Dynamic Model of HIV/AIDS Population of Agra Region

Reader, Faculty of Engineering, D.E.I. (Deemed University), Dayalbagh, Agra, India
Int. J. Environ. Res. Public Health 2005, 2(3), 420-429; https://doi.org/10.3390/ijerph2005030006
Submission received: 31 May 2005
/
Accepted: 14 November 2005
/
Published: 30 December 2005
Abstract
:The Human Immunodeficiency Virus / Acquired Immunodeficiency syndrome (HIV/AIDS) is spreading rapidly in all regions of the world. But in India it is only 20 years old. Within this short period it has emerged as one of the most serious public health problems in the country, which greatly affect the socio-economical growth. The HIV problem is very complex and ill defined from the modeling point of view. Keeping in the view the complexities of the HIV infection and its transmission, it is difficult to make exact estimates of HIV prevalence. It is more so in the Indian context, with its typical and varied cultural characteristics, and its traditions and values with special reference to sex related risk behaviors. Therefore, it is necessary to develop a good model which will help in making exact estimates of HIV prevalence that may be used for planning HIV / AIDS prevention and control programs. In this paper Neuro-Fuzzy approach has been used to develop dynamic model of HIV population of Agra region.
Introduction
Mathematical models of transmission dynamics of HIV plays an important role in better understanding of epidemiological patterns and methods for disease control as they provide short and long term prediction of HIV and AIDS incidence and its dependence on various factors. The modeling study is also helpful in determining the demographic and economic impact of the epidemic, which in turn helps us to develop reasonable, scientifically, and socially sound intervention plans in order to reduce the spread of the infection. Mathematical and statistical models can serve as tools for understanding the epidemiology of HIV and AIDS if they are constructed carefully. Here an attempt is made to model the spread of HIV in a comprehensive manner with limited data of Agra Region.
Roots of HIV/AIDS
Investigators have assessed high-risk patients by studying long-distance truck drivers [3], female sex workers [4], STD clinics [1,2,14], and tuberculosis patients.
It has been estimated that there are at least several million female sex workers (FSW) in India. The number of clients is of course much higher. In India, it has been examined that the most men with sexually transmitted infections (STI) probably acquired their infections from sex workers. In India, from current knowledge, approximately 80% of sexually transmitted infections are first generation infections derived from sex work. Also, HIV infection in monogamous women [15] is probably linked to their husbands having visited sex workers. This problem is more severe in rural areas where the people do not open their mouth and allow this disease to spread silently. It has long been recognized that sexual behavior is very heterogeneous, most people have few partners, while a minority (the core group) have many and therefore account for a much of the transmission of HIV and STI in a population. Prevention of mother-to-child transmission is possible through peripartum antiretroviral treatment of mother and child and followed by non-breastfeeding [12].
Three different male-female partnerships were considered:
Commercially Sex Worker (CSW)-Client Relationships
The risk of transmission during a single unprotected sex worker-client contact is determined by the risk factors of the risk of transmission from female-to-male and from male-to-female, respectively. The number of sex contacts between sex workers and clients is determined by the demand for it and the number of available sex workers.

αi - Risk of Transmission
Spousal Relationships
“Spousal” partnerships between low risk (non-client) men and low risk (non CSW) women were considered to be more risky than above case, as these partnerships usually involve several or many sexual encounters. However, per sexual act these partnerships are implicitly assumed to be safer than individual sex worker contacts. The rate by which women form such partnerships is determined by the rate by which men form such partnerships. This simply ensures that the number of partnerships formed by men equals that formed by women, and it does not aim to be reflective of any realistic pattern of partnership formation. Transmission can occur when one of the two partners is HIV positive and enters into such a relationship.

Other Relationships
In addition to these new “spousal” partnerships formed at (presumably) a low rate between low risk men and low risk women, all other sexual relationships are between men and women. We modeled the effect of transmission occurring as a result of such relationships and subsequent HIV transmission to existing “spousal” partnerships and other contacts by allowing HIV positive individuals to “leak” infection to low-risk individuals of the opposite sex. Most individuals are married or have other “spouse-like” sex partners among the low risk population. If these people become HIV infected from other partners (via sex worker or other routes) they have a high risk of “leaking” the infection to their spouses or other partners.
Vertical Transmission
HIV infected women were considered as fertile as uninfected women. The fraction of births of infected women also infected with HIV.
The latest estimate for the HIV/AIDS infected adult population in the country is 3.8 million in 2000. HIV/AIDS is not a disease which spreads randomly and is transmitted as a consequence of a specific behavioral pattern and has strong socio-economic implications. It not only costs huge sums of money in terms of controlling the opportunistic infections such as TB, Pneumonia and Cryptococcus meningitis, but seriously affects individuals in their prime productive years causing serious economic loss to them and their Families. To study the socio-economic effect of these diseases on the country, it is very important to predict the correct values of HIV/AIDS population. The information gathered from the infected people is not 100% accurate and correct (but it has ambiguity and vagueness). Most of the time, the infected individuals hide the information due to number of reasons like society’s fear etc. To overcome the problem of dealing with imprecise and vague information, Fuzzy Logic Based Approach works well. Fuzzy Set Theoretic Approach is the best technique to deal with such uncertainties due to vagueness, impreciseness, or incomplete information. On the other hand, a number of NGOs and GOs are collecting the data for HIV/AIDS; these data may be numeric or non-numeric in nature. Unfortunately, Fuzzy systems could not deal with numerical data. Hence, Artificial Neural Network is used along with Fuzzy System to use numeric as well as non-numeric data in modeling.
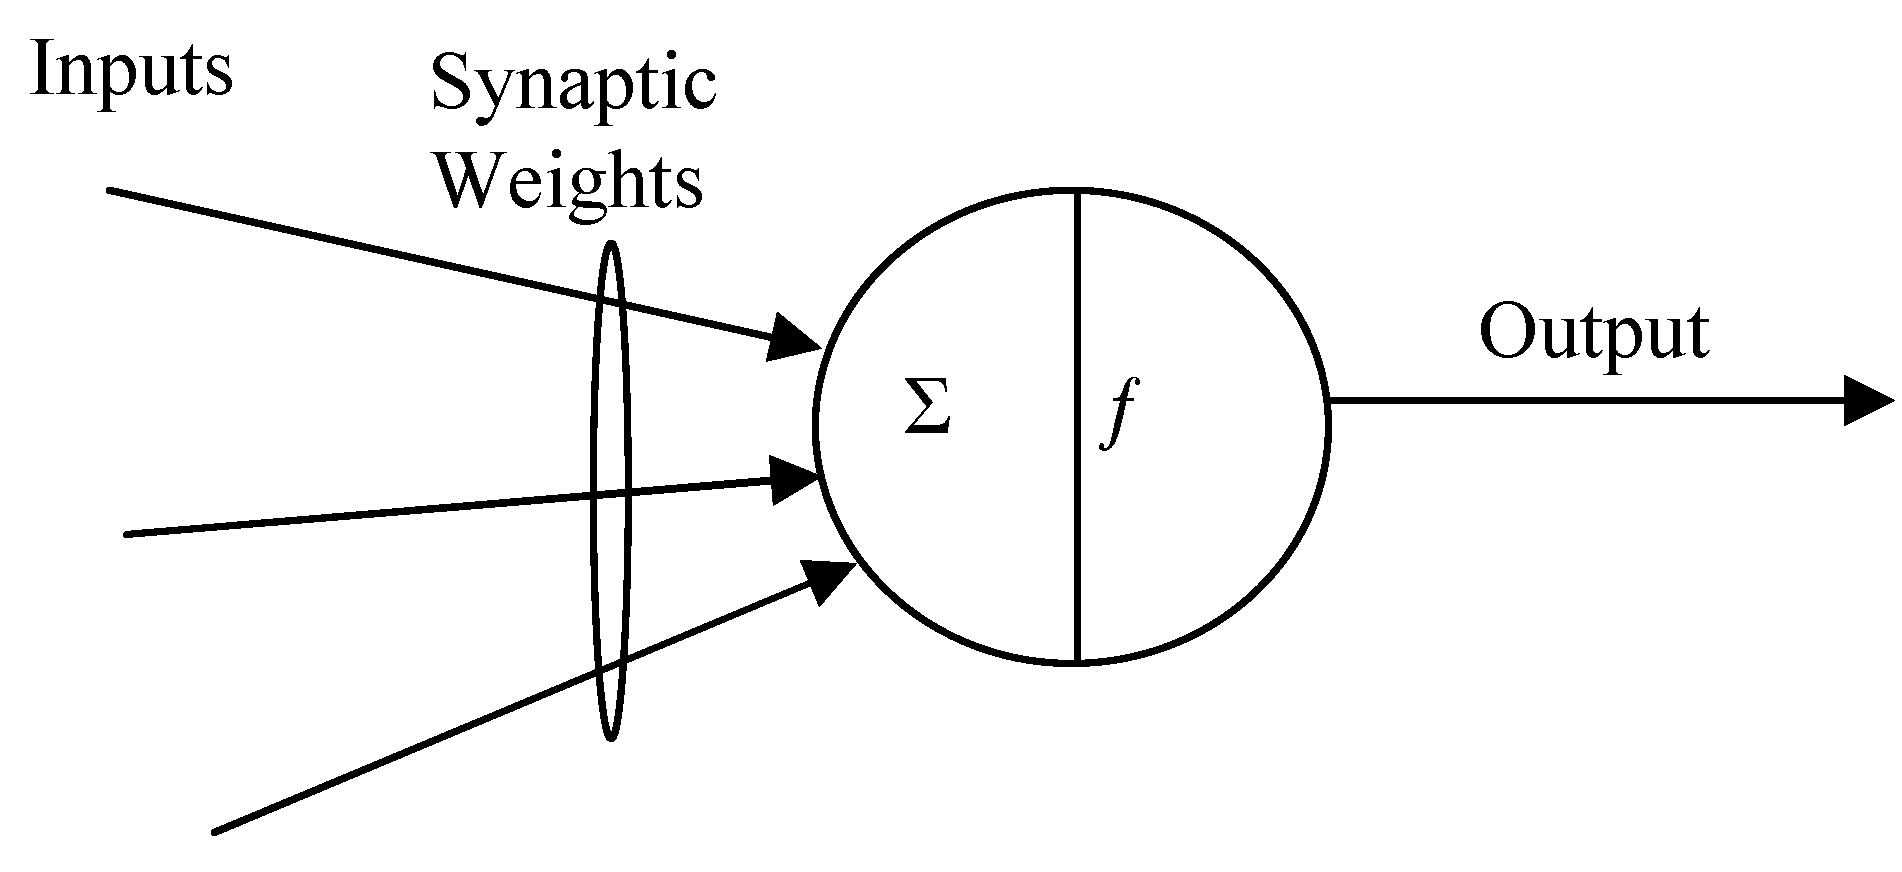
Artificial Neural Networks
Most artificial neural networks are based to some degree on biological systems (figure 1). The function of the Processing Elements is based loosely on the nerve cell.
Figure 1.
Simplified diagram of connecting neurons

From a modeling point of view dendrites are input receptors, Cell Body is accumulator (with threshold function), Axon is an output channel. If the total input potential to the cell is sufficient then the neuron fires. An action potential is generated and propagates down the axon towards the synaptic junctions with other nerve cells.
McCullock and Pitts suggested the first synthetic neuron in the early 1940s (figure 2). In the McCullock-Pitts model the artificial neuron produces a binary output whose value depends on the weighted sum of its inputs.
Figure 2.
The first synthetic neuron in the early 1940s (McCullock and Pitts).

We suppose there are n inputs with signals x1, x2, ... xn and weights w1, w2, ... wn. The signals take on the values '1' or '0' only. That is the signals are Boolean valued. (This allows their relation to digital logic circuits to be discussed). The activation a, is given by:
a = w1x1 + w2x2 + ... wnxn
This may be represented more compactly as:
![Ijerph 02 00420 i003]()

The output y is then given by thresholding the activation function (f). Such simple neurons connected in a network to get artificial neural network (ANN). There is a number of applications of ANN reported in different field. ANN is also widely used for model free estimation in the sense that they are able to create internal representation without of how output depends on inputs. Some of the inherent of difficulties of ANN are as follows [5]:
- Slow learning process.
- It can get stuck at the local minima.
- There is no systematic method to generalize a neural network trained for one application and apply it to another application.
- Require extensive amount of training for good performance.
- Extremely large neural network cannot be built with currently available technology.
Fuzzy Set Theoretic Approach
Natural language abounds with vague and imprecise concepts, such as "Anjali is tall," “He has acute pain”. Such statements are difficult to translate into more precise language without losing some of their semantic value.
For example, when one is designing an expert system to mimic the diagnostic powers of a physician, one of the major tasks is to codify the physician's decision-making process. We will see how fuzzy logic based systems affords a broader, richer field of data and the manipulation of that data than do more traditional methods.
Fuzzy logic is a superset of conventional (Boolean) logic that has been extended to handle the concept of partial truth - truth values between "completely true" and "completely false". It was introduced by Dr. Lotfi Zadeh of University of California, Berkeley in the 1960's.
Fuzzy systems combine fuzzy sets with fuzzy rules to produce overall complex nonlinear behavior. Fuzzy formulations can help to achieve tractability, robustness, and lower solution cost.
Neuro-Fuzzy Approach
Neural networks and fuzzy systems [5] each have their own advantages and shortcomings. Neural nets and fuzzy systems, although very different, have a close relationship: they both can work with imprecision in a space that is not defined by crisp, deterministic boundaries. The shortcomings of neural networks and of fuzzy systems may be overcome if both operate corporately, which is also called Neuro–Fuzzy approach of modeling. The ANN is used for modifying the knowledge base of fuzzy system on-line. The knowledge base of Fuzzy system is consisting of a database and a rule base. Database contains number of input and output variables, range of these variables and membership functions. Rule base contains if-then rules to deal with the problem in hand. ANN modifies the database as well as rule base.
There are two steps in modification:
- Knowledge base is optimized off line initially, to get good starting performance and then,
- Optimized on-line using ANN to maintain its performance with change in situations.
The fuzzy system toolbox of Matlab Ver. 7.0 is used for modeling the HIV/AIDS population dynamics.
Modeling and Simulation of HIV/AIDS Population Dynamics
In recent years, various modeling studies have been conducted to describe the transmission dynamics of HIV [6,7,8,9,10,11,13,16,17,18,19,20,11,13,16]. In particular, Anderson [24] described some preliminary attempts to use mathematical models for transmission of HIV in a homosexual community. In 1987 May & Anderson [22,23] showed that if the probability of developing AIDS increases linearly with time since infection then the distribution of the AIDS incubation period is a Weibull distribution. Nowak [25] analyzed a model where the mean rate of acquisition of new partners depends on the size of the sexually active population. Srinivasa Rao [7] developed a Mathematical model of AIDS epidemic. Baily [26] presented a model for HIV infection and AIDS in which infected people proceed through a sequence of stages to AIDS and then to death. Most of the above mentioned models consider only one population but HIV transmission takes place in populations that are heterogeneous in a variety of ways. The models incorporating demographic factors have also been studied by May et.al. [23], Anderson et al [22]. The incubation period of AIDS in India estimated through de-convoluting HIV epidemic density and reporting AIDS cases, is between 8 and 12 years. Quantitative information on female commercial sex (FSW) activity in India is available through various sources, but it is just impossible to get accurate information. Due to lack of information, it is not possible to develop an exact model using conventional method. Hence, there is need to develop non-conventional (Neuro-Fuzzy) modeling technique to model this problem.
In the earlier models the population was taken constant and the growth rate is not taken into account, but this aspect is very important in the spread of disease due to long incubation period during which the population might have doubled particularly in developing countries.
Further, there is strong argument that variable infectivity, the nature and type of social/sexual mixing structures and the long and variable periods of infectiousness are key factors in modeling of HIV+ population dynamics.
Survey Results
The investigator surveyed the rural and urban areas of Agra region in which HIV is spreading rapidly and also surveyed the Blood-Banks of Agra region.
Blood-Banks Data

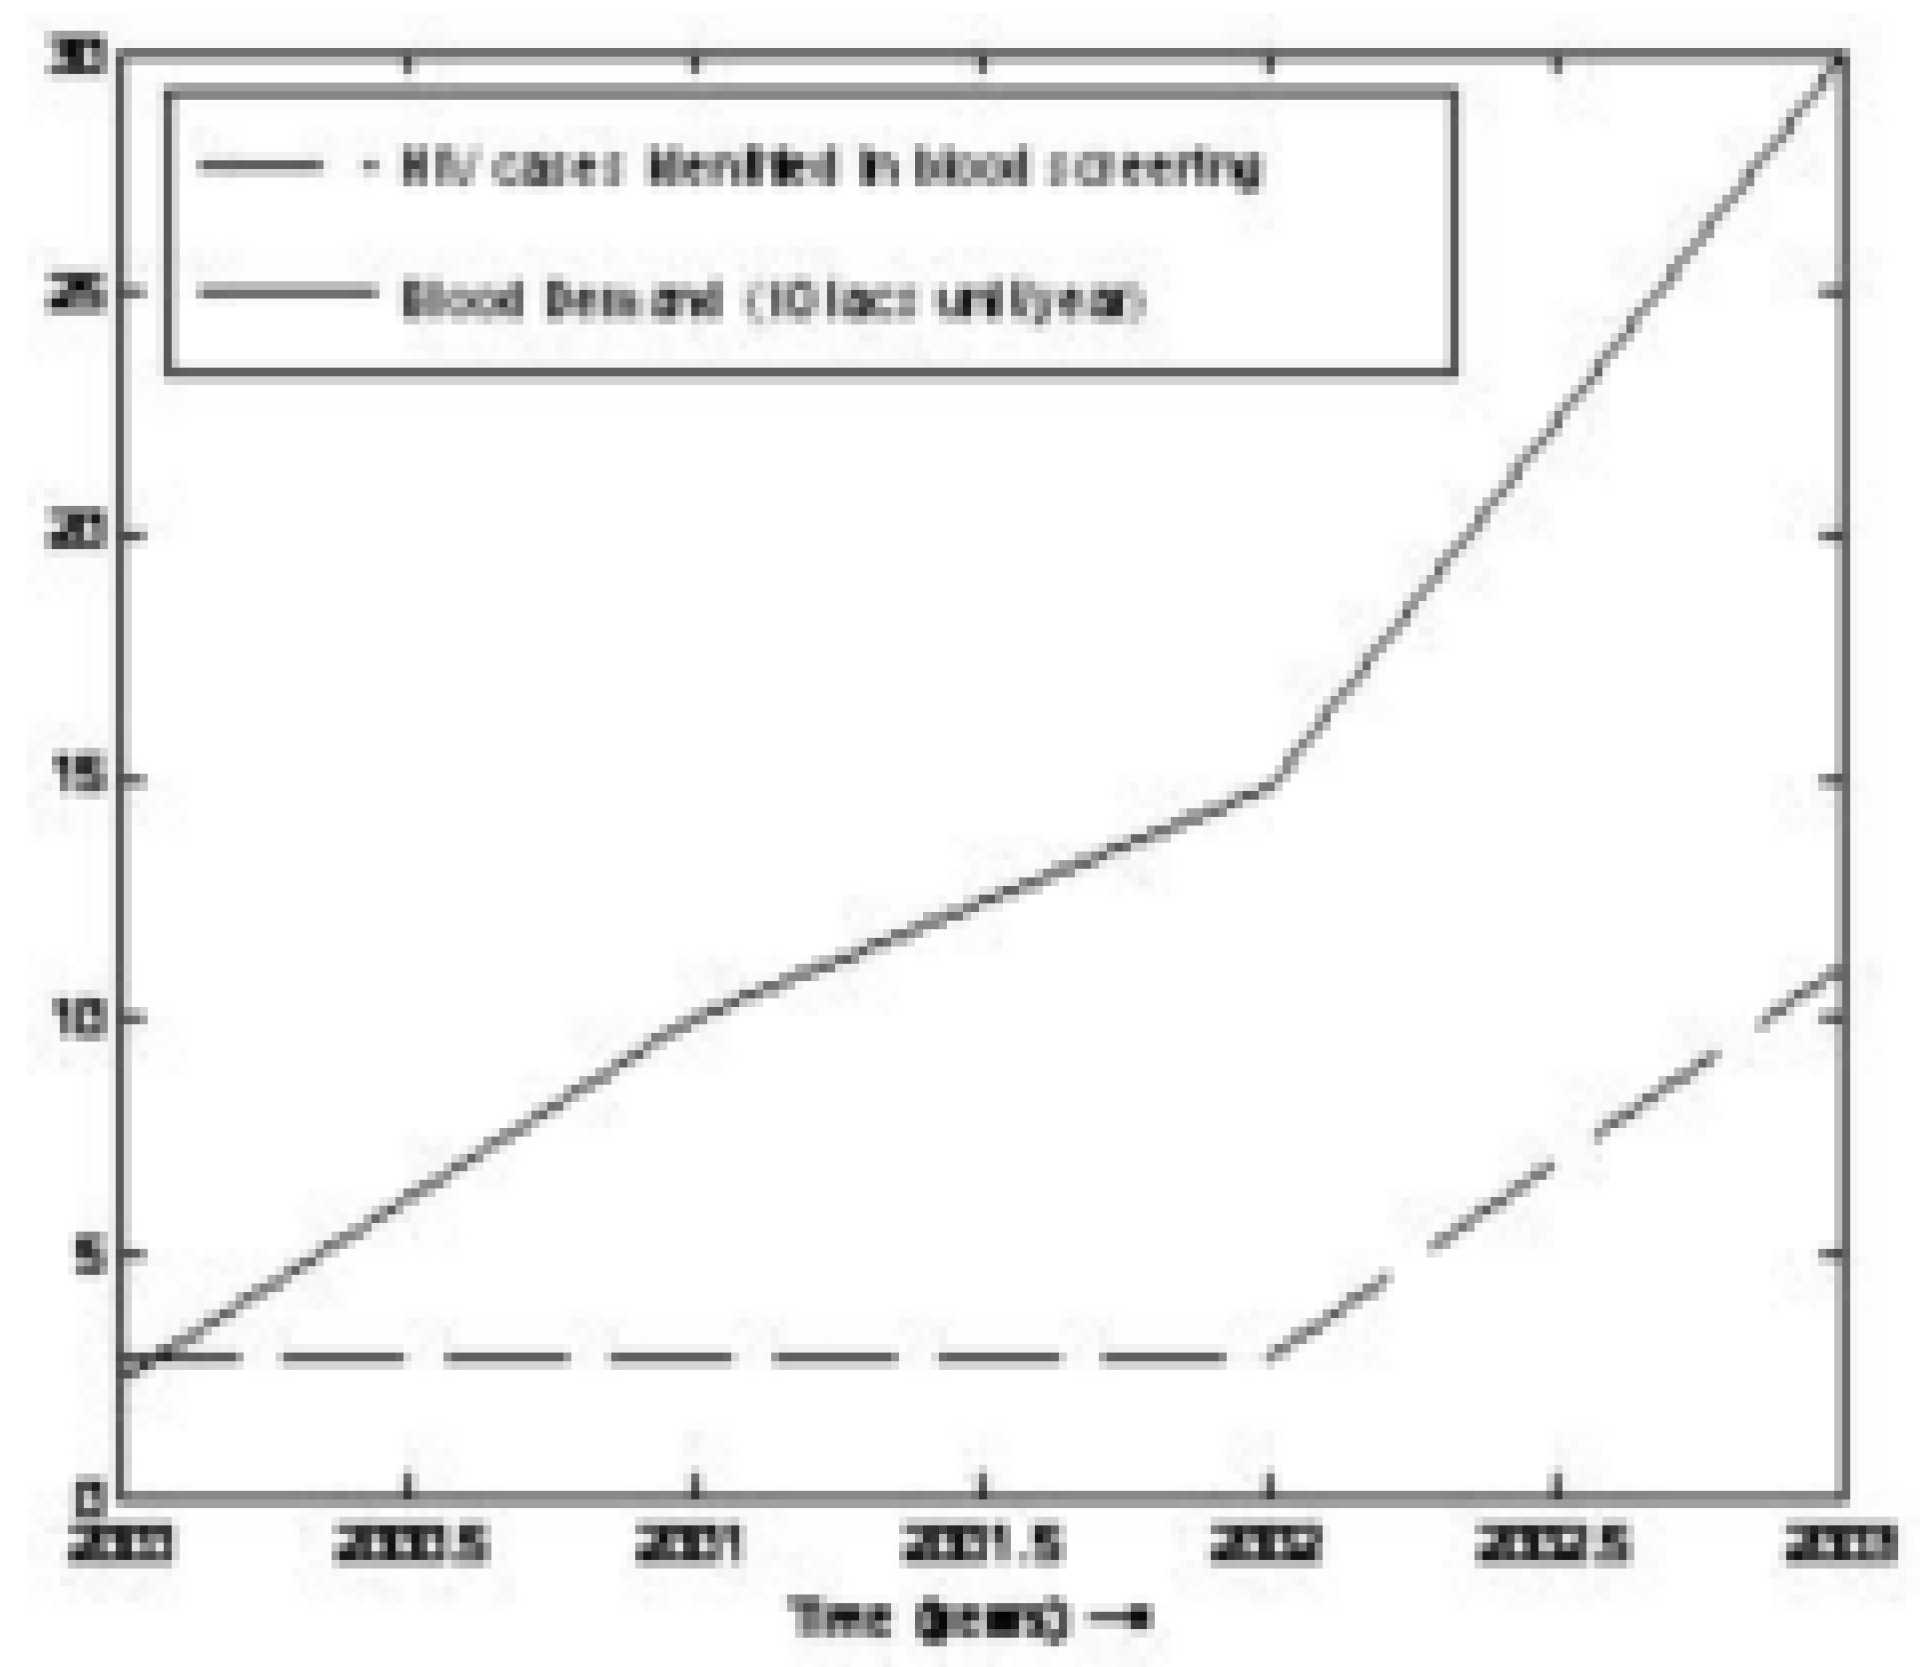
| Year | Total donation / consumption of blood106 unit/year | No. of HIV+ in Agra region |
|---|---|---|
| 2000 | 3298 | 3 |
| 2001 | 3221 | 10 |
| 2002 | 3282 | 15 |
| 2003 | 11098 | 30 |
Figure 3.
Trend of Blood Demand and HIV+ Cases

High Risk Group
- □
- C.S.W.
- □
- Clients:
- □
- Pre marital relation
- □
- Extra marital relation
- □
- Blood recipient
- □
- Children of HIV+ (mother to child)
- □
- Policeman and military personal
Low Risk Group
- □
- Students
- □
- General mass
Main castes Responsible for spreading HIV+ in Agra Region are Bediya, Bhantu, Kabutare. Main Red light areas in Agra city are Seb ka bazaar, Mal ka bazaar, Kashmiri bazaar, Panni gali, Sikandra and in Rural areas of_Fatehabad such as Chaurahe mauhalla, Kanoon goyan, Ambedkar nagar, Village ai and lodhai; Shamsabad: Kans tila, Gopalpura; Bah: Basaur, Sabora, Rai khilla, Nagla swaroop lal; Fatehpur sikri: Churiyari, Shringarpur, Korai; Zarar: Manikpura, Pinahat; Jagner; Jalesar.
No of HIV+ detected in rural areas = 60 cases.
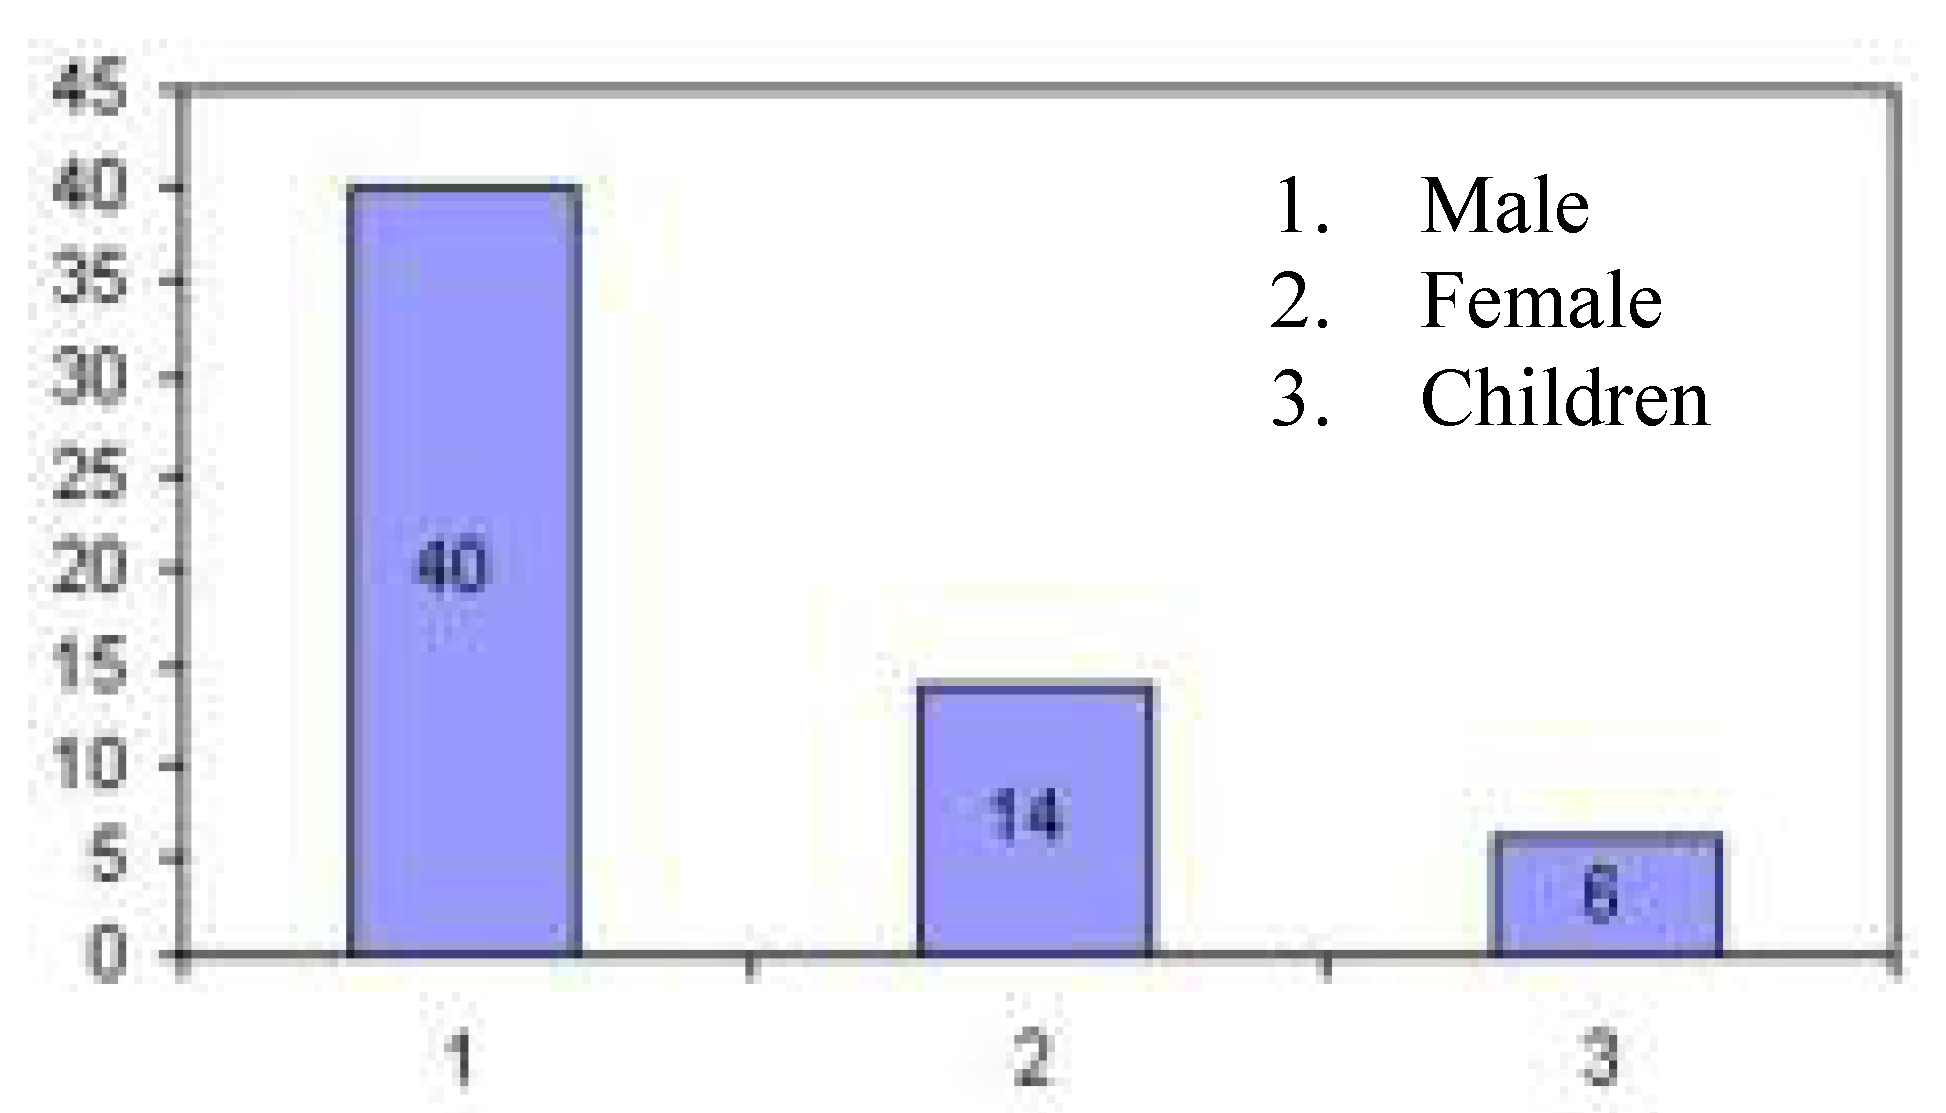
These results show that 67% HIV+ population is in the age from 18-45 years as shown in Fig. 4, which can contribute in national economy. Almost all HIV+ individuals are of low or medium income group (i.e. labour, or farmers) as shown in Table 2.
| Person | No. ofHIV | Age group (Years) | Income Level | Married/ Unmarried |
|---|---|---|---|---|
| Male | 40 | 18-45 | Labour &Farmer | 70% Married30% Unmarried |
| Female | 14 | 18-45 | Labour | 100% Married |
| Infants | 6 | 6-9 | - | - |
Figure 4.
HIV Infected male, female and children population

Main reason of HIV+ Infection in Agra Region
- □
- Sexual contact (unsafe) = 80%
- □
- Blood transmission = 6%
- □
- Mother to child = 10%
- □
- Using infected injections = 4%
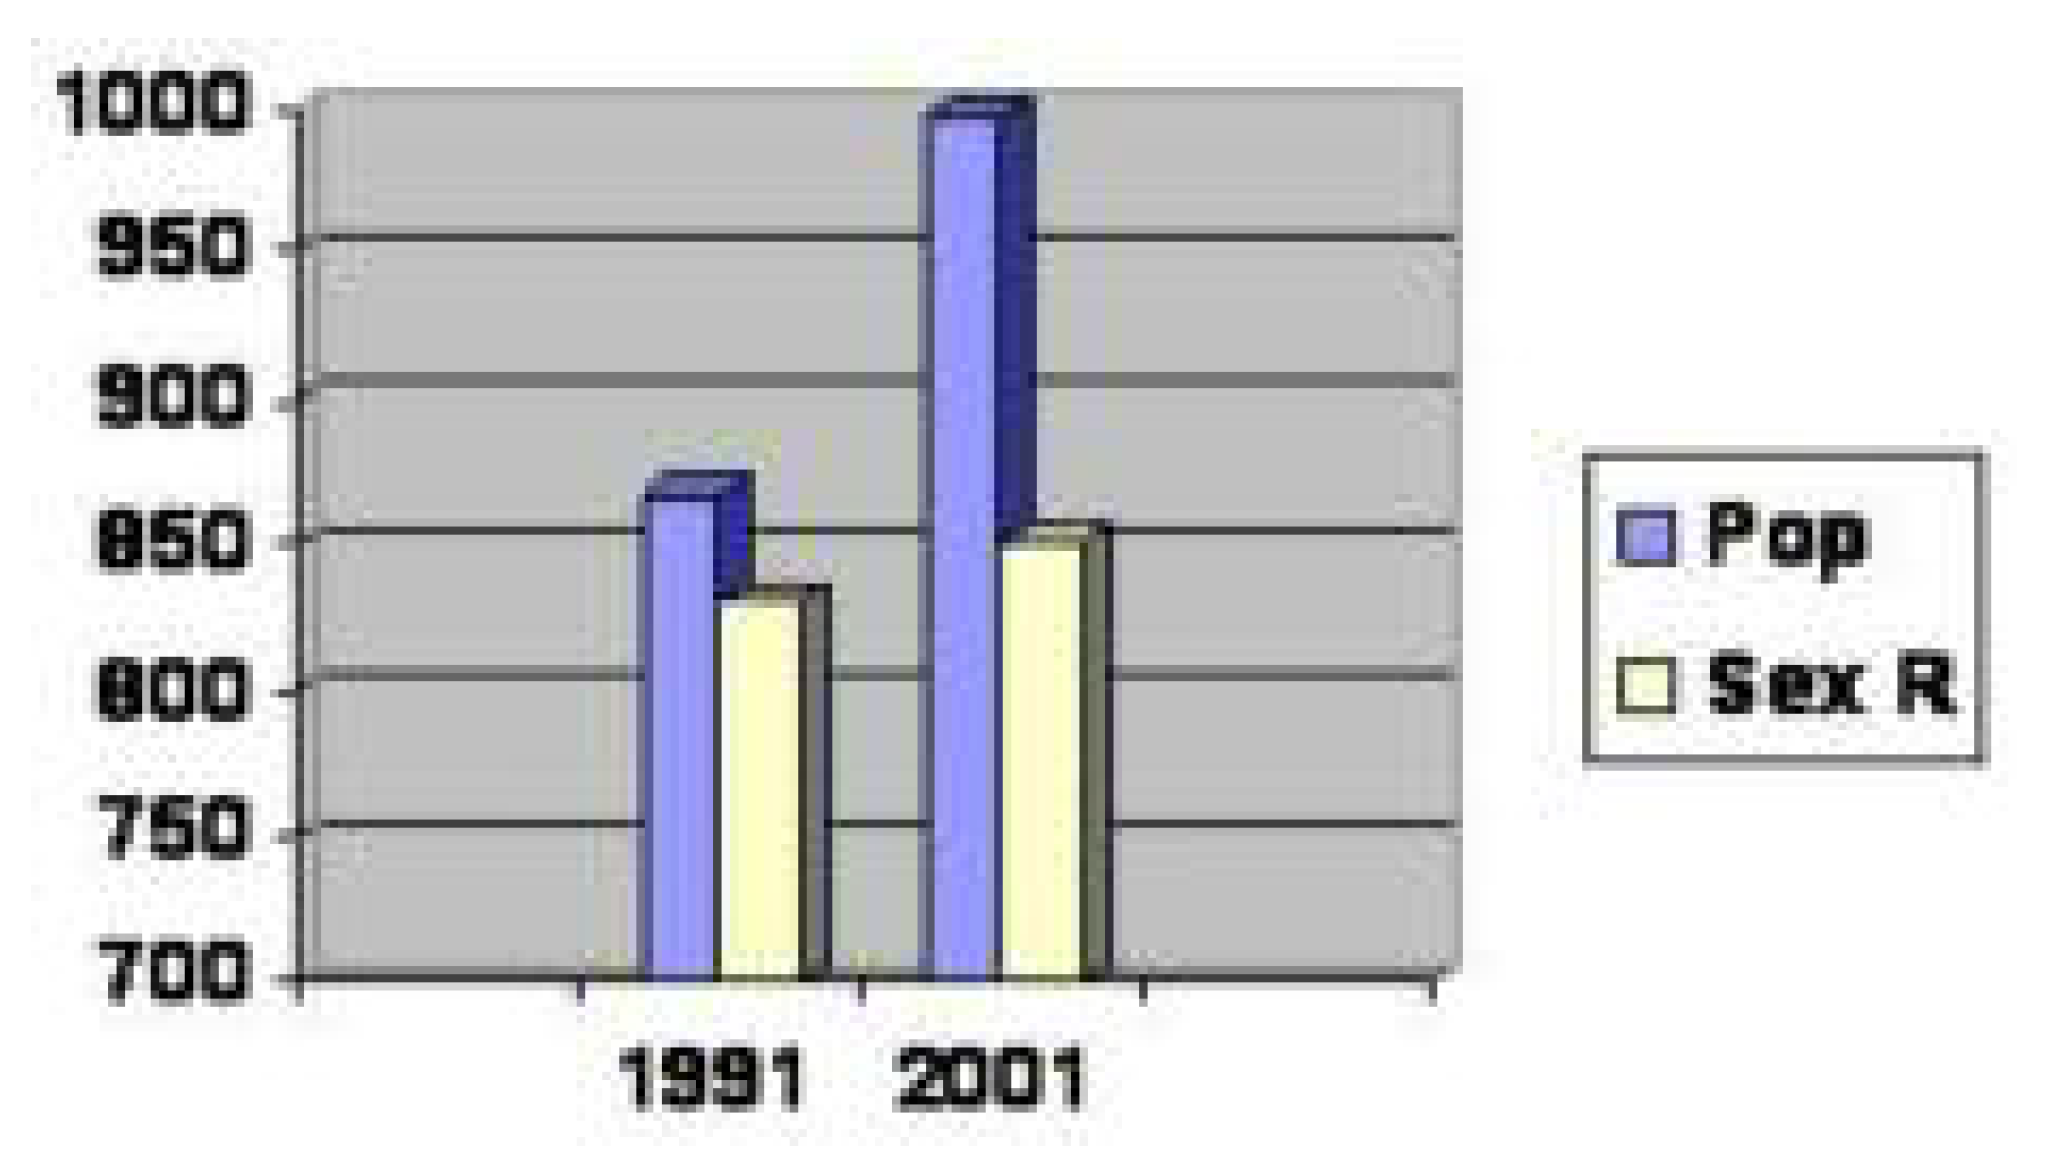
This shows that most of the HIV+ people is educated only up to primary level and a very few educated up to higher secondary level and almost none up to intermediate and higher education level as shown in Table 3. Another important observation from these data is that the percentage of female literacy level is very low especially in rural areas as mentioned in Table 4. This is also an important reason of high rate of HIV infection. Hence, attention is required to improve the literacy level of female. Also the sex ratio is 85.2% and population density is 89.7% of Agra region as per the survey results of Govt. of India 2001 (Fig. 5).
| Sex | % of Literacy | Primary Level | High Sec. Level | Inter-mediate Level |
|---|---|---|---|---|
| Male | 95% | 60 -75% | 25% | 1% |
| Female | 10% | 100% | - | - |
| Sex | Rural | Urban | ||
|---|---|---|---|---|
| Population | Literacy | Population | Literacy | |
| Male | 1114971 | 675043 | 834804 | 614428 |
| Female | 938985 | 292586 | 722541 | 373444 |
Figure 5.
Population Density and Sex Ratio of Agra region

Rehabilitation
There is no community care center in Agra region as far as author’s knowledge. Doctors prefer to refer the HIV+ patients for home care and they provide medicines only for opportunistic infections (e.g. fever, cough etc).
Modeling and Simulation of HIV+ Population using Neuro-Fuzzy Approach
The following steps have to follow in modeling and simulation of HIV+ population:
Model Development Phase
Step 1
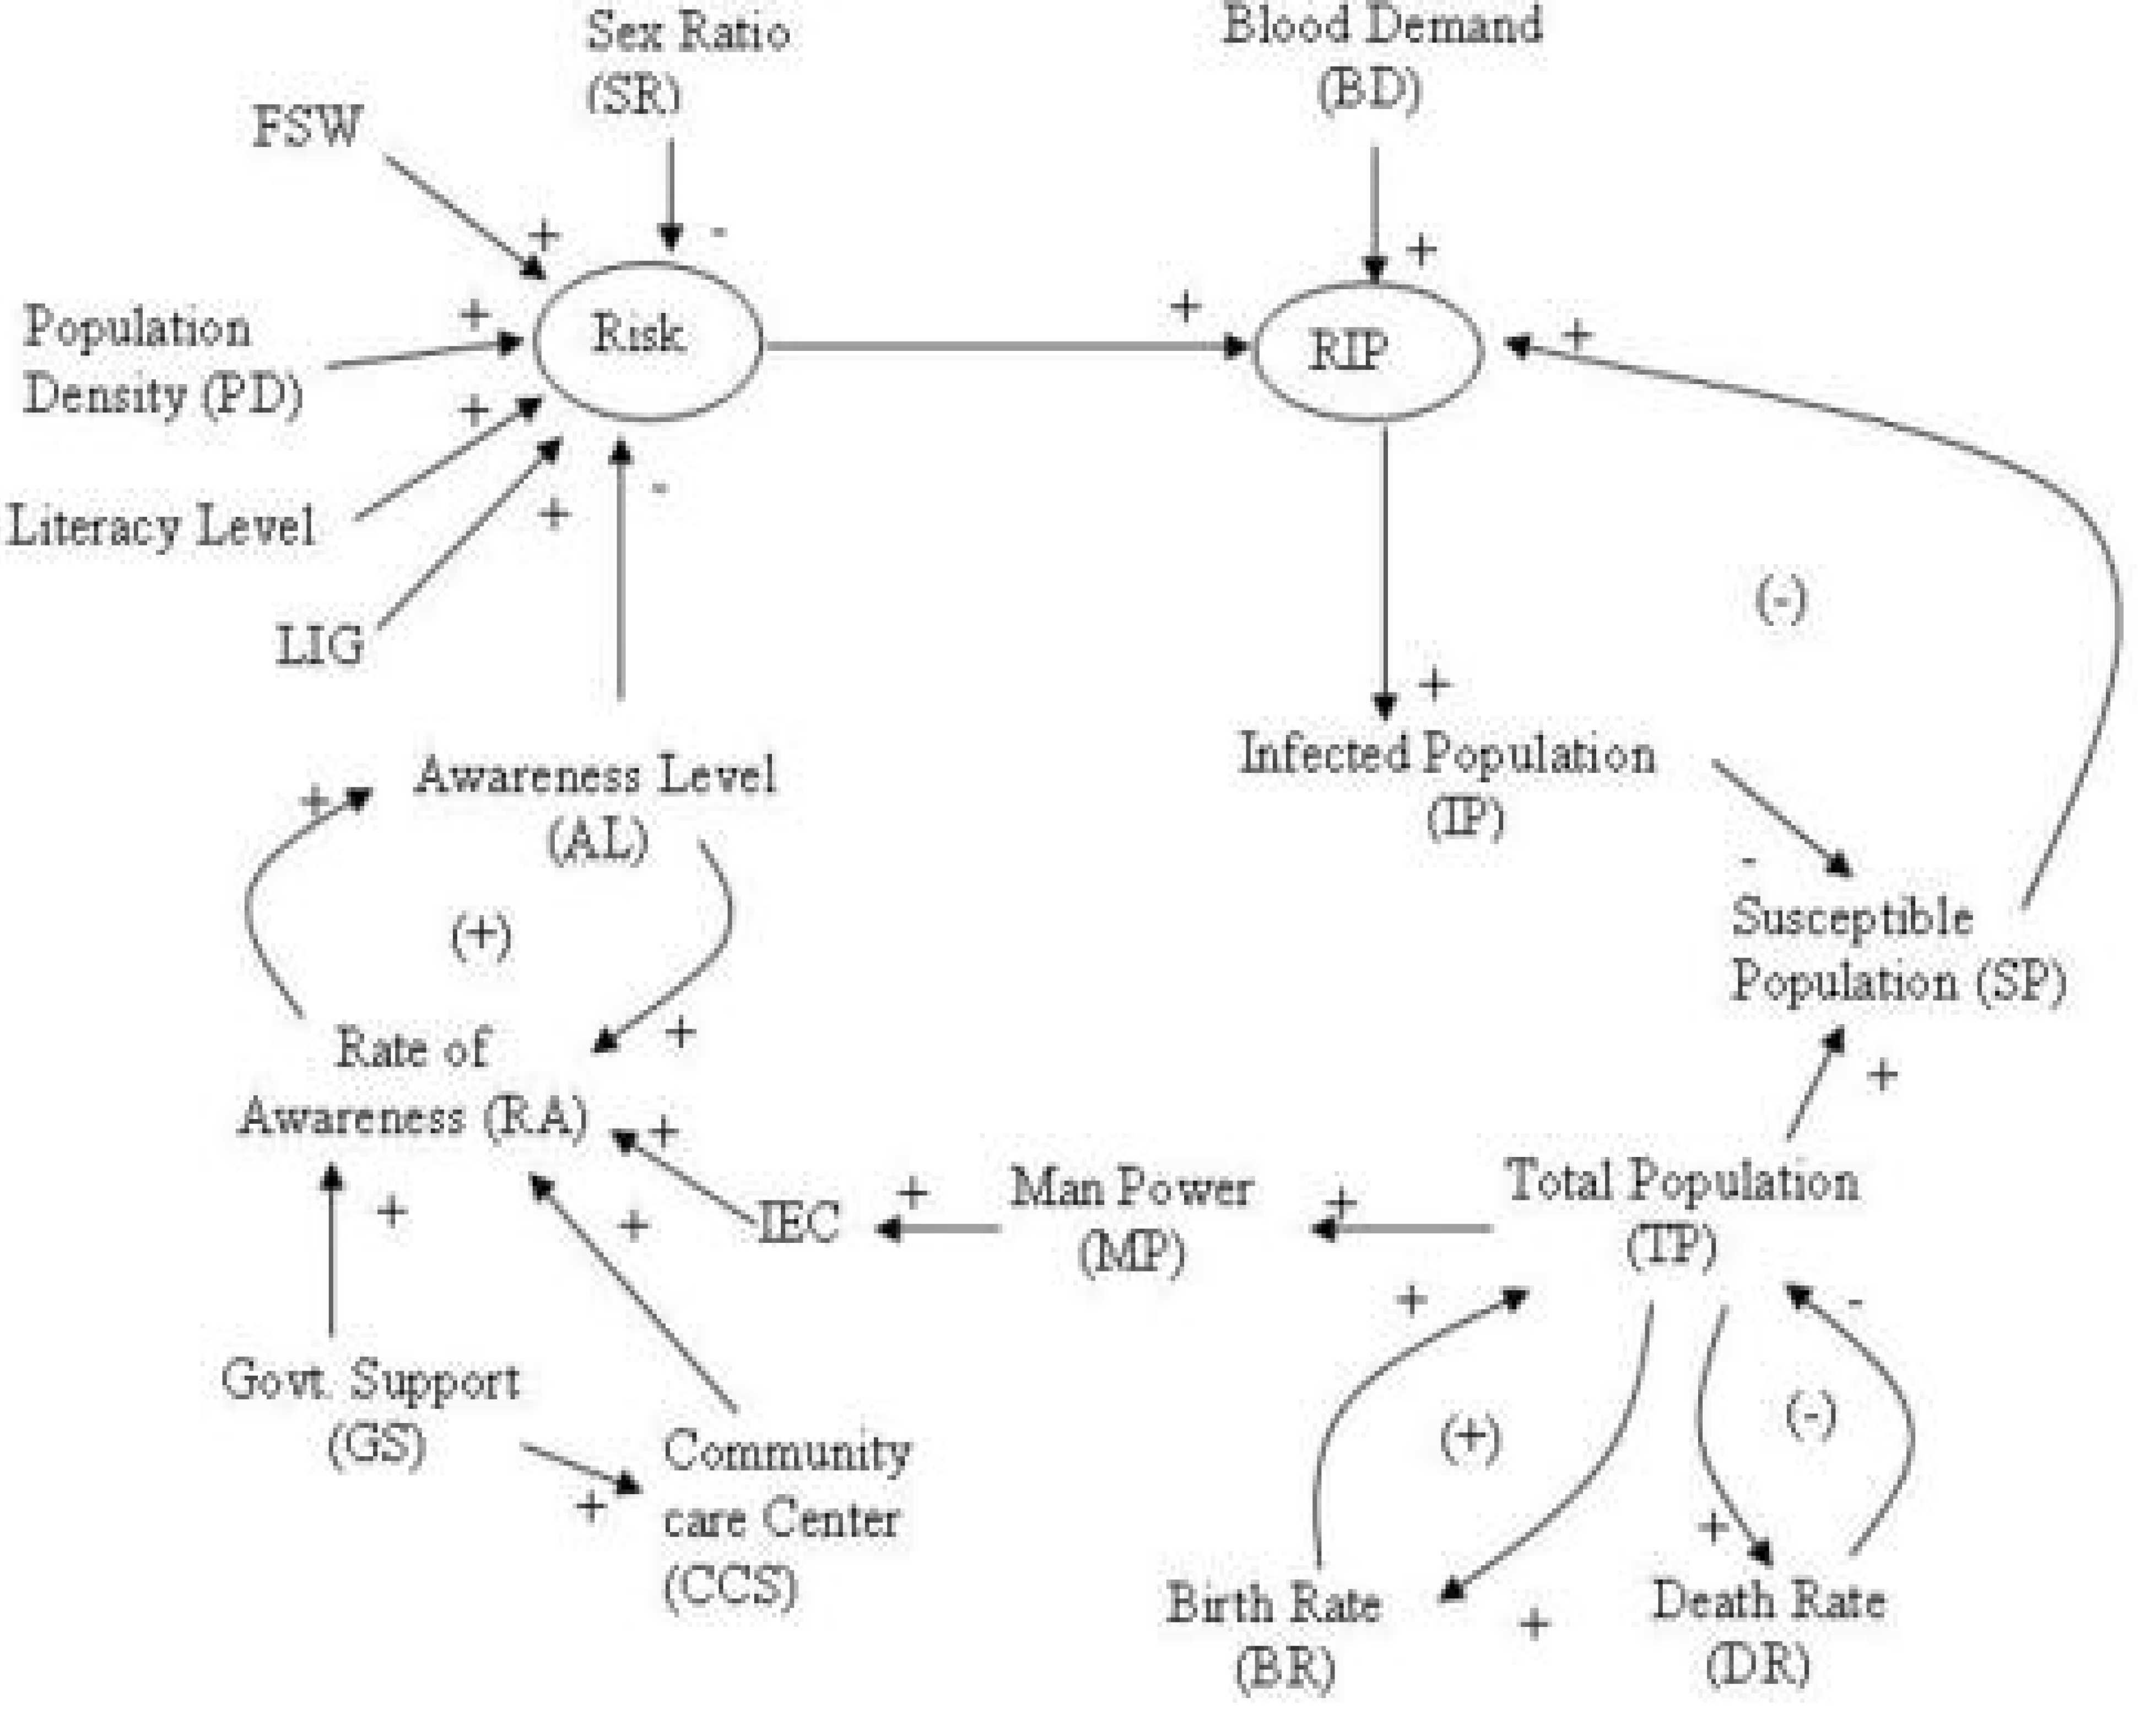
The first step in model development is the identification of key variables. The key variables identified for the HIV+ infected population are: Risk, Female Sex Worker (FSW) of different caste as Bediya, Kabutare and Bhantu in Agra region, Blood demand (BD), Literacy Level, Low Income Group (LIG), Migration (M), Infected population (IP), Awareness level (AL), Rate of Awareness (RA), Government Support (GS), Man Power available for IEC (MP), Population Density (PD), Sex Ratio (SR), Susceptible Population (SP), Rural Population, Urban Population, Rate of Infection (RIP), Social Economy (SE), Injecting drug users (IDU) but there is no case identified of IDU in Agra as per the records. The ranges of these variables are given in Table 5.
| S. No. | Variable Name | Range |
|---|---|---|
| 1. | FSW | 1-5 % |
| 2. | Literacy level | 20-70 % |
| 3. | Low Income Group | 10-50 % |
| 4. | Migration | 0-8 % |
| 5. | Awareness level | 0-100 % |
| 6. | Blood demand | 0-20, 000 unit/year |
| 7. | Population density | 800-950 |
| 8. | Sex ratio | 80-110 % |
| 9. | Risk | 0-100 % |
Step 2
Causal links have been developed between a pair of variables under cetris paribus conditions (i.e. keeping other variables constant) as in the System Dynamic methodology. From these causal links a causal loop diagram is drawn as shown in Fig. 6.
Step 3
Development of fuzzy knowledge base from causal link developed in Step 2.
Fuzzy Knowledge Base
Rule 1: If FSW is high then Risk is high Else if FSW is medium then Risk is medium Else if FSW is low then Risk is low.
Rule 2: If Literacy is low then Risk is high Else If Literacy is medium then Risk is medium Else if Literacy is high then Risk is low.
Rule 3: If LIG is high then Risk is high Else if LIG is medium then Risk is medium Else if LIG is low then Risk is low.
Rule 4: If M is high then Risk is high Else if M is medium then Risk is medium Else if M is low then Risk is low.
Rule 5: If AL is high then Risk is low Else if AL is medium then Risk is medium Else if AL is low then Risk is high.
Rule 6: If PD is high then Risk is low Else if PD is Medium then Risk is Medium Else if PD is low then Risk is low.
Rule 7: If SR is high then Risk is high Else if SR is Medium then Risk is Medium Else if SR is low then Risk is high.
Rule 8: If Risk is high then IP is high Else if risk is medium then IP is medium Else if risk is low then IP is low.
Rule 9: If BD is high then RIP is high Else if BD is medium then RIP is medium Else if BD is low then RIP is low.
Rule 10: If SP is high then RIP is high Else if SP is medium then RIP is medium Else if SP is low then RIP is low.
Rule 11: If RIP is low then IP is low Else if RIP is medium then IP is medium Else if RIP is high then IP is high.
Rule 12: If IP is high then SP is high Else if IP is medium then SP is medium Else if IP is low then SP is low.
Rule 13: If IP is high then SE is low Else if IP is medium then SE is medium Else if IP is low then SE is high.
Rule 14: If TP is low then SP is low Else if TP is medium then IP is medium Else if TP is high then IP is high.
Figure 6.
Causal Loop Diagram for HIV/AIDS model

Rule 15: If BR is high then TP is high Else if BR is medium then TP is medium Else if BR is low then TP is low
Rule 16: If DR is high then TP is low Else if DR is medium then TP is medium Else if DR is low then TP is high.
Rule 17: If RA is high then AL is high Else if RA is medium then AL is medium Else if RA is low then AL is low.
Rule 18: If IEC is high then RA is high Else if IEC is medium then RA is medium Else if IEC is low then RA is low.
Rule 19: If MP is high then RA is high Else if MP is medium then RA is medium Else if MP is low then RA is low.
Rule 20: If GS is high then RA is high Else if GS is medium then RA is medium Else if GS is low then RA is low.
Rule 21: IF GS is high then CCS is high else if GS is low CCS is low.
Rule 22: If CCS is high then RA is high else if CCS is low RA is low.
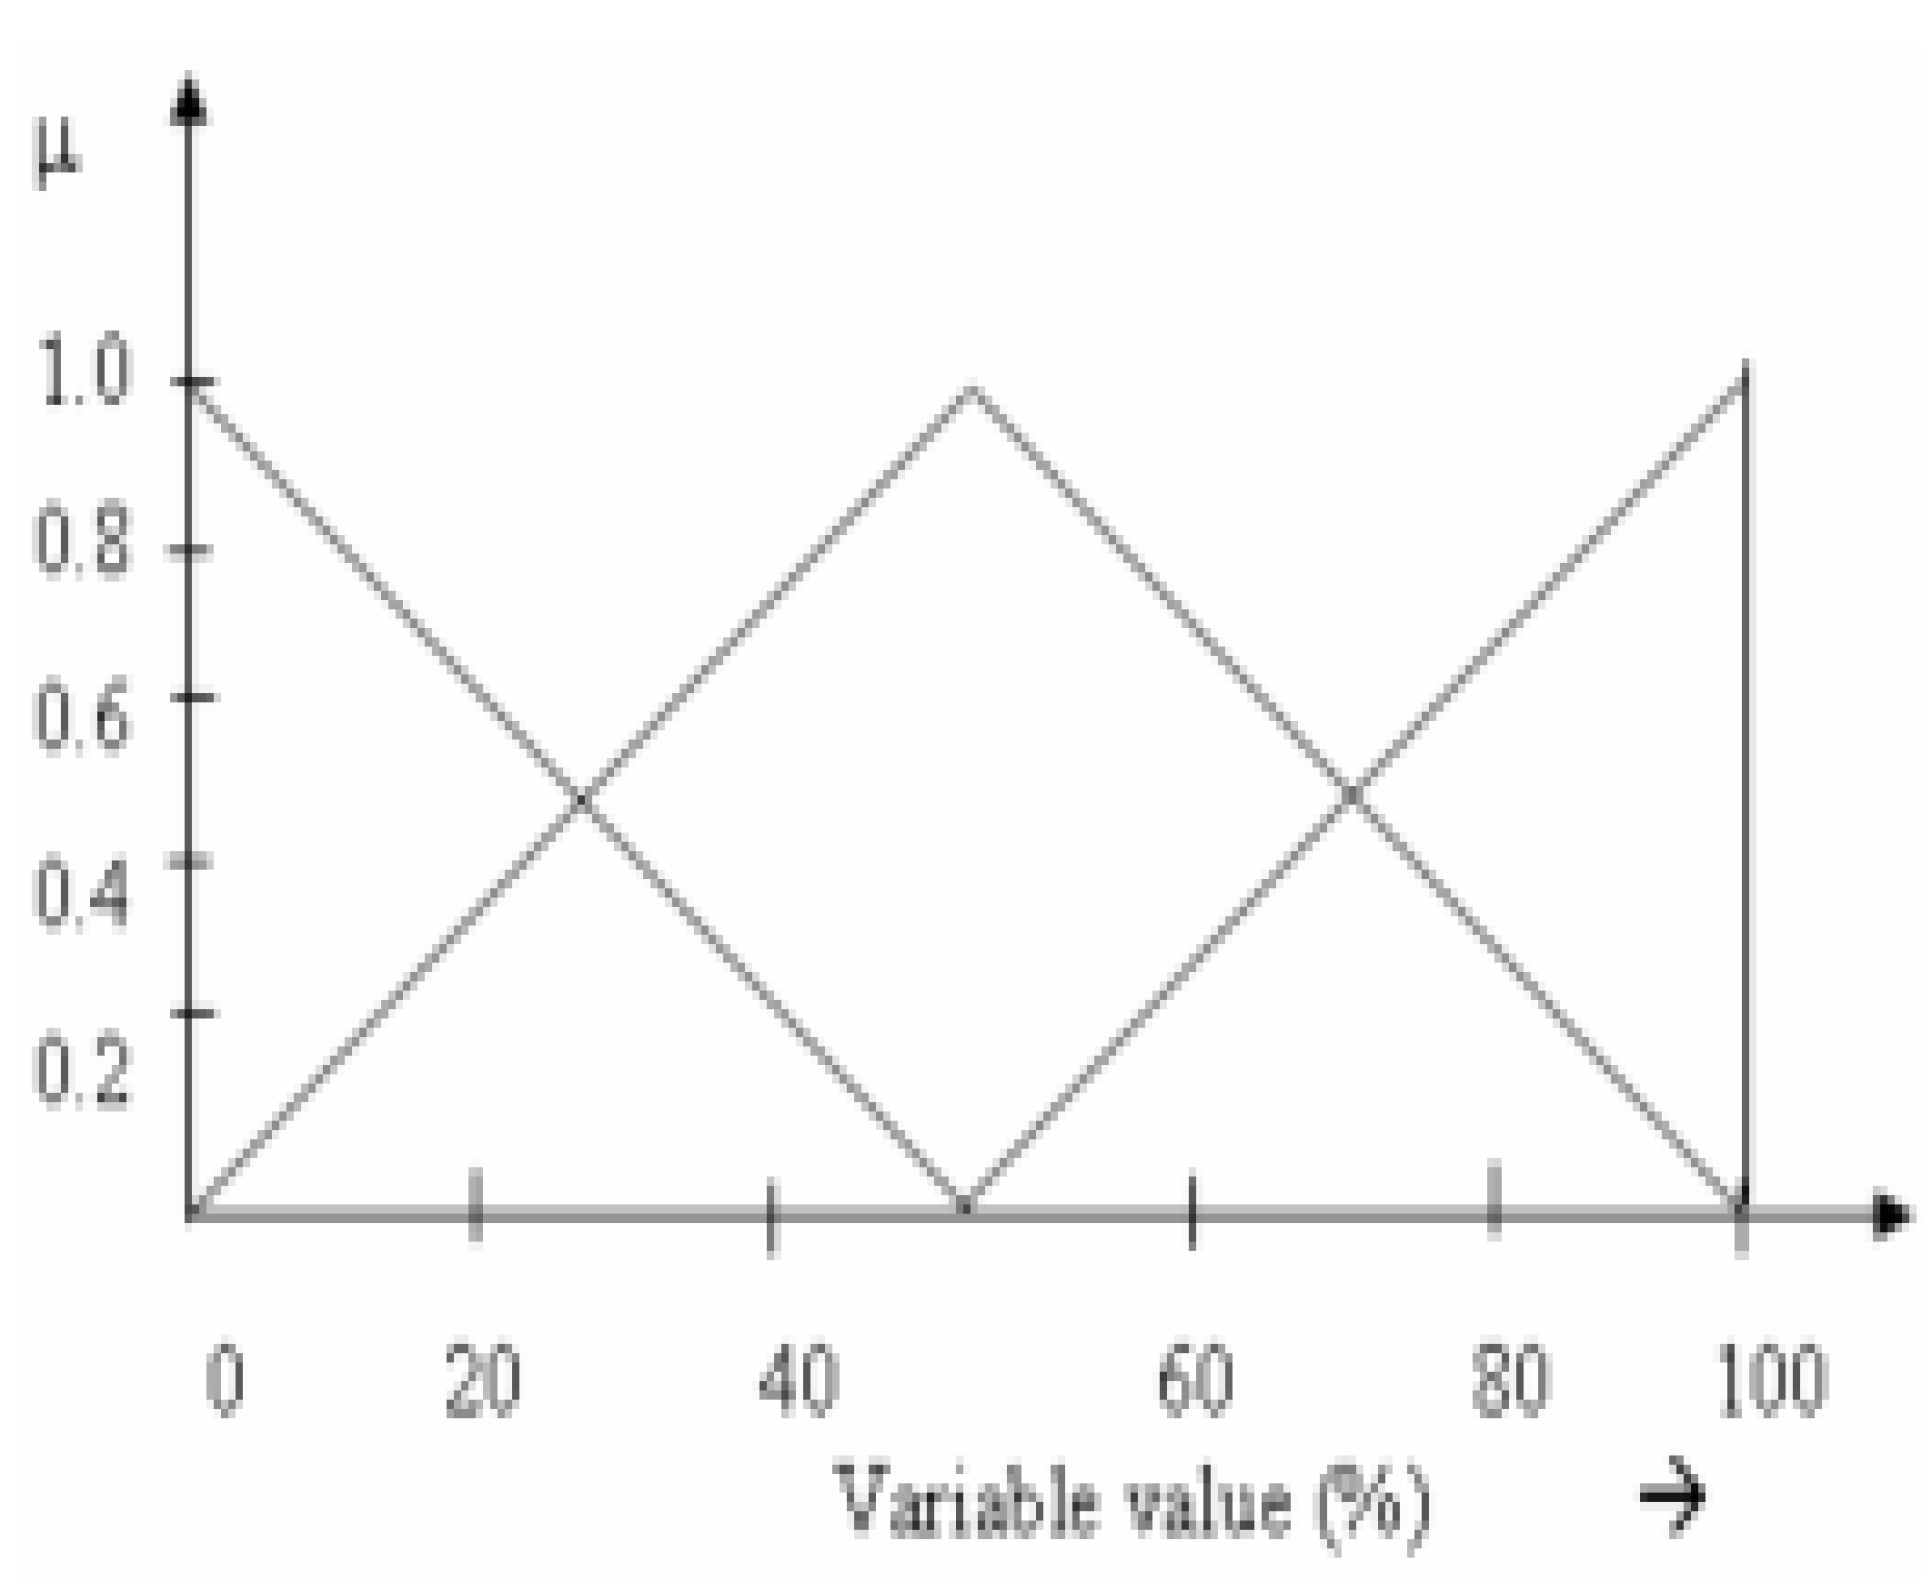
The suitable triangular fuzzy sets have been defined for the identified variables as shown Fig. 7. The rule matrices have been developed for different rules using discrete fuzzy sets and max min fuzzy composition eg.
Rule 1= HFSW x HRisk + MFSW x MRisk + LFSW x LRisk
=[0/2.9, 0.25/3.375, 0.5/3.85, 0.75/4.225, 1.0/4.8] x [0/50, 0.25/62.5, 0.5/75, 0.75/87.5, 1.0/100] + [0/1,0.25/1.475, 0.5/1.95, 0.75/2.425, 1/2.9, 0.75/3.375, 0.5/3.85, 0.25/4.225,0/4.8] x [0/0, 0.25/12.5, .5/25, 0.75/37.5, 1/50, 0.75/62.5, 0.5/75, 0.25/87.5, 0/100] + [1/1,0.75/1.475, 0.5/1.95, 0.25/2.425, 0/2.9] x [1/0, 0.75/12.5, .5/25, 0.25/37.5, 0/50]
=[0/2.9, 0.25/3.375, 0.5/3.85, 0.75/4.225, 1.0/4.8] x [0/50, 0.25/62.5, 0.5/75, 0.75/87.5, 1.0/100] + [0/1,0.25/1.475, 0.5/1.95, 0.75/2.425, 1/2.9, 0.75/3.375, 0.5/3.85, 0.25/4.225,0/4.8] x [0/0, 0.25/12.5, .5/25, 0.75/37.5, 1/50, 0.75/62.5, 0.5/75, 0.25/87.5, 0/100] + [1/1,0.75/1.475, 0.5/1.95, 0.25/2.425, 0/2.9] x [1/0, 0.75/12.5, .5/25, 0.25/37.5, 0/50]
Figure 7.
Fuzzy Membership functions

The rule 1 may also be represented in the matrix form as given in Table 6.
| 0 | 12.5 | 25 | 37.5 | 50 | 62.5 | 75 | 87.5 | 100 | |
|---|---|---|---|---|---|---|---|---|---|
| 1 | 1 | 0.75 | 0.5 | 0.25 | 0 | 0 | 0 | 0 | 0 |
| 1.475 | 0.75 | 0.75 | 0.5 | 0.25 | 0.25 | .25 | 0.25 | 0.25 | 0 |
| 1.95 | 0.5 | 0.25 | 0.5 | 0.5 | 0.5 | 0.5 | 0.5 | 0.25 | 0 |
| 2.425 | 0.25 | 0.25 | 0.25 | 0.75 | 0.75 | 0.75 | 0.5 | 0.25 | 0 |
| 2.9 | 0 | 0.25 | 0.5 | 0.75 | 1.0 | 0.75 | 0.5 | 0.25 | 0 |
| 3.375 | 0 | 0.25 | 0.5 | 0.75 | 0.75 | 0.75 | 0.5 | 0.25 | 0.25 |
| 3.85 | 0 | 0.25 | 0.5 | 0.5 | 0.5 | 0.5 | 0.5 | 0.5 | 0.5 |
| 4.225 | 0 | 0.25 | 0.25 | 0.25 | 0.25 | 0.25 | 0.5 | 0.75 | 0.75 |
| 4.8 | 0 | 0 | 0 | 0 | 0 | 0.25 | 0.5 | 0.75 | 1 |
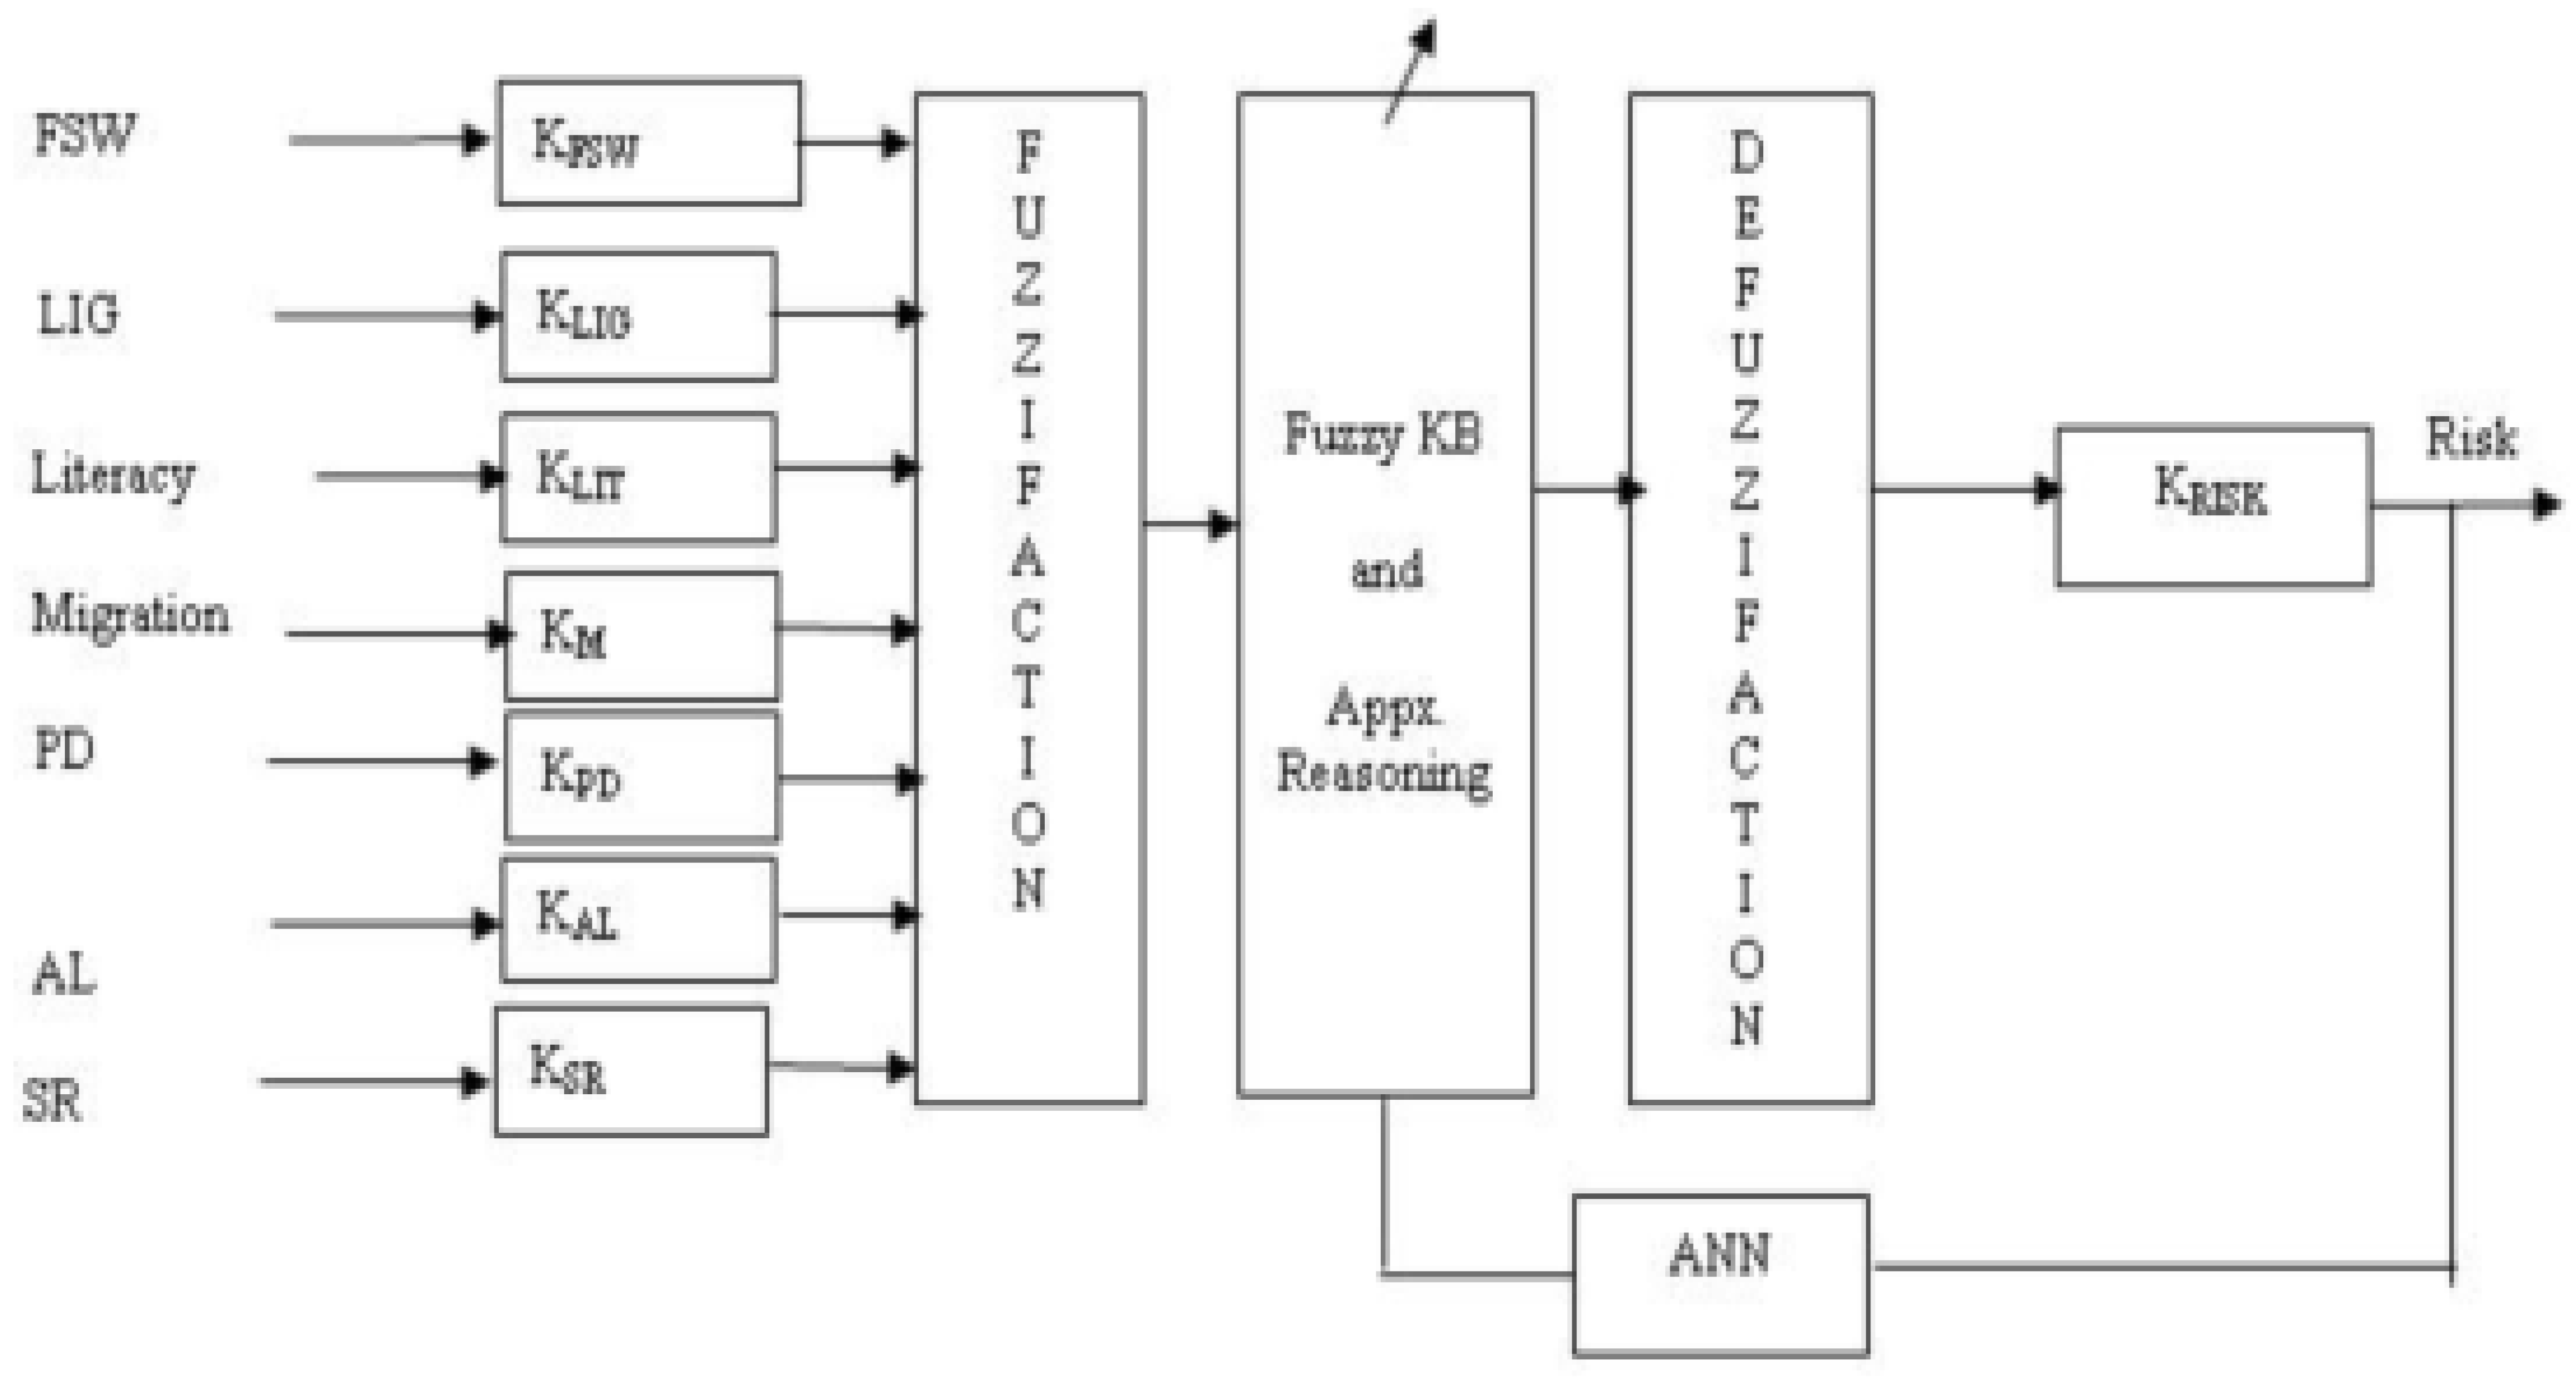
Figure 8.
Block diagram of ANFIS model of risk

Let us find the effect of FSW on Risk:
Given Crisp % FSW = 1.475,
Fuzzy % FSW = [1/1,0.75/1.475, 0.5/1.95, 0.75/2.425, 1/2.9, 0.75/3.375, 0.5/3.85, 0.25/4.225, 0/4.8]
After getting fuzzified valued of %FSW, determine the risk using rule #1and max-min composition.
RiskFSW = Fuzzy % FSW o Rule1
= [1/0, 0.75/12.5, 0.5/25, 0.75/37.5, 1/50, 0.75/62.5, 0.5/75, 0. 5/87.5, 0.5/100]
= [1/0, 0.75/12.5, 0.5/25, 0.75/37.5, 1/50, 0.75/62.5, 0.5/75, 0. 5/87.5, 0.5/100]
Similarly risk from other factors also calculated and then finally combined risk is calculated.
Step 4
The fuzzy knowledge base developed in step 3 is fiixed and does not have adaptability. Hence, Neuro-fuzzy approach has been used to make it more flexible and adaptive. The ANFIS model of risk is shown in Fig. 8, which is developed, in Fuzzy toolbox of Matlab Ver. 7.0. Similarly the Infected population model is developed.
Simulation Phase
Step 5
The above-developed ANFIS Model is simulated and the results have been compared with the actual results. The model is tuned for error (i.e. deviation in the model response from actual response).
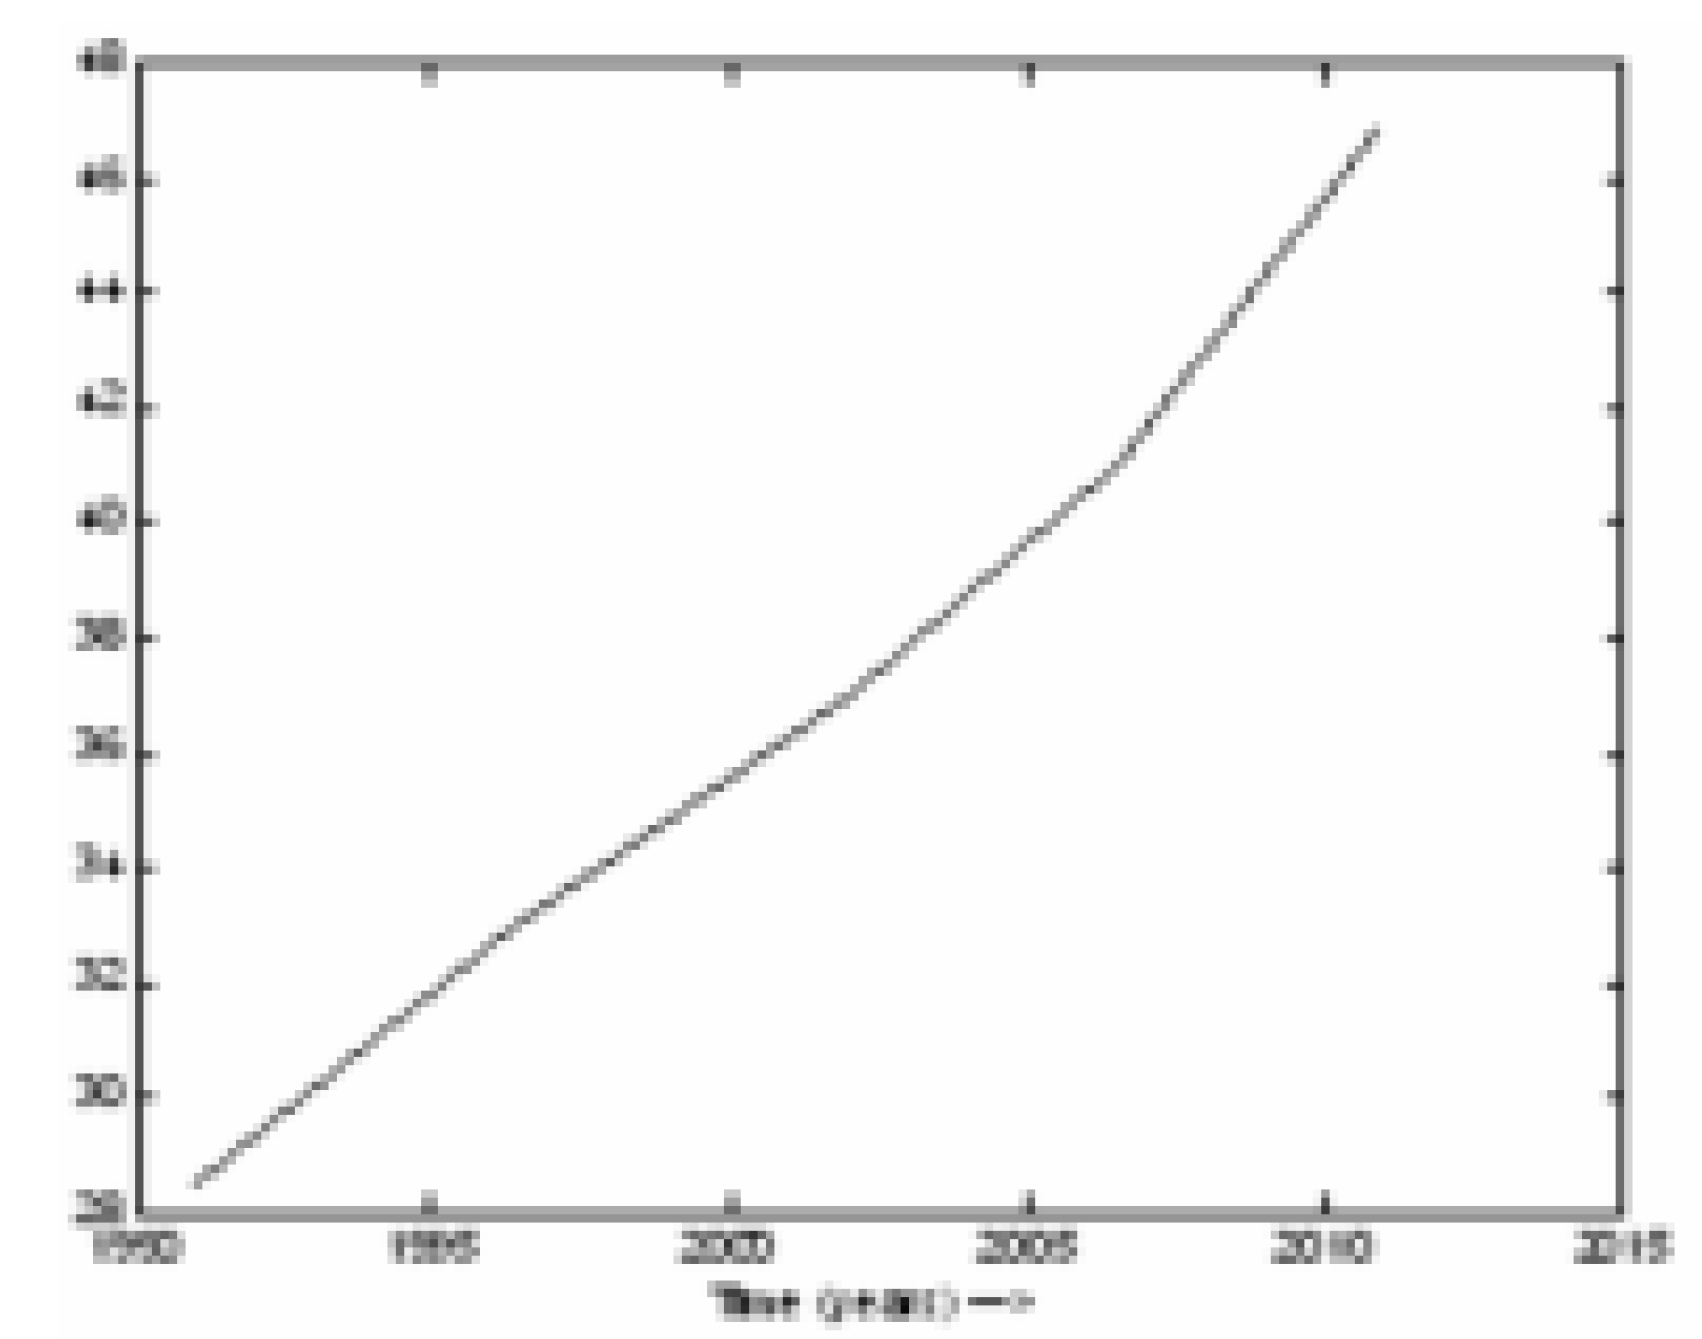
Step 6
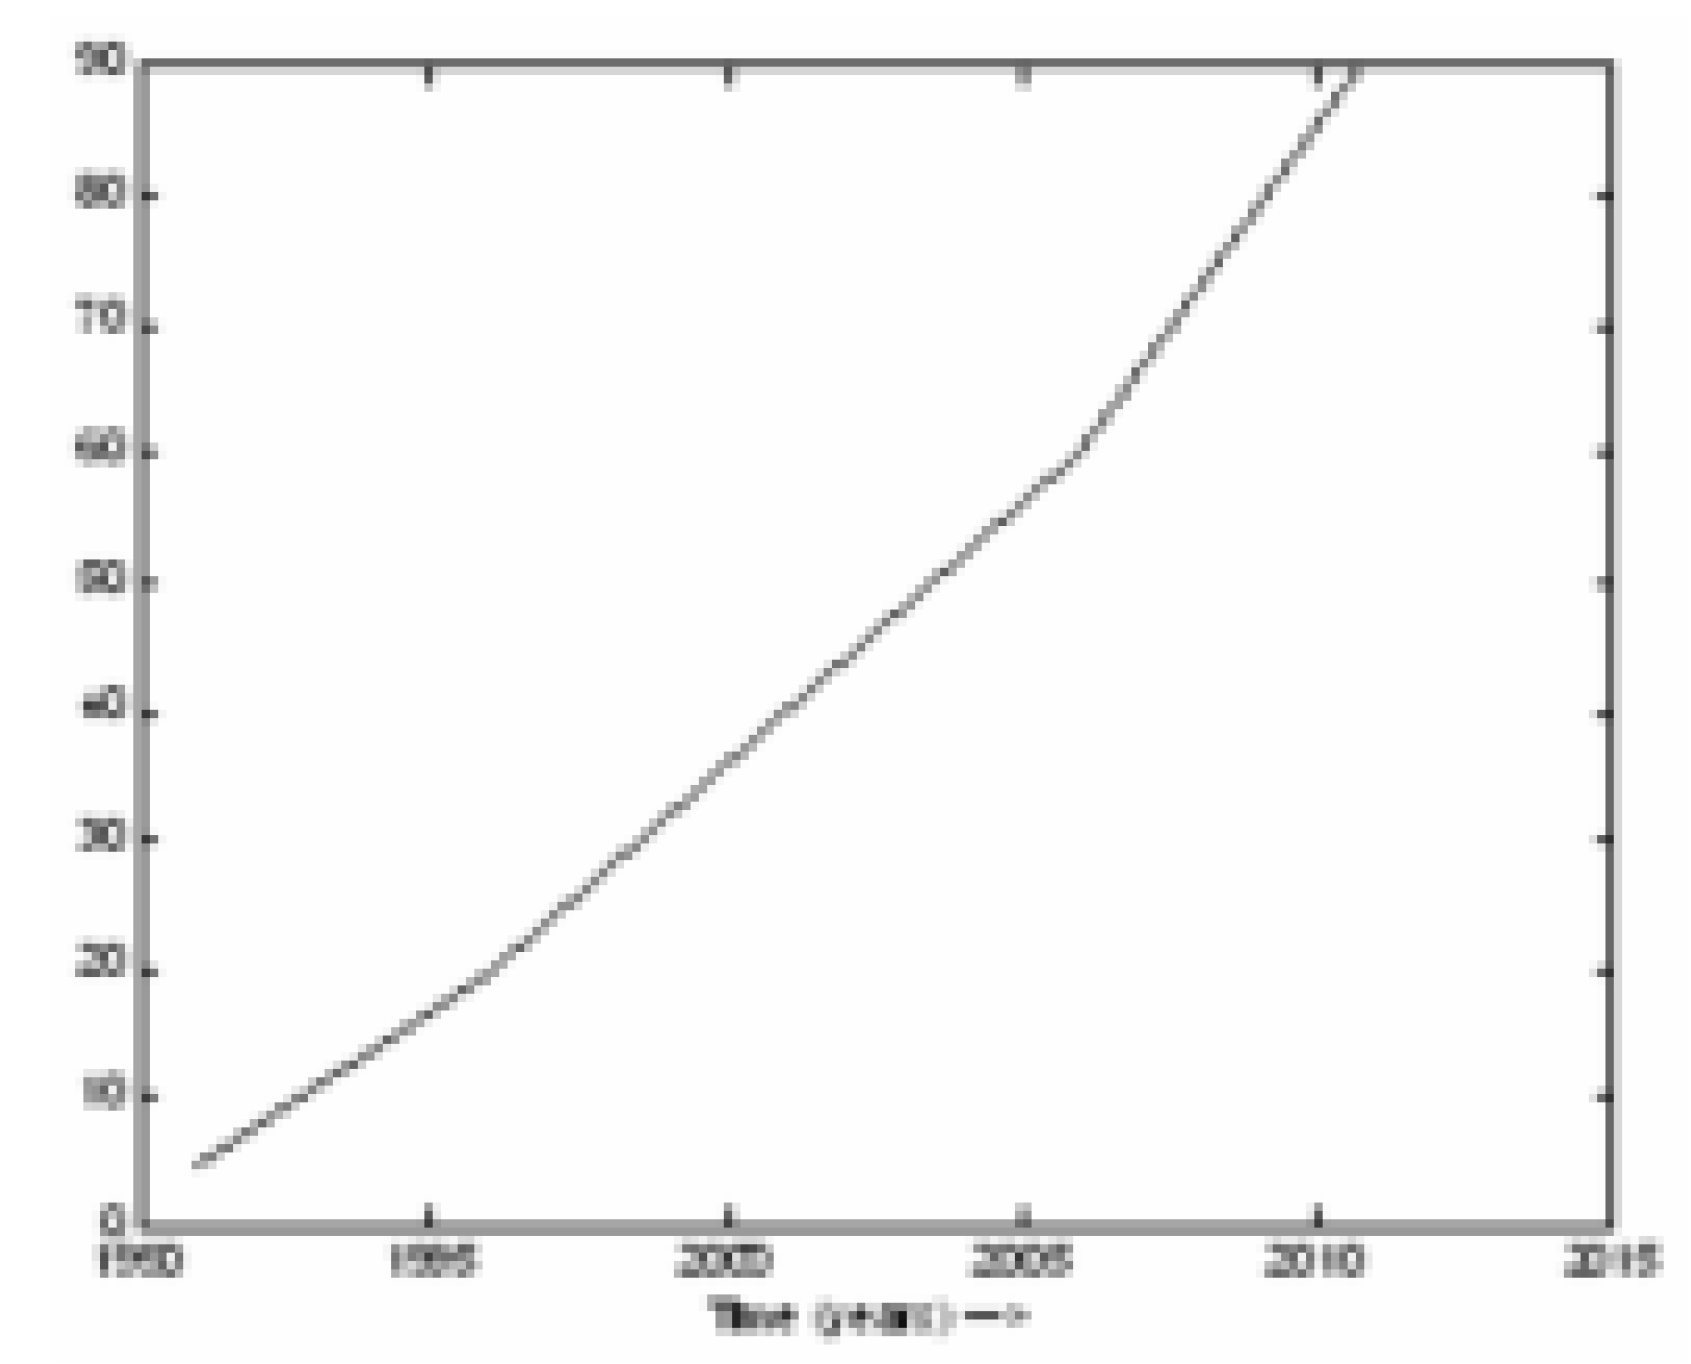
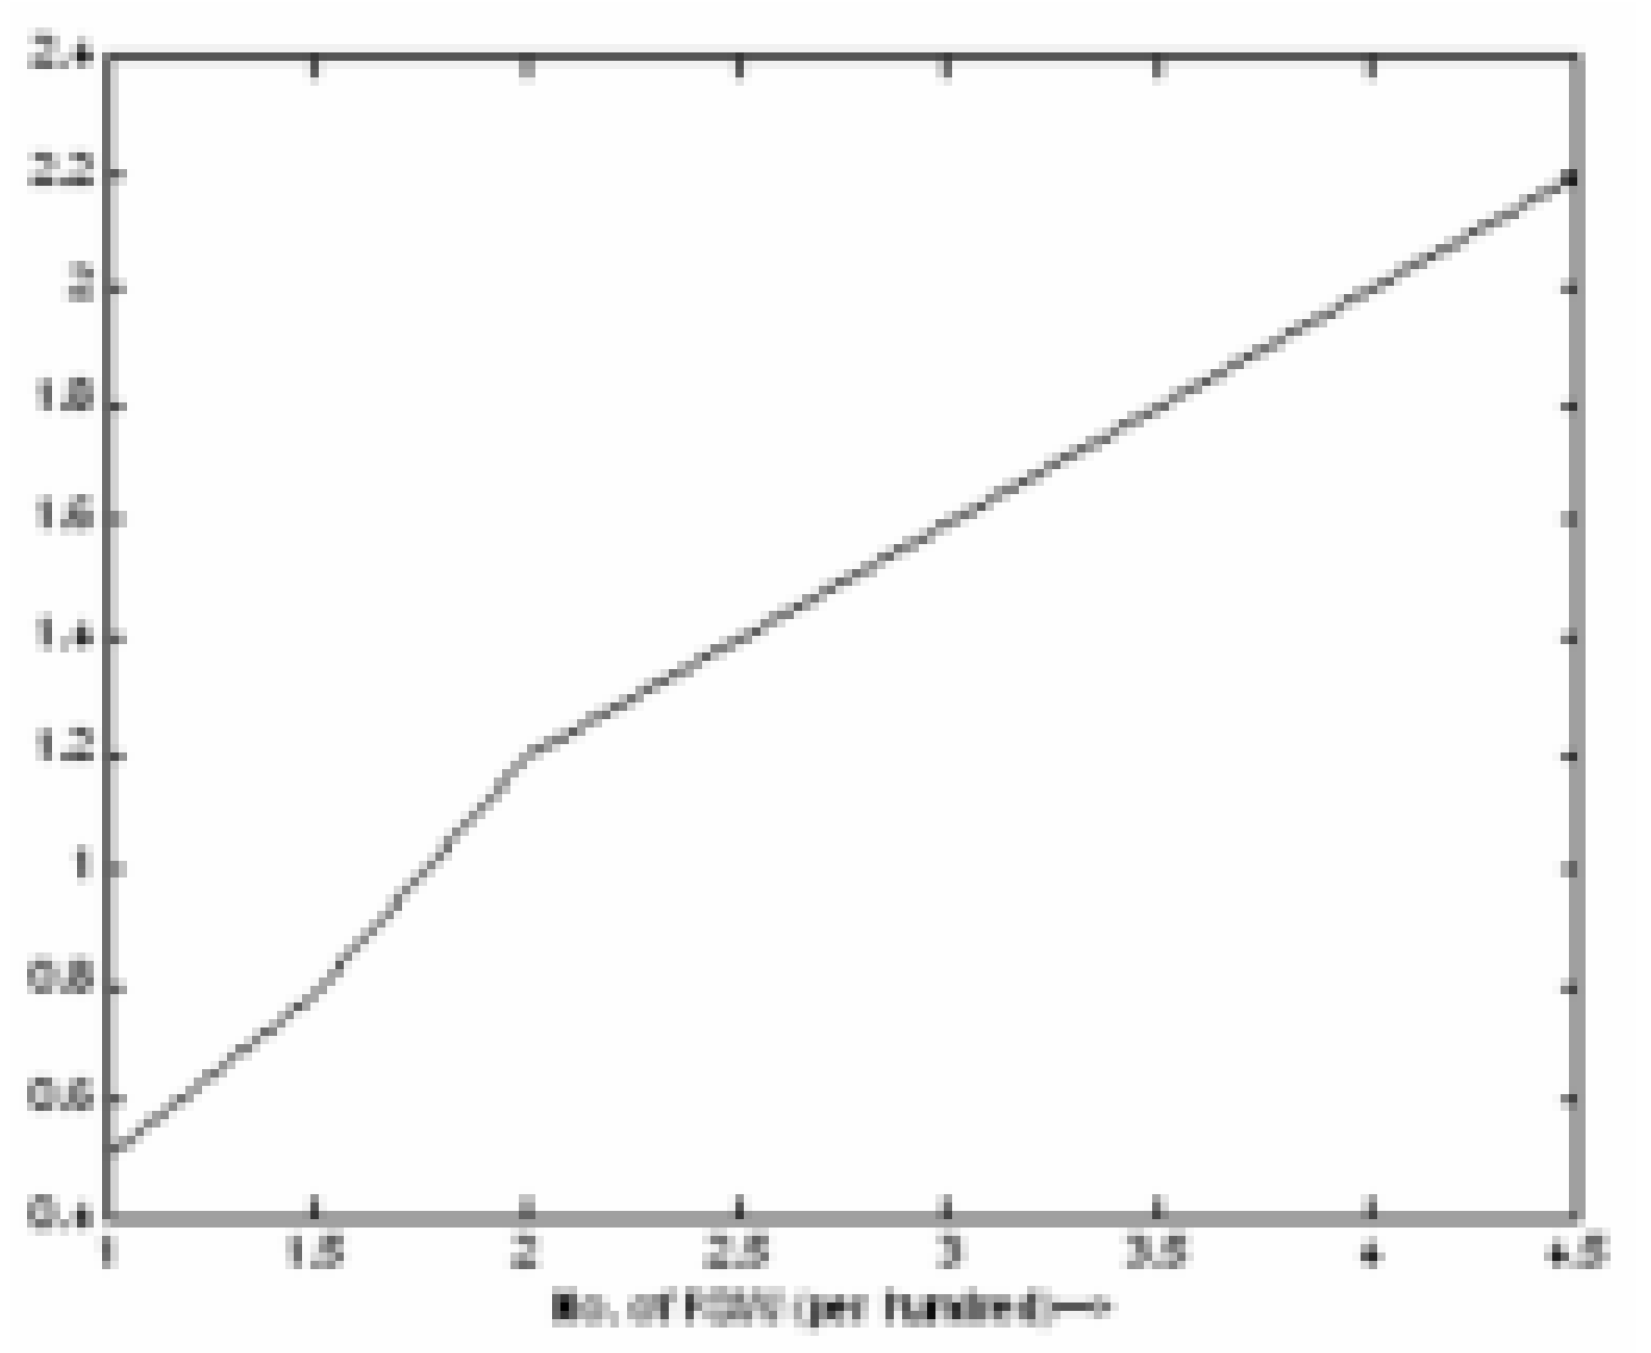
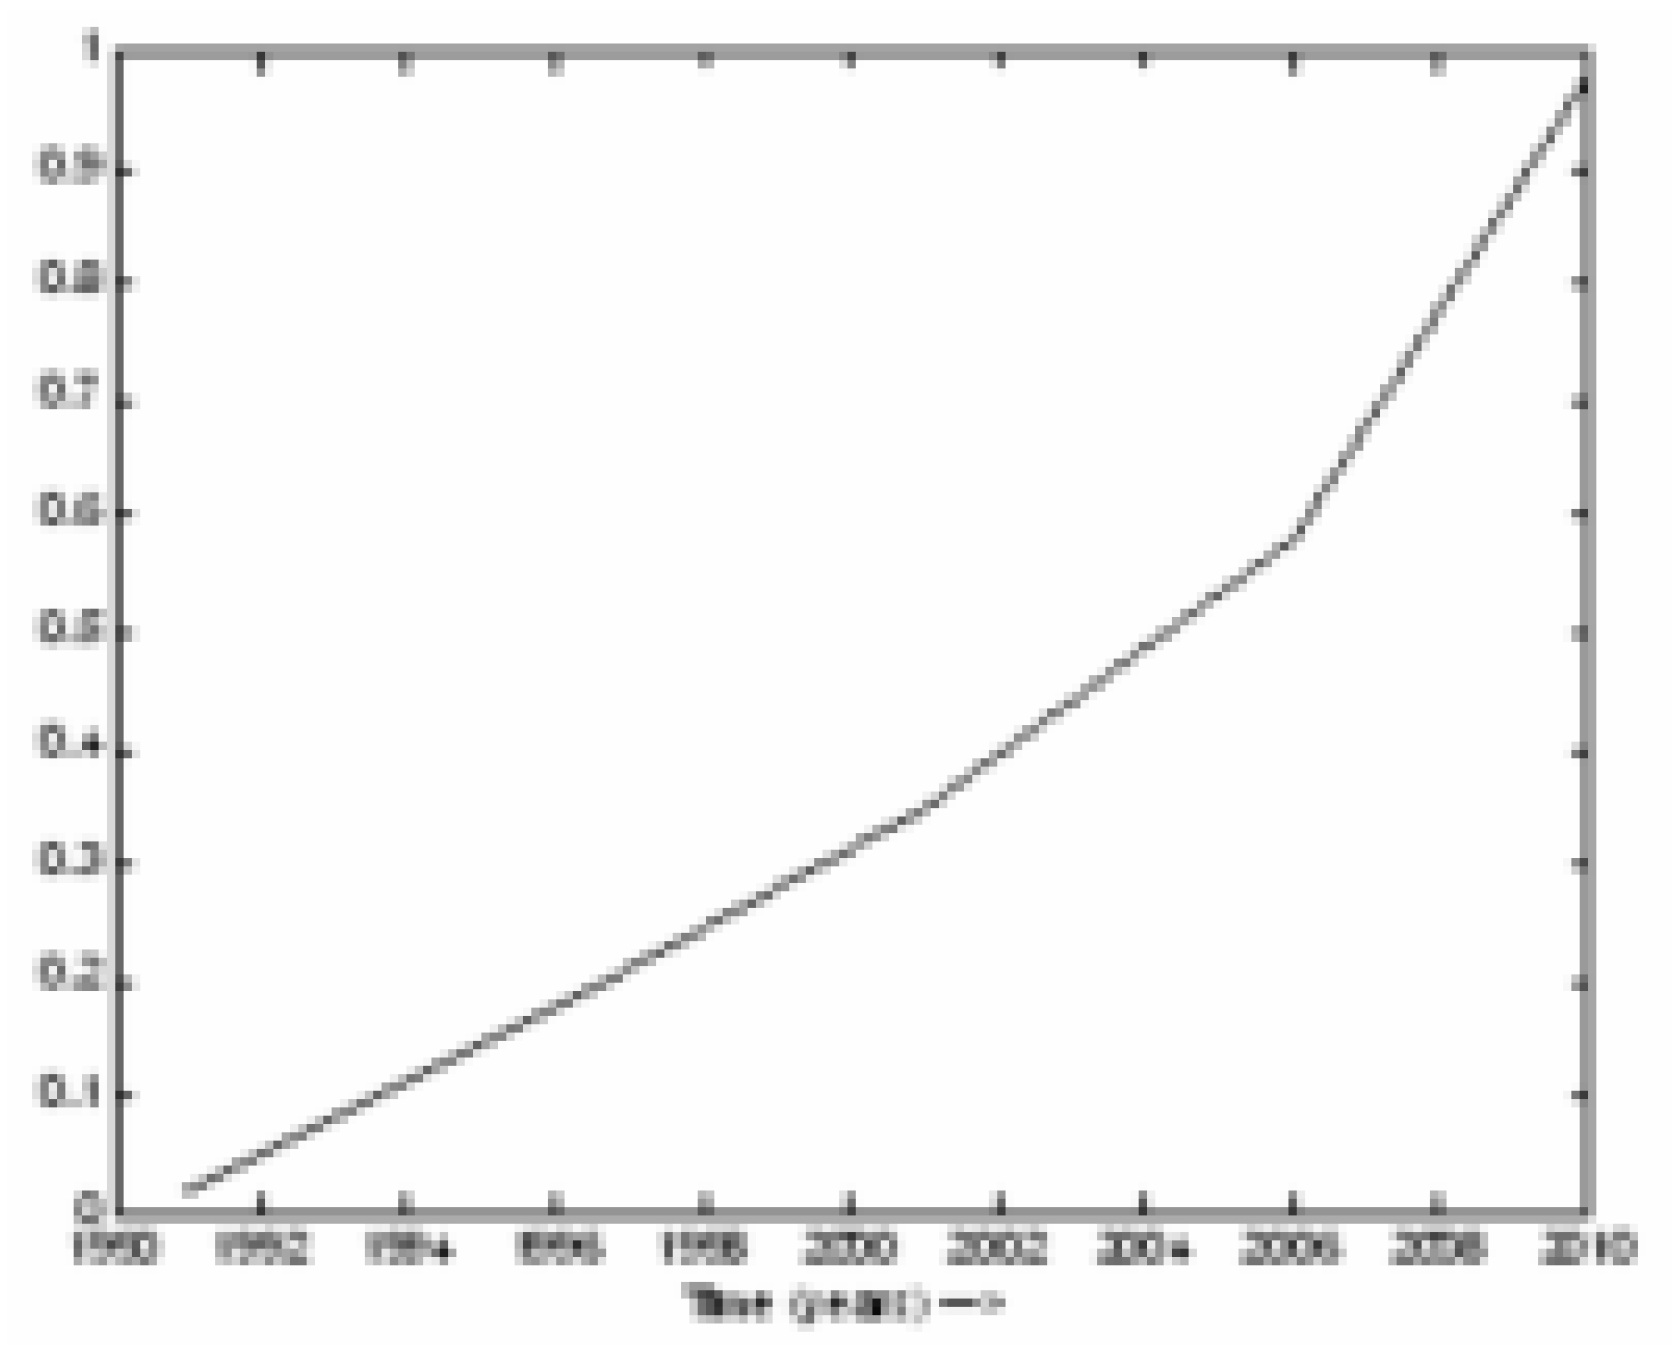
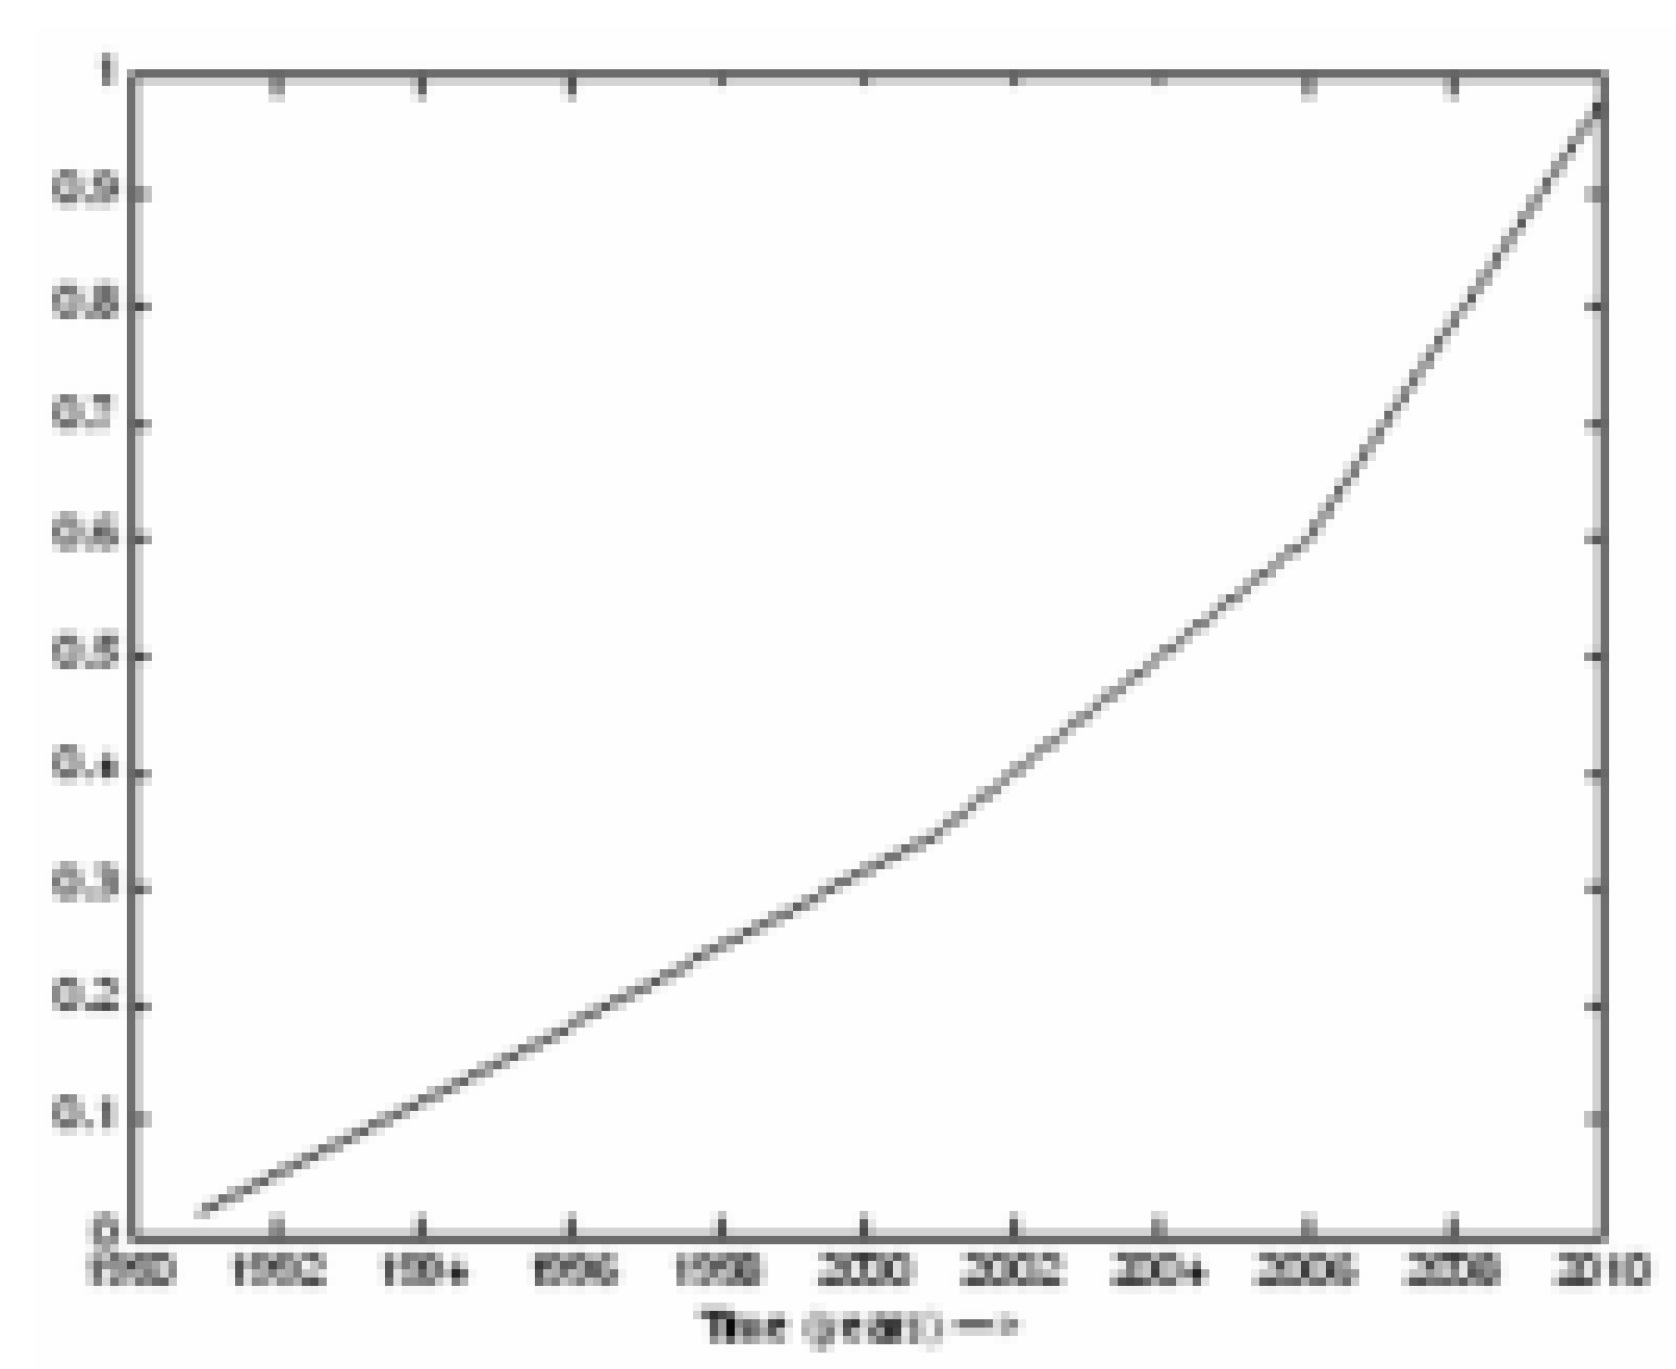
Tuned Model is used for Prediction purposes and the results are shown in Figure 9, Figure 10, Figure 11, Figure 12, Figure 13, Figure 14 and Figure 15.
Figure 9.
Estimated population

Figure 10.
Awareness level among the common man

Figure 11.
Risk of HIV infections

Figure 12.
Effect of FSW on Risk

Figure 13.
Effect of Literacy on Risk

Figure 14.
Trend of IEC for future

Figure 15.
Trend of infected population

Conclusion
It has been accepted that HIV/AIDS is not a health problem alone, but a problem of such magnitude that it affects every facet of human life. The country will have serious socio-economic consequences if sufficient and necessary steps are not taken. In the paper, the dynamic model of HIV/AIDS population has been developed by establishing the cause – effect (causal) relationship between a pair of variables and then from these relationships a Fuzzy knowledge base is prepared. For causal relationship the information is gathered through the survey of results. The problems faced during survey are mentioned below:
- There is no information obtained for HIV+ unmarried female due to typical Indian culture.
- People do not want to disclose that he/she is HIV+ due to stigma.
- Some private blood banks do not have full proof HIV testing facility.
These are the difficulties to collect the correct and accurate information for model development. Hence, fuzzy system is best suited for modeling of HIV population dynamics to include the uncertainty in the data. To include adaptivity in the developed model technique, ANN is used to change rules and membership functions of fuzzy sets. The neuro-fuzzy model developed for HIV/AIDS population dynamics is quite suited for this application. The model includes the variable growth rate of population, diffusion of population due to migration, transmission in a heterosexual community, role of exposed classes, demographic factors, effect of education and intervention programs.
The results obtained are very close to the actual results. The results show that HIV+ is increasing with alarming rate. Lacks of political commitment make the situation even worse. The following conclusions can be drawn from the results to reduce the HIV infection rate:
- By educating the female rural population of the region.
- Free HIV screening facility for everybody.
- Effect implementation of value based intervention programs in the rural area.
- Proper counseling to the common public.
- Poverty is also a main cause of spreading HIV infection.
- Some mechanism to devised, so that if a earning male member of the family dies with AIDS, then other family member should get job or get some financial support from the government.
References
- Mehendale, S. M.; Shepherd, M. E.; Divekàr, A. D.; et al. Evidence for high prevalence and rapid transmission of HIV among individuals attending STD clinics in Pune, India. Indian J. Med Res. 1996, 104, 317–35. [Google Scholar]
- Bollinger, R. C.; Brookmeyer, R. S.; Mehendale, S. M.; et al. ‘Risk factor and clinical presentation of acute primary HIV infection in India’. JAMA 1997, 278, 2085–9. [Google Scholar] [CrossRef]
- Bwayo, J.; Plummer, F.; Omari, A. M.; Mutere, A. N.; et al. Long distance truck-drivers: 1. Prevalence of Sexually Transmitted Diseases (STDs). East Afr Med. J. 1991, 68, 425–9. [Google Scholar]
- Kreiss, J. K.; Hopkins, S. G. The association between circumcision status and human immunodeficiency virus infection in homosexual men. J. Infect Dis. 1993, 168, 1404–8. [Google Scholar] [CrossRef]
- Kosko, Bart. “Neural network and fuzzy systems”. Prentice Hall: New Delhi, 1994. [Google Scholar]
- Ram, Naresh. “The transmission dynamics of HIV/AIDS : some basic models”. Narosa publishing house: New Delhi, 2000. [Google Scholar]
- Srinivasa Rao, S. R. “Mathematical Modeling of AIDS Epidemic in India”. Current Science, 10 May 2003; Vol-84. [Google Scholar]
- Nagelkerke, N.; Jha, P. “Modelling the HIV/AIDS epidemic in India and Botswana: the effect of interventions”. CMH working paper series, 2001. [Google Scholar]
- Vanhowe, R. S. “Circumcision and HIV infection: review of the literature and meta analysis”. Journal of STD & AIDS 1999, vol.10. [Google Scholar]
- Chaturvedi, D. K.; Singh, P.; Man, Mohan; Gaur, S. K.; Mishra, D. S. “Development of HIV Model and Its Simulation”. J. of Health Management 2001, Vol. 3(No. 1), Sage Publications. 65–84. [Google Scholar] [CrossRef]
- Bhave, G.; Lindan, C. P.; Hudes, E. S.; Desai, S.; Wagle, U.; Tripathi, S. P.; Mandel, J. S. Impact of an intervention on HIV, sexually transmitted diseases, and condom use among sex workers in Bombay, India. AIDS 1995, 9 Supp l1:S21-30. [Google Scholar]
- Gibb, D. M.; Tess, B. H. Interventions to reduce mother-to-child transmission of HIV infection: new developments and current controversies. AIDS 1999, 1 3 Suppl A:S93-102. [Google Scholar]
- Aggarwal, O. P.; Sharma, A. K.; Indrayan, A. HIV/AIDS Research in India. National AIDS Control Organisation: New Delhi, 1997. [Google Scholar]
- Rodrigues, J. J.; Mehendale, S. M.; Shepherd, M. E.; Divekar, A. D.; Gangakhedkar, R. R.; Quinn, T. C.; Paranjape, R. S.; Risbud, A. R.; Brookmeyer, R. S.; Gadkari, D. A.; et al. Risk factors for HIV infection in people attending clinics for sexually transmitted diseases in India. British Medical Journal 1995, 311, 283–6. [Google Scholar] [CrossRef]
- Gangakhedkar, R. R.; Bentley, M. E.; Divekar, A. D.; Gadkari, D.; Mehendale, S. M.; Shepherd, M. E.; Bollinger, R. C.; Quinn, T. C. Spread of HIV infection in married monogamous women in India. Journal of the American Medical Association 1997, 278, 2090–2. [Google Scholar] [CrossRef]
- Brookmeyer, R.; Mehendale, S. M.; Pelz, R. K.; Shepherd, M. E.; Quinn, T.; Rodrigues, J. J.; Bollinger, R. C. Estimating the rate of occurrence of new HIV infections using serial prevalence surveys: the epidemic in India. AIDS 1996, 10, 924–5. [Google Scholar] [CrossRef]
- Chaturvedi, D. K.; Man, Mohan; Saxena, A. K. Development of HIV infected population model using System Dynamics Technique. Int. J. of Modeling, Measurements, and Control, France 2001, Vol. 22(No. 2), 1–14. [Google Scholar]
- Stover, J.; Walker, N.; Garnett, G. P.; Salomon, J. A.; Stanecki, K. A.; Ghys, P. D.; Grassly, N. C.; Anderson, R. M.; Schwartländer, B. ‘Can we reverse the HIV/AIDS pandemic with an expanded response?’. Lancet 2002, volume 360(issue 9326), 73–7, (issn: 0140-6736). [Google Scholar] [CrossRef]
- Garnett, G. P.; Bartley, L.; Grassly, N. C.; Anderson, R. M. ‘Antiretroviral therapy to treat and prevent HIV/AIDS in resource – poor settings’. Nat. Med. 2002, volume 8(issue 7), 651–4, (issn: 1078-8956). [Google Scholar]
- Ghani, A. C.; Ferguson, N. M.; Fraser, C.; Donnelly, C. A.; Danner, S.; Reiss, P.; Lange, J.; Goudsmit, J.; Anderson, R. M.; De Wolf, F. ‘Viral replication under combination antiretroviral therapy: a comparison of four different regimens’. J. Acquir Immune Defic Syndr 2002, volume 30(issue 2), 167–76, (issn: 1525-4135). [Google Scholar]
- Anderson, R. M.; Garnett, G. P. ‘Mathematical models of the transmission and control of sexually transmitted diseases’. Sex Transm Dis 2002, volume 27(issue 10), 636–43, (issn: 0148-5717). [Google Scholar] [CrossRef]
- Anderson, R. M.; May, R. M.; McLean, A. R. ‘Possible demographic consequences of AIDS in developing countries.’. Nature 1988, 332((6161)), 228–34. [Google Scholar] [CrossRef]
- May, R. M.; Anderson, R. M. ‘The transmission dynamics of human immunodeficiency virus (HIV).’. Philos Trans. R Soc Lond B Biol Sci. 1988, 321(1207), 565–607. [Google Scholar] [CrossRef]
- Anderson, R. M.; Medley, G. F.; May, R. M.; Johnson, A. M. A preliminary study of the transmission dynamics of the human immunodeficiency virus (HIV), the causative agent of AIDS. IMA J. Math Appl. Med. Biol. 1986, 3(4), 229–63. [Google Scholar]
- Nowak, M. A.; May, R. M. ‘Mathematical biology of HIV infections: antigenic variation and diversity threshold.’. Math Biosci. 1991, 106(1), 1–21. [Google Scholar] [CrossRef]
- Baily, G. G.; Moore, C. B.; Essayag, S. M.; de Wit, S.; Burnie, J. P.; Denning, D. W. ‘Candida inconspicua, a fluconazole-resistant pathogen in patients infected with human immunodeficiency virus’. J. Clin Infect Dis. 1997, 25(1), 161–3. [Google Scholar]
© 2005 MDPI. All rights reserved.
Share and Cite
MDPI and ACS Style
Chaturvedi, D.K. Dynamic Model of HIV/AIDS Population of Agra Region. Int. J. Environ. Res. Public Health 2005, 2, 420-429. https://doi.org/10.3390/ijerph2005030006
AMA Style
Chaturvedi DK. Dynamic Model of HIV/AIDS Population of Agra Region. International Journal of Environmental Research and Public Health. 2005; 2(3):420-429. https://doi.org/10.3390/ijerph2005030006
Chicago/Turabian StyleChaturvedi, D. K. 2005. "Dynamic Model of HIV/AIDS Population of Agra Region" International Journal of Environmental Research and Public Health 2, no. 3: 420-429. https://doi.org/10.3390/ijerph2005030006