Effect of Organic Loading on Rotating Biological Contactor Efficiency

University of Mosul, College of Engineering, Civil Engineering Dept., Mosul, Iraq
Int. J. Environ. Res. Public Health 2005, 2(3), 469-477; https://doi.org/10.3390/ijerph2005030012
Submission received: 29 September 2004
/
Accepted: 15 February 2005
/
Published: 30 December 2005
Abstract
:Organic loading (weight per unit time per volume) is useful for the design of rotating biological contactors (RBC) and for comparison with the other processes such as activated sludge or oxidation ponds. The present study puts emphasis on the significance of this control or design parameter because it allows direct comparison of the RBC system's performance when operated under various circumstances and with different kinds of wastewater. The results of the paper proved that, the COD removal in rotating biological contactor systems is a function of the organic loading rate. However, each of the wastewater concentration and flow rate are also influence on the system efficiency but theirs impact can be combined by the effect of organic loading. The majority of COD removal (40-85 % of the total removal depending on the organic loading applied) occurs in the first stages of the system. There is a strong correlation between the organic loading and the concentration of the suspended solids in the rotating biological contactor basin. At higher loadings higher concentrations noted. At a loading of about, (24 g/m2.d) suspended solids were 225, 125, 35, and 25 mg/L in the first, second, third and, the fourth stage respectively. To achieve an effluent quality of (BOD ≤ 25 mg/L, COD ≤ 60 mg/L), the system must be operated on organic loadings of about (22 gBOD/m2.d and 65 gCOD/m2.d) respectively. For nitrification process, the system must be designed to operate at organic loading of about (10 g/m2.d) or less and, the reactor or basin volume should be designed to achieve a hydraulic loading of about (40 L/m2.d) or less.
Introduction
The rotating biological contactor (RBC) is an aerobic biological treatment system based on bio-absorption principle. It uses captive biological slimes to remove substance from the liquid wastewater by physical and biological means. Rotating biological contactor-treatment design criteria are still in the development stage and have been based generally on hydraulic loading. However, except for some studies, the importance of organic loading in system design or in evaluating the performance of the RBC process has been overlooked [33]. The organic loading could be expressed better in weight per unit time per unit disk surface area. Earlier investigation [2] indicated that the percentage removal for carbon removal followed the first-order relationship with respect to substance, justifying the use of hydraulic loading. Capital costs of the rotating biological contactor also have been shown to decrease linearly with hydraulic loading [12], potentially providing relatively inexpensive biological treatment for small communities, camps and others. Otherwise wastewater form these sources tend to have large diurnal flow and substrate concentration fluctuation [24], and for the rotating biological contactors that will be used in these applications, its dynamic behaviour must be carefully evaluated and quantified. Recent publications [32] suggest that the influent-substance concentration levels may play a significant role in the operation of rotating biological contactors. However, organic loading can provide an attractive alternative by combining the effect of both of hydraulic loading and organic concentration in one parameter.
The major factors controlling rotating biological contactor systems design and their performance are hydraulic loading, organic loading, influent wastewater substrate concentration, wastewater temperature, cylinder rotational speed, staging and others [1]. However, information on rotating biological contactor performance capabilities is incomplete. The performance and the operational problems of each stage of an RBC system needs to evaluate and the design criteria should be effectively judged.
The major purpose of this paper is to provide the engineering data, which is useful in the design and operation of rotating biological contactor systems.
Selected Data
Experimental testing programs are expensive in terms of both of time and money, but it is inevitable in many cases, when the information available for the design of water and wastewater treatment process is judged inadequate [24]. The major shortage in the experimental testing that it is carried out in small scale so its results mainly limits by the testing circumstances. In this paper, large of actual data were collected from existing wastewater treatment plants [1,2,3,4,5,6,7,8,9,10,11,12,13,14,15,16,17,18,19,20,21,22,23,24,25,26,27,28,29,30,31,32,33,34,35,36,37,38,39] and used to evaluate the effect of organic loading. The data were selected to cover various scales of plants (contactor diameters varied from 0.1 to 3.3 m). The work was done under wide range of operating conditions (contactor immersion ranged from 34 –60%, rotational velocity from 1.5 to 30 rpm, detention time from 0.3 to 6.85 hours, organic loading from 0.1 to 360 g/m2. d, and hydraulic loading up to 1250 L/m2. d). After sorting out, all data were treated and analyzed to evaluate the effect of organic loading on the operational factors of the system and then on its performance efficiency. Individual mathematical models to describe the effect of each parameter were also derived.
Effects of Organic Characteristics
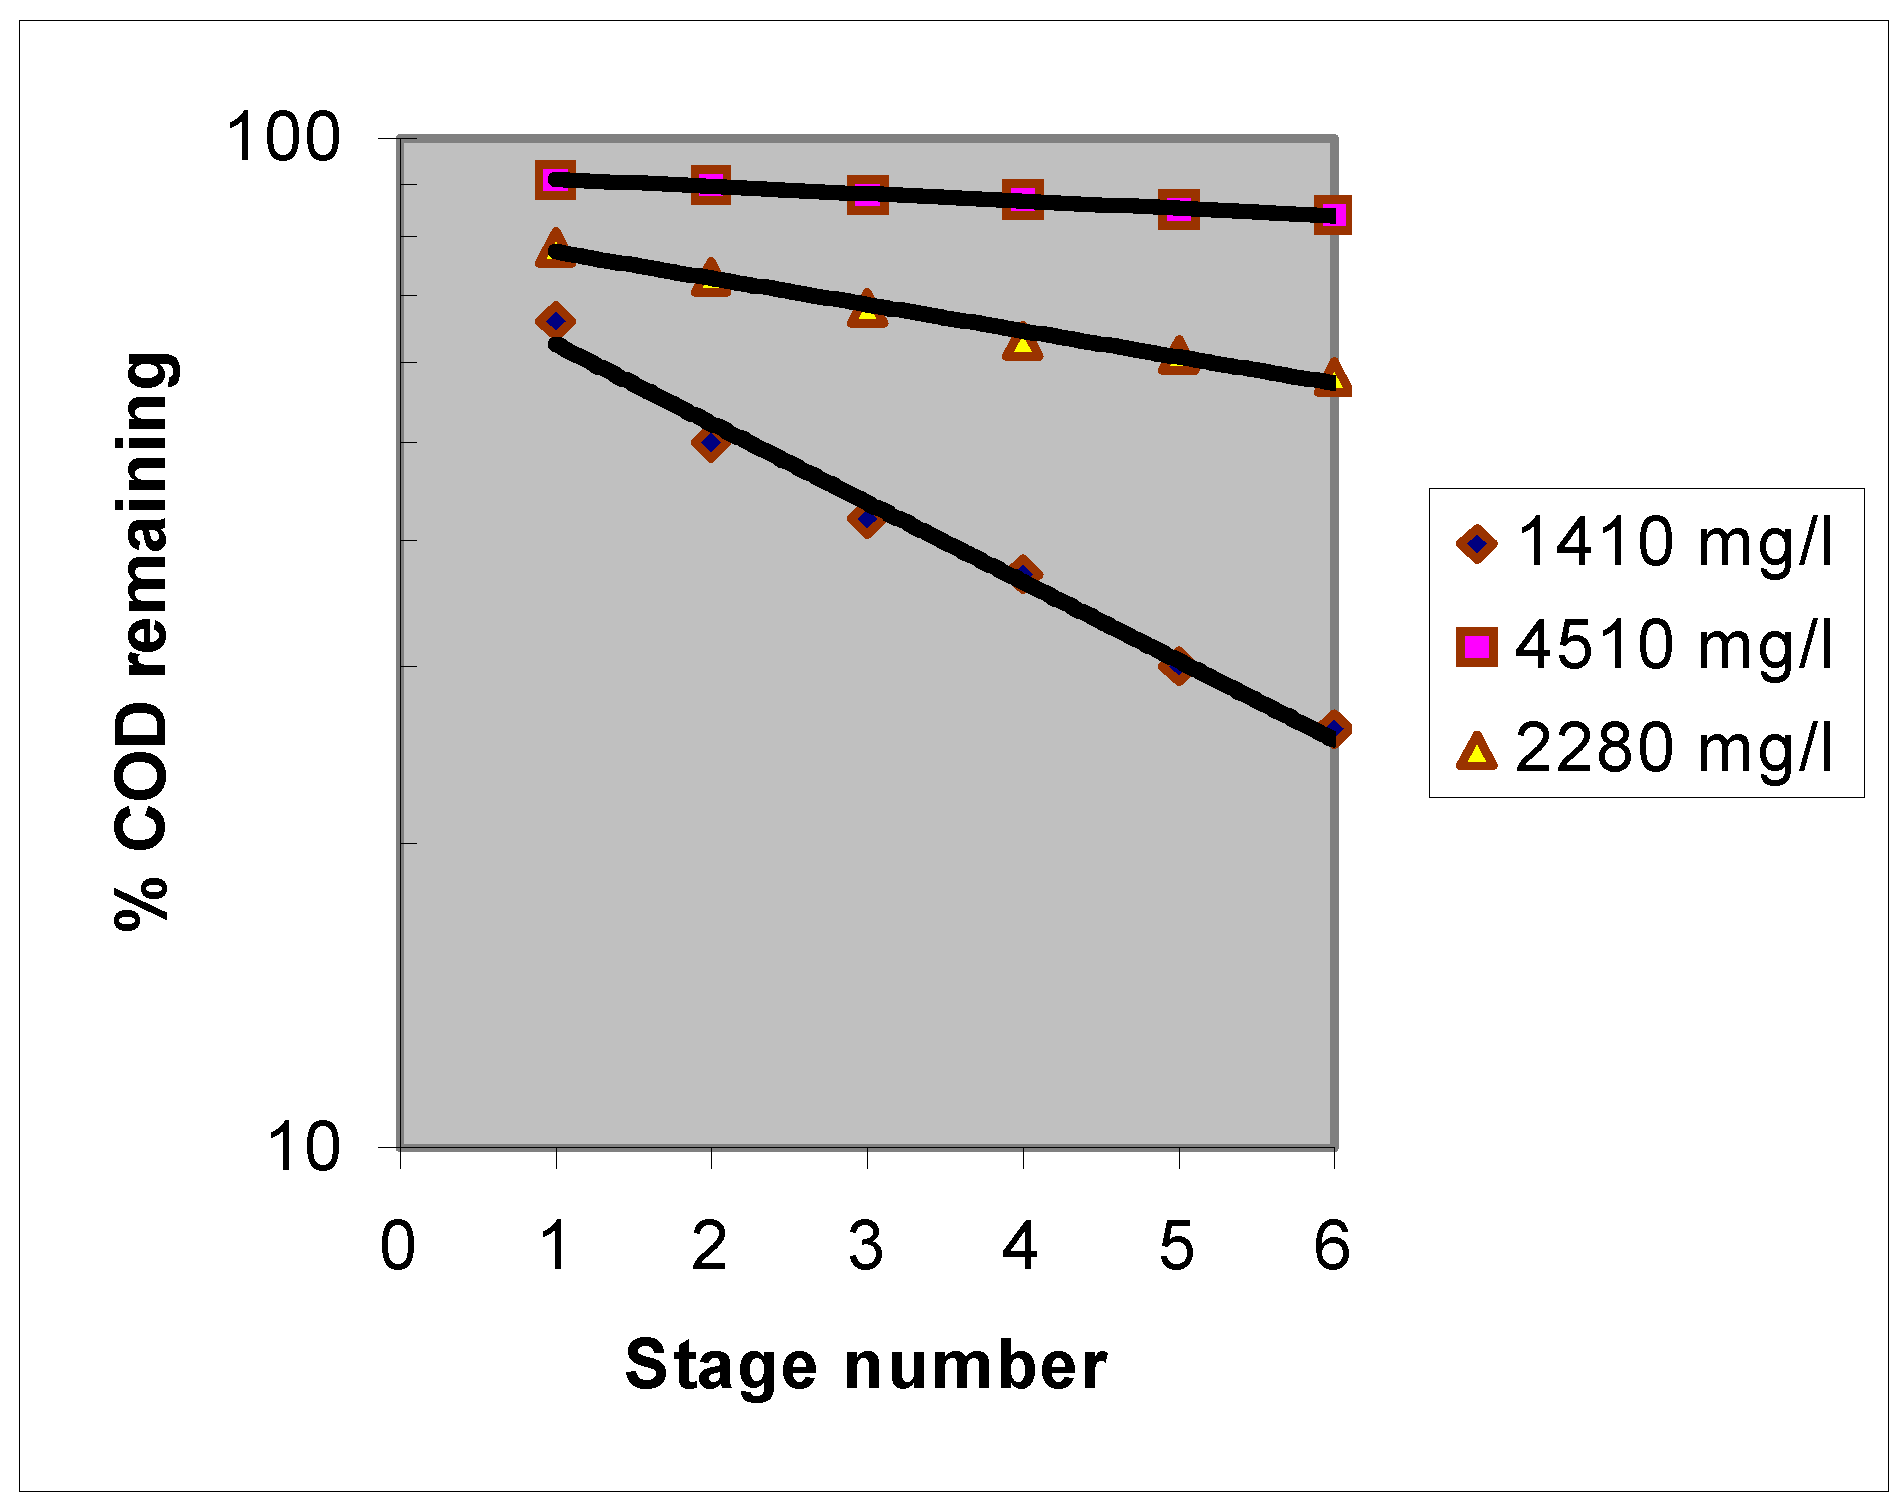
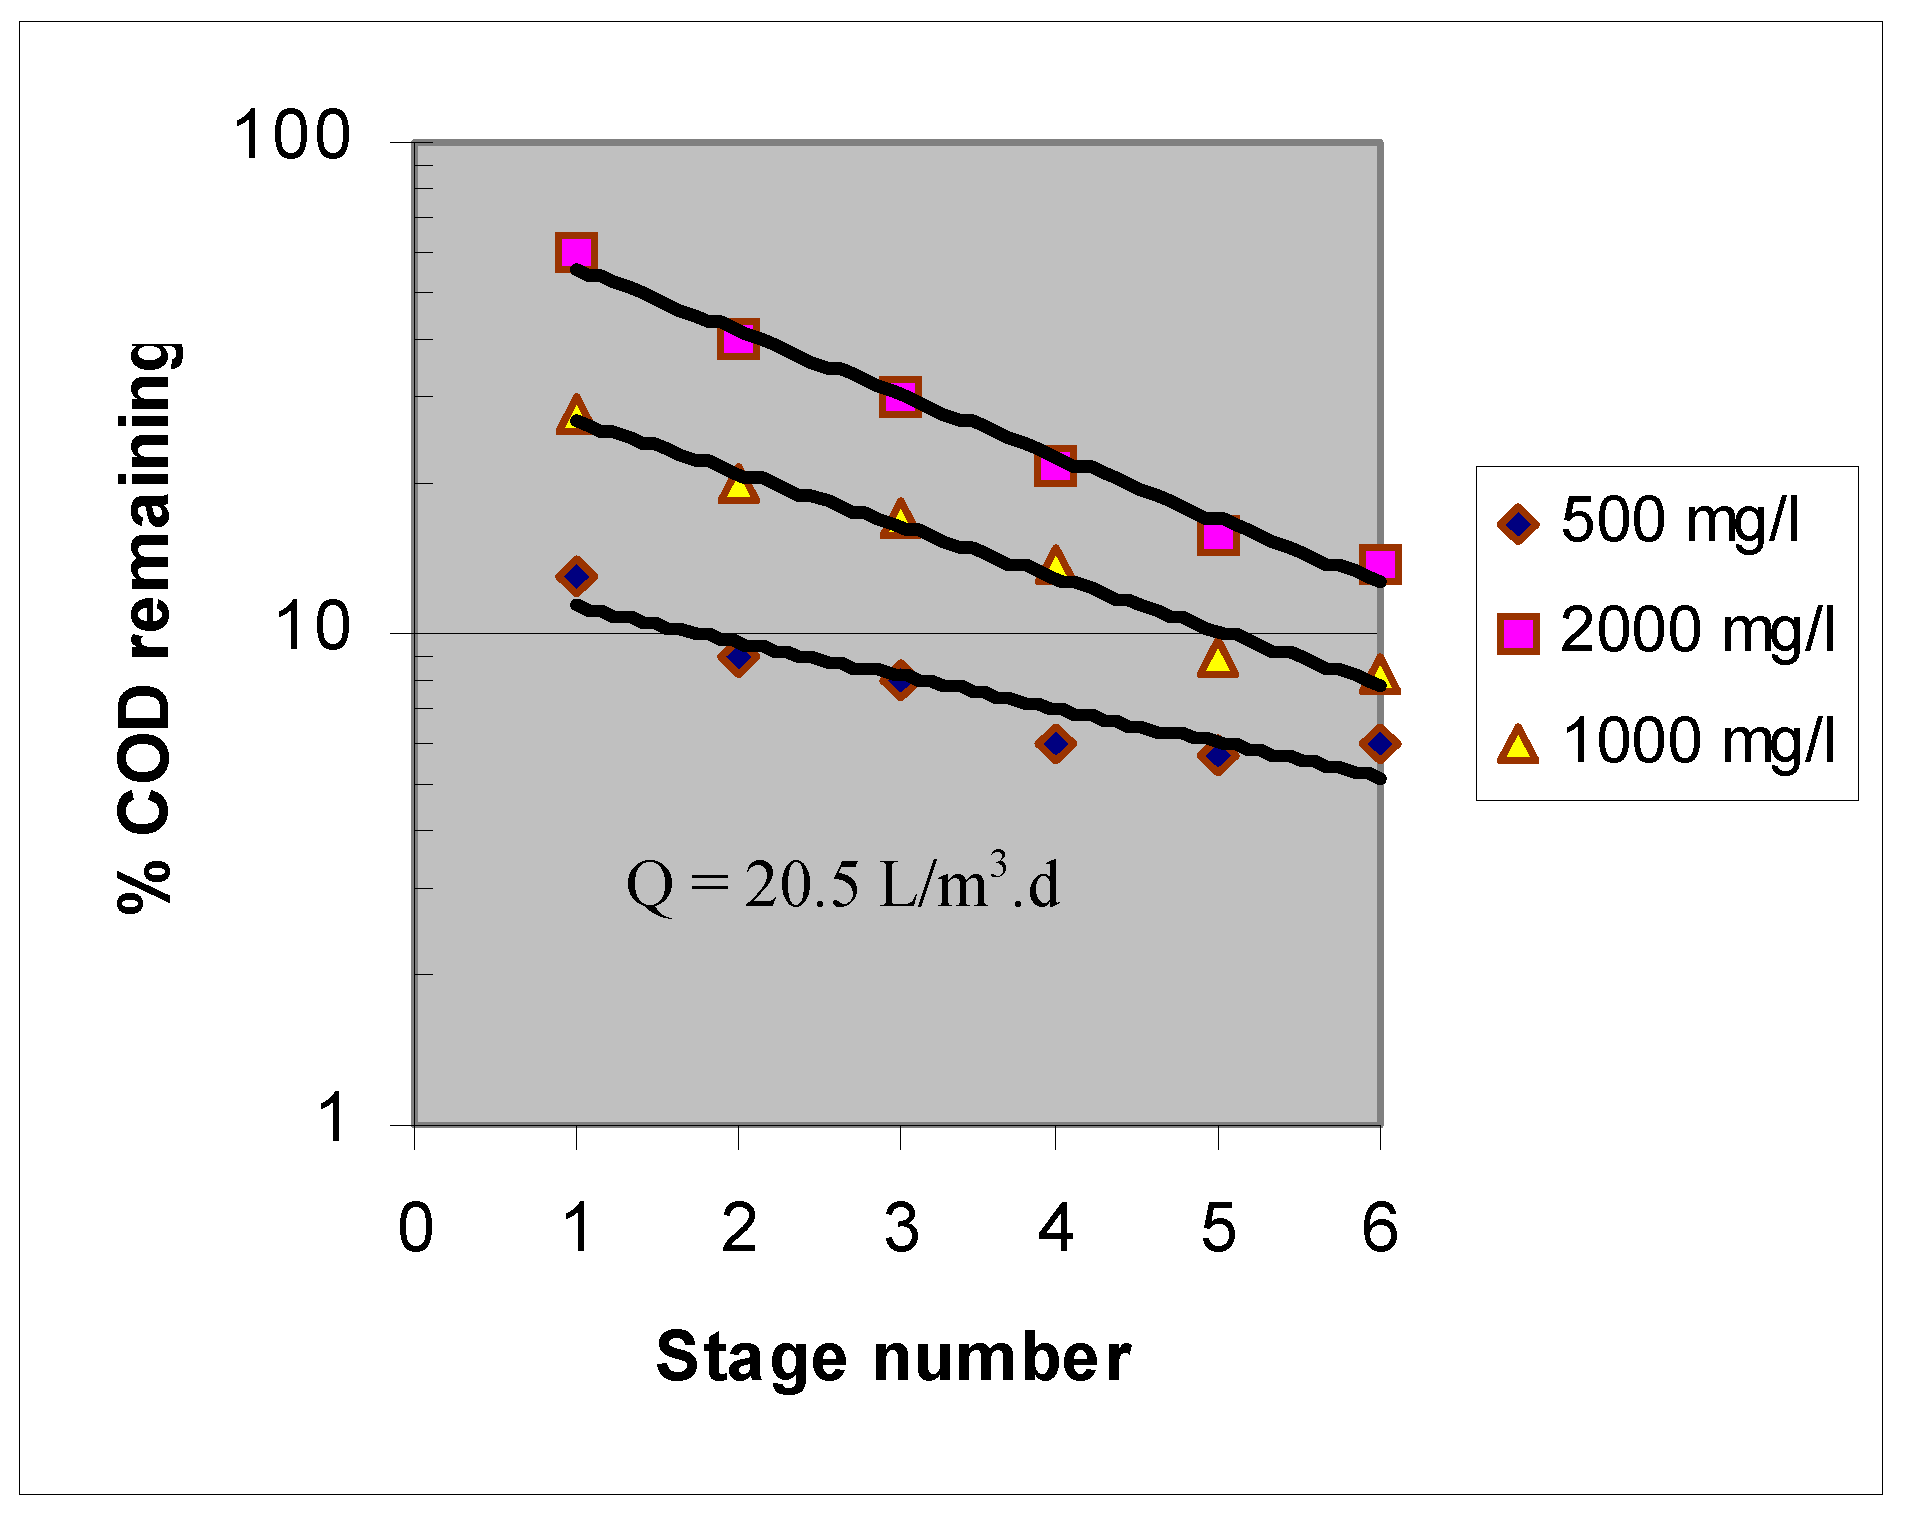
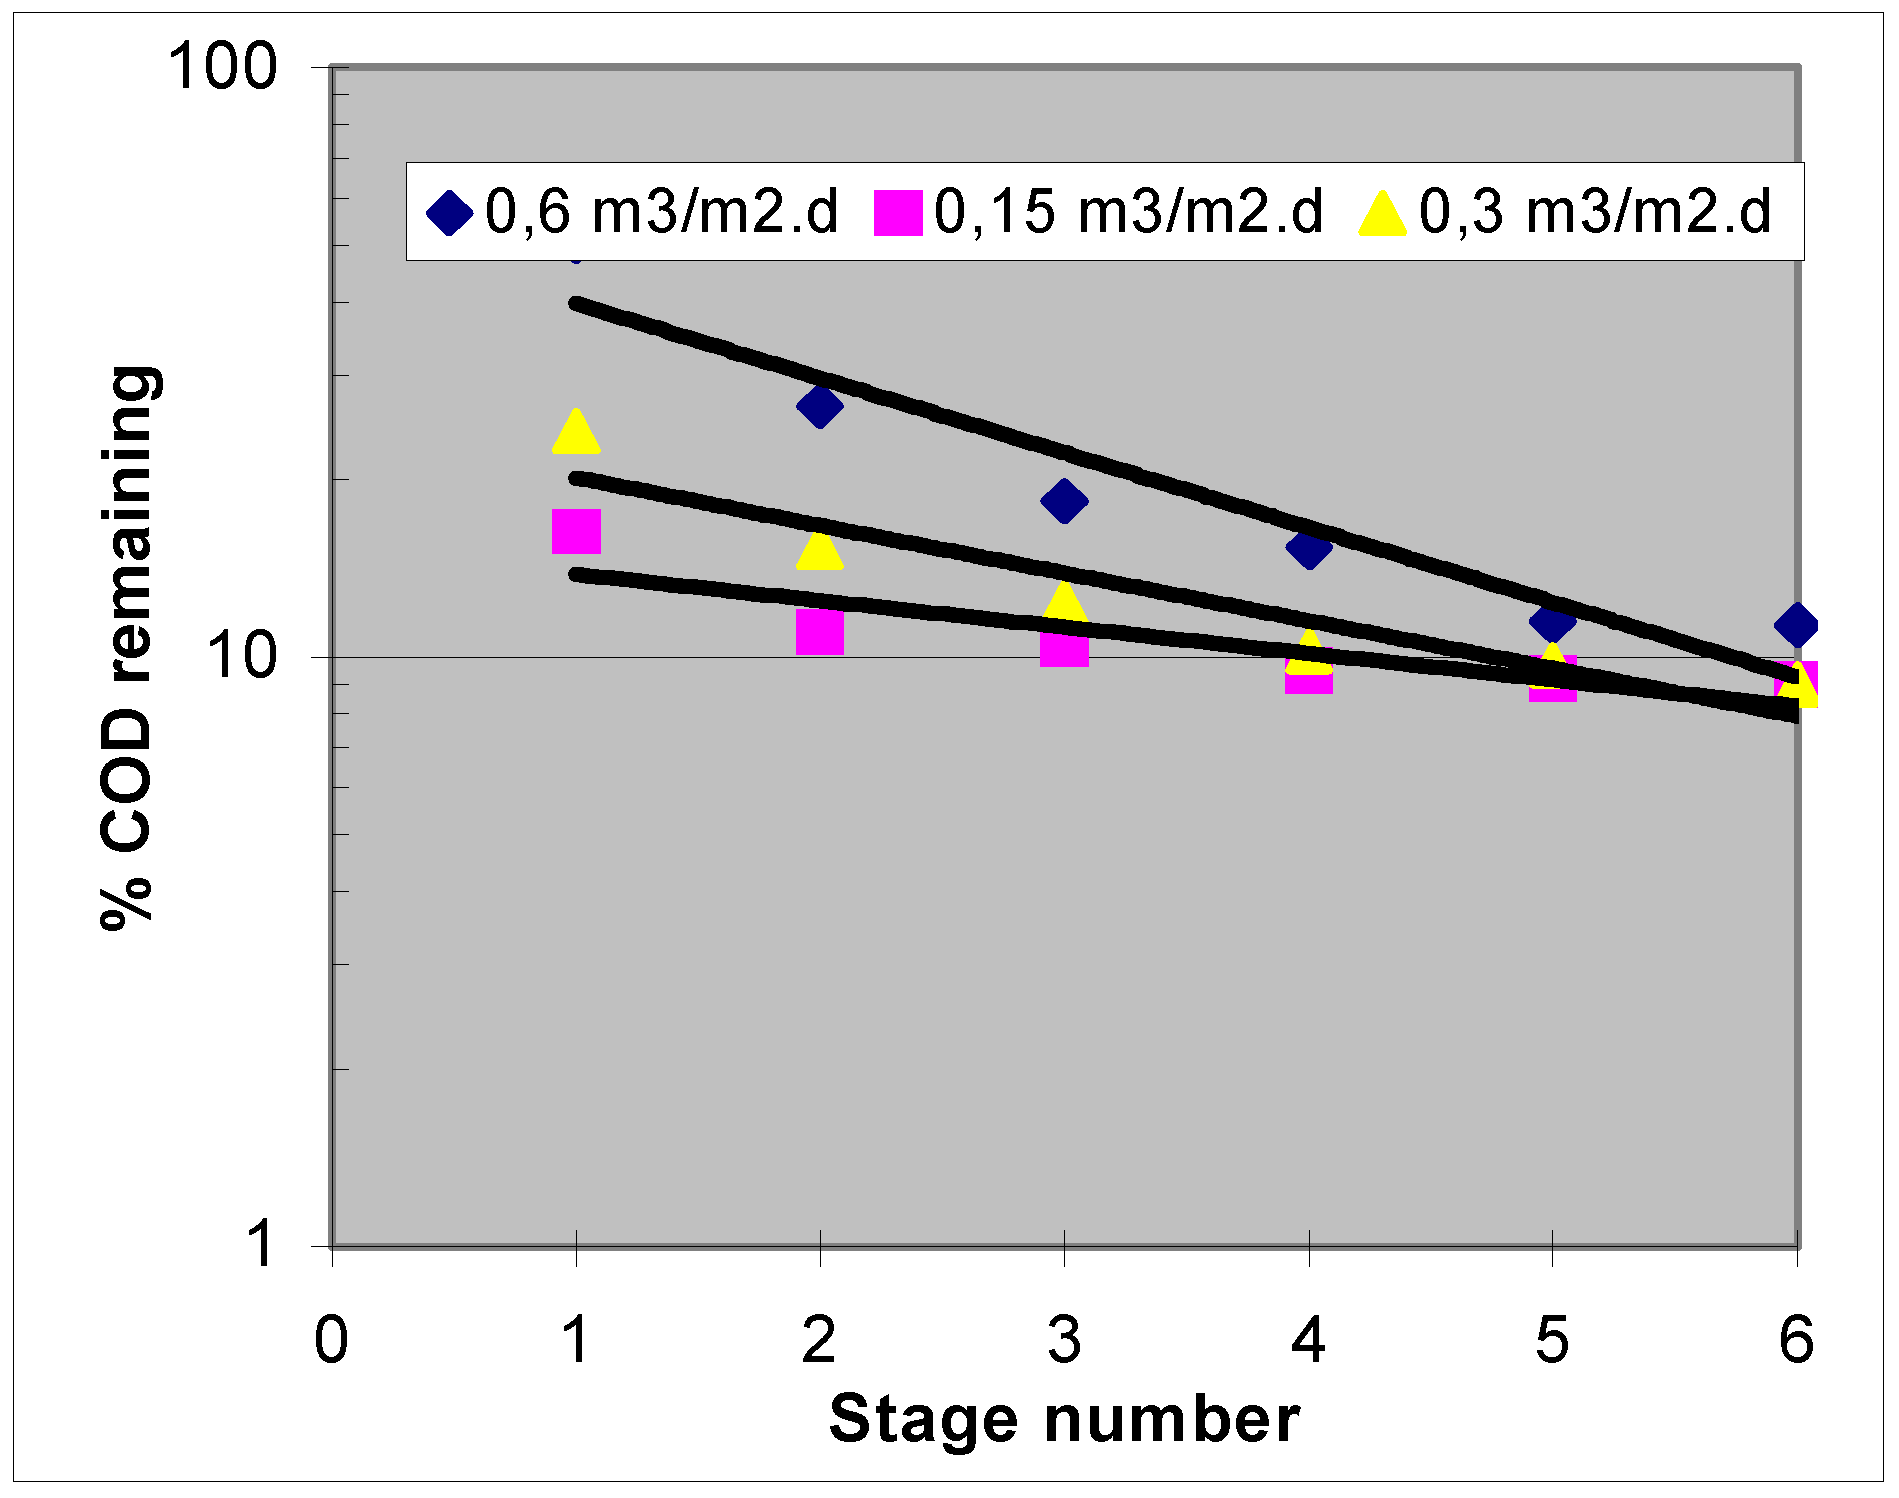
As previously explained, performance operation of rotating biological contactor systems are influence by changing of many parameters, one of these is the variation in the characteristics of wastewater. In figure (1), figure (2), figure (3), figure (4) and figure (5), the effect of wastewater types and concentrations on the performance efficiency of the systems were studied. Figure (1) and Figure (2) show the relationship between percent COD remaining with stage number for two types of wastewater: typical carbohydrate wastewater and slaughterhouse wastewater.
Figure 1.
Percent COD remaining per stage for different concentration of wastewater at constant flow rate. [33]
Figure 1.
Percent COD remaining per stage for different concentration of wastewater at constant flow rate. [33]

As shown in the figures, increasing organic concentrations in both types of wastewaters leads to decrease the removal efficiency of the system. In figure 1, about 82% of organic COD is removed in the first stage system when the COD concentration was 500 mg/l, while this efficiency is decreased to about 40% when the concentration is increased to about 2000 mg/L. In figure 2, similar results are noted but with another removal values. The slopes of the curves at each figure were also different. However, these curves proved that, in the rotating biological contactor process increasing the concentration of wastewater leads to decrease the rate of substrate utilization in the system.
Figure 2.
Percent COD remaining per stage for different concentration of wastewater at constant flow rate and velocity. [33]
Figure 2.
Percent COD remaining per stage for different concentration of wastewater at constant flow rate and velocity. [33]
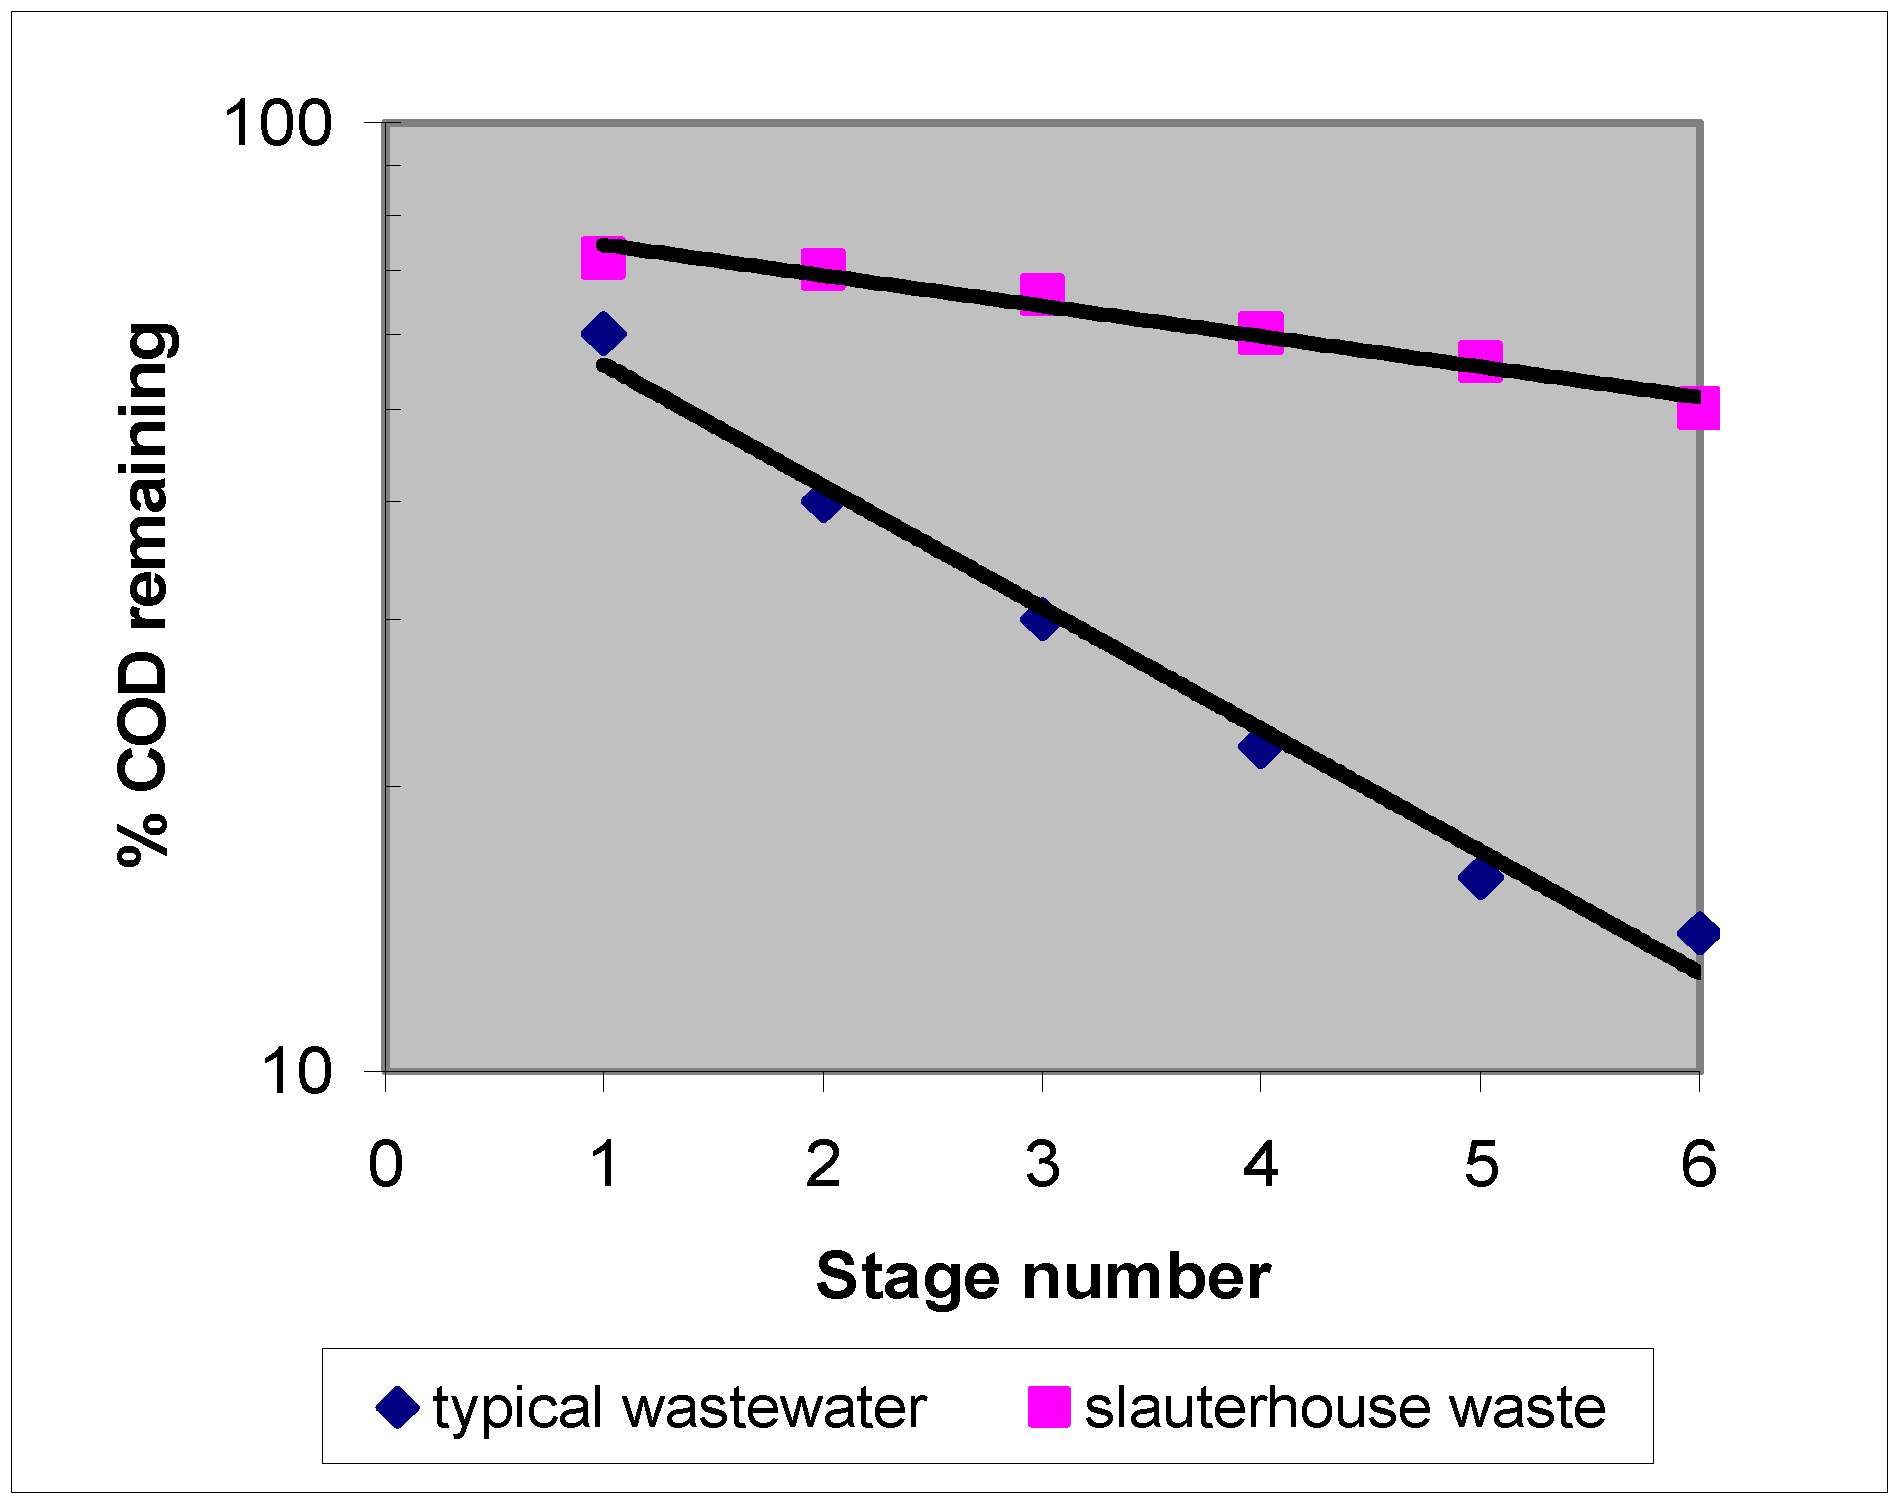
In figure (3), the effect of type of wastewater on performance of the rotating biological contactors is studied, so the percent of COD remaining for two kinds wastewater which have parallel concentration was drawn at each stage of the system. As shown in the figure, there is a clear difference in slope of the curves for each type of wastewaters. Since all circumstances are concurrence then the conclusion is: the type of wastewater has a notable affect on removing efficiency of the system. Similar results also noted by other authors [1, 23, 24, 32].
Figure 3.
Percent COD remaining per stage at a constant flow rate, concentration and, rotation velocity. [33]
Figure 3.
Percent COD remaining per stage at a constant flow rate, concentration and, rotation velocity. [33]

Effect of Hydraulic Loading
When rotating biological contactor systems were originally introduced, the process design was based on hydraulic loading expressed in (L/m2.d) to achieve required removals. Figure (4) and Figure (5) show the relationship between percent COD remaining and the stage number for two types of wastewater, typical municipal and synthetic wastewater, at a selected range of flow rates. As shown in the figures, increasing flow rate at a constant substrate concentration also leads to decrease the removal efficiency of the system.
However, from figures (1), figures (2), figures (3), figures (4) and figures (5), we can conclude that, increasing each of flow rates and substrate concentration can lead to decrease the capability of the system to remove organic substrate; in addition, the type of wastewater has also an effect on the performance of the system.
Figure 4.
Percent COD remaining per stage for synthetic wastewater at constant concentration, and varying flow rates. [31]
Figure 4.
Percent COD remaining per stage for synthetic wastewater at constant concentration, and varying flow rates. [31]
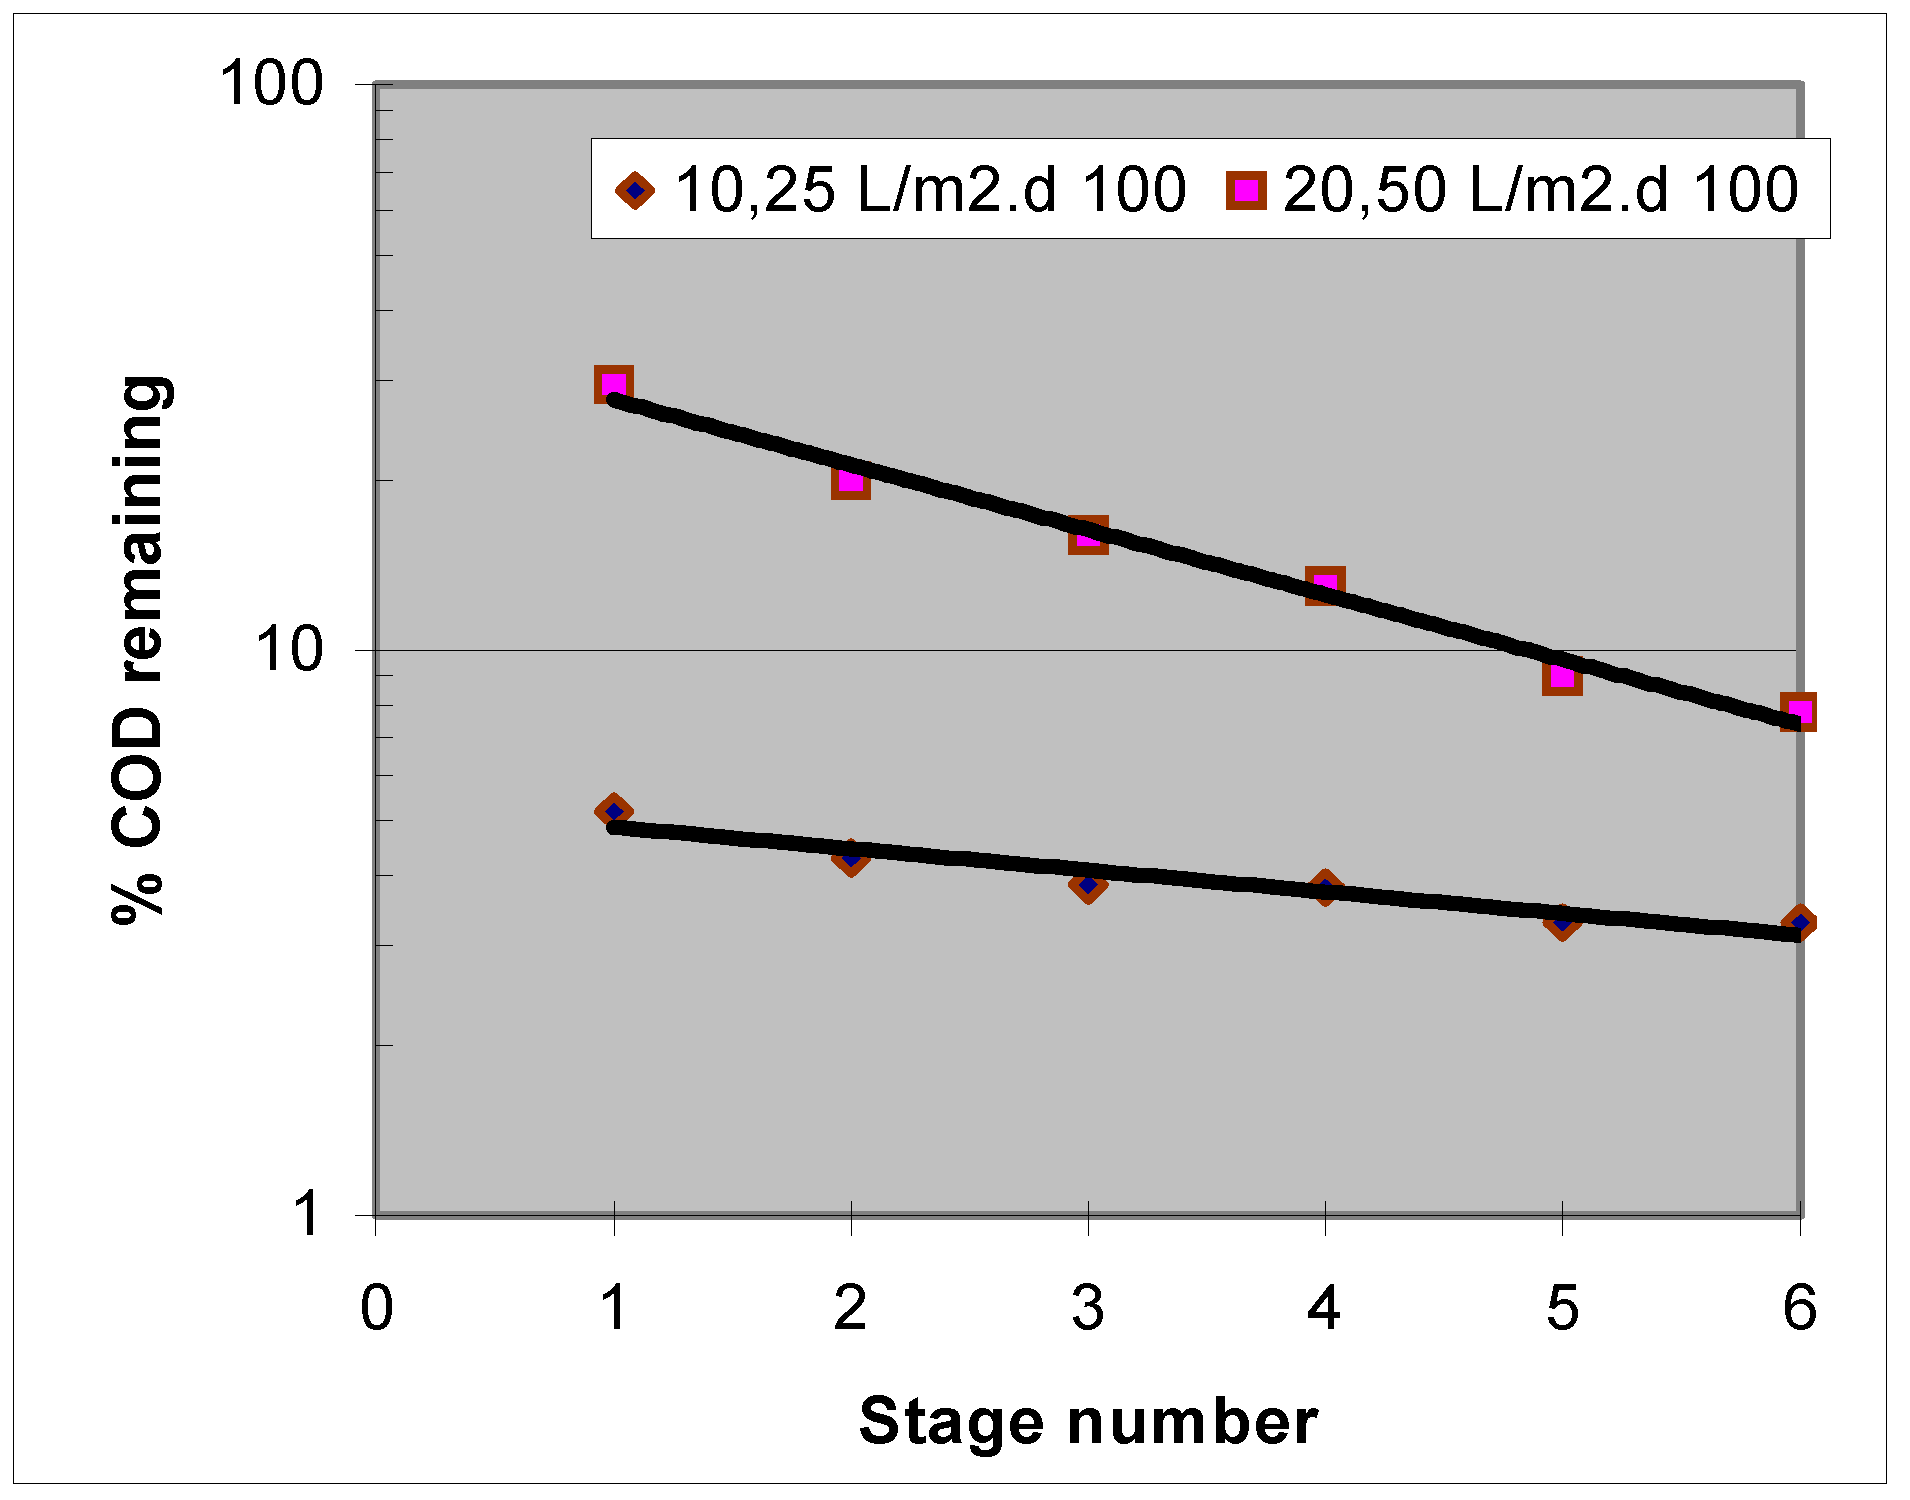
Figure 5.
Percent COD remaining per stage for typical municipal wastewater at constant concentration, and varying flow rates [31]
Figure 5.
Percent COD remaining per stage for typical municipal wastewater at constant concentration, and varying flow rates [31]

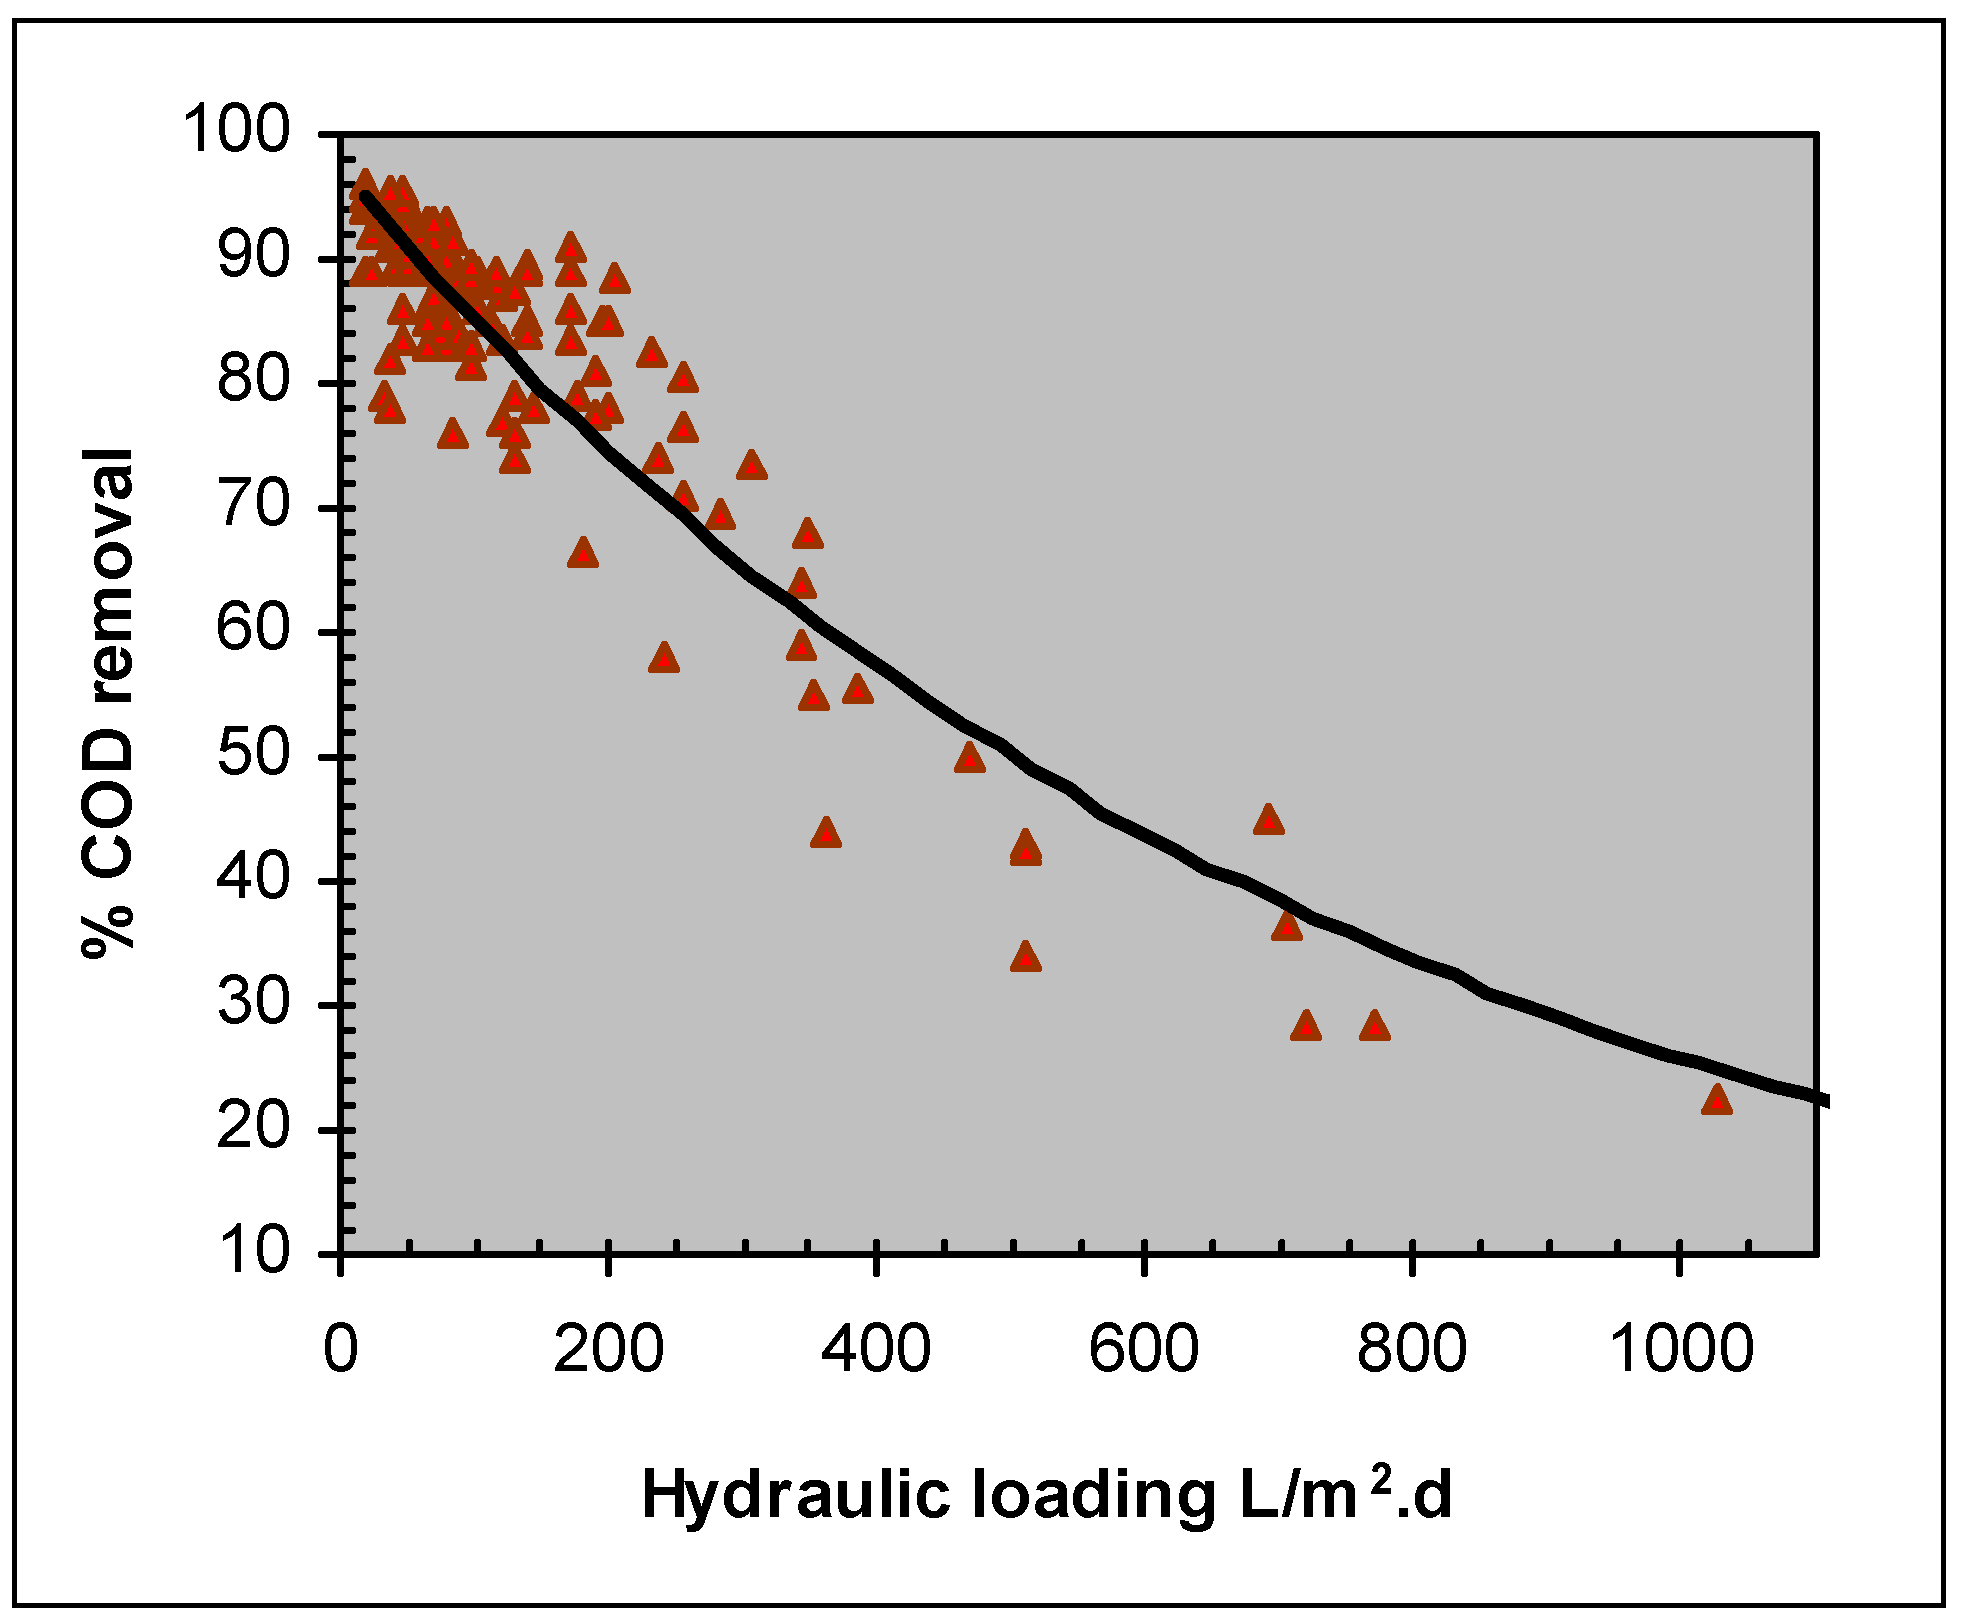
In figure (6), the percent removals of COD were represented against the hydraulic loadings as a direct relationship. As noted, there is a strong correlation between these two parameters. Increasing hydraulic loadings scientifically decrease the performance efficiency of the rotating biological contactor systems.
Figure 6.
Effect of hydraulic loading on % COD removal.

The exponentional form of equation is proved efficient for describing the relationship between these two parameters. This equation can be written as:
where,
Sr = 97.182 e –0.0013 (Lx)…….………………..….
- Lx is the hydraulic loading applied in terms of (L/m2.d) and,
- Sr is the percent of organic removal in terms ofCOD.
Equation (1) has a strong correlation factor (R2) which was equal to 92.1%.
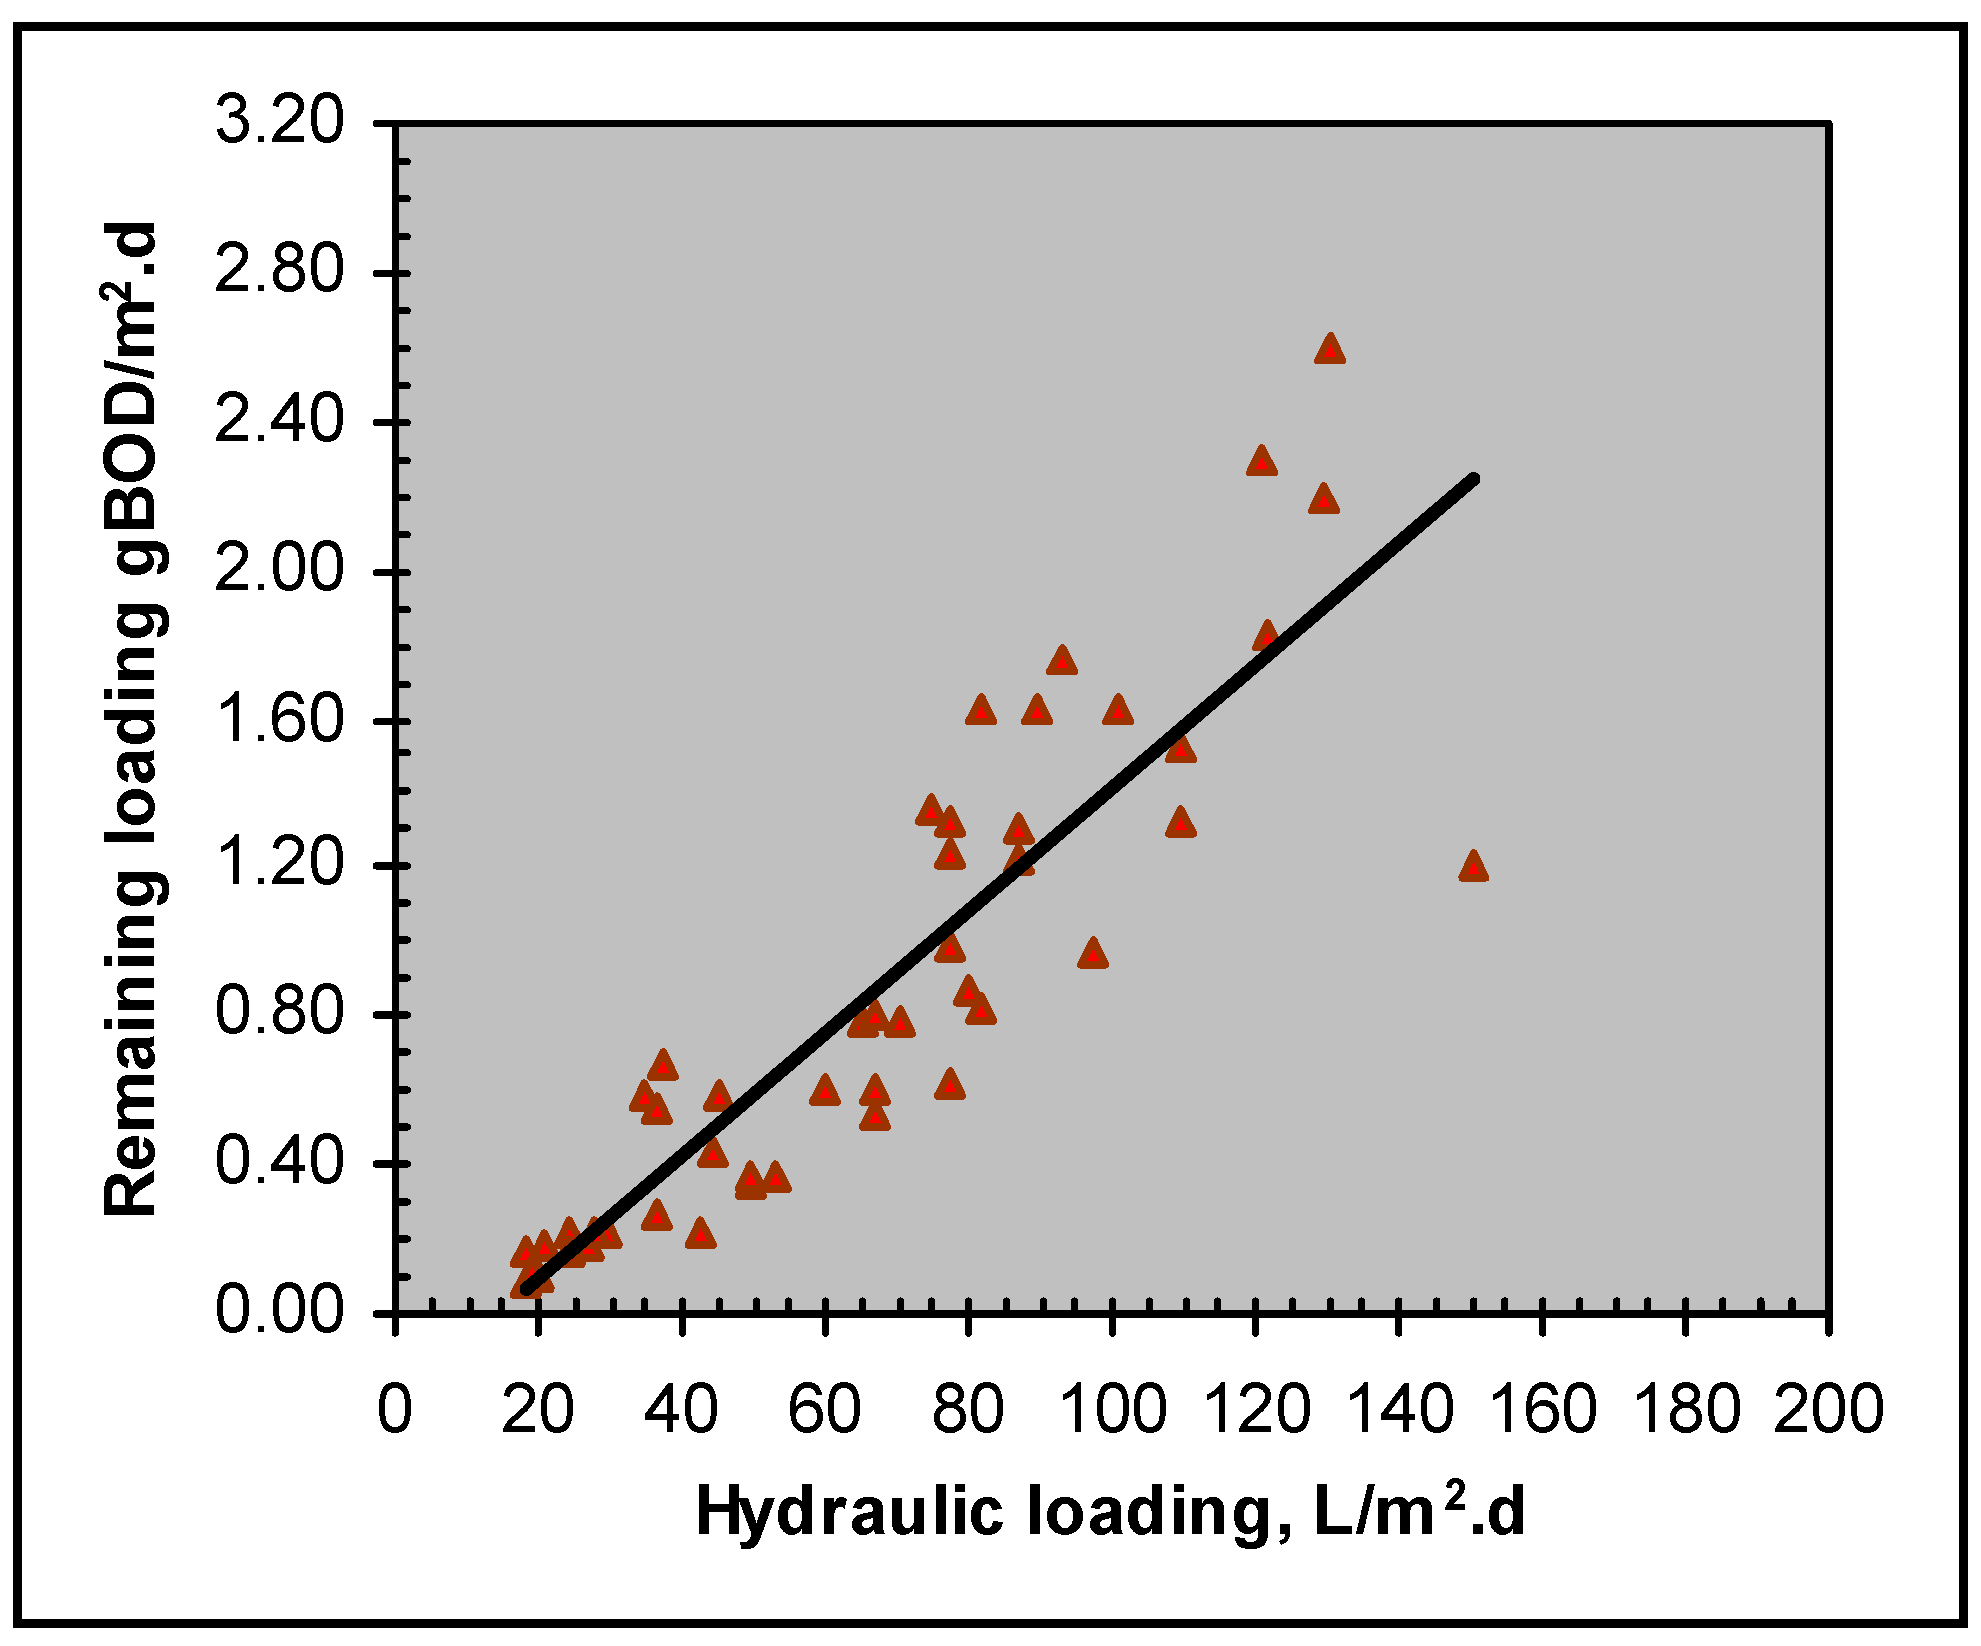
In figure (7), the effect of hydraulic loading was represented against the remaining organic loading in terms of (gBOD/m2.d). As shown in the figure, increasing hydraulic loading increase the amount of organic loading remaining, which consequently decrease the efficiency of the system. The equation, which controls the relationship between these two parameters, is:
Where,
Ne = 0.0167 Lx – 0.2334………………….…
- Ne is the organic loading remaining in terms of (gBOD /m2.d)
In fact, the parameter (hydraulic loading) is directly joints with the concept of contact or detention time. High hydraulic load combined with low organic concentrations in the wastewater can be treated satisfactorily as long as the sufficient hydraulic detention time is available [1,12].
Conversely, a highly concentrated wastewater at a very low hydraulic load still requires adequate time for satisfactory treatment. At a constant flow rate, increasing organic concentrations causes increasing in the total amount of organic loading applied to the rotating contactor system. Likewise, at a constant organic concentration, increasing flow rates can cause increasing in the total amount of organics applied to the system.
Figure 7.
Effect of hydraulic loading on remaining BOD in terms of gBOD/m2.d
Since both flow rate and organic concentration exhibit definite relationships with substrate removal rate and efficiency, it can be shown that these two parameters act in combination to affect the substrate removal rate and efficiency. Therefore, hydraulic loading alone does not determine the efficiency of the rotating biological contactor performance correctly.
Effect of Organic Loading
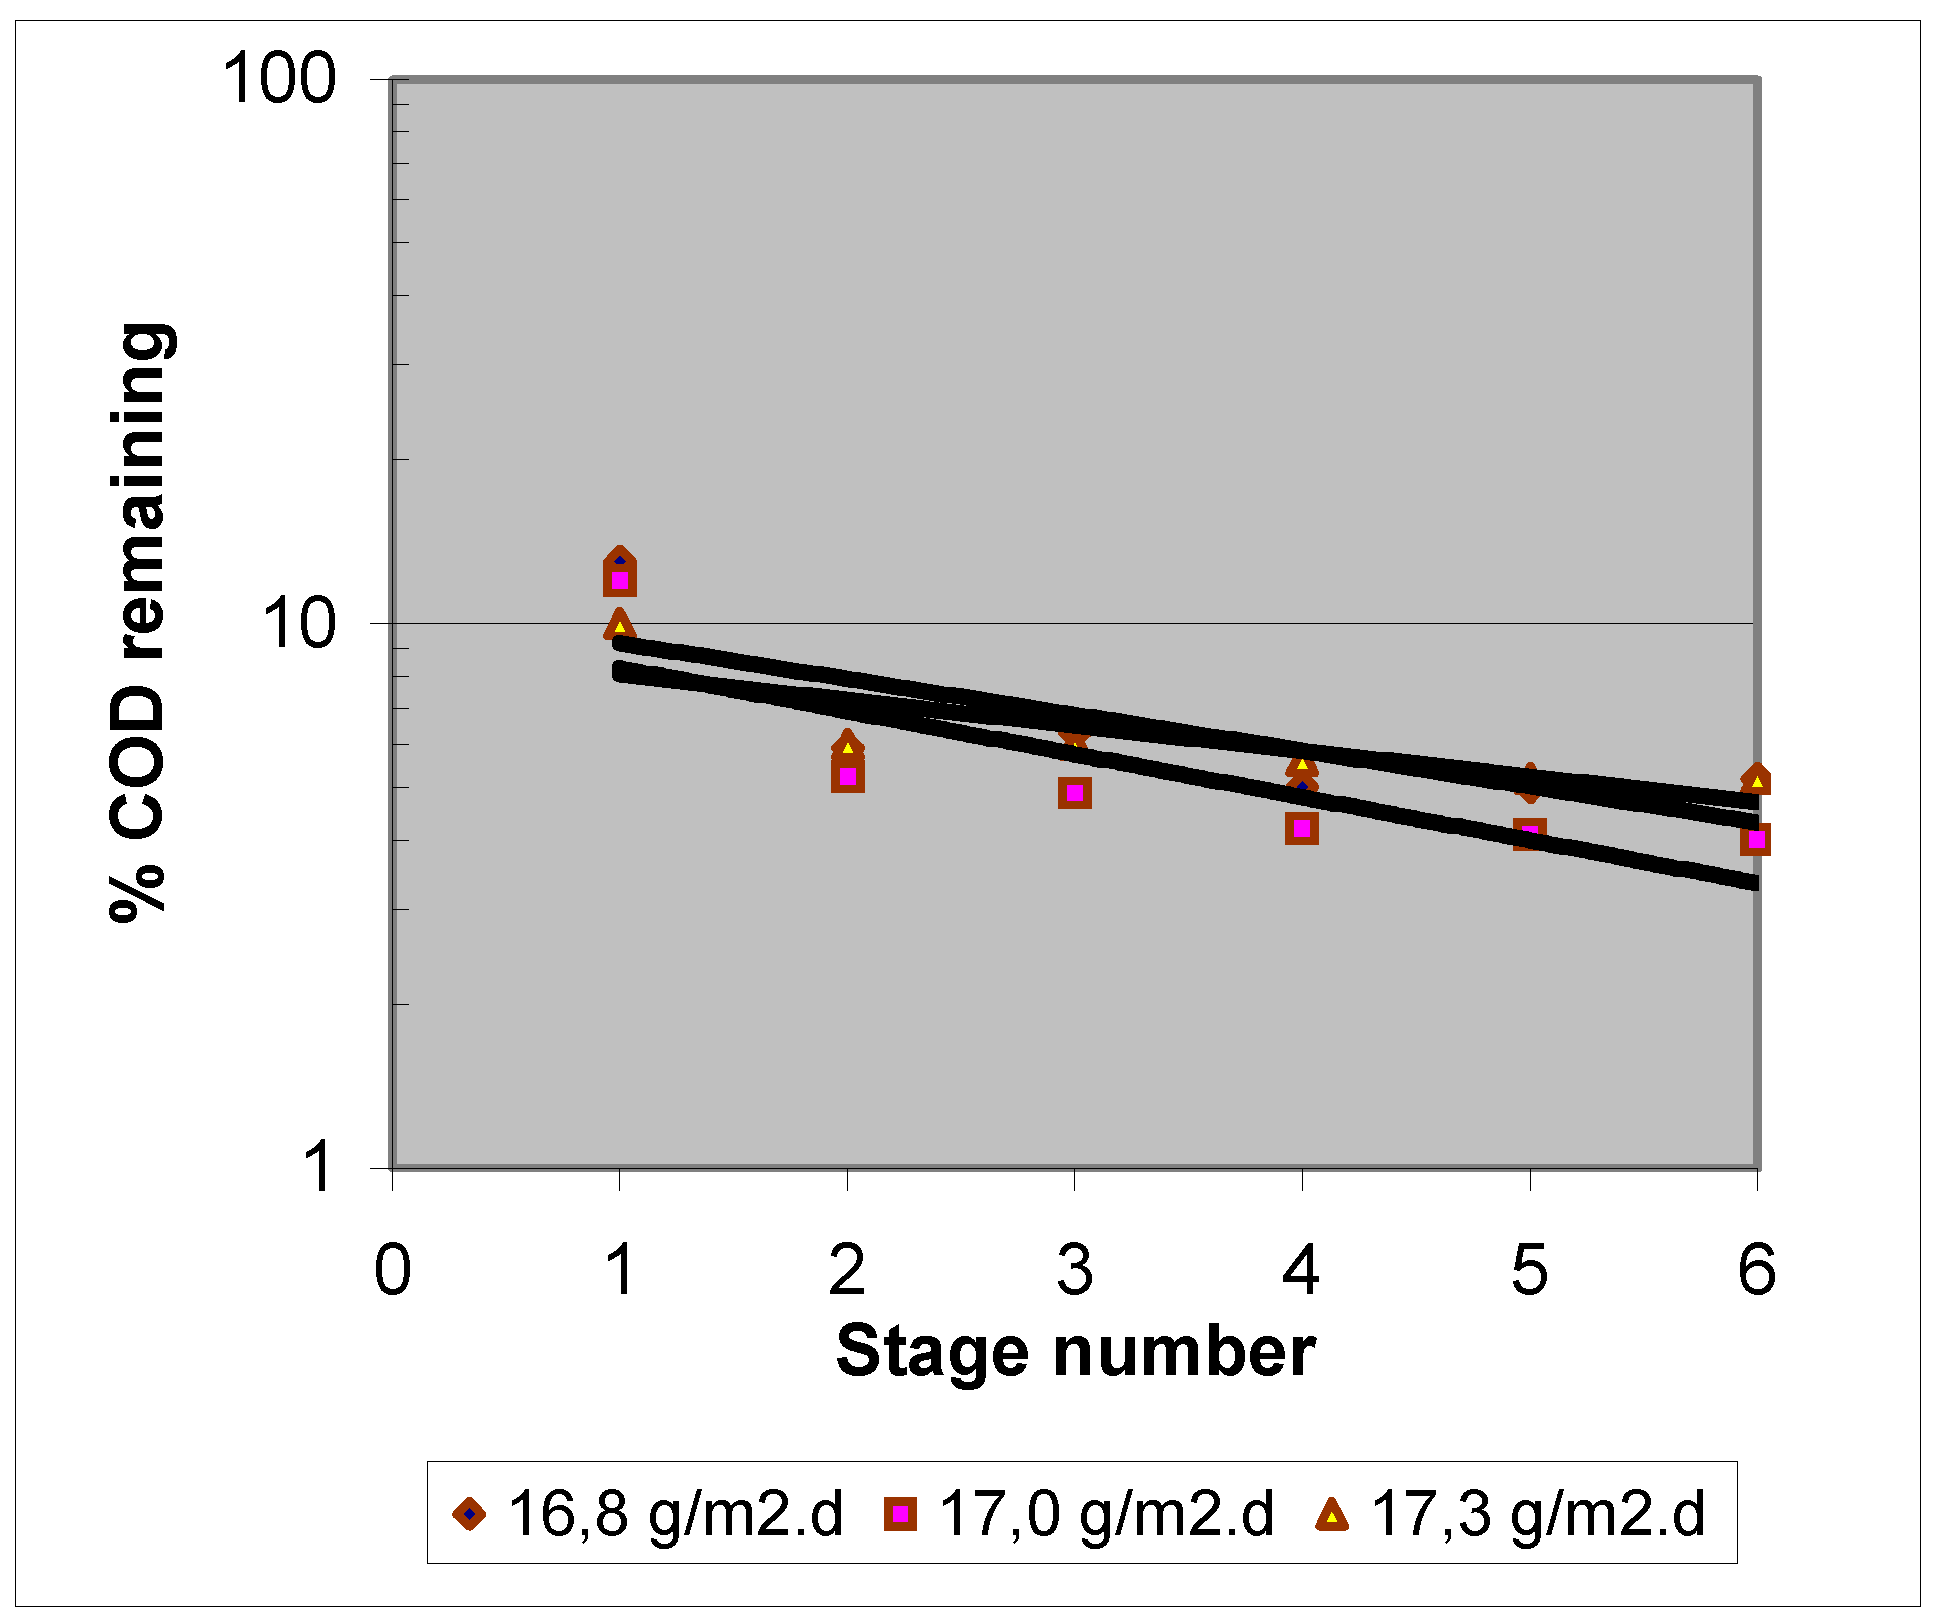
In figure (8), the effect of these two parameters, flow rate and organic concentration, acting in combination is represented. The curve is drawn depending on the results of three experiments that carried out at various organic concentrations and flow rates but with approximately similar organic loading (17.0 g/m2.d). As noted, there is no important difference between these plots. However, such results proved that the performance efficiency of rotating biological contactor is mainly dependent on organic loading rather than on the organic concentration or flow rate individually.
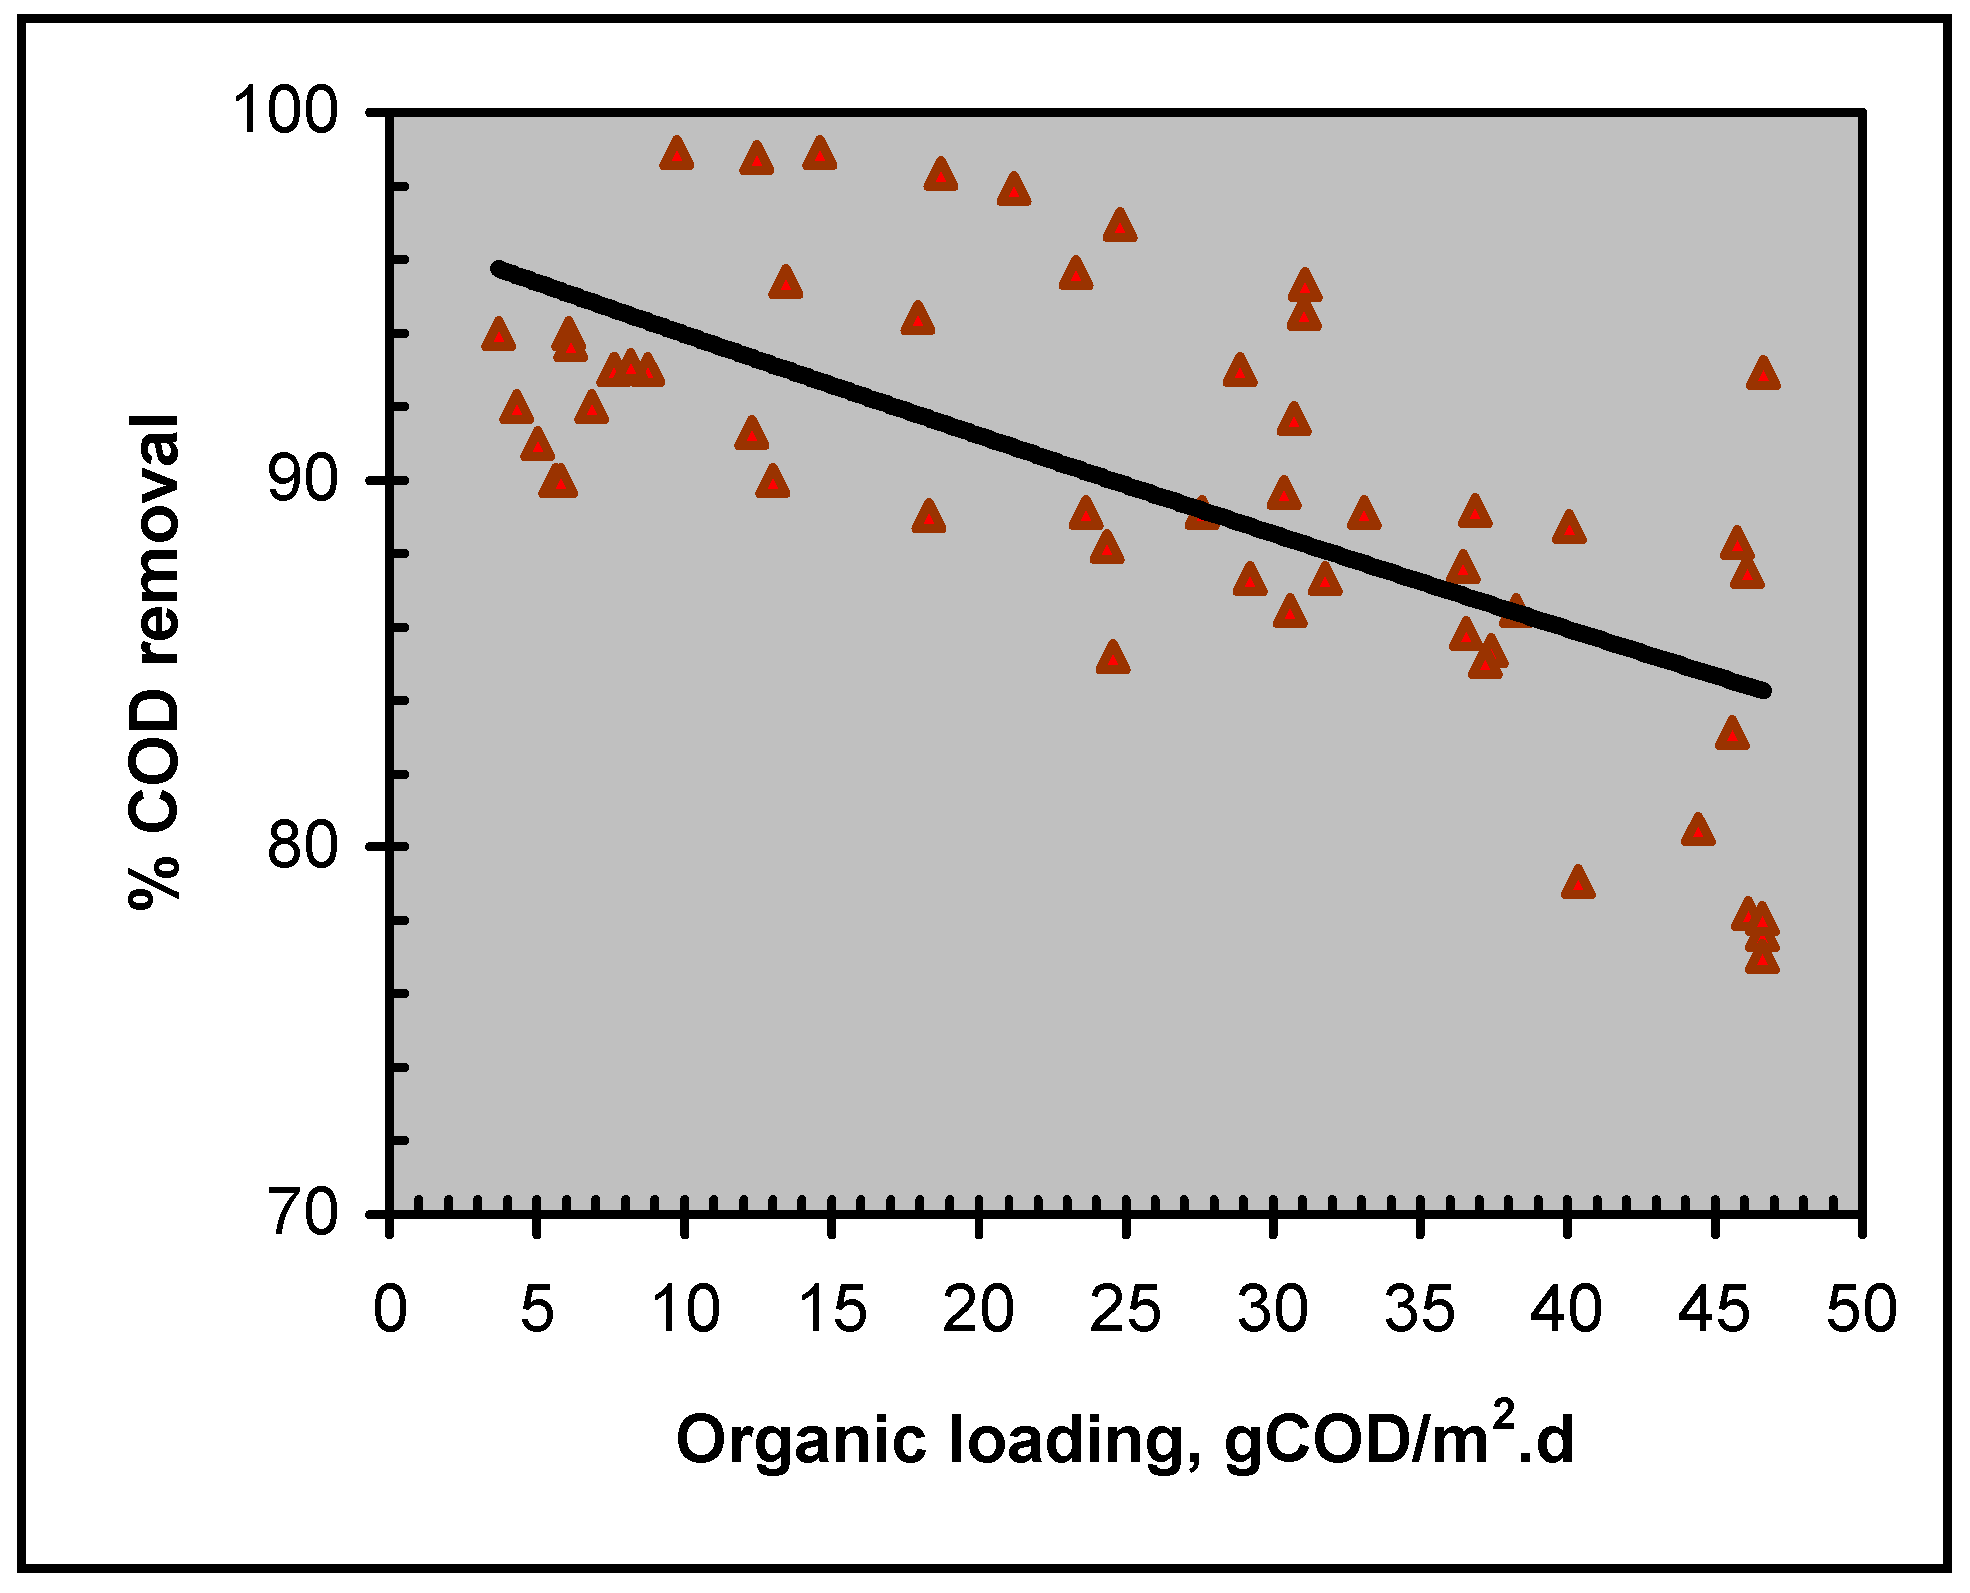
In figures (9), the effect of organic loading on the removal efficiency of the system is represented. As shown in the figure, there is a strong correlation between these two parameters (R2 > 90 %). Increasing organic loading scientifically decrease the removal efficiency of the system. The following equation can be used to describe this relationship:
where,
Sr = 96.58 e –0.0041 (Nx)……………………….
- Sr is the percent removal efficiency of the system in terms of COD.
- Nx is the organic loading applied in terms of gCOD/m2.d
Figure 8.
Percent COD remaining per stage for synthetic wastewater at various organic concentrations and flow rate but with constant organic loadings.
Figure 8.
Percent COD remaining per stage for synthetic wastewater at various organic concentrations and flow rate but with constant organic loadings.

Figure 9.
Effect of organic loading on the COD removal efficiency.
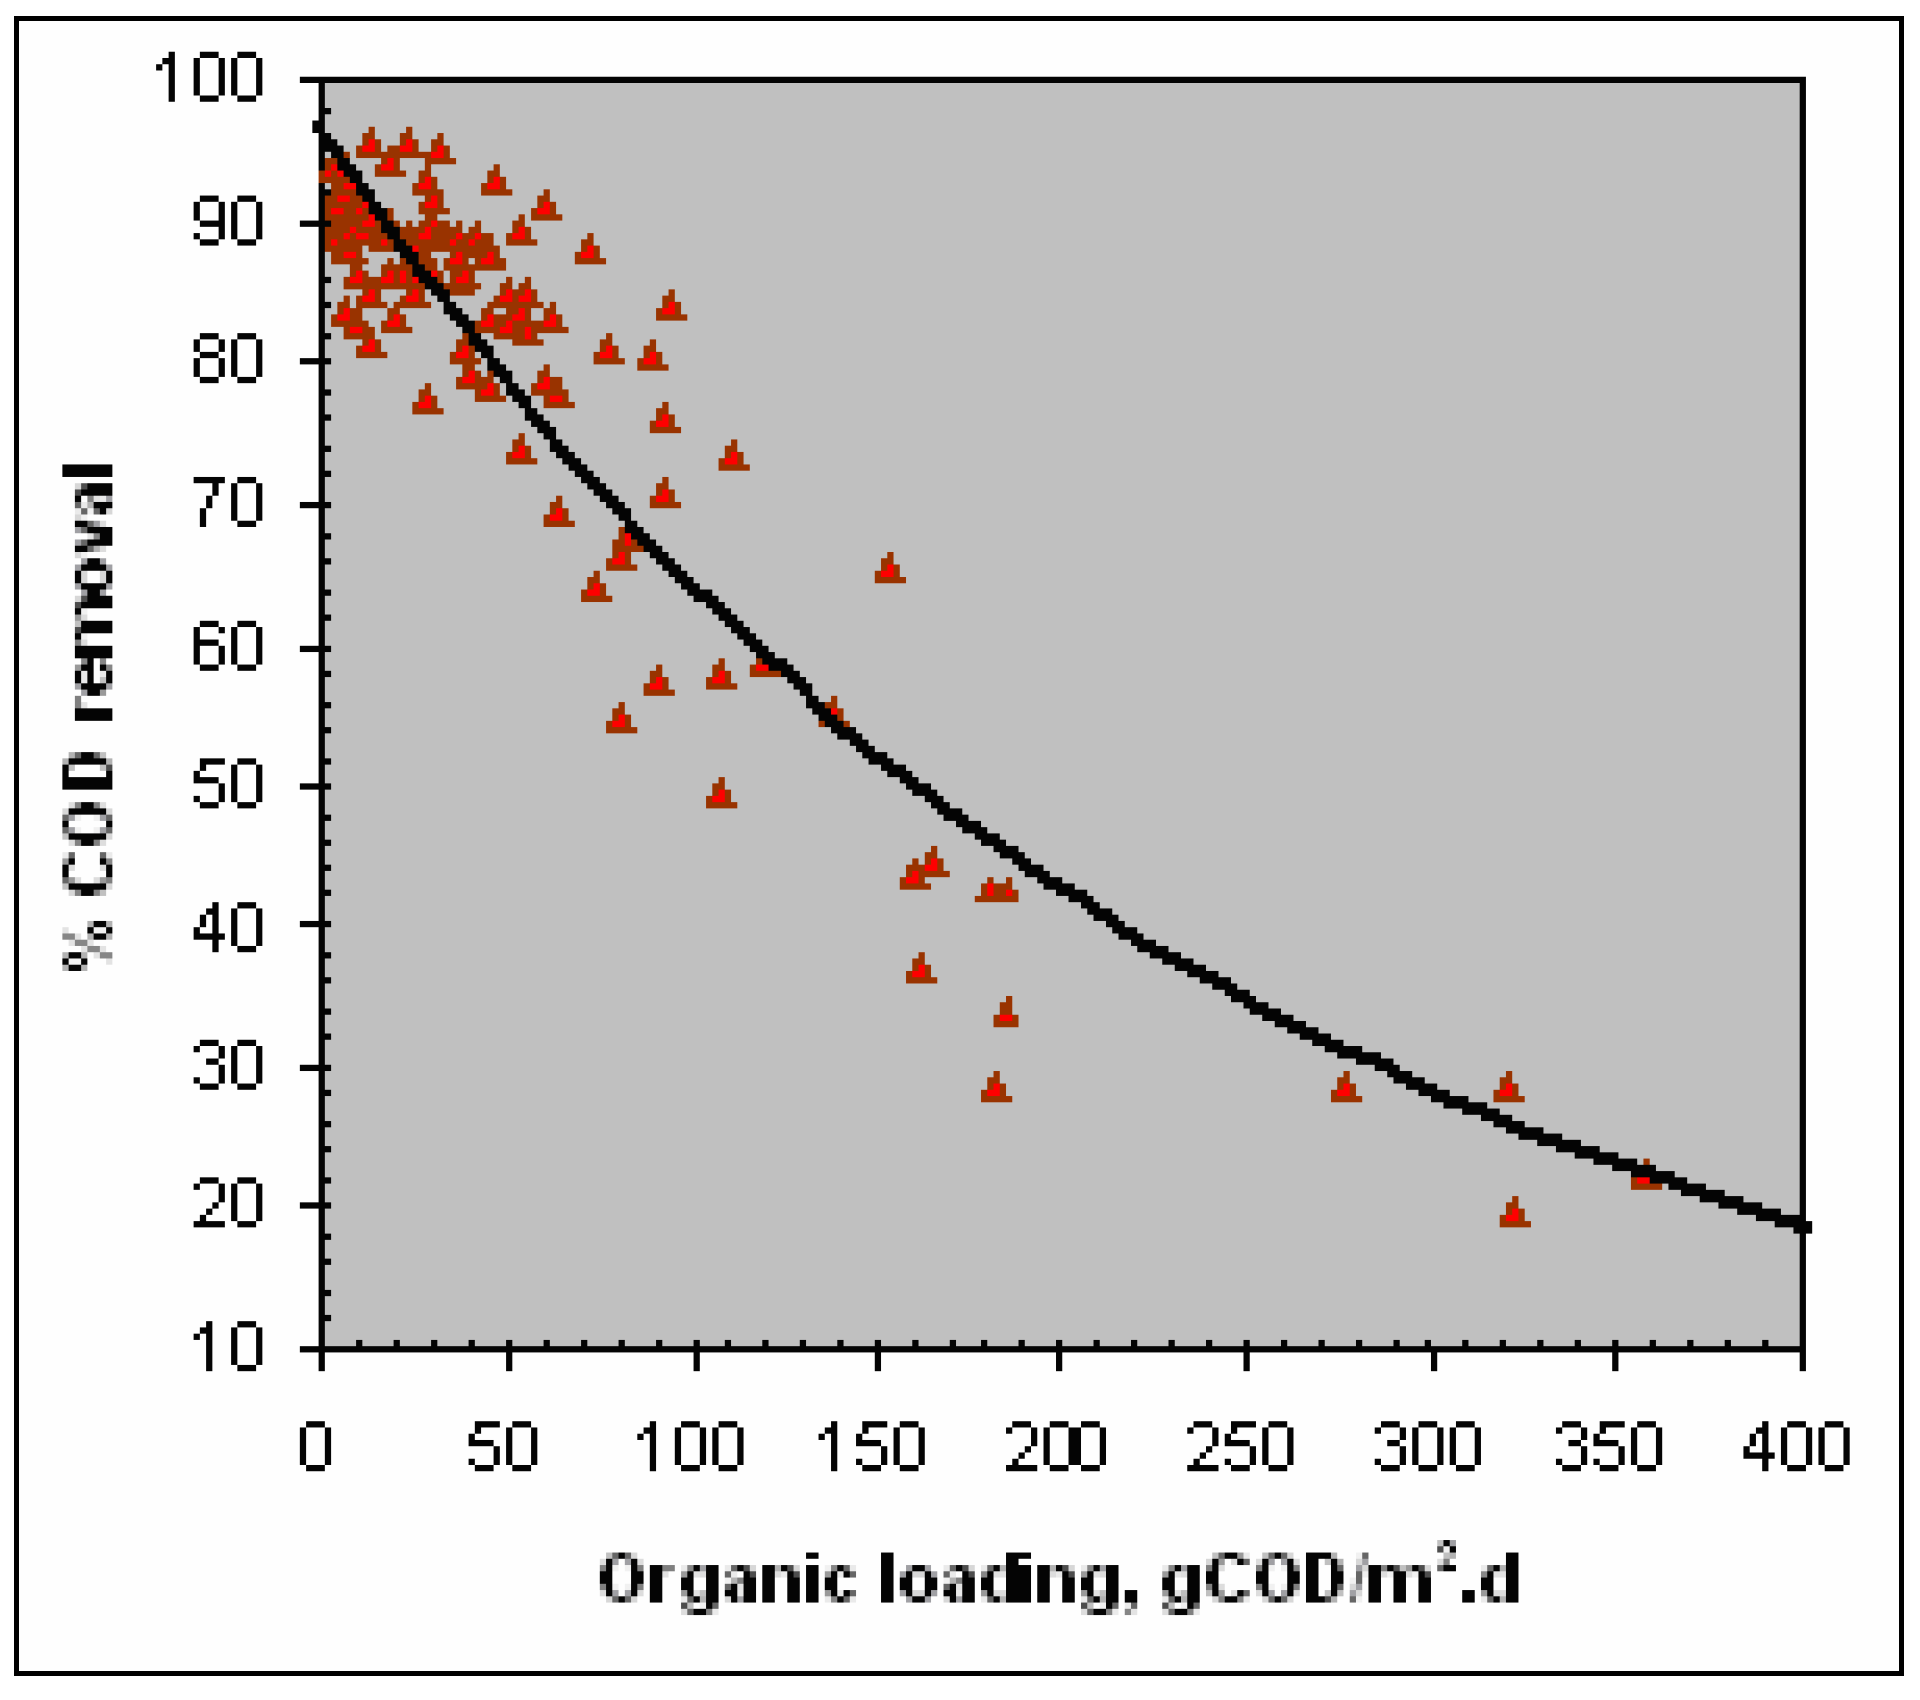
Because the rotating biological contactor systems are usually working at low loading condition (up to 50 gCOD/m2.d) [24], the effect of this range of loading on the removal efficiency is represented in figure (10). The following equation can be used to explain the relationship between these parameters:
Sr = 96.804 e –0.0031(Nx) (for Nx ≤ 50 gCOD/m2.d)..
As noted, both of equations (3) and (4) have approximately similar form. In practical application each of these equations can be used successfully to estimate the removal efficiency of the system. However, for domestic wastewater, when desired to operate the system at removal efficiency up to 85 % the system should be operated at organic loading of not more than 36 CODg/m2.d.
Figure 10.
Effect of organic loading on the COD removal efficiency under loading ≤ 50 g COD/m2.d.

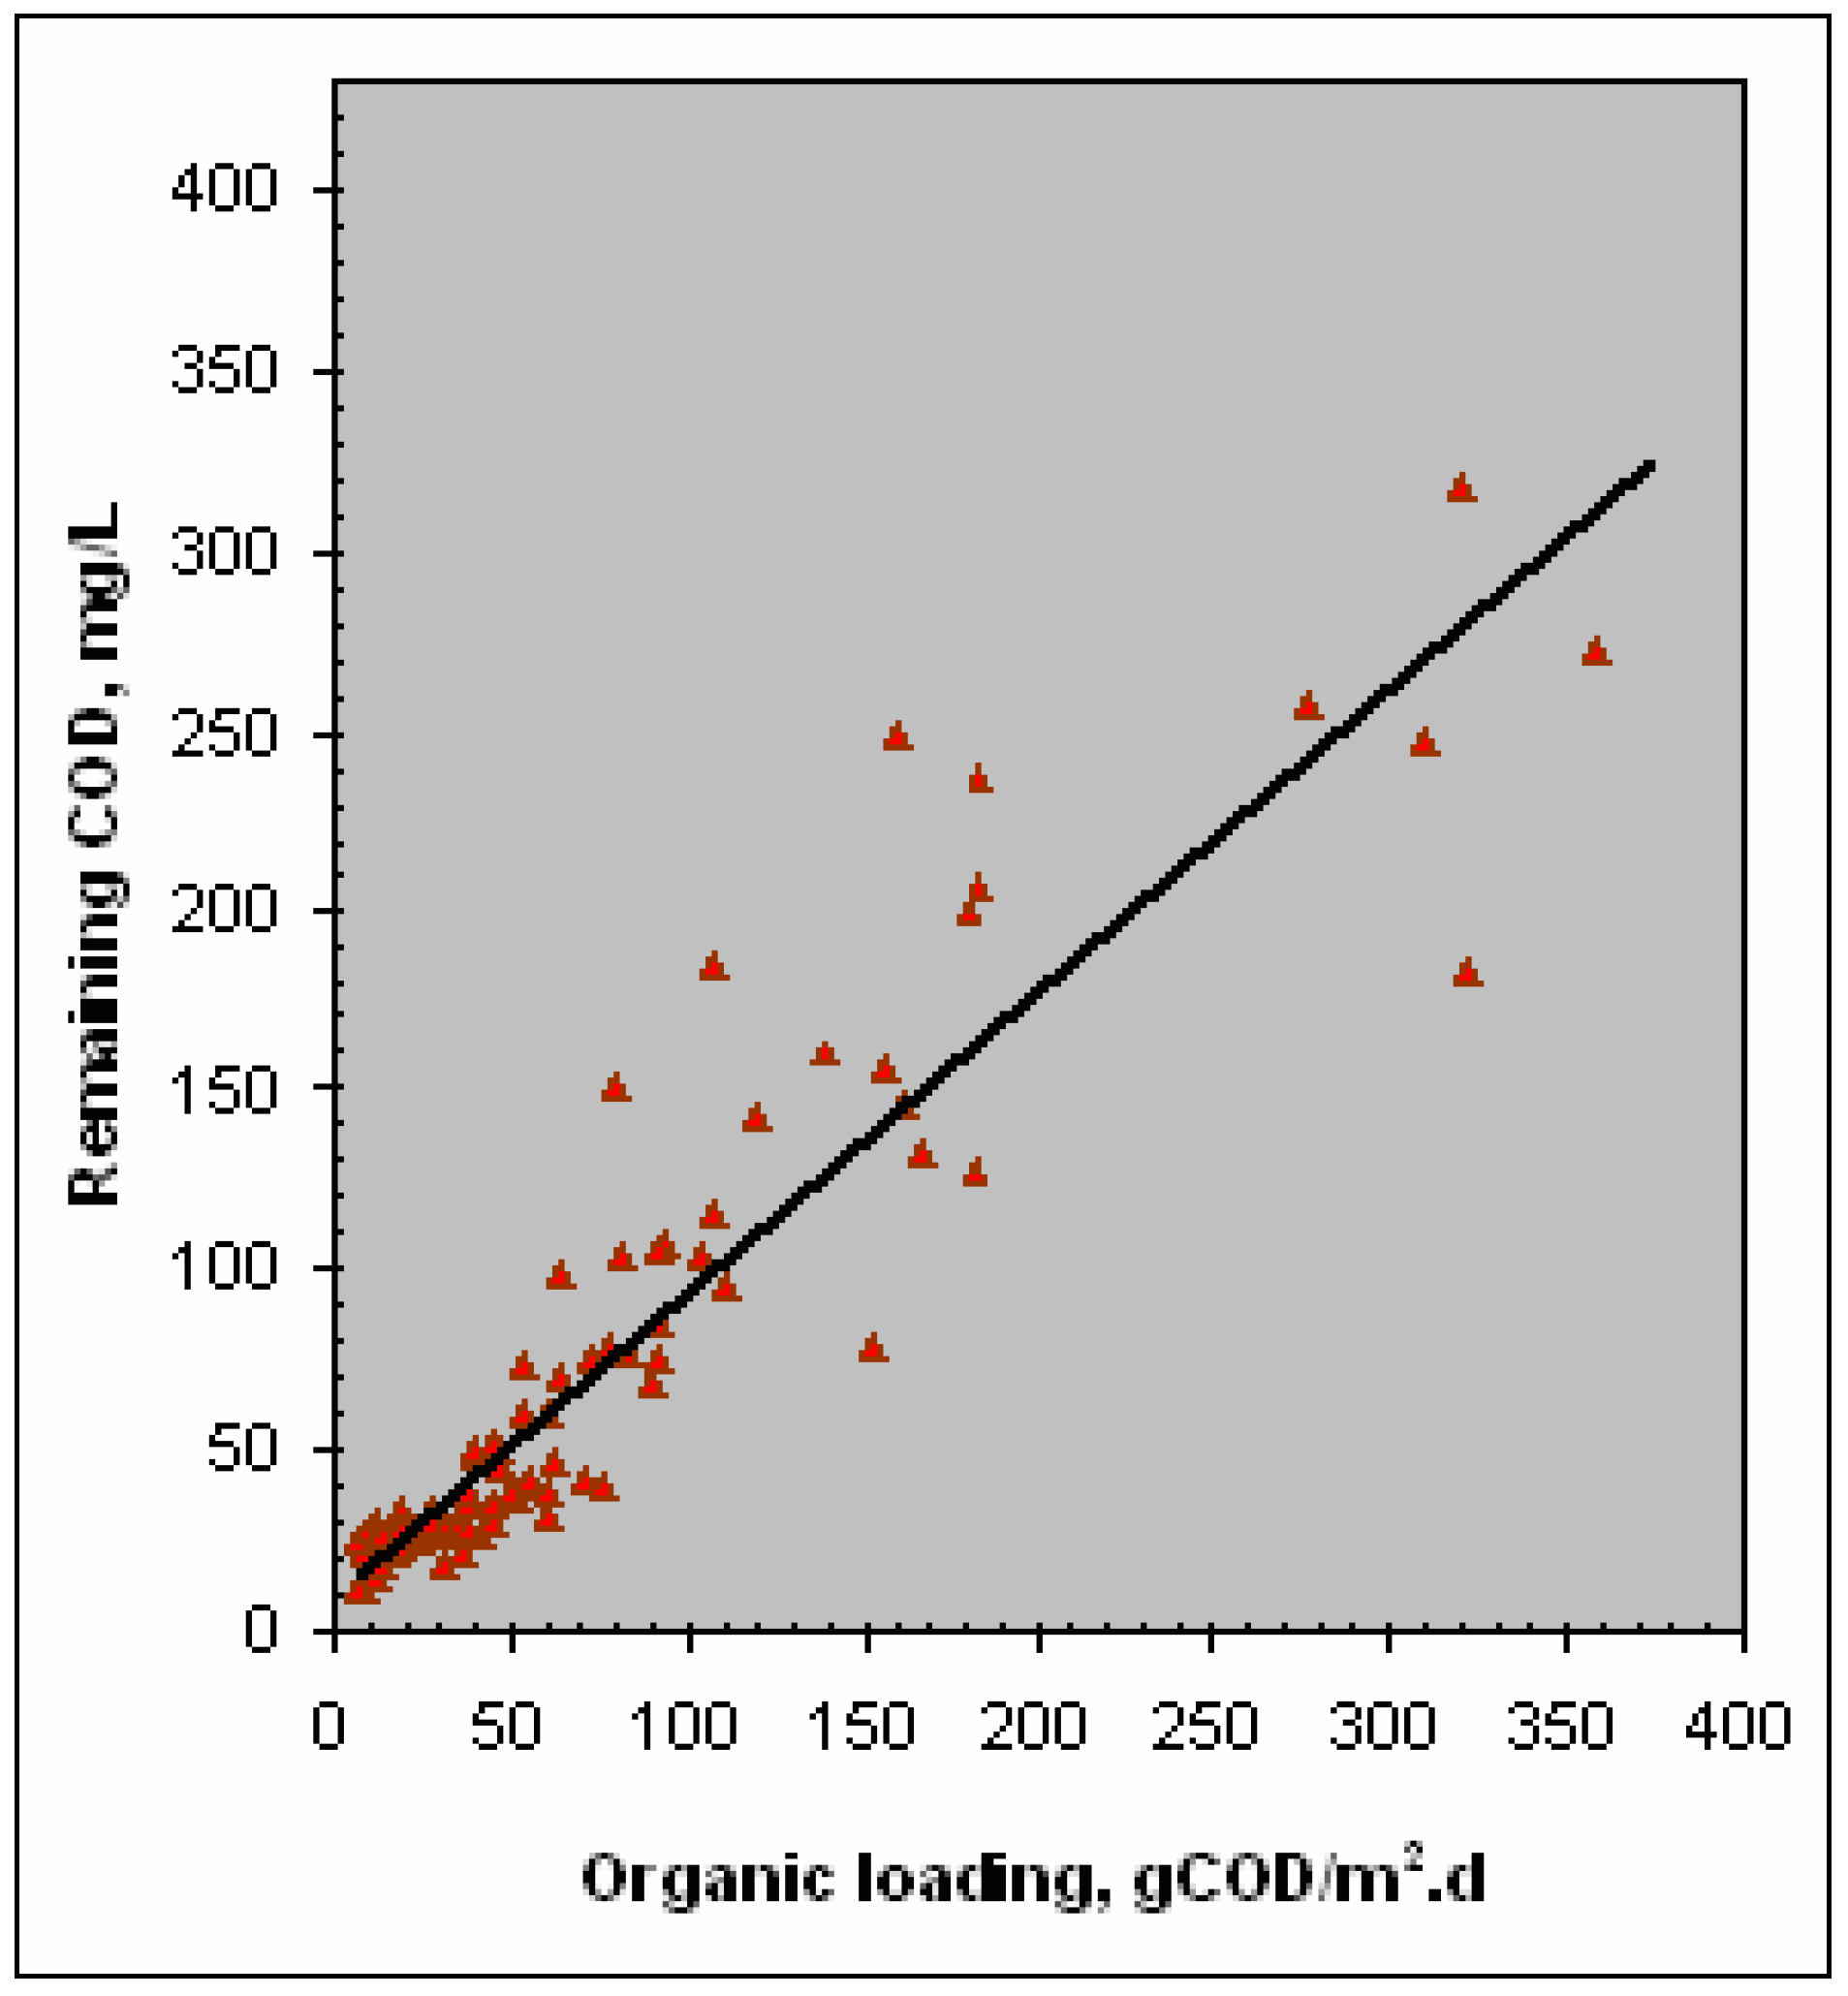
In figure (11) and figure (12), the effluent concentrations from the system are drawn as a function of organic loading also at high and low levels of loading respectively. As noted in these figures, increasing organic loadings increase the amount of remaining COD in effluent. A simple form of equation is proved to be efficient to describe this correlation (R2 > 85 %).
Se = 0.84 Nx + 9.9 …………………………………....
Se = 0.78 Nx + 9.6 (for Nx < 100 gCOD/m2.d).…...
- Se is the concentration of organic substrate remaining in effluent from the system organic in terms of COD, (mg/l).
Figure 11.
Effect of organic loading on the remaining COD (organic loading up to 400 g COD/m2.d).

Figure 12.
Effect of organic loading on the remaining COD (organic loading up to 100 g COD/m2.d).

For the design purpose, equations (5) and (6) can be used to calculate the maximum load, which can be applied on the system to achieve the desired effluent quality. From figure (12), the system should be operated at a loading rate not more than 65 gCOD/m2.d to achieve an effluent quality of about 60 mg COD/L.
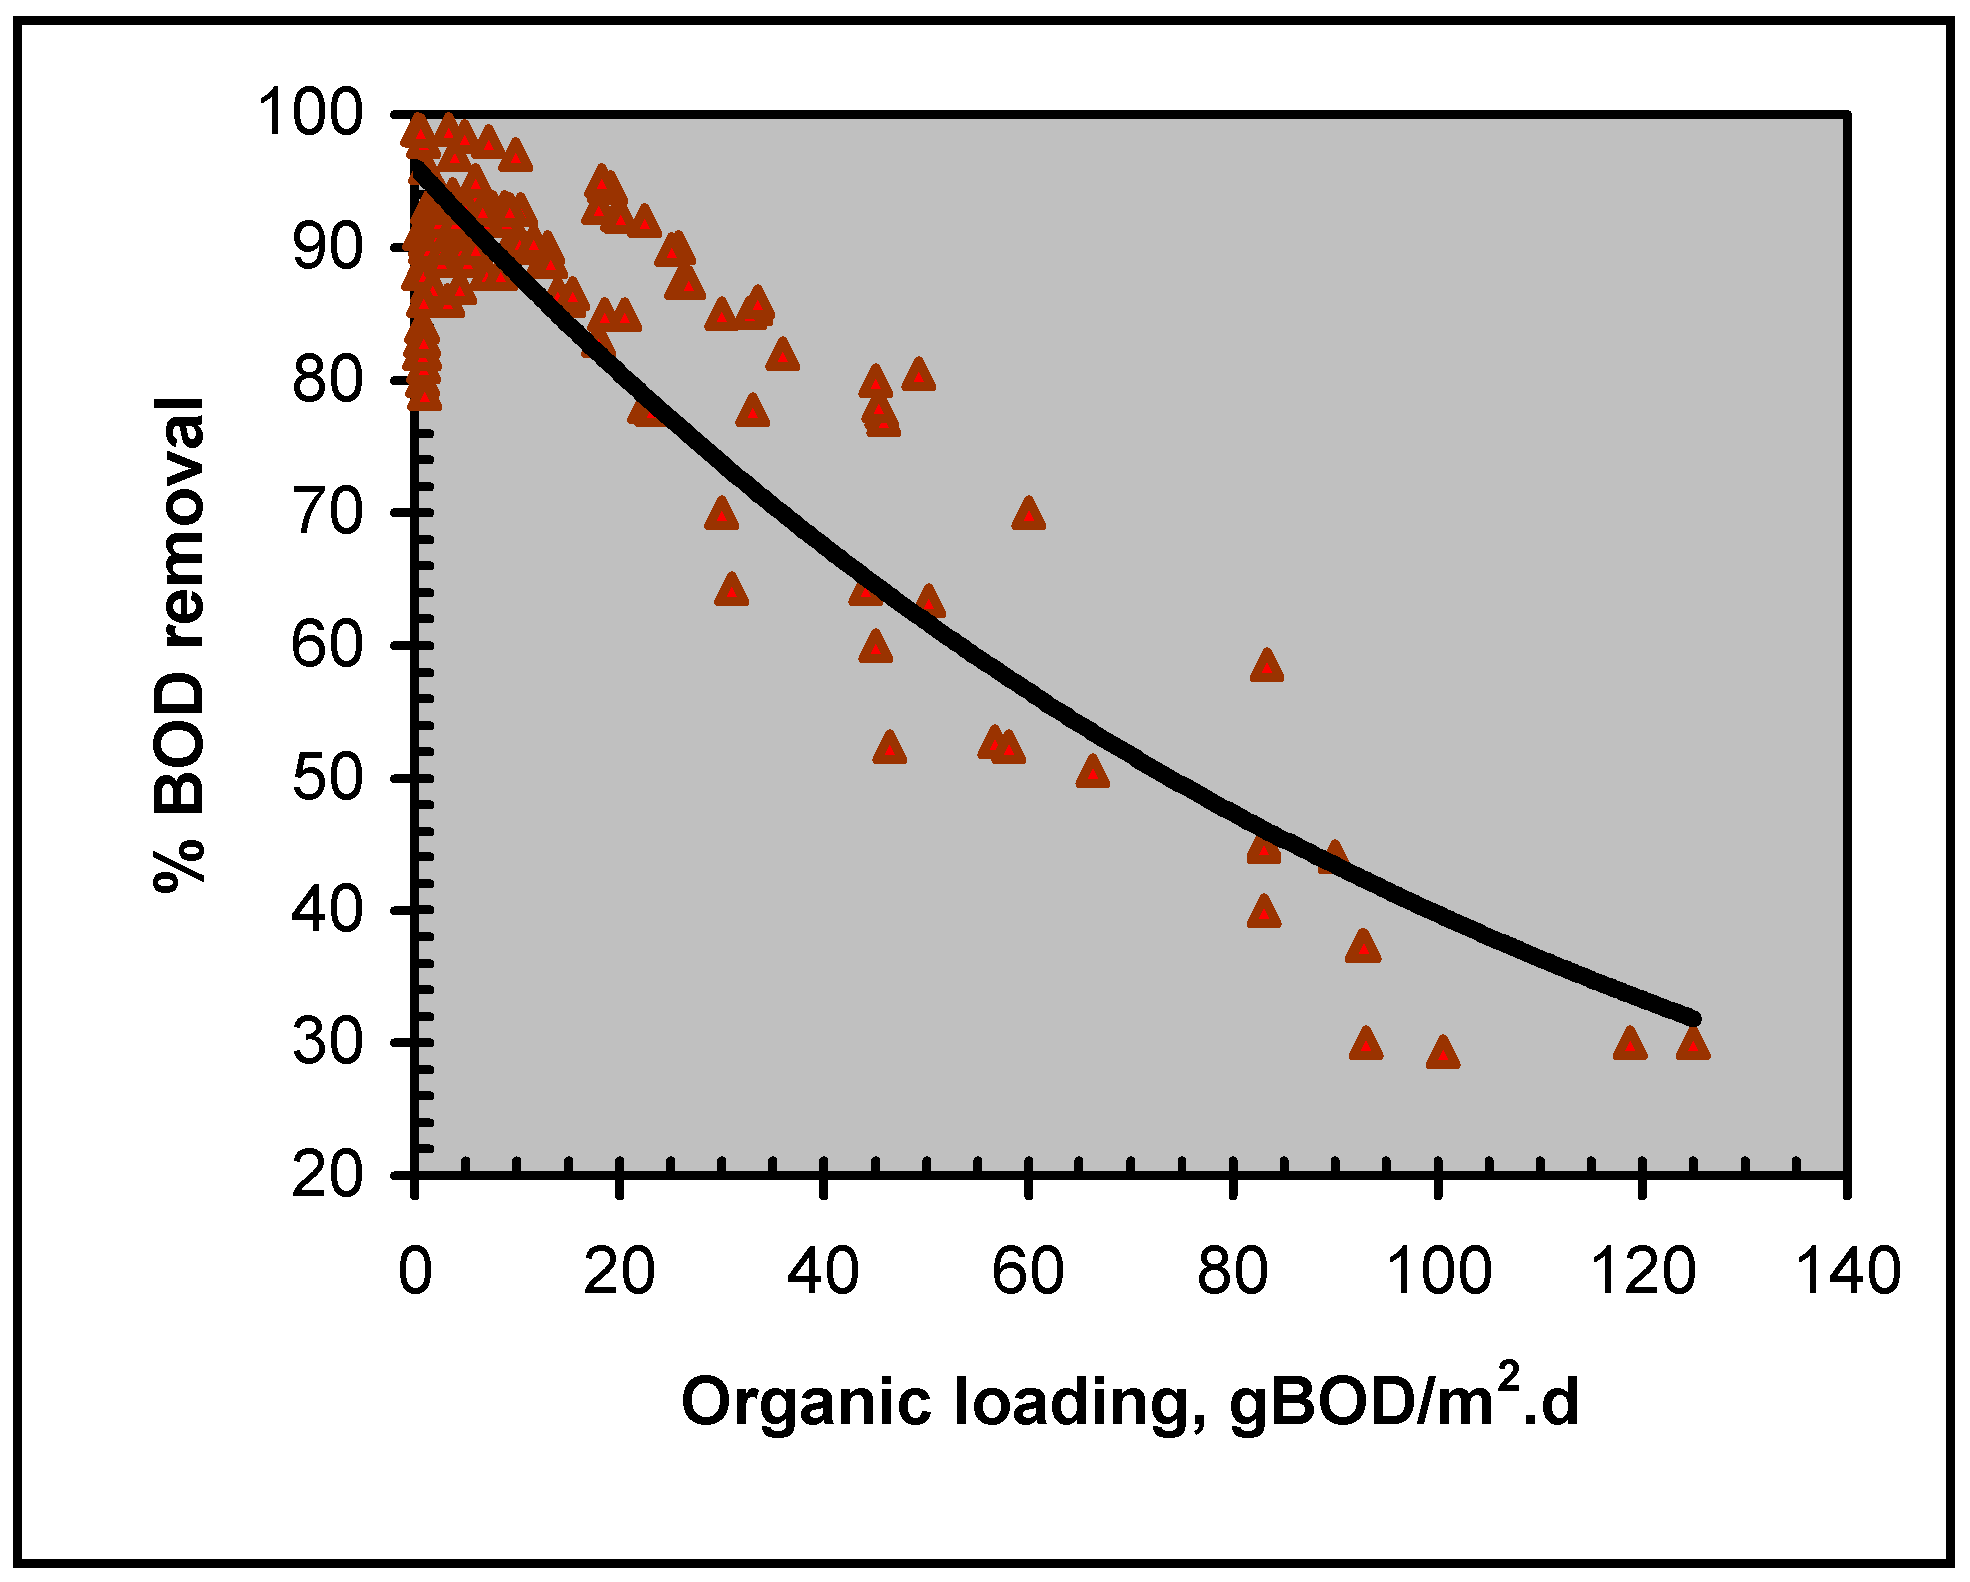
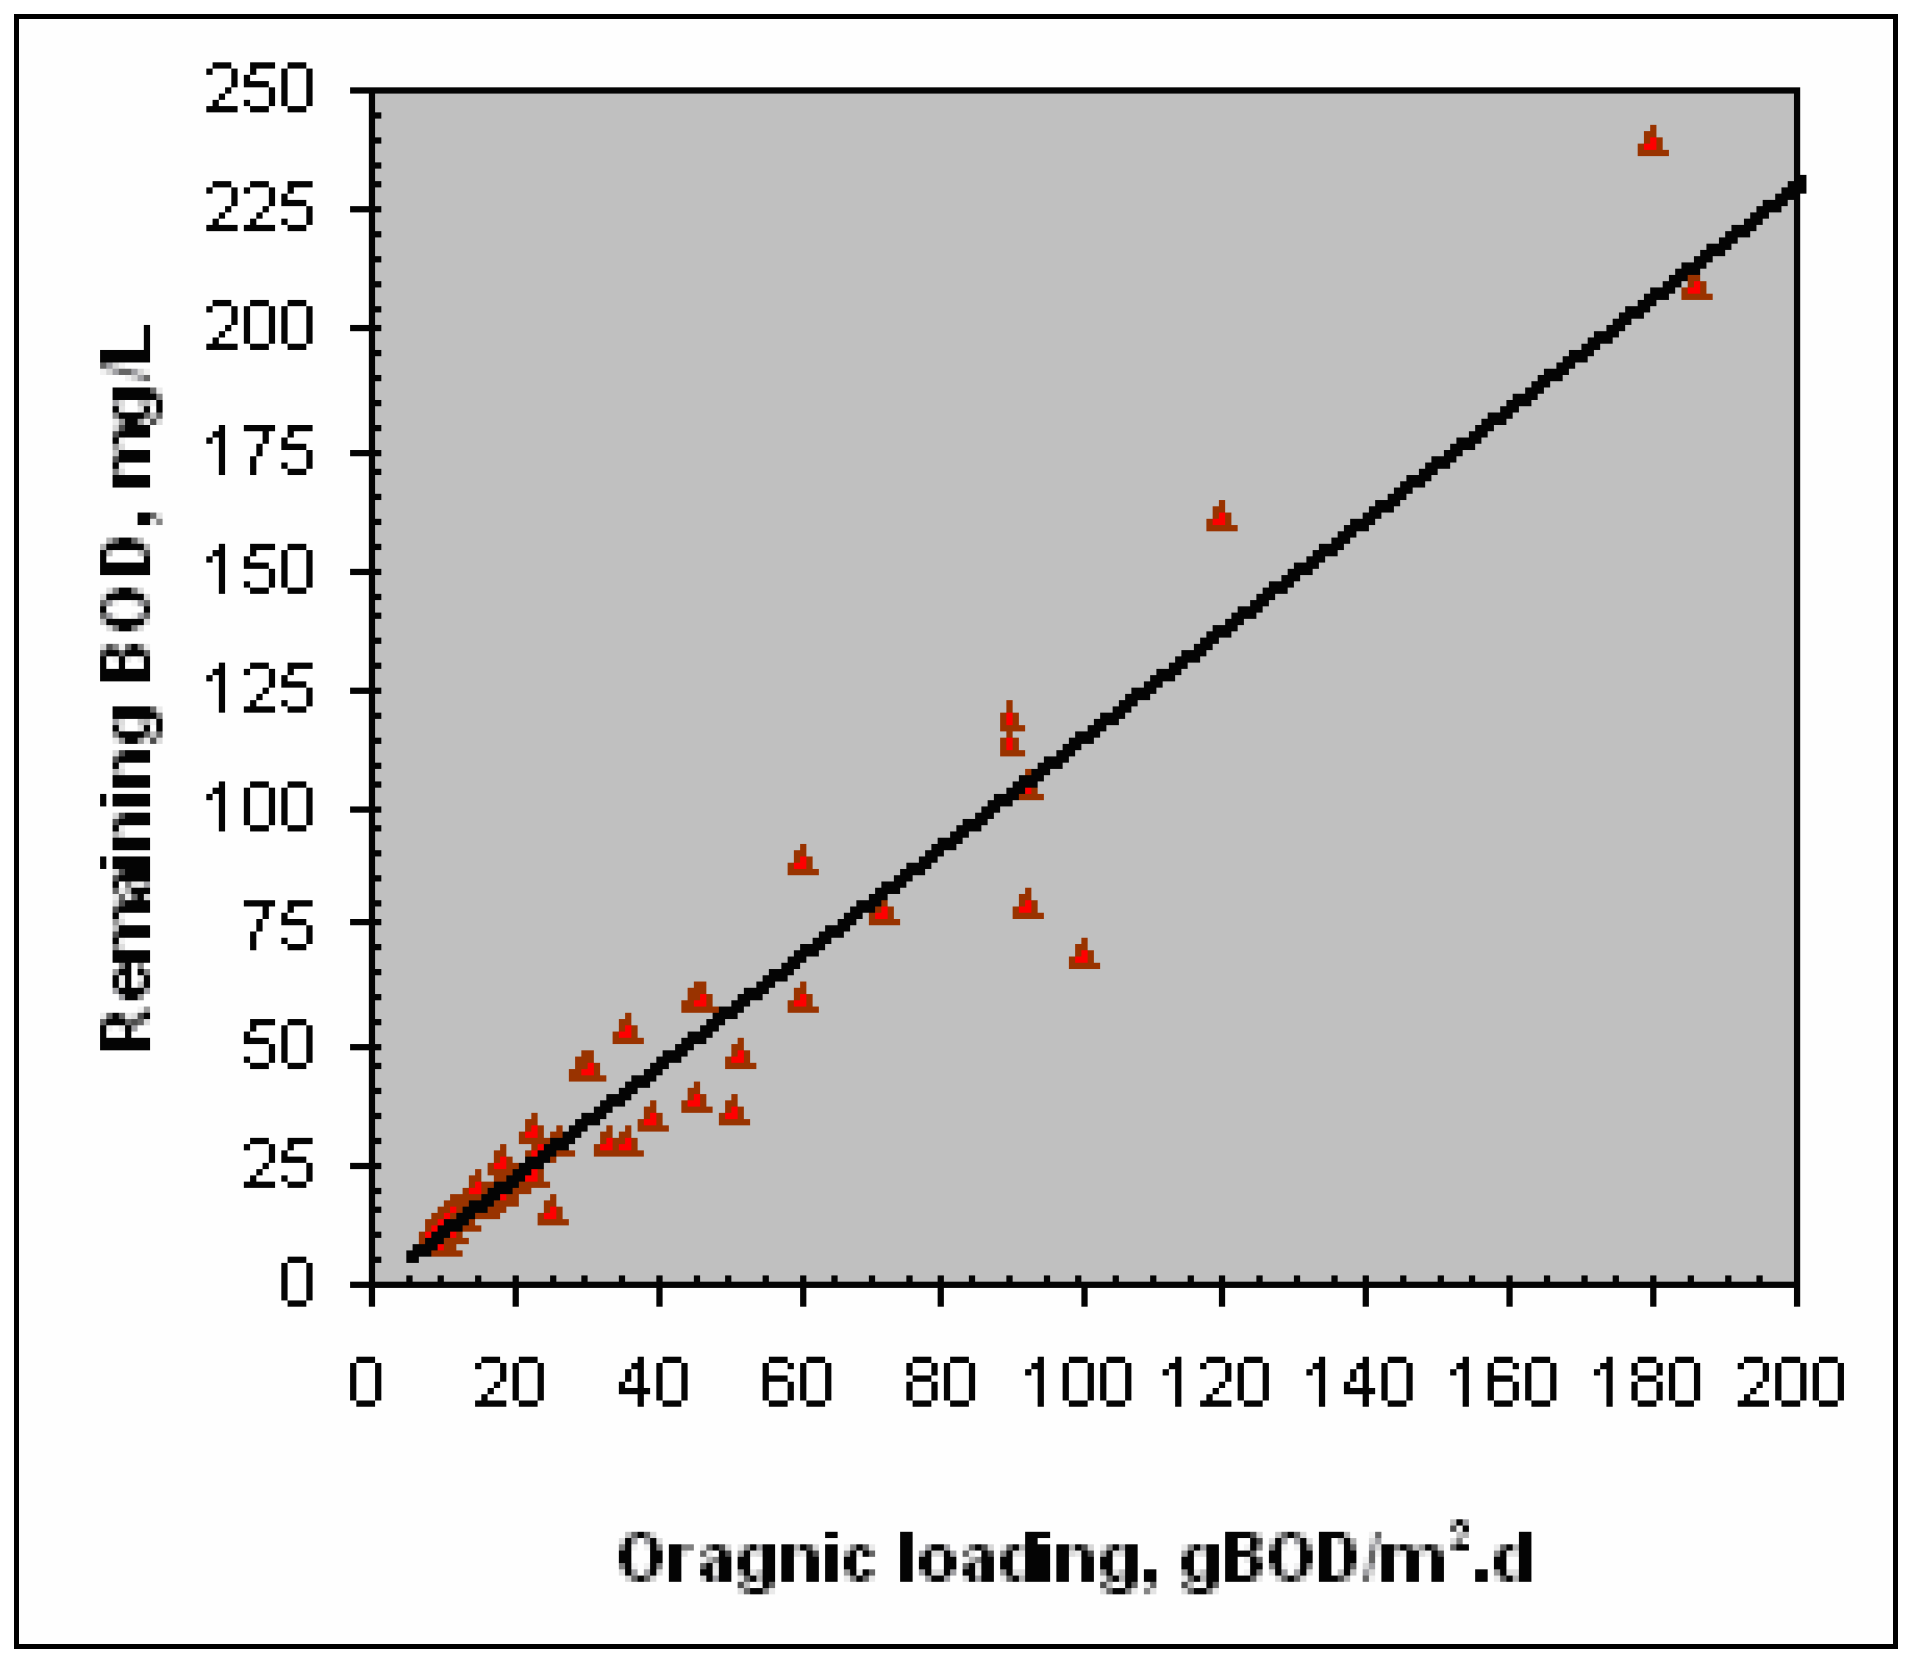
In figures (13), the effect of organic loading in terms of gBOD/m2.d on the percent BOD removal efficiency of the system, is represented. In figure (14), the values of remaining BOD are drawn as a function of organic loading. From these two figures, the following equations can be derived:
Sr (BOD) = 96.15 e – 0.0088 Nx (BOD)……………… ….
Se (BOD) = 1.15 Nx (BOD)………………………. ….
However, equations (7) and (8) also can be used in the design of rotating biological contactor systems. From figure (14), when it is desired to operate the system to achieve an effluent quality of about 25 mgBOD/L the system should be operated at an organic loading of not more than 22 BODg/m2.d.
Figure 13.
Effect of organic loading on the BOD removal efficiency (organic loading up to 140g BOD/m2.d).
Figure 13.
Effect of organic loading on the BOD removal efficiency (organic loading up to 140g BOD/m2.d).

Figure 14.
Effect of organic loading in g BOD/m2.d on the remaining BOD.

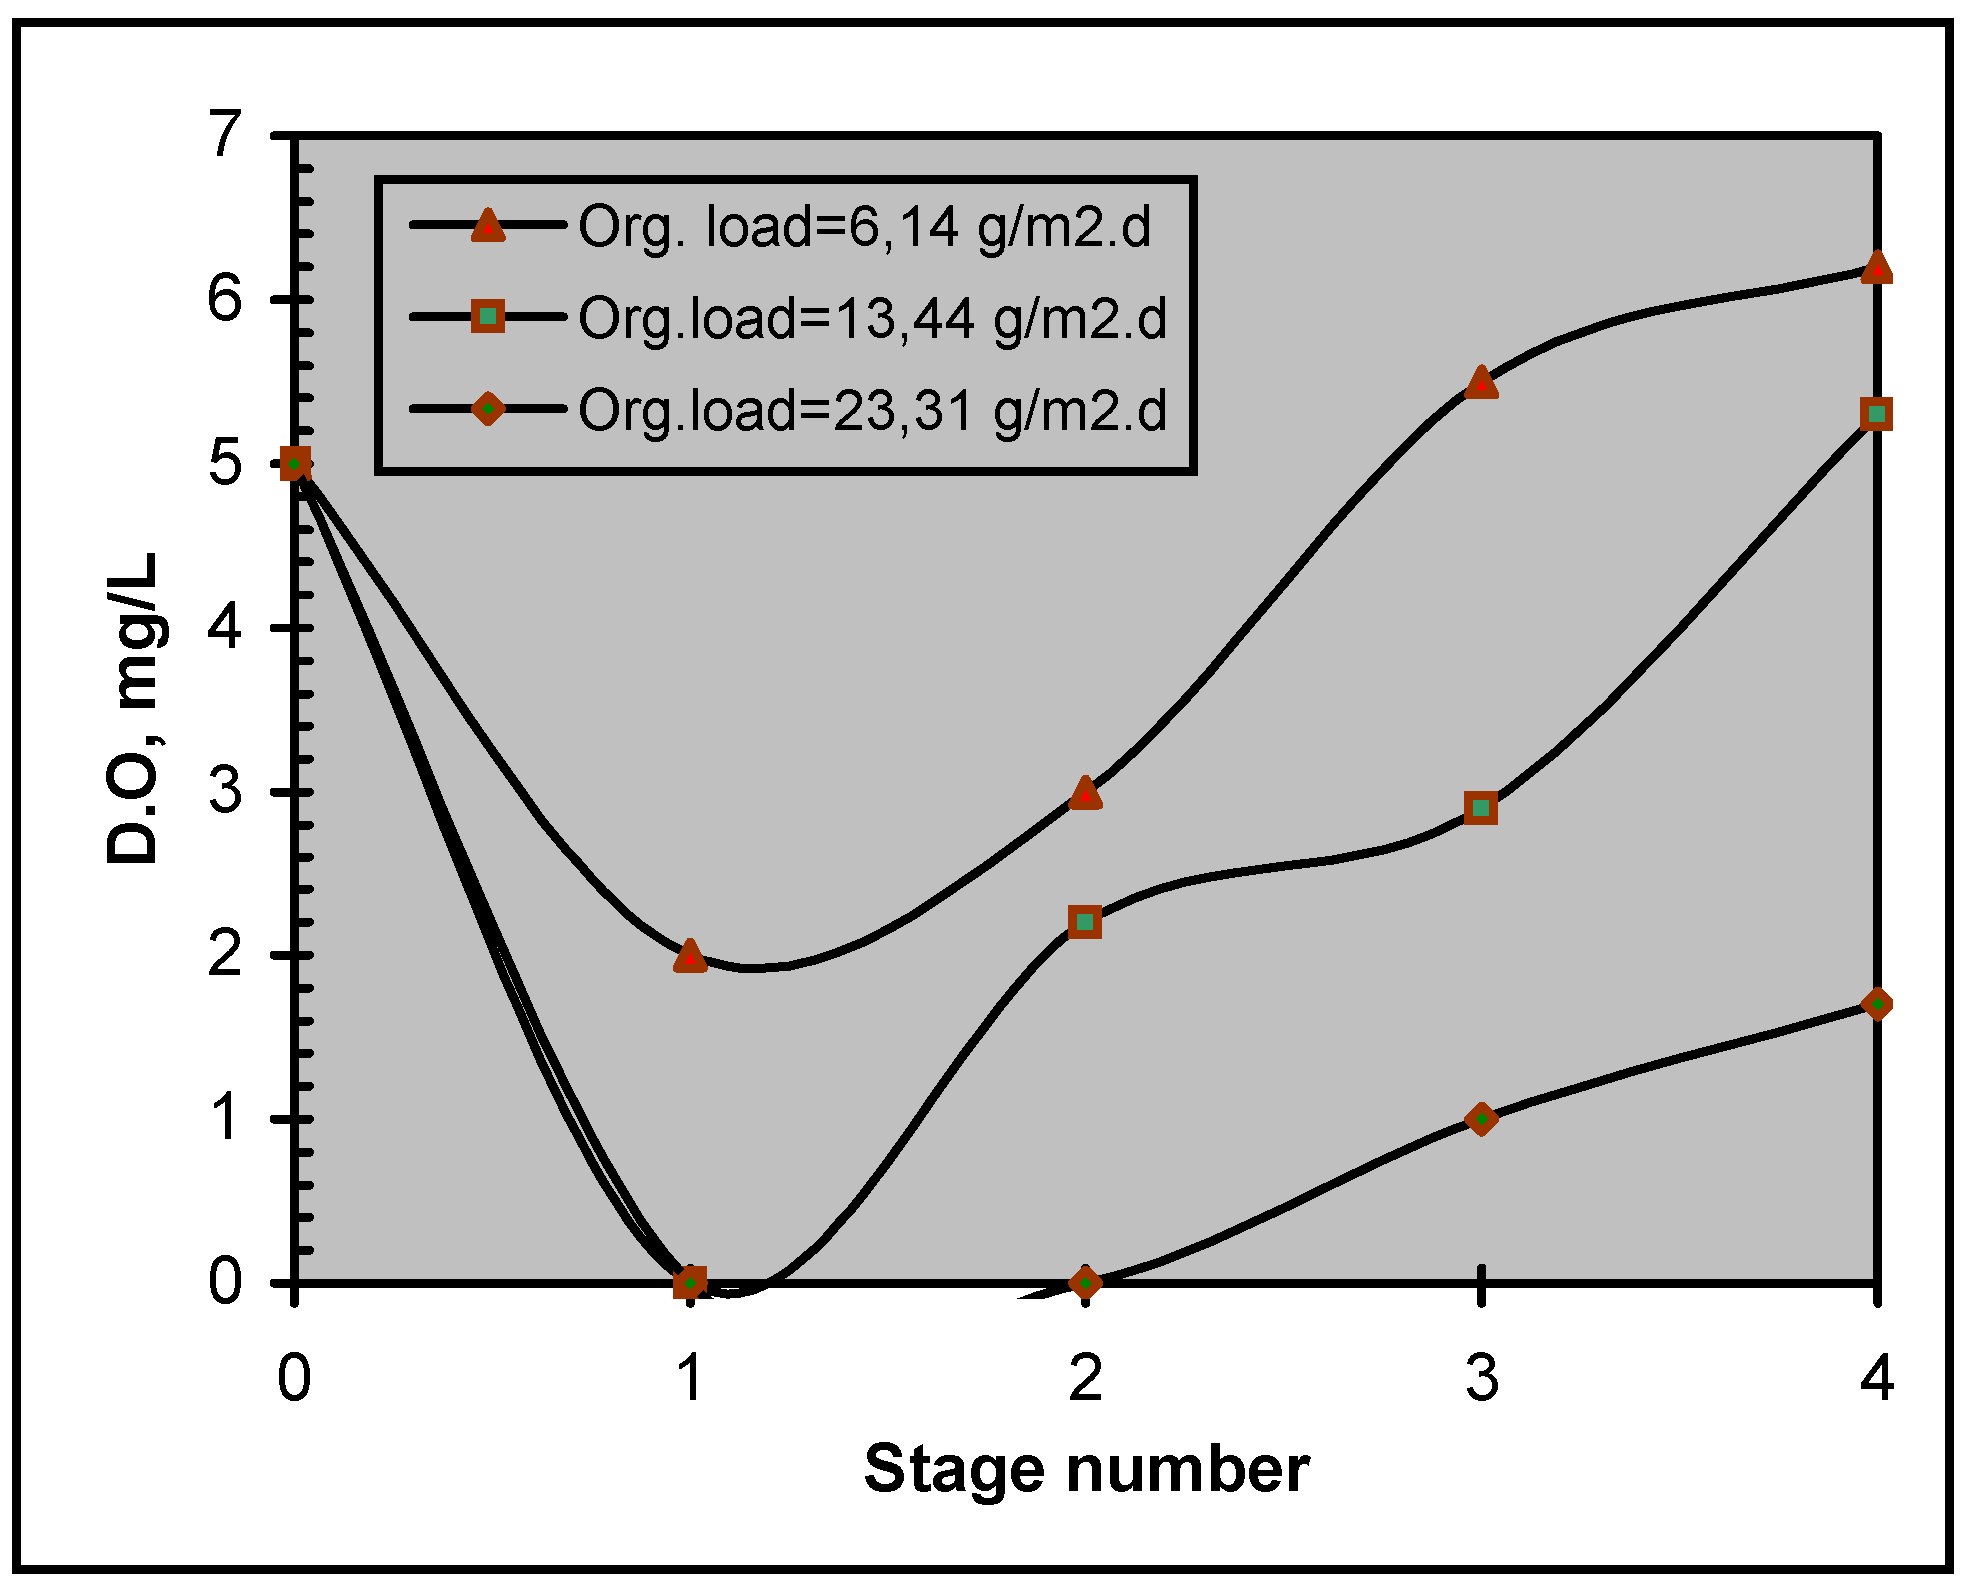
In figure (15), the effect of both of organic loading and stage number on the level of dissolved oxygen concentration (DO) in the system basins is drawn. As shown in the figure, dissolved oxygen profiles generally followed a pattern of rapid initial decline in the first stages and, slow recovery in successive stages. As noted, there is a direct correlation between the dissolved oxygen concentration and organic loading. Higher loading cause sharp decrease in DO. Such phenomenon can be explained by heterotrophic uptake of dissolved oxygen in these stages. At the first and second stages, high concentration of organic substrate is available and then high utilization of substrate and heterotrophic growth are attained i.e. maximum consumption of oxygen. As organic substrate is metabolized through the successive stages, heterotrophic growth decreased, resulting in decreasing of oxygen demand in the last stages. Where organic substrate is low and heterotrophic growth is minimal, aeration provided by the contactor rotation supplied oxygen in excess of demand.
Figure 15.
Effect of organic loading on the dissolved oxygen concentration in the RBC stages (rotational velocity = 10rpm).
Figure 15.
Effect of organic loading on the dissolved oxygen concentration in the RBC stages (rotational velocity = 10rpm).
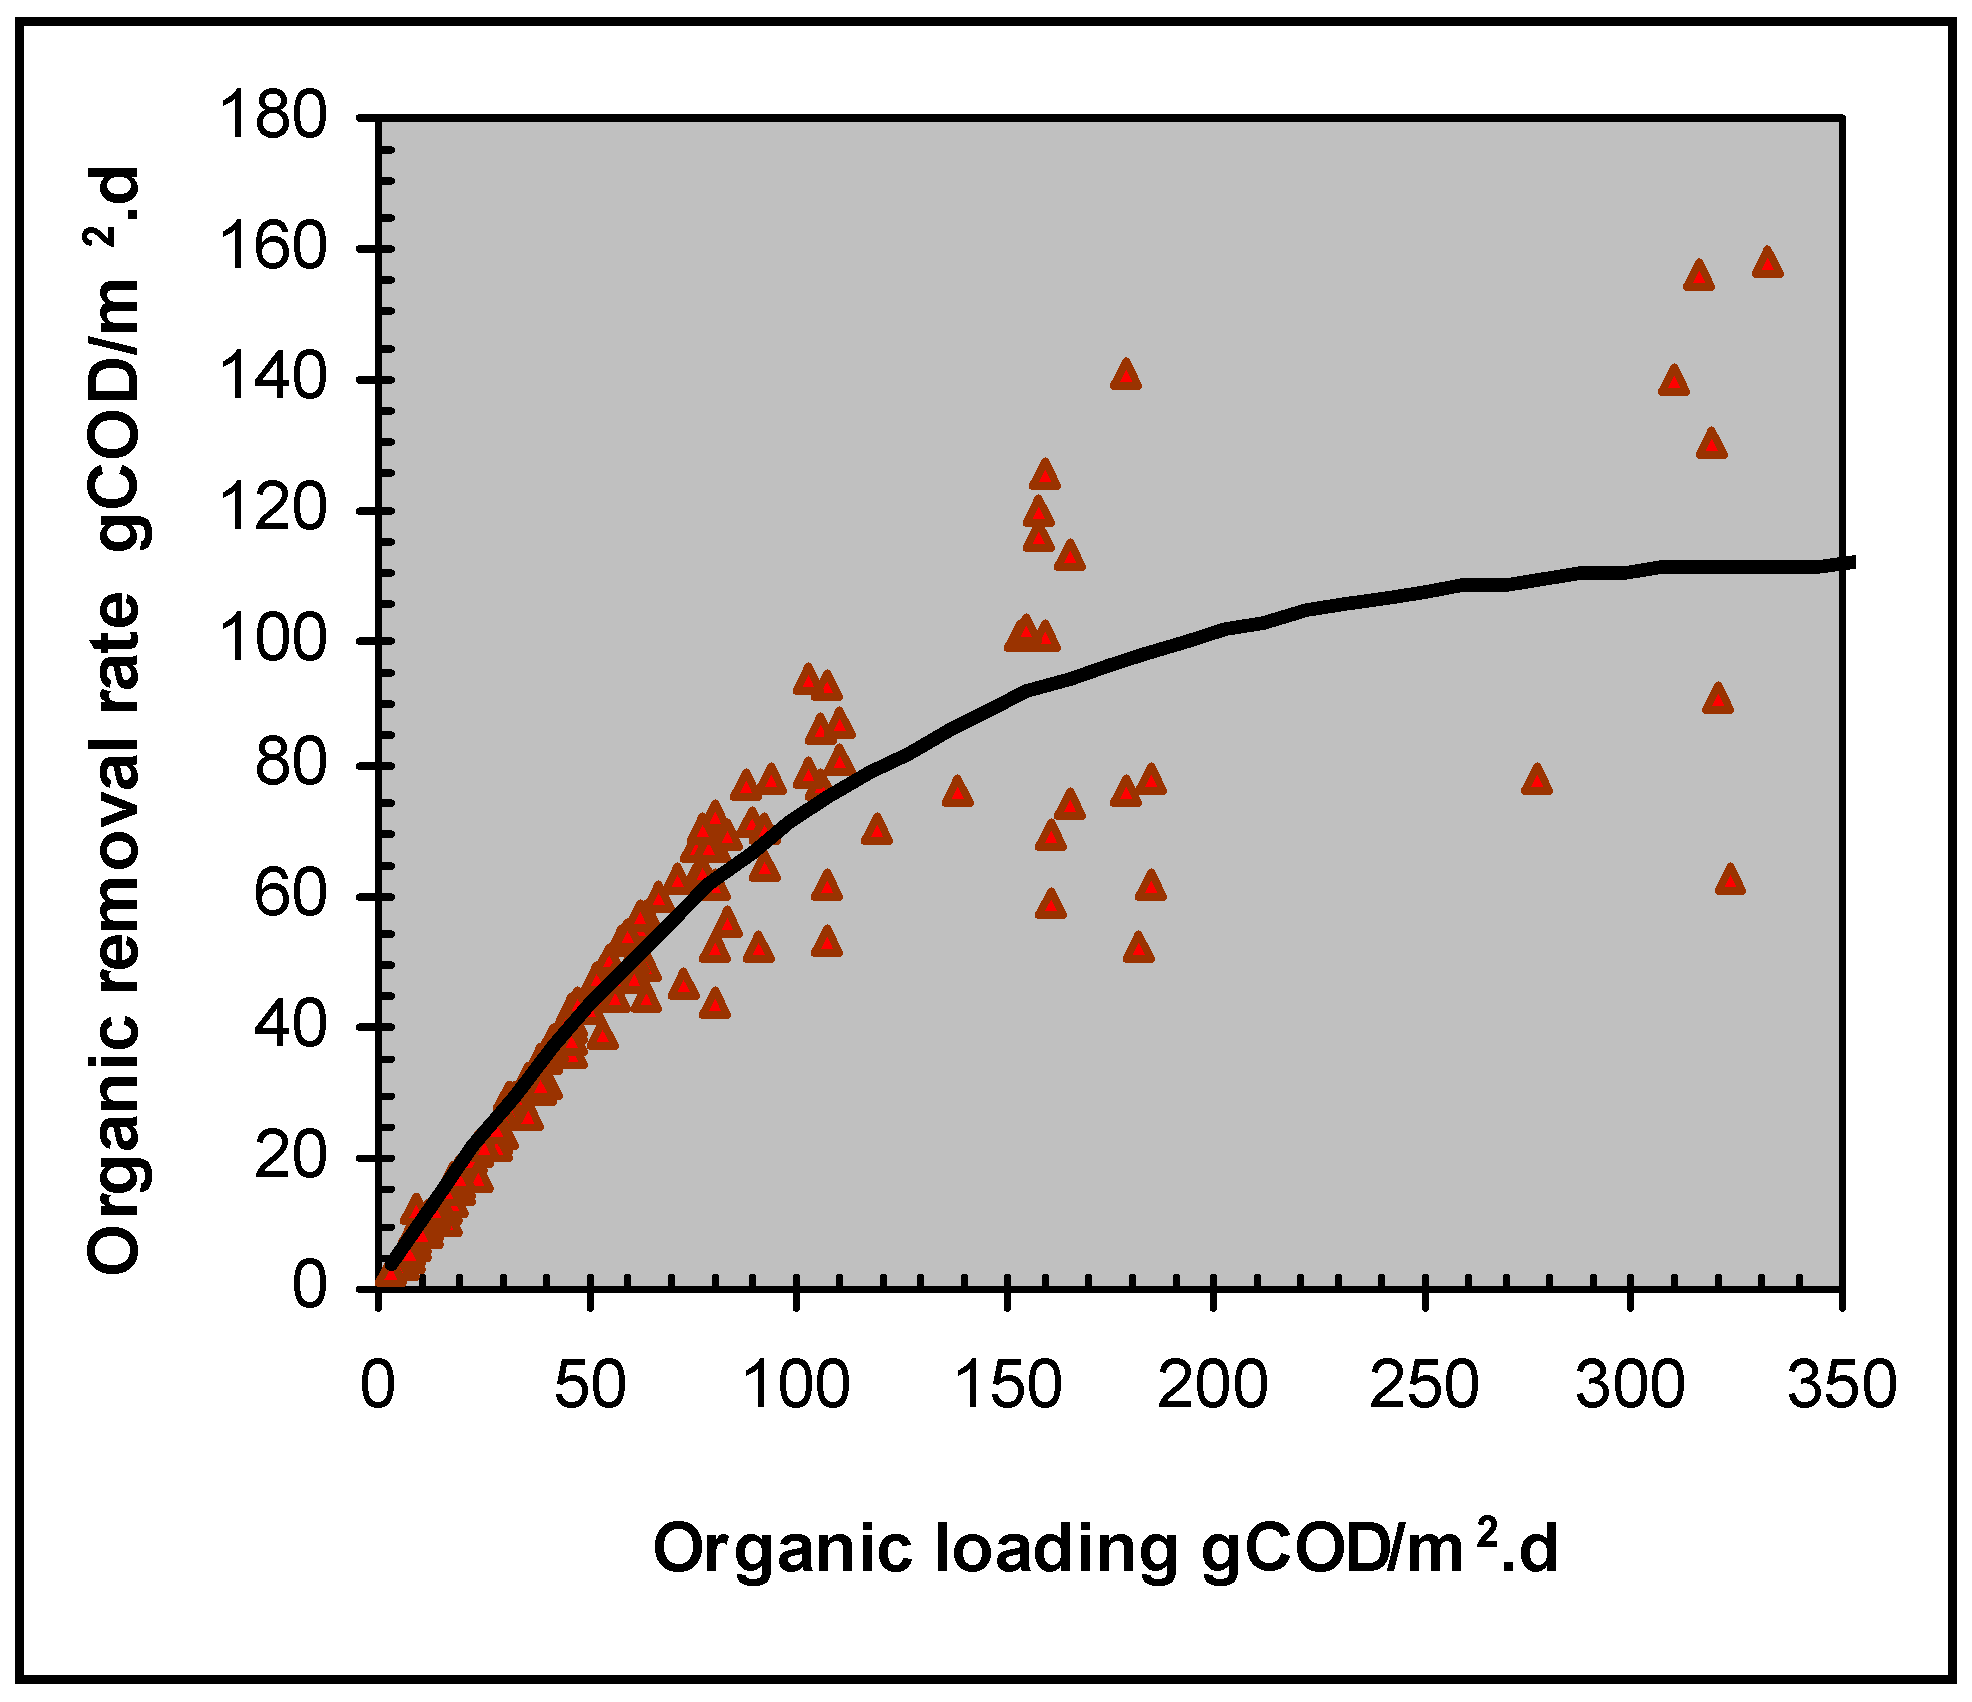
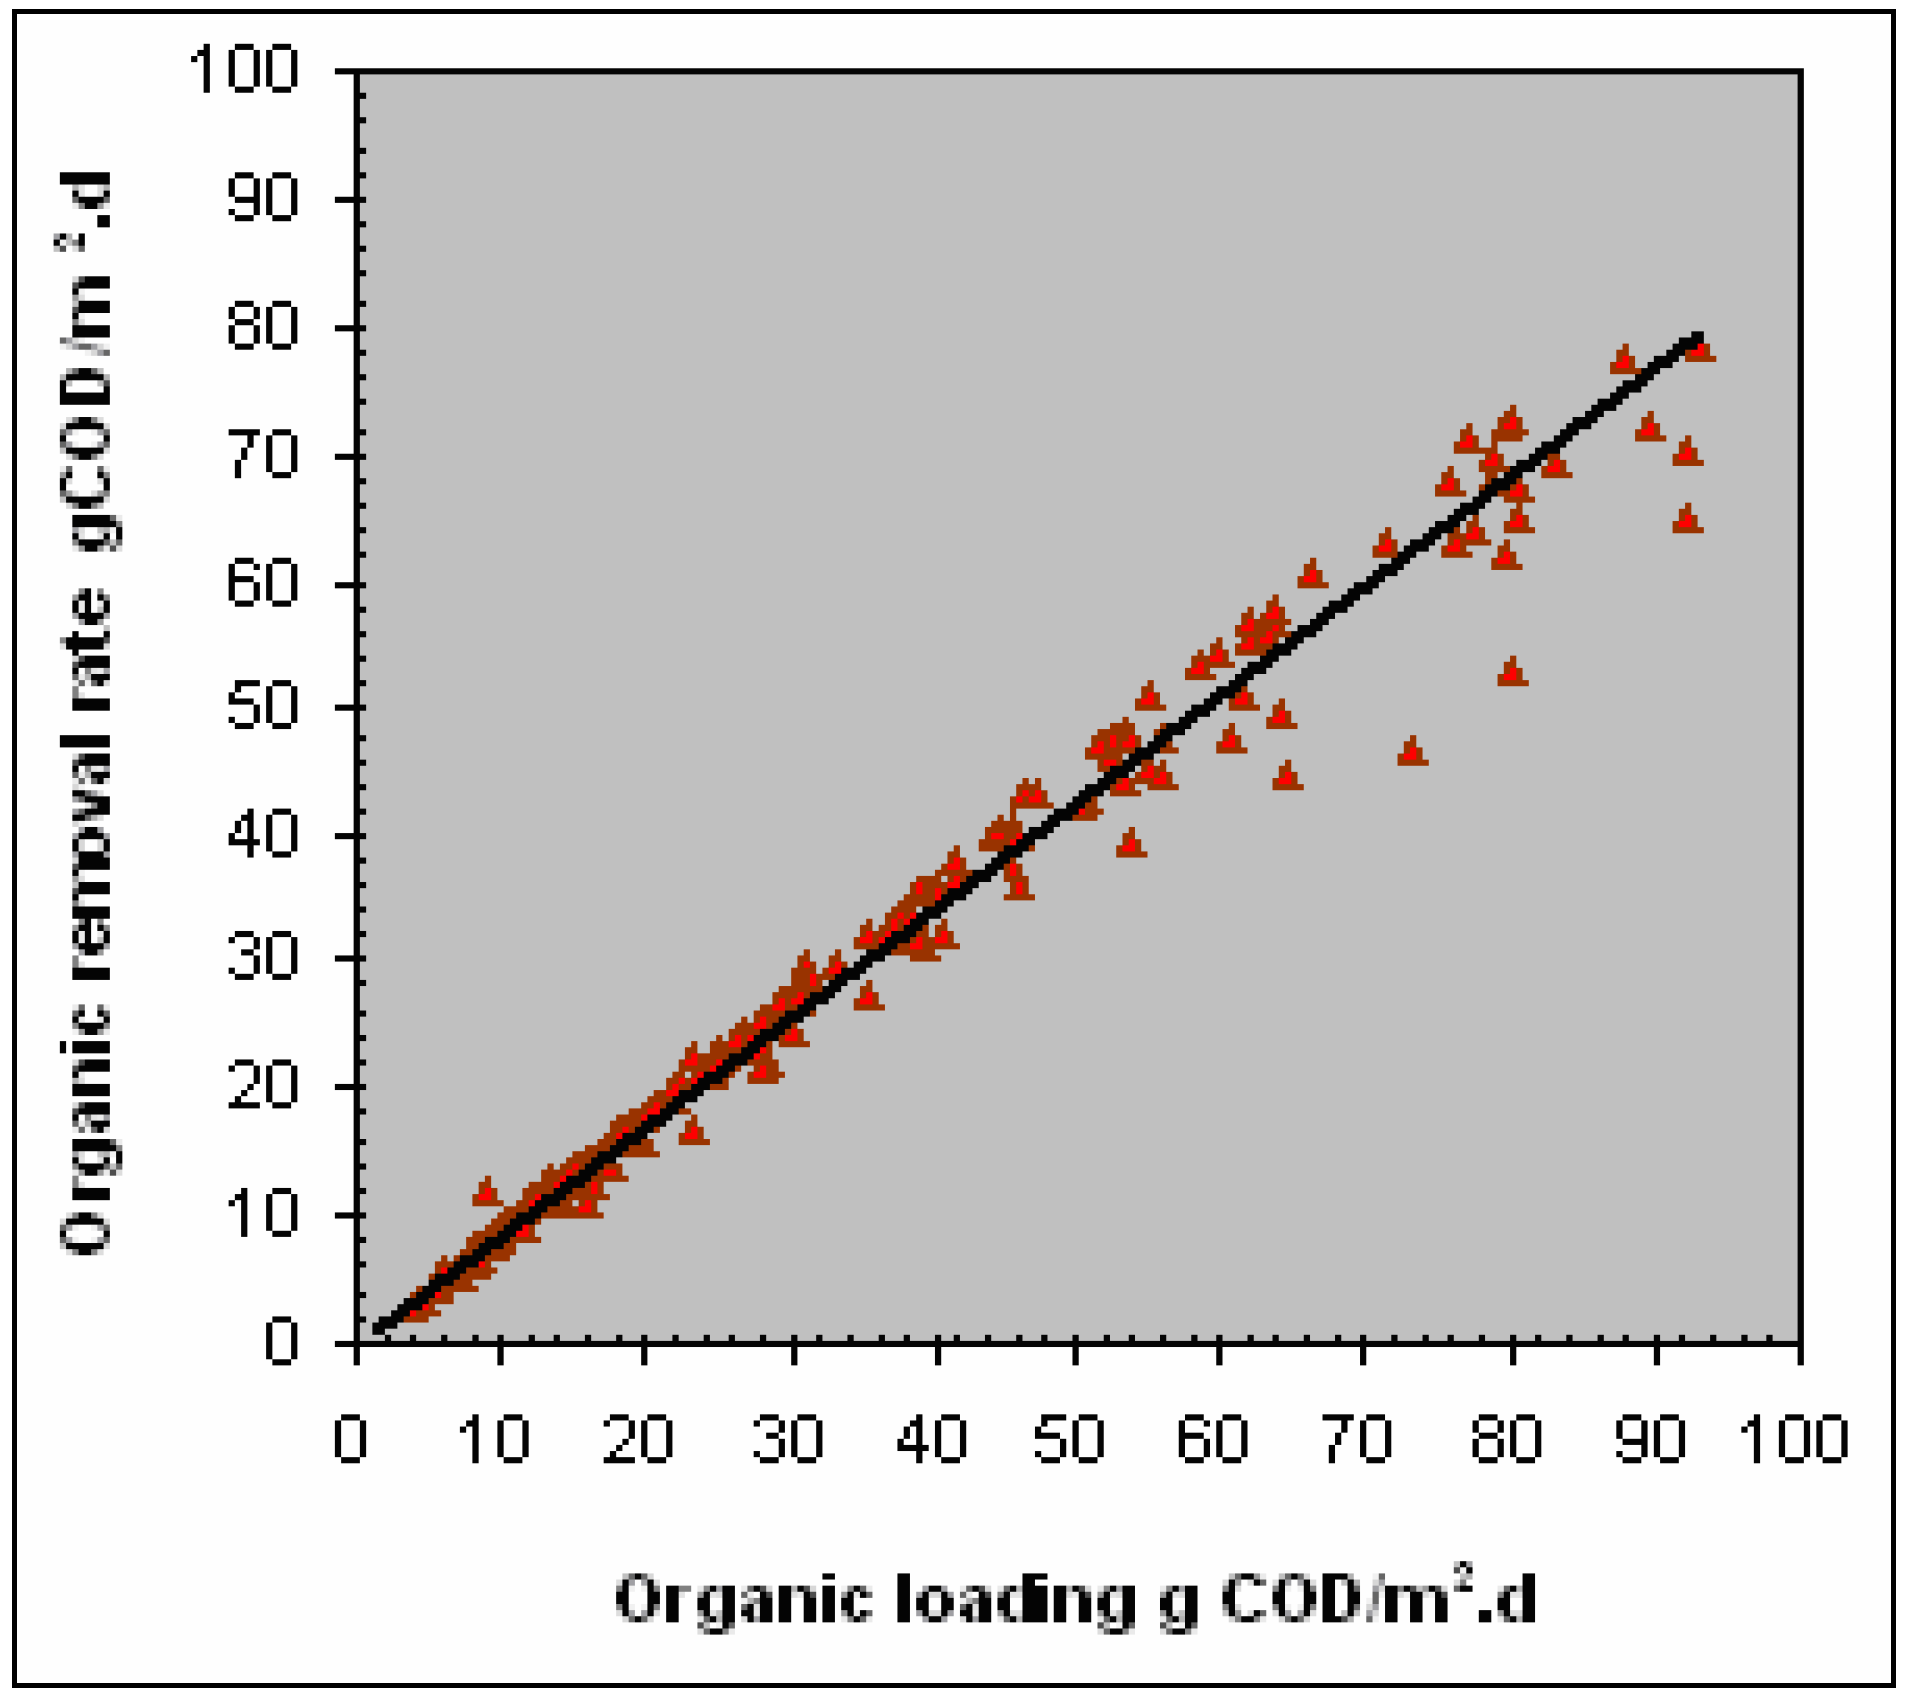
In figure (16), the relationship between the applied organic loading and the removal organic loading in terms of (g CODremoved/m2.d) is presented. As noted, there is a strong correlation between these two factors, especially at a range of loadings up to 150 g/m2.d, after that, more scatter in data is noted. However, from the figure to achieve accepted level of removal, the system should be operated at loading rate of not more than (100 gCOD/m2.d).
Figure 16.
Effect of total applied organic loading on organic removal rate under various operational conditions.
Figure 16.
Effect of total applied organic loading on organic removal rate under various operational conditions.

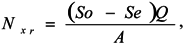
In figure (17), the portion which extend (from 0 – 100 gCOD/m2.d) in figure (16) is drawn separately. As shown in the figure, a simple linear form equation is obtained. The equation which represents this relationship can be written as:
where,
Nxr = 0.85 Nx ……………………………...…
- Nxr is the removed loading in terms of gCODr/m2.d, which can be represented as:
![Ijerph 02 00469 i001]()
- So: influent COD in (mg/l);
- Se: effluent or remaining COD in (mg/l);
- Q: flow rate (m3/d) and;
- A is the surface area of the contactor (m2).
The slope of equation (9) is a function of wastewater characteristics and temperature. When wastewater is classified as easy in term of microorganisms destabilization, the slope of curve is increasing to reach one. On the other hand, environmental characteristic, such as temperature, has also an affect on the slope of curve. However, other researchers also derived similar type of straight equation but with other values of slope (0.89-0.97) [26,27].
Figure 17.
Effect of total applied organic loading on organic removal rate (organic loading up to 100 gCOD/m2.d).
Figure 17.
Effect of total applied organic loading on organic removal rate (organic loading up to 100 gCOD/m2.d).

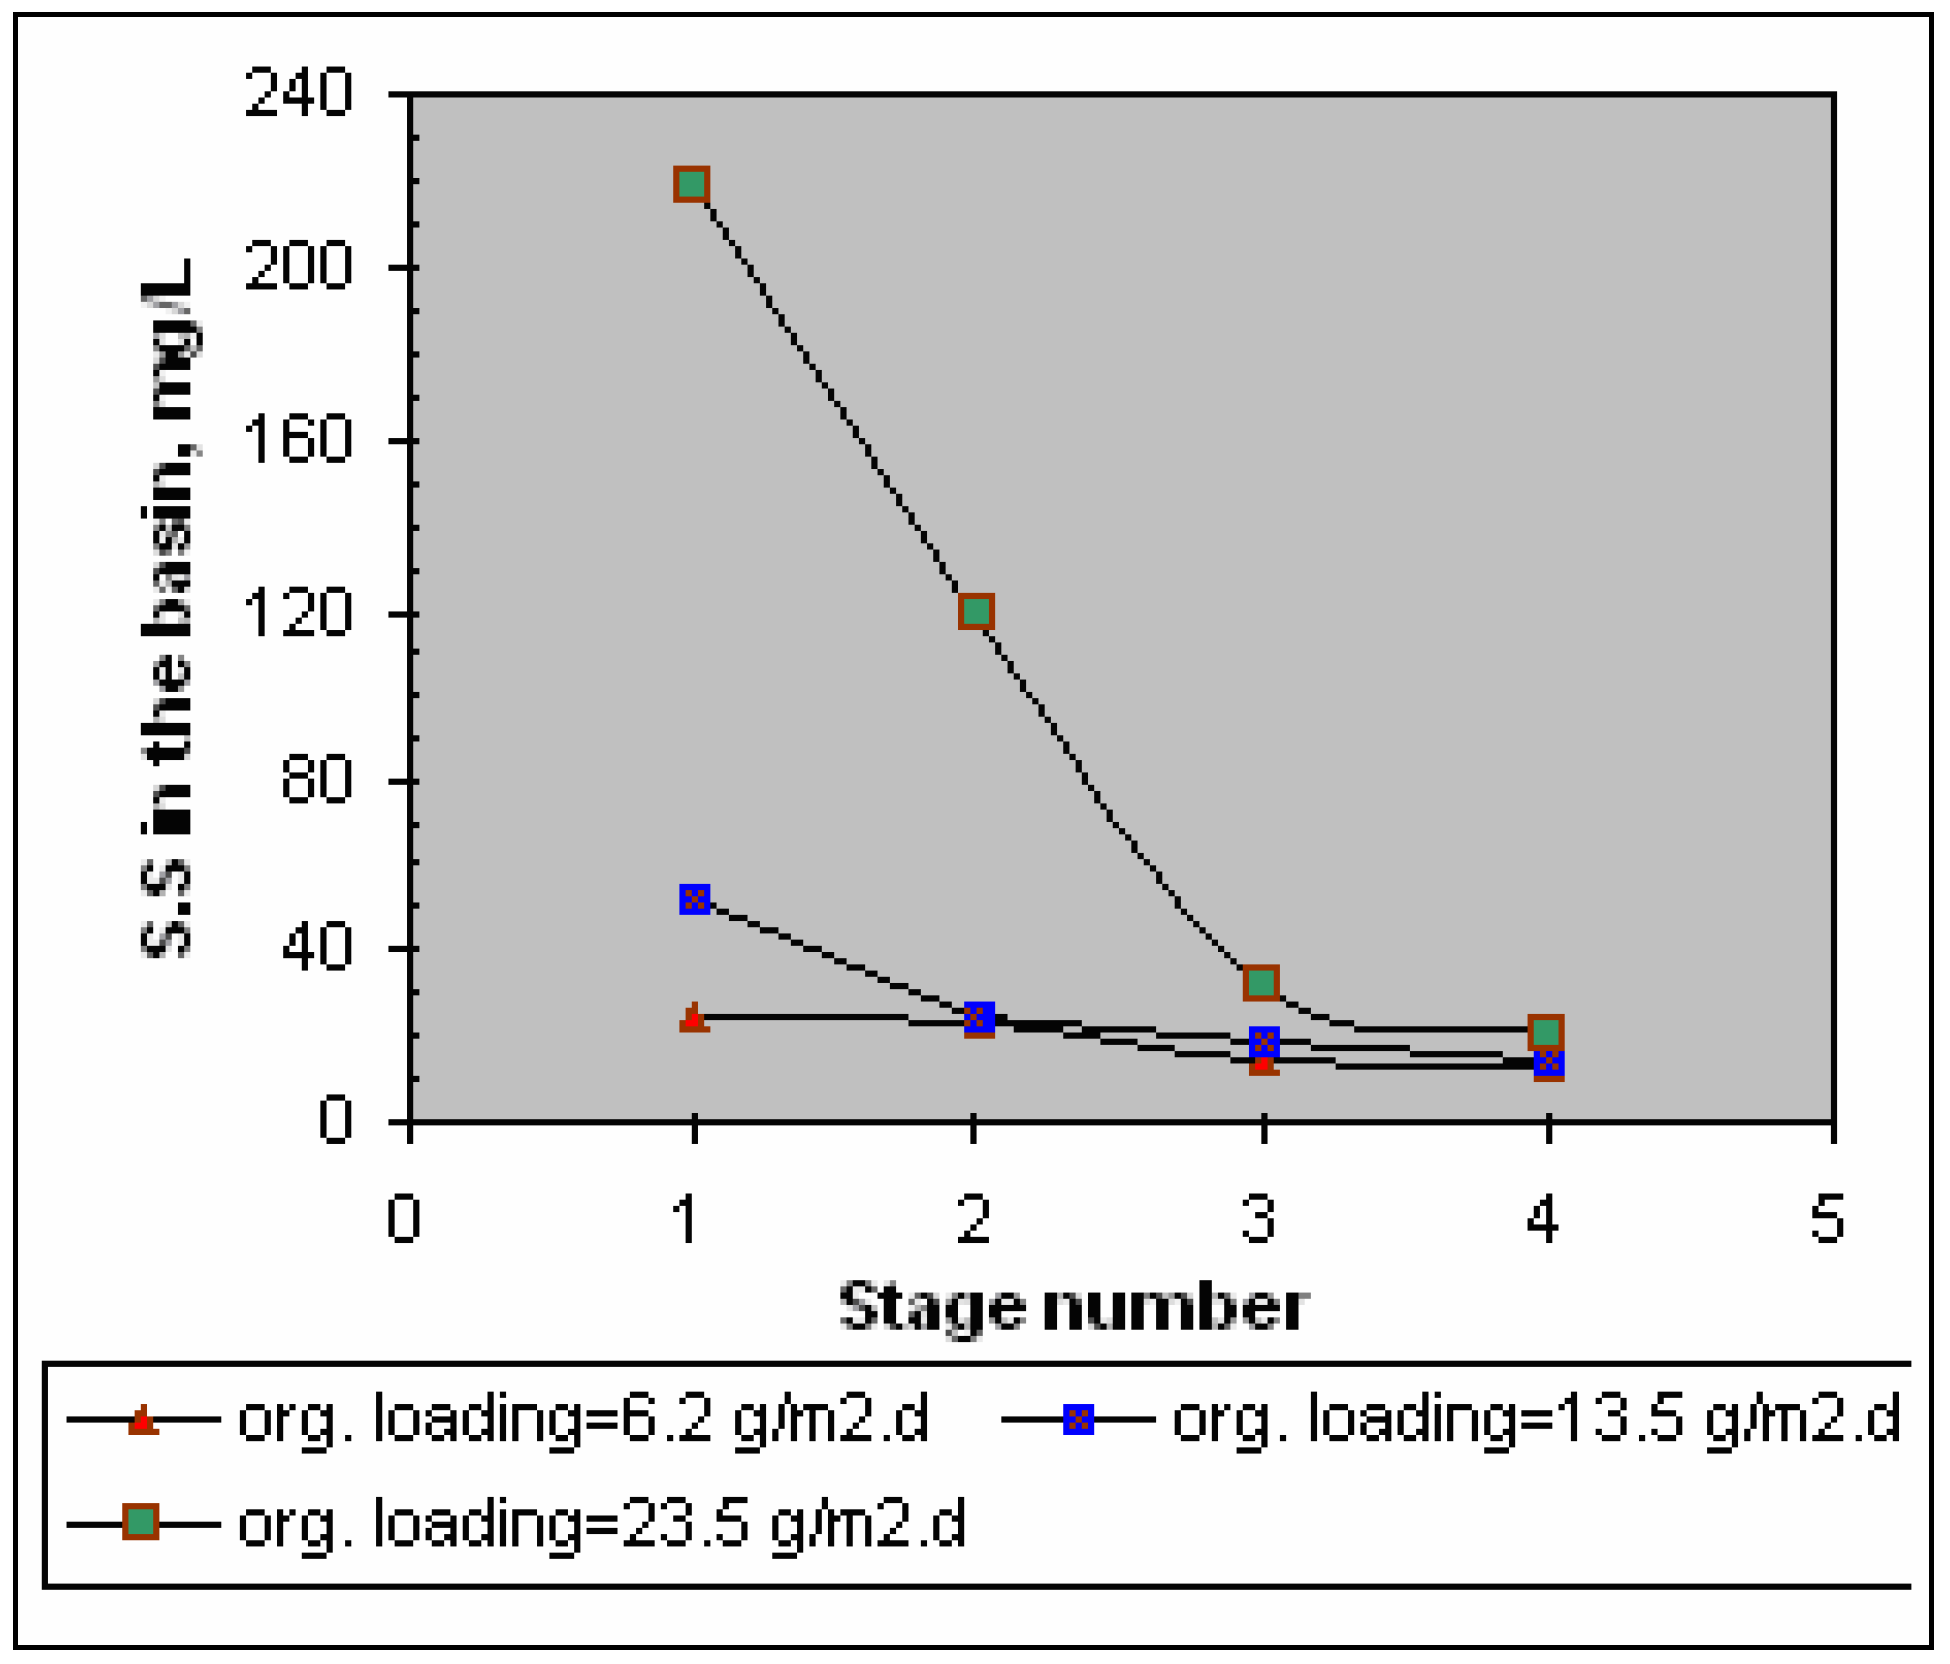
In figure (18), the concentration of suspended solids (SS) in rotating biological contactor basins is drawn as a function of organic loading and stage number. As noted, with increasing the organic load, suspended solids concentration increase, especially in the first stage. This is due to high amount of food available and high biomass sloughing process, [17]. As shown in the figure, concentration of suspended solids decreases with increasing the stage number. As in other biological processes, effluent suspended solids have a great influence on the performance of rotating biological contactor systems. Many researchers indicated that, in rotating biological contactor systems, about 50 % of the total effluent BOD is coming from effluent suspended solids [1,24,34].
Figure 18.
Relationship between the concentrations of suspended solids and organic loading at different stages of RBC
Figure 18.
Relationship between the concentrations of suspended solids and organic loading at different stages of RBC
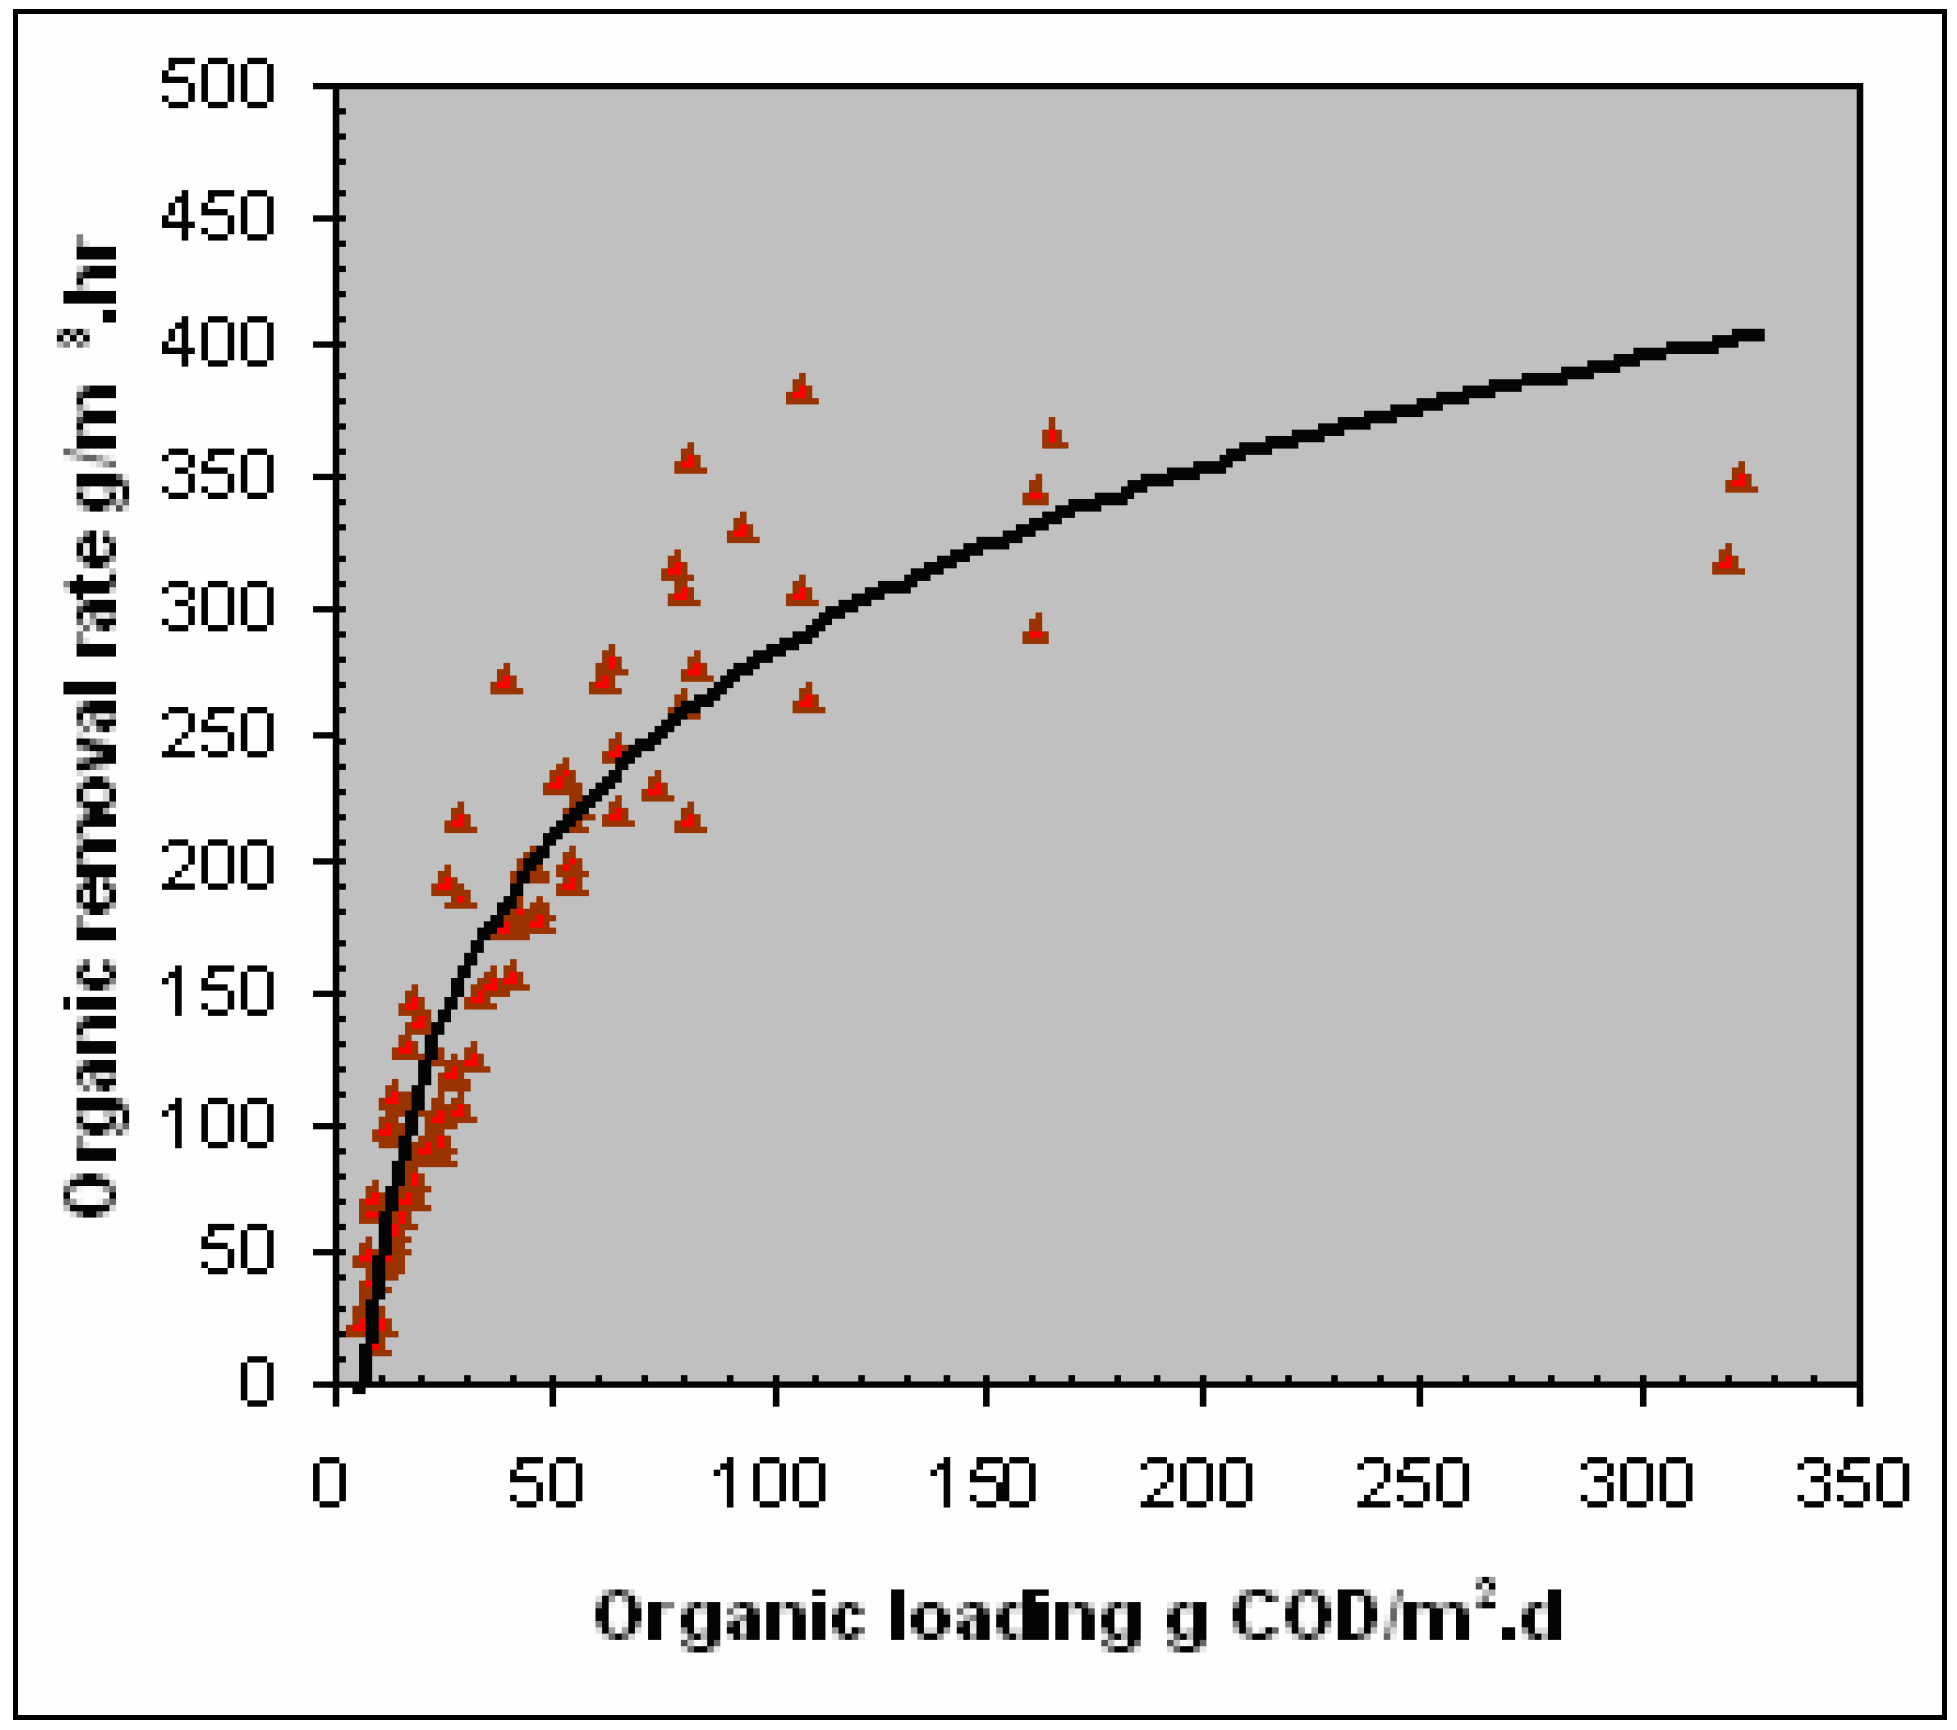
In figure (19), the volumetric substrate utilization rate in terms of (gCOD/m3. h) is drawn as a function of organic loading. As noted, the volumetric removal rate directly increases with increasing loading rate as long as the system is working at range of load between (0-50 g/m2.d). After that, the impact of organic loading on the volumetric removal rate decreases. At a range of loading of larger than (150 gCOD/m2.d) the effect of loading on the removal rate becomes approximately absent. For domestic wastewater, the volumetric removal rate which corresponds to load of (150 g/m2.d) is (320g/m3.h).
Figure 19.
Effect of total applied organic loading on organic removal rate.
Conclusions
- (1)
- The majority of COD removal occurs in the first stages of rotating biological contactor systems. The COD removal in the first stages ranging between (40-85 %) depending on the organic loading applied. However, each of the type of wastewater and flow rate is also influence on the system efficiency but their impact can be combined by the effect of organic loading.
- (2)
- There is a strong correlation between the organic loading applied and the concentration of the suspended solids present in the rotating biological contactor basins. At higher loadings, higher concentration is noted. At a loading of about, (24 g/m2.d) suspended solids were 225, 125, 35, and 25 mg/L at the first, second, third and, the fourth stage respectively.
- (3)
- To achieve an effluent quality of: BOD ≤ 25 mg/L, COD ≤ 60 mg/L, the system should be operated on organic loading rates of (22 gBOD /m2.d and 65 gCOD g/m2.d) respectively.
- (4)
- Substrate utilization rate (organic removal rate) increases with increasing the organic loading to such limit which after it, increasing the load has no or limited impact on the removal rate. For rotating biological contactor systems, that treating domestic wastewater, the value of organic loading that at which the maximum removal rate is obtained was (150 g/m2.d). The volumetric and surface removal rates which correspond to this load were (320 gCOD/m3.d) and (100 gCOD/m2.d) respectively.
- (5)
- For nitrification, the rotating biological contactor systems should be designed to work on a level of loading not more than (10 gCOD/m2.d) and, the reactor volume should be designed to achieve a hydraulic loading of about (40 L/m2.d) or less.
References
- Al-Ahmady, K. K. Development of new technology for rotating biological contactors for wastewater treatment. Ph.D. Thesis, St. Petersburg state university of architecture and civil engineering, Russia, 2003; pp. 86–95. [Google Scholar]
- Antonie, R. L.; Kluge, L. D.; Mielke, J. H. Evaluation of rotating disk wastewater treatment plant. J. Water Pollut. Control Fed. 1974, 46, 498–511. [Google Scholar]
- Barger, R.; Dawson, D. Factors affecting rotating biological contactor biomass weight through seasonal variations. In Abst. Tech. Pap. 64th Annu. Conf., Water Pollut. Control Fed., Toronto, Can; 1991. [Google Scholar]
- Bintanja, H. H. J.; Van Der Erve, J. J. V. M.; Boelhouwer, C. Oxygen transfer in a rotating disc treatment plant. Water Res. (G.B.) 1975, 9, 1147–1153. [Google Scholar] [CrossRef]
- Chesner, W. H.; Ionnone, T. T. I. Current status of municipal wastewater treatment with rotating biological contactor technology in the USA. In Proc. 1st Nat. Symp./Workshop on Rotating Biological Contactor Technol, University of Pittsburgh, Champion, Pa. Smith, E. D., Ed.; 1980; pp. 53–58. [Google Scholar]
- Chung, J. C.; Storm, P. F. Microbiological study of ten New Jersey rotating biological contactor wastewater treatment plants. Res. J. Water Pollut. Control Fed. 1991, 63, 35–43. [Google Scholar]
- Clark, J. A.; et al. Performance of a rotating biological contactor under varying wastewater flow. J. Water Pollut. Control Fed. 1978, 50, 896–911. [Google Scholar]
- dAntonio, G.; Mendia, L.; Pirozzi, F.; Polese, A. Rotating biological contactor–solid contact system for the treatment of wastewater from small communities. Wat. Sci. Technol. (G.B.) 1997, 35, 109–115. [Google Scholar]
- DuPont, R. R.; McKinney, R. E. Data evaluation of a municipal installation, Kirksville, Missouri. In Proc. 1st Nat. Symp./Workshop on Rotating Biological Contactor Technol., University of Pittsburgh, Champion, Pa. Smith, E. D., Ed.; 1980; pp. 205–217. [Google Scholar]
- Eckenfelder, W. W.; Vandevenne, L. A design approach for rotating biological contactor treating industrial wastewaters. In Proc. 1st Nat. Symp./Workshop on Rotating Biological Contactor Technol., University of Pittsburgh, Champion, Pa. Smith, E. D., Ed.; 1980; pp. 1065–1077. [Google Scholar]
- Famularo, J.; Muller, J. A.; Mulligan, T. Application of mass transfer to rotating biological contactors. J. Water Pollut. Control Fed. 1978, 50, 653–671. [Google Scholar]
- Filion, M. P.; Murphy, K. L.; Stephenson, J. P. Performance of a rotating biological contactor under transient loading conditions. J. Water Pollut. Control Fed. 1979, 51, 1925–1933. [Google Scholar]
- Friedman, A. A.; Robbins, R. C. Wood: “Effect of disk rotational speed on biological contactor efficiency”. J. Water Pollut. Control Fed. 1979, 51, 11. 2678–2690. [Google Scholar]
- Greaves, F. E.; Thorp, B.; Critchley, R. F. Operational performance of package sewage treatment plants in north west England. Wat. Sci. Technol. (G.B.) 1990, 22, 25–32. [Google Scholar]
- Hitdlebugh, J. A.; Miller, R. D. Full- scale rotating biological contactor for secondary treatment and nitrification. In Proc. 1st Nat. Symp./Workshop on Rotating Biological Contactor Technol., Champion, Pa. 1980; 1, pp. 269–278. [Google Scholar]
- Kim, B. J.; Molof, A. H. The scale-up and limitation of physical oxygen transfer in rotating biological contactors. Wat. Sci. Technol. (G.B.) 1982, 14, 569–574. [Google Scholar]
- Kyu-Hong, Ahn; Chang, Joe-Soo. Performance evaluation of compact rotating biological contactor – settling tank. Wat. Sci. Technol. (G.B.) 1991, 23, 1467–1485. [Google Scholar]
- Lehman, P. L. Start-up and operating characteristics of an rotating biological contactor facility in a cold climate. J. Water Pollut. Control Fed. 1983, 55, 1233–1238. [Google Scholar]
- Leitdlebaugh, I. A.; Miller, R. D. Operational problems with rotating biological contactors. Water Pollut. Control Fed. 1981, 53, 1283–1288. [Google Scholar]
- Liu, Y.; Capdeville, B. Specific activity of nitrifying biofilm in water nitrification process. Water Res. (G.B.) 1996, 30, 1645–1650. [Google Scholar] [CrossRef]
- Marsh, D. Copuled trickling filter – rotating biological contactor for nitrification process. Water Pollut. Control Fed. 1981, 53, 1469–1480. [Google Scholar]
- Masuda, S.; Watanabe, Y.; Ishiguro, M. Biofilm properties and simultaneous nitrification and denitrification in aerobic rotating biological contactors. Wat. Sci. Technol. (G.B.) 1991, 23, 1355–1363. [Google Scholar]
- Mathys, R. G.; Branion, R. M. R.; Lo, K.V.; Anderson, K. B.; Leyen, P.; Louie, D. Wastewater treatment using a rotating biological contactor. Water Qual. Res. J. Can. 1997, 32, 771–779. [Google Scholar]
- Metcalf and Eddy, Inc. Wastewater engineering, Treatment, Disposal, and Reuse, 4nd ed.; McGraw-Hill Book Co.: New York, NY, 2002; Volume Ch. 9, pp. 930–940. [Google Scholar]
- Mueller, J. A.; Paquin, P.; Famularo, J. Analysis and design of rotating biological contactors. In Proc. 1st Nat. Symp./Workshop on Rotating Biological Contactor Technol., University of Pittsburgh, Champion, Pa. Smith, E. D., Ed.; 1980; pp. 921–928. [Google Scholar]
- Okabe, S.; Oozawa, Y.; Hirata, K.; Watanabe, Y. Relationship between population dynamic of nitrifiers in biofilms and reactor performance at various C: N ratios. Water Res. (G.B.) 1996, 30, 1563–1572. [Google Scholar] [CrossRef]
- Pano, A.; Middlebrook, J. Kinetic of carbon and ammonia nitrogen removal in RBC. J. Water Pollut. Control Fed. 1983, 55, 956–965. [Google Scholar]
- Paolini, A. E.; Variali, G. Kinetic consideration on the performance of activated sludge reactors and rotating biological contactors. Water Res. (G.B.) 1982, 16, 155–160. [Google Scholar] [CrossRef]
- Pescod, N. B.; Norton, T. S. Treatment of strong organic wastewater using aerobic and anaerobic packed-cage rotating biological contactors. In Paper presented at the 2nd Int. conf. Fixed-Film Biological Processes, Arlington; July 1984; pp. 299–318. [Google Scholar]
- Poon, P. C.; Chao, Ya-Len; Micucki, W. J. Factors controlling rotating biological contactor performance. J. Water Pollut. Control Fed. 1979, 51, 601–611. [Google Scholar]
- Sagy, M.; Kott, Y. Efficiency of rotating biological contactor in removing pathogenic bacteria from domestic sewage. Water Res. (G.B.) 1990, 24, (9), 1125–1128. [Google Scholar] [CrossRef]
- Spengel, D. B.; Dzombak, A. D. Biokinetic modeling and scale-up considerations for rotating biological contactors. Res. J. Water Pollut. Control Fed. 1992, 64, (3), 223–235. [Google Scholar]
- Stover, E. L.; Kincannon, D. F. Evaluating rotating biological contactor performance. Water and Sew. Works 1976, 123, 88–91. [Google Scholar]
- Tanaka, K.; Oshima, A.; Rittman, B. E. Performance evaluation of rotating biological contactor process. Wat. Sci. Technol. 1987, 19, 483–494. [Google Scholar]
- Tanaka, K.; Tada, M.; Ito, M.; Shimizu, N. Performance analysis of the rotating biological contactor process based on particle fraction and improvement of final effluent quality. Wat. Sci. Technol. (G.B.) 1991, 23, 1457–1466. [Google Scholar]
- Ware, J. A.; Pescod, M. B.; Storch, B. Evaluation of alternatives to conventional disc support media for rotating biological contactors. Wat. Sci. Technol. (G.B.) 1990, 22, (2), 113–117. [Google Scholar]
- Watanabe, Y.; Lee, C.; Koike, M.; Ishiguro, M. Nitrification kinetics and simultaneous removal of biomass and phosphorus in rotating biological contactors. Wat. Sci. Technol. (G.B.) 1990, 22, (2), 169–178. [Google Scholar]
- Weng, C.; Molof, A. H. Nitrification in the biological fixed film rotating disk systems. J. Water Pollut. Control Fed. 1974, 46, 1674–1685. [Google Scholar]
- Wilson, R. W. Scale-up in rotating biological contactor design. J. Water Pollut. Control Fed. 1980, 52, 610–620. [Google Scholar]
- Wu, Y. C.; Smith, ED, D.; Chen, C. Y. Temperature effects on rotating biological contactor scale-up. J. of the Environ. Engin. Div. 1983, 109, 321–726. [Google Scholar] [CrossRef]
© 2005 MDPI. All rights reserved.
Share and Cite
MDPI and ACS Style
Al-Ahmady, K.K. Effect of Organic Loading on Rotating Biological Contactor Efficiency. Int. J. Environ. Res. Public Health 2005, 2, 469-477. https://doi.org/10.3390/ijerph2005030012
AMA Style
Al-Ahmady KK. Effect of Organic Loading on Rotating Biological Contactor Efficiency. International Journal of Environmental Research and Public Health. 2005; 2(3):469-477. https://doi.org/10.3390/ijerph2005030012
Chicago/Turabian StyleAl-Ahmady, Kossay K. 2005. "Effect of Organic Loading on Rotating Biological Contactor Efficiency" International Journal of Environmental Research and Public Health 2, no. 3: 469-477. https://doi.org/10.3390/ijerph2005030012