Analysis of Oxygen Transfer Performance on Sub-surface Aeration Systems

Civil Engineering Department, College of Engineering, University of Mosul, Iraq
Int. J. Environ. Res. Public Health 2006, 3(3), 301-308; https://doi.org/10.3390/ijerph2006030037
Submission received: 10 October 2005
/
Accepted: 10 June 2006
/
Published: 30 September 2006
Abstract
:The efficiency of oxygen transfer depends on many factors including the type, size and shape of diffusers and the tank geometry. In this paper, the effect of the depth of water in the tank and, the extension of coverage area of diffusers on each of oxygen transfer capacity (OC), efficiency (E) and, on a percentage of oxygen absorption (δ) is tested. Experimental procedure is adopted to evaluate the effect of these parameters. The results of the study showed that, both the depth of water and the extent of coverage area of diffuser had a significant effect on the tested parameters. The values of oxygen transfer capacity (OC) and efficiency (E) ranged from 18 to 170 grO2/m3. hr and from 2 to 17 grO2/m3air, respectively; depending on the depth of water in tank and the ratio of diffusers coverage area. The percentage of oxygen absorption ranged from 0.45–5.4% depending on the testing conditions. Specific mathematical models to describe the effect of each parameter were also derived. The exponential form of equation proved to be efficient in describing the effect of a depth water on oxygen transfer capacity (OC) whereas; the linear form of equation was good enough in representing the effect of the other parameters.
Introduction
Since introduction of the activated sludge process in the early 1900s, many different types of subsurface or diffused aeration devices have been designed and developed to dissolve oxygen into wastewater. These have ranged from simple individual orifices (holes and slots) drilled in a section of pipe to elaborate devices made up of small diameter particles fused together.
Although, their size, shape, and materials of construction may vary considerably, diffused aeration devices are usually classified as either fine or coarse bubble referring to the relative diameter of the bubble produced. The demarcation between fine and coarse bubbles is not well defined [13, 18].
However, the improvement of the degree of treatment and consideration of nitrification has resulted in increased requirements for aeration system. Supply of oxygen constitutes a major operating cost for biological wastewater treatment systems. Many researchers [1, 7, 9, 16] contend that the potential economical design capabilities of the activated sludge process have not been reached. It has been suggested that oxygen transfer limitations restrict the design of plants beyond the present accepted limits of loading.
Oxygen transfer, the process by which oxygen is transferred from the gaseous to the liquid phase, is a vital part of a number of wastewater treatment processes. The functioning of aerobic processes, such as activated sludge, depends on the availability of sufficient quantities of oxygen. Because of the low solubility of oxygen and the consequent low rate of oxygen transfer, sufficient oxygen to meet the requirements of aerobic waste treatment does not enter water through normal surface air-water interface. To transfer the large quantities of oxygen that are needed, additional interfaces must be formed.
Oxygen can be supplied by means of air or pure oxygen bubbles introduced to the water to create additional gas-water interfaces. In wastewater treatment plants, submerged-bubbles aeration is most frequently accomplished by dispersing air bubbles in the liquid.
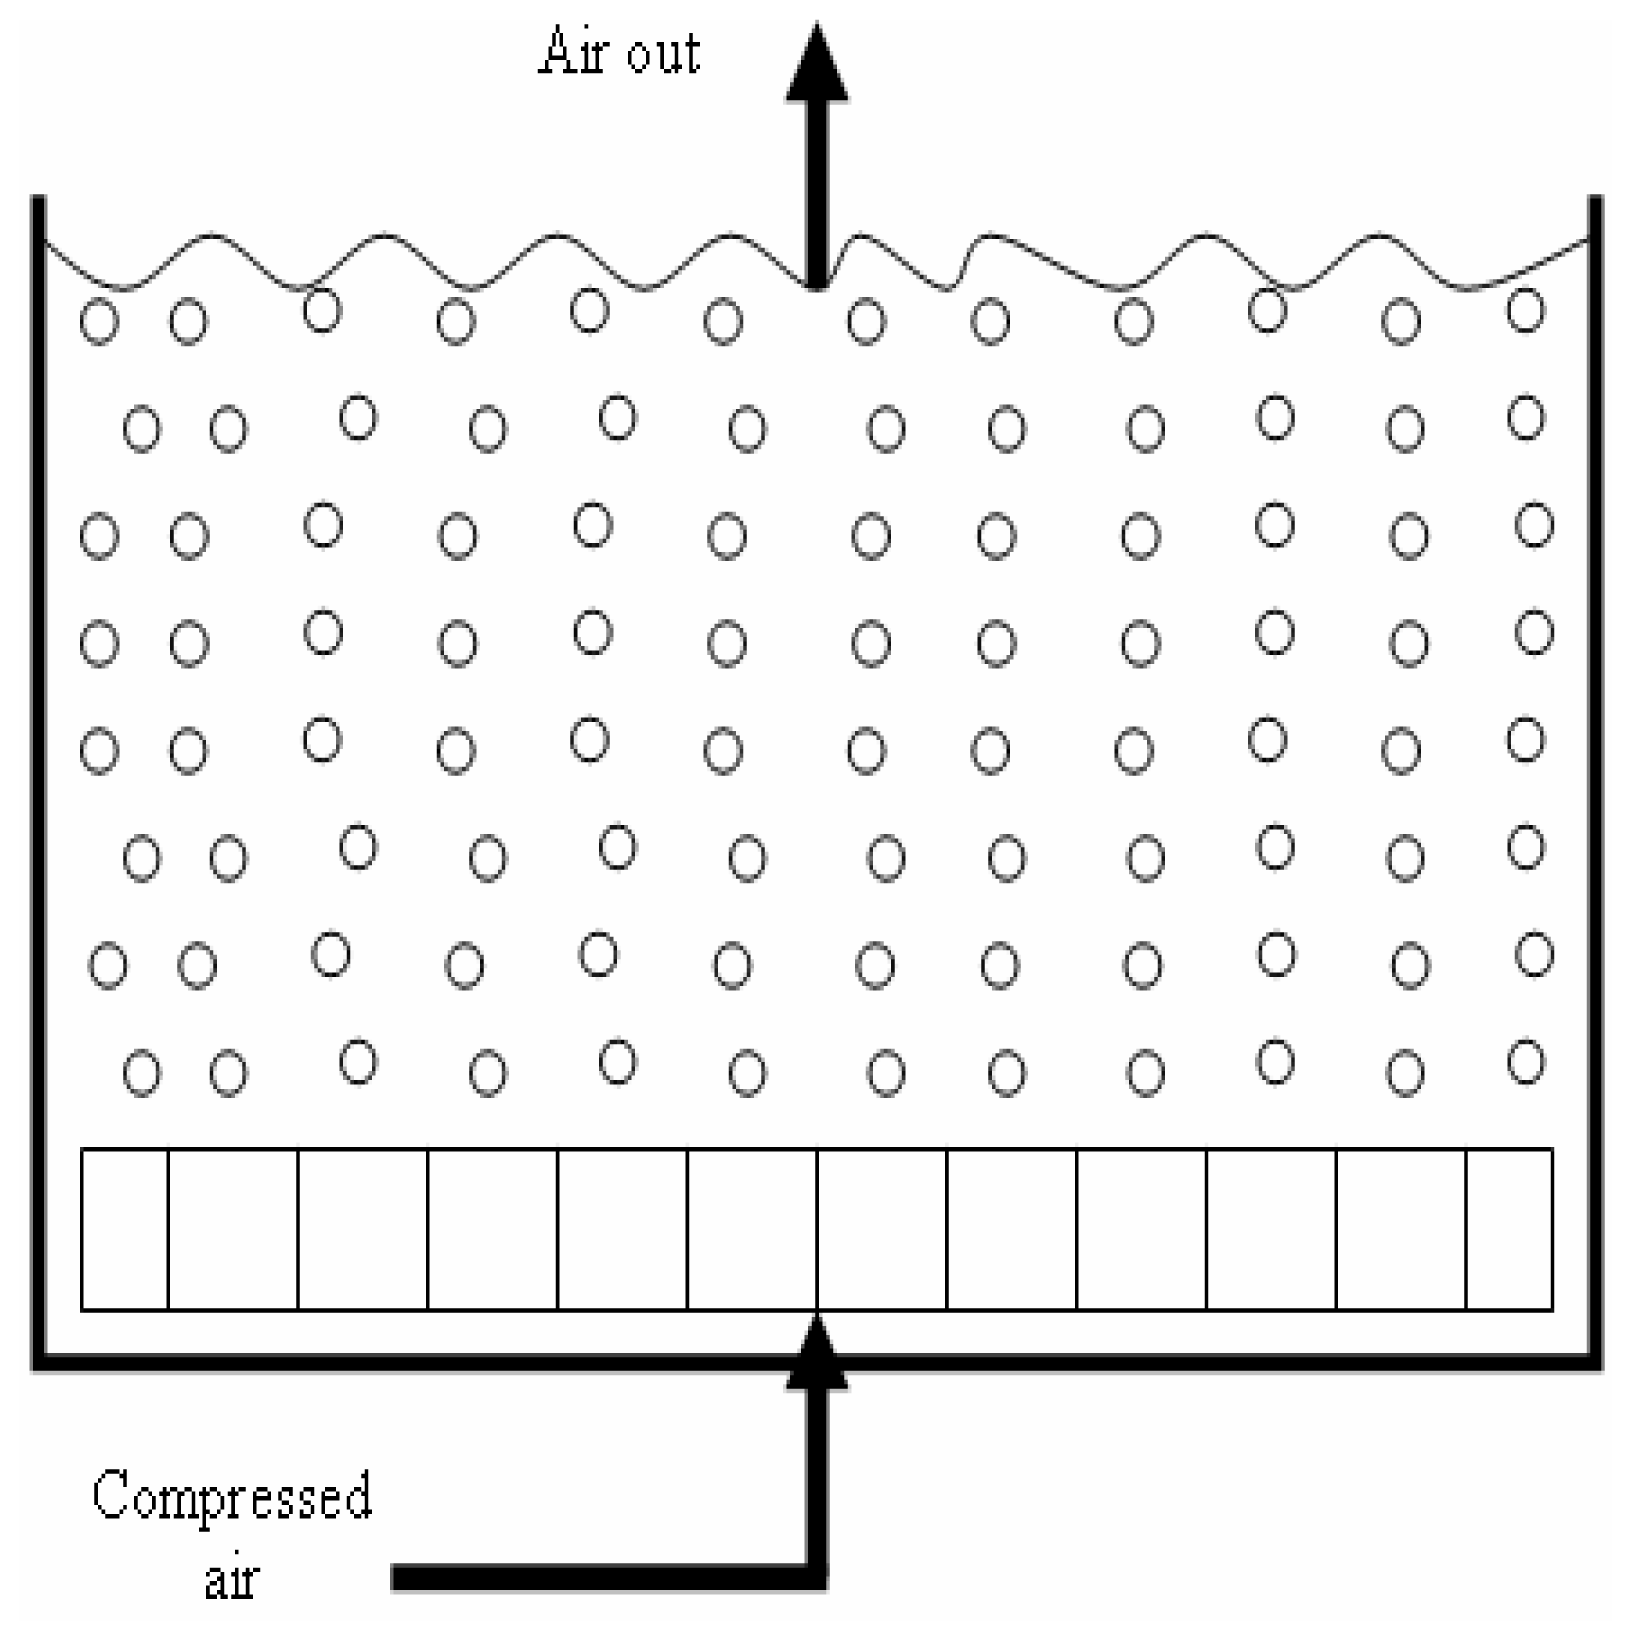
The diffused or bubble aeration process consists of contacting gas bubbles with water for the purpose of transferring gas to the water. The most commonly used diffuser system consists of a matrix of perforated tubes (or membranes) or porous plates arranged near the bottom of the tank to provide maximum gas to water contact (Figure 1). Various types of diffusers and diffuser systems are presented in the Environmental Protection Agency’s technology transfer design manual on aeration systems [4].
For good performance the rate of supply of dissolved oxygen should be equal to the rate of oxygen consumption exerted by the mixed liquor under any given set of circumstances.
In diffused air systems bubbles are distributed from diffusers at the base of the reactor. Oxygen transfer takes place from the rising bubbles to the mixed liquor to supply the oxygen requirements for the biological process.
For a given volume of water being aerated, aeration devices are evaluated on the basis of the quantity of oxygen transferred per unit of air introduced to the water for equivalent conditions.
A number of equipment and operational parameters interact to influence the efficiency and rate of transfer of oxygen such as; tank length, depth and width and aeration size, type and location and, airflow rate.
These parameters determine factors such as bubble size and the degree of turbulence. Conditions in the mixed liquor also have an impact on the transfer; for example, temperature, ionic strength, presence of surface-active compounds, and solids concentration. The rate of oxygen transfer (under the conditions prevailing in an aeration basin) is governed by the liquid phase mass transfer coefficient, kL. Determination of kL poses experimental problems in that knowledge of the interfacial area for mass transfer (At) per unit volume (V) is required. For this reason the rate of transfer for a particular system is usually reflected by the overall mass transfer coefficient, KLa; without attempting to separate the factors KL and (At/V):
Where:
KLa = apparent volumetric oxygen mass transfer coefficient in clean water, hr−1
V = water volume in the tank, m3
A, = interfacial area of mass transfer, m2
The interfacial area per unit volume, m2/m3
Oxygen Transfer Function, Non Steady State Method
There are several methods of experimental determination of mass transfer coefficients. The so-called clean water non-steady state method was selected in this study. The unsteady state test or re-aeration of deoxygenated clean water (re-oxygenation) is presently the most broadly accepted test procedure [9]. The accepted procedure for determining and evaluation the overall oxygen transfer coefficient (KLa) is considered is outlined as follows. The test method involves the removal of dissolved oxygen (DO) from a known volume of water by the addition of sodium sulfite followed by re-oxygenation to near the saturation level. The DO of the water volume is monitored during the re-aeration period by measuring DO concentration at several different points.
The basic equation describing the rate at which oxygen is absorbed by water is:
Where:
dc/dt = transfer rate of oxygen to the water (mg/L.t),
C, = concentration of oxygen in the water at time (t), (mg/L)
Cst = saturation, or equilibrium, concentration of oxygen in water with respect to air in bubble at mean depth, (mg/L)
t = the time,
The difference (Cs, – C,) between saturation value and actual concentration of oxygen (C) in the body of the liquid phase is usually called oxygen deficit. The oxygen transfer rate is determined by integrating of this equation.
From equation (3), the initial oxygen uptake rate at Ct = 0, is:
Where:
OC = the oxygen transfer capacity of the system, (grO2/m3 water.hr)
The fraction of oxygen transferred to the water due to pass one-meter cubic of air is expressed as oxygenation efficiency (E) of the diffuser system, which can be written as:
Where:
H = the liquid depth in the tank in meters.
/ = the aeration intensity, or volumetric air flux per unit area of tank surface.
If the oxygen concentrations are measured in mg/L, and the time interval to determine KLa is expressed in hours, dc/dt in equation (4) gives the oxygen uptake rate in mg/L at 0 mg/L dissolved oxygen (DO) concentration in the test water. By multiplying this value by the quantity of water aerated, the mass oxygen uptake rate is obtained, and oxygen absorption (δ) is determined by:
The fraction of oxygen transferred from the air into water, δ, at the moment when the dissolved oxygen equal to Ct can be found from the following relationship:
Where:
j = constant = 298; (the amount of oxygen in gram/m3 of air T = 20°C and normal atmospheric pressure),
V = the aeration tank liquid volume, m3
AT= the aeration tank surface area, m2.
The saturation values for oxygen in water at equilibrium with normal atmosphere standard with water vapor (CSO)760 are available in standard tables [2, 9]. Theses values must be corrected for actual test pressure conditions, which vary from atmospheric at the water surface to atmospheric plus the depth of water at the tank bottom.
Because the value of KLa thus determined relates to the test water temperature, it must be corrected to standard conditions (20°C) by the relationship:
Where:
(KLa)20= value of KLa at 20°C,
(KLa)T— value of KLa at test water temperature, and
T = test water temperature, °C.
Research Objectives
This research aims to achieve the following objectives: To determine the effect of water depth in the tank on each of oxygen transfer capacity (OC), efficiency (E), and on the percentage of oxygen absorption (δ) of subsurface aeration systems; and to determine the effect of coverage area of diffusers on each of oxygen transfer capacity (OC), efficiency (E), and on the percentage of oxygen absorption (δ) of subsurface aeration systems.
Experimental Work
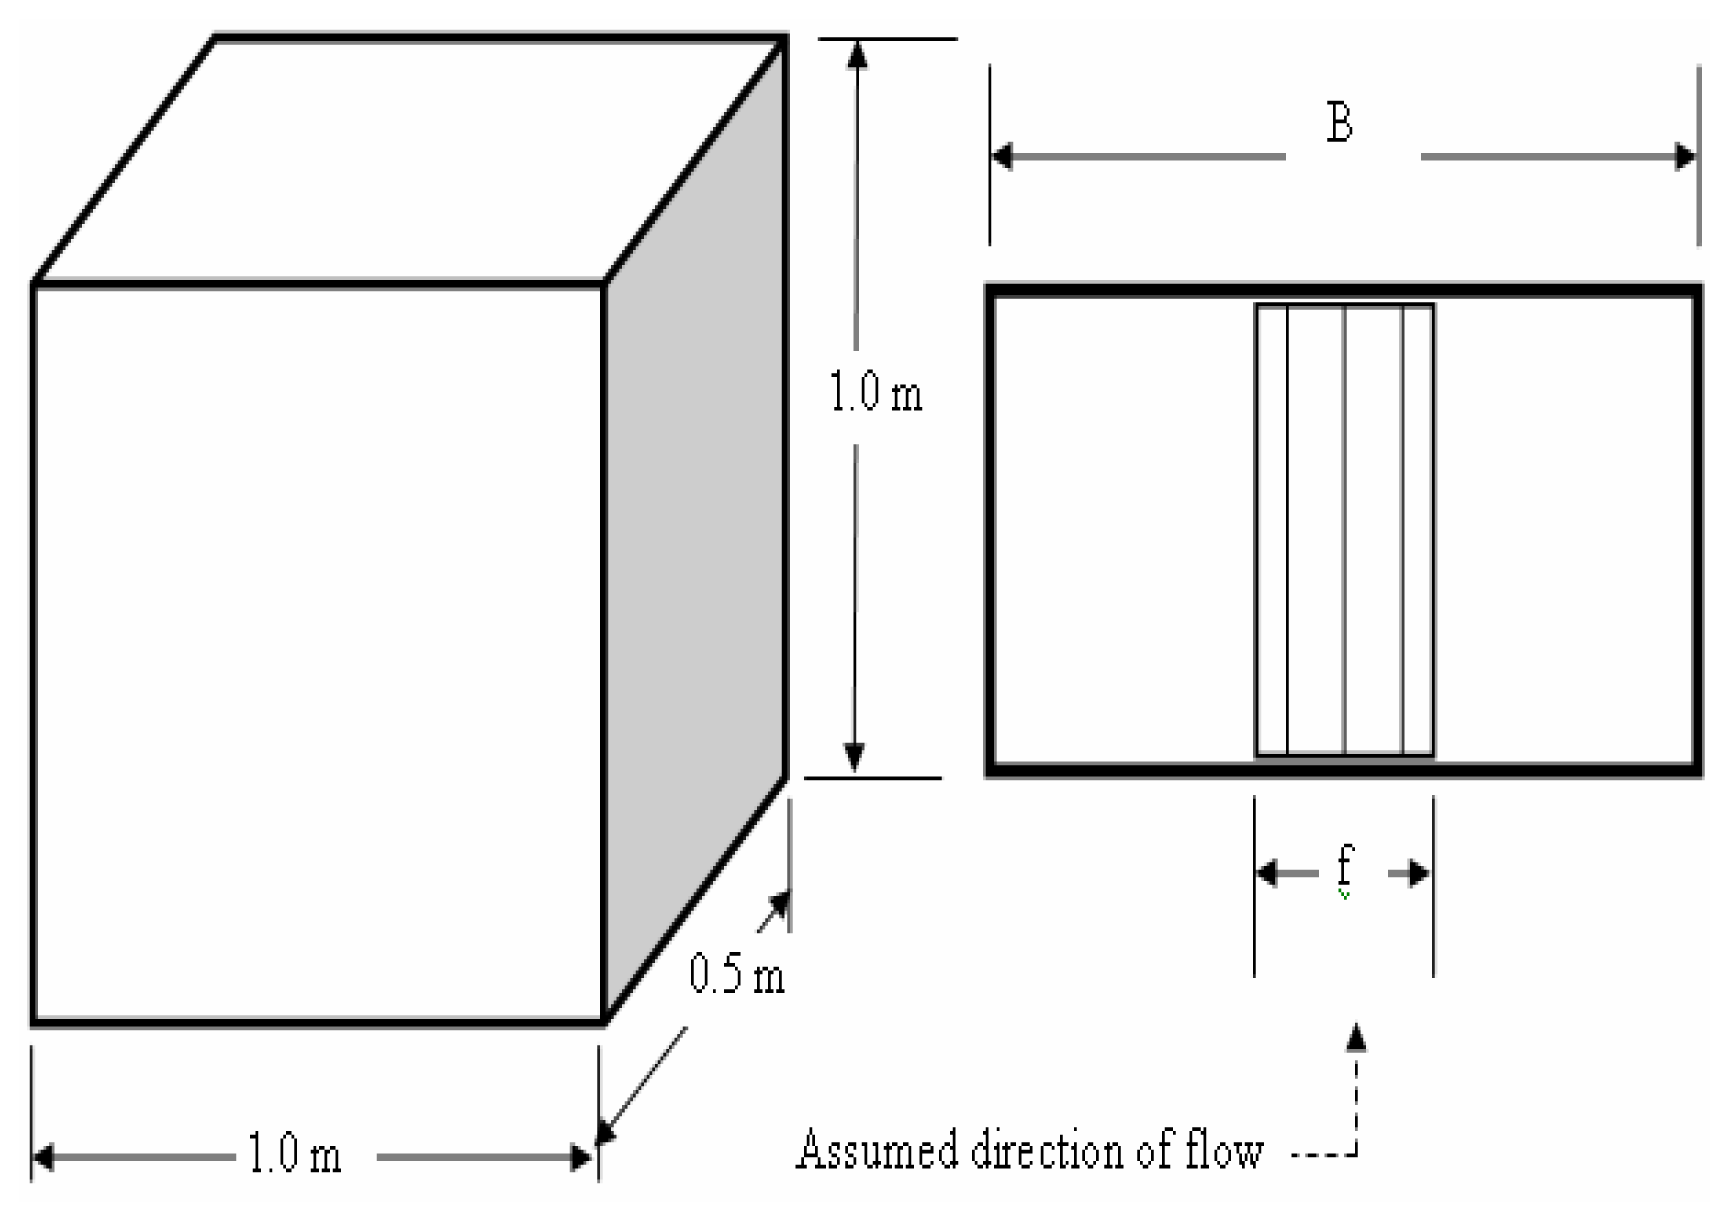
Oxygen transfer efficiency information ordinary obtained by using laboratory (bench-scale) apparatus [4]. All tests reported herein were carried out by using two laboratory scale tanks (0.55m × 0.35m × 0.38 m) and (0.5m × 1.0m × 1.0 m), (Length × Width × Depth) see figure (2), which were operated on the batch mode.
The experiment program was divided into four groups. In each group, the effect of side of water depth (H), on the studied parameters at a given (f/B) ratio was investigated (f: total width of diffuser band, B: width of the tank), see figure 2. Four different ratios were studied during these tests. These ratios were (25%, 50%, 75% and 100%).
The oxygen transfer tests were conducted using potable water obtained from the distribution system. The normal procedure described in an ASCE standard [1, 19] recommended to conduct oxygen transfer tests with tap water rather than wastewater. Many authors [4, 9, 19] have demonstrated the necessity of this to obtain consistency and comparability of results. To introduce the effect of wastewater on the results obtained from this procedure, the following equation for admixtures correction factor is usually used [7]:
Where:
KLa= oxygen transfer coefficient for the specific admixture.
α = the admixtures correction factor
In table (1), the values of correction factor for some types of wastewater are represented. Within the tank, the diffusers were placed, close to the bottom in that arrangement so that the longitudinal placement of diffusers is achieved (see figure 3). Many authors have shown that, the longitudinal placement of diffusers is clearly superior to other arrangements with respect to oxygen transfer efficiency [8, 10].
Prior to each group of runs, the tanks were drained, cleaned and filled with clean water to avoid salt accumulation [13]. Each run was carried out at a given (f/B) ratio and submergence of diffusers.
At each run, the following measuring procedure was adopted: DO depletion with sodium sulfite in the presence of a cobalt catalyst, measurement of DO concentration versus time of aeration, and determination of water temperature and air pressure.
The sodium sulfite (Na2SO3) was added to the tanks as a slurry. The total amount of (Na2SO3) required per run were calculated based on the theoretically demand of (Na2SO3) (7.9 ppm are required to remove 1 ppm dissolved oxygen) [1]. Depending on the dissolved oxygen concentration in the test water, the approximate (Na2SO3) requirements were estimated. 10–30% excess sodium sulfite was used each run [9]. The sodium sulfite was maintained in suspension by mixing. Cobalt was added to the tank as cobalt chloride (CoCl2.6H2O) at the beginning of each test. Sufficient cobalt chloride was added to provide a minimum Co+2 concentration of 1.5 ppm [13].
Dissolved oxygen determinations were made on samples collected near the side of basin. Because of the small volume of basin, one sample location was assumed to be representative of the total basin volume [4], In some runs, the readings were conducted with another positions but no difference was noted. The dissolved oxygen concentrations of the samples were determined using a dissolved oxygen meter type (EXTECH; model 407510) with stirrer. The probe was calibrated immediately before and after each run, using modified Winkler dissolved oxygen titration procedure [4], Periodic calibration checks were made during the run using distilled water samples of known DO concentrations. Water temperatures were measured before and after each test, and the average values were used in data analysis. It was not possible to conduct all tests at 20°C [9]; therefore, the values of KLa obtained had to be adjusted to the standard temperature of 20C according to equation (8). The air flowrate was measured with a pre-calibrated gauge. In figure 4, some results of the experimental work were represented.
The major shortage in these tests is that they were carried out in small scale so, their results mainly limits by the test circumstances. Accordingly, in this paper a number of points from published paper were also collected [3, 6, 7, 11–14, 16–18]. The points were selected from plants which have a scale larger than that adopted by the experimental work, (Depth of water in these plants range from 1.4 to 6.0 m, f/B ratio from 12.5 % to 100 %). After separation, all data were treated and combined with the experimental points in order to expand the applicability of the results. Individual mathematical models to describe the effect of each parameter were also derived.
Results and Discussions
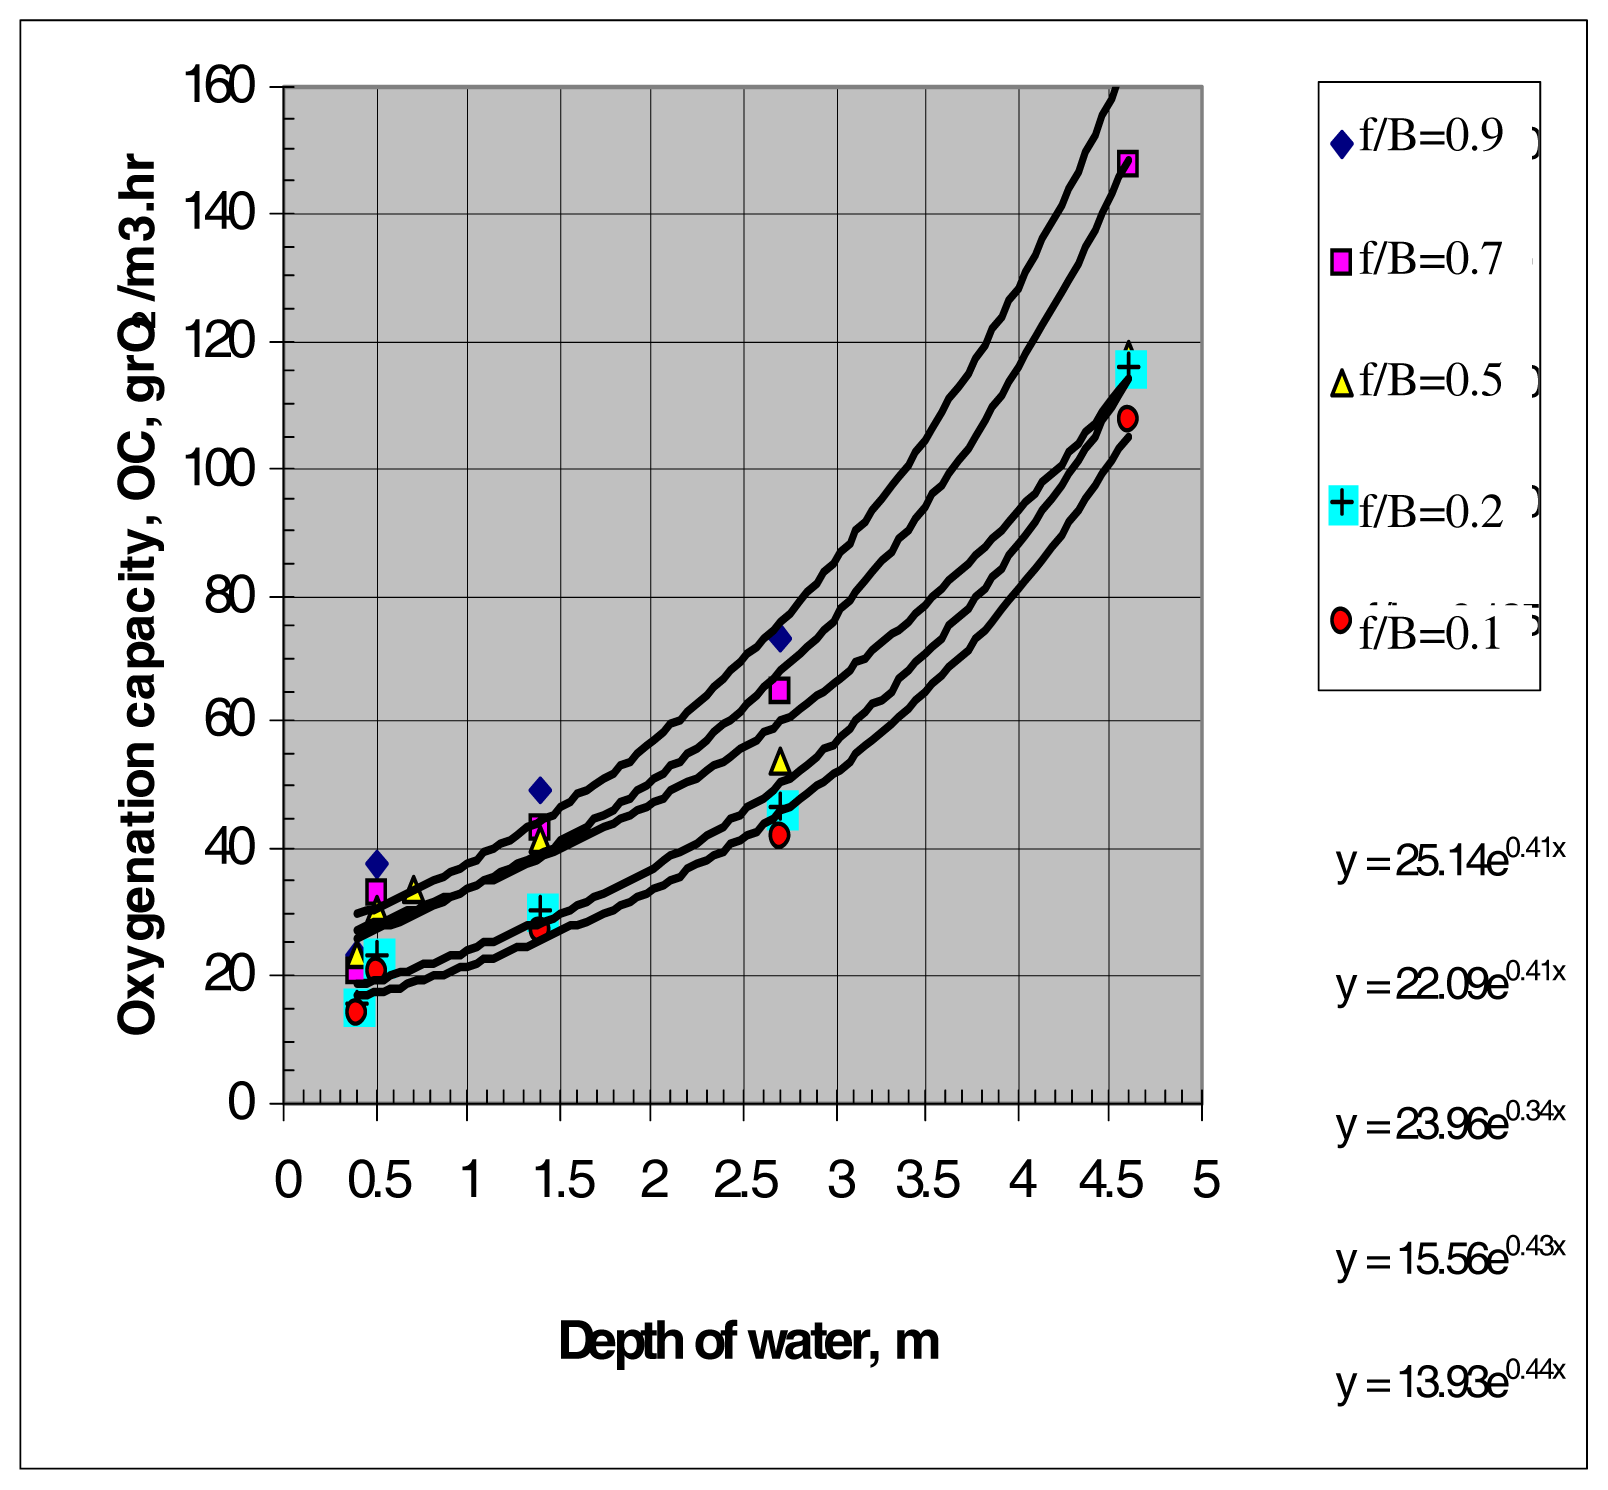
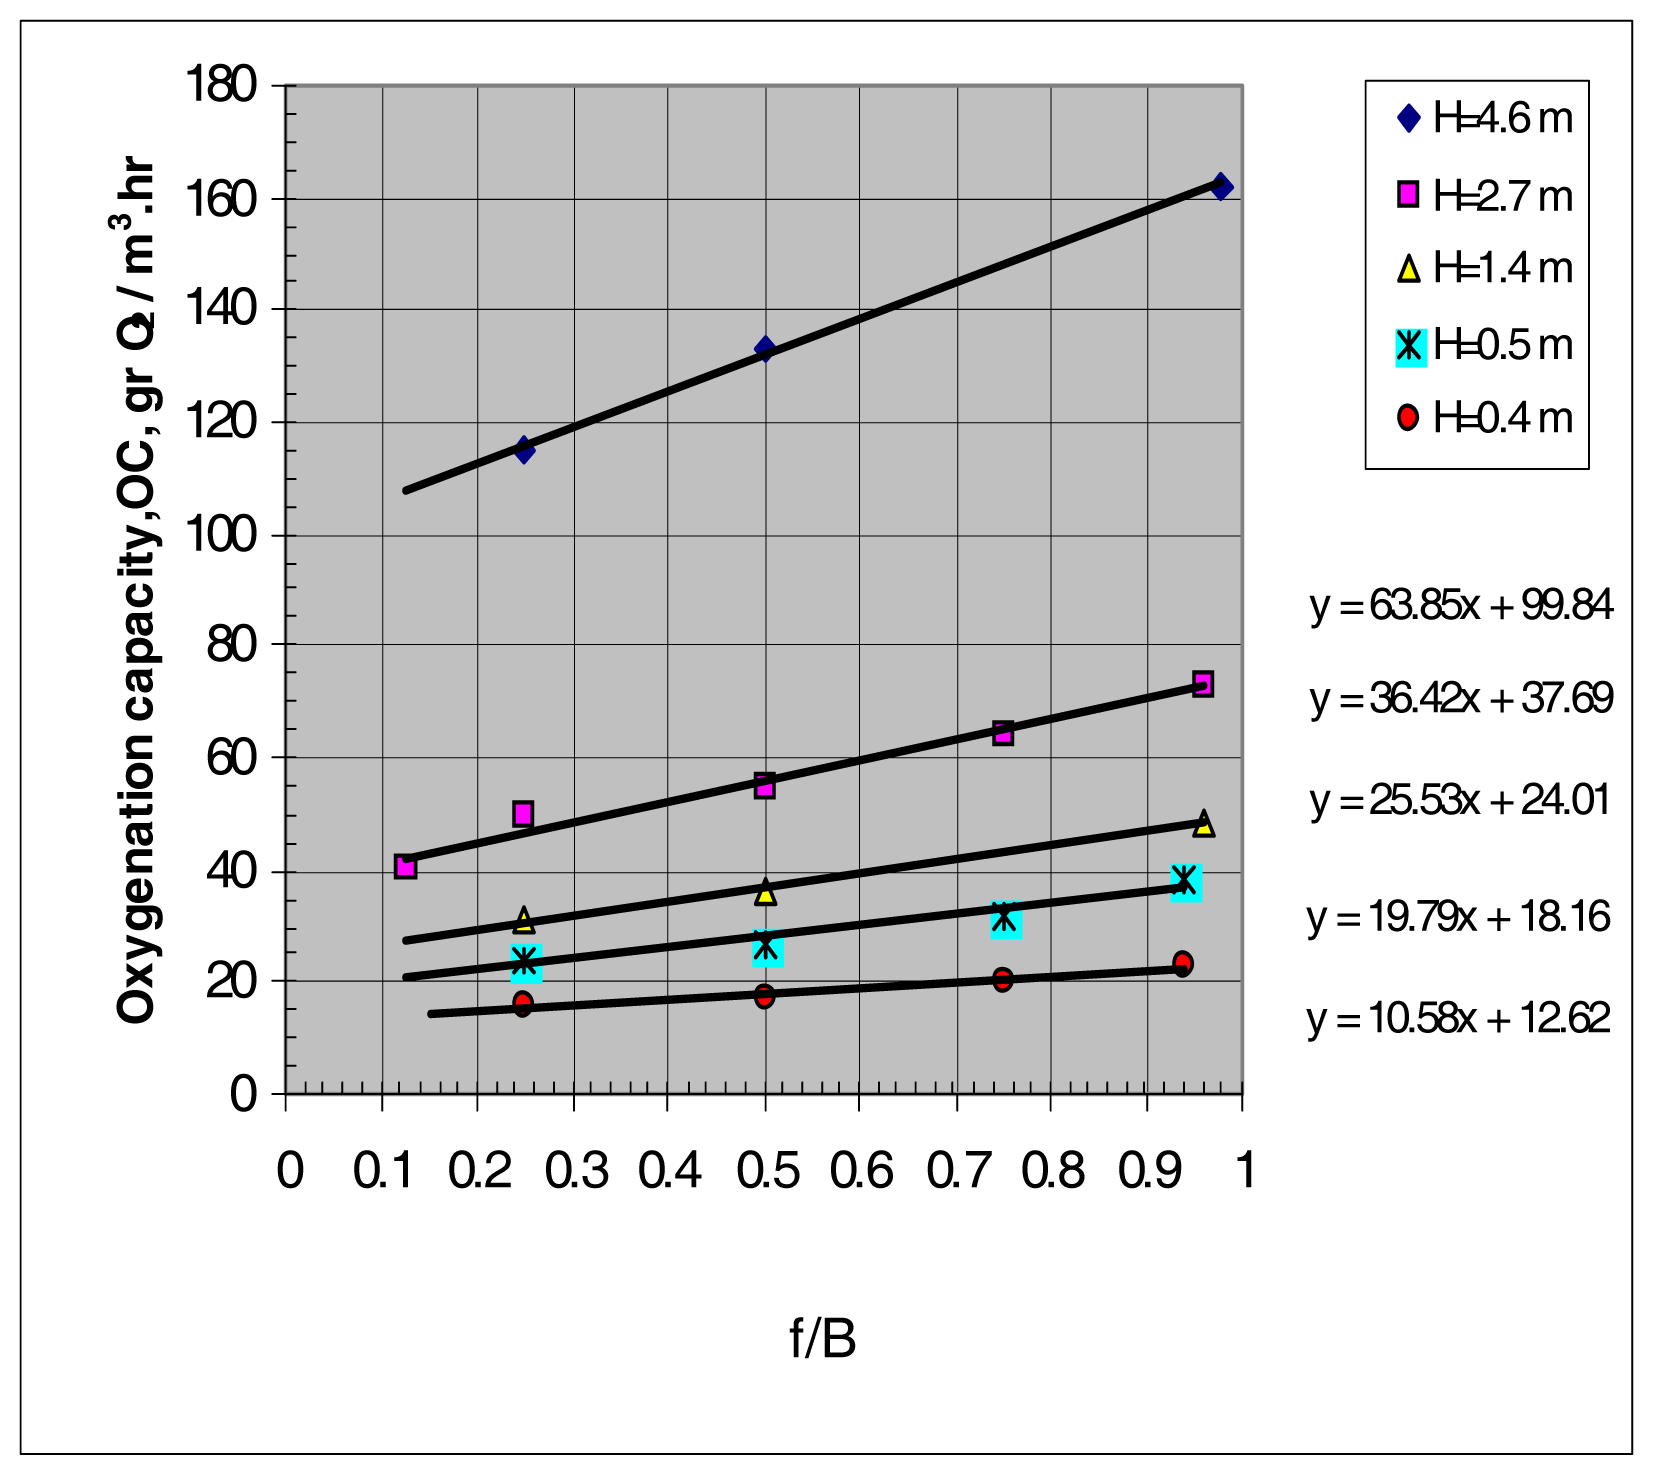
Diffuser oxygen transfer capacity (OC) was plotted in two ways. Figure 5 shows the capacity as a function of depth of water in the tank, while figure 6 shows the capacity as a function of diffuser wide band.
Figure 5 indicated that, if the airflow rate is kept constant, oxygen transfer capacity (OC) is directly proportional to submergence. At 0.5 m submerges, the oxygenation capacity is ranging within a narrow limit between 18–34 grO2/m3water.hr depending on the (f/B) ratios. With increasing the depth, the oxygenation capacity is increased to about 160 grO2/m3water.hr at the 4.6 m submerges. As shown in this figure, at low depth of water, the effect of (f/B) ratio on the oxygenating capacity is decreases. This phenomenon is shown more clearly in figure 6, which reflects the effect of (f/B) ratio on the oxygen transfer capacity of the system. As shown in the figure, at 0.4 m submergence, an increasing of the wide span of diffusers four times (from 0.25 to 0.95) will add to the oxygenation capacity (OC) of the system only by 7.3 grO2/m3water.hr whereas at 4.6 m this duplicate improved the oxygenation capacity of the system by 45 grO2/m3water.hr. The reason behind such behavior is the difference in depth of water in the tank.
However, the effect of increase in the depth of water on the oxygenation capacity (OC) can be explained by the mechanism of exchange of the oxygen from the gas to liquid. During this phase, the transfer is occurring by the processes of bubble formation, release, and ascension. This rate of oxygen transfer is dependent on the relative rate of ascent, bubble size, partial pressure of oxygen, temperature, and driving force (the difference between the liquid–film oxygen concentrations in equilibrium with the gas bubble and the bulk-liquid dissolved oxygen content) [8]. Additionally, the oxygen transfer is influenced by the dispersion and coalescence characteristics produced through turbulent recirculation patterns existing in the basin [10].
With increasing the depth of water in the tank, one of these parameters such as the time is affected. The major effect is caused due to the elongation of the path of bubbles in the tank. Since the ascension speed of bubbles is approximately constant then, a general increasing in depth of water will increase bubble residence time in the tank, which accordingly results in a longer time of bubble-water contact.
Another effect of increasing the path of bubbles in the tank is specified by its ability to decrease the diameter of the bubbles, as the result of both of absorption and break up processes in bulk solution, which consequently will increases the oxygen transfer capacity of the system. Similar results also recorded by [6, 7, and, 13].
Although increasing the depth of water effects on hydrostatic characteristics of the system, expand the spacing of diffusers effect on other direction i.e. the hydrodynamic characteristics of bulk solution and its movement in the tank. When the diffusers are spaced uniformly across the entire tank bottom, the bubble velocity is reduced to its terminal velocity [1]. This increases the detention time of air bubbles in the tank and therefore the oxygen absorption increases.
The second impact of install the diffuser to coverage a total floor may result due to enhance the agitation and mixing degree in the tank, which ultimately leads to further break up of large bubbles and to increase the transfer efficiency. However, some researcher noted that, the total floor layout of diffuser will produce a higher oxygen transfer efficiency, whereas the placement of diffuser in a specific position (spiral roll pattern) will produce more effective bulk mixing of the mixed liquor [4].
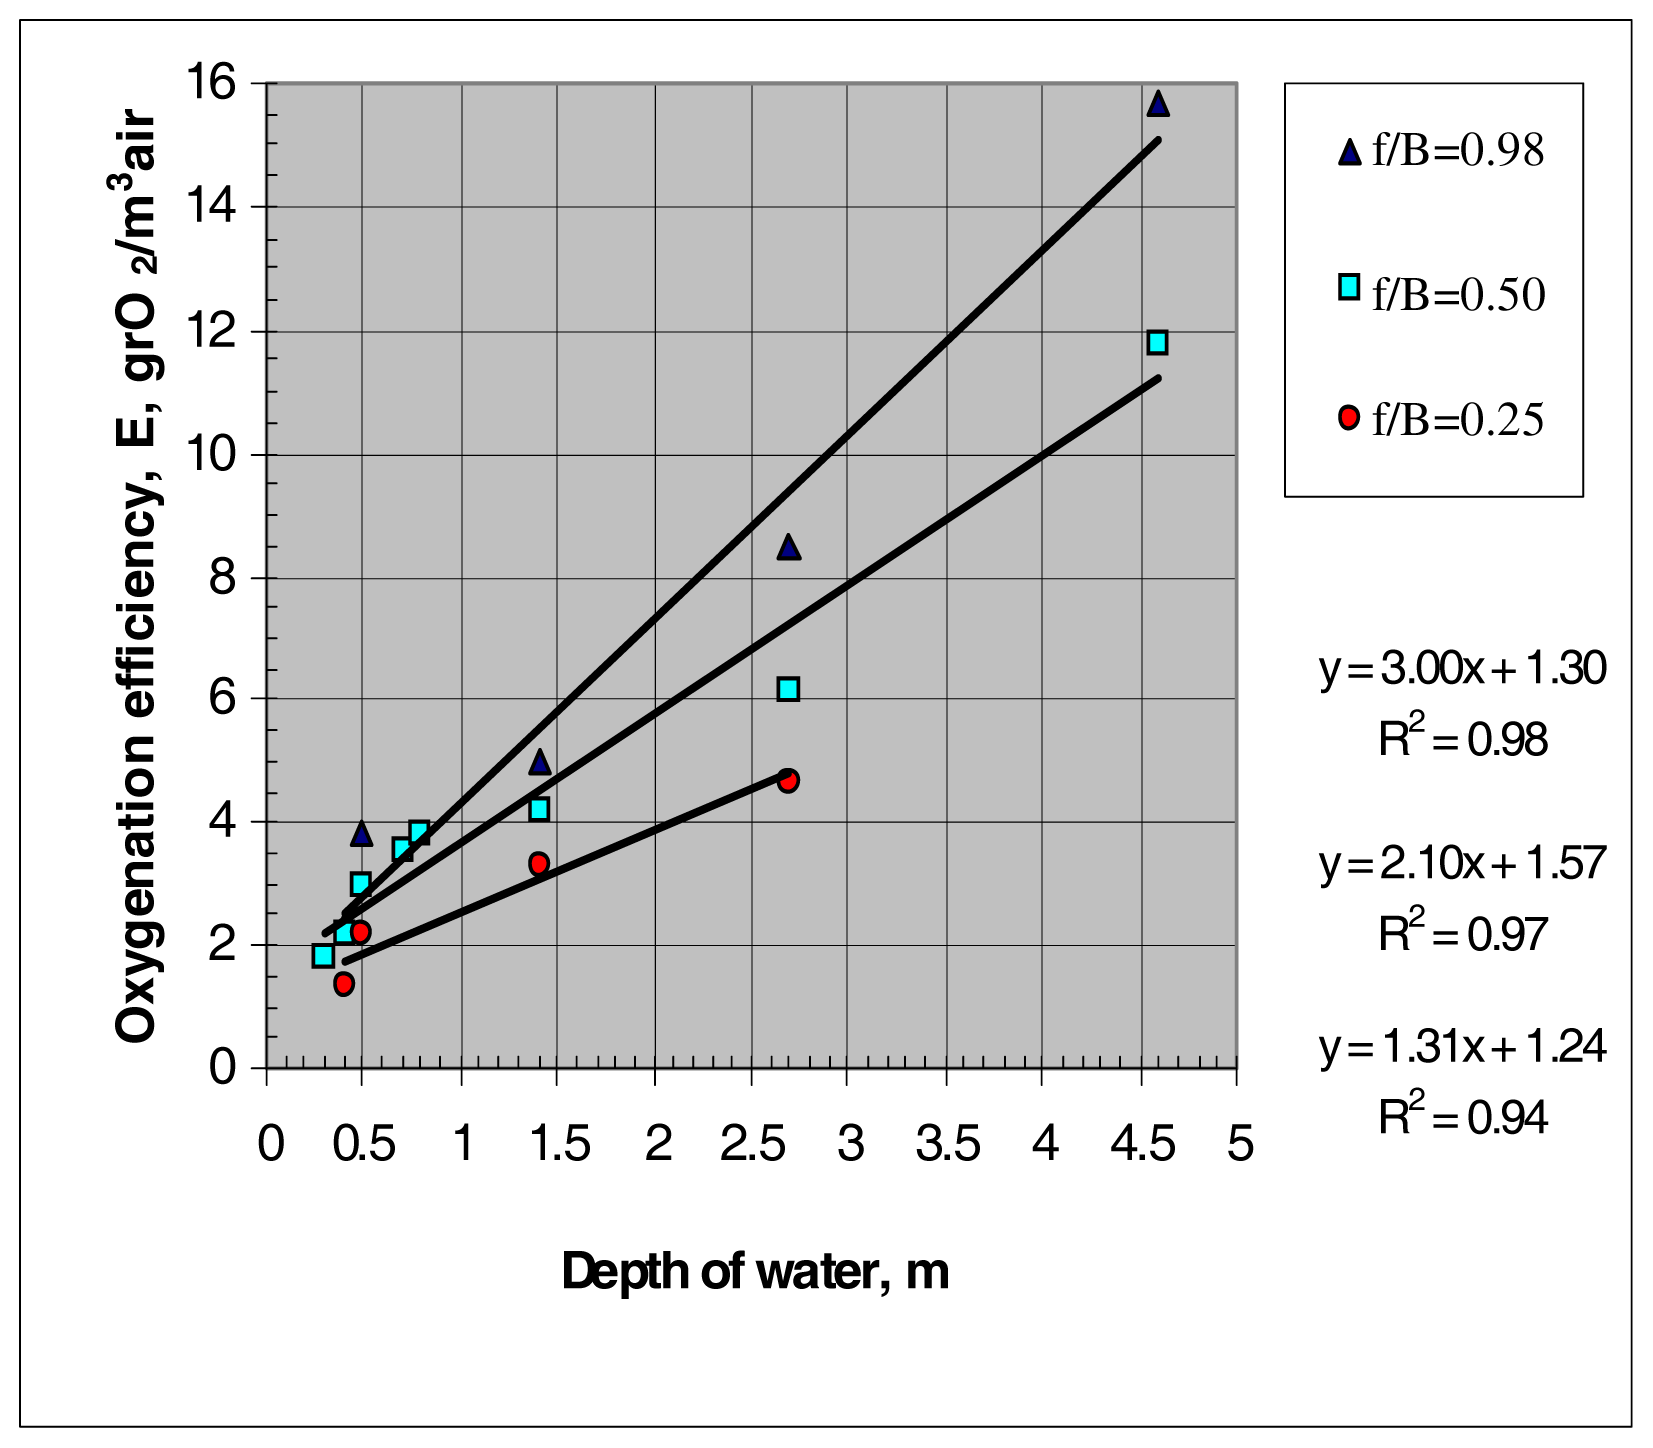
In figure 7, the oxygen transfer efficiency (E) is drawn as a function of water depth in the tank at different (f/B) ratios. As shown in the figure, increasing depth of water in the tank significantly will increase the oxygenation efficiency (E) i.e., amount of oxygen transferred by the one meter of air. At the small depth of water (H = 0.4 m), the oxygenation efficiency (E) of the system is low at all (f/B) and not more than 3. With increasing the depth, the factor is increased gradually to reach to about 16 at a depth of 4.6 m and f/B ratio equal to 0.98.
As shown in the figure, equations that control this relationship are linear. Very good correlation which represented by the high (R2) values is achieved. However, the relation can be explained by the effect of the increasing water depth on the actual oxygen transfer capacity. At higher depth of water, longer pattern of bubbles will achieve, which consequently will increase its absorption capacity in bulk solution. Some researchers [13, 14] also recorded similar results.
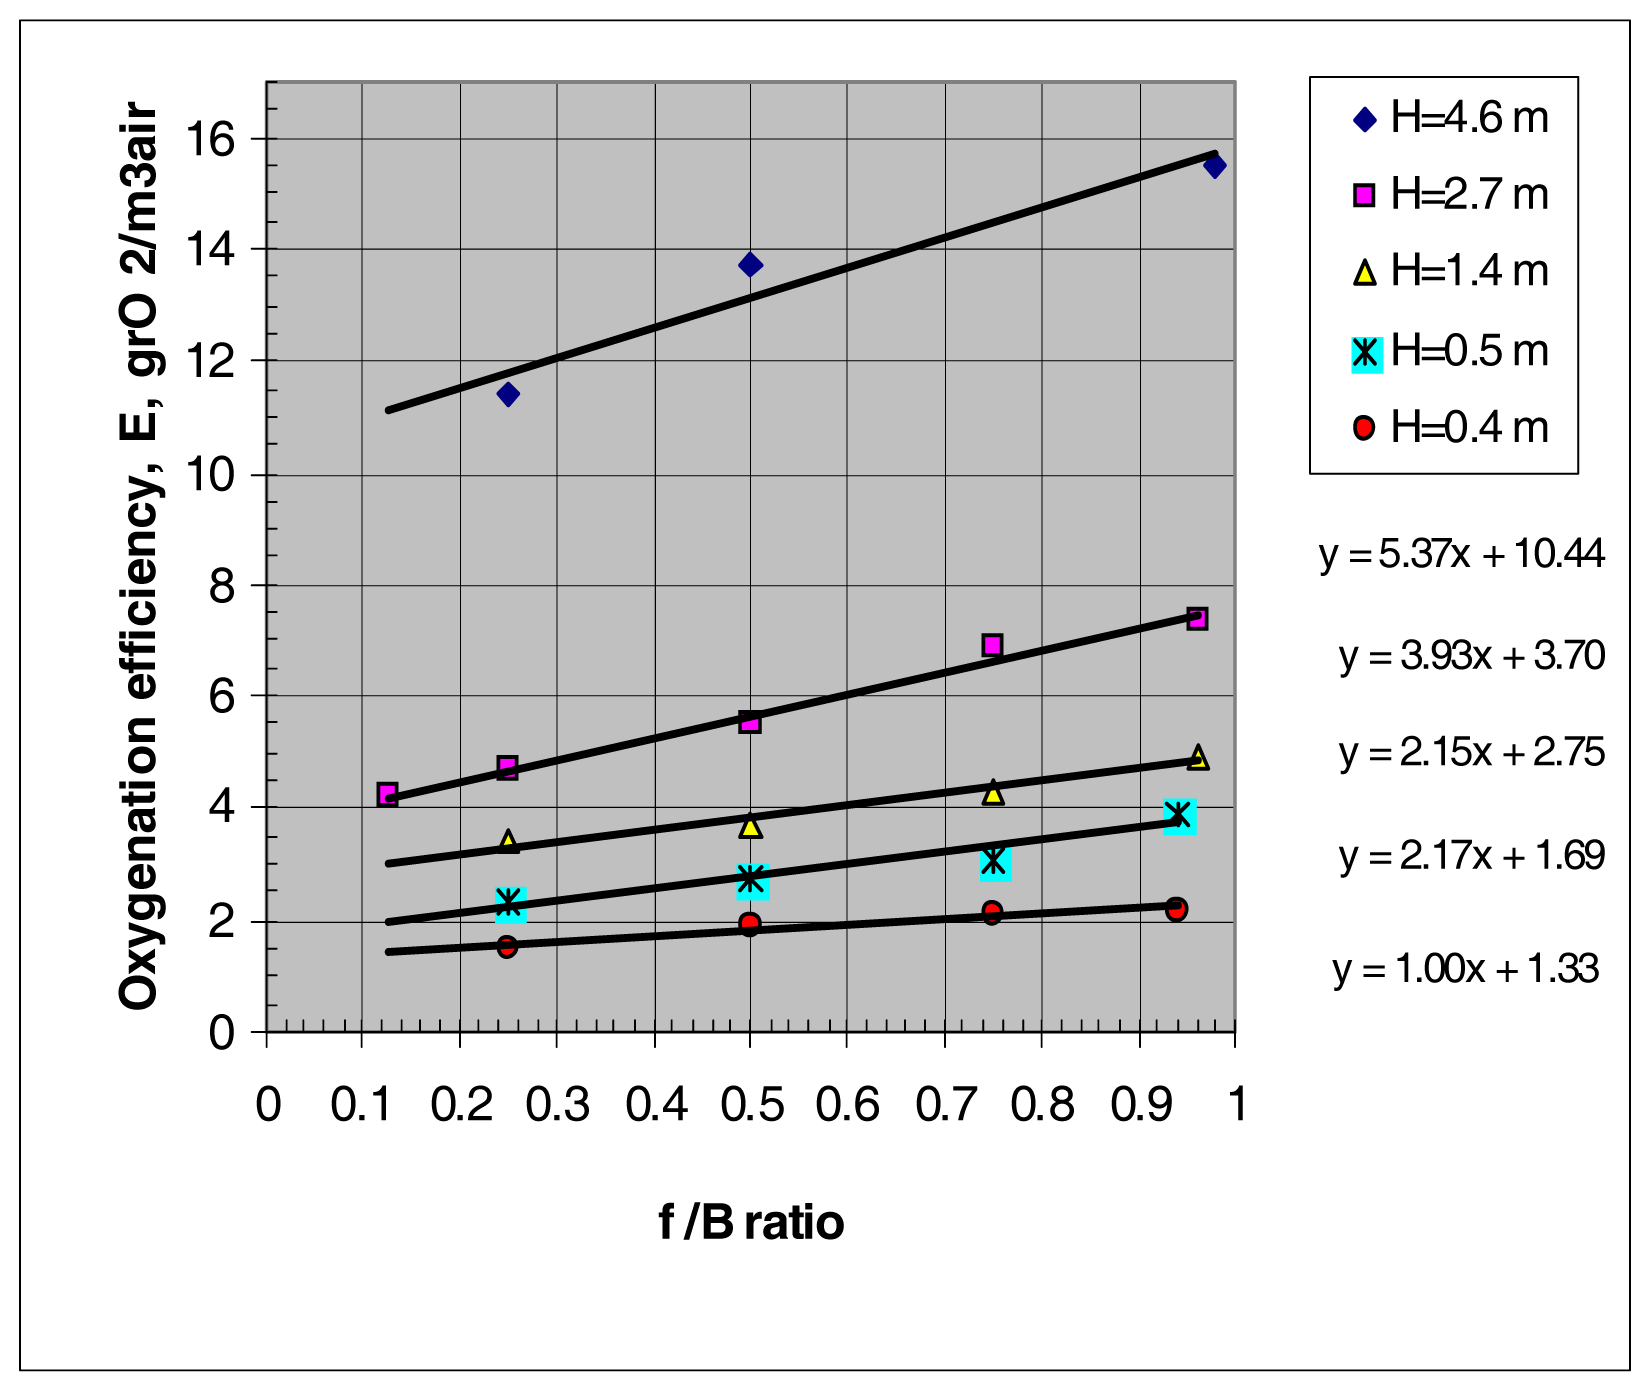
In figure 8, the oxygen transfer efficiency (E) was plotted as a function of (f/B) ratio at different depths of water. As expected, this factor has positive effects on oxygen transfer efficiency. Its effect is similar to its effect on oxygen transfer capacity.
If the airflow rate and the depth of water are kept constant, the oxygen transfer efficiency (E) is directly proportional to the coverage ratio of diffuser. At (f/B = 0.25) and depth of water of 0.5 m the aeration efficiency of the diffuser is about 2.5 whereas this value is increased about 4 at the same depth if the (f/B) ratio is increased to 0.95. However, the results of these curves comply with the normal values of the diffused aeration systems. Some researchers showed that the standard oxygen transfer ranged from 3.9 to 17.1 percent depending on the type of diffusion unit, its placement, and the tankage configuration [1].
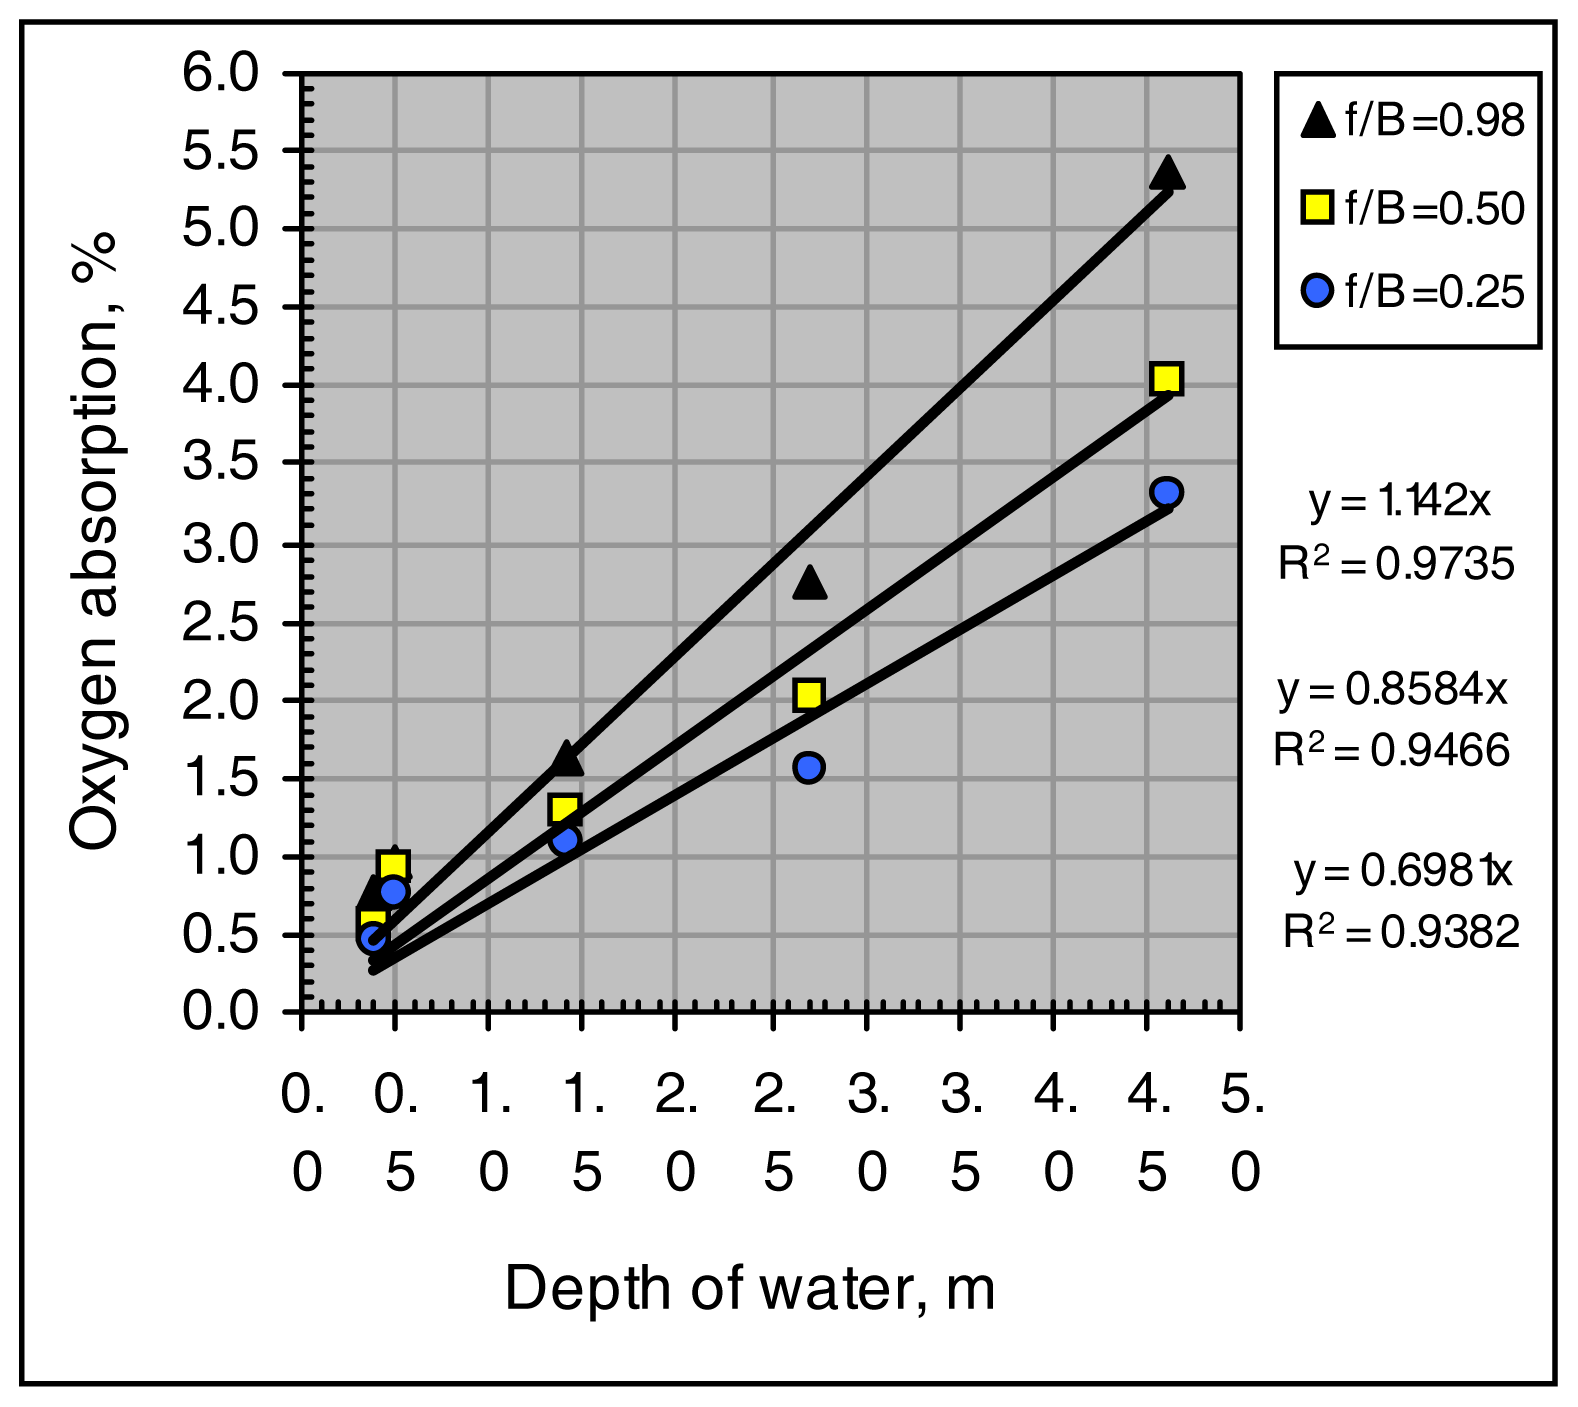
In figure 9, the percentage of oxygen absorption is drawn as a function of depth of water in the tank at different (f/B) ratios. As shown in the figure, the equations that control this relationship are linear. At constant airflow rate, increasing both of depth of water and (f/B) ratio significantly increasing the amount of oxygen transferred, i.e. percent of oxygen absorption. At water depth equal to 0.4 m and (f/B) ratio of 0.25, the percentage of absorption is about 5%, with increasing the (f/B) ratio to 0.98 and at fixed water depth, the ratio is increased to about 14%. As noted in the figure, the depth of water plays considerable role on percent of oxygen absorption of diffused aeration system. If the (f/B) still constant, increasing the depth of water from 1.0 to 4.0 m will increase the percentage value from 15% to 40%. However, the effect of these parameters on the percentage value is expected, since they enlarge the amount of both of the oxygen transfer capacity (OC) and efficiency (E).
In the design point of stand, figures 5 and 6 can be used to select the optimum option with respect to depth of water in the tank and the coverage area of diffuser system. Typically, influent and effluent BOD are known or assumed, and, after selection of aeration tank loadings, the oxygen transfer per day per unit volume of aeration tank become fixed and may be readily determined or estimated. These figures can be used directly in determining the most suitable depth of water in thank as well as the optimum (f/B) ratio.
Figures 7 and 8 are very important in the design process since they give the efficiency (E) of the diffused aeration at a wide range of operation conditions. This value is provides the required bridge to calculate the actual volume of the selected aeration device used depending on the calculations of essential net oxygen.
Figure 9 gave the percentage of total oxygen that will be transferred to the bulk solution at a given condition. This value is extremely important and required in the step of design check or when required to study an existing treatment plants
Conclusions
- At a fixed airflow rate, increasing the level of water depth in the tank significantly increase each of oxygen transfer capacity (OC), efficiency (E) and, the percentage of oxygen absorption (δ) in the system. This effect can be explained by the influence of elongation the bubbles paths which lead to increase its detention time in the tank.
- Enlarging the diffusers coverage area in the tank will increase each of oxygen transfer capacity (OC), efficiency (E) and, the percentage of oxygen absorption (δ) because it establishes the bubble circulation and mixing pattern produced within the tank.
- The exponentional form of equation proved to be efficient in expressing the relationship between the depth of water and the oxygen transfer capacity at different (f/B) ratios. At a depth of and (f/B) ratio equal to 0.4m and 0.98 respectively, the oxygen transfer capacity (OC) was 30 grO2/m3tank.hr. Increasing the depth of water in the tank to 4.6m with a fix of (f/B) ratio raise the oxygen transfer capacity (OC) of the system to about 170 grO2/m3 tank.hr.
- The equation that controls the relationship between ratio of diffuser coverage area (f/B) and oxygen transfer capacity (OC) is linear. The slopes of the equations are varying depending on the level of water in the tank. At a depth of water equal to 2.7 and (f/B) equal to 0.25 m, the value oxygen transfer capacity was 50 grO2/m3tank.hr whereas; the capacity is increased to 75 grO2/m3tank.hr if the (f/B) increased to 0.98.
- The linear form of equation is efficient in expressing the relationship between both of depth of water and diffuser coverage area (f/B) with oxygen transfer efficiency (E) of the diffused aeration system. However, the value of oxygen transfer efficiency of the system ranged between 2–17 grO2/m3.air depending on the depth of water in the tank and the coverage area of diffusers.
- The percentage of oxygen absorption (δ) is affected by the variation of the level of water in the tank and, the coverage area of diffusers. During the test, this percentage ranged between 0.45 – 5.4 % depending on testing conditions.
Figure 1.
Schematic of diffused air aeration system

Figure 2.
Tanks used in the experiments (one tank is shown)

Figure 3.
Two types of diffusers placement. (A): transverse arrangement. (B): longitudinal arrangement
Figure 3.
Two types of diffusers placement. (A): transverse arrangement. (B): longitudinal arrangement

Figure 4.
Sample of the experimental results showing the variation of log (Cst – Ct) over time at various water depths.
Figure 4.
Sample of the experimental results showing the variation of log (Cst – Ct) over time at various water depths.

Figure 5.
Effect of depth of water on the oxygen transfer capacity (OC) of the system air at constant air flow rate.
Figure 5.
Effect of depth of water on the oxygen transfer capacity (OC) of the system air at constant air flow rate.

Figure 6.
Effect of (f/B) ratios on the oxygen transfer capacity (OC) of the system at constant air flow rate.
Figure 6.
Effect of (f/B) ratios on the oxygen transfer capacity (OC) of the system at constant air flow rate.

Figure 7.
Effect of water depth level (h) on oxygenation efficiency (E) at constant air flow rate.

Figure 8.
Effect of (f/B) ratio on oxygenation efficiency (E) of the system at constant air flow rate.
Figure 8.
Effect of (f/B) ratio on oxygenation efficiency (E) of the system at constant air flow rate.

Figure 9.
Effect level of depth of water (h) on oxygen absorption (δ) at constant air flow rate.


Table 1.
Values of the correction factor for some types of wastewater [15]
| Type of Wastewater | α - factor |
|---|---|
| Domestic wastewater | 0.85 |
| Dairy wastewater | 0.82 |
| Wastewater from chemicals industries | 0.7 |
| Pulp and paper industry wastewater | 0.7 |
| Wastewater from acidic industries | 0.5 |
References
- American Society of Civil Engineering, Wastewater Treatment Plant Design. In WPCF Manual of Practice No. 8, ASCE Manual on Engineering Practice No. 36Lancaster Press, Inc.: Lancaster, Pa., USA, Third edition; 1991; Volume Chapter 14, Activated Sludge.
- American Water Works Association, Water Quality and Treatment. In A Handbook of Community Water SuppliesMcGraw-Hill Handbooks: USA, Fifth edition; 2000; Volume Chapter 5, Air Stripping and Aeration.
- Boyle, W. C.; Craven, A.; Danely, W.; Riech, M. Oxygen Transfer Studies at the Madison Metropolitan Sewerage District Facilities; Risk Reduction Engineering Laboratory, Office of research and Division: US. EPA, Cincinnati, Ohio, 45268, 1996. [Google Scholar]
- Center of Research and Development, Design Manual: Fine Pore Aeration Systems; Risk Reduction Engineering Laboratory, US. EPA: Cincinnati, Ohio, 45268, 1989.
- Groves, K. P.; et al. Evaluation of Oxygen Transfer Efficiency and Alpha Factor on a Variety of Diffused Aeration Systems. Water Environmental Research 1992, 64(5). [Google Scholar]
- Khudenko, B. M.; Shprit, E. A. Wastewater Aeration; Publishing House Stroyizdat: Moscow, 1973; In Russian. [Google Scholar]
- Khudenko, B. M.; Shpirt, E. Hydrodynamic Parameters of Diffused Air Systems. Water Research 1986, 20(7). [Google Scholar]
- Lioyed, E.; David, T. R.; Jermo, D. W. Testing and Data Analysis of Diffused Aeration Equipment. J. Water Pollution Control Fed. 1979, 51(10). [Google Scholar]
- Metcalf & Eddy, Wastewater Engineering, 4th edition; Tata McGraw Hill Edition: New Delhi, 2003.
- Michael, B. L.; Ronald, N. S. Subsurface Aeration Evaluation. J Water Pollution Control Fed 1979, 51(10). [Google Scholar]
- Muller, J. A.; Boyle, W. C. Oxygen Transfer Under Process Conditions. J. Water Pollution Control Fed. 1988, 60(3). [Google Scholar]
- Peter, D.; Mark, F. Estimating Oxygen Transfer KLa, SOTE and Airflow Rate Requirements hi Fine Bubble Diffused Air Systems. In Water Environment Federation; WEFTEQ, 2001. [Google Scholar]
- Richard, C. A.; Rattray, Gordon B.; Paul, P. D. Air Diffusion Unit. J. Water Pollution Control Fed. 1974, 46(5). [Google Scholar]
- Shifrin, S. M.; Mishukov, B. G. Treatment of Wastewater for Dairy Industry; Publishing House Stroyizdat: Moscow, 1972; In Russian. [Google Scholar]
- Shifrin, S. M.; Mishukov, B. G.; Feofanov, E. A. Design of Biological Treatment Systems for Domestic and Industrial astewater; University Publishing House: Leningrad, 1977; In Russian. [Google Scholar]
- Suschka, J. Oxygenation in Aeration Tanks. J. Water Pollution Control Fed 1971, 43(1). [Google Scholar]
- Warriner, R.; Brenner, R.C. Oxygen Transfer Efficiency Surveys at the Jones Island Treatment Plants 1985–1988; Risk Reduction Engineering Laboratory, Office of research and Division, US. EPA: Cincinnati, Ohio, 45268, 1996. [Google Scholar]
- Warriner, R.; Brenner, R.C. Oxygen Transfer.
- Efficiency Surveys at the South Shore Wastewater Treatment Plant 1985–1987; Risk Reduction Engineering Laboratory, Office of research and Division, US. EPA: Cincinnati, Ohio, 45268, 1996.
- Water Environment Federation, Aeration. In WEF manual of Practice - MOP FD-13, ASCE Manuals and Reports on Engineering Practice No. 68; American Society of Civil Engineers: New York, 1996.
© 2006 MDPI. All rights reserved.
Share and Cite
MDPI and ACS Style
Al-Ahmady, K.K. Analysis of Oxygen Transfer Performance on Sub-surface Aeration Systems. Int. J. Environ. Res. Public Health 2006, 3, 301-308. https://doi.org/10.3390/ijerph2006030037
AMA Style
Al-Ahmady KK. Analysis of Oxygen Transfer Performance on Sub-surface Aeration Systems. International Journal of Environmental Research and Public Health. 2006; 3(3):301-308. https://doi.org/10.3390/ijerph2006030037
Chicago/Turabian StyleAl-Ahmady, Kossay K. 2006. "Analysis of Oxygen Transfer Performance on Sub-surface Aeration Systems" International Journal of Environmental Research and Public Health 3, no. 3: 301-308. https://doi.org/10.3390/ijerph2006030037