Introduction
Lead is a heavy, low melting, bluish-gray metal that occurs naturally in the earth’s crust. However, it is rarely found naturally as a metal. It is usually found combined with two or more other elements to form lead compounds [
1]. As it is one of the first discovered and most widely used metal in human history and is, therefore, one of the metal most commonly encountered in the environment [
2]. Its continued release into the environment as an exhaust emission product, as well as its widespread industrial use, has made lead a serious threat to human health [
3]. Most lead used by industry comes from mined ores (“Primary”) or from recycled scrap metal or batteries (“Secondary”). However, most lead today is “secondary” lead, obtained from lead-acid batteries. It is reported that 97% of these batteries are recycled [
1].
The largest industrial use of lead today is for the production of lead batteries, extensively used in automobile industries. Other uses of lead include the production of lead alloys, use in soldering materials, shielding for X-ray machines, and in the manufacture of corrosion and acid resistant materials used in the building industry [
4]. Lead has long been known to alter the hematological system by inhibiting the activities of several enzymes involved in heme biosynthesis, particularly δ-aminolevulinic acid dehydratase (ALAD). Inhibition of ALAD activity occurs over a wide range of Pb in blood beginning at <10μg/dL [
1]. The anemia induced by lead is primarily the results of both inhibition of heme biosynthesis and shortening of erythrocyte life span, but lead can also induce inappropriate production of erythropoietin leading to inadequate maturation of red cell progenitors, which can contribute to anemia. Lead absorbed by the GIT comes from the intake of the lead in food, beverages and soil or dust in case of older children and adults and in occupational exposure population mostly from atmospheric air [
5].
After absorption lead enters into the blood. Blood lead concentrations are currently regarded as the most reliable index of exposure to lead. Over 95% of blood lead is bound to the erythrocytes and seems to be in dynamic equilibrium with plasma lead [
6]. Once absorbed it is distributed particularly to the liver and kidneys, and is then stored in the bones and cause damage to the organs including the liver, kidneys, heart and male gonads as well as causes effects to the immune system [
1]. It is reported that erythrocyte ALAD activity is rapidly inhibited by lead exposure; hence determination of ALAD activity in erythrocyte is one of the most useful methods for evaluating lead exposure [
7]. The final step of heme biosynthesis introducing Fe
2+ into protoporphyrin XI (PP) is also affected by lead. Inhibition of Fe
+3 reductions by lead exposure causes the decrease in transportation of the Fe
2+ into mitochondria resulting in accumulation of PP in erythrocyte [
8]. PP is enzymatically or non-enzymatically chelated with Zn
2+ to form zinc protoporphyrin (ZPP).
Thus accumulation of PP or ZPP in erythrocytes provides an index of disturbance of the final step in heme biosynthesis, suggesting biochemical effect of lead in bone marrow and of active deposits of the metal in the tissue [
9]. A growing amount of evidence indicates that cellular damage mediated by reactive oxygen species (ROS) may be involved in the pathology associated with lead intoxication [
10]. A strong correlation between blood lead concentration and malondialdehyde levels in blood of lead exposed workers was already reported [
11]. In erythrocytes, from the workers exposed occupationally to lead, the activities of the antioxidant enzymes, superoxide dismutase (SOD) and glutathione peroxidase were remarkably lower than the non-exposed workers [
12]. Heavy metal induced alteration of antioxidant enzyme activities and nucleic acids concentrations are also reported [
13,
14].
Lead causes oxidative stress by inducing the generation of ROS, reducing the antioxidant defense system of cells via depleting glutathione, interfering with some essential metal, inhibiting sulfhydryl dependent enzymes or antioxidant enzymes activities and/or increasing susceptibility of cells to oxidative attack by altering membrane integrity and fatty acid composition [
15]. The binding activity of lead compounds with oxidative stress factors and with the generation of reactive oxygen species, such as hydrogen peroxide and it’s interaction with different metals and also toxic activity of d-amminolevulinic acid (ALA) are reported earlier [
16,
17]. The biological role of superoxide dismutase (SOD) is to dismute superoxide ion, hydrogen peroxide (H
2O
2), produced in this reaction is eliminated by catalase, one of the most active enzymes in the human organism. Catalase consists of four protein subunits, each of them containing heme group with iron (Fe), connected to its active center. The highest activity of catalase in the human body may be found in the liver and red blood cells [
18].
As most research about lead exposure on SOD and Catalase activity has mainly been experimental and the results are often divergent, the purpose of this study was to evaluate the activity of these enzymes and concentration of products of reactive oxygen species in blood with reference to heme biosynthesis of battery manufacturing workers (BMW) of western Maharashtra (India) exposed to lead compounds.
Materials and Methods
The study group included non-lead exposed healthy male subjects and lead exposed battery-manufacturing workers of Kolhapur city in the western Maharashtra state of India. The lead exposed groups consisted of 28 male battery-manufacturing workers (BMW) and the non-lead exposed control group consisted of 35 healthy male subjects. All the study group subjects had age in the range of 20–40 years. The entire experimental protocol was approved by institutional ethical committee and utmost care was taken during the experimental procedure according to the Helsinki Declaration of 1964 [
19]. Blood was collected by venipuncture into 10 ml evacuated tubes containing heparin solution as anticoagulant to obtain erythrocytes. Analysis of lead in blood and urine were carried out by graphite furnace atomic absorption spectrophotometry, using Perkin Elemer model 303 fitted with a boiling three slot burner. The atomic absorption spectrophotometer was connected to Hitachi 165 recorder and values were shown in μg/dL [
20]. Concentration of ZPP in the erythrocytes was measured directly using Aviv Biomedical hematoflurometer model 206. The light was filtered by means of an interference filter transmitting at 415nm. The excitation light was focused on a drop of blood. The emitted light passed through a narrow band interference filter, which is transmitted at 595nm. The instrument measured the ratio of fluorescent substance (ZPP) to the absorption of the light in the sample (hemoglobin) displayed as μg ZPP/g hemoglobin (μg/g Hb). ZPP (μg/g Hb) was converted into μg/dL[
21]. Erythrocyte–daminolevulinic acid dehydratase(ALAD) is estimated by the method of Julian Chisolan et al [
22 ]. Erythrocyte - ALAD acts on d-aminolevulinic acid (ALA) to form porphobilinogen, which is further reacted with modified Ehrlich’s reagent to form pink colored compound measured on spectrophotometer at 555nm. Hg-TCA solution stops the reaction by precipitating the proteins. ALAD activity is estimated by using this formula:
Where,
2 = Conversion factor for ALA to PBG
35 = Dilution factor
60 = Incubation time (min)
0.062 = Micromolar absorptivity of modified Ehrlich’s reagent and PBG chromogen.
Activated and non-activated ALAD ratio (Act/Non-act) was determined. d- aminolevulinic acid (ALA)was estimated in urine samples by the method of Osamu W. et al. [
23]. ALA reacts with acetylacetone and form pyrrole substance, which reacts with p- dimethyl amino benzaldehyde. The colored complex was measured spectrophotometrically at 555nm. The results were expressed as mg/L. Estimation of porphobilinogen in urine was estimated by Mauzerall & Granick [
24]. Porphobilinogen (PBG) from urine reacts with p-dimethyl aminobenzaldehyde (DMAB, Ehrlich’s reagent) in acid solution to form a red compound, which is measured at 555nm exactly after 5 minutes and the value were calculated according to Rimington formula [
25]:
All the hematological parameters were measured by using fully automated Hematology analyzer Sysmax K-4500. Lipid peroxidation was measured spectrophotometrically by method of Kei Satoh [
26]. The proteins in serum are precipitated by trichloroacetic acid (TCA) and the mixture is heated with thioburbituric acid in 2M sodium sulfate, in a boiling water bath for 30 minutes. The resulting chromogen is extracted with n-butyl alcohol and absorbance of organic phase is determined at 530 nm wavelength. The values are expressed in terms of malondialdehyde (MDA) nmol/ml by using 1,1,3,3 tetraethoxy propane as the standard. The activity of erythrocyte-superoxide dismutase (SOD) was indicated by Marklund and Marklund method [
27]. Superoxide anion is involved in auto-oxidation of pyrogallol at alkaline pH (8.5). The SOD inhibits the auto-oxidation of pyrogallol, which can be determined as an increase in absorbance per two minutes at 420nm on a spectrophotometer. The SOD activity was measured as unit/ ml of hemolysate. One unit of SOD is defined as the amount of enzymes required to cause 50% inhibition of pyrogallol auto-oxidation. Erythrocyte-catalase was measured by the method of Aebi [
28].
Sediments of erythrocytes were rinsed 3 times using 0.9% NaCl and were lysed in 3 volumes of cold, redistilled water and left in ice for 30 minutes. The samples were not centrifuged before catalase was measured. The hemolysate was diluted 500 times with phosphate buffer (60 mM), pH 7.4. Kinetic reaction was carried out in a cuvett mixed with 3.0 ml phosphate buffer, 10μl hemolysate and 1.0 ml of H2O2 and the initial absorbance was measured immediately at λ =240 nm. The kinetic changes of absorbance were measured every 15 secs intervals upto 1 minute on ELICO, UV-VIS spectrophotometer SL 159. The unit of catalase activity was expressed as mM of H2O2 decomposition/ mg Hb/min.
Statistical comparison between control and BMW group were made by student t-test. Pearson’s correlation equation was also done to evaluate correlation between various parameters in control and BMW groups separately.
Results
Table 1 summarizes lead concentration in blood (Pb-B), lead concentration in urine (Pb-U), both activated and non activated erythrocyte- ALAD and it’s ratio, erythrocyte ZPP, ALA in urine (ALA-U) and PBG in urine (PBG-U) of lead exposed battery manufacturing workers (BMW) group and unexposed control group. The PbB level of control ranged from 2.8 – 22.0 μg/dL whereas incase of BMW group it was 25.8 – 78.0 μg/dL. The PbB and PbU were significantly increased in the BMW group (p<0.001) as compared to the lead unexposed control group. Non activated erythrocyte-ALAD activities were significantly decreased (p < 0.05) in BMW group as compared to control group. However the activated erythrocyte ALAD activities in BMW group showed no significant change when compared to control group. But the ratio of activated/non activated erythrocyte ALAD activities showed a significant increase (p <0.01) in BMW group as compared to the control group.
Erythrocyte-ZPP level was significantly increased (p< 0.01) in BMW group in comparison to the control group. Both ALA in urine (ALA-U) and PBG in urine (PBG-U) of BMW group showed a significant elevation (p< 0.001) from respective controls.
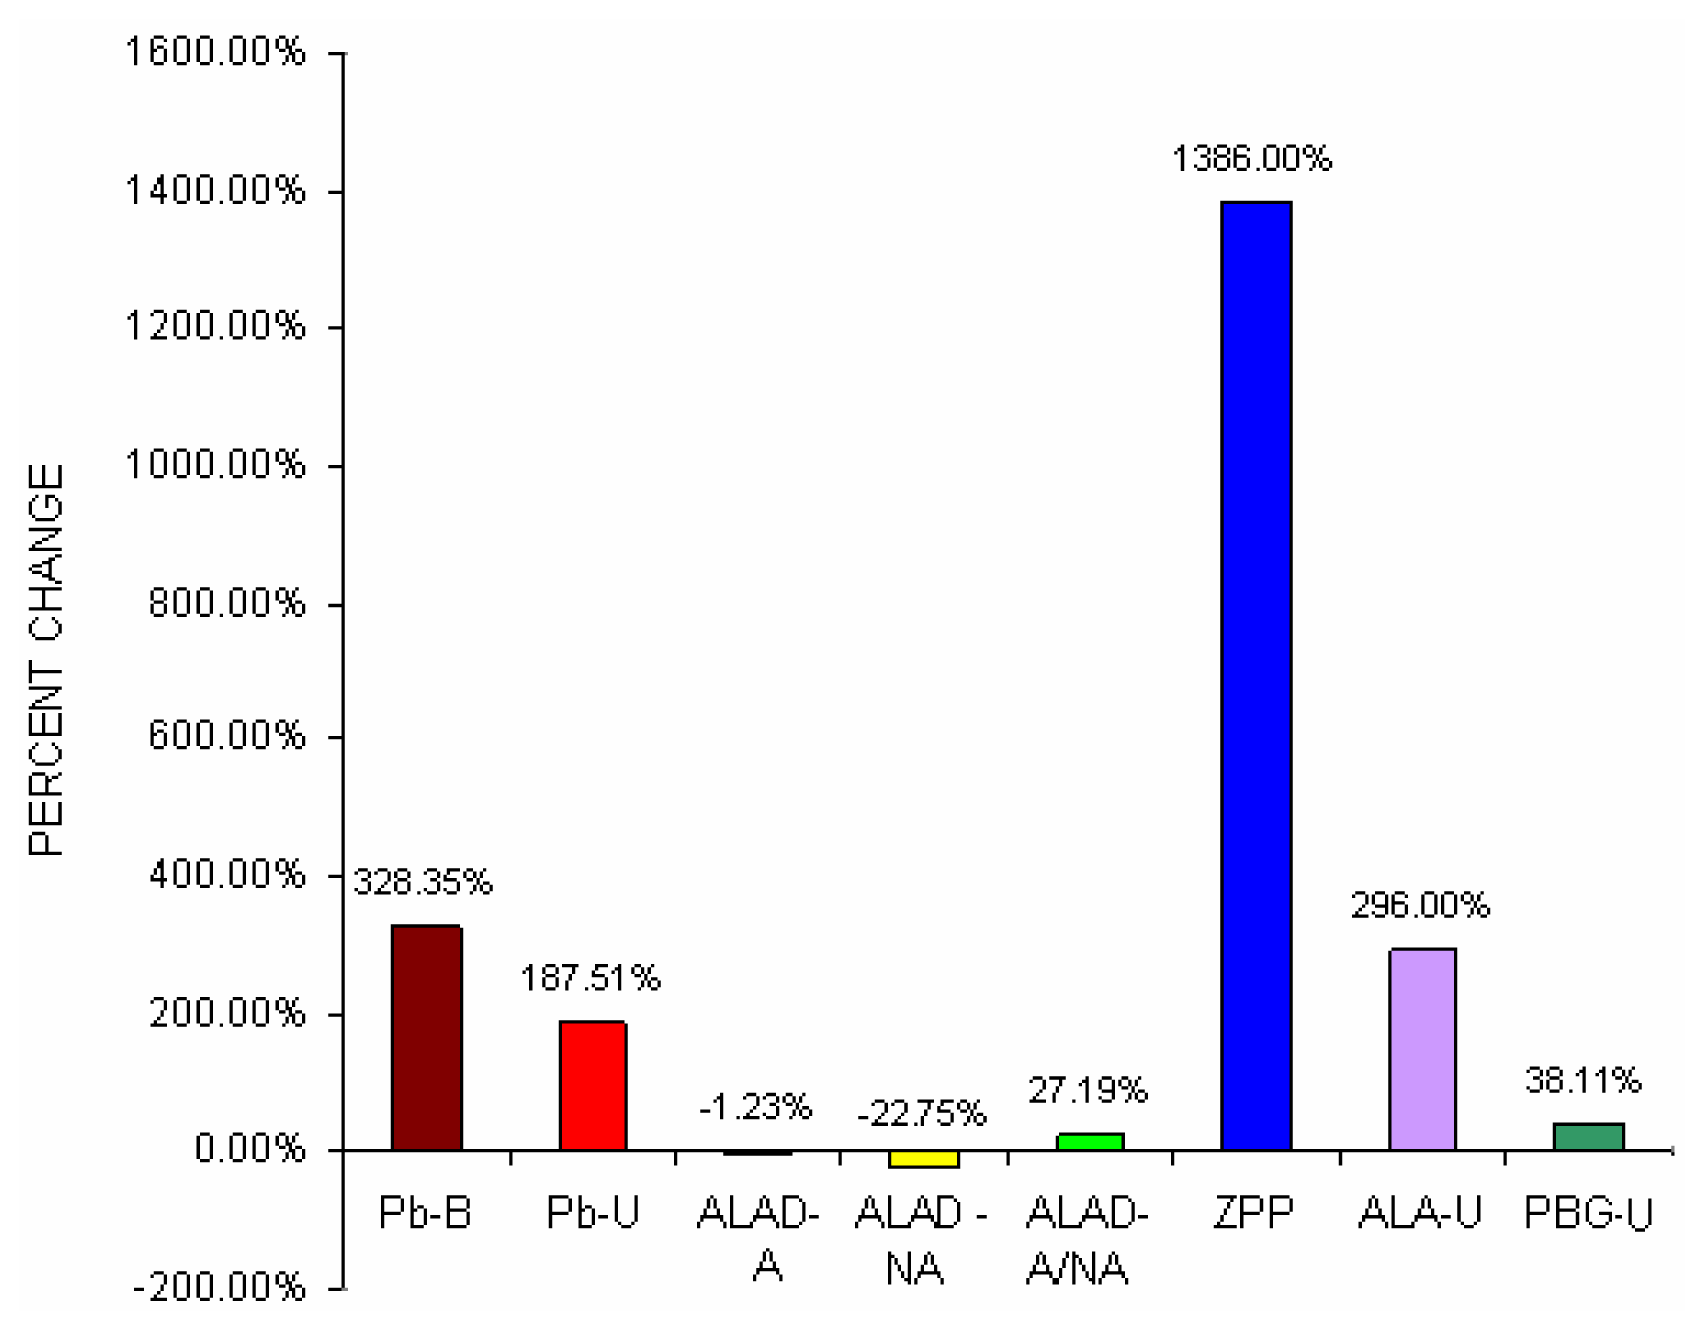
Fig 1 shows percent change difference of blood lead concentration (Pb-B), urine lead concentration (Pb-U), activated and non activated erythrocyte- ALAD and it’s ratio, erythrocyte ZPP, ALA in urine (ALA-U) and PBG in urine (PBG-U) of lead exposed BMW groups with unexposed control groups.
It was noticed from
Fig 1 that blood lead concentration of BMW group increased by 328.35% from control group, which was further corroborated with greater urinary lead excretion (187.51%) in BMW group. BMW groups also showed the percent change increase of activated erythrocyte- ALAD and non activated erythrocyte- ALAD ratio (27.19%), erythrocyte ZPP (1386%) and PBG in urine (38.11%) as compared to respective controls.
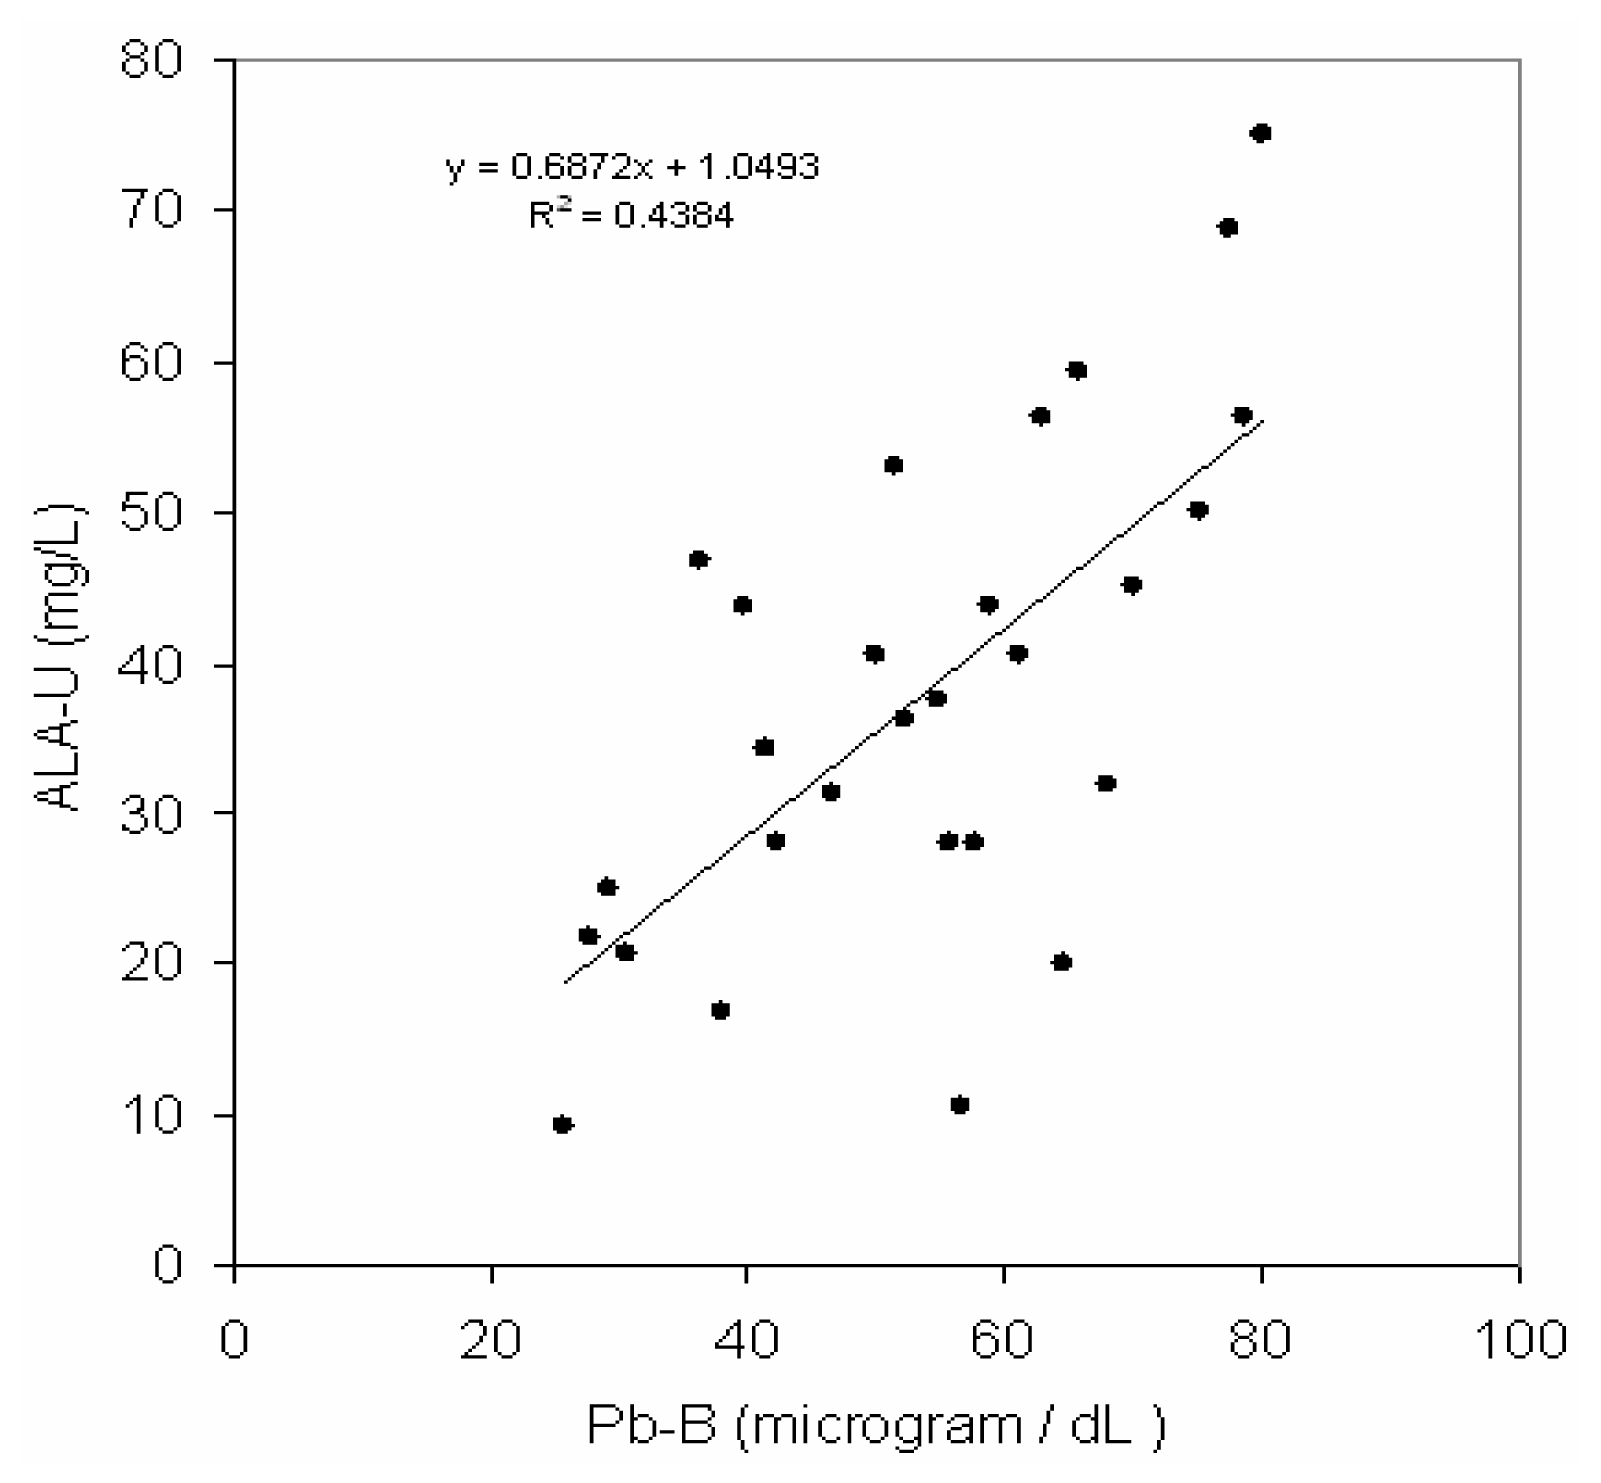
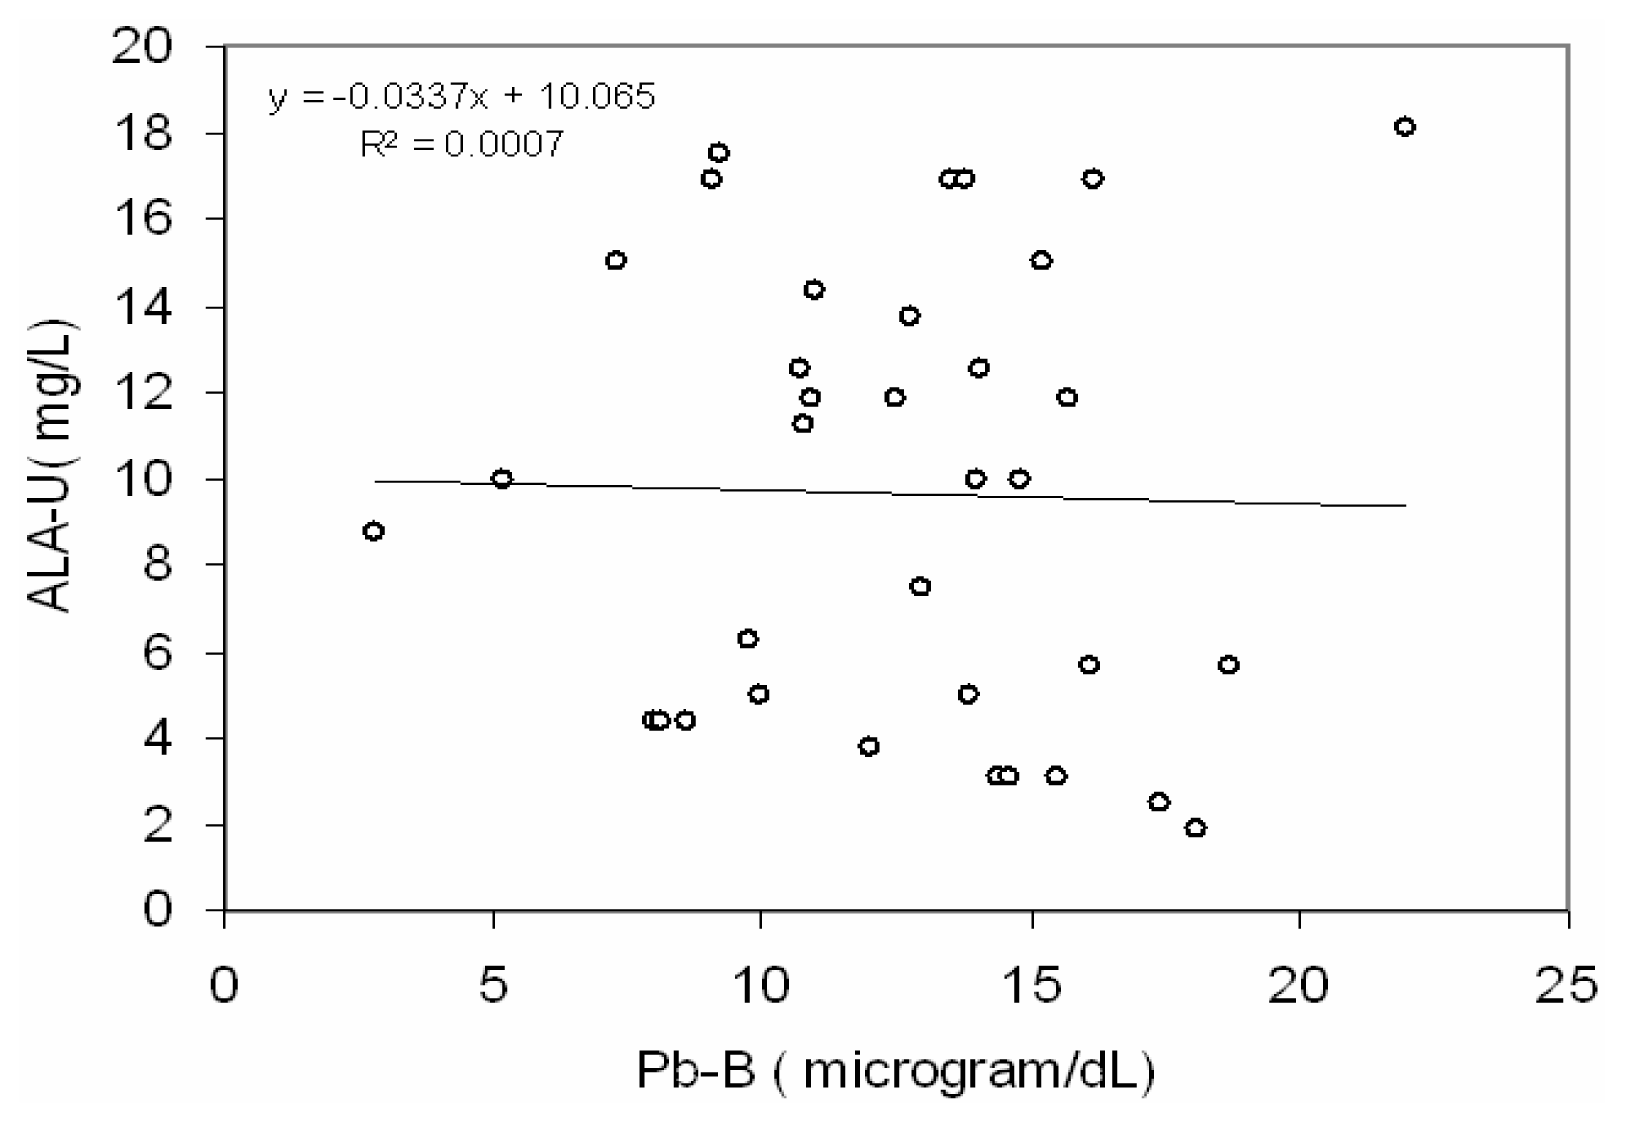
Fig 2 depicts a positive correlation (r = 0.66, p< 0.001) between blood lead concentration (Pb-B) and ALA in urine (ALA-U) of lead exposed BMW workers (Pb-B levels of 25.8 – 78.0 μg/dl). But no correlation (r=0.02) between blood lead concentration (Pb-B) and ALA in urine (ALA-U) of control group (Pb-B levels of 2.8 – 22.0 μg/dl) was observed (
Fig. 3).
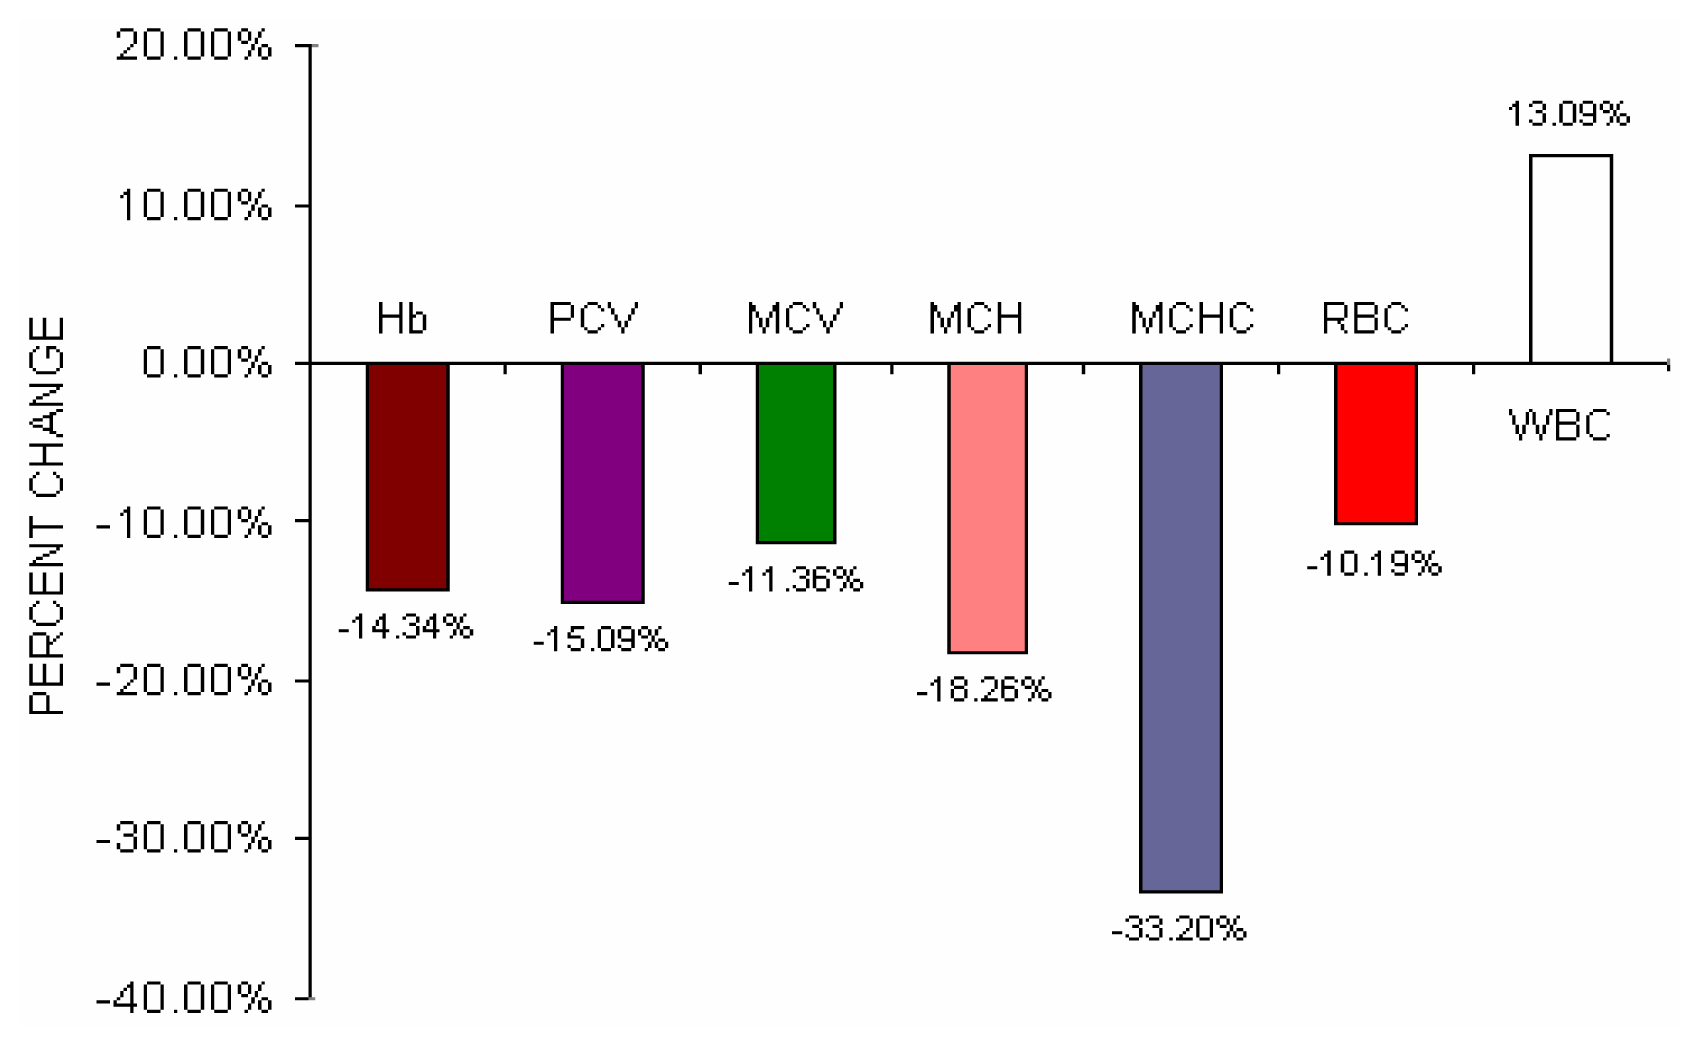
Table 2 shows the hematological parameters of lead exposed BMW group and lead unexposed control group. Incase of BMW group hemoglobin (p < 0.01), packed cell volume (p< 0.001), mean corpuscular volume (p < 0.05), mean corpuscular hemoglobin (p< 0.001), mean corpuscular hemoglobin concentration (p< 0.05) were significantly decreased and total leucocytes count was significantly increased (p < 0.05) as compared to lead unexposed control group. No significant changes of total erythrocyte count in BMW group were observed in comparison to control group.
Fig 4 shows the percent change difference of various hematological parameters of BMW group from control group. Though there were no statistical significant changes of total erythrocyte count in BMW group was observed as compared to control group but percent change difference of BMW group shows a fall of 10.19% of total erythrocyte count from control group.
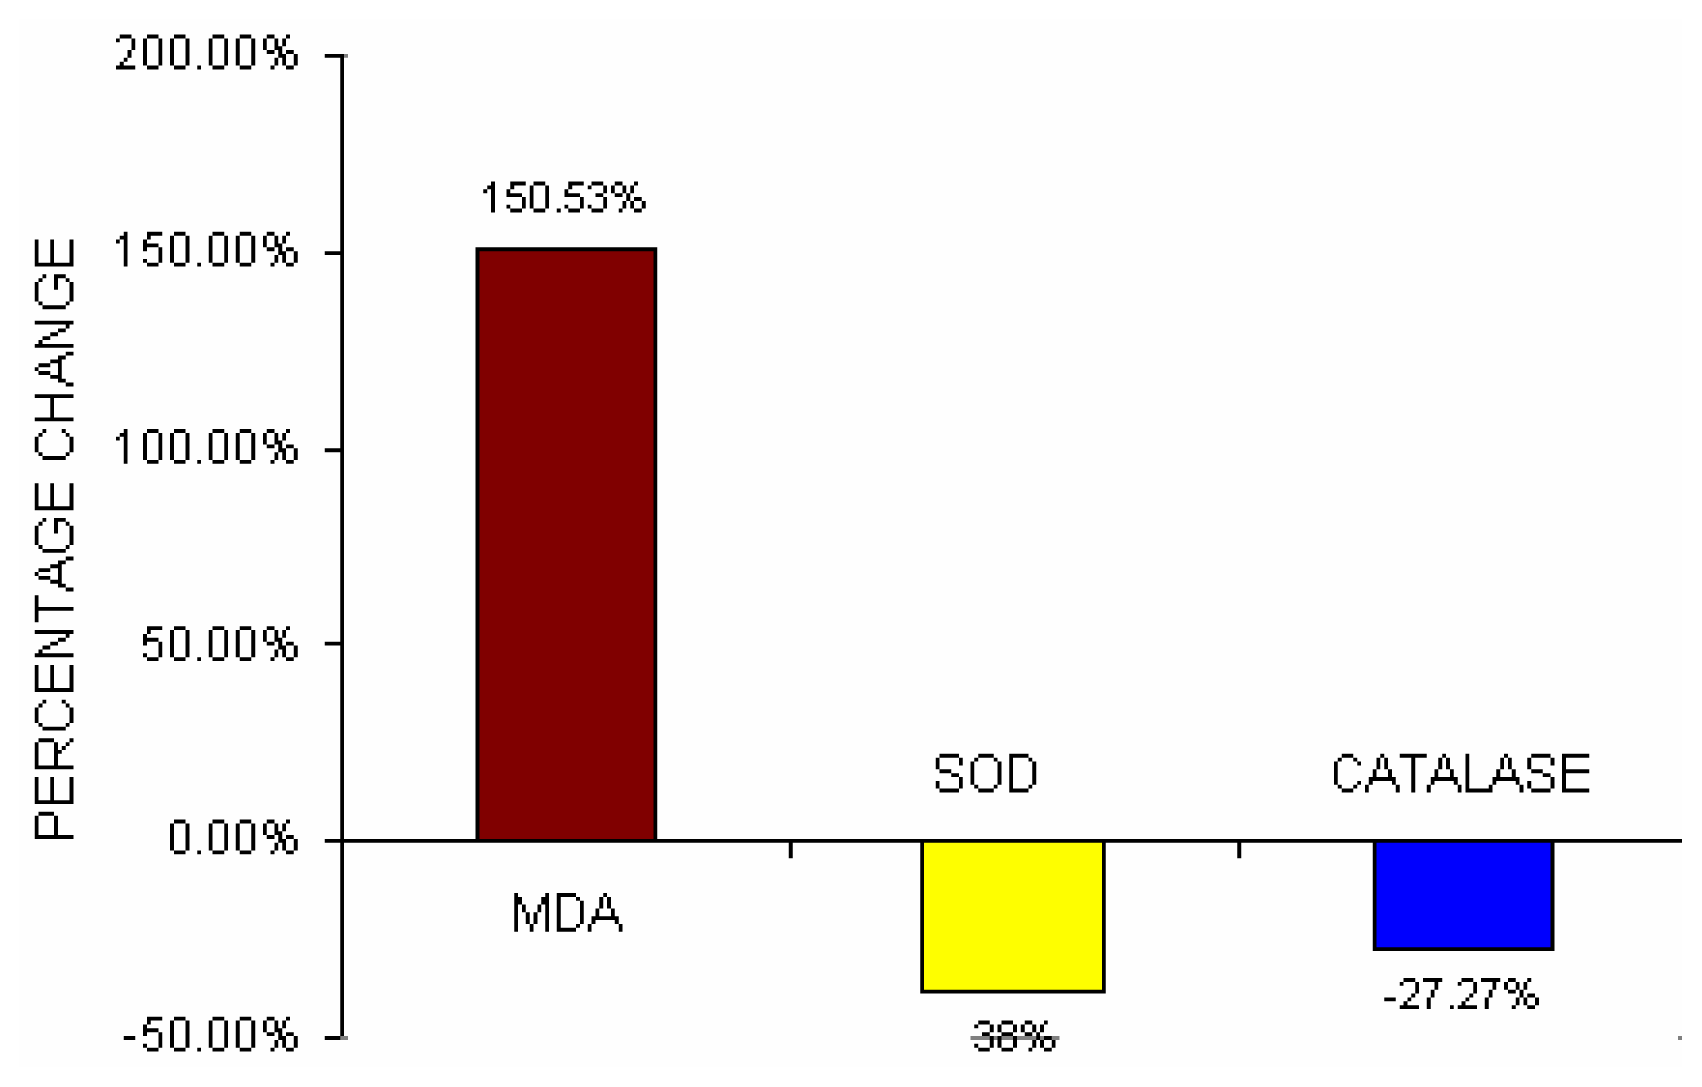
Table 3 depicts the serum MDA content, erythrocyte-SOD activities, and erythrocyte-Catalase activities in lead exposed BMW group and unexposed control group. The lipid peroxidation level was significantly increased (p< 0.001) and the antioxidant enzymes such as erythrocyte –SOD activities (p<0.001) and erythrocyte- Catalase activities (p<0.001) were significantly decreased in BMW group as compared to unexposed control group.
Fig 5 depicts the percent change difference of serum lipid peroxide (MDA), erythrocyte–SOD activities and erythrocyte-Catalase activities in BMW group from control group. Serum MDA content increased by 150.53% in BMW group from control. Erythrocyte-SOD activities and erythrocyte-Catalase activities in BMW groups showed a decrease of 38% and 27.27% respectively from the control groups.
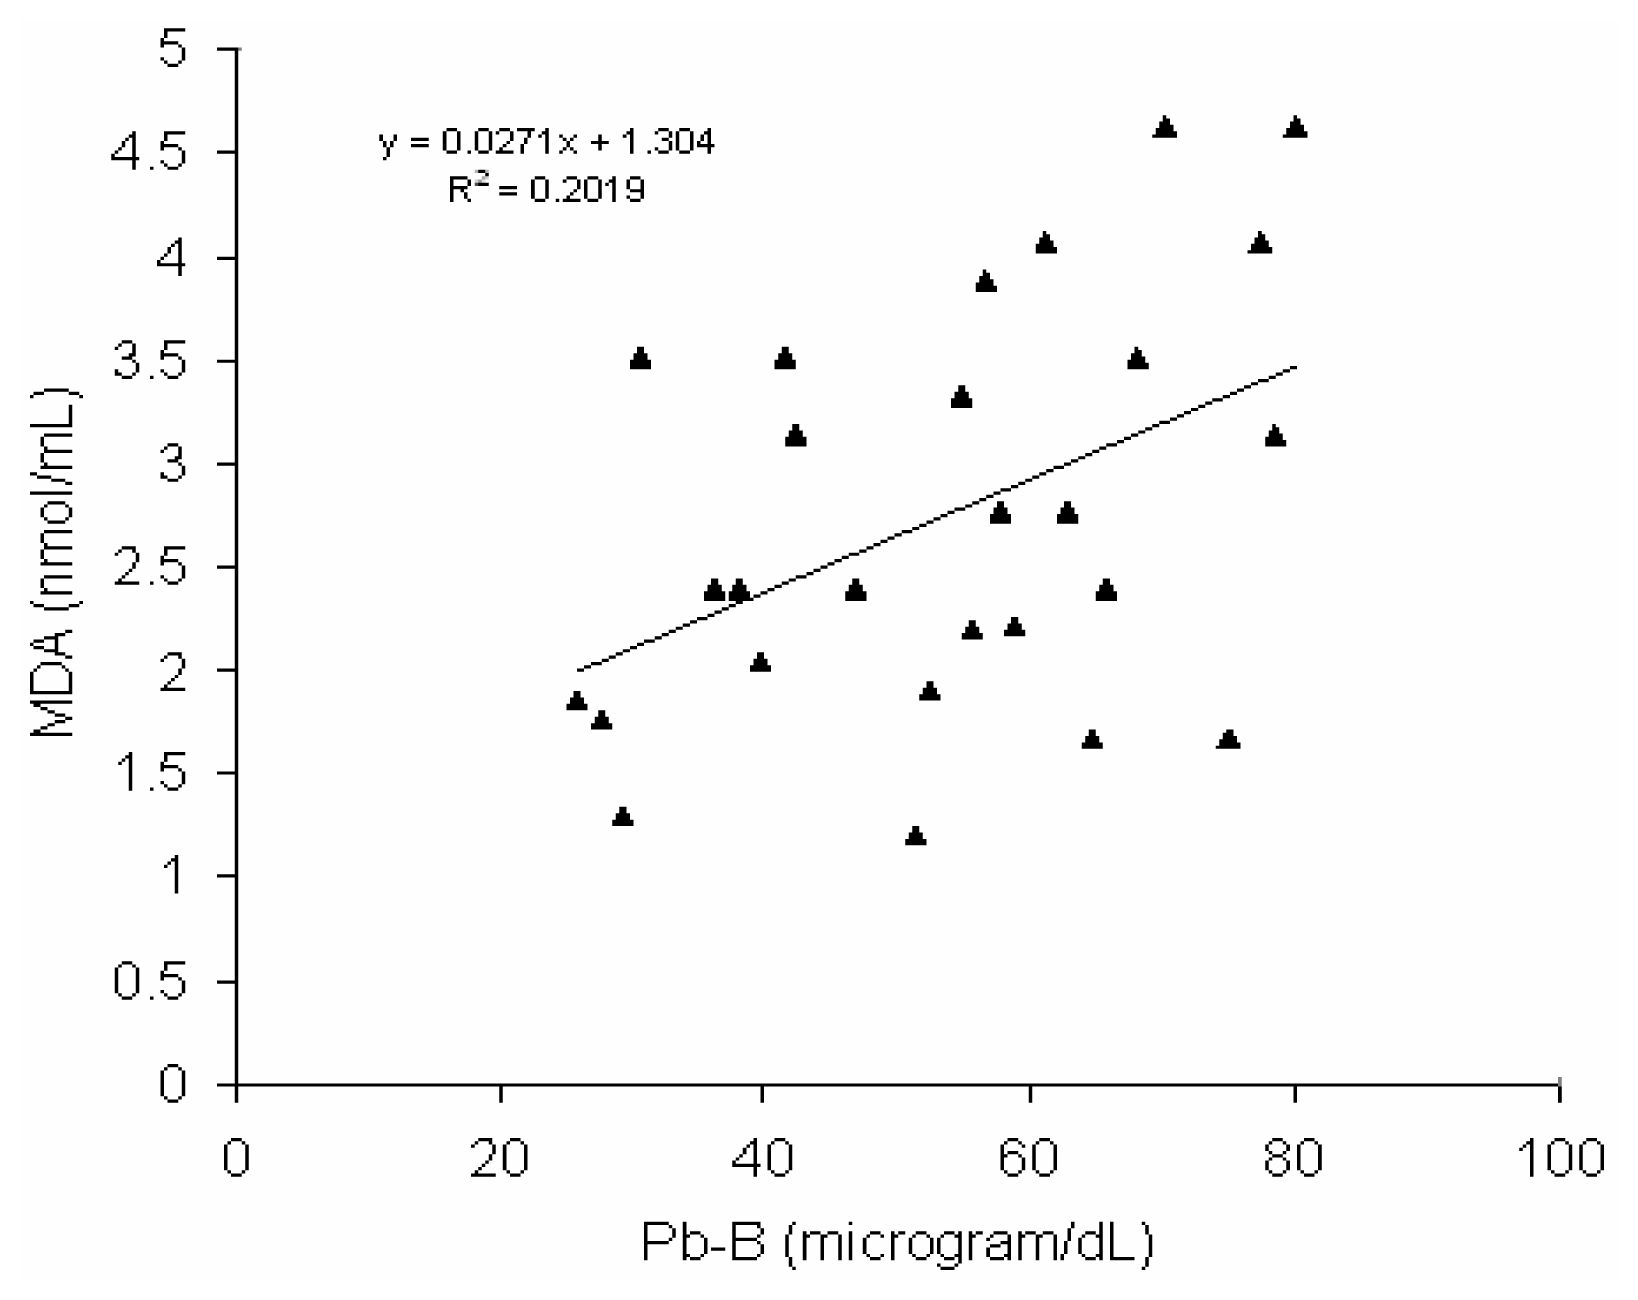
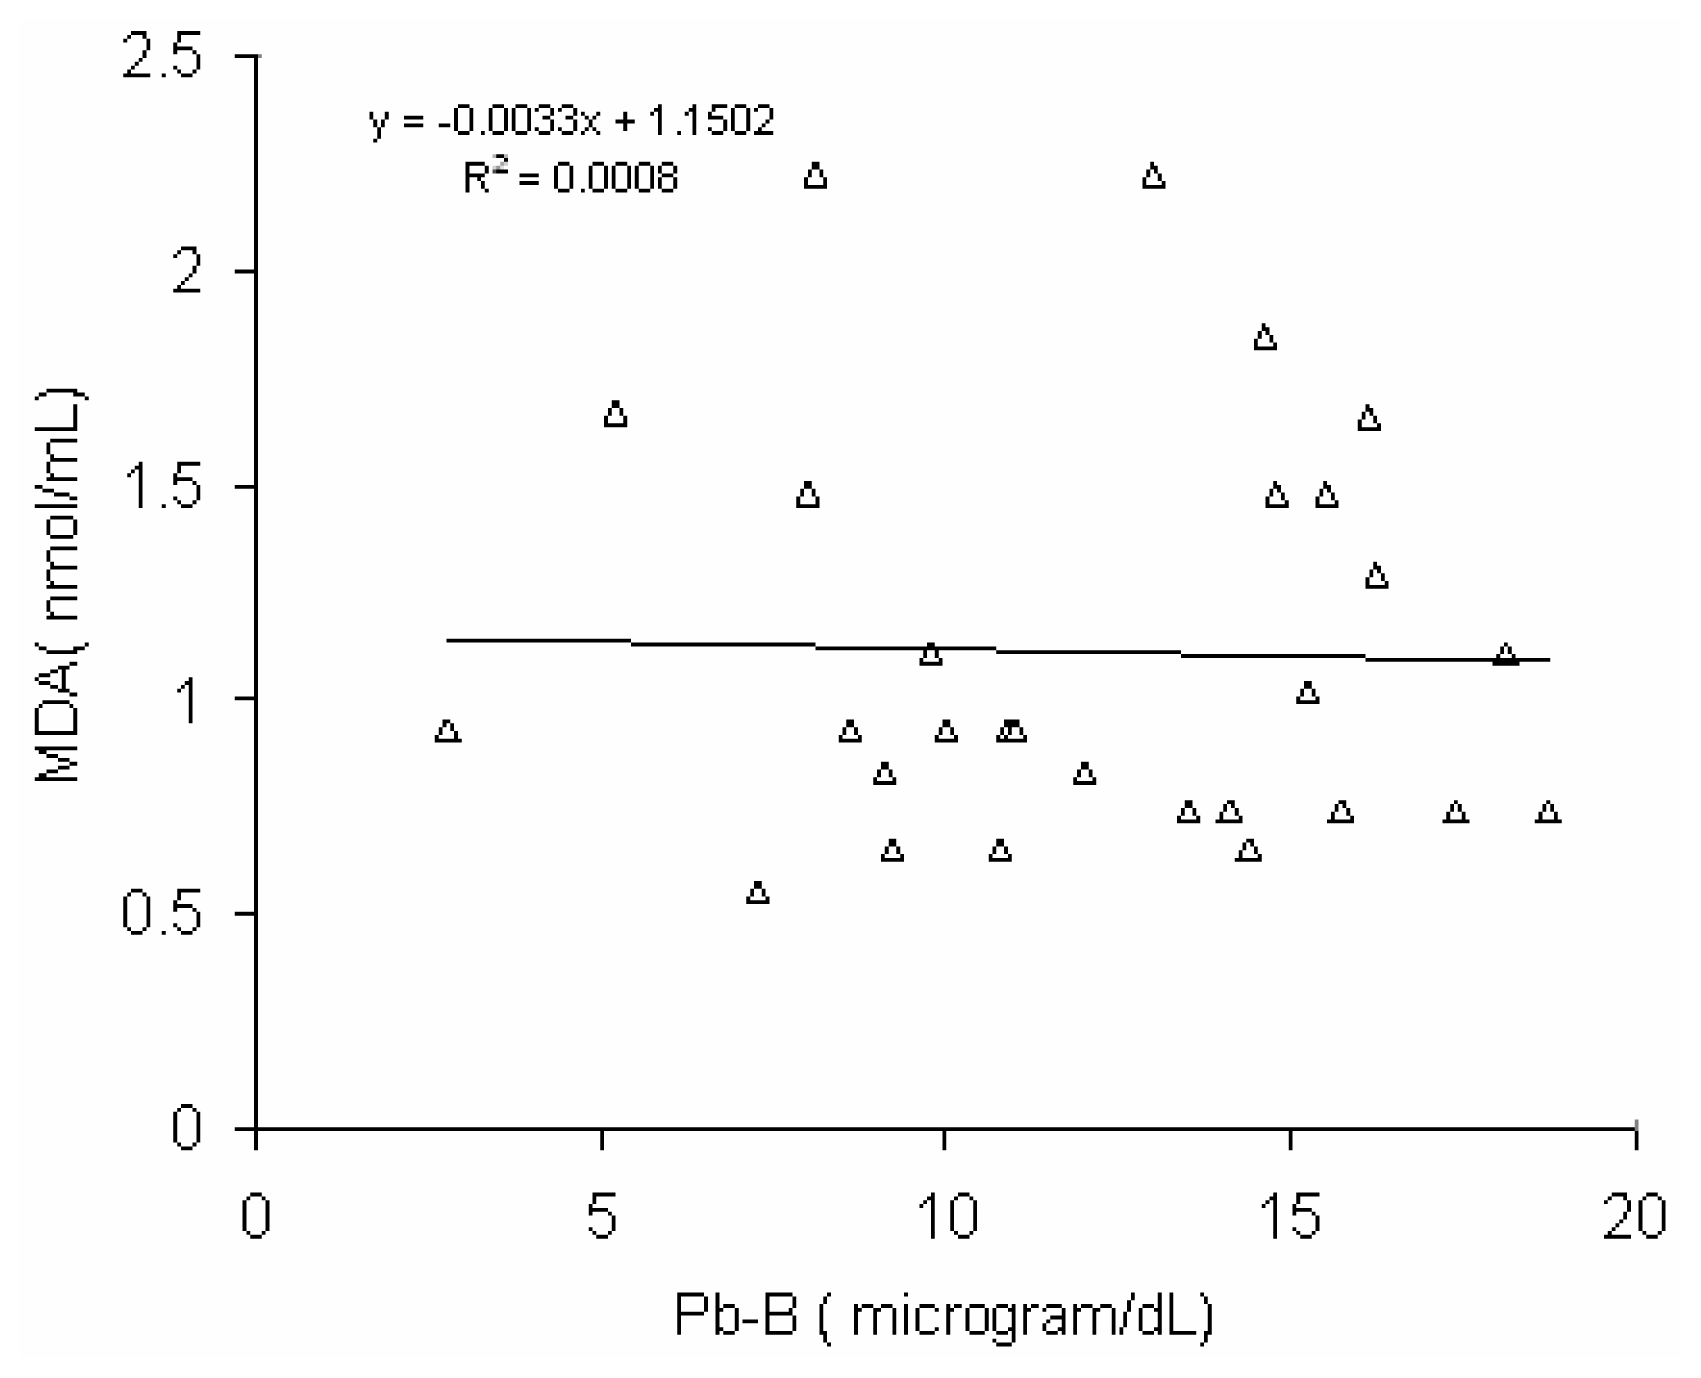
Fig 6 shows a positive correlation (r = 0.45, p < 0.02) between blood lead concentration (Pb-B) and serum MDA level in BMW group (Pb-B range is 25.8 – 78.0μg/dl). No such correlation (r = 0.028) was observed in control group (Pb-B range is 2.8 – 22.0 μg/dl) (
Fig 7).
Discussion
The significant elevation of blood lead (Pb-B) and urinary lead (Pb-U) levels of battery manufacturing workers (BMW) group indicates the greater absorption of lead in BMW group as compared to the normal control group. Absorption of lead ordinarily resulted in rapid urinary lead excretion. If excessive lead exposure continues, lead accumulates in bones followed by soft tissues. Pb-B levels depend on the equilibrium between absorption, storage and excretion [
5]. Battery recycling and manufacturing involves the use of metallic lead for making grids, bearing and solder. Manufacturing process is usually manual and involves the release of lead particles and lead oxide that may cause environmental pollution and severe lead poisoning. Poor hygiene and inappropriate protection might be the reason for increased Pb-B level in BMW group. Lead (Pb) intoxication in BMW group clearly resulted in a disturbances of heme biosynthesis. Erythrocyte ALAD plays an important role in evaluating lead poisoning [
29].
Recent studies and kinetic behavior of Pb in blood have implicated major Pb binding sites on erythrocyte which alters the activities of one of the cytosolic vestigial heme synthesis pathway enzyme in the cell, δ-aminolevulinic acid dehydratase [
30]. A significant decrease of non activated erythrocyte δ-aminolevulinic acid dehydratase(ALAD) which is an important enzyme in the heme biosynthesis and a significant increase of activated/non activated erythrocyte ALAD ratio in lead exposed BMW group indicates the adverse effect of lead on heme biosynthesis. Lead induced decrease activities of ALAD of BMW group may be due to it’s interaction with enzyme functional groups, and high affinity metal binding proteins, such as Pb binding proteins and metallothioneins [
31]. The level of ALAD is a sensitive indicator of lead toxicity and is usually reduced to 50% or less of normal activity when Pb-B values are in the 30 –50 μg/dL range, unfortunately the erythrocyte ALAD activity reached a plateau when marked reduction of it take place hence it can not be used to quantify degree of lead exposure [
5]. Non activated erythrocyte ALAD alone is considered as a predictor of Pb-B concentration, as in the European standardized and other similar ALAD assay methods [
22].
Several studies have reported that the erythrocyte ALAD activity is increased in individuals with anemia and sickle cell disease but not in subjects with β-thalassemia [
32]. Therefore, the use of the activated/non activated erythrocyte δ-aminolevulinic acid dehydratase (ALAD) activity ratio appears to be good marker for lead toxicity. Lead induced inhibition of Zn containing enzyme ALAD activities resulted in catalyzing the condensation of two units of ALA to form porphobilinogen (PBG). A significant rise of erythrocyte Zn – protoporphyrin (ZPP) in lead exposed BMW group in present study indicates a disturbance of the final step in heme biosynthesis [
9]. Lead interferes with the conversion of zinc protoporphyrin (ZPP) to heme by the enzyme ferrochelatase and a correlation has been observed between blood lead levels and erythrocyte ZPP, therefore, levels of erythrocyte ZPP can be used as a biomarker of lead exposure [
33]. Lead induced significant elevation in urinary δ-aminolevulinic acid (ALA-U) and urinary porphobilinogen (PBG-U) of BMW group corroborates the effect of lead on the hematopoietic system. Lead inhibits the zinc containing cytosolic enzyme ALAD, which catalizes the condensation of two units of δ-aminolevulinic acid (ALA) to form porphobilinogen (PBG). Rise of ALA-U and PBG–U of lead exposed BMW group supports this statement. ALA is synthesized in mitochondria from glycine and succinyl- Co A by ALA synthetase (ALA-S), which is rate limiting enzyme in heme biosynthesis pathway. The decrease in ALAD activity and indirect activation of ALAS due to negative feedback regulation by lead exposure cause an increase in ALA in various tissues and in plasma, and consequently increase excretion of ALA-U [
34].
A strong correlation (r = 0.892) between urinary δ-aminolevulinic acid (ALA-U) and serum δ-aminolevulinic acid was already reported [
35]. Hence the measurement of ALA-U is very useful tool for biological monitoring of occupational lead exposure. The urinary level of δ-aminolevulinic acid (ALA-U), a precursor of porphobilinogen and therefore porphyrin synthesis in heme metabolism, has been accepted in occupational health as a marker of biochemical effect of lead [
36]. A positive correlation (r = 0.66) between blood lead concentration (Pb-B) and urinary level of δ-aminolevulinic acid (ALA-U) of lead exposed BMW group (blood Pb range is 25.8–78.5μg/dl) in present study clearly shows the magnitude of deleterious effect of heme biosynthesis and supported the above mentioned statements. The Pb-B concentration to induce a substantial increase ALA-U has been remained as a focus of interest. The lowest Pb-B concentration to induce an increase in ALA-U, or the threshold Pb-B level, has also reported as early as mid 1970s [
37,
38]. In present study no significant correlation between Pb-B and ALA-U of the control group (blood Pb range is 2.8–22.0 μg/dl) suggests that the threshold Pb-B to increase ALA-U may be from 22.0 μg/dl onwards as it was reported earlier [
39,
40]. Hence it may be postulated from a positive correlation with the linear regression between Pb-B and ALA-U in lead exposed BMW group (blood Pb range is 25.8 – 78.5 μg/dl) and no correlation in control group (blood Pb range is 2.8–22.0 μg/dl) that ALA-U stays almost unchanged when Pb-B is low (as in case of control group of present study, Vide
Fig. 3) whereas elevation of Pb-B in certain level the increase of ALA-U is substantial (as in case of lead exposed BMW group of present study, vide
Fig. 2).
It was noticed that one of the most sensitive targets for lead toxicity is hematological system. The adverse hematological effects of lead are mainly the result of its perturbation of the heme biosynthesis pathway. Lead induced decrease concentration of hemoglobin (Hb) in blood of BMW group in present study supported this view. A few indices of erythropoietic activity like PCV, MCH and MCHC were significantly decreased in lead exposed BMW group and also corroborate the same view. Most of the research findings observed that lead increased concentration of lipid peroxide in blood, both in experimental or clinical studies [
41,
42]. It was reported that increase level of lipid peroxide in plasma is associated with decrease erythrocyte–SOD and erythrocyte–Catalase activities in the workers who were occupationally exposed to lead (mean Pb-B concentration is 57.1±17.6 μg/dL)[
12]. This observation is corroborated with the findings of lipid peroxide level, erythrocyte–SOD and erythrocyte–Catalase activities of lead exposed BMW group (mean Pb-B is 53.63±16.98 μg/dL) in present study. Increase production of lipid peroxide (MDA) in BMW groups may be due to rise of ALA in blood after lead exposure. Lead usually inhibits the delta-aminolevulinic acid dehydratase activity, which increase ALA in blood plasma and urine. Much research, both experimental and on cell breedings confirms that ALA may generate reactive oxygen species (ROS) in biological system [
43,
44]. In BMW group, a positive correlation with linear regression between Pb-B level and serum MDA level has been observed (
Fig. 6) (Pb-B range 25.8μg/dL-78μg/dL) whereas no correlation with linear regression is found in case of control group (Pb-B range 2.8μg/dL-22.5μg/dL). It is postulated from the higher serum MDA content associated with decrease activity of SOD and catalase in BMW group exposed to lead may be a part in the increased membrane lipid peroxidation. Catalase contains heme as the prosthetic group, the biosynthesis of which is inhibited by lead and resulted in decrease erythrocyte catalase activation. A definite relationship between increase WBC counts with rise in serum MDA level in BMW group may also to be considered. As it is well established, free radicals are released from activated leukocytes, which cause peroxidation of membrane lipids.
There is a rupture of the lysosomal membranes, the release of lysosomal enzymes, necrosis of the cells and destruction of the parenchymal tissue. All these processes culminate in an increase in serum MDA level. Hence increase serum MDA could be used as a marker for free radical mediated destruction of liver parenchymal cells [
45]. Thus chronic exposure of lead in battery manufacturing workers of Western Maharashtra (India) clearly showed an adverse effect on heme biosynthesis and decrease activities of SOD and catalase in associated with increased lipid peroxidation. Although no apparent fall of total erythrocyte count has been observed in BMW group, which is very common in chronic lead exposure, but decrease in hemoglobin concentration and other blood indices reflects anemia in lead exposed BMW group.
The decreased SOD activity in BMW group is probably due to interaction of lead with copper molecule. As SOD is a Zn-Cu containing enzyme, hence lead exposure induced copper deficiency resulted in decreased erythrocyte SOD activity [
46].
In conclusion, it may be postulated that despite modern technical supports considerable lead induced health hazards still exist. This study reveals that complete hemogram, urinary d- ALA, PBG and erythrocyte- d-ALAD activities are valuable tool in screening occupational lead exposure. Alterations of prooxidants and antioxidants level in battery manufacturing workers indicate definite oxidative stress due to lead pollution.


