Increased Mortality Associated with Well-Water Arsenic Exposure in Inner Mongolia, China


Abstract
:1. Introduction
- Identify deaths that occurred in the village between January 1, 1997 and December 1, 2004 and classify each according to underlying cause of death;
- Evaluate the relationship between mortality rate and arsenic exposure from the primary water source.
2. Methods
2.1. Census and Mortality Classification
2.2. Water Collection and Arsenic Analysis
2.3. Statistical Methods
3. Results
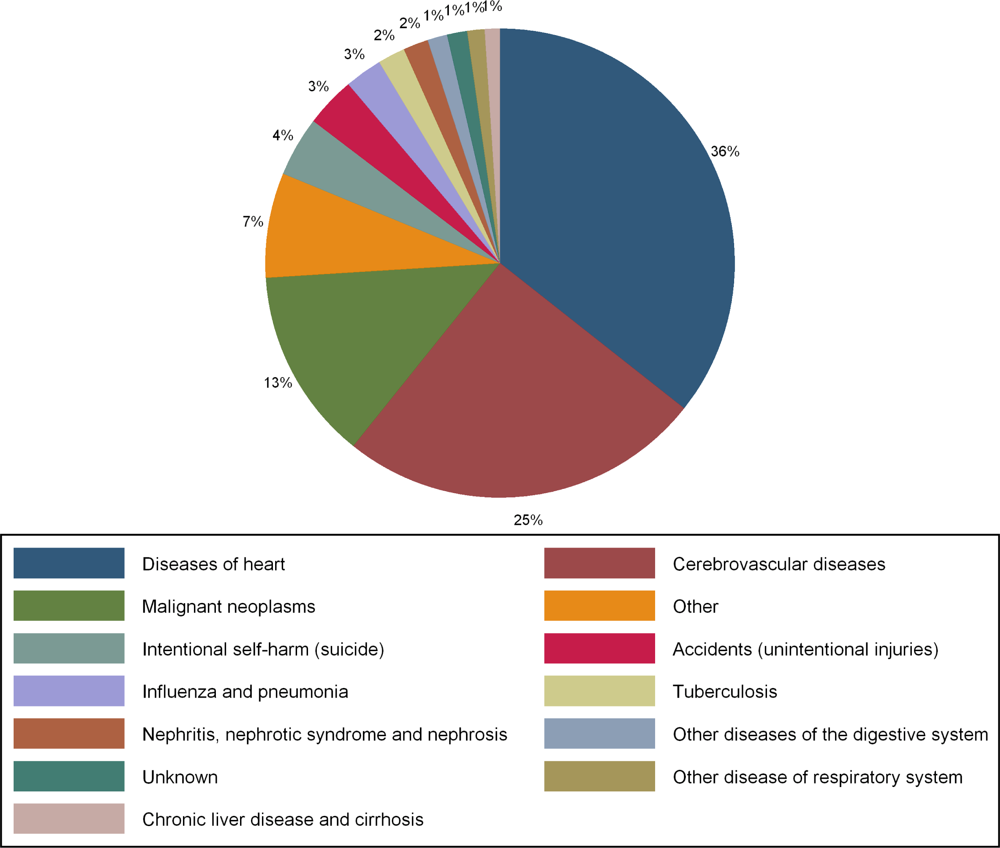
3.1. Mortality
3.2. Arsenic Exposure
3.3. Mortality and Arsenic Exposure
3.4. Other Factors Associated with Mortality
4. Discussion
Acknowledgments
References and Notes
- Smith, AH; Goycolea, M; Haque, R; Biggs, ML. Marked increase in bladder and lung cancer mortality in a region of Northern Chile due to arsenic in drinking water. Am. J. Epidemiol 1998, 147, 660–669. [Google Scholar]
- Hopenhayn-Rich, C; Biggs, ML; Fuchs, A; Bergoglio, R; Tello, EE; Nicolli, H; Smith, AH. Bladder cancer mortality associated with arsenic in drinking water in Argentina. Epidemiology 1996, 7, 117–124. [Google Scholar]
- Chen, CJ; Chuang, YC; Lin, TM; Wu, HY. Malignant neoplasms among residents of a blackfoot disease-endemic area in Taiwan: high-arsenic artesian well water and cancers. Cancer Res 1985, 45, 5895–5899. [Google Scholar]
- Tsai, SM; Wang, TN; Ko, YC. Mortality for certain diseases in areas with high levels of arsenic in drinking water. Arch. Environ. Health 1999, 54, 186–193. [Google Scholar]
- Otto, D; He, L; Xia, Y; Li, Y; Wu, K; Ning, Z; Zhao, B; Hudnell, HK; Kwok, R; Mumford, J; Geller, A; Wade, T. Neurosensory effects of chronic exposure to arsenic via drinking water in Inner Mongolia: II. vibrotactile and visual function. J. Water Health 2006, 4, 39–48. [Google Scholar]
- Li, Y; Xia, Y; He, L; Ning, Z; Wu, K; Zhao, B; Le, XC; Kwok, R; Schmitt, M; Wade, T; Mumford, J; Otto, D. Neurosensory effects of chronic exposure to arsenic via drinking water in Inner Mongolia: I. Signs, symptoms and pinprick testing. J. Water Health 2006, 4, 29–37. [Google Scholar]
- Chen, CJ; Hsueh, YM; Lai, MS; Shyu, MP; Chen, SY; Wu, MM; Kuo, TL; Tai, TY. Increased prevalence of hypertension and long-term arsenic exposure. Hypertension 1995, 25, 53–60. [Google Scholar]
- Chang, CC; Ho, SC; Tsai, SS; Yang, CY. Ischemic heart disease mortality reduction in an arseniasis-endemic area in southwestern Taiwan after a switch in the tap-water supply system. J. Toxicol. Environ. Health A 2004, 67, 1353–1361. [Google Scholar]
- Ma, H; Xia, Y; Wu, K. Human exposure to arsenic and health effects in Bayingnormen, Inner Mongolia. In Arsenic Exposure and Health Effects; Elsevier: Amsterdam, The Netherlands, 1999; pp. 127–131. [Google Scholar]
- Yu, G; Sun, D; Zheng, Y. Health effects of exposure to natural arsenic in groundwater and coal in China: an overview of occurrence. Environ. Health Perspect 2007, 115, 636–642. [Google Scholar]
- Guo, X; Fujino, Y; Ye, X; Liu, J; Yoshimura, T. Association between multi-level inorganic arsenic exposure from drinking water and skin lesions in China. Int. J. Environ. Res. Public Health 2006, 3, 262–267. [Google Scholar]
- Guo, X; Fujino, Y; Kaneko, S; Wu, K; Xia, Y; Yoshimura, T. Arsenic contamination of ground-water and prevalence of arsenical dermatosis in the hetao plain area, inner mongolia, china. Mol. Cell Biochem 2001, 222, 137–140. [Google Scholar]
- Mo, J; Xia, Y; Wade, TJ; Schmitt, M; Le, XC; Dang, R; Mumford, JL. Chronic arsenic exposure and oxidative stress: OGG1 expression and arsenic exposure, nail selenium, and skin hyperkeratosis in Inner Mongolia. Environ. Health Perspect 2006, 114, 835–841. [Google Scholar]
- International classification of diseases, 10th revision; World Health Organization: Geneva, Switzerland, 2006.
- Hoyert, D; Heron, M; Murphy, S; Kung, H. Deaths: Final data for 2003. In National vital statistics reports; Technical report; National Center for Health Statistics: Atlanta, GA, USA, 2006. [Google Scholar]
- Gong, Z; Lu, X; Watta, C; Wena, B; Hea, B; Mumford, J; Ning, Z; Xia, Y; Le, XC. Speciation analysis of arsenic in groundwater from Inner Mongolia with an emphasis on acid-leachable particulate arsenic. Anal. Chim. Acta 2006, 555, 181–187. [Google Scholar]
- Selvin, S. Statistical Analysis of Epidemiological Data, 2nd Ed ed; Oxford University Press: New York, USA, 1996. [Google Scholar]
- Williams, RL. A note on robust variance estimation for cluster-correlated data. Biometrics 2000, 56, 645–646. [Google Scholar]
- StataCorp LP. Stata/SE 92 for Windows; StataCorp LP: College Station, TX, USA, 2006. [Google Scholar]
- Ahmad, OB; Boschi-Pinto, C; Lopez, AD; Murray, CJ; Lozano, R; Inoue, M. Age standardization of rates: A new WHO standard Technical Report GPE Discussion Paper Series: No 31; World Health Organization: Geneva, Switzerland, 2001. [Google Scholar]
- World Health Organization. Estimates of death rates for 2002 by cause for WHO Member States; World Health Organization: Geneva, Switzerland, December 2004. [Google Scholar]
- Liu, Z; Lobdell, DT; Myers, SL; He, L; Yang, M; Kwok, RK; Mumford, JL; Mendola, P. Pregnancy and perinatal health in Inner Mongolia, China, 1996–1999. Int. J. Gynaecol. Obstet 2007, 99, 127–131. [Google Scholar]
- Chen, CJ; Chiou, HY; Chiang, MH; Lin, LJ; Tai, TY. Dose-response relationship between ischemic heart disease mortality and long-term arsenic exposure. Arterioscler. Thromb. Vasc. Biol 1996, 16, 504–510. [Google Scholar]
- Axelson, O; Dahlgren, E; Jansson, CD; Rehnlund, SO. Arsenic exposure and mortality: a case-referent study from a Swedish copper smelter. Br. J. Ind. Med 1978, 35, 8–15. [Google Scholar]
- Westervelt, P; Brown, RA; Adkins, DR; Khoury, H; Curtin, P; Hurd, D; Luger, SM; Ma, MK; Ley, TJ; DiPersio, JF. Sudden death among patients with acute promyelocytic leukemia treated with arsenic trioxide. Blood 2001, 98, 266–271. [Google Scholar]
- St Petery, J; Gross, C; Victorica, BE. Ventricular fibrillation caused by arsenic poisoning. Am. J. Dis. Child 1970, 120, 367–371. [Google Scholar]
- Tseng, CH. Abnormal current perception thresholds measured by neurometer among residents in blackfoot disease-hyperendemic villages in Taiwan. Toxicol. Lett 2003, 146, 27–36. [Google Scholar]
- Lewis, DR; Southwick, JW; Ouellet-Hellstrom, R; Rench, J; Calderon, RL. Drinking water arsenic in Utah: A cohort mortality study. Environ. Health Perspect 1999, 107, 359–365. [Google Scholar]
- Rahman, M; Tondel, M; Ahmad, SA; Chowdhury, IA; Faruquee, MH; Axelson, O. Hypertension and arsenic exposure in Bangladesh. Hypertension 1999, 33, 74–78. [Google Scholar]
- Engel, RR; Hopenhayn-Rich, C; Receveur, O; Smith, AH. Vascular effects of chronic arsenic exposure: a review. Epidemiol. Rev 1994, 16, 184–209. [Google Scholar]
- Wang, CH; Jeng, JS; Yip, PK; Chen, CL; Hsu, LI; Hsueh, YM; Chiou, HY; Wu, MM; Chen, CJ. Biological gradient between long-term arsenic exposure and carotid atherosclerosis. Circulation 2002, 105, 1804–1809. [Google Scholar]
- Kwok, RK; Mendola, P; Liu, ZY; Savitz, DA; Heiss, G; Ling, HL; Xia, Y; Lobdell, D; Zeng, D; Thorp, JM; Creason, JP; Mumford, JL. Drinking water arsenic exposure and blood pressure in healthy women of reproductive age in Inner Mongolia, China. Toxicol. Appl. Pharmacol 2007, 222, 337–343. [Google Scholar]
- Some drinking-water disinfectants and contaminants, including arsenic; International agency for research on cancer: Lyon, France, 2004.
- Chen, CJ; Wang, CJ. Ecological correlation between arsenic level in well water and age-adjusted mortality from malignant neoplasms. Cancer Res 1990, 50, 5470–5474. [Google Scholar]
- Wu, MM; Kuo, TL; Hwang, YH; Chen, CJ. Dose-response relation between arsenic concentration in well water and mortality from cancers and vascular diseases. Am. J. Epidemiol 1989, 130, 1123–1132. [Google Scholar]
- Hopenhayn-Rich, C; Biggs, ML; Smith, AH. Lung and kidney cancer mortality associated with arsenic in drinking water in Cordoba, Argentina. Int. J. Epidemiol 1998, 27, 561–569. [Google Scholar]
- Steinmaus, C; Yuan, Y; Bates, MN; Smith, AH. Case-control study of bladder cancer and drinking water arsenic in the western United States. Am. J. Epidemiol 2003, 158, 1193–1201. [Google Scholar]
- Bates, MN; Smith, AH; Cantor, KP. Case-control study of bladder cancer and arsenic in drinking water. Am. J. Epidemiol 1995, 141, 523–530. [Google Scholar]
- Chiou, HY; Huang, WI; Su, CL; Chang, SF; Hsu, YH; Chen, CJ. Dose-response relationship between prevalence of cerebrovascular disease and ingested inorganic arsenic. Stroke 1997, 28, 1717–1723. [Google Scholar]
- Hertz-Picciotto, I; Arrighi, HM; Hu, SW. Does arsenic exposure increase the risk for circulatory disease? Am. J. Epidemiol 2000, 151, 174–181. [Google Scholar]
- Jarup, L; Pershagen, G; Wall, S. Cumulative arsenic exposure and lung cancer in smelter workers: a dose-response study. Am. J. Ind. Med 1989, 15, 31–41. [Google Scholar]
- Mumford, JL; Wu, K; Xia, Y; Kwok, R; Yang, Z; Foster, J; Sanders, WE. Chronic arsenic exposure and cardiac repolarization abnormalities with qt interval prolongation in a population-based study. Environ. Health Perspect 2007, 115, 690–694. [Google Scholar]
- Ning, Z; Lobdell, DT; Kwok, RK; Liu, Z; Zhang, S; Ma, C; Riediker, M; Mumford, JL. Residential exposure to drinking water arsenic in Inner Mongolia, China. Toxicol. Appl. Pharmacol 2007, 222, 351–356. [Google Scholar]


| No. | % | |
|---|---|---|
| Sex | ||
| Male | 327 | 57.2% |
| Female | 245 | 42.8% |
| Total | 572 | 100.0% |
| Age category | ||
| 0–5 | 6 | 1.1% |
| 6–10 | 5 | 0.9% |
| 11–15 | 1 | 0.2% |
| 16–20 | 6 | 1.1% |
| 21–30 | 11 | 1.9% |
| 31–40 | 14 | 2.5% |
| 41–50 | 34 | 6.0% |
| 51–60 | 66 | 11.6% |
| 61–70 | 144 | 25.3% |
| 71–80 | 191 | 33.5% |
| Over 80 | 92 | 16.1% |
| Total | 570 | 100.0% |
| Race/Ethnicity | ||
| Han | 571 | 99.8% |
| Mongol | 1 | 0.2% |
| Total | 572 | 100.0% |
| Occupation | ||
| Agriculture | 498 | 89.6% |
| Industry | 2 | 0.4% |
| Professional | 6 | 1.1% |
| Teacher | 7 | 1.3% |
| Student | 6 | 1.1% |
| Service | 2 | 0.4% |
| Not employed | 24 | 4.3% |
| Other | 11 | 2.0% |
| Total | 556 | 100.0% |
| Smoking | ||
| Current smoker | 261 | 46.4% |
| Ex-smoker | 63 | 11.2% |
| Never smoked | 239 | 42.5% |
| Total | 563 | 100.0% |
| Education | ||
| College | 1 | 0.2% |
| High school | 17 | 3.0% |
| Middle school | 60 | 10.5% |
| Primary school | 81 | 14.2% |
| Some primary or none | 410 | 72.1% |
| Total | 569 | 100.0% |
| Household income (Yuan) | ||
| 0–999 | 30 | 5.2% |
| 1000–9999 | 391 | 68.4% |
| 10000 or more | 151 | 26.4% |
| Total | 572 | 100.0% |
Alcohol drinking | ||
| Never drinker | 381 | 67.8% |
| Ever drinker | 181 | 32.2% |
| Total | 562 | 100.0% |
Years exposed to current water source | ||
| Under 1 | 2 | 0.4% |
| 1–10 | 247 | 43.4% |
| 11–20 | 262 | 46.0% |
| 21–30 | 58 | 10.2% |
| Total | 569 | 100.0% |
Well water arsenic (μg/L) | ||
| 0–5 | 176 | 31.3% |
| 5.1–20 | 102 | 18.1% |
| 20.1–100 | 234 | 41.6% |
| 100.1–300 | 42 | 7.5% |
| Over 300 | 8 | 1.4% |
| Total | 562 | 100.0% |
Well source | ||
| Community well or other | 145 | 25.5% |
| Hand pump well | 424 | 74.5% |
| Total | 569 | 100.0% |
| All subjects | ||||
|---|---|---|---|---|
| All-cause mortality IRR1/95% CI/p | Heart disease mortality IRR1/95% CI/p | Cancer mortality IRR1/95% CI/p | Stroke mortality IRR1/95% CI/p | |
| Arsenic | ||||
| 50 μg/L increase | 1.02 | 1.12* | 1.07 | 0.82 |
| 0.94,1.11 | 1.01,1.23 | 0.89,1.28 | 0.65,1.03 | |
| 0.616 | 0.034 | 0.464 | 0.086 | |
| Number | 12600 | 12600 | 12600 | 12600 |
Exposed since before 2000 | ||||
| All-cause mortality IRR1/95% CI/p | Heart disease mortality IRR1/95% CI/p | Cancer mortality IRR1/95% CI/p | Stroke mortality IRR1/95% CI/p | |
| Arsenic | ||||
| 50 μg/L increase | 1.04 | 1.13* | 1.09 | 0.82 |
| 0.95,1.13 | 1.02,1.26 | 0.92,1.30 | 0.64,1.05 | |
| 0.394 | 0.016 | 0.305 | 0.109 | |
| Number | 8967 | 8967 | 8967 | 8967 |
Exposed since before 1995 | ||||
| All-cause mortality IRR1/95% CI/p | Heart disease mortality IRR1/95% CI/p | Cancer mortality IRR1/95% CI/p | Stroke mortality IRR1/95% CI/p | |
| Arsenic | ||||
| 50 μg/L increase | 1.09 | 1.19** | 1.18* | 0.86 |
| 0.99,1.19 | 1.05,1.33 | 1.00,1.40 | 0.67,1.12 | |
| 0.084 | 0.005 | 0.048 | 0.266 | |
| Number | 6394 | 6394 | 6394 | 6394 |
Exposed since before 1990 | ||||
| All-cause mortality IRR1/95% CI/p | Heart disease mortality IRR1/95% CI/p | Cancer mortality IRR1/95% CI/p | Stroke mortality IRR1/95% CI/p | |
| Arsenic | ||||
| 50 μg/L increase | 1.12* | 1.24*** | 1.20 | 0.88 |
| 1.01,1.23 | 1.10,1.41 | 1.00,1.44 | .68,1.15 | |
| 0.027 | 0.001 | 0.056 | 0.356 | |
| Number | 3213 | 3213 | 3213 | 3213 |
Exposed since before 1985 | ||||
| All-cause mortality IRR1/95% CI/p | Heart disease mortality IRR1/95% CI/p | Cancer mortality IRR1/95% CI/p | Stroke mortality IRR1/95% CI/p | |
| Arsenic | ||||
| 50 μg/L increase | 1.15** | 1.22* | 1.22* | 0.98 |
| 1.03,1.27 | 1.03,1.44 | 1.03,1.45 | 0.76,1.26 | |
| 0.009 | 0.021 | 0.023 | 0.866 | |
| Number | 1775 | 1775 | 1775 | 1775 |
| Arsenic (μg/L) | All deaths | Rate (per 100,000) | Adjusted IRR1 | 95% CI | p |
| 0–5 | 115 | 1218.05 | ref | ref | ref |
| 5.1–20 | 49 | 985.49 | 0.87 | 0.62–1.22 | 0.413 |
| 20.1–100 | 86 | 1181.58 | 0.92 | 0.70–1.22 | 0.573 |
| 100.1–300 | 31 | 1459.02 | 1.05 | 0.71–1.54 | 0.815 |
| Over 300 | 6 | 3599.29 | 3.39 | 1.32–8.69 | 0.011 |
| Arsenic (μg/L) | Heart disease | Rate (per 100,000) | Adjusted IRR1 | 95% CI | p |
| 0–5 | 36 | 381.3 | ref | ref | ref |
| 5.1–20 | 12 | 241.35 | 0.75 | 0.37–1.51 | 0.418 |
| 20.1–100 | 37 | 508.36 | 1.28 | 0.79–2.07 | 0.315 |
| 100.1–300 | 15 | 705.98 | 1.60 | 0.87–2.95 | 0.132 |
| Over 300 | 2 | 1199.77 | 5.08 | 1.45–17.81 | 0.011 |
| Arsenic (μg/L) | Cancer | Rate (per 100,000) | Adjusted IRR1 | 95% CI | p |
| 0–5 | 11 | 116.51 | ref | ref | ref |
| 5.1–20 | 11 | 221.23 | 2.11 | 0.92–4.85 | 0.078 |
| 20.1–100 | 12 | 164.87 | 1.40 | 0.60–3.26 | 0.438 |
| 100.1–300 | 4 | 188.26 | 1.42 | 0.45–4.46 | 0.545 |
| Over 300 | 1 | 599.89 | 6.25 | 1.08–36.22 | 0.041 |
| Arsenic (μg/L) | Stroke | Rate (per 100,000) | Adjusted IRR1 | 95% CI | p |
| 0–5 | 40 | 423.67 | ref | ref | ref |
| 5.1–20 | 13 | 261.46 | 0.62 | 0.33–1.18 | 0.147 |
| 20.1–100 | 20 | 274.79 | 0.65 | 0.38–1.12 | 0.118 |
| 100.1–300 | 6 | 282.39 | 0.58 | 0.26–1.29 | 0.181 |
| Over 300 | 1 | 599.88 | 1.64 | 0.31–8.77 | 0.565 |
| Arsenic (μg/L) | All deaths | Rate (per 100,000) | Adjusted IRR1 | 95% CI | p |
| 0–5 | 146 | 997.55 | ref | ref | ref |
| 5.1–20 | 79 | 873.26 | 0.89 | 0.68–1.17 | 0.401 |
| 20.1–100 | 179 | 837.75 | 0.84 | 0.68–1.06 | 0.139 |
| 100.1–300 | 37 | 1116.73 | 1.00 | 0.70–1.42 | 1.000 |
| Over 300 | 6 | 2408.52 | 2.28 | 0.75–6.95 | 0.146 |
| Arsenic (μg/L) | Heart disease | Rate (per 100,000) | Adjusted IRR1 | p | |
| 0–5 | 44 | 300.63 | ref | ref | ref |
| 5.1–20 | 26 | 287.4 | 1.07 | 0.64–1.78 | 0.810 |
| 20.1–100 | 72 | 336.97 | 1.22 | 0.82–1.82 | 0.317 |
| 100.1–300 | 17 | 513.09 | 1.55 | 0.88–2.73 | 0.125 |
| Over 300 | 2 | 802.83 | 2.47 | 0.50–12.18 | 0.265 |
| Arsenic (μg/L) | Cancer | Rate (per 100,000) | Adjusted IRR1 | 95% CI | p |
| 0–5 | 15 | 102.49 | ref | ref | ref |
| 5.1–20 | 14 | 154.75 | 1.62 | 0.79–3.33 | 0.191 |
| 20.1–100 | 24 | 112.32 | 1.13 | 0.59–2.19 | 0.708 |
| 100.1–300 | 6 | 181.09 | 1.50 | 0.58–3.85 | 0.398 |
| Over 300 | 1 | 401.42 | 3.99 | 0.59–27.17 | 0.157 |
| Arsenic (μg/L) | Stroke | Rate (per 100,000) | Adjusted IRR1 | 95% CI | p |
| 0–5 | 53 | 362.13 | ref | ref | ref |
| 5.1–20 | 16 | 176.86 | 0.47 | 0.27–0.84 | 0.010 |
| 20.1–100 | 41 | 191.89 | 0.51 | 0.34–0.79 | 0.002 |
| 100.1–300 | 7 | 211.27 | 0.52 | 0.25–1.10 | 0.087 |
| Over 300 | 1 | 401.41 | 1.02 | 0.16–6.71 | 0.980 |
| All subjects | ||||
|---|---|---|---|---|
| All-cause mortality IRR1/95% CI/p | Heart disease mortality IRR1/95% CI/p | Cancer mortality IRR1/95% CI/p | Stroke mortality IRR1/95% CI/p | |
| Arsenic | ||||
| 50 μg/L increase | 1.02 | 1.12* | 1.07 | 0.82 |
| 0.94,1.11 | 1.01,1.23 | 0.89,1.28 | 0.65,1.03 | |
| 0.616 | 0.034 | 0.464 | 0.086 | |
| Age | ||||
| 1.09*** | 1.14*** | 1.05*** | 1.11*** | |
| 1.08,1.10 | 1.12,1.15 | 1.03,1.07 | 1.09,1.13 | |
| 0.000 | 0.000 | 0.000 | 0.000 | |
| Sex | ||||
| (female vs male) | 0.83 | 1.18 | 0.63 | 0.85 |
| 0.67,1.02 | 0.86,1.62 | 0.38,1.07 | 0.55,1.29 | |
| 0.073 | 0.300 | 0.085 | 0.440 | |
| Education2 | ||||
| 1.27** | 1.03 | 1.75** | 1.20 | |
| 1.09,1.49 | 0.81,1.30 | 1.20,2.57 | 0.87,1.66 | |
| 0.003 | 0.832 | 0.004 | 0.267 | |
| Current smoker | ||||
| (yes vs. no) | 1.17 | 1.33 | 2.47*** | 1.13 |
| 0.97,1.42 | 0.96,1.84 | 1.53,3.99 | 0.76,1.68 | |
| 0.101 | 0.085 | 0.000 | 0.551 | |
| Alcohol use | ||||
| (yes vs. no) | 1.15 | 0.96 | 1.32 | 0.97 |
| 0.94,1.40 | 0.67,1.36 | 0.79,2.20 | 0.64,1.47 | |
| 0.178 | 0.802 | 0.284 | 0.882 | |
| Farmer | ||||
| (yes vs. no) | 1.27 | 3.31*** | 1.72 | 1.29 |
| 0.93,1.73 | 1.83,5.98 | 0.71,4.18 | 0.74,2.26 | |
| 0.132 | 0.000 | 0.233 | 0.375 | |
| N | 12600 | 12600 | 12600 | 12600 |
© 2009 by the authors; licensee Molecular Diversity Preservation International, Basel, Switzerland. This article is an open-access article distributed under the terms and conditions of the Creative Commons Attribution license (http://creativecommons.org/licenses/by/3.0/).
Share and Cite
Wade, T.J.; Xia, Y.; Wu, K.; Li, Y.; Ning, Z.; Le, X.C.; Lu, X.; Feng, Y.; He, X.; Mumford, J.L. Increased Mortality Associated with Well-Water Arsenic Exposure in Inner Mongolia, China. Int. J. Environ. Res. Public Health 2009, 6, 1107-1123. https://doi.org/10.3390/ijerph6031107
Wade TJ, Xia Y, Wu K, Li Y, Ning Z, Le XC, Lu X, Feng Y, He X, Mumford JL. Increased Mortality Associated with Well-Water Arsenic Exposure in Inner Mongolia, China. International Journal of Environmental Research and Public Health. 2009; 6(3):1107-1123. https://doi.org/10.3390/ijerph6031107
Chicago/Turabian StyleWade, Timothy J., Yajuan Xia, Kegong Wu, Yanhong Li, Zhixiong Ning, X Chris Le, Xiufen Lu, Yong Feng, Xingzhou He, and Judy L. Mumford. 2009. "Increased Mortality Associated with Well-Water Arsenic Exposure in Inner Mongolia, China" International Journal of Environmental Research and Public Health 6, no. 3: 1107-1123. https://doi.org/10.3390/ijerph6031107