Avoidable Portion of Tobacco-Attributable Acute Care Hospital Days and Its Cost Due to Implementation of Different Intervention Strategies in Canada

Abstract
:1. Introduction
2. Methodology
2.1. Selection of Interventions
2.2. Methodological Considerations for Statistical Modeling
- → Estimation of population disease with sex and age specific population-attributable fractions, in the case of tobacco with smoking-attributable fractions (SAF).
- → Based on SAF, tobacco-attributable morbidity expressed in the number of acute care hospital days.
2.3. Computing Smoking-Attributable Fractions
| RR(x) | relative risk at exposure level x |
| P(x) | population distribution of exposure |
| P′(x) | counterfactual distribution of exposure (often 0 = no exposure for tobacco) |
| m | maximum exposure level |
2.4. Smoking Risk Relations
2.5. Prevalence of Smoking in Canada
- Yearly quitting rates of 10%;
- The assumption that 80% of smokers wanted to quit;
- The assumption of an annual incidence rate (new cases of smokers before and after intervention in the specified year) of 0.46% for current female non-smokers, and prevalence proportionate incidence rate for males.
2.6. Morbidity Data
2.7. Estimating Avoidable Morbidity and Its Cost
3. Results
3.1. Collection of Evidence for Most Common Interventions
a) Public policy interventions:
1) Price increase
b) Interventions focusing on individual behavioural change (counselling, brief advice, therapy):
2) Individual behavioural counselling (IBC) for smoking cessation
3) Nicotine replacement therapy (NRT) for smoking cessation
4) Physician advice for smoking cessation
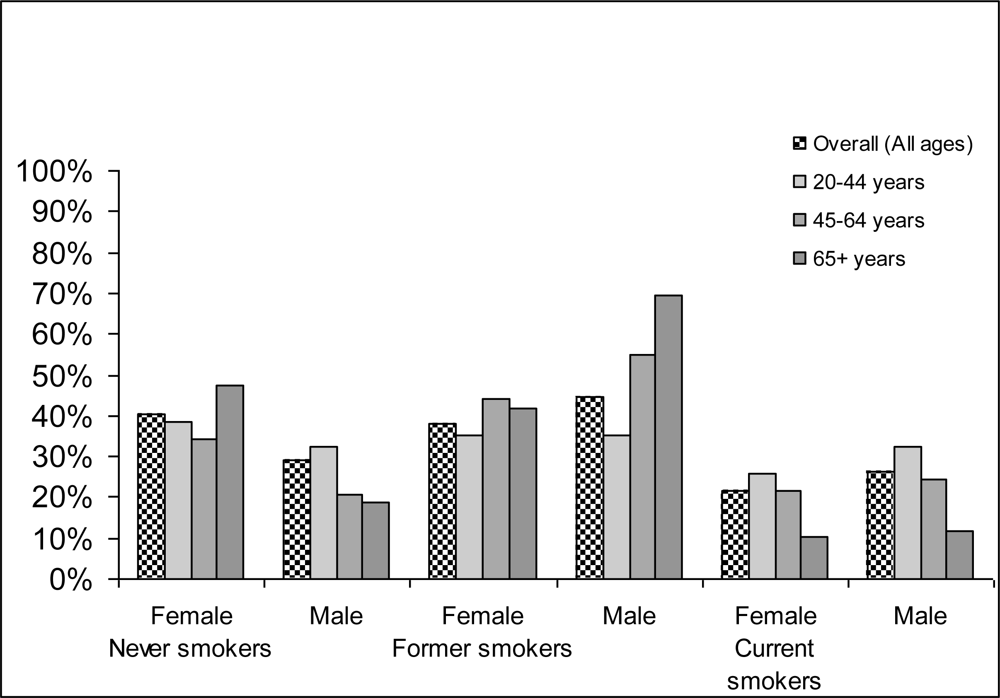
3.2. Exposure
3.3. Tobacco-Attributable Morbidity in Canada 2002
3.4. Effectiveness of Interventions
3.5. Avoidable Morbidity and Its Cost in Canada
3.6. Limitations and Conclusion of the Study
Acknowledgments
References
- USDHHS – US Department of Health and Human Services. The Health Consequences of Smoking: A Report of the Surgeon General; USDHHS, Center for Chronic Disease Prevention and Health Promotion, Office of Smoking and Health: Atlanta, GA, USA, 2004. [Google Scholar]
- WHO. The World Health Report 2002: Reducing Risks, Promoting Healthy Life; WHO: Geneva, Switzerland, 2002. [Google Scholar]
- Rehm, J; Baliunas, D; Brochu, S; Fischer, B; Gnam, W; Patra, J; Popova, S; Sarnocinska-Hart, A; Taylor, B. The Costs of Substance Abuse in Canada 2002; Canadian Centre on Substance Abuse: Ottawa, Canada, 2006. [Google Scholar]
- Rehm, J; Gnam, W; Popova, S; Baliunas, D; Brochu, S; Fischer, B; Patra, J; Sarnocinska-Hart, A; Taylor, B. The social costs of alcohol, illegal drugs and tobacco in Canada 2002. J. Stud. Alcohol Drugs 2007, 68, 886–895. [Google Scholar]
- Drummond, M; O’Brien, B; Stoddart, GL; Torrance, GW. Methods for the Economic Evaluation of Health Care Programmes; Oxford University Press: Oxford, UK, 1997. [Google Scholar]
- Drummond, M; McGuire, A. Economic Evaluation in Health Care: Merging Theory with Practice; Oxford University Press: Oxford, UK, 2001. [Google Scholar]
- Rehm, J. Ökonomische Aspekte von Substanzmissbrauch. In Lehrbuch der Suchterkrankungen; Gastpar, M, Mann, K, Rommelspacher, H, Eds.; G Thieme Verlag: Stuttgart, Germany, 1999; pp. 118–127. [Google Scholar]
- Rehm, J; Frick, U; Fischer, B. Zur Ökonomie des Suchtmittelgebrauchs. In Oekonomie der Sucht und Suchttherapie; Tretter, F, Erbas, B, Sonntag, G, Eds.; Pabst: Lengerich, Berlin, Germany, 2004; pp. 233–244. [Google Scholar]
- Tretter, F; Erbas, B; Sonntag, G. Okonomie der Sucht und Suchtterapie; Pabst: Lengerich, Berlin, Germany, 2004. [Google Scholar]
- Ezzati, M; Lopez, AD; Rodgers, AD; Vander Hoorn, S; Murray, CJL; Comparative Risk Assessment Collaborating Group. Selected major risk factors and global and regional burden of Ddisease. Lancet 2002, 360, 1347–1360. [Google Scholar]
- Ezzati, M; Vander Hoorn, S; Rodgers, A; Lopez, A; Mathers, C. Estimates of global and regional potential health gains from reducing multiple major risk factors. Lancet 2003, 362, 271–280. [Google Scholar]
- Shibuya, K; Ciecierski, C; Guindon, E; Bettcher, D; Evans, D; Murray, C. WHO framework convention on tobacco control: development of an evidence based global public health treaty. BMJ 2003, 327, 154–157. [Google Scholar]
- Single, E; Robson, L; Xie, X; Rehm, J. The costs of substance abuse in Canada; Canadian Centre on Substance Abuse: Ottawa, Canada, 1996. [Google Scholar]
- Single, E; Robson, L; Xie, X; Rehm, J. The economic costs of alcohol, tobacco and illicit drugs in Canada, 1992. Addiction 1998, 93, 991–1006. [Google Scholar]
- Murray, C; Lopez, A. The Global Burden of Disease: A Comprehensive Assessment of Mortality and Disability from Diseases, Injuries and Risk Factors in 1990 and Projected to 2020; Harvard University: Cambridge, MA, USA, 1996. [Google Scholar]
- Murray, C; Evans, D; Archarya, A; Blatussen, R. Development of WHO guidelines on generalized cost-effectiveness analysis. Health Econ 2000, 9, 235–251. [Google Scholar]
- WHO. World Health Report 2001: Mental Health: New Understanding, New Hope; WHO: Geneva, Switzerland, 2001. [Google Scholar]
- Miettinen, O. Proportion of disease caused or prevented by a given exposure, trait or intervention. Am. J. Epidemiol 1974, 99, 325–332. [Google Scholar]
- Eide, G; Heuch, I. Attributable fractions: fundamental concepts and their visualization. Stat. Methods Med. Res 2001, 10, 159–193. [Google Scholar]
- Walter, SD. The estimation and interpretation of attributable risk in health research. Biometrics 1976, 32, 829–849. [Google Scholar]
- Walter, SD. Prevention of multifactorial disease. Am. J. Epidemiol 1980, 112, 409–416. [Google Scholar]
- Rothman, K. Causes. Am. J. Epidemiol 1976, 104, 587–592. [Google Scholar]
- Rothman, K; Greenland, S. Causation and Casual Inference, 2nd ed; Lippincott-Raven Publishers: Philadelphia, PA, USA, 1998. [Google Scholar]
- IARC – International Agency for Research on Cancer. Monographs on the Evaluation of Carcinogenic Risks to Humans. Tobacco Smoke and Involuntary Smoking; IARC: Lyon, France, 2004. [Google Scholar]
- English, D; Holman, C; Milne, E; Winter, M; Hulse, G; Codde, G; Bower, G; Corti, B; de Klerk, N; Knuiman, M; Kurinczuk, J; Lewin, G; Ryan, G. The quantification of drug caused morbidity and mortality in Australia 1995; Commonwealth Department of Human Services and Health: Canberra, Australia, 1995. [Google Scholar]
- Statistics Canada. Canadian Community Health Survey, cycle 2.1; Statistics Canada: Ottawa, Cannada, 2003. [Google Scholar]
- Rehm, J; Zahringer, S; Egli, S. The Epidemiologic and Economic Evaluation of Different Forms of Tobacco Prevention for Switzerland: an Analysis of Exemplary Interventions using Secondary Data; Insitut fur Suchtforschung (ISF): Zurich, Switzerland, 2004. [Google Scholar]
- CIHI-Canadian Institute for Health Information. Data Quality Documentation: Discharge Abstract Database 2002–2003; CIHI: Ottawa, ON, Canada, 2004. [Google Scholar]
- CIHI-Canadian Institute for Health Information. Canadian MIS Database: Hospital Finance Performance Indicators 1999–2000 to 2001–2002; CIHI: Ottawa, ON, Canada, 2004. [Google Scholar]
- Ranson, K; Jha, P; Chaloupka, F; Nguyen, S. The effectiveness and cost-effectiveness of price increases and other tobacco-control policies. In Tobacco Control in Developing Countries; Jha, P, Chaloupka, F, Eds.; Oxford University Press: New York, NY, USA, 2000; pp. 427–447. [Google Scholar]
- Lancaster, T; Stead, LF. Individual behavioural counselling for smoking cessation. Cochrane Database Syst Rev 2006, 4. [Google Scholar]
- Silagy, C; Lancaster, T; Stead, L; Mant, D; Fowler, G. Nicotine replacement therapy for smoking cessation. Cochrane Database Syst Rev 2004, 3. [Google Scholar]
- Lancaster, T; Stead, L. Physician advice for smoking cessation. Cochrane Database Syst Rev 2004, 4. [Google Scholar]


| Cause of morbidity | ICD 9 | ICD10 | RRs (Source: [25]) | Comments | |
|---|---|---|---|---|---|
| FS | CS | ||||
| Lip, oral and pharyngeal cancer | 140–149 | C00–C14 | 1.76 | 4.55 | RRs for codes: 140–141, 143–149 |
| Esophageal cancer | 150 | C15 | 1.79 | 4.01 | |
| Stomach cancer | 151 | C16 | 1.11 | 1.41 | |
| Liver cancer | 155 | C22 | 1.07 | 1.71 | |
| Pancreatic cancer | 157 | C25 | 1.15 | 1.86 | |
| Laryngeal cancer | 161 | C32 | 2.86 | 7.48 | |
| Lung cancer – m | 162 | C33–C34 | 6.75 | 13.0 | |
| Lung cancer – w | - | - | 5.07 | 11.4 | |
| Cervical cancer | 180 | C53 | 1.31 | 1.75 | RRs for codes: 180, 233.1 |
| Bladder cancer | 188 | C67 | 1.66 | 2.72 | |
| Kidney, other urinary cancer | 189 | C64–C66, C68 | 1.61 | 1.64 | Renal parenchymal carcinoma −189.0 |
| Leukemia | 204–208 | C91–C95 | 1.21 | 1.01 | |
| Parkinson disease | 332 | G20–G21 | 0.57 | 0.57 | |
| Ischaemic heart disease <65 | 410–414 | I20–I25 | 1.45 | 3.06 | |
| Ischaemic heart disease -m 65+ | - | - | 0.93 | 1.67 | |
| Ischaemic heart disease -w 65+ | - | - | 1.22 | 1.67 | |
| Other heart diseases | 390–398, 415–417, 420–429 | I00–I09, I26–I51 | NA | NA | |
| Cerebrovascular disease <65 | 430–438 | I60–I69 | 1.30 | 3.12 | |
| Cerebrovascular disease 65+ | - | - | 1.15 | 1.65 | |
| Atherosclerosis | 440 | I70 | NA | NA | |
| Other arterial diseases | 441–448 | I71–I78 | NA | NA | |
| Atherosclerosis and other arterial diseases | 440–448 | I70–I78 | 1.82 | 2.54 | |
| Pneumonia | 480–487 | J10–J18 | 1.29 | 1.47 | |
| Bronchitis, emphysema | 490–492 | J40–J43 | NA | NA | |
| Chronic airways obstruction | 496 | J44 | NA | NA | |
| COPD | 490–492, 496 | J40–J44 | 6.70 | 9.80 | |
| Peptic ulcer | 531–534 | K25–K27 | 2.24 | 2.07 | |
| Crohn disease – m | 555 | K50 | 1.92 | 1.92 | |
| Crohn disease – w | - | - | 1.60 | 3.27 | |
| Ulcerative colitis | 556 | K51 | 1.71 | 0.63 | |
| Fire injury | E890–E899 | X00–X09 | NA | NA | TAF = 23% |
| Provinces | Average cost per night $ |
|---|---|
| Alberta | 1,311 |
| British Columbia | 1,524 |
| Manitoba | 1,346 |
| New Brunswick | 1,284 |
| Newfoundland | 1,455 |
| Nova Scotia | 1,217 |
| Ontario | 1,045 |
| Prince Edward Island | 798 |
| Quebec | 990 |
| Saskatchewan | 1,263 |
| Northwest Territory | 2,177 |
| Nunavut | SUB |
| Yukon Territory | 883 |
| CANADA | 1,109 |
| Type of intervention | Effect | Reference |
|---|---|---|
| Public policy interventions | ||
| Taxation and price increases | 2% prevalence reduction in smokers associated with 10% increase in price, based on meta-analysis for high income countries. | [30] |
| Interventions focusing on individual behavioural change | ||
| Individual behavioural counselling for smoking cessation (non-medical)
Nicotine replacement therapy for smoking cessation Physician advice for smoking cessation | Cessation ratio of 1.56 (95% CI: 1.32–1.84) compared to controls without intervention
Cessation ratio of 1.58 (95% CI: 1.50–1.66) compared to controls without intervention Cessation ratio of 1.66 (95% CI: 1.42–1.94) compared to controls without intervention | [31]
[32] [33] |
| Overall (all ages >15) | 15–19 Yrs | 20–44 Yrs | 45–64 Yrs | 65+ Yrs | ||||||
|---|---|---|---|---|---|---|---|---|---|---|
| M% | W% | M% | W% | M% | W% | M% | W% | M% | W% | |
| Natural course plus quitters plus new beginners = baseline scenario | ||||||||||
| NS | 29.1 | 40.4 | 58.3 | 59.2 | 32.4 | 38.7 | 20.8 | 34.2 | 18.8 | 47.6 |
| FS | 44.6 | 37.8 | 20.0 | 18.6 | 35.1 | 35.3 | 54.7 | 44.1 | 69.7 | 41.9 |
| CS | 26.3 | 21.8 | 21.8 | 22.2 | 32.5 | 26.0 | 24.5 | 21.7 | 11.5 | 10.5 |
| 100.0 | 100.0 | 100.0 | 100.0 | 100.0 | 100.0 | 100.0 | 100.0 | 100.0 | 100.0 | |
| Taxation change to result in price increases of 10% | ||||||||||
| FS | 45.1 | 38.2 | 20.4 | 19.0 | 35.8 | 35.8 | 55.2 | 44.5 | 69.8 | 42.2 |
| CS | 25.8 | 21.4 | 21.3 | 21.7 | 31.8 | 25.5 | 24.0 | 21.3 | 11.4 | 10.2 |
| 100.0 | 100.0 | 100.0 | 100.0 | 100.0 | 100.0 | 100.0 | 100.0 | |||
| Individual behavioural counselling (assuming 40% coverage based on those willing to quit) | ||||||||||
| FS | 45.2 | 38.3 | 20.5 | 19.0 | 35.9 | 35.9 | 55.3 | 44.6 | 69.9 | 42.2 |
| CS | 25.7 | 21.3 | 21.3 | 21.7 | 31.7 | 25.4 | 23.9 | 21.1 | 11.3 | 10.2 |
| 100.0 | 100.0 | 100.0 | 100.0 | 100.0 | 100.0 | 100.0 | 100.0 | |||
| NRT (assuming 40% coverage based on those willing to quit) | ||||||||||
| FS | 45.4 | 38.5 | 20.6 | 19.3 | 36.2 | 36.1 | 55.5 | 44.9 | 70.0 | 42.4 |
| CS | 25.4 | 21.1 | 21.1 | 21.5 | 31.4 | 25.2 | 23.7 | 20.9 | 11.2 | 10.1 |
| 100.0 | 100.0 | 100.0 | 100.0 | 100.0 | 100.0 | 100.0 | 100.0 | |||
| Physician’s advice (assuming 40% coverage based on those willing to quit) | ||||||||||
| FS | 45.4 | 38.5 | 20.6 | 19.2 | 36.1 | 36.1 | 55.5 | 44.9 | 70.0 | 42.4 |
| CS | 25.5 | 21.1 | 21.1 | 21.5 | 31.5 | 25.2 | 23.7 | 20.9 | 11.2 | 10.1 |
| 100.0 | 100.0 | 100.0 | 100.0 | 100.0 | 100.0 | 100.0 | 100.0 | |||
| All cause | 20–44 Yrs | 45–64 Yrs | 65+Yrs | 20+ Yrs | ||||||||
|---|---|---|---|---|---|---|---|---|---|---|---|---|
| M | W | M | W | M | W | M | W | Total | ||||
| Natural course plus quitters plus new beginners = baseline scenario | 27,789 | 11,155 | 241,401 | 88,257 | 545,869 | 493,782 | 815,059 | 593,193 | 1,408,252 | |||
| Various Intervention Scenarios | Tobacco-attributable acute hospital days saved | |||||||||||
| M | W | Total | ||||||||||
| Taxation change to result in price increases of 10% | 27,635 | 11,102 | 240,316 | 87,898 | 543,801 | 491,614 | 811,753 | 590,614 | 1,402,367 | 3,306 | 2,579 | 5,885 |
| IBC* | 27,613 | 11,091 | 240,098 | 87,808 | 542,765 | 491,614 | 810,477 | 590,513 | 1,400,990 | 4,582 | 2,680 | 7,262 |
| NRT* | 27,546 | 11,069 | 239,661 | 87,627 | 541,729 | 490,528 | 808,936 | 589,225 | 1,398,161 | 6,123 | 3,968 | 10,091 |
| PA* | 27,569 | 11,069 | 239,661 | 87,627 | 541,729 | 490,528 | 808,958 | 589,225 | 1,398,183 | 6,101 | 3,968 | 10,069 |
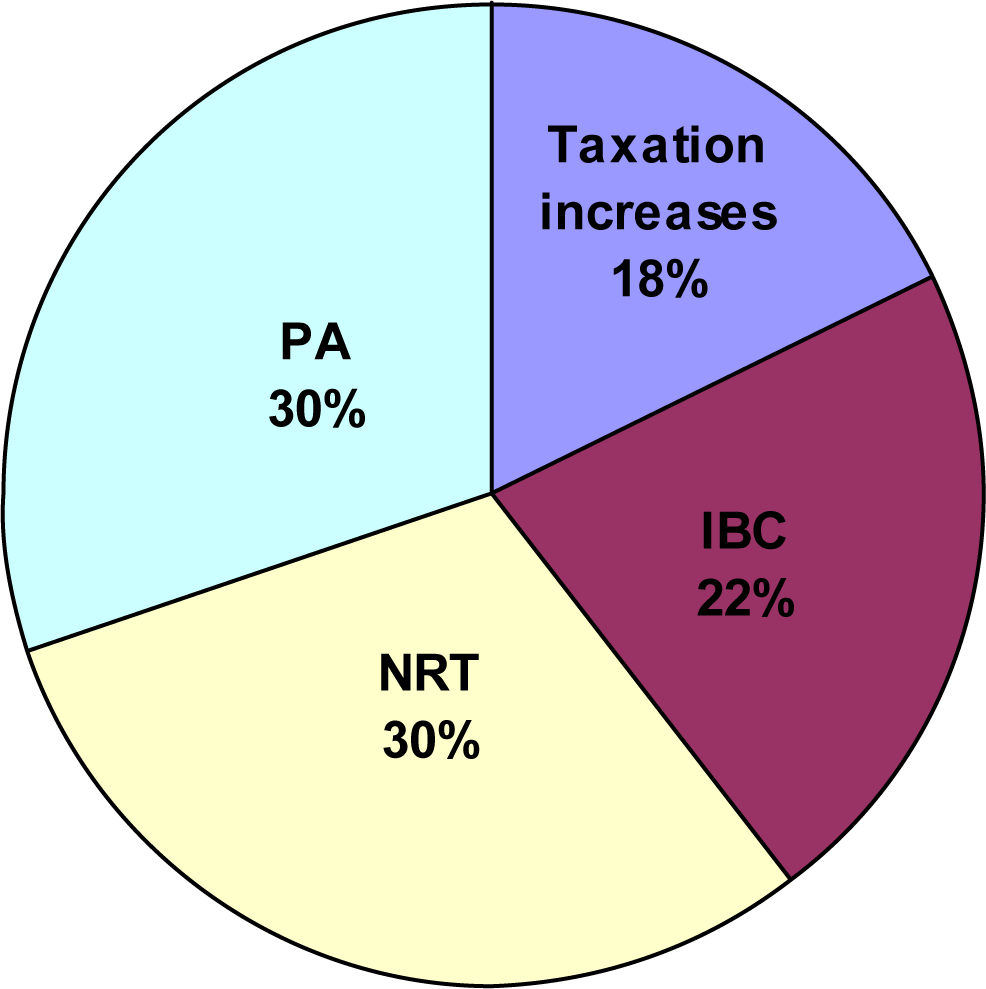
| ALL: taxation, IBC, NRT, PA | - | - | - | - | - | - | - | - | - | 20,111 | 13,196 | 33,307 |
| Selected Interventions | M | W | TOTAL |
|---|---|---|---|
| Baseline | 903,900,431 | 657,851,037 | 1,561,751,468 |
| Taxation change to result in price increases of 10% | 900,234,077 | 654,990,926 | 1,555,225,003 |
| Difference between baseline and this intervention* | 3,666,354 | 2,860,111 | 6,526,465 |
| Relative change between baseline and this intervention | 0.4% | 0.4% | 0.4% |
| IBC (assuming 40% coverage based on those willing to quit) | 898,818,993 | 654,878,917 | 1,553,697,910 |
| Difference between baseline and this intervention* | 5,081,438 | 2,972,120 | 8,053,558 |
| Relative change between baseline and this intervention | 0.6% | 0.5% | 0.5% |
| NRT (assuming 40% coverage based on those willing to quit) | 897,110,024 | 653,450,525 | 1,550,560,549 |
| Difference between baseline and this intervention* | 6,790,407 | 4,400,512 | 11,190,919 |
| Relative change between baseline and this intervention | 0.8% | 0.7% | 0.7% |
| PA (assuming 40% coverage based on those willing to quit) | 897,134,422 | 653,450,525 | 1,550,584,947 |
| Difference between baseline and this intervention* | 6,766,009 | 4,400,512 | 11,166,521 |
| Relative change between baseline and this intervention | 0.7% | 0.7% | 0.7% |
| Difference between baseline and all interventions | 22,304,208 | 14,633,255 | 36,937,463 |
| Relative change between baseline and all interventions | 2.5% | 2.2% | 2.4% |
© 2009 by the authors; licensee Molecular Diversity Preservation International, Basel, Switzerland. This article is an open-access article distributed under the terms and conditions of the Creative Commons Attribution license (http://creativecommons.org/licenses/by/3.0/).
Share and Cite
Popova, S.; Patra, J.; Rehm, J. Avoidable Portion of Tobacco-Attributable Acute Care Hospital Days and Its Cost Due to Implementation of Different Intervention Strategies in Canada. Int. J. Environ. Res. Public Health 2009, 6, 2179-2192. https://doi.org/10.3390/ijerph6082179
Popova S, Patra J, Rehm J. Avoidable Portion of Tobacco-Attributable Acute Care Hospital Days and Its Cost Due to Implementation of Different Intervention Strategies in Canada. International Journal of Environmental Research and Public Health. 2009; 6(8):2179-2192. https://doi.org/10.3390/ijerph6082179
Chicago/Turabian StylePopova, Svetlana, Jayadeep Patra, and Jürgen Rehm. 2009. "Avoidable Portion of Tobacco-Attributable Acute Care Hospital Days and Its Cost Due to Implementation of Different Intervention Strategies in Canada" International Journal of Environmental Research and Public Health 6, no. 8: 2179-2192. https://doi.org/10.3390/ijerph6082179