Article

Modeling of a Photovoltaic-Powered Electric Vehicle Charging Station with Vehicle-to-Grid Implementation

1
DSIM, University of L’Aquila, 67100 L’Aquila, Italy
2
College of E&ME, National University of Science and Technology (NUST), H-12 Islamabad, Pakistan
3
Department of Electrical Engineering, King Saud University, Riyadh 12372, Saudi Arabia
*
Author to whom correspondence should be addressed.
Energies 2017, 10(1), 4; https://doi.org/10.3390/en10010004
Submission received: 18 July 2016 / Revised: 7 November 2016 / Accepted: 13 December 2016 / Published: 22 December 2016

Abstract

:
This paper is aimed at modelling of a distinct smart charging station for electric vehicles (EVs) that is suitable for DC quick EV charging while ensuring minimum stress on the power grid. Operation of the charging station is managed in such a way that it is either supplied by photovoltaic (PV) power or the power grid, and the vehicle-to-grid (V2G) is also implemented for improving the stability of the grid during peak load hours. The PV interfaced DC/DC converter and grid interfaced DC/AC bidirectional converter share a DC bus. A smooth transition of one operating mode to another demonstrates the effectiveness of the employed control strategy. Modelling and control of the different components are explained and are implemented in Simulink. Simulations illustrate the feasible behaviour of the charging station under all operating modes in terms of the four-way interaction among PV, EVs and the grid along with V2G operation. Additionally, a business model is discussed with comprehensive analysis of cost estimation for the deployment of charging facilities in a residential area. It has been recognized that EVs bring new opportunities in terms of providing regulation services and consumption flexibility by varying the recharging power at a certain time instant. The paper also discusses the potential financial incentives required to inspire EV owners for active participation in the demand response mechanism.

1. Introduction

Envisioned large-scale penetration of electric vehicles (EVs) in the system would trigger a need for readily-available charging facilities. A huge amount of EVs’ charging load on the power system could arouse various technical issues, including voltage regulation, harmonic contamination, frequency variations, etc. A smart grid technology may come up with a technique to manage EVs’ charging load and its scheduling in an efficient way with seamless integration and operation of renewable energies in the power system, which can help keep stress on the power grid to a minimum. In the wake of the Smart Grid Initiative, there has been much attention on the impact of large-scale EVs carrying out vehicle-to-grid (V2G) operation through smart control approaches [1,2]. In order to deal with grid limitations during peak load hours, the implementation of the V2G concept enables the use of EVs as an auxiliary power source that can be discharged to feed the grid, and thus, it contributes towards the latter’s stability.
The PV-based power generation can be located on the roof-tops of parking lots for recharging EVs with an effective strategy of power flow management among PVs, EVs and the grid. Different grid-connected EV charging levels (Level 1, Level 2 and Level 3) are defined by the SAEJ1772, IEC62196-2 and CHAdeMO, for single-phase and three-phase slow, medium and DC charging, respectively [3,4,5]. Keeping in view the driving needs of EVs, there is a need to develop fast charging stations with the feature of lesser charging time, and this has to be supported through the deployment of appropriate infrastructure in the power grid [6], including smart meters, power electronic converters and smart load management strategies [7,8,9].
Smart DC charging is based on direct DC charging in which EVs can be supplied either from PV power or the utility grid, and EVs could be discharged for supplying the grid. A DC bus-based system has many advantages over an AC system, such as involving a few stages of power conversion with reduced losses and hardware costs [10,11,12]. This work presents a solar carport-based charging point that can be supplied by DC power for efficient and quick recharging of electric cars. A charging station supplied by a PV source may provide an economical recharging facility. The charging station involves vehicle driver’s participation in the electricity market by selling extra stored energy in the vehicle, when not needed, back to the charging station during peak hours for better economy. The idea of utilizing the electric vehicle as a power source may serve to a great extent to satisfy the mean power demand at economical cost. It is considered a potential concept in dealing with the intermittency and fluctuating nature of renewable energy sources. A block diagram of the system is shown in Figure 1.
There have been many attempts by researchers to present DC charging station [13,14] with a limited discussion on the potential solution through efficient power management. For instance, the authors in [15] proposed an intelligent energy management system to allocate power for recharging EVs with the optimal use of supplied and recharging time, but the power electronic converter-based implementation of the management system is not significantly reported. The authors in [16,17] have presented numerous EV control and modelling strategies, including reactive power compensation given in [18,19]. Large-scale placement of photovoltaic-powered charging facilities in a public parking lot is analysed in [20]. A practical control strategy for an electric vehicle charging station consists of a photovoltaic array, the power grid and a lithium ion battery emulator, as illustrated in [21,22]. The economics of a PV-powered charging station are investigated in [23,24]. However, none of those ensure an effective and efficient strategy for the management of EVs’ charging load though multiple-mode operation. The presented charging station is made to operate in three different modes, including V2G operation, i.e., EV discharging to the grid with seamless transition from charging to discharging mode. The presented strategy is validated through simulations carried out in MATLAB/Simulink. Additionally, the positive impact of EVs is given in [25,26,27]. In this paper, a business model is envisioned with a cost-benefit analysis under EVs’ penetration for the assessment of the cost for charging infrastructure and external factors, such as health and climate benefits.
In principle, a distribution system must be designed to withstand the power demand during peak load hours. An additional load of EVs can be supplied during the off-peak period without additional generation capacity. In general, an optimal time to recharge EVs is between the hours of the evening and early morning, and thus, it needs to be managed through the enforcement of some incentive-based techniques. In other words, EVs can actively participate in the demand response by offering financial benefits to EV owners. The implementation of vehicle-to-grid (V2G) technology depends on whether an EV owner is willing to trade his/her surplus energy for some money versus his/her convenience. In this regard, the efficiency of energy delivery and its effect on battery life are also of great concern. A traditional means lies in offering regulation by modulating the required power level during EV recharging and discharging. A principle adopted in [6] is meant to maximize the aggregator revenue from EV users and the grid. The authors in [28] presented an algorithm to manage an EV fleet assisting wind power generation to preserve a stable output. A technique based on variation in real time for recharging an EV may respond to regulation signals sent from the system operator with the purpose of power exchange for remuneration. For instance, a regulation scheme given in [6] entitles EV owners to freely decide whether to go for the regulating-while-recharging option. With the advent of recent technological changes in distribution engineering, it can be seen that the pricing factor has gained significance in smart grid operations [29]. A discussion on dynamic EV charging pricing was started in [30], and the relevant concepts are broadly debated for demand response options in [31,32]. Incentives are considered important to actuate demand response in both the residential, as well as the industrial sector. Smart grids and EVs’ penetration in the market move the discussion of dynamic pricing to the level of distribution networks [33]. Nonetheless, the response will be assisted by innovative automation technology.
This paper is organized as follows: The charging station architecture is illustrated in Section 2. The description of the EV battery is given in Section 3. Section 4 contains an explanation of the various components of the smart charging station, and simulations are detailed in Section 6. A business model of the EV charging infrastructure along with incentives for EVs’ participation in demand response and regulation are explained in Section 5. The paper is concluded in Section 7.

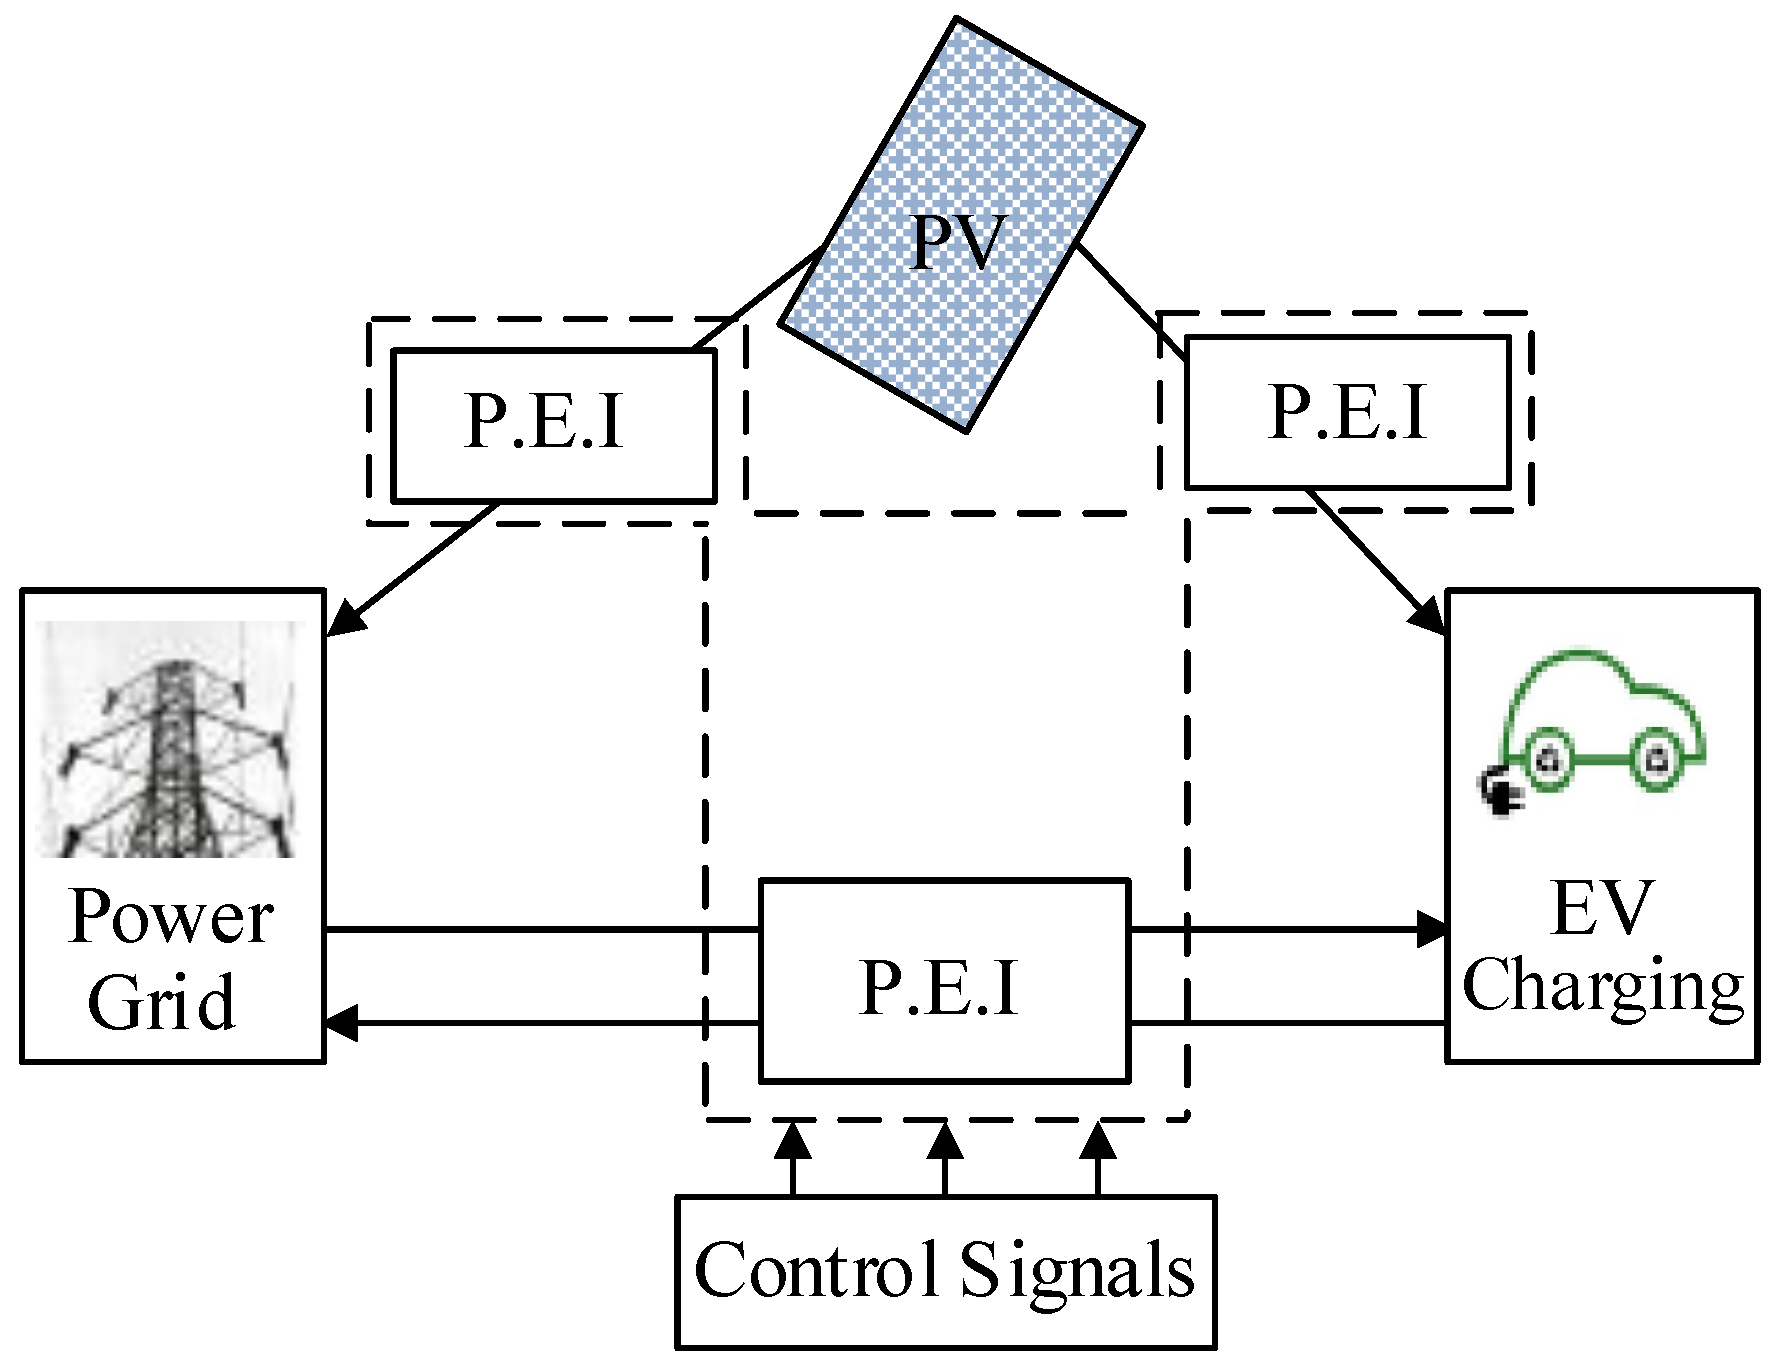
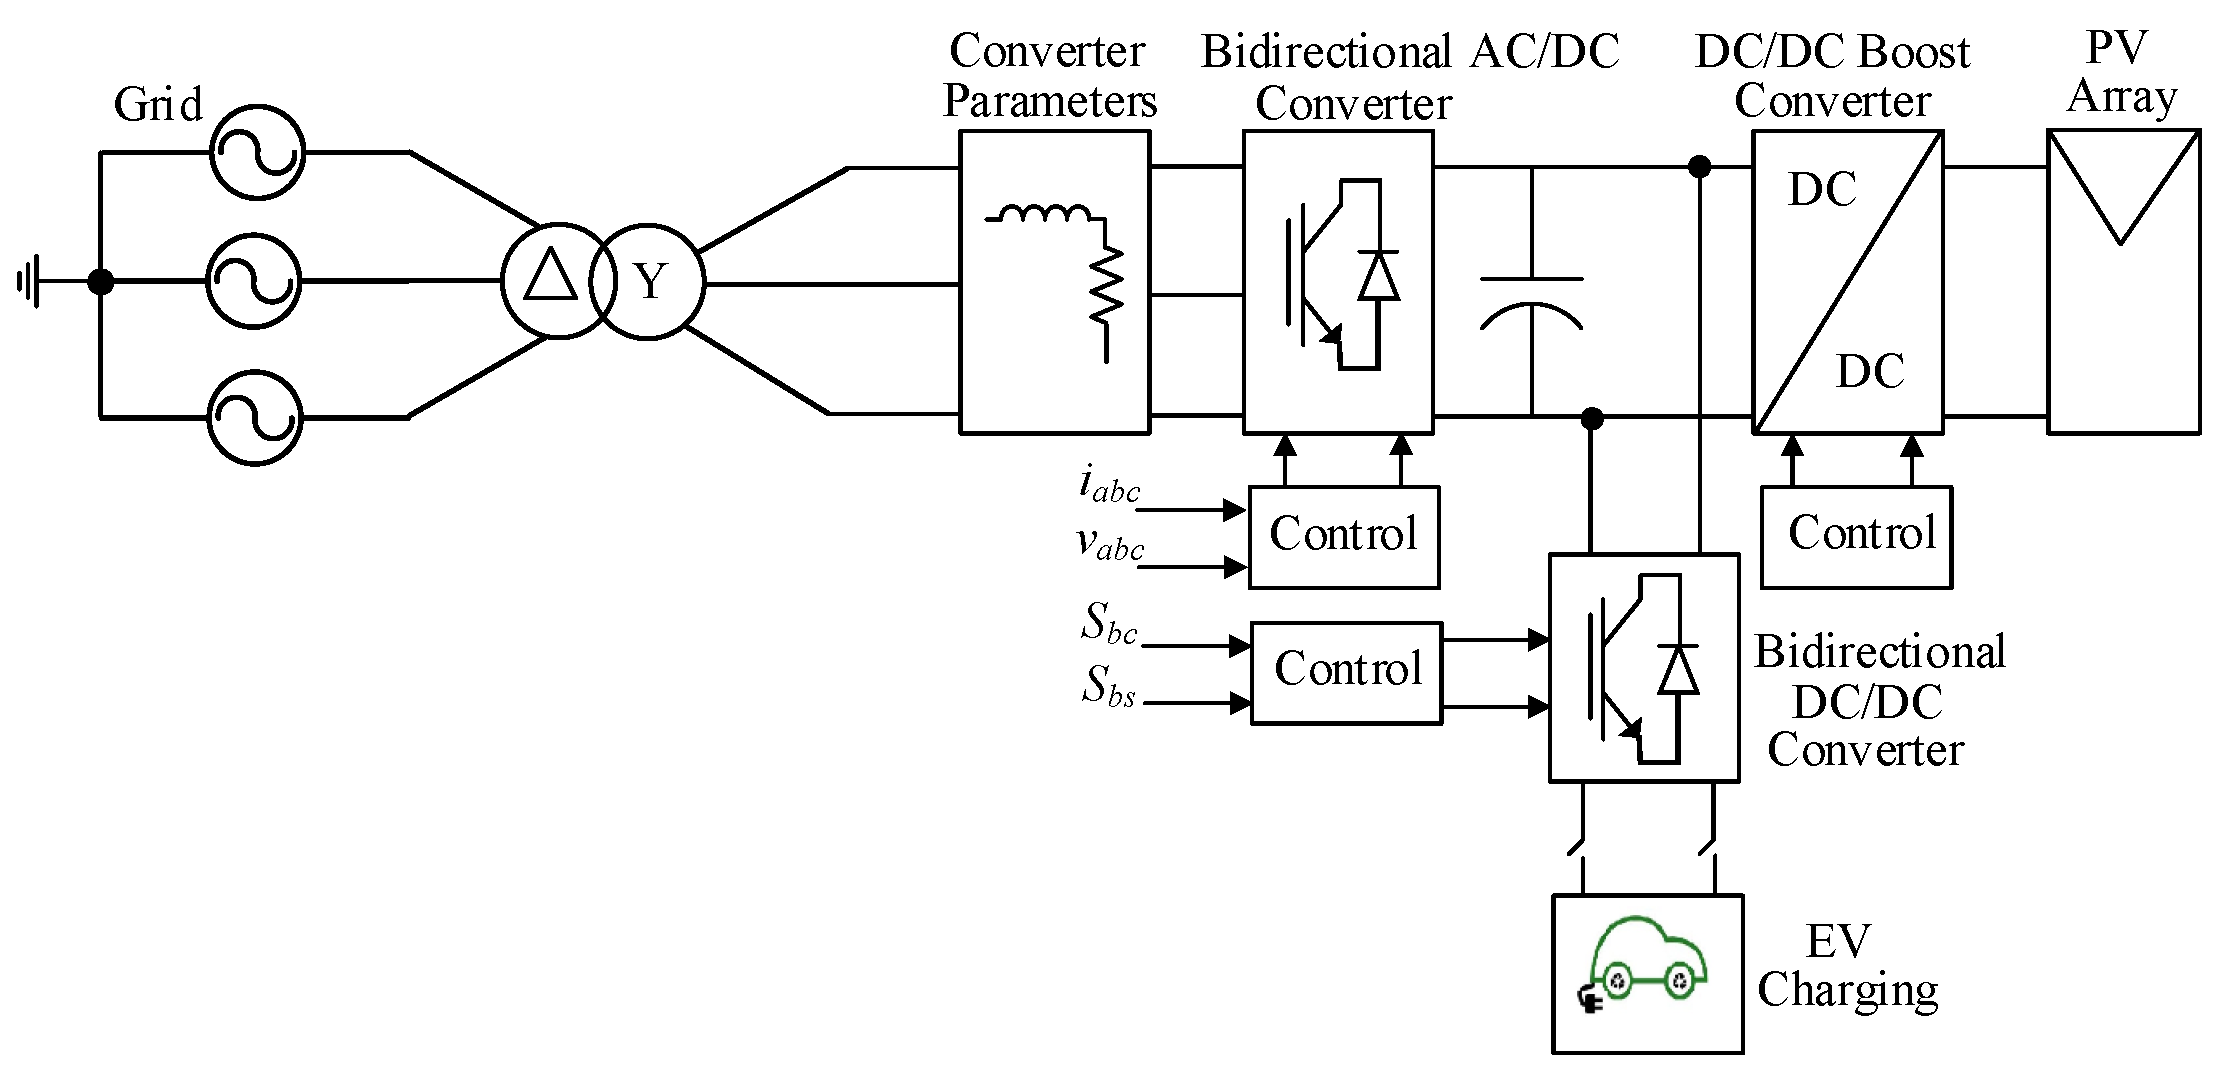
2. Smart Charging Station Architecture

The proposed charging station is primarily supplied by PV power generation, and if necessary, power could be drawn from the utility grid via the corresponding DC/DC boost converter and bidirectional power converter, respectively. EVs can be operated in V2G mode, i.e., EVs are discharged to the grid during peak load hours provided that extra energy is available in them. The charging station architecture is shown in Figure 2. EV charging is supplied by a common DC bus that is energized by either PV or the utility grid depending on the availability and operating conditions, respectively. Major components of the whole system include the bidirectional grid-interfaced power converter, the DC-DC boost converter with the function of maximum power point tracking (MPPT) that delivers PV power generation to the variable DC bus and an EV battery charger with a bidirectional DC-DC buck boost converter for recharging and discharging of EVs, respectively. All of these components are explained in the following subsections. A controller is employed that decides the power flow direction among three blocks of the system depending on the change in DC bus voltage.

2.1. Modes of Operation of the Charging Station

The direction of power flow is monitored and controlled in three different modes; parameters, including voltage magnitude at the DC link, V d c , the state of charge S O C of the EV battery and the current loading on the grid I g (this can be acquired from the data acquisition centre in a smart grid environment by using techniques given in [34]), are used to determine the required action to cause the power to flow in the required direction. In the perspective of intermittent solar power generation and the consequent change in voltage level at the DC bus, control of the system is subject to the sensing and regulation of voltage levels at the common DC bus, which is switched to operate in different modes [35]. In fact, for the purpose of simplicity, but without loss of generality, the design principles and modelling are implemented in MATLAB/Simulink in an educational way to support academic research. The presented EV charging station is formulated in an educational manner that allows its further implementation and research on the subject. In order to maintain the simplicity of the educational research problem, different values are taken for clear and better understanding of the modes of operation with corresponding voltage levels.
P r e q is the amount of power required to recharge EVs at time t; P p v is the power available from PV; E V s o c represents the state of charge of the EV battery; P t o t is the total power available at time t; P p v , m i n is the minimum available power through PV that is greater than zero; P g is the grid power available at t; P g , m a x is the maximum power demand from the grid; and E V s o c , t h is the energy stored in EV greater than the required amount for the operation of the vehicle.
Mode I: EV charging through PV power:
P p v P r e q and E V s o c < E V s o c , t h
In this mode, PV generates enough power to recharge EVs at time t, and no power is required from the grid to meet the EV charging power demand; in this case, the bidirectional DC/DC power converter acts in buck mode for recharging the EV battery. However, the charging is stopped when the S O C of the EV is maximum; then, the PV power is supplied to the grid, and grid-tied power converter inverts DC into AC. Thus, the operation of Mode I may lie in two cases: Case I is when the whole PV power is used for recharging electric vehicle, and Case II is observed when PV is redirected to the grid.
Mode II: Meeting EV charging power demand through both sources—PV power and the utility grid:
P p v > P p v , m i n and P p v < P r e q
In this case, PV power is not sufficient to support EV charging demand, and thus, the latter is supplied by a combination of PV power and the grid. In this mode, the grid-tied power converter acts in rectification mode, and the EV interfaced bidirectional DC/DC converter serves in buck mode.
Mode III: Vehicle-to-grid mode: the EV is discharged (V2G) to contribute towards the stability of the power grid, and/or subject to availability, the PV power may also be directed to the grid.
P p v > P r e q or E V s o c > E V s o c , t h and P g < P g , m a x
In the third mode of operation, the concept of V2G is performed. In this situation, the EV battery interfaced bidirectional DC/DC converter acts in boost mode and supplies energy to the grid, and PV power is also directed to the grid depending on the availability and concurrent operating conditions of all elements of the system. EV is used as an auxiliary power source and helps stabilize the power grid during peak hours. However, the availability of power from EVs depends on the availability and vehicle driver’s willingness to either sell energy by discharging EV or not.

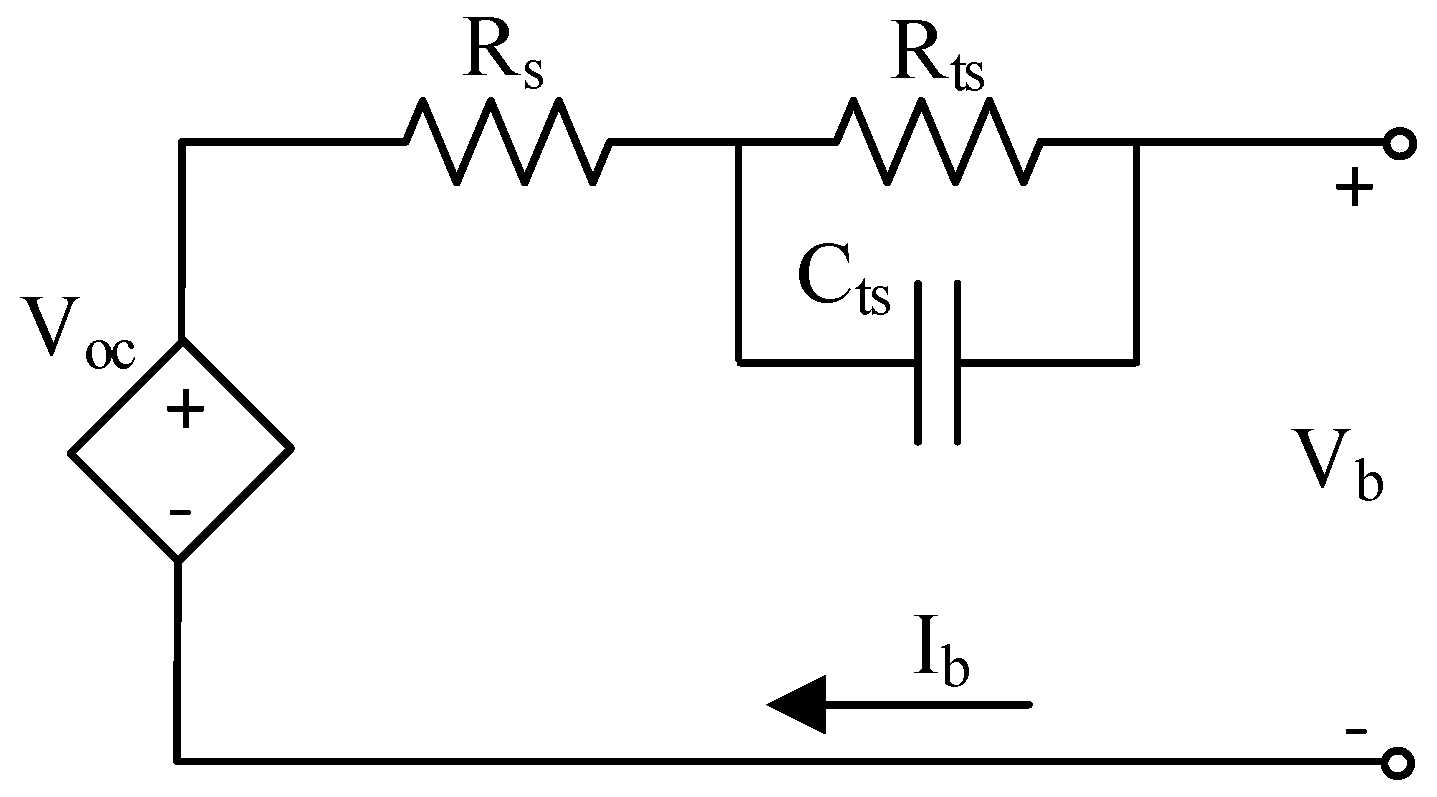
3. Electric Vehicle Battery

An EV is represented by a battery that is charged through its charger. The charger model shall be explained in the next section. An appropriate modelling of the battery is necessary for its smooth operation. Some battery models, including electrical, electro-chemical and mathematical models, are presented in [36]. For this study, an electrical model of the battery is considered accurate in terms of its characteristics. The electro-chemical behaviour of a battery has been presented in [37] while accounting for the battery’s state of charge (SOC), internal resistance, discharging current, battery terminal voltage, etc. Generally, an EV battery refers to a lithium-ion-type battery with appropriate specifications of the model. Mathematically, the charge equation of the battery is expressed as given in Equation (1).
V b = V c i b R K Q Q b t b t + B b t
where V b is the voltage of the battery, V c represents the battery constant voltage, i b is the battery current, K stands for the polarization constant, Q shows the battery capacity in Ah, b t is the actual charge of the battery, A stands for the zone amplitude and B is the zone time constant. The value of all of these parameters can be found using a characteristic curve given by the manufacturer with the data including the fully-charged voltage V f u l l , the capacity and value of the voltage at the nominal zone ( Q n o m , V n o m ) and the capacity and value of the voltage at the exponential zone ( Q e x p , V e x p ), where the battery parameters can also be found, assuming that R is constant, and during the charging process, it is 0.05 ohms, where A, B, V c and K can be determined using Equation (2):
A = V f u l l V e x p B = 3 Q e x p V c = V f u l l A + i b R i b K = V c V n o m R i b + A e x p 3 Q n o m / Q e x p
In EV battery applications, the required energy storage capacity and terminal voltage are acquired by combining several cells in series or in a parallel arrangement. The series arrangement of cells determines the battery stack voltage, and cells in parallel determine the current carrying capacity of the battery stacks. The capacity of the stacks can be found using Equation (3):
C t o t = C c n s n p
C t o t is the capacity in Ah; C c represents the capacity of an individual cell; n s stands for cells arranged in series; and n p represents the number of battery cells connected in parallel. A state-of-the-art Thevenin equivalent-based model is considered in this work; an equivalent circuit is shown in Figure 3. A Thevenin battery model uses a series resistor R s that models the voltage and current characteristic and an repetitive control (RC) parallel circuit with R t and C t that helps determine the predictive response to transients at an instant SOC of the EV battery. This model was further improved with the addition of some components for enabling one to determine and predict run-time and DC response, as given in [38,39]. For instance, [39] adds a capacitor to represent a non-linear open circuit voltage and state of charge instead of open circuit voltage V o c , and the model gives the relationship of V o c and S O C , but does not account for transients.

4. Components of the Smart Charging Station

The smart charging station consists of a PV array, a bidirectional grid-interfaced power converter, a DC-DC boost converter and an EV battery charger with a bidirectional DC-DC buck-boost converter for recharging and discharging of EVs, respectively. All of these components are explained in Section 4.1, Section 4.2, Section 4.2.1 and Section 4.3. A controller is employed that decides the power flow direction among the three blocks of the system depending on the change in the DC bus voltage.

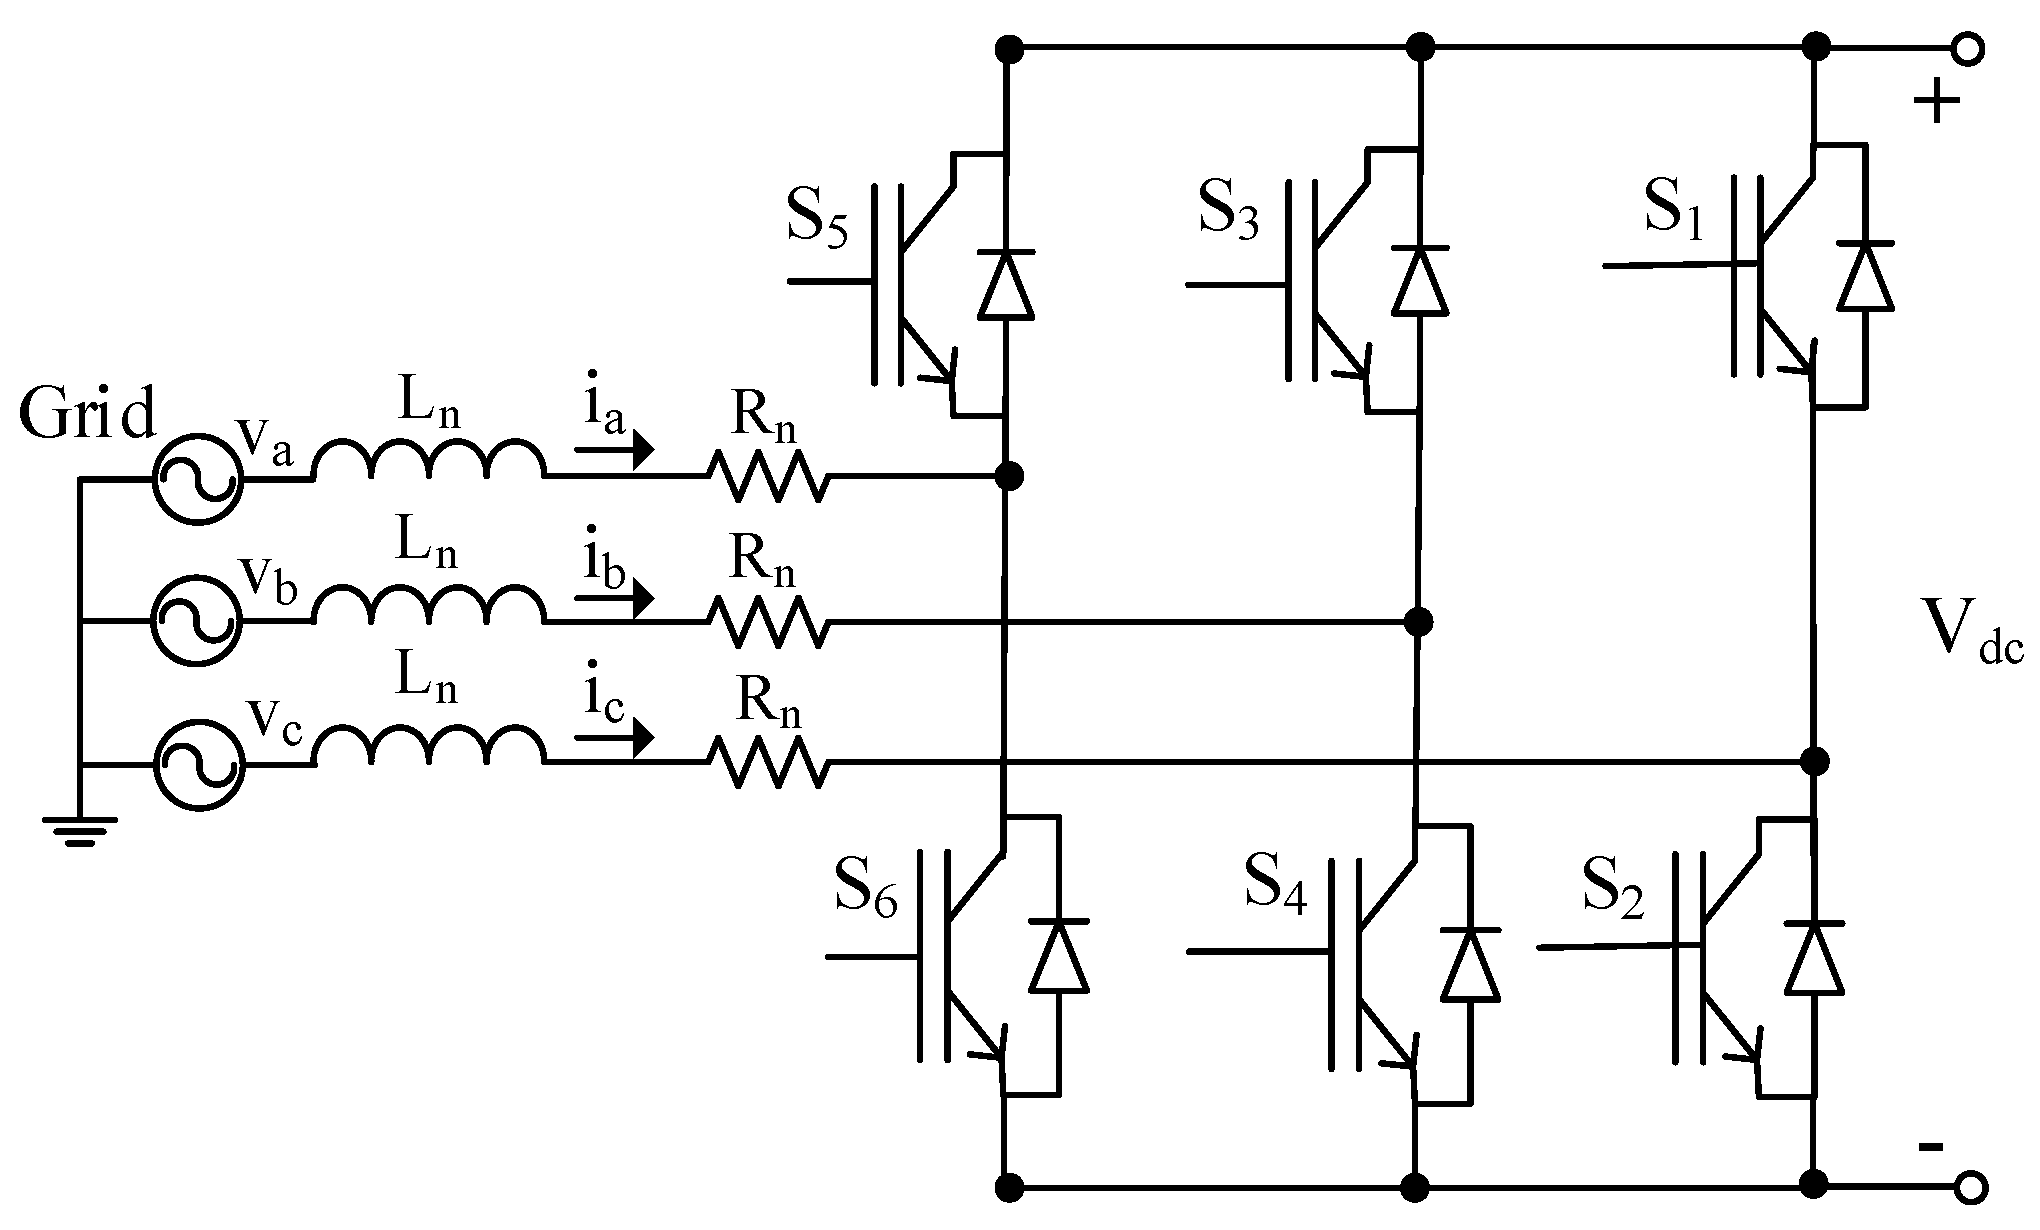
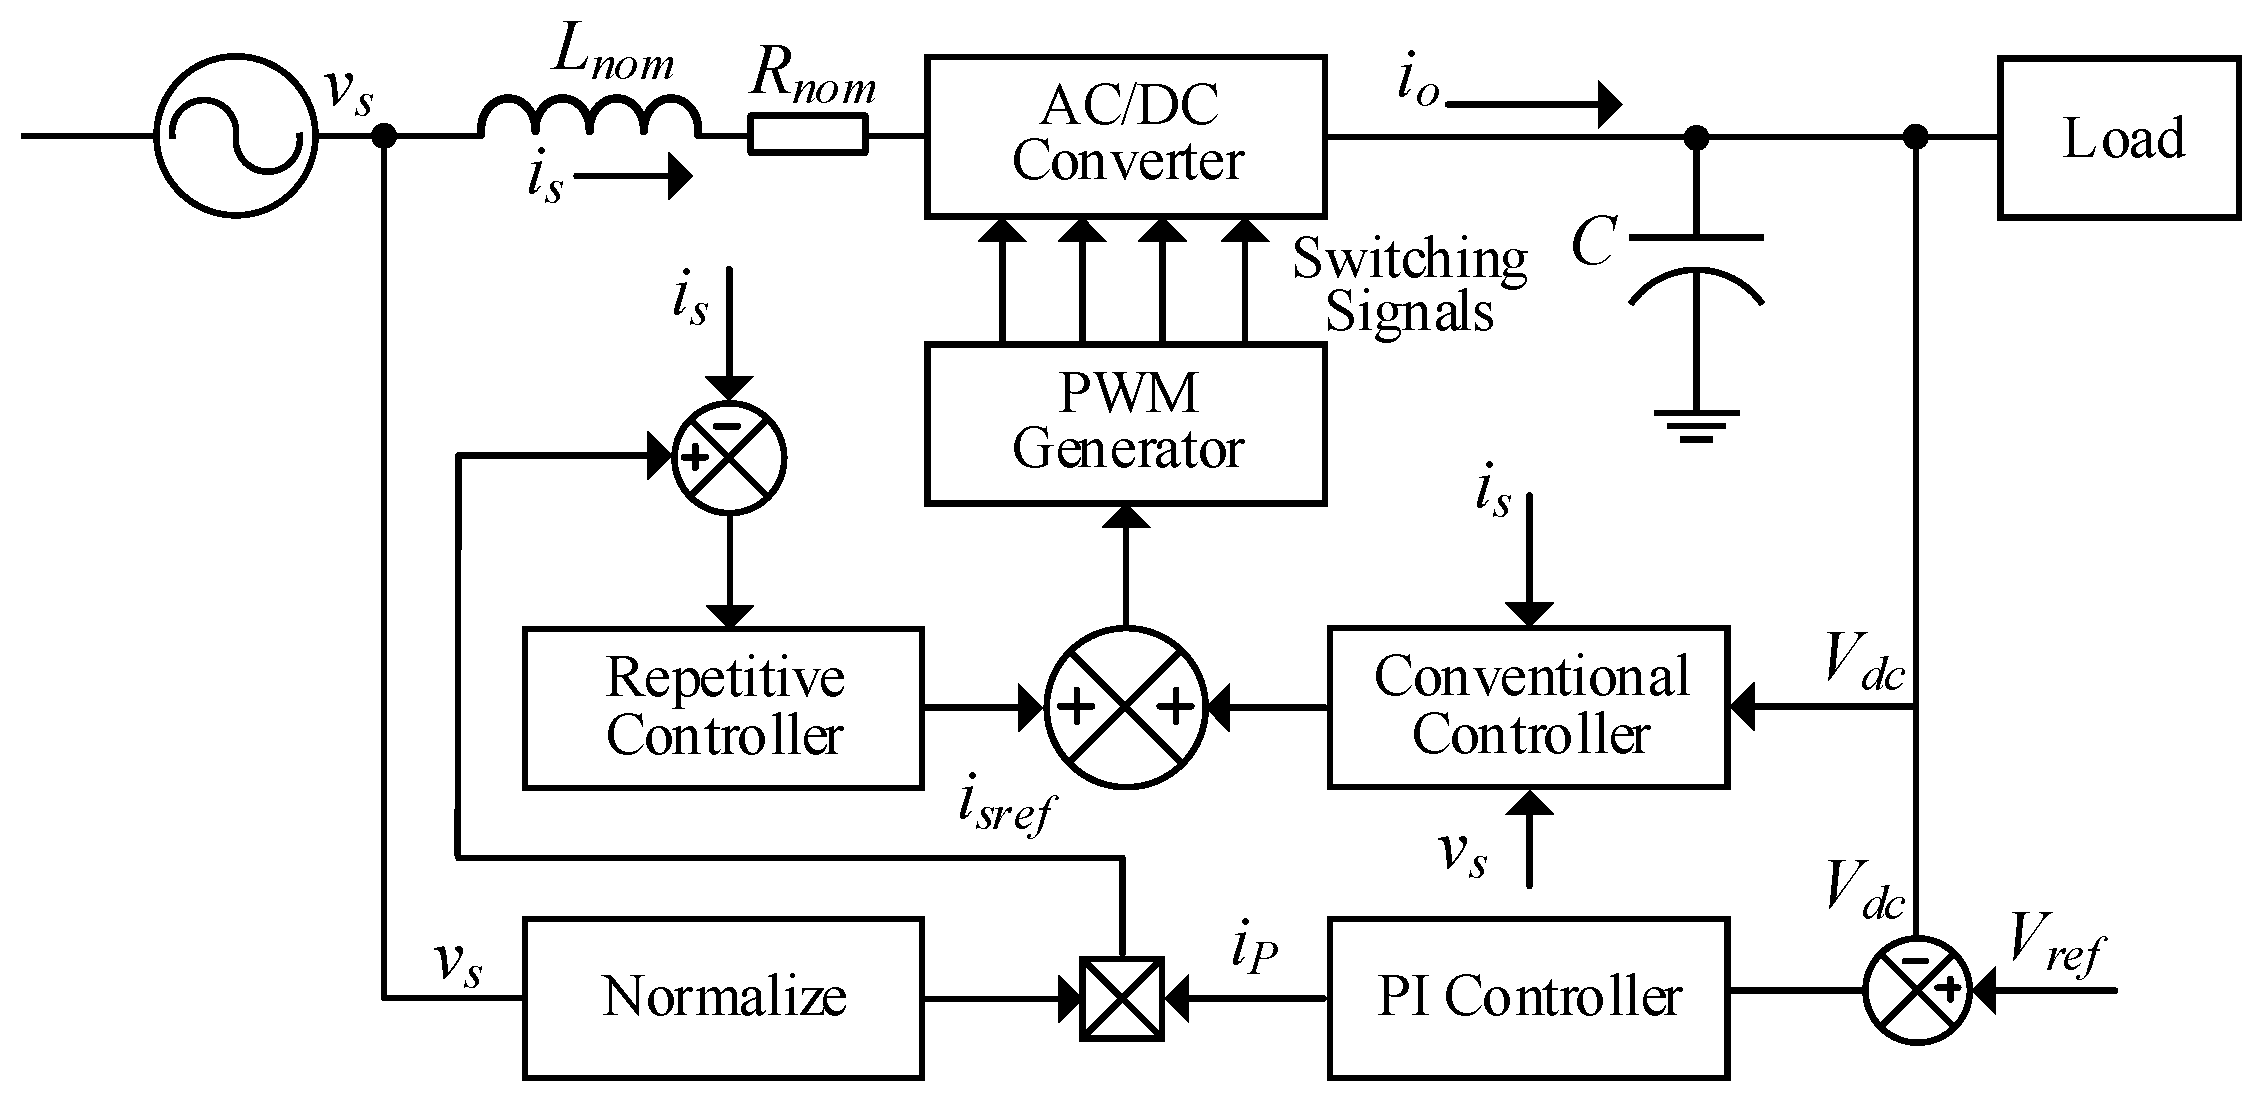
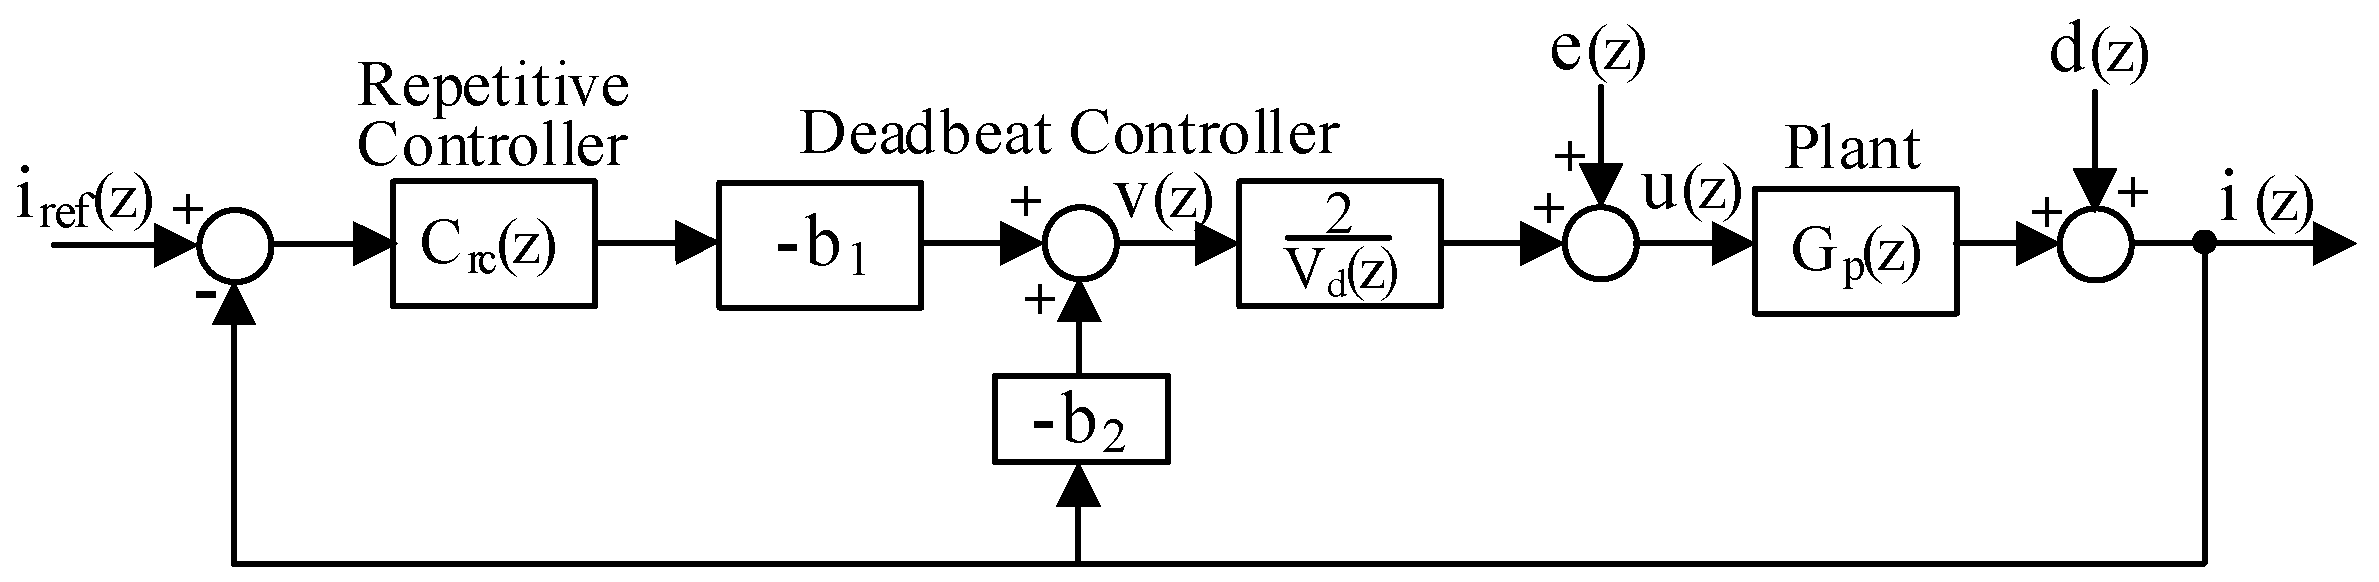
4.1. Grid-Interfaced Bidirectional Power Converter
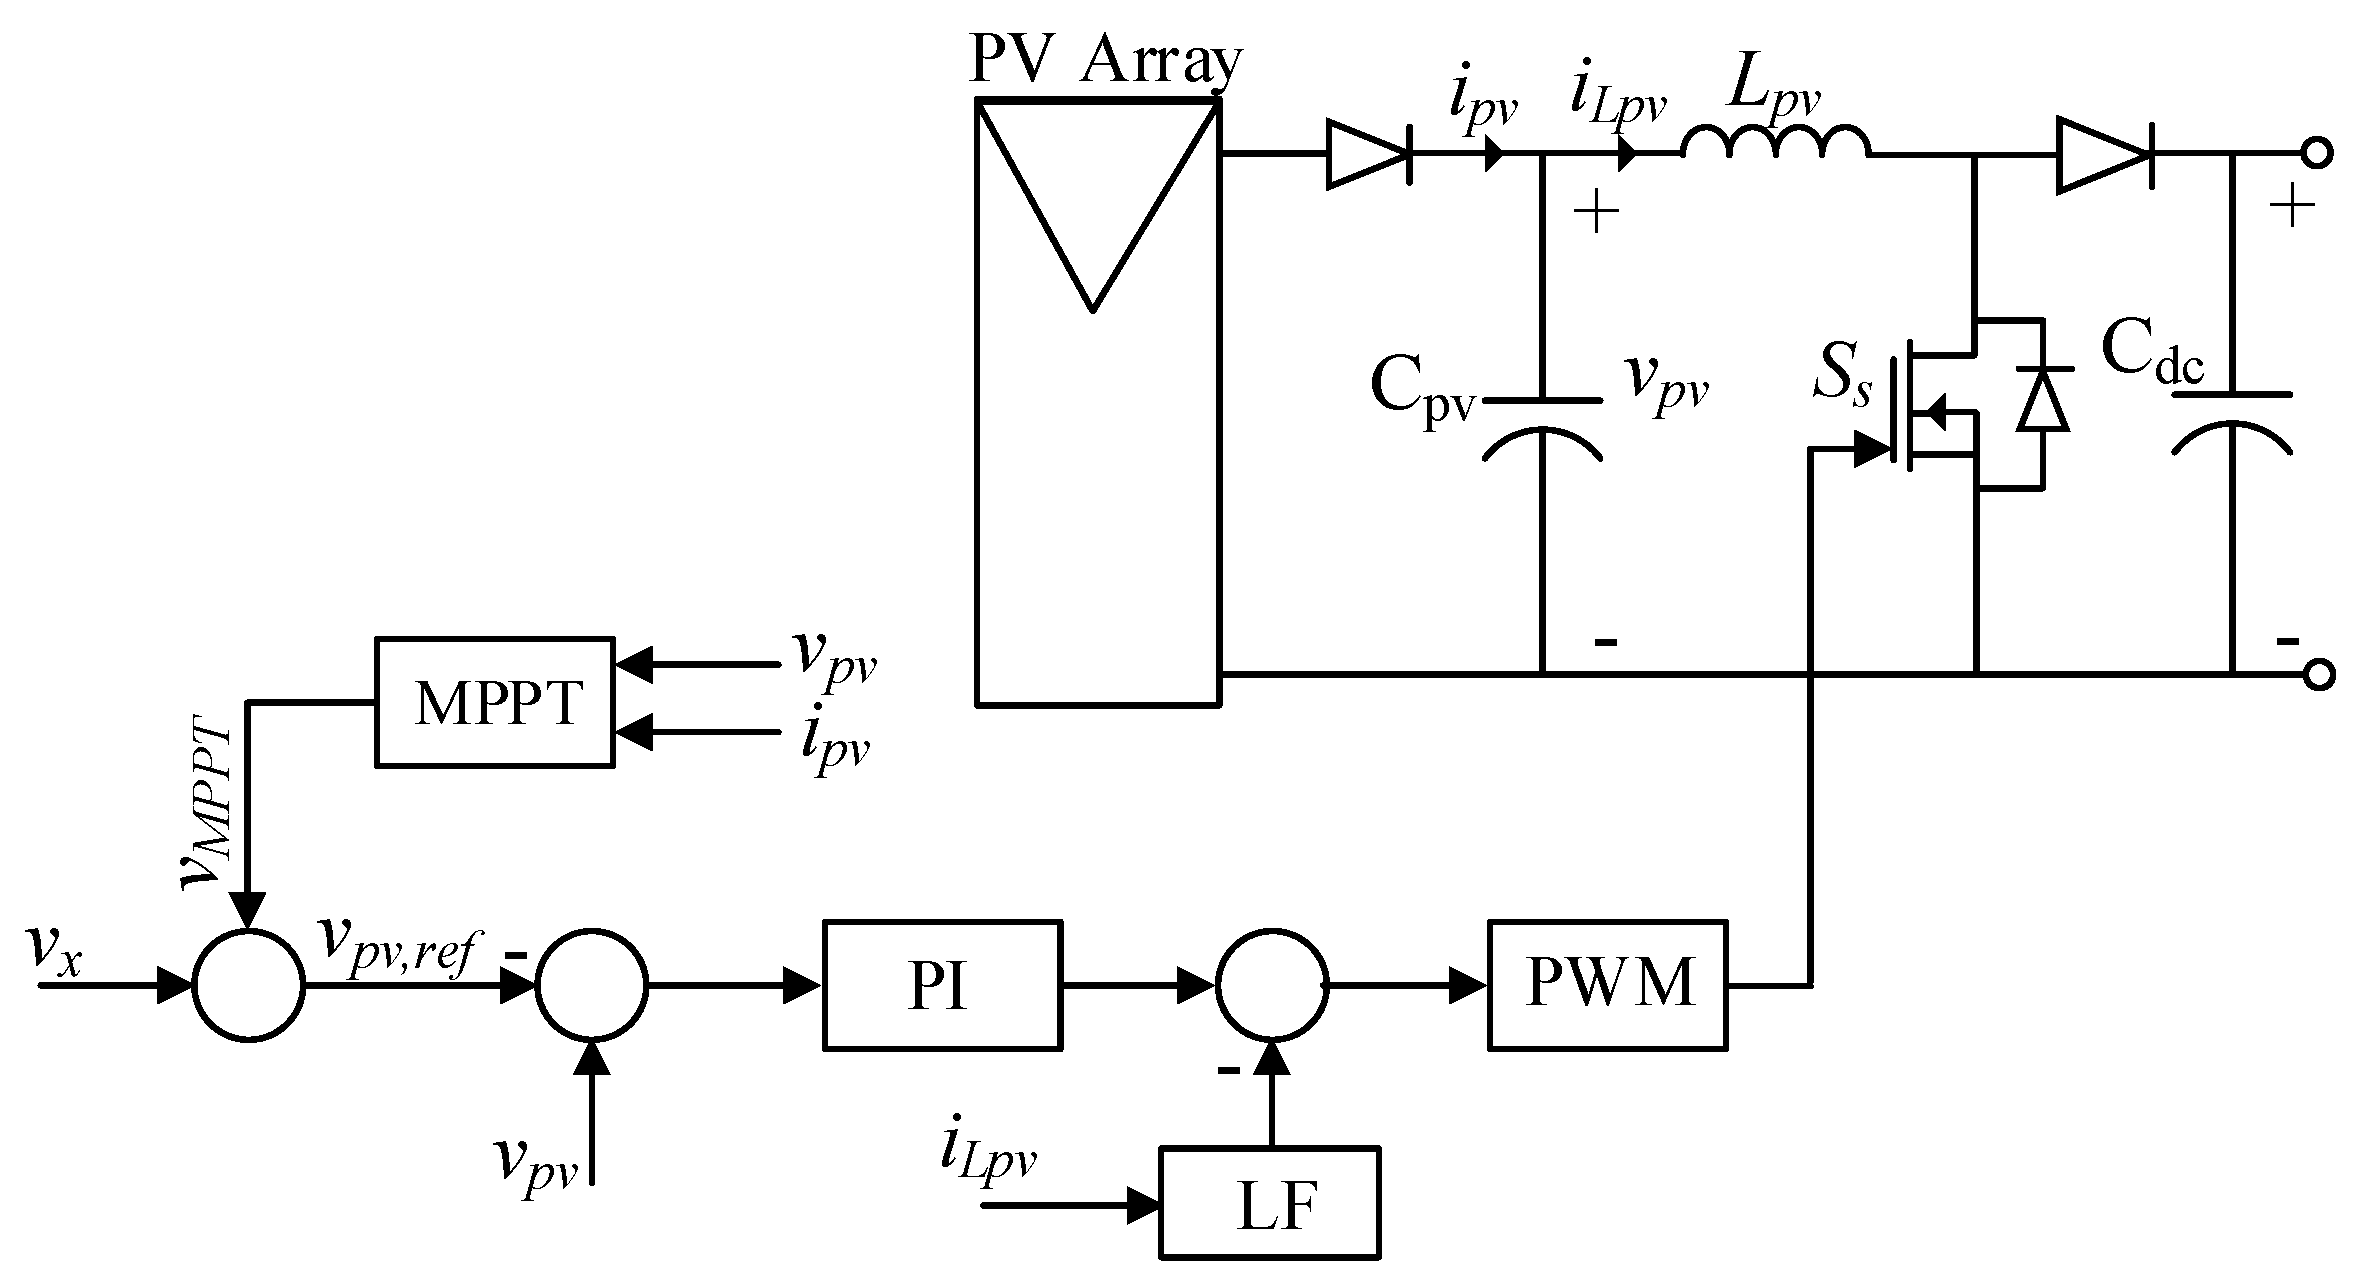
In the proposed configuration of the PV-based DC charging station, the bidirectional PWM power converter deals with power exchange between the grid and the EV battery charger. When an EV is discharged, it exchanges power from EV to the grid under V2G mode, and conversely, power is delivered to the common DC bus from the grid when required. The configuration of the power converter is shown in Figure 4. The controller design for the AC/DC power converter is based on the internal model principle to achieve a minimum tracking error and ripple-free output DC voltage V d c , as described in [40,41].
The control scheme of a double loop structure is shown in Figure 5 that contains an inner current loop and outer loop for voltage. The employed control scheme basically combines an outer loop that is based on a PI voltage controller and an inner loop deadbeat controller in addition with a repetitive controller for the current control [42]. The implementation of a plug-in repetitive control (RC) system is shown in Figure 6 Transfer function C r c ( z ) , with control gain k r c , of the RC and low pass filter q ( z ) can be found as given in Equation (4). Generally, q ( z ) = 1 is considered for a DC signal. As per Equation (4), the integral controller is considered a special case of a repetitive controller. In the case of the DC reference, the PI controller is another particular case of the control scheme. The control scheme for the single-phase current loop is shown in Figure 7. A sample equation for each phase with standard parameters is given in Equation (5).
C r c ( z ) = k r c z N 1 1 z N q ( z ) = k r c z N 1 z N 1 q ( z )
i j ( k + 1 ) = b 1 b 2 b 1 i j ( k ) + 1 b 1 e j ( k ) v d ( k ) 2 1 b 1 u j ( k )
where b 1 = L n o m T , b 2 = R n o m , L n o m and R n o m are the nominal values of L and R , respectively. If T is the sampling period, then u ( k ) = 2 t + ( k ) T T , and in this case, the transfer function for G p ( z ) would be as given in Equation (6). The equation for the deadbeat controller is given in Equation (7). Obtaining i j ( k + 1 ) = i r e f ( k ) , the transfer function for each control loop without the repetitive controller would become H ( z ) = z 1 . The deadbeat controller offers a quick response with a one-sampling period delay only.
G p ( z ) = i ( z ) u ( z ) = v d ( z ) 2 1 b 1 z b 1 + b 2
u j ( k ) = 2 v d ( k ) e ( k ) b 1 i r e f ( k ) + b 1 b 2 i j ( k )
The deadbeat controller is based on an accurate model of the AC/DC power converter. Practically, some uncertainties are found in the parameters of converter, such as: Δ L = L L n o m and Δ R = R R n o m . . Thus, it becomes difficult to achieve a tracking phase error of zero in accordance with the references [43,44].

4.2. PV Structure

The characteristics of the PV module are described using a single-diode model, as per the I-V curve presented in [45]. Mathematically, it is expressed in Equation (8):
I = N p e I p g I d X a V N s + I N c R s e R p l X a = e x p q A k T V N s e + I N p e R s 1
where V and I represent the voltage and current of the PV array, I p g stands for the photo-generated current, I d is the saturation current of the diode and T , A , q , k represent the operating temperature, diode quality factor, electron charge and Boltzmann constant, respectively. R s e and R p l stand for the series and parallel resistances of the cell; N s e and N p e are the number of cells arranged in series and parallel in cell strings. Values of these parameters can be found using an approach given in [46], and I d can be calculated using Equation (9):
I d = I s c e x p q V o c k T A N s e 1
where I s c , V o c represent the short circuit current and open circuit voltage, respectively. Many PV models have been presented for different purposes with a certain accuracy. Authors in [47,48,49,50] demonstrate the effect of recombined carriers using an extra diode with the inclusion of additional effects. However, a single-diode model is offers both fair accuracy and simplicity; in the literature, it has been mostly used with a simplified structure of the current source and a parallel diode. Generally, electric generators are considered as either the voltage or current source, but PV arrays show a hybrid behaviour in terms of current and voltage. Typically, series resistance substantially influences the device, when operating in the voltage source region, and the device’s parallel resistance affects it while operating the current source region. The series resistance is found by summing many structural resistances, and parallel resistance is characterized by the leakage current. However, these resistances are sometimes ignored for the simplification of PV modelling [51], and the parameters are important to determine the photo-generated current. An assumption that I p g photo-generated current is equal to the short circuit current is also used considering the R s and R p to be very low and high, respectively; I p g depends on irradiation and is effected by temperature, and it can be found using Equation (10).
I p g = I p g , n + K 1 T G G n
where I p g , n represents photo-generated current at the nominal condition and Δ T is the difference of the actual and nominal temperature. G and G n stand for irradiation in watts per square meters and nominal irradiation, respectively. I o is the saturation current that depends on temperature and is expressed as in Equation (11).
I o = I o , n T n T 3 e x p q E g a k 1 T n 1 T
where E g and I o , n stand for band-gap energy (its value is 1.12 eV) and nominal saturation current, respectively, and the latter can be found using Equation (12)
I o , n = I s c , n e x p V o c , n α V t , n 1
where V t , n represents the thermal voltage of the cells at T n and α is the diode constant. I o of PV cells is dependent on the saturation current density, J o , of the semiconductor material, and the latter further depends on the intrinsic properties of the cell. I o , n is found at the I s c , n nominal open-circuit assuming that V = V o c , n , I = 0 and I p g I s c , n ; where the value of α can be randomly chosen between 1≤ and ≤1.5 depending on the I V model, as it represents the degree of ideality of the diode; so, it is mostly empirical, and initially an appropriate value can be chosen; then it might be improved later for the purpose of model fitting, as its value influences the I V curve.

4.2.1. DC/DC Boost Converter

A single-phase boost stage is used that boosts the PV voltage while tracking the maximum power point of the PV array. For this, the input voltage and current are sensed and used by the algorithm. The boost power converter regulates the input terminal voltage to the maximum power point at the PV to facilitate the maximum power point tracking (MPPT) during the normal operating condition. The control strategy of the converter is illustrated in Figure 8. An average current-mode control scheme is applied that ensures robust control as compared to the peak current-mode control strategy. A low pass filter L F is used to reduce the noise and ripples. Linearized averaged state-space equations of the DC/DC converter can be written as in Equations (13) and (14) [52]:
L p v d i L p v d t = v p v + V d c , n m d
C p v d v p v d t = i L p v + v p v r d p v
where V d c , n represents the nominal DC-link voltage, r d p v stands for the PV dynamic resistance and m d is the averaged control input. Then, transfer functions G m d , i L p v and G i L p v , v p v from m d to i L p v and from i L p v to v p v , respectively, can be found using Equations (15) and (16):
G m d , i L p v ( s ) = i L p v ( s ) m d ( s ) = C p v r d p v 1 V d c , n L p v C p v r d p v s 2 L p v s + r d p v
G i L p v , v p v ( s ) = v p v ( s ) i L p v ( s ) = r d p v C p v r d p v s 1
The employed PI controllers are designed by using the frequency response of the system with diverse values of r d p v found at r d p v , v and r d p v , c voltage and current source regions, respectively, and the I–V characteristics, and the stability of the system is observed with r d p v , v and r d p v , c .

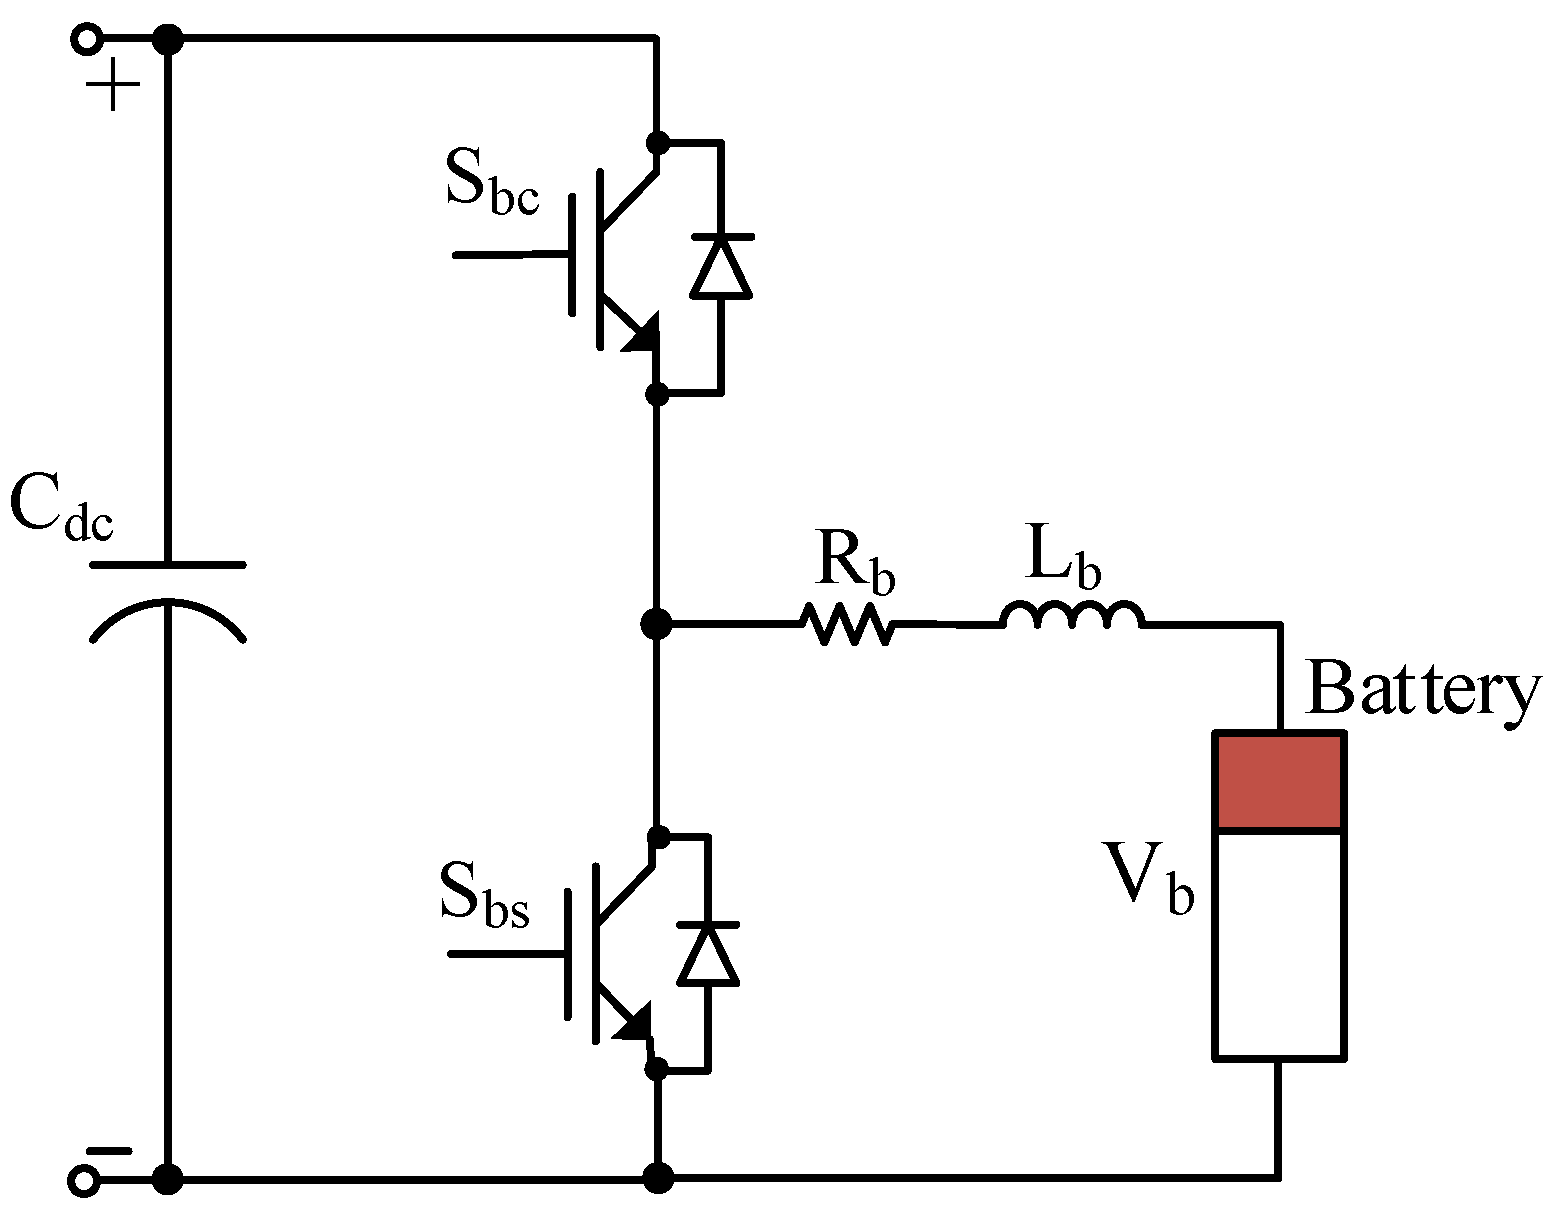
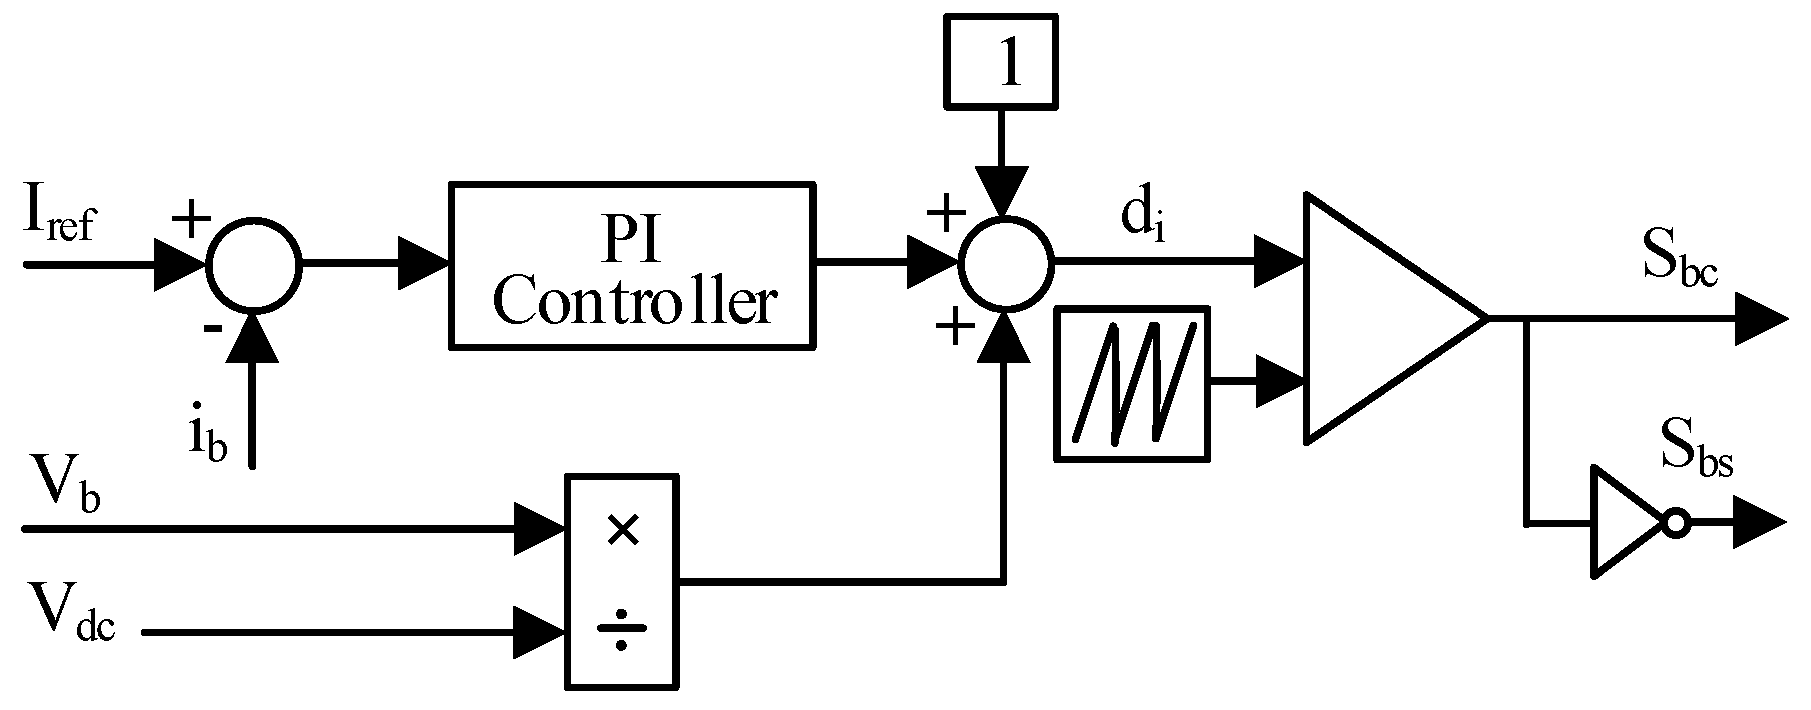
4.3. EV Battery Charging Converter

A model of the battery charger is shown in Figure 9. It is composed of a bidirectional DC/DC power converter that enables two-way power transfer capability, with two switches (IGBT) controlled by a complimentary controller. In discharging mode of the battery with the V2G concept, switch S b s operates; the converter acts in boost mode; it increases the voltage V b and current I b in the inductor L b and flows towards capacitor C d c . On the other hand, in the case of the battery charging process, the converter acts as a buck converter when switch S b c is ON, and I b rather flows in the opposite direction from the capacitor to the inductor for recharging the EV battery. On the other hand, the control of the battery charger depends on the state of charge S O C of the battery; where the configuration of the EV battery charger is shown in a simplified manner for educational research purposes, and it aims to demonstrate that the corresponding control methodologies can be realized depending on the required charging strategy (i.e., charging or discharging) under the constant current or constant voltage strategy. However, the model is implemented in SimPowerSystems with certain required simulation aspects, the integration method, the time step, the grid parameters, the reactive power, the inverter modulation index, the switching frequency, etc.
For the battery charger, two control techniques, including constant voltage and constant current, are applied for battery charging and discharging modes, respectively. In the constant voltage strategy, the battery is operated as a voltage source, and the resulting duty ratio d v describes the converter operation in buck mode for battery charging, as shown in Figure 10. A constant current strategy, in which the EV battery operates as a current source, is employed for controlling the charger while operating in V2G mode. In this mode, the converter serves in boost mode, and the scheme is shown in Figure 11.

5. Business Model of EV Charging

A sustainable expansion of EVs in the transportation sector requires substantial charging facilities, up-gradation of the distribution network and aggregated control strategies for market integration. Installation cost for charging facilities and equipment depends on the required charging mode and physical location. According to the information given in [53,54], let us assume a scenario of EV charging at a public lot only and estimate the total cost of the charging stations, including installation cost, equipment, electrical connections, connection with the grid, maintenance and administrative costs. The considered public lot has the following characteristics; it can charge an EV in both slow and fast modes; charging time ranges from 15 min to 12 h depending on the employed charging mode (whether the slow or fast charging method); and the charging facility is available 24 h with V2G property. Its cost is €2130 for a slow charging station of a maximum power of 3.5 kW at a public lot, and the cost will be €44,692 for a fast charging station of a power up to 10 kW. Generally, aggregators offer EV charging facilities to EV users through public charging stations. The aggregators act as retailers; they purchase energy from the spot market and sell to the ultimate customers.
It is assumed that the number of EVs to be recharged at a public lot is 48. As the charging station is equipped with V2G technology, so a public charging station needs an electronic counter for distant control, management and interaction with the market. Studio Scada is an example of such an electronic counter described in [55], and its total cost is around €240k. The EVs’ ambient impact considered in this study includes the effect of emissions on human health, change in climate and noise pollution.
The impact of emission on human health is estimated using the criteria given in [56] for a small suburban area, and it is found that the mortality rate is significantly reduced with a reduction in emissions. In terms of climate change, the cost of CO 2 emissions may be estimated based on their impact on climate change. For example, in the year 2010, the average value of CO 2 per ton was €25. Additionally, EVs make no noise and ensure acoustic comfort, though the levels are different for different countries depending on the noise tolerance.
Cost Estimation
The cost for deployment of the EV charging infrastructure ( E V D C I ) can be estimated (in €) as given in Equation (17):
E V D C I = E V P L . T C V . C p p + C R U + C C M S + C E q . + C D N E
where E V P L is the EV penetration level, T C V represents the total cost of conventional vehicles and C p p and C R U stand for the cost of charging stations at public parking lots and the cost of charging stations at single residential units. C C M S is the cost of the control and management software; C E q . stands for the cost of equipment; and C D N E represents the cost of the expansion distribution network.
The cost of ambient factors in €can be calculated as expressed in Equation (18):
C A F = A L E V T C E m . + T C c c + T C N
T C A F is the total cost of ambient factors; A L E V stands for the average life of an EV; T C E m . is the total cost of emissions; T C c c represents the cost of climate change; T C N stands for the noise cost.

5.1. Incentivizing EVs’ Participation in the Demand Response and Regulation Services

It is generally considered that most consumers would choose convenience over cost to recharge their EVs. A few of the effective techniques for providing incentives include different pricing schemes with respect to varying times, such as real-time, peak pricing and time-of-use. Time-based pricing splits a day into different chunks of time and applies different unit prices for energy use at particular instants. A pricing strategy usually involves an off-peak and on-peak price. Creating a time-of-use-based schedule for EV users will allow them to use timers to utilize energy at a certain time. The ability to contribute to the time-of-use schedule might encourage consumers to carefully utilize energy.
Two possible options for recharging of an EV can be offered to an EV driver with the perspective of revenue maximization for an aggregator: (i) flat charging (f-charging) set in which the EV recharging price is fixed by the aggregator, and EVs are reached at the maximum rate of power; (ii) f-charging in addition to service charging (s-charging) in which an aggregator bids a lower price for recharging, and in exchange, the recharging process provides regulation to the power grid.
In both options/settings, an EV driver is free to select none of the offered options by the aggregator, i.e., an alternative option of no-charging is also available. Let us consider an aggregator of numerous charging stations, which purchases energy at a wholesale price represented by WSP (wholesale price) (in $/kWh), and then offers a fixed a retail price (RP) in $/kWh for EV drivers. As a general fact, most vehicles are assumed to be parked during the daytime, and the same may be expected with EVs; thus, comparatively low recharging power may be adequate to recharge a battery of a few EVs. This fact is considered for the basic assumption that EV drivers are ready to accept reduced power at a less expensive price. In this case, an aggregator can avail itself of this opportunity to have increased revenue. As low recharging power is satisfactory for a few clients, so the aggregator can reduce it when it is cost-effective to do so. Consider that the variable EV recharging power level contributing towards auxiliary control may be termed as a regulation service. In order to perceive EV charging as a resource for regulation, there must be some margins to decrease or increase its power consumption. Regarding monetary compensation for such regulation, the aggregator pays Δ w s p P n per EV with its regulation slot. In the case of regulation, the aggregator is paid for tumbling demand to zero. The incentive is symbolized as a fraction r u 1 of the wholesale price, and the aggregator receives an amount, as expressed in Equation (19).
Δ w s p r u P n 0 = Δ w s p r u P n
In other words, the system operator re-purchases the energy at a unit price r u W S P W S P . For regulation, where EVs should consume more than scheduled, the operator bids a concession ratio of r d 0 on the normal price W S P , so that the aggregator purchases the spare energy at a reduced price.
Aggregating all payments and their occurrence probabilities, the anticipated revenue for the aggregator from one regulating EV is expressed in Equation (20).
A r = Δ w s p ρ u r u P c ρ d 1 r s P d P c P c
where A r stands for anticipated regulation, w s p is the price at which the aggregator buys energy, r u is the ratio of the remuneration for regulation, r s is the discount ratio, the probability of a signal when no regulation is need is denoted by ρ u and P c is the charging power.

5.2. Smart EV Charging and Pricing
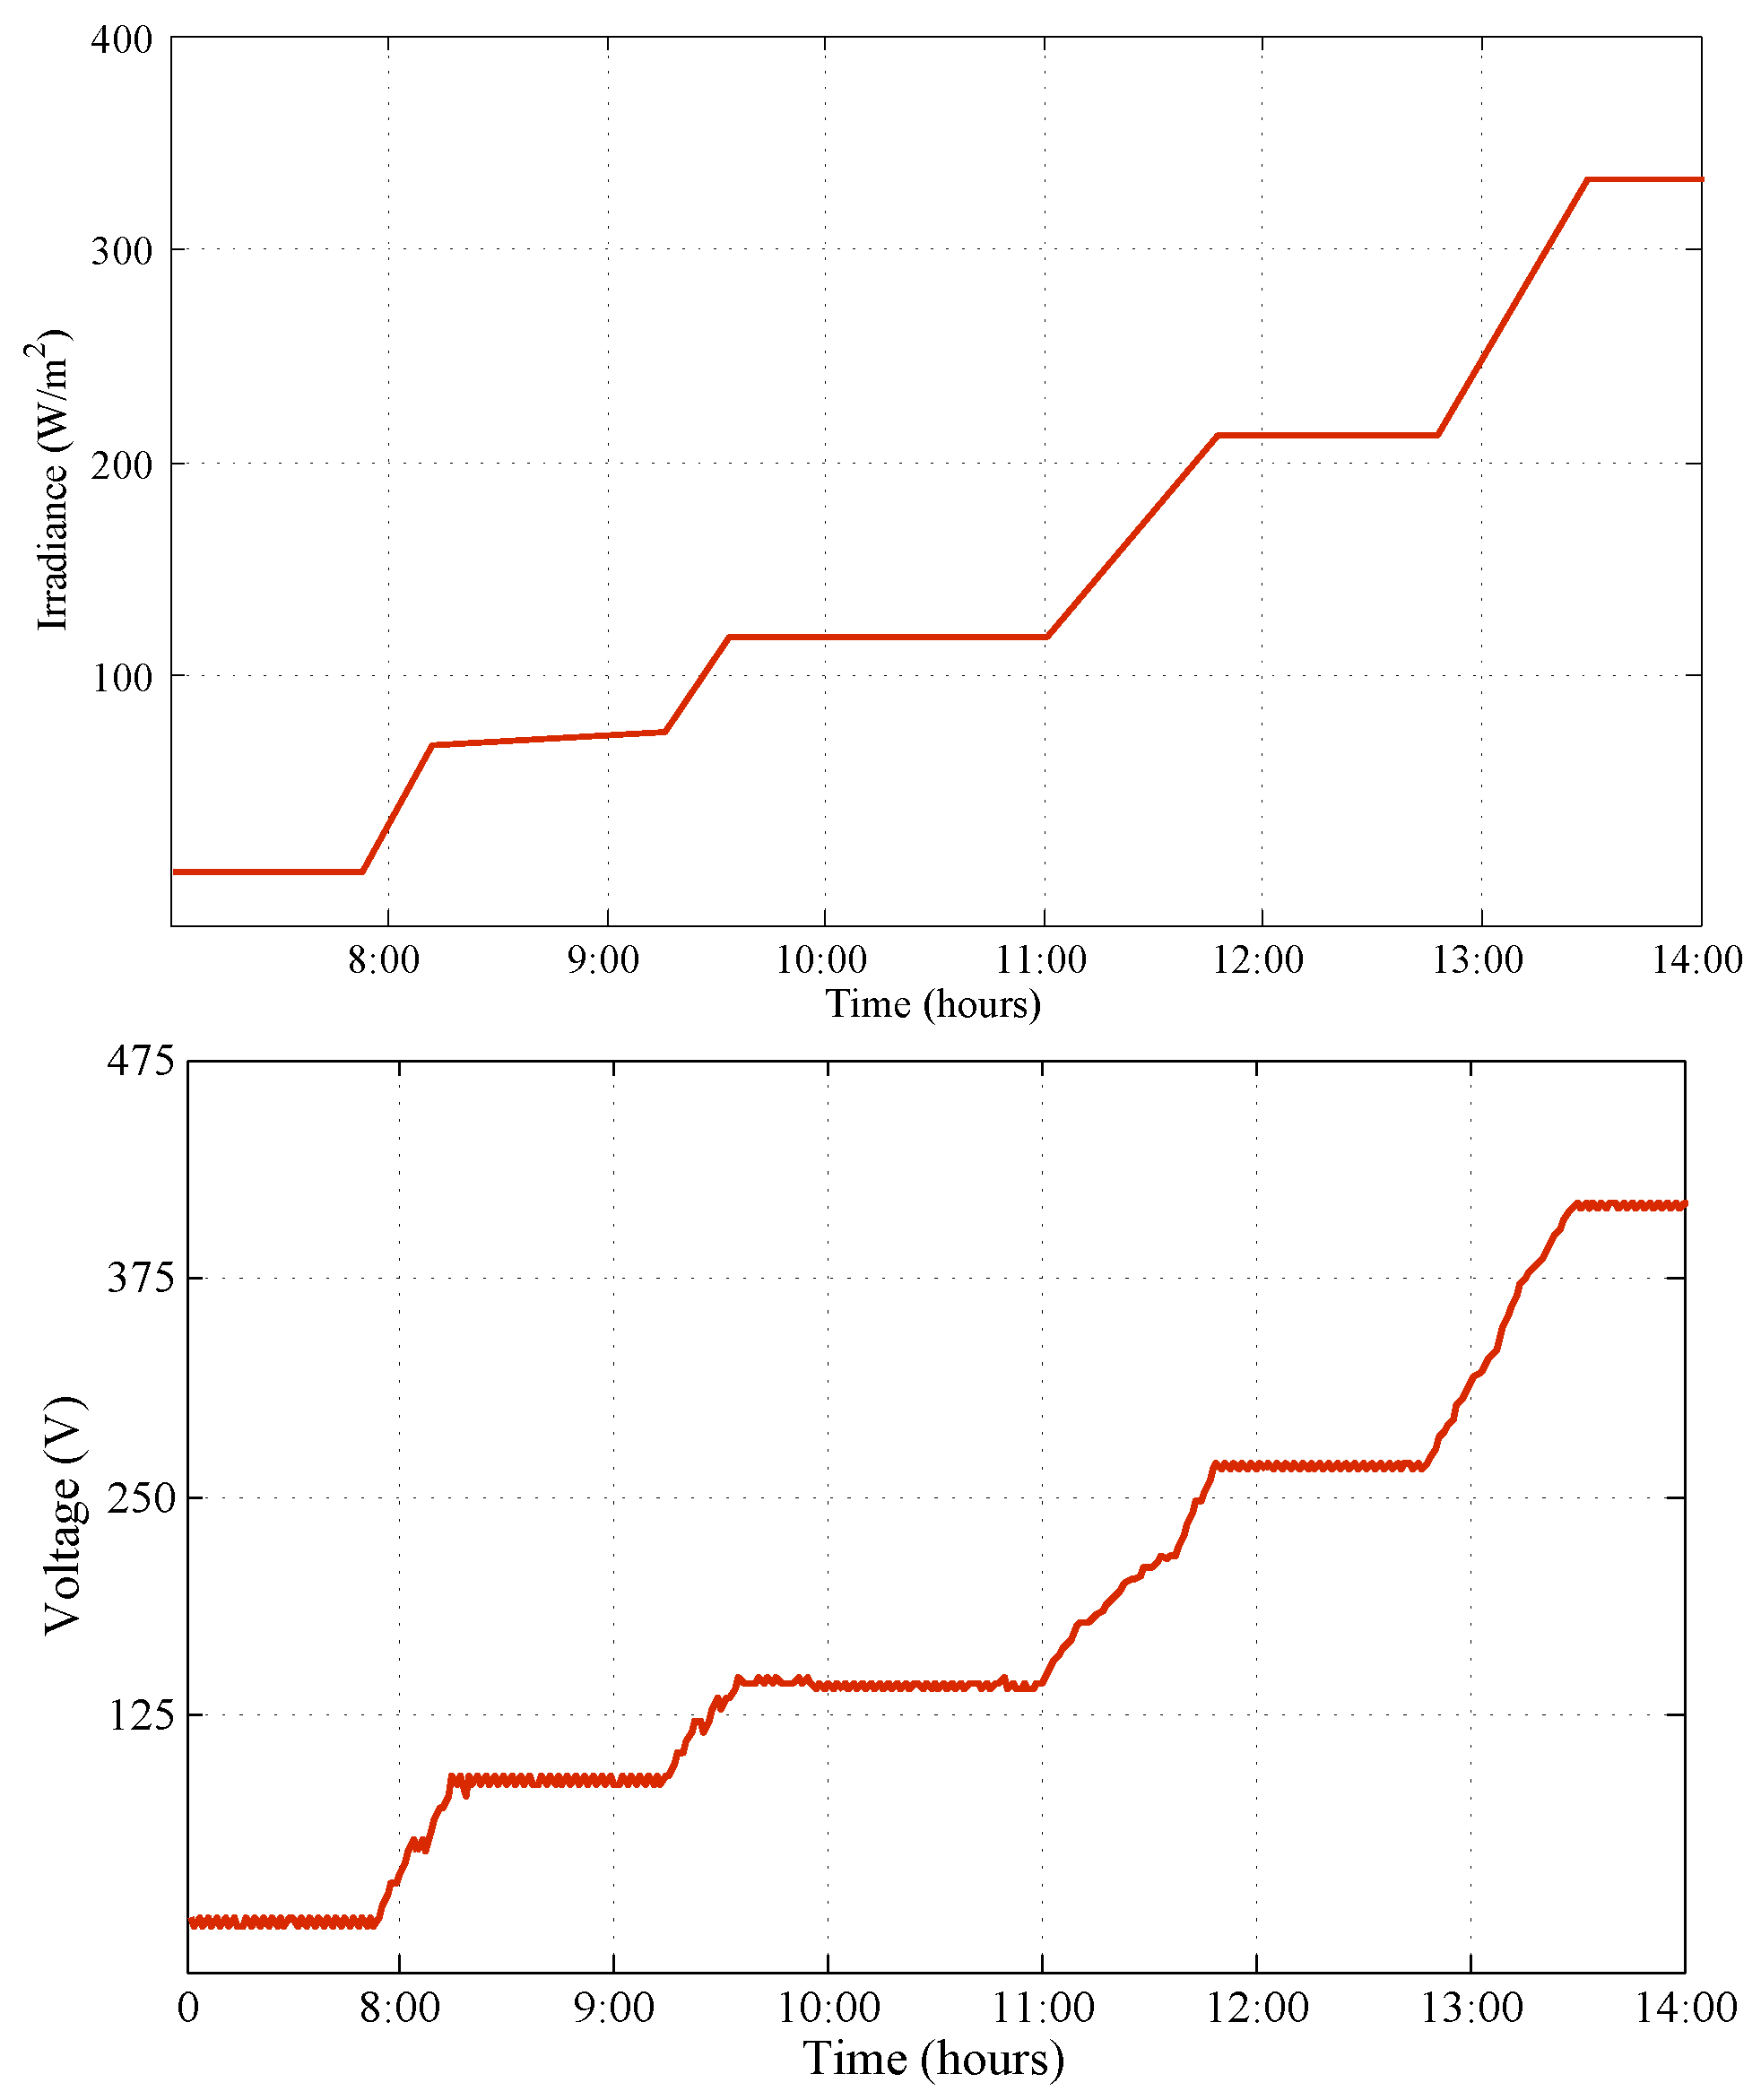
This subsection contains a description of the potential smart operation of EVs’ charging manner for the benefit of the system. It is based on a self-determined charging decision and ancillary control through variable pricing. At a certain moment, prices may typically reflect energy generation cost only. In order to use the pricing factor for altering EV charging, the prices must be able to reflect the system operating conditions. Prices that achieve this goal must be cost-reflective of generation and network cost. EVs’ driving routes affect the location of the charging load. Likewise, utilization patterns influence the quantity of available energy to be supplied to the grid under V2G operation.
A controlled and smart operation of EVs can spread EV charging load over time and re-position EV demand to reduce peak power consumption and network congestion. EVs’ smart operation can further increase the feasibility by reducing the driving cost. This discussion is concentrated on prices with the aim to incentivize the system charging.
Smart EV charging operation can be performed through a direct control strategy on an EV charging process or through dynamic price-based indirect control [57]. Depending on the model, a control scheme may be applied only when an EV is parked and being charged at a particular location, or a control scheme may be implemented directly by an operator or an aggregator. The right to control may be allowed by an EV user in lieu of a certain rebate payment. Indirect control is exercised through dynamic pricing. There may be several diverse pricing extents to steer EV charging operation with the aim to lessen energy peaks. These price dimensions vary from a simple tariff to greatly distinguished pricing schemes.
A probable dimension of pricing is the diversity of price according to the time of charging. Time-differentiated prices are characterized by the utilization of the network and can aid synchronized EV charging with the system operation. Such synchronization ensures a less expensive system by steering the EV charging towards off-peak hours. Real-time pricing involves different prices at different time slots in accordance with the real operating conditions. Another dimension is the difference in location, where the EV charging process may have a substantial influence on network load. Location-based steering can diminish distribution losses and avert network expansion costs, thereby reducing inclusive cost for the ultimate consumers. Differentiation in terms of location can be illustrious as per price differences. A certain benefit of location-based pricing for EV charging originates from the mobile nature of EVs and their wide-spread energy requirements. Price differentiation based on volume is another potential dimension. The amount of energy consumed at a particular time influences the capacity required for power generation, transmission and distribution. In order to direct energy consumption towards better tariffs, applying a higher price per kilowatt-hour may persuade billing less per unit for incentivizing the total turnover. Depending on the needs of a particular system, this must be addressed via price incentives. Price dimensions may greatly help produce the desired incentives for optimal EV charging operation.

6. Results

Simulations are carried out to validate the presented operation of the proposed system model. The value of the DC link bus voltage V d c is taken between V d c , m i n and V d c , m a x for shifting from one mode of operation to another. DC bus voltage is variable, and thus, the power source for EV charging varies, respectively. The reference DC bus voltage value is chosen based on a mode where the load of an EV is taken as constant and the irradiation varies gradually.
The reference values at the DC bus are kept at 250 V and 350 V, and these are selected based on the change in available solar energy from morning till evening. Varying the voltage value on the DC bus causes switching of the power source (either from the grid or PV) to recharge an EV. It can be seen in Figure 12 that the variations in the solar irradiance from morning until afternoon on a sunny day cause a corresponding change in the DC bus voltage. In a public parking lot, EVs can be assumed to be parked at different times of a day; thus, an analogous varying load of EVs can also be considered. The range of operational voltage can be split into any levels, and based on that, the charging station may be subjected to different modes of operation. In this study, the DC bus voltage is chosen while taking into account the change in solar irradiance during a day. The PV panel starts yielding power when the DC bus voltage is above its threshold value. In this way, the PV system provides the required amount of power when the DC bus voltage is 250 V, and with the further increase in the DC bus voltage, it starts producing extra power, which is then directed to the grid. In other words, the DC bus voltage does correspond with the solar irradiation and the output power, and so do the criteria for switching of the operating mode from one to another with reduced complexity.
The results for all described modes of operation under steady-state conditions at the output of the various power converters employed are obtained in this work. This is aimed at showing that the supply source for recharging an EV changes when variation in the bus voltage is seen. For instance, the EV will be fully recharged through PV power while operating under Mode I if the DC bus voltage is greater than 400 V; it will serve in Mode II when the voltage at the DC bus is in the range of 250 to 350; a combination of PV power redirection and V2G operation will be observed when the load on the grid is greater than the available supply. The outputs of the system, downstream of the power converters, under Mode II, when EV charging power demand is being met through both PV and the power grid, are shown in Figure 13 and Figure 14. Figure 13 shows that when the DC bus voltage is 250 V, this means the corresponding power from the PV system is not enough to satisfy the EV charging power demand, and thus, it has to be supplied through both sources, i.e., the PV system and the grid. In this case, the required amount of power is drawn from the grid, and the DC bus voltage is raised to 350 V, which is analogous to the sufficient amount of power for recharging EVs; where the upper part of Figure 14 is the measured grid voltage (showing that the grid is operating at off-peak hours and enough power is available for EVs), and its lower part illustrates that the DC bus voltage has reached the required level while meeting the required power demand of EV charging.
Results including the DC bus voltage, grid supply voltage and output of the grid-connected bidirectional power converter under the system transition from Mode I to Mode II are also obtained and shown in Figure 15 and Figure 16. It could be observed that when the bus voltage is less than 350 V, the utility grid also supplies power to charge EVs, and as soon as the DC bus voltage is sufficiently available from the PV power, then grid supply is no longer provided. Thus, in Mode I, an EV is solely recharged through PV power, and the output of the grid interfaced power converter becomes zero.
This implies that when the solar irradiation changes to the higher value of W/ m 2 , it causes an increase in the PV generated power, and the corresponding DC bus voltage is raised to the value of 350 V, which is termed as the transition of the mode from II to I, as shown in Figure 15. In the previous case, the charging power was being supplied by both combined sources (PV, as well as the grid), whereas, with the increase in solar irradiance, enough power becomes available through PV only. The top of Figure 16 demonstrates the grid voltage in which it can be seen that a supply is being drawn from the grid from 0.4 to 1.2 s; afterwards, no supply is required from the grid end; just to symbolize it, the supply from the grid for EV charging is reduced to zero; this means that at that moment, no power is drawn from the grid. The bottom of Figure 16 illustrates the corresponding DC bus voltage in which the rectified output of the bidirectional power converter after 1.2 s becomes zero, and it shows that no power is being rectified from the grid end; rather. the whole power demand of EVs is being met through PV power generation. For further clarification, the output of the bidirectional converter will be at some value until the power is drawn from the grid, and when no power is taken from the grid, then the output of the converter will become zero.
The grid loading and its operating condition are assessed by determining the value of the current on the secondary side of the distribution transformer. At the start, when the grid is operating at off peak hours, it delivers some amount of power required to charge EVs, as shown in the first half interval (from 0.4 till 1.2 s) of Figure 16. The charging supply is ended as soon as the load on the grid increases, and the grid interfaced side of the bidirectional power converter draws no power from the grid. In other words, zero power is taken from the grid, and it is shown in the second half interval in both the upper and lower parts of Figure 16, i.e., in this situation, zero voltage is measured at the upstream and downstream of the grid-tied bidirectional power converter.
Figure 17 shows Mode I operation under the transition from Case I to Case II when firstly all solar energy is used to recharge EVs and the DC bus voltage is close to 350 V. If it continues to increase or EV charging demand is satisfied, then the power is supplied to the grid. In this case, it can be seen that firstly, the whole EV charging demand is being supported or supplied through PV power generation only, as a sufficient amount of solar energy is available. Thus, the top of Figure 17 illustrates the DC bus voltage value, showing that from 0.4 s till 1.1 s, the DC bus voltage value is 350 V, which is sufficient (i.e., its corresponding generated power) to meet EV power demand, and no power is required to be drawn from the grid for this period. This implies that the output of the grid interfaced bidirectional converter is zero (otherwise, there would be some rectified output) from 0.4 till 1.1 s (i.e., power is being neither supplied nor drawn from the grid). Consequently, in the second half interval (from 1.1 till 2.0 s) of Figure 17, it is obvious that as soon as the value of the DC bus voltage goes above 350 V (again, here, the increase in the DC bus voltage corresponds to the increase in solar irradiation and, thus, an increase in generated power), the power management algorithm, which is based on the variation in the DC bus voltage, causes the surplus amount of power to flow towards the grid, and in this situation, the grid interfaced bidirectional converter becomes active in inversion mode and starts supplying to the grid. Therefore, the second half of the bottom of Figure 17 shows the inverted output of the respective power converter. In this way, the first and second halves of the top and bottom of Figure 17 are found to be appropriate in functioning, while validating the designed algorithm of the power flow under different operating modes.
Simulation of the charging station under V2G operation is shown in Figure 18 with reactive power compensation. It demonstrates that initially, the charging station operates at around 48 kW, and the reactive power is zero; for first quarter of a second, no reactivepower is demanded by the controller while the EV is being recharged. When time is almost 0.24 s, some reactive power injection is demanded by the controller, and the bidirectional EV charger starts providing reactive power. In V2G operation, changing the current direction affects voltage variation. It is observed that the reactive power is zero when the system is in charging mode, and the value of reactive power is also zero. At around 0.3 s, EV discharging under V2G mode is requested, and the system starts injecting power to the utility grid; the value of reactive power becomes positive. Thus, the controller ensures seamless transition among different modes of operation. The reactive power support is consider the most beneficial parameter, as it does not affect the battery performance of an EV.

7. Conclusions and Future Research Direction

A model of a PV-based fast charging station with a four-way power flow interaction is presented in this paper. The model and corresponding control strategy of each component, including the PV interfaced DC/DC boost converter, the EV interfaced DC/DC buck-boost converter and the grid-tied bidirectional AC/DC converter, are explained along with their implementation in Simulink. The employed control strategy is based on the variation in the DC link voltage that causes a change in the power flow direction, and thus, it operates in various different modes. The charging station also supports V2G operation. Simulations validate the dynamic behaviour of the DC bus voltage, battery voltage and the current. In view of the presented results, it could be safely established that the PV-based grid-connected EV charging is a promising factor to support the expected overwhelming load of EVs and the intermittent nature of renewable energy, while using EVs as an energy storage device upon availability. This paper also presents a brief model for the cost-benefit analysis of EVs’ penetration in a suburban area. The theatrical analysis shows that EVs would be a profitable initiative in the transportation and energy market with significant human health and environmental benefits. Nonetheless, deployment of charging infrastructure will require substantial investments. It has been discussed that incentives and rebates can be used to encourage EV drivers’ active participation in the market. A coordinated EV charging operation could increase the system’s efficiency through good incentivization, as dynamic electricity pricing is a potential strategy to aid the power system. However, opportunities for price-based control of EV charging operation are still indefinite, and further research is required regarding the effects that EVs can experience in a local network. Basically, this research paper is aimed at describing the presented model and its implementation in an educational manner. For experimental verification, its further implementation is planned to be carried out using industry-oriented parameters/values. In view of the fact that the EV characteristics differentiating from the distributed resources are mobility and duality, as they can behave either as controllable loads or controllable micro-generators, the authors are working to enhance this presented model with the inclusion of the aggregation strategies for PV integrated EV charging management under the virtual power plant (VPP) concept. The authors are hoping to be able to obtain the experimental validation in the next few months and will strive to publish that work as an extended Part II of this manuscript in the same journal. As we believe that the addition of further sections in this paper will extraordinarily increase the length of this paper and, sometimes, such a lengthy paper does not appeal to potential readers, thus the extended research work with the experimental results shall be submitted for potential publication as Part II.

Acknowledgments

I, Azhar ul-haq, sincerely acknowledge that this work would have not been completed, if financial as well as technical support from University of L’Aquila under the supervision of Carlo Cecati had not been provided. Additionally, I remain grateful to Ehab El-Saadany for his outstanding supervision during my exchange studentship at ECE Department of University of Waterloo, Canada.

Author Contributions

This work has principally been done by Azhar Ul-Haq under the esteemed guidance of Carlo Cecati. During the manuscript preparation Essam A. Al-Ammar’s suggestions helped improve the paper content’s quality.

Conflicts of Interest

The authors declare no conflict of interest.

References

  1. Deilami, S.; Masoum, A.; Moses, P.; Masoum, M. Real-time coordination of plug-in electric vehicle charging in smart grids to minimize power losses and improve voltage profile. IEEE Trans. Smart Grid 2011, 2, 456–467. [Google Scholar] [CrossRef]
  2. Kempton, W.; Tomic, J. Vehicle-to-grid power implementation: From stabilizing the grid to supporting large-scale renewable energy. J. Power Sources 2005, 144, 280–294. [Google Scholar] [CrossRef]
  3. SAE International. Charging Configurations and Ratings Terminology. Available online: http://www.sae.org/smartgrid/chargingspeeds.pdf (accessed on 3 May 2016).
  4. International Electrotechnical Commission (IEC). Available online: http://webstore.iec.ch (accessed on 17 April 2016).
  5. CHAdeMO Association. Available online: http://www.chademo.com (accessed on 2 March 2016).
  6. Sortomme, E.; El-Sharkawi, M. Optimal charging strategies for unidirectional vehicle-to-grid. IEEE Trans. Smart Grid 2011, 2, 131–138. [Google Scholar] [CrossRef]
  7. Masoum, A.; Deilami, S.; Moses, P.; Masoum, M.; Abu-Siada, A. Smart loadmanagement of plug-in electric vehicles in distribution and residential networks with charging stations for peak shaving and loss minimisation considering voltage regulation. IET Gener. Transm. Distrib. 2011, 5, 877–888. [Google Scholar] [CrossRef]
  8. Han, S.; Han, S.; Sezaki, K. Development of an optimal vehicle-togrid aggregator for frequency regulation. IEEE Trans. Smart Grid 2010, 1, 65–72. [Google Scholar]
  9. Wu, C.; Mohsenian-Rad, H.; Huang, J. Vehicle-To-Aggregator Interaction Game. IEEE Trans. Smart Grid 2012, 3, 434–442. [Google Scholar] [CrossRef]
  10. Sbordone, D.; Bertini, I.; Di Pietra, B.; Falvo, M.C.; Genovese, A.; Martirano, L. EV fast charging stations and energy storage technologies: A real implementation in the smart micro grid paradigm. Electr. Power Syst. Res. 2015, 120, 96–108. [Google Scholar] [CrossRef]
  11. Mouli, G.C.; Bauer, P.; Zeman, M. System design for a solar powered electric vehicle charging station for workplaces. Appl. Energy 2016, 168, 434–443. [Google Scholar] [CrossRef]
  12. Bianchi, F.D.; Domínguez-García, J.L.; Gomis-Bellmunt, O. Control of multi-terminal HVDC networks towards wind power integration: A review. Renew. Sustain. Energy Rev. 2016, 55, 1055–1068. [Google Scholar] [CrossRef]
  13. Arancibia, A.; Strunz, K. Modeling of an Electric Vehicle Charging Station for Fast DC Charging. In Proceedings of the 2012 IEEE International Electric Vehicle Conference (IEVC), Greenville, SC, USA, 4–8 March 2012; pp. 1–6.
  14. Aggeler, D.; Canales, F.; Zelaya, H.; de la Parra; Coccia, A.; Butcher, N.; Apeldoorn, O. Ultra-Fast DC-Charge Infrastructures for EV-Mobility and Future Smart Grids. In Proceedings of the 2010 IEEE PES Innovative Smart Grid Technologies Conference Europe (ISGT Europe), Gothenberg, Sweden, 11–13 October 2010; pp. 1–8.
  15. Berthold, F.; Ravey, A.; Blunier, B.; Bouquain, D.; Williamson, S.; Miraoui, A. Design and development of a smart control strategy for plug-in hybrid vehicles including vehicle-to-home functionality. IEEE Trans. Transp. Electr. 2015, 1, 168–177. [Google Scholar] [CrossRef]
  16. Zhou, X.; Wang, G.; Lukic, S.; Bhattacharya, S.; Huang, A. Multifunction Bi-Directional Battery Charger for Plug-in Hybrid Electric Vehicle Application. In Proceedings of the 2009 IEEE Energy Conversion Congress and Exposition, San Jose, CA, USA, 20–24 September 2009; pp. 3930–3936.
  17. Kramer, B.; Chakraborty, S.; Kroposki, B. A Review of Plug-in Vehicles and Vehicle-to-Grid Capability. In Proceedings of the 34th Annual Conference of the IEEE Industrial Electronics Society (IECON), Orlando, FL, USA, 10–13 November 2008; pp. 2278–2283.
  18. Kisacikoglu, M.; Ozpineci, B.; Tolbert, L. Effects of V2G Reactive Power Compensation on the Component Selection in an EV or PHEV Bidirectional Charger. In Proceedings of the IEEE Energy Conversion Congress and Exposition (ECCE), Atlanta, GA, USA, 12–16 September 2010; pp. 870–876.
  19. Kisacikoglu, M.; Ozpineci, B.; Tolbert, L. Reactive Power Operation Analysis of a Single-Phase EV/PHEV Bidirectional Battery Charger. In Proceedings of the IEEE 8th International Conference on Power Electronics (ECCE Asia), Jeju, Korea, 30 May–3 June 2011; pp. 585–592.
  20. Neumann, H.; Schar, D.; Baumgartner, F. The Potential of Photovoltaic Carports to Cover the Energy Demand of Road Passenger Transport. Prog. Photovolt. Res. Appl. 2012, 20, 639–649. [Google Scholar] [CrossRef]
  21. Locment, F.; Sechilariu, M.; Forgez, C. Electric Vehicle Charging System with PV Grid-connected Configuration. In Proceedings of the IEEE Vehicle Power and Propulsion Conference (VPPC), Lille, France, 1–3 September 2010.
  22. Erickson, L.E.; Robinson, J.; Brase, G.; Cutsor, J. Solar Powered Charging Infrastructure for Electric Vehicles: A Sustainable Development; CRC Press: Boca Raton, FL, USA, 2016. [Google Scholar]
  23. Tulpule, P.J.; Marano, V.; Yurkovich, S.; Rizzoni, G. Economic and Environmental Impacts of a PV Powered Workplace Parking Garage Charging Station. J. Appl. Energy 2013, 108, 323–332. [Google Scholar] [CrossRef]
  24. Birnie, D.P., III. Solar-to-Vehicle (S2V) Systems for Powering Commuters of the Future. J. Power Sources 2009, 186, 539–542. [Google Scholar] [CrossRef]
  25. Carlsson, F.; Johansson-Stenman, O. Costs and Benefits of Electric Vehicles a 2010 Perspective. J. Transp. Policy 2003, 37, 1–28. [Google Scholar]
  26. Markel, T.; Simpson, A. Cost-Benefit Analysis of Plug-in Hybrid Electric Vehicle Technology. In Proceedings of the 22nd International Battery, Hybrid and Fuel Cell Electric Vehicle Symposium and Exhibition (EVS-22), Yokohama, Japan, 25–28 October 2006.
  27. Anair, D.; Mahmassani, A. Electric Vehicles’ Global Warming Emissions and Fuel-Cost Savings Across the United States; UCS Publications: Cambridge, MA, USA, 2012. [Google Scholar]
  28. Leterme, W.; Ruelens, F.; Claessens, B.; Belmans, R. A Flexible Stochastic Optimization Method for Wind Power Balancing with PHEVs. IEEE Trans. Smart Grid 2014, 5, 1238–1245. [Google Scholar] [CrossRef]
  29. Kockar, I.I.; Papadaskalopoulos, D.; Strbac, G.; Pudjianto, D.; Galloway, S.; Burt, G. Dynamic Pricing in Highly Distributed Power Systems of the Future. In Proceedings of the 2011 IEEE Power and Energy Society General Meeting, Detroit, MI, USA, 24–28 July 2011; pp. 1–4.
  30. O’Connell, N.; Wu, Q.; Ostergaard, J.; Nielsen, A.H.; Cha, S.T.; Ding, Y. Electric Vehicle (EV) Charging Management with Dynamic Distribution System Tariff. In Proceedings of the 2011 IEEE Innovative Smart Grid Technologies, Manchester, UK, 5–7 December 2011.
  31. Faruqui, A.; Harris, D.; Hledik, R. Unlocking the V53 Billion Savings from Smart Meters in the EU: How Increasing the Adoption of Dynamic Tariffs Could Make or Break the Eu’s Smart Grid Investment. Energy Policy 2009, 38, 6222–6231. [Google Scholar] [CrossRef]
  32. Jaske, M.; Rosenfeld, A. Dynamic Pricing, Advanced Metering, and Demand Response in Electricity Markets; Center for the Study of Energy Markets Working Paper Series, No. 105; University of California Energy Institute: Berkeley, CA, USA, 2002. [Google Scholar]
  33. Brandstätt, C.; Brunekreeft, G.; Friedrichsen, N. Locational Signals to Reduce Network Investments in Smart Distribution Grids: What Works and What Not? Util. Policy 2011, 19, 244–254. [Google Scholar] [CrossRef]
  34. Kirkham, H. Current Measurement Methods for the Smart Grid. In Proceedings of the Power & Energy Society General Meeting, Calgary, AB, Canada, 26–30 July 2009.
  35. Kouro, S.; Leon, I.; Vinnikov, D.; Franquelo, L.G. Grid-Connected Photovoltaic Systems: An Overview of Recent Research and Emerging PV Converter Technology. IEEE Ind. Electron. Mag. 2015, 9, 47–61. [Google Scholar] [CrossRef]
  36. Gholizadeh, M.; Salmasi, F.R. Estimation of state of charge, unknown nonlinearities, and state of health OFA lithium-ion battery based on a comprehensive unobservable model. IEEE Trans. Ind. Electron. 2014, 61, 1335–1344. [Google Scholar] [CrossRef]
  37. Baba, A.; Kinnosuke, I.; Teranishi, N.; Edamoto, Y.; Osamura, K.; Maruta, I.; Adachi, S. Simultaneous Estimation of the Soc and Parameters of Batteries for HEV/EV; SAE Technical Paper, No. 2016-01-1195; The Society of Automotive Engineers (SAE): Warrendale, PA, USA, 2016. [Google Scholar]
  38. Layadi, T.M.; Champenois, G.; Mostefai, M.; Abbes, D. Lifetime estimation tool of lead acid Batteries for hybrid power sources design. Simul. Model. Pract. Theory 2015, 54, 36–48. [Google Scholar] [CrossRef]
  39. Carter, R.; Cruden, A.; Hall, P.J.; Zaher, A.S. An improved lead-acid battery pack model for use in power simulations of electric vehicles. IEEE Trans. Energy Convers. 2012, 27, 21–28. [Google Scholar] [CrossRef]
  40. Buccella, C.; Cecati, C.; Khalid, H.A.; Ul-Haq, A. On flatness-based control for series-connected VSC for voltage dip mitigation. In Proceedings of the 2014 IEEE 23rd International Symposium on Industrial Electronics (ISIE), Istanbul, Turkey, 1–4 June 2014; pp. 2637–2642.
  41. Zhou, K.; Wang, D.; Zhang, B.; Wang, Y. Plug-in dual-mode-structure repetitive controller for CVCF PWM inverters. IEEE Trans. Ind. Electron. 2009, 56, 784–791. [Google Scholar] [CrossRef]
  42. Escobar, G.; Valdez, A.; Leyva-Ramos, J.; Mattavelli, P. Repetitive-based controller for a UPS inverter to compensate unbalance and harmonic distortion. IEEE Trans. Ind. Electron. 2007, 54, 504–510. [Google Scholar] [CrossRef]
  43. Zhou, K.; Low, K.S.; Wang, Y.; Luo, F.-L.; Zhang, B. Zero-phase odd-harmonic repetitive controller for a single-phase PWM inverter. IEEE Trans. Power Electron. 2006, 21, 193–201. [Google Scholar] [CrossRef]
  44. Lu, W.; Zhou, K.; Wang, D.; Cheng, M. A general parallel structure repetitive control scheme for multiphase DC–AC PWM converters. IEEE Trans. Power Electron. 2013, 28, 3980–3987. [Google Scholar] [CrossRef]
  45. Rauschenbach, H.S. Solar Cell Array Design Handbook; Van Nostrand Reinhold: New York, NY, USA, 1980. [Google Scholar]
  46. Xiao, W.; Edwin, F.; Spagnuolo, G.; Jatskevich, J. Efficient approaches for modelling and simulating photovoltaic power systems. IEEE J. Photovolt. 2013, 3, 500–508. [Google Scholar] [CrossRef]
  47. Khalid, M.S.; Abido, M.A. A novel and accurate photovoltaic simulator based on seven-parameter model. Electr. Power Syst. Res. 2014, 116, 243–251. [Google Scholar] [CrossRef]
  48. Vimalarani, C.; Kamaraj, N. Modeling and performance analysis of the solar photovoltaic cell model using embedded matlab. Simulation 2015, 91, 217–232. [Google Scholar] [CrossRef]
  49. Nishioka, K.; Sakitani, N.; Uraoka, Y.; Fuyuki, T. Analysis of multicrystalline silicon solar cells by modified 3-Diode equivalent circuit model taking leakage current through periphery into consideration. Sol. Energy Mater. Sol. Cells 2007, 91, 1222–1227. [Google Scholar] [CrossRef]
  50. Verma, D.; Savita, N.; Shandilya, A.M.; Soubhagya, K.D. Maximum power point tracking (MPPT) techniques: Recapitulation in solar photovoltaic systems. Renew. Sustain. Energy Rev. 2016, 54, 1018–1034. [Google Scholar] [CrossRef]
  51. Eftekharnejad, S.; Vijay, V.; Gerald, T.H.; Keel, B.; Jeffrey, L. Small signal stability assessment of power systems with increased penetration of photovoltaic generation: A case study. IEEE Trans. Sustain. Energy 2013, 4, 960–967. [Google Scholar] [CrossRef]
  52. Xiao, W.; Dunford, W.G.; Palmer, P.R.; Capel, A. Regulation of photovoltaic voltage. IEEE Trans. Ind. Electron. 2007, 54, 1365–1374. [Google Scholar] [CrossRef]
  53. Nemry, F.; Leduc, G.; Munoz, A. Plug-in Hybrid and Battery Electric Vehicles; Institute for Prospective Technological Studies: Seville, Spain, 2010. [Google Scholar]
  54. Avila, F.; Gonzalez, F. Conexión de Vehículos a la Red Eléctrica (V2G); Pontificia Universidad Católica de Chile: Región Metropolitana, Chile, 2009. [Google Scholar]
  55. Lizarraga de Miguel, A. Implementation of Power Studio Scada Software; Universidad Politecnica de Cataluna: Barcelona, Spain, 2011. [Google Scholar]
  56. Perez, L.; Sunyer, L.; Kunzli, N. Estimating the health and economic benefits associated with reducing air pollution in the barcelona metropolitan area. Gac. Sanit. 2009, 23, 287–294. [Google Scholar] [CrossRef] [PubMed]
  57. Dallinger, D.; Wietschel, M. Grid Integration of Intermittent Renewable Energy Sources Using Price-Responsive Plug-in Electric Vehicles; Working Paper Sustainability and Innovation No. S 7/2011, FhG-ISI; Fraunhofer Institute for Systems and Innovation Research: Karlsruhe, Germany, 2011. [Google Scholar]
Figure 1. Block diagram of the system.
Energies 10 00004 g001
Figure 2. Charging station architecture.
Energies 10 00004 g002
Figure 3. Thevenin battery model.
Energies 10 00004 g003
Figure 4. Configuration of the bidirectional AC/DC converter.
Energies 10 00004 g004
Figure 5. Control scheme for the AC/DC converter.
Energies 10 00004 g005
Figure 6. Implementation of the repetitive control system.
Energies 10 00004 g006
Figure 7. Control scheme for the current loop.
Energies 10 00004 g007
Figure 8. Control of the DC/DC boost converter.
Energies 10 00004 g008
Figure 9. EV battery charger configuration.
Energies 10 00004 g009
Figure 10. Control scheme for the DC/DC converter in buck mode.
Energies 10 00004 g010
Figure 11. Control scheme for the DC/DC converter in boost mode.
Energies 10 00004 g011
Figure 12. Changing DC bus voltage, corresponding to the PV generated power, with respect to change in solar irradiation.
Energies 10 00004 g012
Figure 13. DC bus voltage under Mode II operation.
Energies 10 00004 g013
Figure 14. Grid voltage (top) and output voltage of the bidirectional converter in rectification mode (bottom).
Energies 10 00004 g014
Figure 15. DC bus voltage under the transition from Mode II to Mode I.
Energies 10 00004 g015
Figure 16. Grid voltage (top) and output voltage of the bidirectional converter in rectification mode (bottom) under the transition from Mode II to Mode I.
Energies 10 00004 g016
Figure 17. DC bus voltage (top) and supply to the grid (bottom).
Energies 10 00004 g017
Figure 18. V2G operation for reactive power compensation: reactive power (top), active power (bottom).
Energies 10 00004 g018

