Article

Optimal Load Shedding for Maximizing Satisfaction in an Islanded Microgrid

1
Department of Information Technology Engineering, Sookmyung Women’s University, Seoul 04310, Korea
2
Department of Electrical Engineering, Incheon National University, Incheon 22012, Korea
*
Author to whom correspondence should be addressed.
Energies 2017, 10(1), 45; https://doi.org/10.3390/en10010045
Submission received: 3 August 2016 / Revised: 29 December 2016 / Accepted: 29 December 2016 / Published: 3 January 2017
(This article belongs to the Special Issue Smart Microgrids: Developing the Intelligent Power Grid of Tomorrow)

Abstract

:
A microgrid (MG) is a discrete energy system that can operate either in parallel with or independently from a main power grid. It is designed to enhance reliability, carbon emission reduction, diversification of energy sources, and cost reduction. When a power fault occurs in a grid, an MG operates in an islanded manner from the grid and protects its power generations and loads from disturbance by means of intelligent load shedding. A load shedding is a control procedure that results in autonomous decrease of the power demands of loads in an MG. In this study, we propose a load shedding algorithm for the optimization problem to maximize the satisfaction of system components. The proposed algorithm preferentially assigns the power to the subdemand with a high preference to maximize the satisfaction of power consumers. In addition, the algorithm assigns the power to maximize the power sale and minimize the power surplus for satisfaction of power suppliers. To verify the performance of our algorithm, we implement a multi-agent system (MAS) on top of a conventional development framework and assess the algorithm’s adaptability, satisfaction metric, and running time.

1. Introduction

Recently, microgeneration has been considered for use in managing the growth of electric power demands and CO2 emission. The Consortium for Electric Reliability Technology Solutions (CERTS) has initiated research on the impact of connecting small generation units to low-voltage electricity distribution systems in order to enhance the reliability of a utility grid system. Accordingly, a microgrid (MG) has been introduced [1]. An MG is a small-scale autonomous power system that operates either in parallel to or islanded from utility main grids. An MG allows for fast installation of electricity supply without the need for expensive transmission infrastructure investments. It is composed of on-site distributed generators (DGs), energy storages (ESs), and loads [2]. DGs are power generators such as renewable energy sources (e.g., photovoltaic (PV), wind, or solar) and conventional generators such as microturbines or diesel generators. ESs include lithium-ion batteries. They can be either power generators that produce power or power consumers that expend power. Loads such as residential or commercial buildings are power consumers.
An MG has two operational modes: grid-connected and islanded. A grid-connected operation indicates a situation in which an MG is connected to the main grid. An islanded operation indicates a situation in which an MG is disconnected from the main grid when a fault occurs in the grid. The amount of produced power of DGs depends on the demands of loads. The difference between the generated power and load demand is controlled by the well-functioning main grid in the grid-connected MG. On an islanded MG, because the main energy sources are renewable energy sources that have an uncertain nature, the amount of produced power may not controlled. Thus, the control is commonly accomplished by a load shedding system, not a mechanical controller.
Load shedding is a process in which some of the power demands are shed to protect MGs from potential dangers [3]. Two architectures for load shedding, centralized and decentralized, have been investigated [4]. In a centralized architecture, system components are controlled by a central control system, which can lead to optimal utilization of MG resources. In a decentralized architecture, individual components cooperatively or competitively share the power supply or power demand based on their individual capabilities. A decentralized architecture can easily integrate new components. However, real-time optimal utility under various operating conditions is not possible. Although considerable research on load shedding systems such as islanding detection and autonomous operation/management have been extensively studied [5], research on load shedding algorithms remain an open issue for further research. A load shedding algorithm determines the amount of power demand that can be reduced. In general, a load shedding algorithm finds the most stable equilibrium operating point for the system with the fewest shed demands. In other words, a load shedding algorithm is designed to make full use of limited generation resources and maximize the beneficial performance [6]. In this study, we propose a load shedding algorithm for the optimization problem in a centralized architecture of an islanded MG. We use the satisfaction of an MG system player as performance criteria.
In this paper, the major contributions are:
-
Identifying the satisfaction of system components as performance criteria;
-
Defining the optimization problem to maximize the satisfaction;
-
Developing a load shedding algorithm for the optimization problem;
-
Implementing a multi-agent system (MAS) for the load shedding algorithm;
-
Performing experiments to verify performance of the implemented system.
The remainder of the paper is organized as follows. In Section 2, we describe related studies and system models. In Section 3, we propose a load shedding algorithm for the optimization problem to maximize player satisfaction. In Section 4, experimental results are discussed to verify the performance of our algorithm based on an implemented system operating in a conventional development framework. Finally, a conclusion and future research directions are provided in Section 5.

2. Load Shedding in an Islanded Microgrid

2.1. Related Work

Recent studies have explored the load shedding problem in an islanded MG. In Reference [2], fine-grained load shedding policies for high-stressed grids were proposed. High-stressed grids are power grids with a very large and nearly continuous supply-demand gap. Two algorithms have been proposed. In a distributed algorithm, the power throttling level is stochastically computed and the demand is shed based on the level. In a centralized algorithm, feeder-level groups are formed among the loads. In a group, the demand for the highest consumption is shed to the specific level of power consumption. Other demands in the group are then shed alternatively. After the cycling, if a supply demand gap remains, the next group is selected and the process continues until the gap is resolved.
In References [7,8,9], researchers solved the load shedding problem by using a game theoretic approach. They considered MG as a collection of individual components that compete for power. The three methodologies frame a power system in the context of a multiplayer nonzero-sum game, the bankruptcy problem, or the bargaining solution, respectively.
In References [10,11,12], a heuristic method was adopted to solve the load shedding problem. In References [10,11], load shedding strategies were proposed in which a V-shaped transfer function for binary particle swarm optimization or a binary firefly algorithm was used. The objective function is to meet the maximum demand based on the priority. In Reference [12], a genetic algorithm was applied to minimize the shed demands at all stages and maximize the lowest swing frequency. Penalty functions and chromosomes with varying lengths were utilized in the algorithm to determine the optimal shed demands.
In References [13,14], an optimization solution for load shedding was used. In Reference [13], specifically, a control strategy for stratified optimization was presented. This strategy stratifies demands into different levels based on their importance and the load frequency regulation effect coefficient. Based on the levels, the optimization solution is provided to minimize the cost of load shedding and voltage fluctuation. In Reference [14], it was observed that in addition to frequency, the rate of change of frequency (RoCoF) was an important index to determine the demand reduction. Based on RoCoF, a load shedding sequence was determined in real time by evaluating operating profits according to the willingness to pay (WTP) of the loads.

2.2. System Model

In a conventional under-frequency load shedding scheme, when the frequency of MG falls below permissible levels, some power demands in the system are shed in predetermined steps [15]. In the first step, an anticipated overload ( L ) is given by:
L = Total load demands Total power supplied Total power supplied .
In the second step, the total amount of demands to be shed is calculated to maintain the frequency above permissible levels for the maximum L below that of [16]:
L D = L L + 1 d ( 1 f f n ) 1 d ( 1 f f n ) ,
where L D is the total number of demands to be shed, d is the load reduction factor, f is the minimum permissible frequency, and f n is the nominal system frequency. The load reduction factor indicates the percentage change in load demand per percentage change in frequency. In the final step, the number of demands to be shed for each load must be determined. In this study, we focus on the final step of a load shedding scheme.
We next describe a system model for load shedding in an islanded MG. The system is defined as a pair ( L , P ), where P is a vector of the power supplied by N DGs and L is a vector of power demanded by M loads (i.e., P = ( P 1 ,   P 2 , , P N ) and L = ( L 1 ,   L 2 , , L M ) ). There are some stochastic variables in DGs like power generation of renewable energy sources (e.g., wind turbines (WT) and PV cells) [17]. The stochastic models which consider uncertain nature of some variables such as generation of WT and PV are proposed [18,19,20]. In the models, the amount of wind speed or solar irradiance is forecasted by a time series method. For the forecasted amount, a probability distribution function is assigned to obtain the amount of stochastic variable. In our system model, P includes the power supplied by dispatchable energy sources, WT, and PV cells (i.e., P n { P dis ,   P WT , P PV } ).
The demand of the load m is divided into two types: critical load demand and controllable load demand. Critical load includes hospitals, water stations, and other infrastructures to be associated with basic needs of human life. When MG is disconnected from the main grid, controllable load demand is shed gradually for the continuous power supply to critical load. The power supplied by DGs is firstly assigned to the critical load demands, L m ^ . A controllable load demand is composed of a set of K subdemands (i.e., L m = { l m 1 , l m 2 , , l m K m } ). Let l m k denote the k-th subdemand of the load m. For each subdemand, a preference is assigned in the range of 1 to P r e max . The power is assigned gradually to the subdemand with high preference. When n = 1 N P n m = 1 M L m ^ = n = 1 N P n > 0 and m = 1 M L m > n = 1 N P n , our load shedding algorithm is activated. A summary of important symbols used in this study is given in Table 1.

3. Proposed Load-Shedding Algorithm

In this section, we devise an optimization scheme for load shedding to maximize the satisfaction of the system player. The system player is divided into power suppliers such as DGs and ESs and the power consumers such as loads and ESs. In this study, we use DGs as power suppliers and loads as power consumers. The system optimum is achieved when the satisfaction of both the DG and load are maximized. Given x m and y n , which are the satisfaction indices of the load m and DG n in the load shedding, U Load ( x m ) and U DG ( y n ) indicate utility functions of the load and the DG at a specific time interval. The time-dependent utility models general situations in which the load and DG may have various load demands and may supply power at different time intervals. We assume that U Load ( x m ) and U DG ( y n ) are continuously differentiable, strictly concave, and increase over the range x m 0 and y n 0 [21]. In this model, our optimization problem is given by:
maximize ( m = 1 M U Load ( x m ) + n = 1 N U DG ( y n ) ) .
Our optimization problem is divided into two parts: that of the load and that of the DG. First, we define the utility function from the load point of view. The utility function of the load reflects the satisfaction of power allocation and the dissatisfaction of power shortage. We analyze the relationship between the preference of a subdemand and the satisfaction. The satisfaction is achieved when the power is assigned to the subdemand with high preference greater than that when the power is assigned to the subdemand with a relatively low preference. Thus, we assign the power to subdemands in the order of high preference to low preference. To obtain the numerical value of the load satisfaction, we calculate k , which is given by:
max 1 k K min k = 1 k ( l 1 k + l 2 k + + l M k ) = max 1 k K min k = 1 k m = 1 M l m k ,
subject to:
k = 1 k m = 1 M l m k n = 1 N P n ,
where K min indicates min 1 m M K m . The satisfaction index of the subdemand l m k in the load m is given by:
τ m k = w l m k · l m k L m ,
where w l m k is the preference weight of the subdemand l m k . It is given by:
w l m k = 1 P r e l m k P r e max ,
where P r e l m k is the preference of the subdemand l m k . The satisfaction index of the load m , x m is given by:
x m = k = 1 k τ m k + φ m τ m k + 1 ,
subject to:
0 k K m ,
where φ m is a binary variable taken to be 0 or 1 for the linear programming problem. Thus, the satisfaction value of the load m is given by:
S m Load = α L m x m α L m x m ¯ ,
subject to:
m = 1 M φ m l m k + 1 n = 1 N P n   k = 1 k m = 1 M l m k ,
where
x m ¯ = ¬ φ m τ m k + 1 + k = k + 2 K m τ m k .
The variable ¬ φ m indicates the negation of φ m . In other words, ¬ φ m = ( φ m 0 = 1 ) . The variable α L m denotes the sensitivity to the preference of L m . In Equation (10), the first term indicates the satisfaction of power allocation for l m 1 ~ l m k ( or   l m k + 1 ) and the second term indicates the dissatisfaction for l m k + 1 ( or   l m k + 2 ) ~ l m K m resulting from the power shortage. Thus, the utility function of the load is defined as follows:
maximize   m = 1 M U Load ( x m ) = maximize   m = 1 M S m Load .
In the second part of our optimization problem, we define the utility function from the DG point of view. The utility function of the DG reflects the satisfaction of the power sale and the dissatisfaction of the power surplus. The uncertainty of power generation is one of the important features when a load selects its power supplier. It is because the amount of produced power by DGs is not estimated exactly in an islanded MG with renewable energy sources. For dealing with the uncertainty, we assign the uncertainty value to each DG according to the deviations of forecasted amounts of produced power in long-term historical data [17]. Using k in Equation (4), the subdemands of M loads, k = 1 k m = 1 M l m k , are assigned to DGs in the order of low to high uncertainty. The satisfaction index of the DG n , y n is given by:
y n = T n k + T n k + 1 ,
where:
T n k = 1 P n × k = 1 k m = 1 M l m k N ,
and
T n k + 1 = 1 P n × m = 1 M φ m l m k + 1 N ,
subject to:
k = 1 k m = 1 M l m k N + m = 1 M φ m l m k + 1 N P n .
Thus, the satisfaction value of the DG n is given by
S n DG = y n α P n ( 1 y n ) ,
where α P n is the sensitivity to the surplus power of P n . The utility function of DG is defined as follows:
maximize   n = 1 N U DG ( y n ) = maximize   n = 1 N S n DG .
Therefore, our optimization problem is described as follows:
maximize ( m = 1 M U Load ( x m ) + n = 1 N U DG ( y n ) ) = maximize ( m = 1 M S m Load + n = 1 N S n DG ) .

4. Performance Evaluation

An MAS is presented as an effective solution for a centralized or decentralized MG system [22]. Thus, we implemented an MAS for the load shedding management of an islanded MG using a Java Agent Development Environment (JADE) framework (Telecom Italia Lab, Torino, Italy) [23]. The MAS operating on JADE emulates distributed load shedding operations. To optimize load shedding, the MAS was linked with the IBM CPLEX Optimizer (IBM, Armonk, NY, USA) [24], which is a mathematical programming solver for linear programming.
We configured our system with MG central control (MGCC), using DGs as power generators and loads as power consumers. The components were classified according to operational capabilities and assigned appropriate control agents: A g MGCC , A g DG , and A g load [25]. One major functionality of MAS is the communication among the distributed agents. By using the Foundation for Intelligent Physical Agents (FIPA) guidelines for agent-based communication, FIPA-Contract Net Protocol (CNP) performatives are standardized [
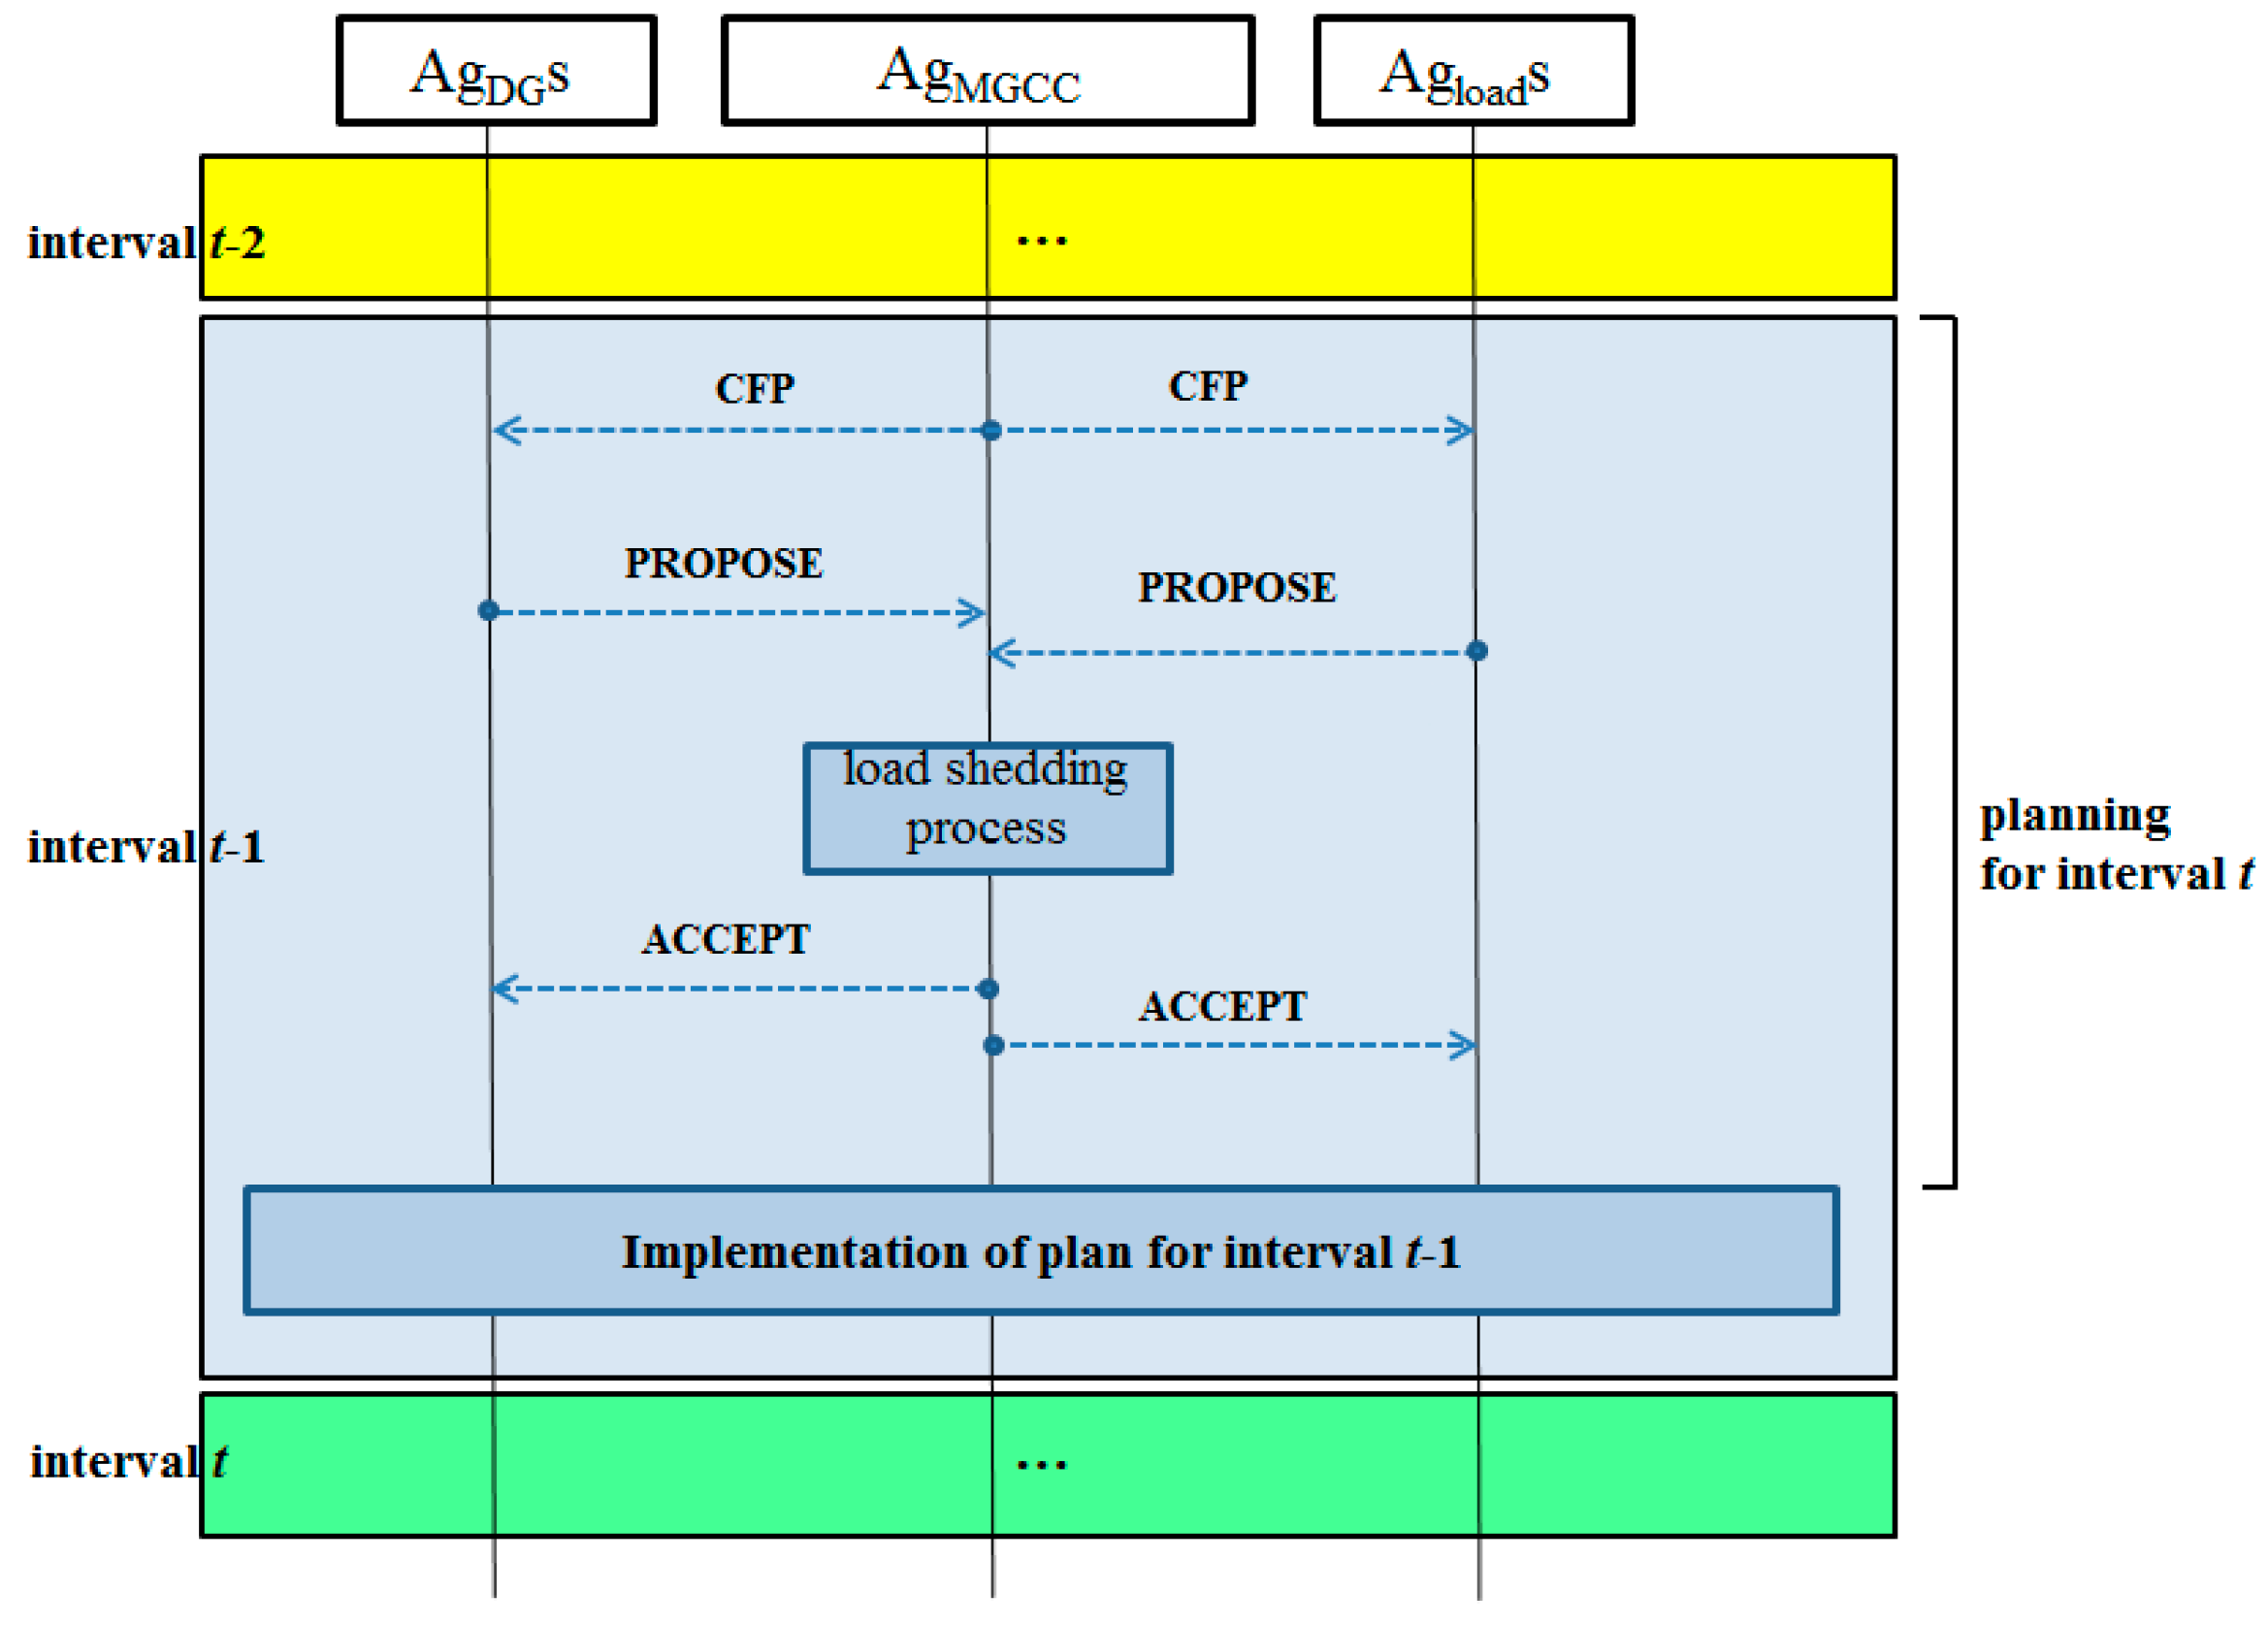
26]. The performatives included CFP (Call For Proposal), PROPOSE, REFUSE, ACCEPT, REJECT, FAILURE, and INFORM. Figure 1 shows the message flows when using the FIPA-CNP performatives. The MG operation follows an interval-based planning paradigm. First, the A g MGCC sends a CFP message to A g DG s and A g load s to produce a load shedding plan of the next interval (e.g., interval t ). The A g DG s and A g load s respond with PROPOSE messages to send their information to the A g MGCC . Such information includes the amount of power generated or the number of power demands. Each A g load additionally sends a list of subdemands with their preferences. If the supplied power is less than the demanded power, the A g MGCC initiates the load shedding scheme to determine the number of shed demands of the loads. Once the number of shed demands is determined, the A g M G C C sends ACCEPT messages to notify the A g DG s and A g load s of the results of the load shedding. For the A g DG s, the amount of power to be supplied to the loads is given. For the A g load s, the number of shed demands and the amount of power to be allocated to the loads are given. The notified load shedding plan is implemented at time interval t. The load shedding planning and implementation procedures repeat at each interval.
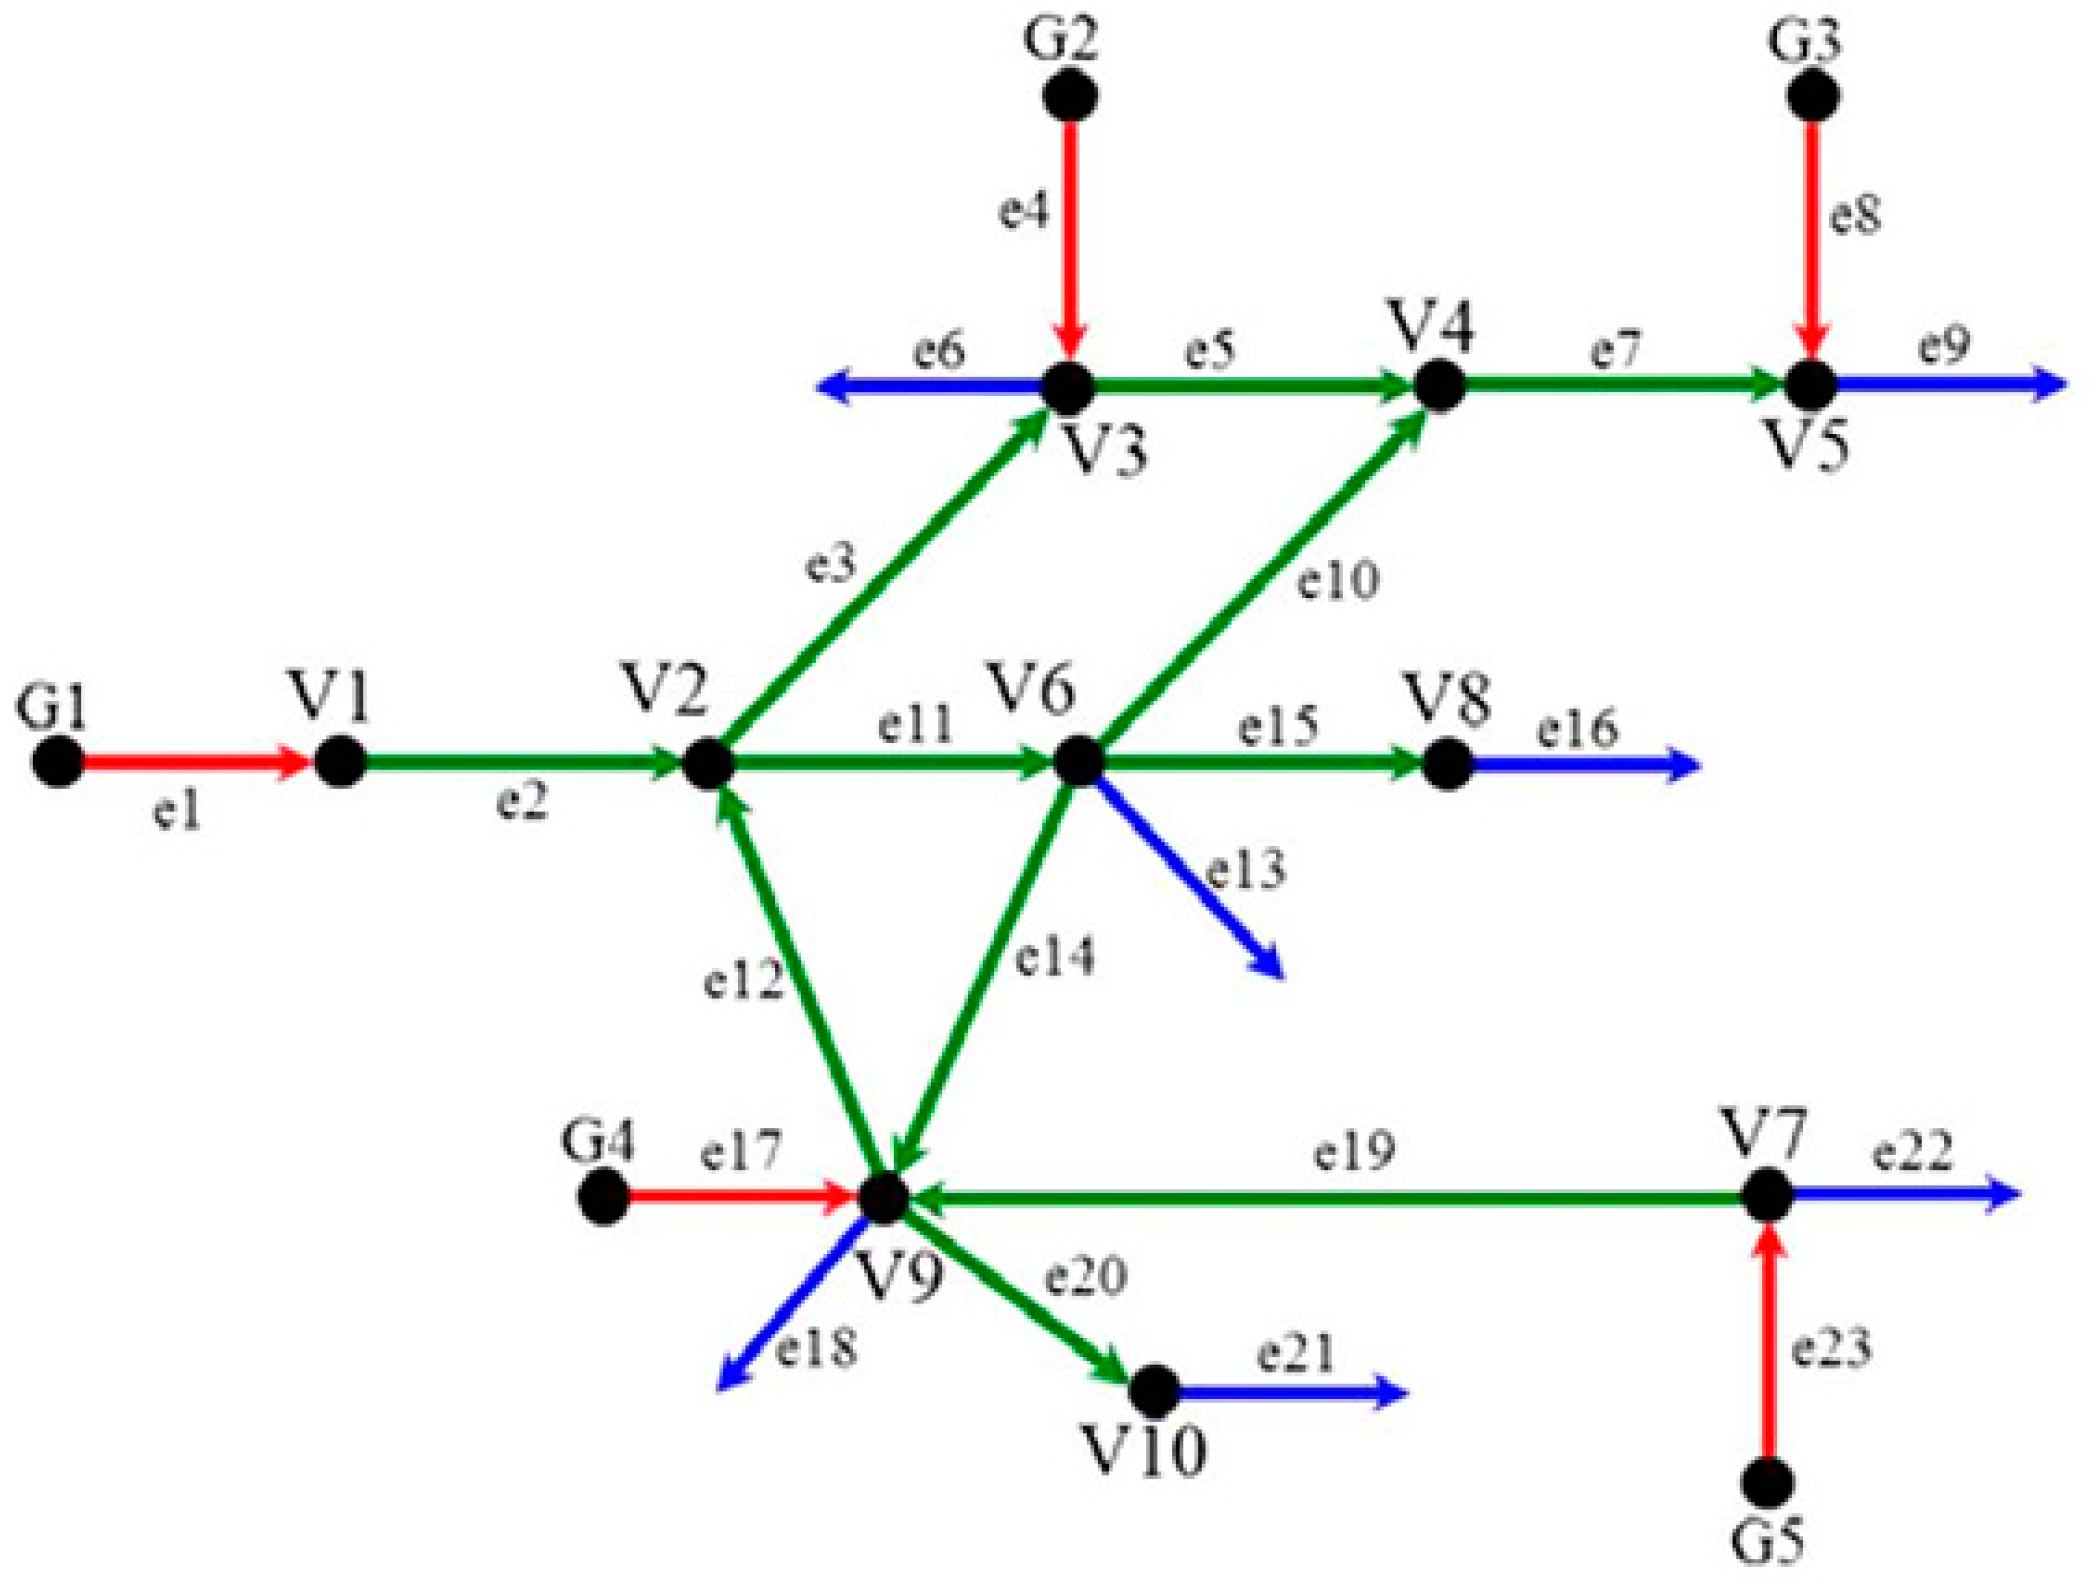
To show the functionality and feasibility of our algorithm, we configured the system with one A g MGCC , five A g DG s, and seven A g load s. The modified CERTS MG consists of five generators, seven loads, and 23 breakers [27]. A graphical representation of normal operation of the modified CERTS is shown in Figure 2.
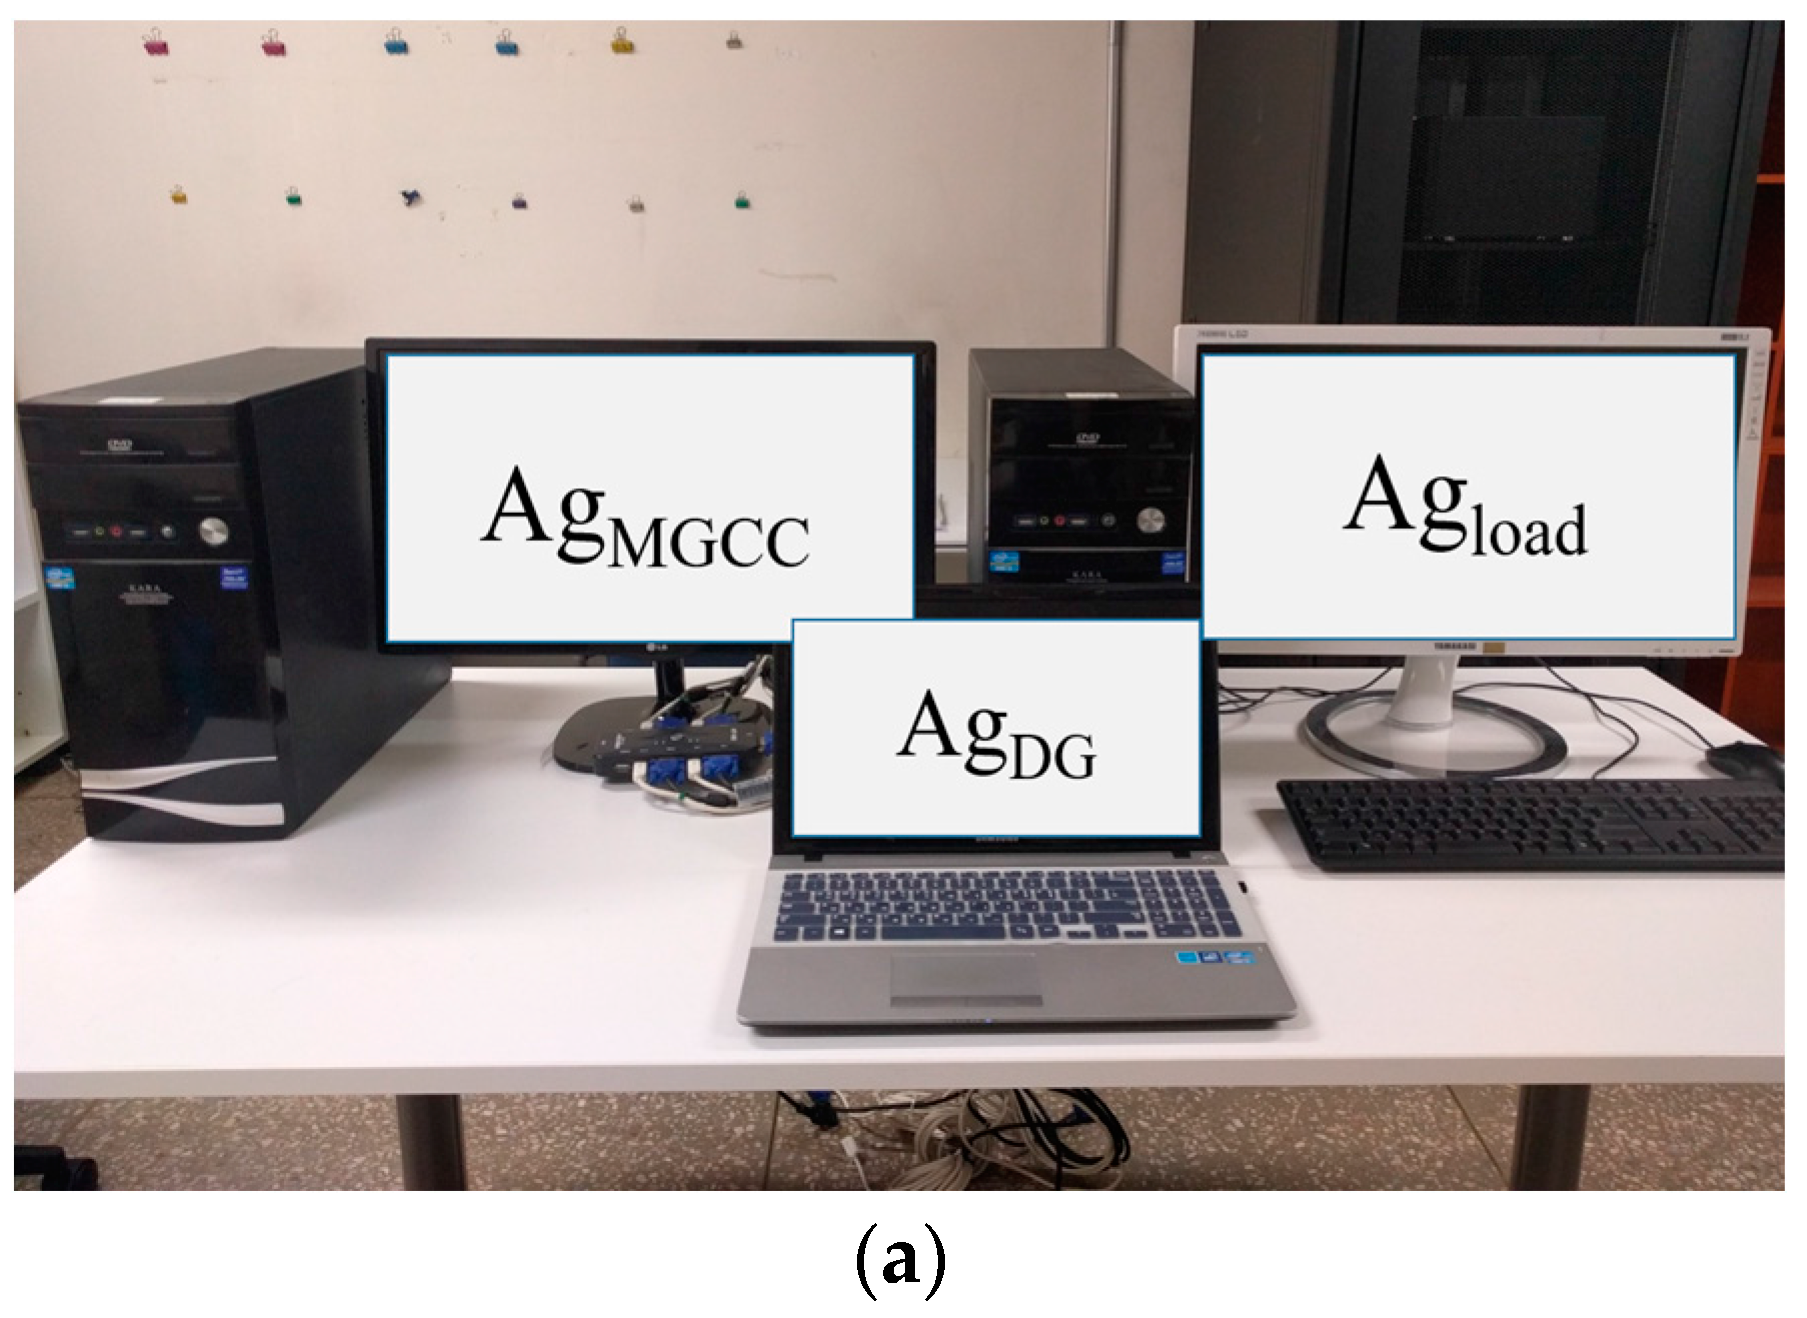
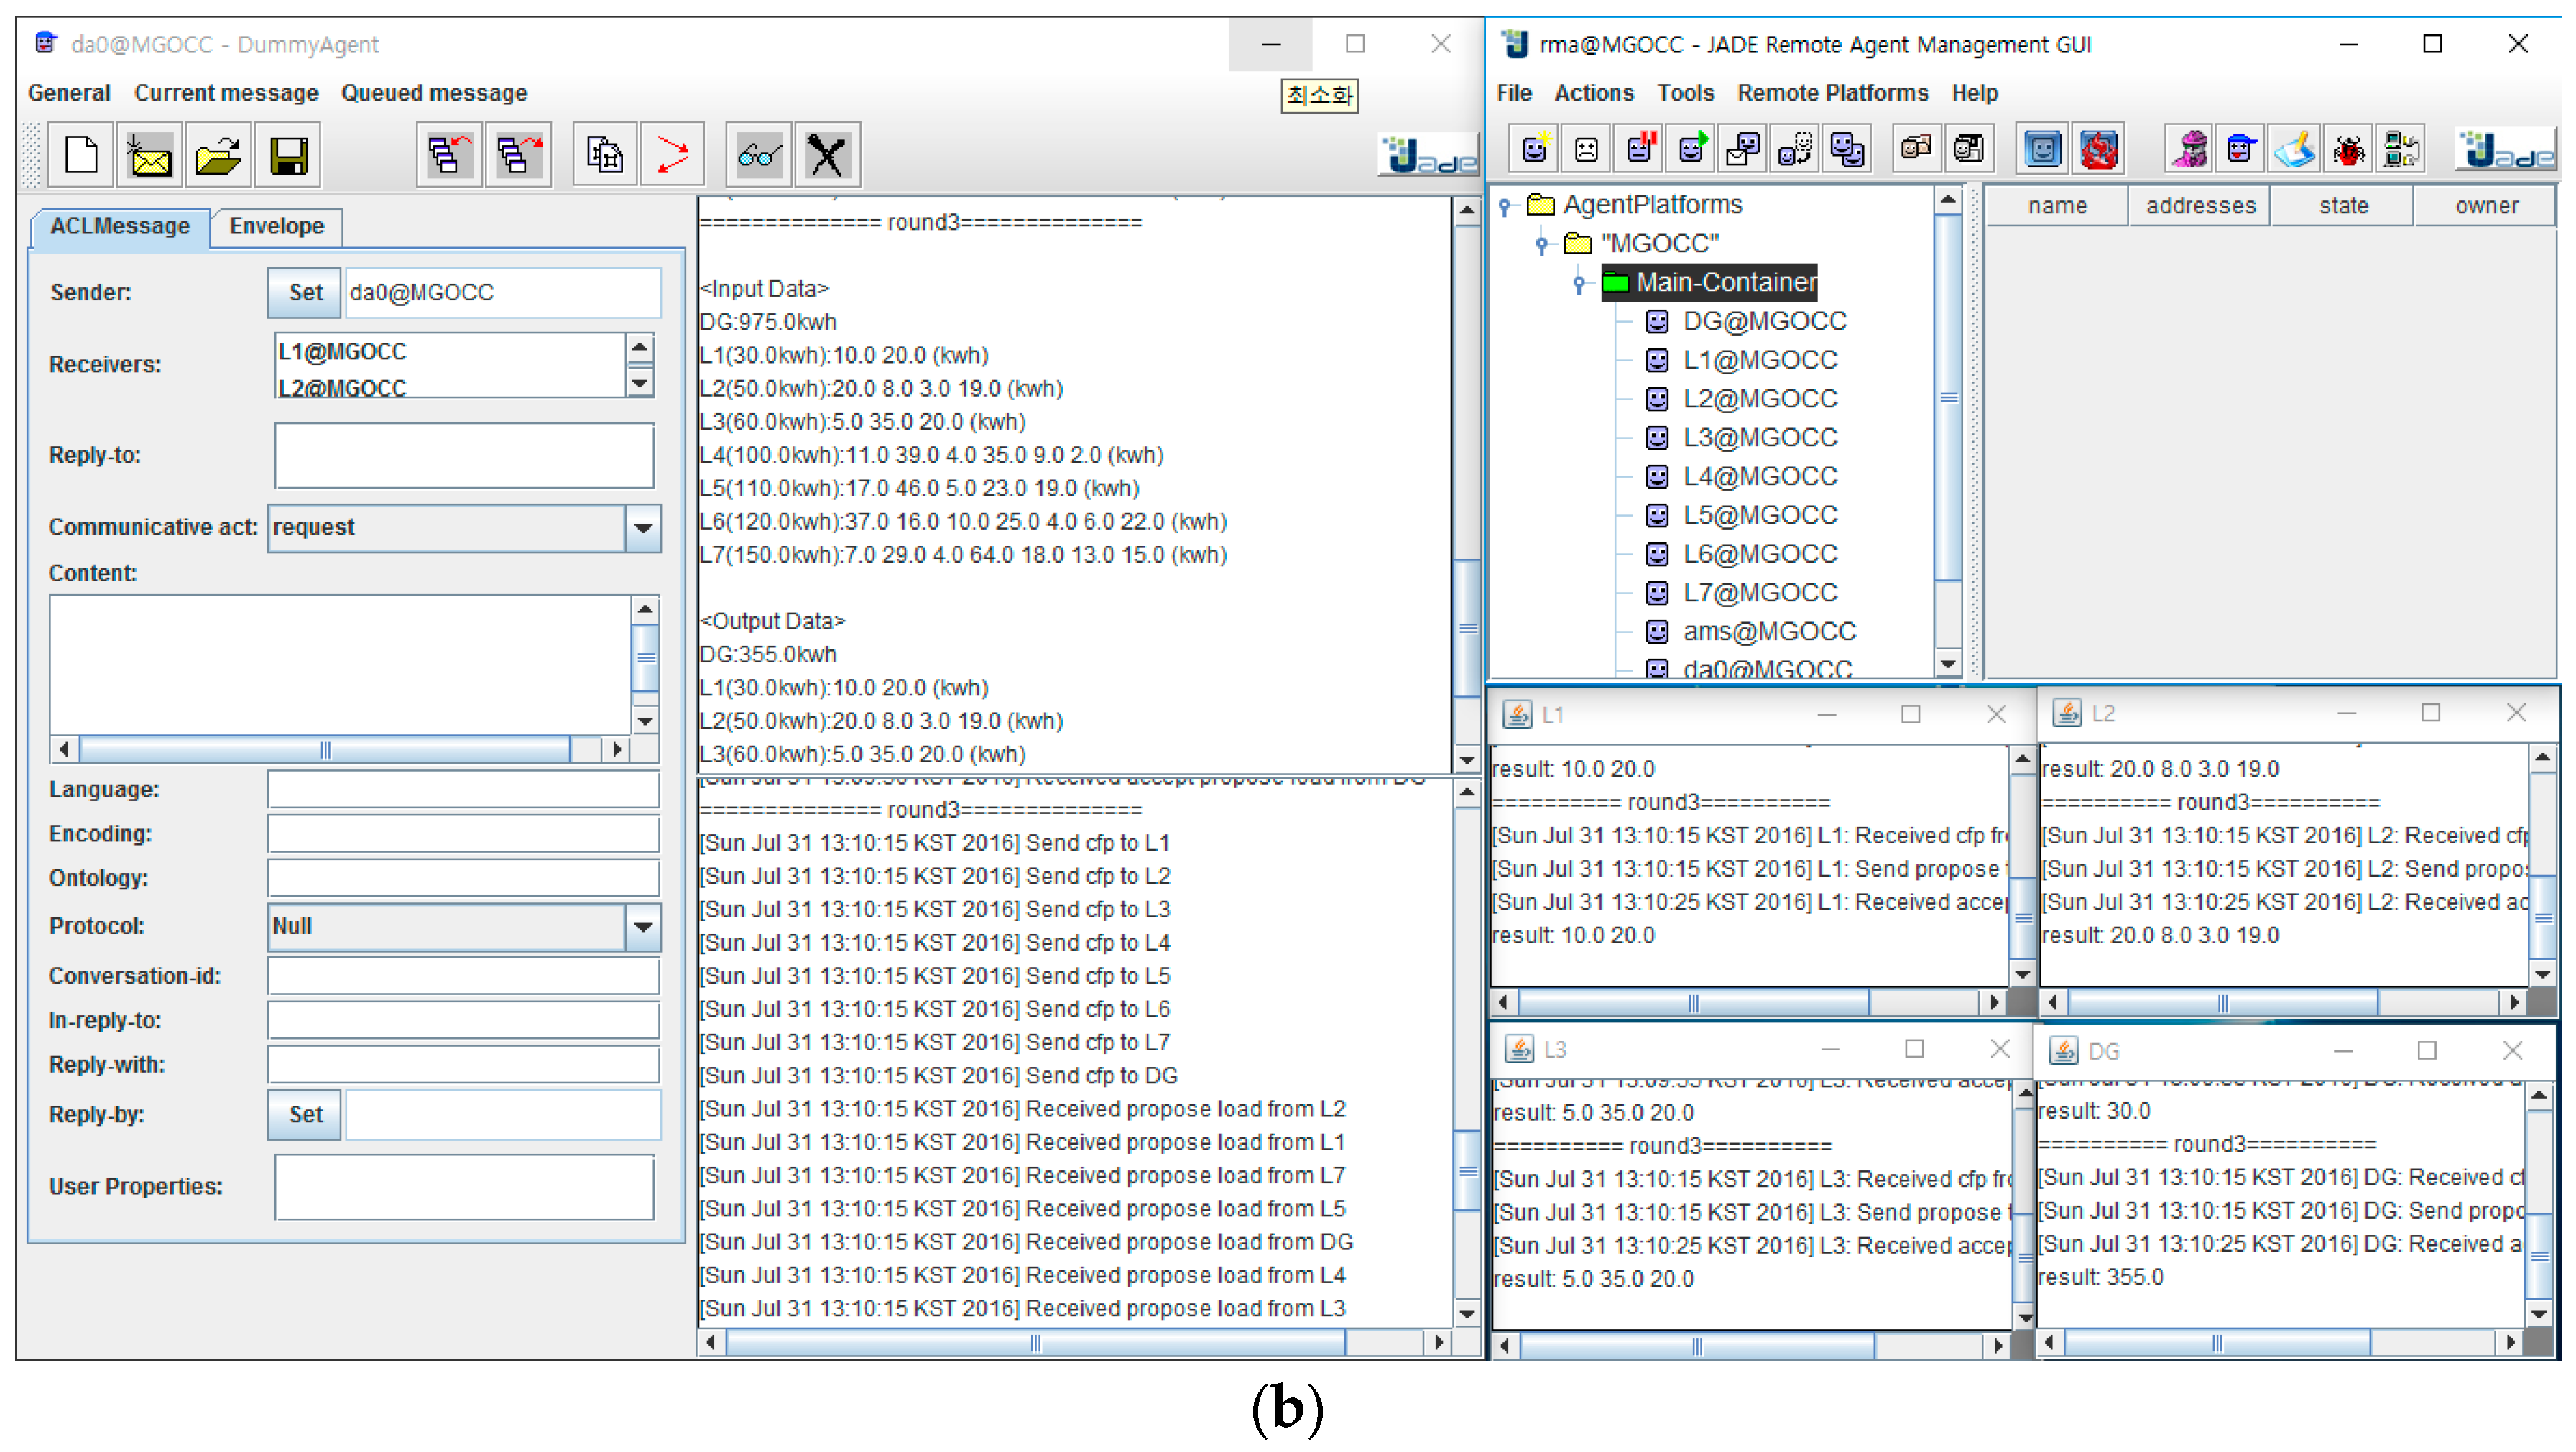
Figure 3 shows the system in a distributed environment based on three PCs. The left subfigure shows the test environment of our laboratory. One A g MGCC is on the first PC, five A g DG s are on the second PC, and seven A g load s are on the third PC. The Internet is used for inter-agent communications. The right subfigure shows the operational process on the implemented JADE system. In our system, for the sake of experiments, we assume that the critical load demands m = 1 7 L m ^ = 0 and n = 1 5 P n = n = 1 5 P n . The total controllable load demands m = 1 7 L m is set to 360   kWh and the total supply n = 1 5 P n is set to 50%, 65%, or 80% of the total load demands. For α L m and α P n , we set both of them to 1. The uncertainty values of DGs are set to the same value. The details of load data is given in Table 2 and the subdemands ( l m k ) for each load are sorted by preference ( P r e l m k ) in ascending order from the value ‘1’. We set P r e max to 10. We divided the time in a day to 24 intervals for MG operation, and the length of an interval was one hour. The amount of demand of an A g load for each interval follows a Poisson distribution.
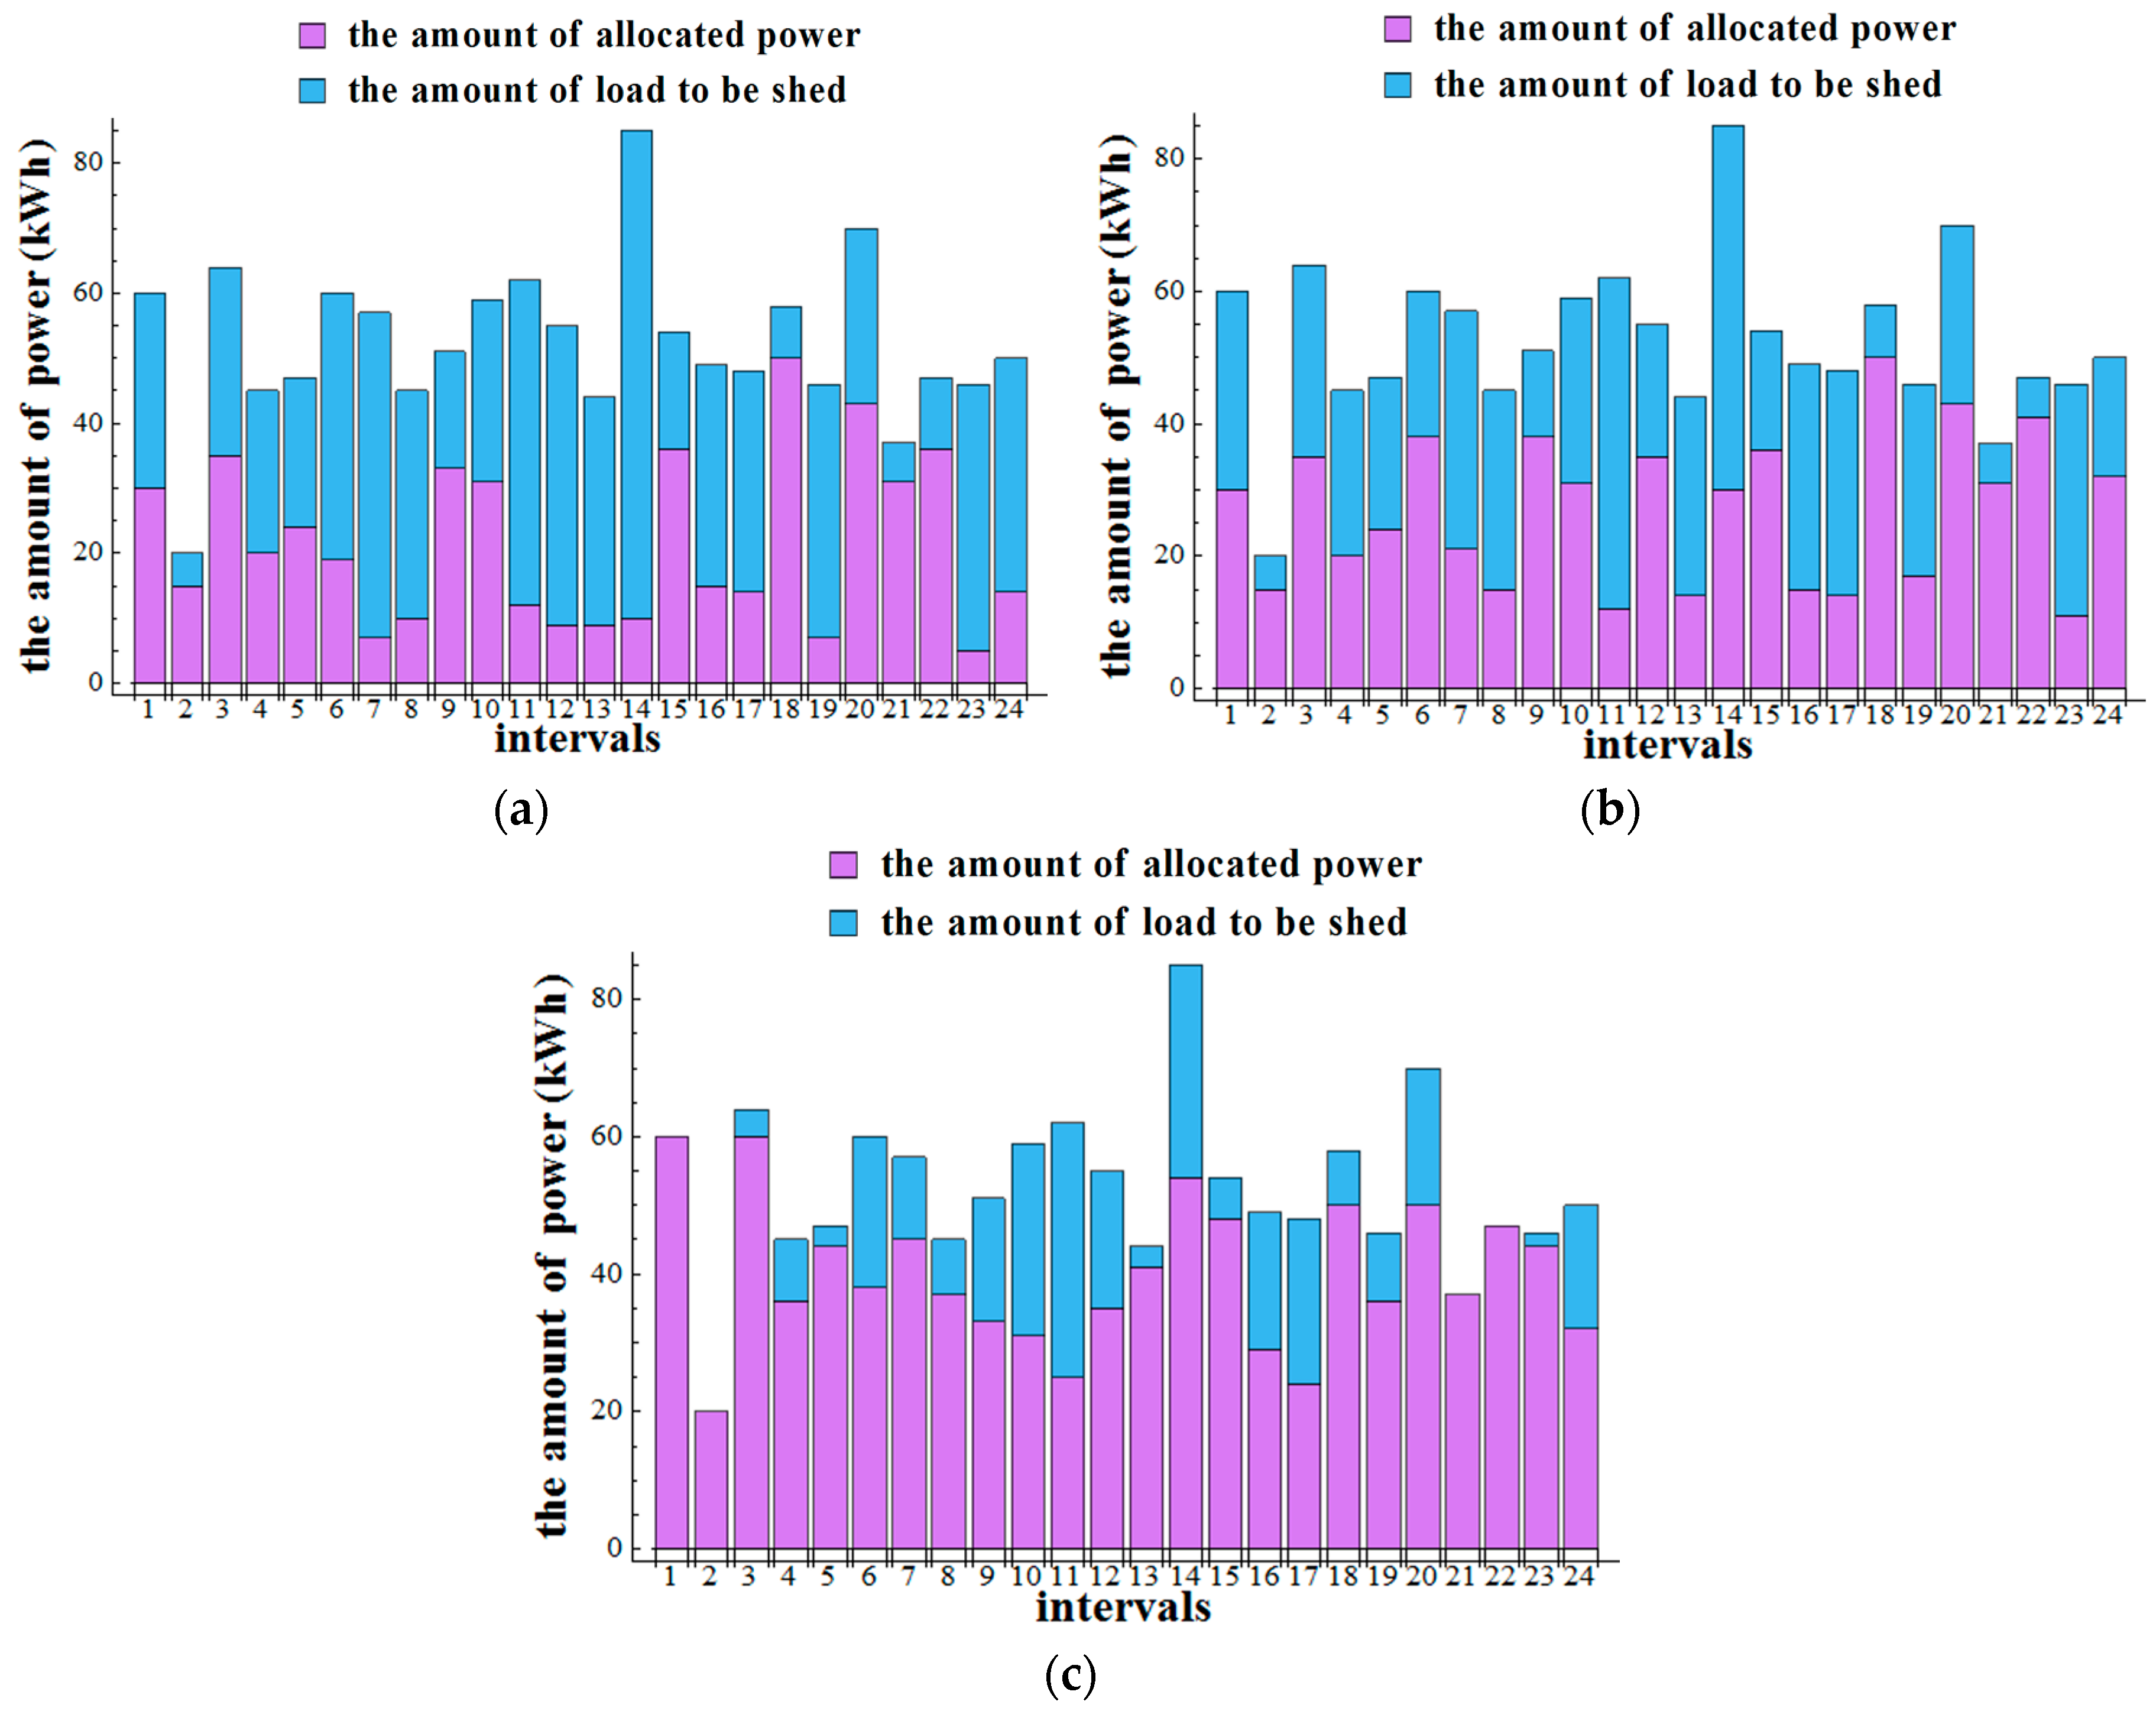
Figure 4 shows the functionality of our load shedding algorithm in three test scenarios. In experiments, the total power supply was set to 180   kWh for 50% of the total load demands (50% test scenario), 234   kWh for 65% (65% test scenario), and 288   kWh for 80% (80% test scenario). The subfigures show the number of shed demands of 3 A g load for 24 time intervals. In the figures, the height of a bar indicates the number of power demands, and the violet color of a bar indicates the amount of allocated power to the load. The blue color of a bar indicates the number of shed demands of the load. At each interval, as the power demands of the load changes, the number of shed demands accordingly changes. In addition, as the power supply increases, the number of shed demands decreases. In the experiments, the power was assigned about 42%, 52%, or 77% of the demands to 3 A g load for 50%, 65% or 80% test scenarios.
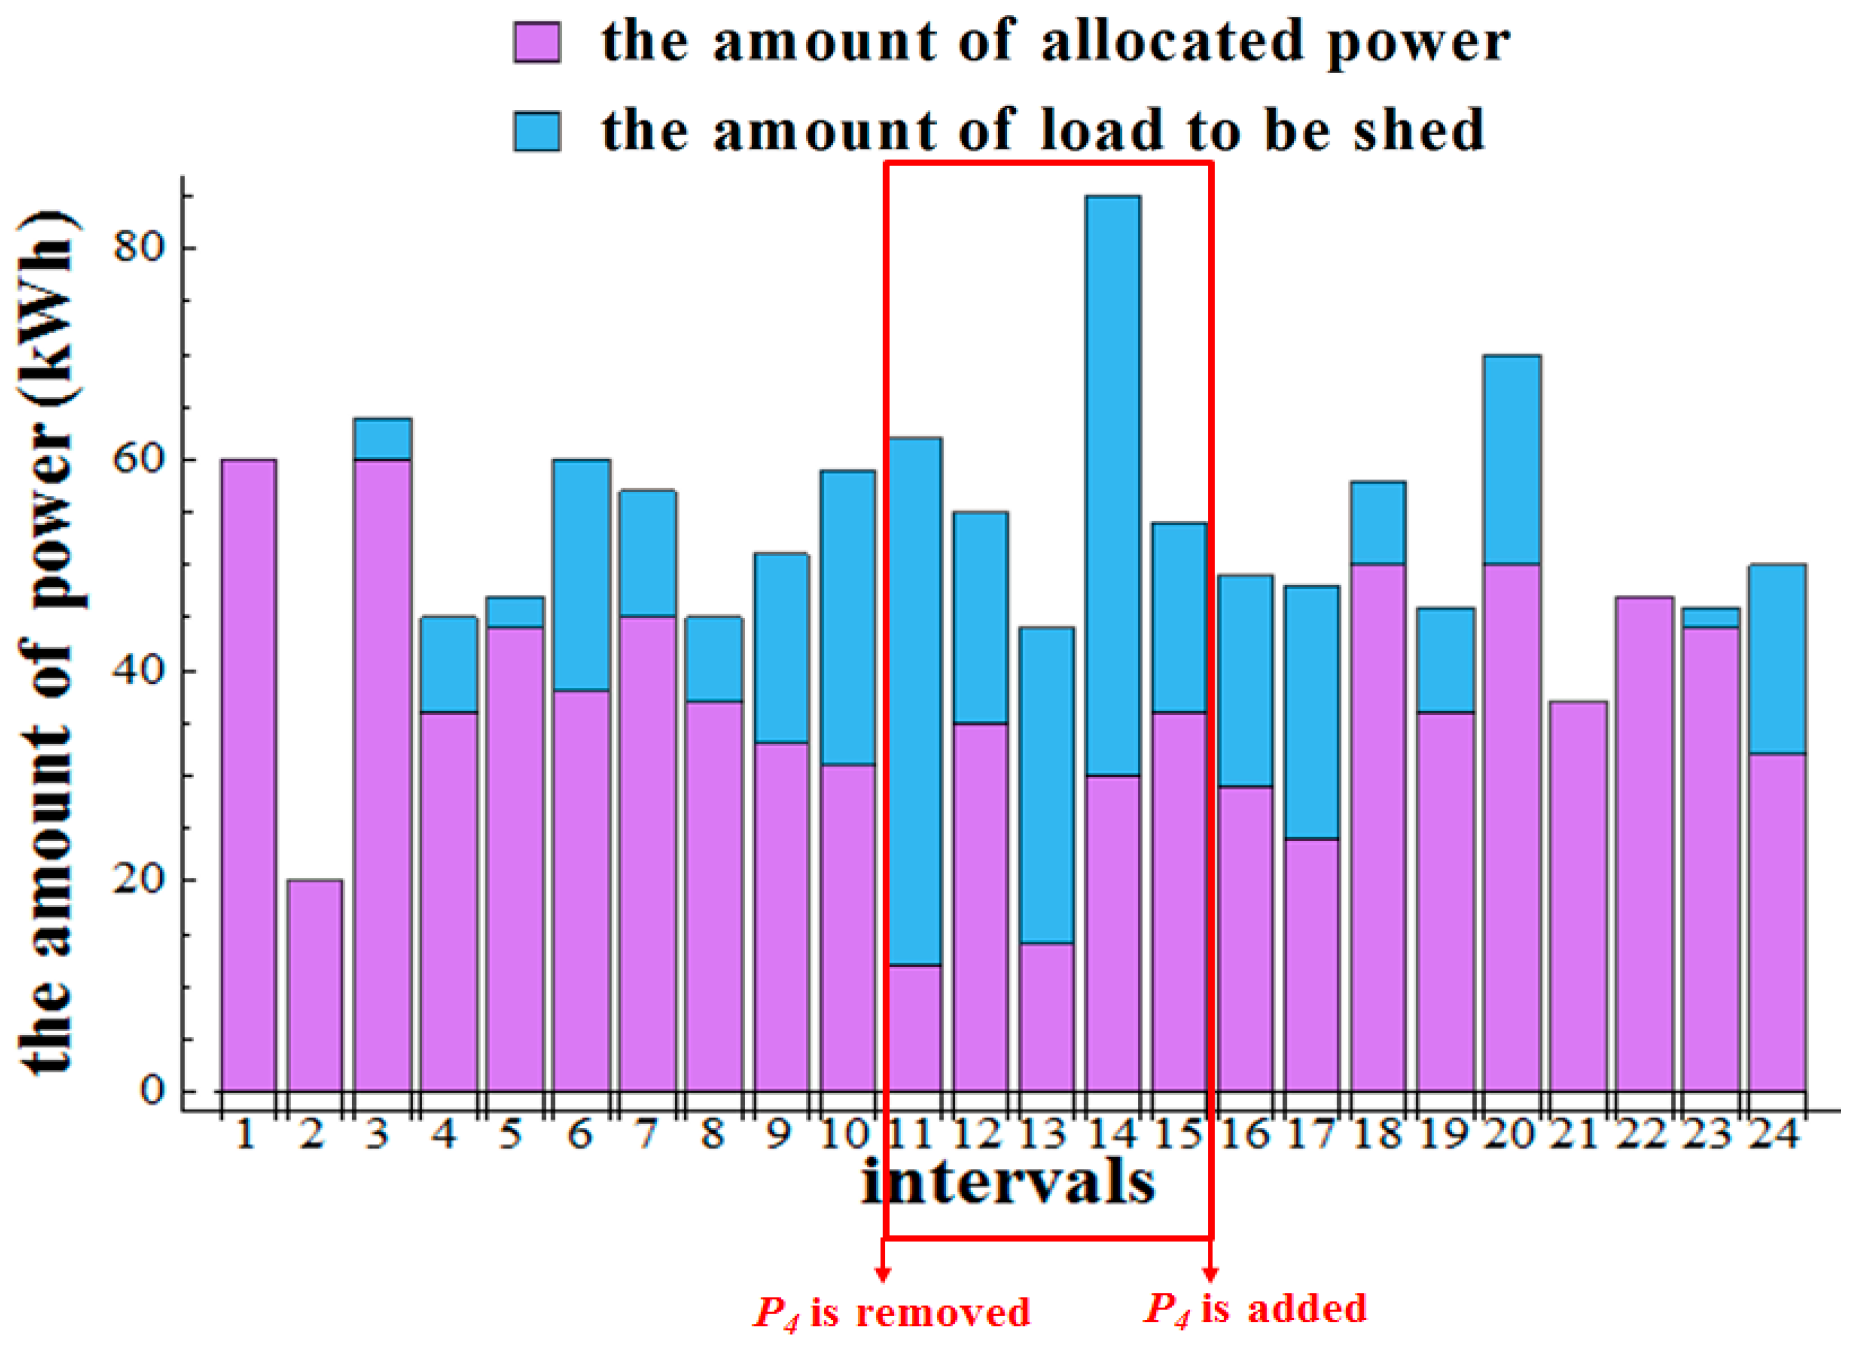
The plug-and-play functionality is one key feature of multi-agent based optimization systems. Thus, to investigate the plug-and-play functionality of our system, we configure that DG P 4 ( 50   kWh ) among five DGs is removed and added at intervals 11 and 15. Figure 5 shows that our system is feasible for plug-and-play operation when n = 1 5 P n is changed from 288 to 238   kWh .
To verify the performance of our algorithm, we compared it with the max–min fairness algorithm. In the max–min fairness, a resource is allocated to customers in order of increasing demand and customers with unsatisfied demands split the remaining resources. For the performance comparison, we designed the satisfaction metric (SM) of A g load   m as follows:
S M m = k = 1 k * w l m k · l m k k = 1 K m w l m k · l m k ,
where k * indicates the number of subdemands that the power is allocated. The SM of A g DG   n is given by:
S M n = P n ˇ P n ,
where P n ˇ indicates the amount of power to be allocated to the loads.
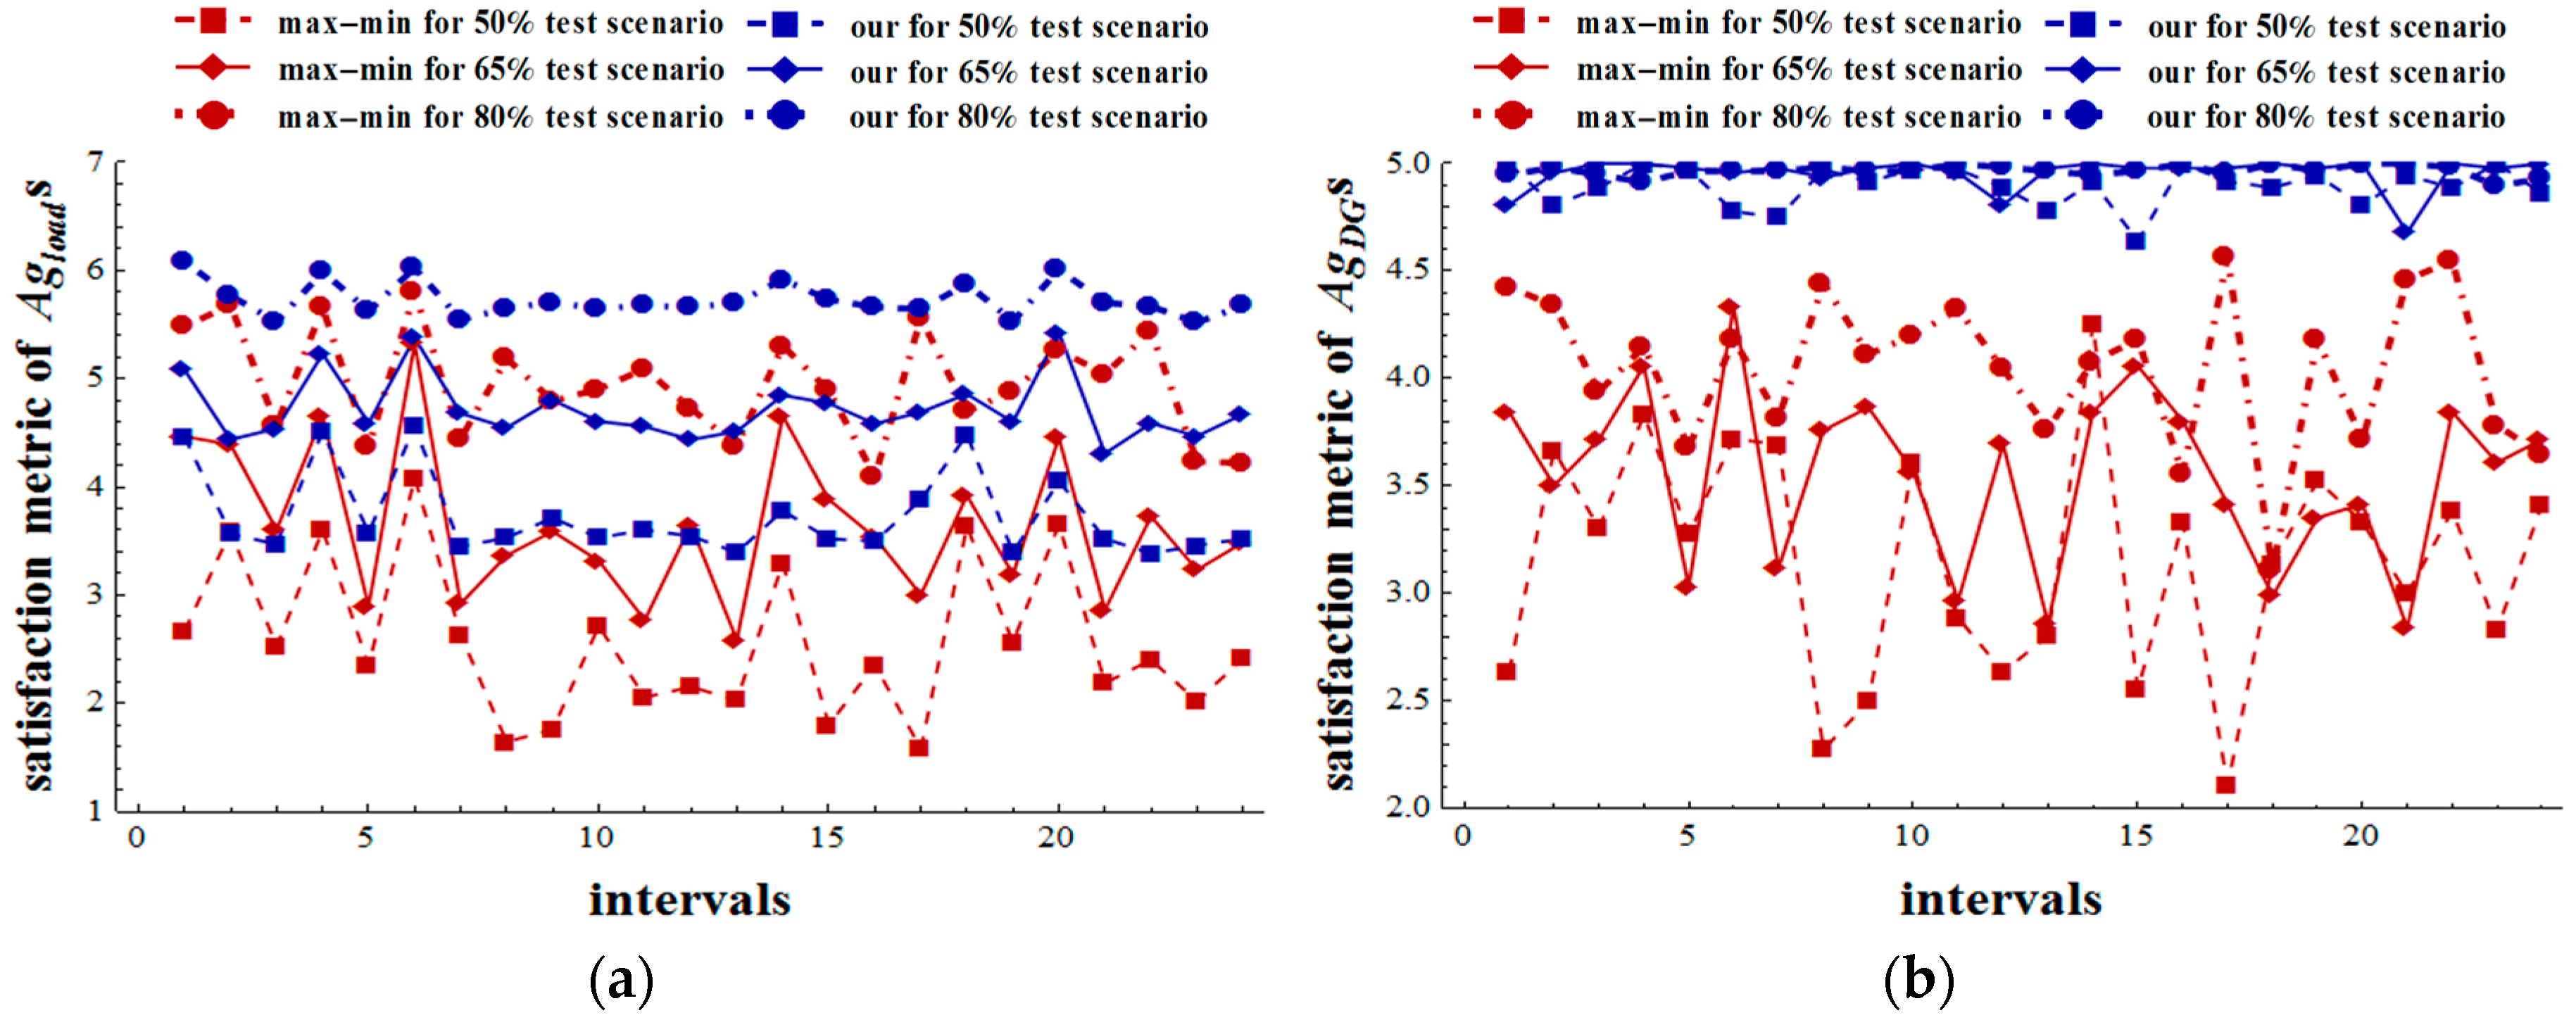
 Figure 6 shows the SM for different load conditions. Each value in the charts indicates m = 1 M S M m or n = 1 N S M n at each interval. Figure 6a shows the performance from the load points of view. On average, the SM of our algorithm was about 39% better than that of max-min algorithm. In detail, our algorithm showed about 55.1%, 39.4%, and 22.5% better performance for 50%, 65% and 80% test scenarios. Figure 6b shows the SM from the DG points of view. On average, the SM of our algorithm was about 30% better than that of the max–min algorithm. In detail, our algorithm showed about 44.8%, 29.3%, and 15.8% better performance for the three test scenarios. As a result, our algorithm improves the degree of satisfaction more than does the max–min fair algorithm from both the DG and load points of view.
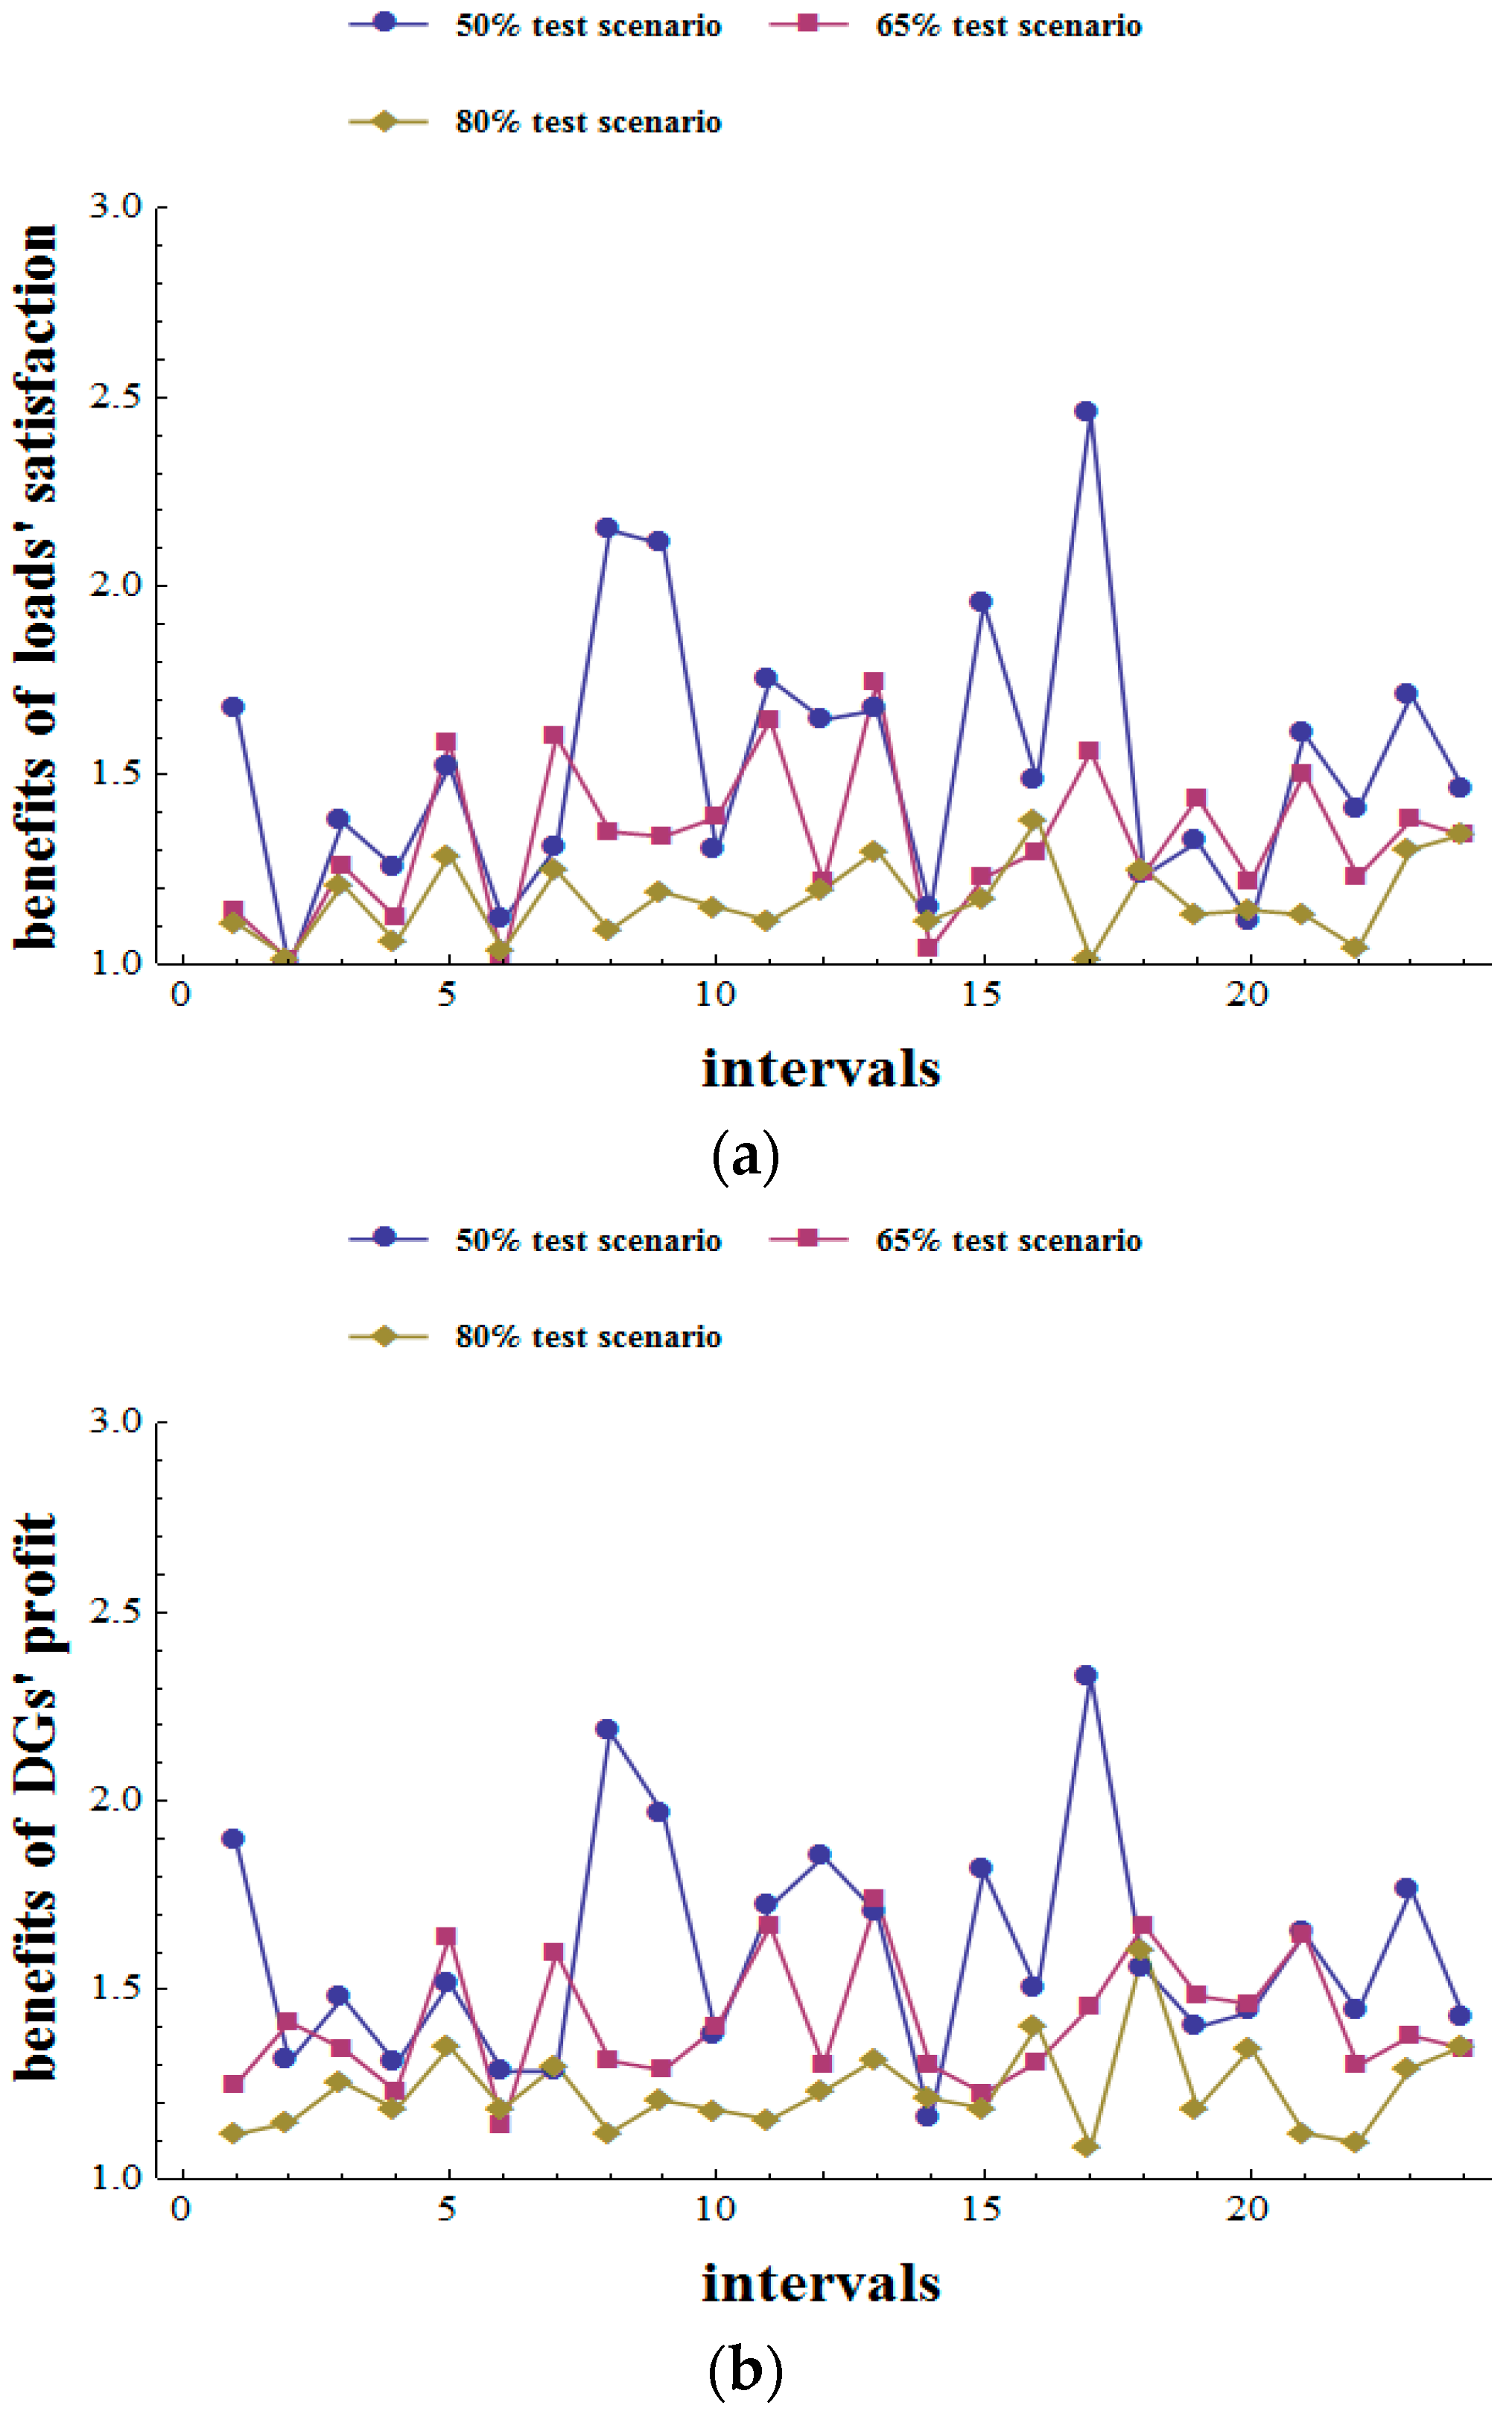
Figure 7 shows benefits for loads and DGs for different load conditions. On the load side, because the load demand is shed by force, we consider the benefits in terms of the satisfaction when the subdemands with high preferences are met. Figure 7a shows the benefit of load satisfaction when the SM of our algorithm is compared with the SM of the max–min algorithm. In detail, our algorithm shows about 153%, 132%, and 116% better benefits for 50%, 65%, and 80% test scenarios. Figure 7b shows the benefit of DGs’ profit. To generate the power, DGs spend generation costs such as the maintenance cost, fuel cost, and emission penalty. Thus, we consider the benefit in terms of the profit when the generated power is maximally assigned to load demands. In detail, our algorithm shows about 159%, 141%, and 123% better benefits for 50%, 65%, and 80% test scenarios. Thus, as the power shortage becomes worse, the benefit of our algorithm increases in terms of load satisfaction and DGs’ profit.
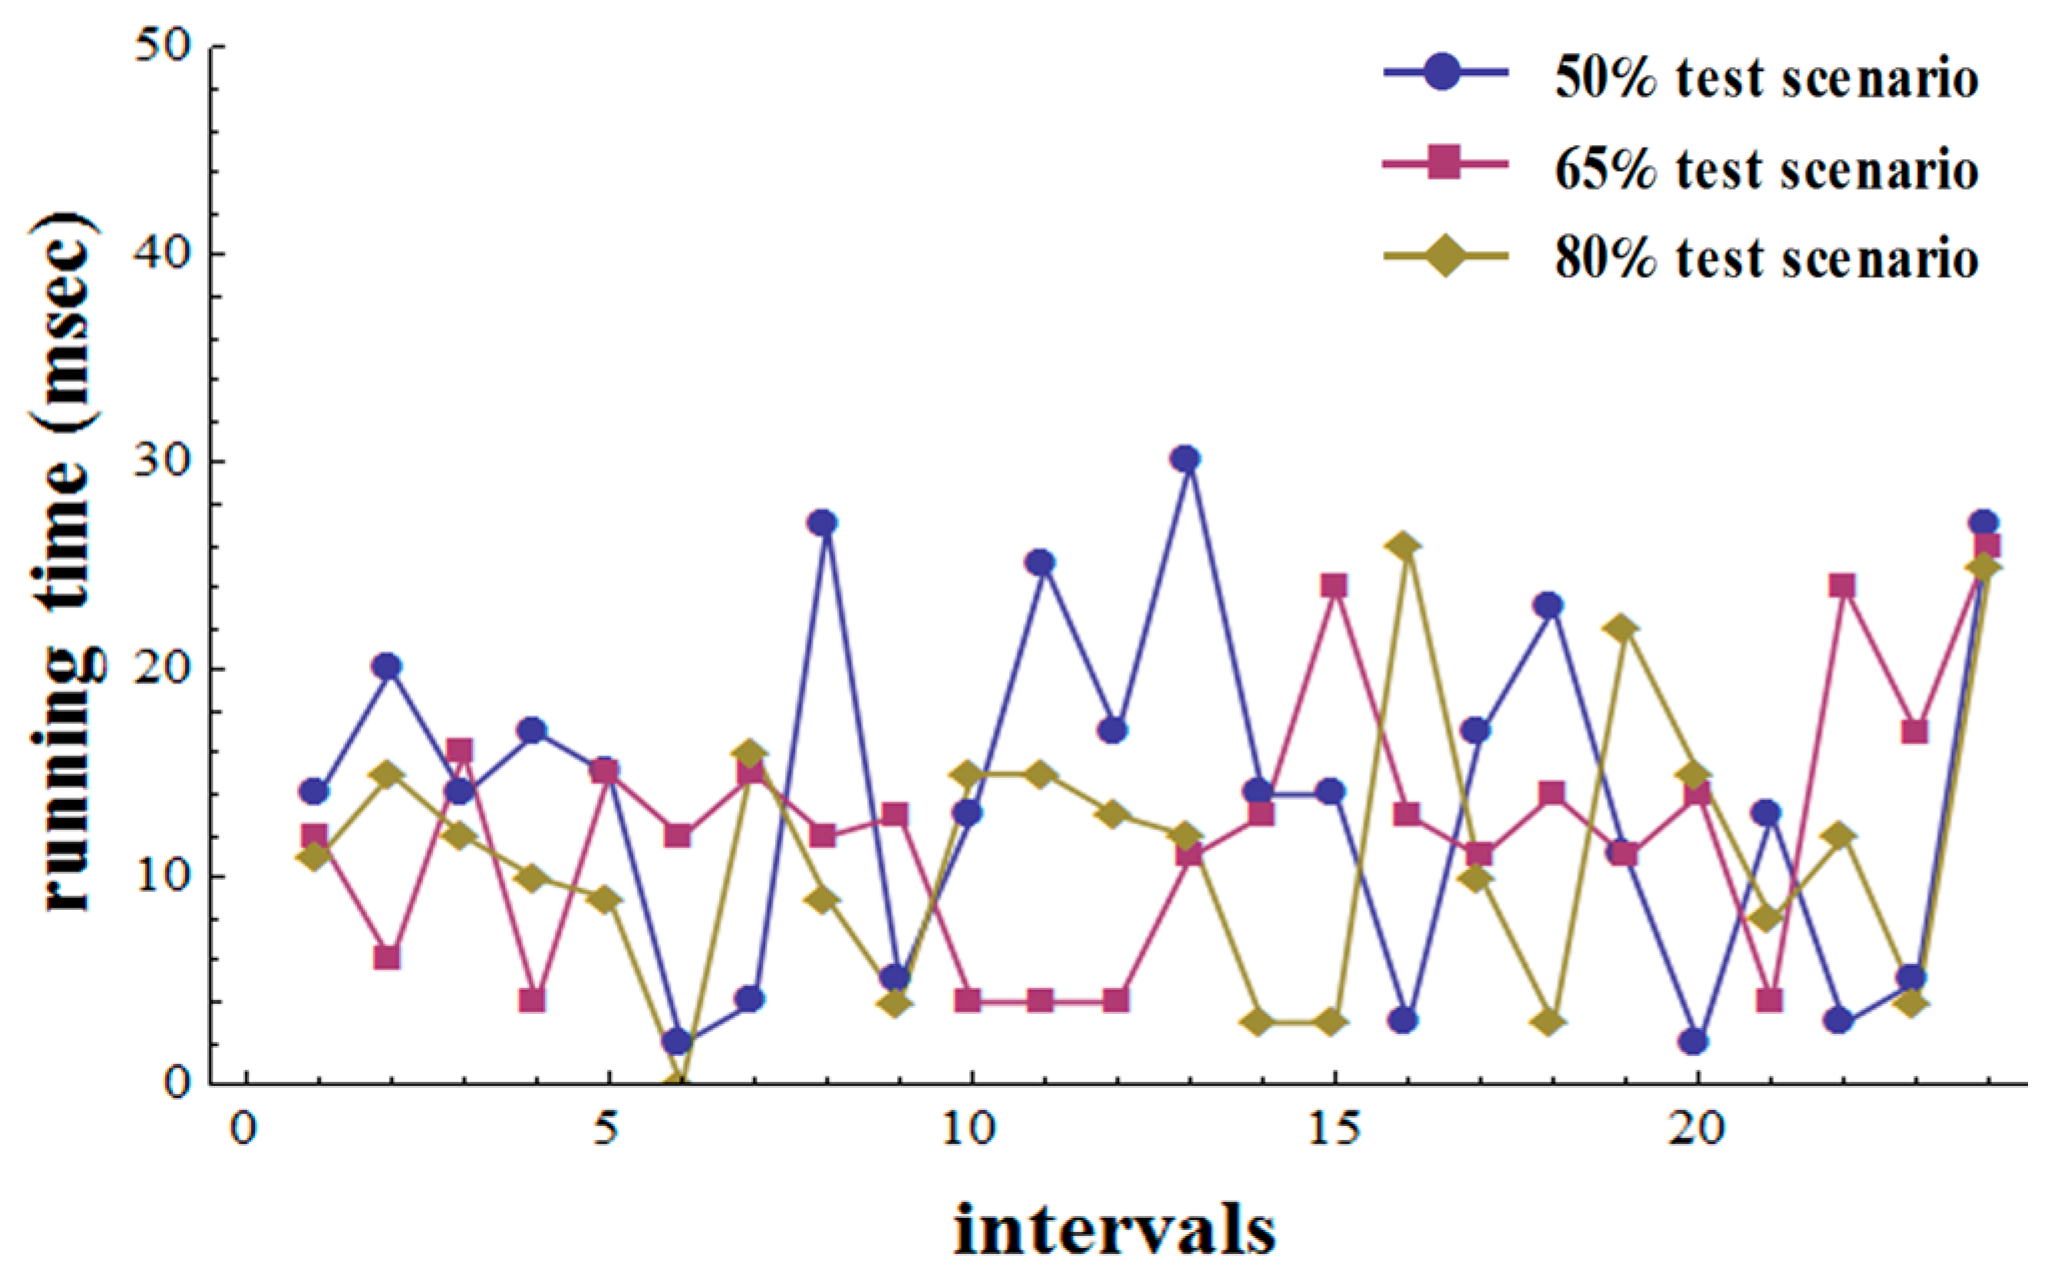
Figure 8 shows the running time of our load shedding algorithm. The dominant factor for the running time of our system is the time required to run the proposed optimization algorithm. For the efficient optimization calculation, we adopted the IBM CPLEX Optimizer in our MAS system. For our experiments, we varied the amount of total power supply. The running time of our system was up to 30   ms in the three test scenarios. In detail, the running times of our system were about 13.9 ms , 12.4 ms , and 11.3 ms for 50%, 65% and 80% test scenarios. Thus, we show that our optimization algorithm does not deteriorate performance in terms of running time.

5. Conclusions

We developed an optimization algorithm for the load shedding problem in an islanded MG. We achieved the system optimum by maximizing the satisfaction of both the DG and load. To maximize satisfaction, we designed the utility function to reflect the satisfaction of power allocation and the dissatisfaction of power shortage. To verify the performance, we implemented an MAS for the load shedding algorithm on top of a JADE framework. Regarding the adaptability of our algorithm, we showed that, as the power demands of the load changes, the number of shed demands accordingly changes. To verify performance, we compared the proposed algorithm with the max–min fairness algorithm in terms of SM. To analyze the feasibility, we measured the running time of our algorithm and revealed that the optimization problem is solved quickly and efficiently. For a future study, we plan to identify an optimal strategy for the load to determine the preference of subdemands for maximizing the profit of the load in the long run. In addition, we plan to continue to do research on how to implement our system in a real world system. For example, the conventional distribution systems are changed into multi-microgrid systems that are usually faster, more controllable and reliable. We plan to investigate the energy management system for a multi-microgrid.

Acknowledgments

This work was supported by the Power Generation & Electricity Delivery Core Technology from the Ministry of Trade, Industry & Energy, Korea. (No. 20141020402350).

Author Contributions

The paper was a collaborative effort between the authors. The authors contributed collectively to the theoretical analysis, modeling, simulation, and manuscript preparation.

Conflicts of Interest

The authors declare no conflicts of interest.

References

  1. Lopes, J.A.P.; Moreira, C.L.; Madureira, A.G. Defining control strategies for MicroGrids islanded operation. IEEE Trans. Power Syst. 2006, 21, 916–924. [Google Scholar] [CrossRef]
  2. Bashir, N.; Sharani, Z.; Qayyum, K.; Syed, A.A. Delivering smart load shedding for highly-stressed grids. In Proceedings of the 2015 IEEE International Conference on Smart Grid Communications (SmartGridComm), Miami, FL, USA, 2–5 November 2015; pp. 852–858.
  3. Balaguer, I.J.; Lei, Q.; Yang, S.; Supatti, U.; Peng, F.Z. Control for grid-connected and intentional islanding operations of distributed power generation. IEEE Trans. Ind. Electron. 2011, 58, 147–157. [Google Scholar] [CrossRef]
  4. Thale, S.S.; Wandhare, R.G.; Agarwal, V. A novel reconfigurable microgrid architecture with renewable energy sources and storage. IEEE Trans. Ind. Appl. 2015, 51, 1805–1816. [Google Scholar] [CrossRef]
  5. Zhao, Z.; Yang, P.; Guerrero, J.M.; Xu, Z.; Green, T.C. Multiple-time-scales hierarchical frequency stability control strategy of medium-voltage isolated microgrid. IEEE Trans. Power Electron. 2016, 31, 5974–5991. [Google Scholar] [CrossRef]
  6. Gao, H.; Chen, Y.; Xu, Y.; Liu, C.-C. Dynamic load shedding for an islanded microgrid with limited generation resources. IET Gener. Transm. Distrib. 2016, 10, 2953–2961. [Google Scholar] [CrossRef]
  7. Weaver, W.W.; Krein, P.T. Game-theoretic control of small-scale power systems. IEEE Trans. Power Deliv. 2009, 24, 1560–1567. [Google Scholar] [CrossRef]
  8. Kim, H.-M.; Kinoshita, T.; Lim, Y.; Kim, T.-H. A bankruptcy problem approach to load-shedding in multiagent-based microgrid operation. Sensors 2010, 10, 8888–8898. [Google Scholar] [CrossRef] [PubMed]
  9. Lim, Y.; Park, J.; Kim, H.-M.; Kinoshita, T. A Bargaining approach to optimizing load shedding in islanded microgrid operation. IETE Tech. Rev. 2013, 30, 483–489. [Google Scholar]
  10. Kumar, R.H.; Ushakumari, S. Optimal management of islanded microgrid using binary particle swarm optimization. In Proceedings of the 2014 International Conference on Advances in Green Energy (ICAGE), Thiruvananthapuram, India, 17–18 December 2014; pp. 251–257.
  11. Kumar, R.H.; Ushakumari, S. A two stage algorithm for optimal management of isolated microgrid. In Proceedings of the 2015 IEEE International Conference on Signal Processing, Informatics, Communication and Energy Systems (SPICES), Kozhikode, India, 19–21 February 2015; pp. 1–5.
  12. Hong, Y.Y.; Chen, P.H. Genetic-based underfrequency load shedding in a stand-alone power system considering fuzzy loads. IEEE Trans. Power Deliv. 2012, 27, 87–95. [Google Scholar] [CrossRef]
  13. Xing, S. Microgrid emergency control based on the stratified controllable load shedding optimization. In Proceedings of the International Conference on Sustainable Power Generation and Supply (SUPERGEN), Hangzhou, China, 8–9 September 2012; pp. 1–5.
  14. Zhang, H.; Lai, C.S.; Lai, L.L. A novel load shedding strategy for distribution systems with distributed generations. In Proceedings of the IEEE PES Innovative Smart Grid Technologies Conference Europe, Istanbul, Turkey, 12–15 October 2014; pp. 1–6.
  15. Saffarian, A.; Sanaye-pasand, M.; Asadi, H. Performance investigation of new combinational load shedding schemes. In Proceedings of the Joint International Conference on Power System Technology and IEEE Power India Conference (POWERCON), New Delhi, India, 12–15 October 2008; pp. 1–8.
  16. Seyedi, H.; Sanaye-Pasand, M.; Dadashzadeh, M.R. Design and simulation of an adaptive load shedding algorithm using a real network. In Proceedings of the IEEE Power India Conference, New Delhi, India, 10–12 April 2006; pp. 1–5.
  17. Talari, S.; Yazdaninejad, M.; Haghifam, M.-R. Stochastic-based scheduling of the microgrid operation including wind turbines, photovoltaic cells, energy storages and responsive loads. IET Gener. Transm. Distrib. 2015, 9, 1498–1509. [Google Scholar] [CrossRef]
  18. Wu, H.; Shahidehpour, M.; Al-Abdulwahab, A. Hourly demand response in day-ahead scheduling for managing the variability of renewable energy. IET Gener. Transm. Distrib. 2013, 7, 226–234. [Google Scholar] [CrossRef]
  19. Guo, L.; Liu, W.; Jiao, B.; Hong, B.; Wang, C. Multi-objective stochastic optimal planning method for stand-alone microgrid system. IET Gener. Transm. Distrib. 2014, 8, 1263–1273. [Google Scholar] [CrossRef]
  20. Gast, N.; Tomozei, D.-C.; Le Boudec, J.-Y. Optimal generation and storage scheduling in the presence of renewable forecast uncertainties. IEEE Trans. Smart Grid 2014, 5, 1328–1339. [Google Scholar] [CrossRef]
  21. Chen, L.; Li, N.; Low, S.H.; Doyle, J.C. Two market models for demand response in power networks. In Proceedings of the 2010 First IEEE International Conference on Smart Grid Communications (SmartGridComm), Gaithersburg, MD, USA, 4–6 October 2010; pp. 397–402.
  22. Liu, W.; Gu, W.; Sheng, W.; Meng, X.; Wu, Z.; Chen, W. Decentralized multi-agent system-based cooperative frequency control for autonomous microgrids with communication constraints. IEEE Trans. Sustain. Energy 2014, 5, 446–456. [Google Scholar] [CrossRef]
  23. Java Agent Development Framework. Available online: http://jade.tilab.com/ (accessed on 6 July 2016).
  24. IBM CPLEX Optimizer. Available online: https://www-01.ibm.com/software/commerce/optimization/cplex-optimizer/ (accessed on 6 July 2016).
  25. Lim, Y.; Kim, H.-M.; Kinoshita, T. Distributed load-shedding system for agent-based autonomous microgrid operations. Energies 2014, 7, 385–401. [Google Scholar] [CrossRef]
  26. Foundation for Intelligent Physical Agents (FIPA). Available online: http://www.fipa.org/ (accessed on 6 July 2016).
  27. Shariatzadeh, F.; Vellaithurai, C.B.; Biswas, S.S.; Zamora, R.; Srivastava, A.K. Real-time implementation of intelligent reconfiguration algorithm for microgrid. IEEE Trans. Sustain. Energy 2014, 5, 598–607. [Google Scholar] [CrossRef]
Figure 1. Message flow among agents for our load shedding system.
Energies 10 00045 g001
Figure 2. Modified Consortium for Electric Reliability Technology Solutions (CERTS) MG.
Energies 10 00045 g002
Figure 3. Implemented system in a distributed environment. (a) Test environment of our laboratory; and (b) operational process on the implemented system.
Energies 10 00045 g003aEnergies 10 00045 g003b
Figure 4. Number of shed demands of a specific A g load in three test scenarios. (a) When the 50% test scenario is used; (b) when the 65% test scenario is used; and (c) when the 80% test scenario is used.
Energies 10 00045 g004
Figure 5. Plug-and-play operation capability.
Energies 10 00045 g005
Figure 6. Satisfaction metric (SM) for: (a) M loads; (b) N DGs.
Energies 10 00045 g006
Figure 7. Benefit of: (a) M loads; (b) N DGs.
Energies 10 00045 g007
Figure 8. Running time of our load shedding system.
Energies 10 00045 g008
Table 1. Summary of important symbols. DG: distributed generator.
SymbolDefinition
P n amount of power supplied by DG n
N number of DGs
L m ^ critical demand of load m
L m controllable load demand of load m
l m k k-th subdemand of L m
M number of loads
K m number of subdemands of L m
P r e l m k preference of l m k
P r e max max value of the preference
α L m sensitivity to the preference of L m
α P n sensitivity to the surplus power of P n
Table 2. Details of load data for modified Consortium for Electric Reliability Technology Solutions (CERTS) MG.
Load NumberDemandSubdemands
110030, 20, 15, 20, 15
26020, 15, 20, 5
36010, 20, 30
46020, 25, 15
52010, 10
63010, 20
73015, 15

