Partial Discharge of Needle-Plane Defect in Oil-Paper Insulation under AC and DC Combined Voltages: Developing Processes and Characteristics


Abstract
:1. Introduction
2. Experimental Setup of the PD Test under AC-DC Combined Voltage
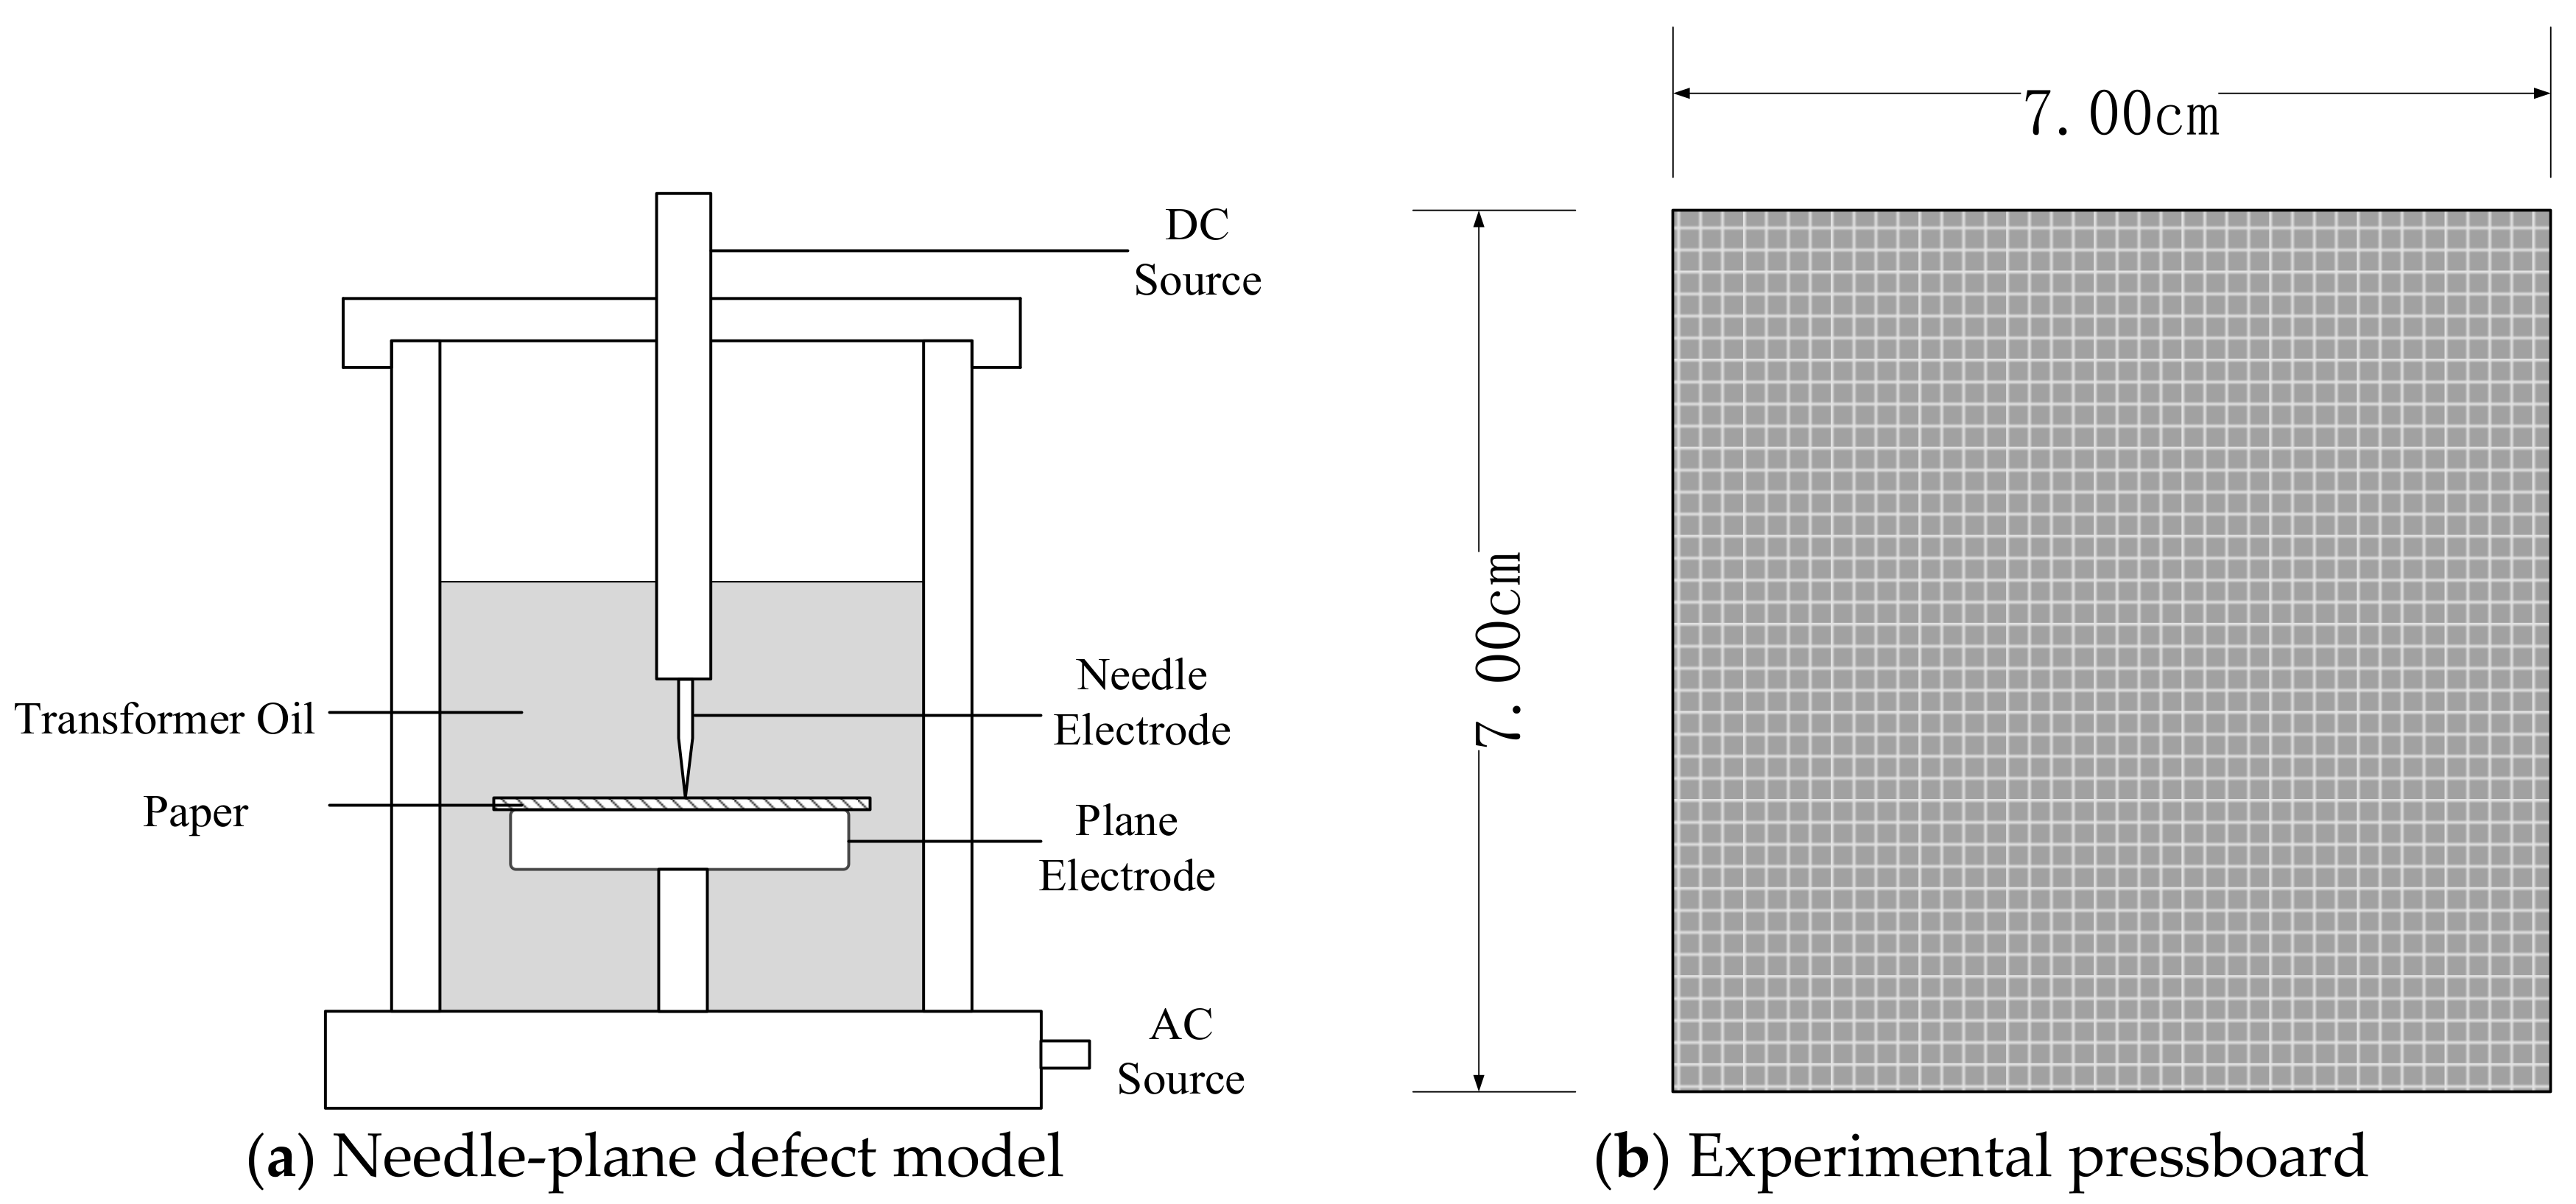
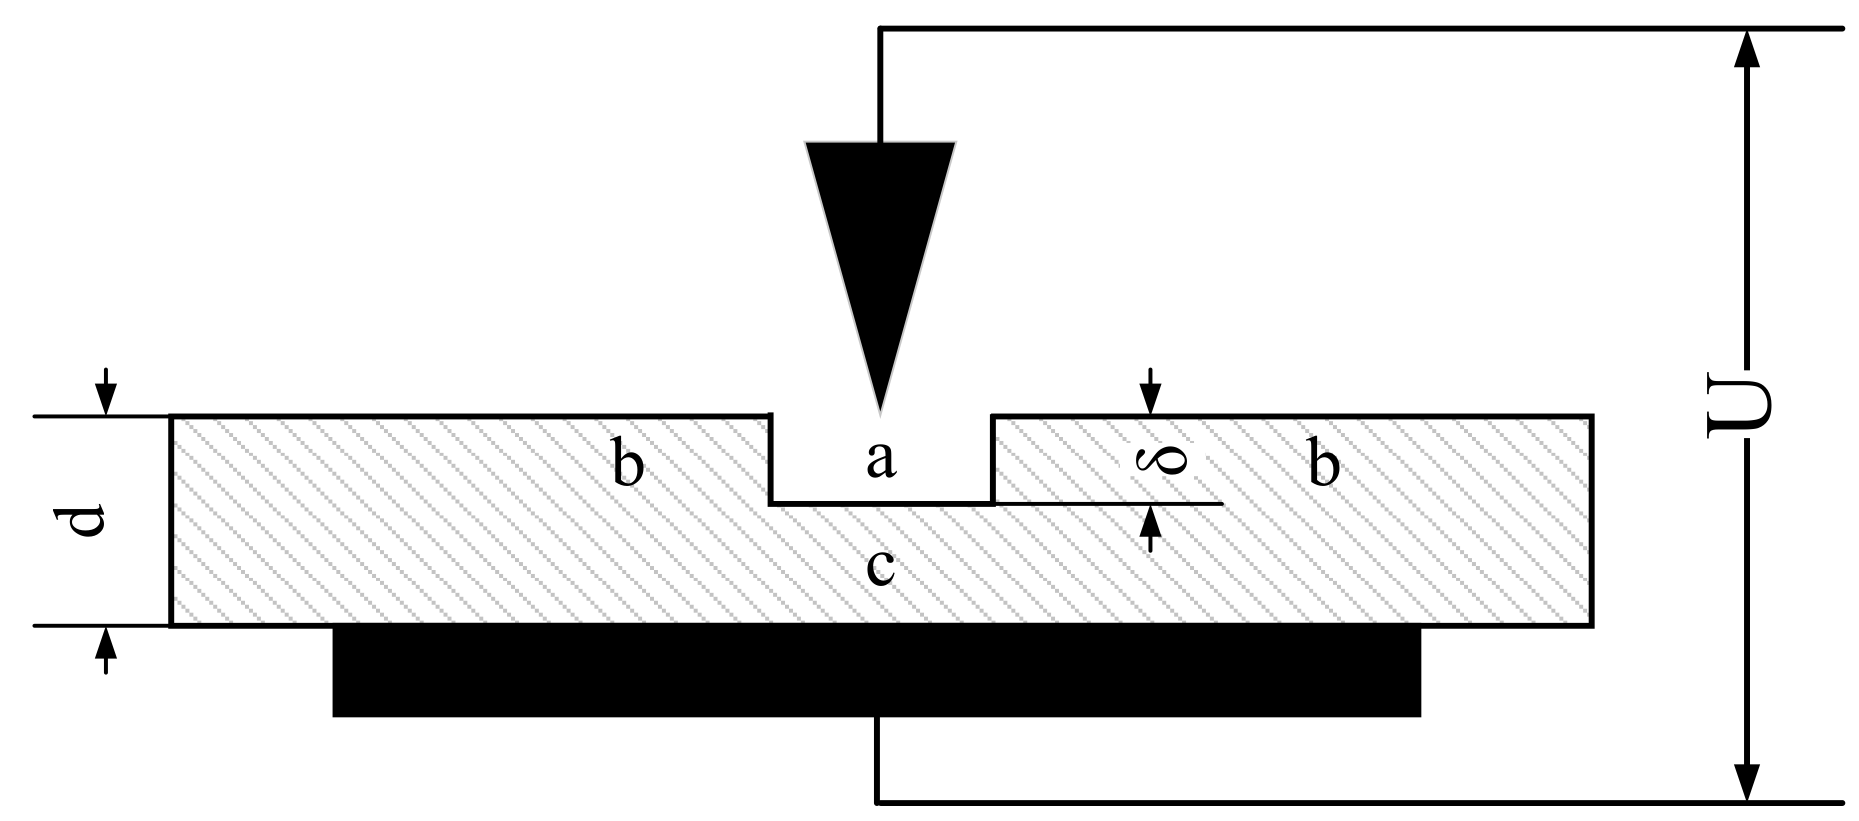
2.1. Test Model
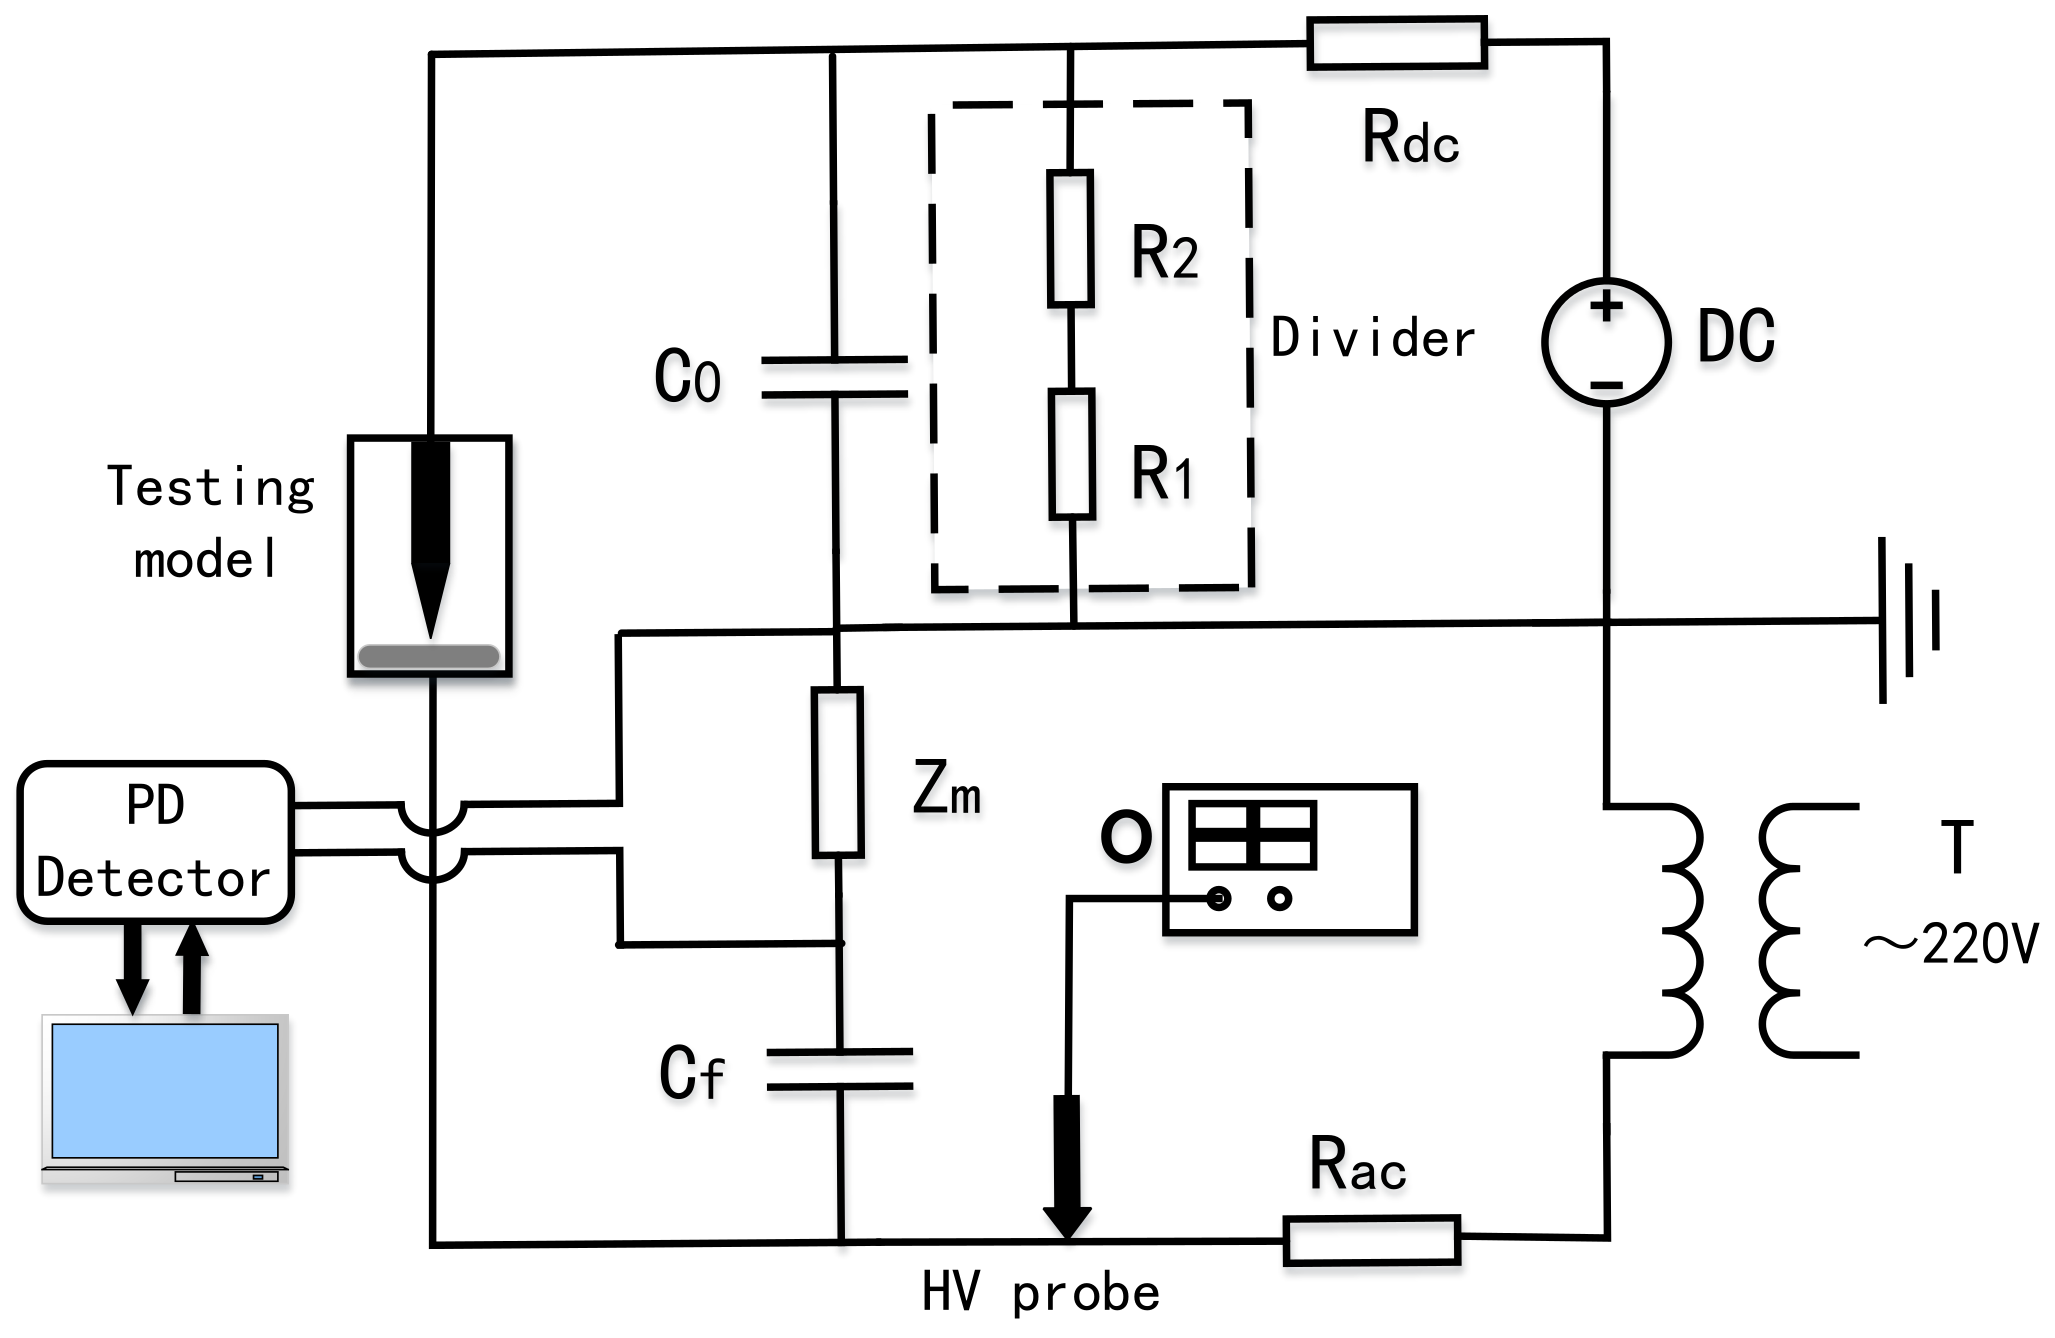
2.2. Test Circuit
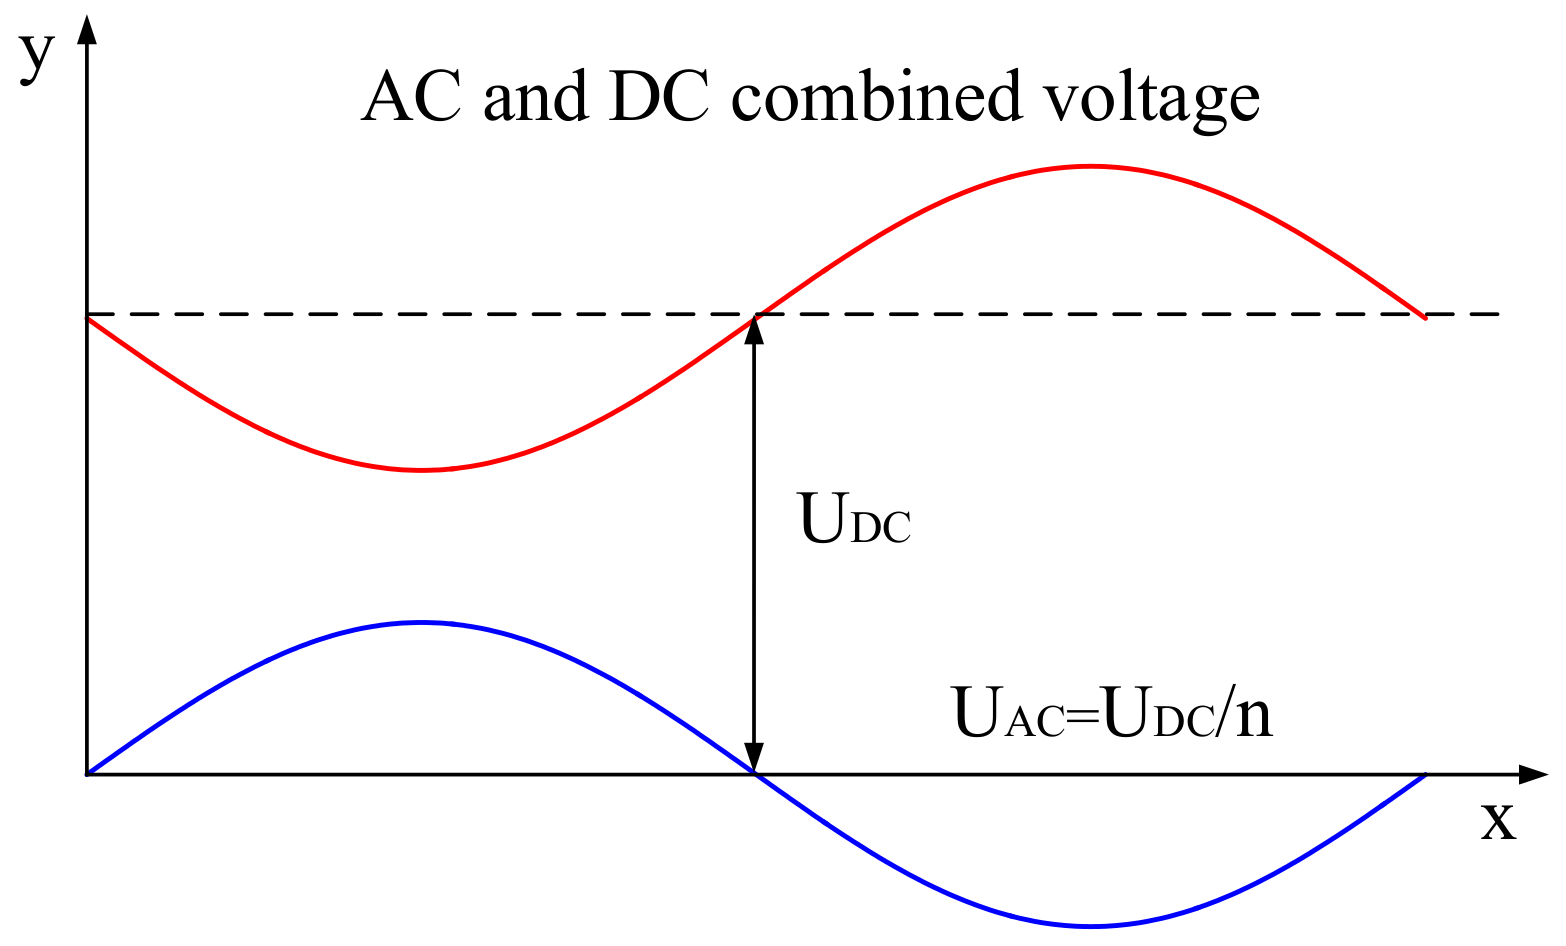
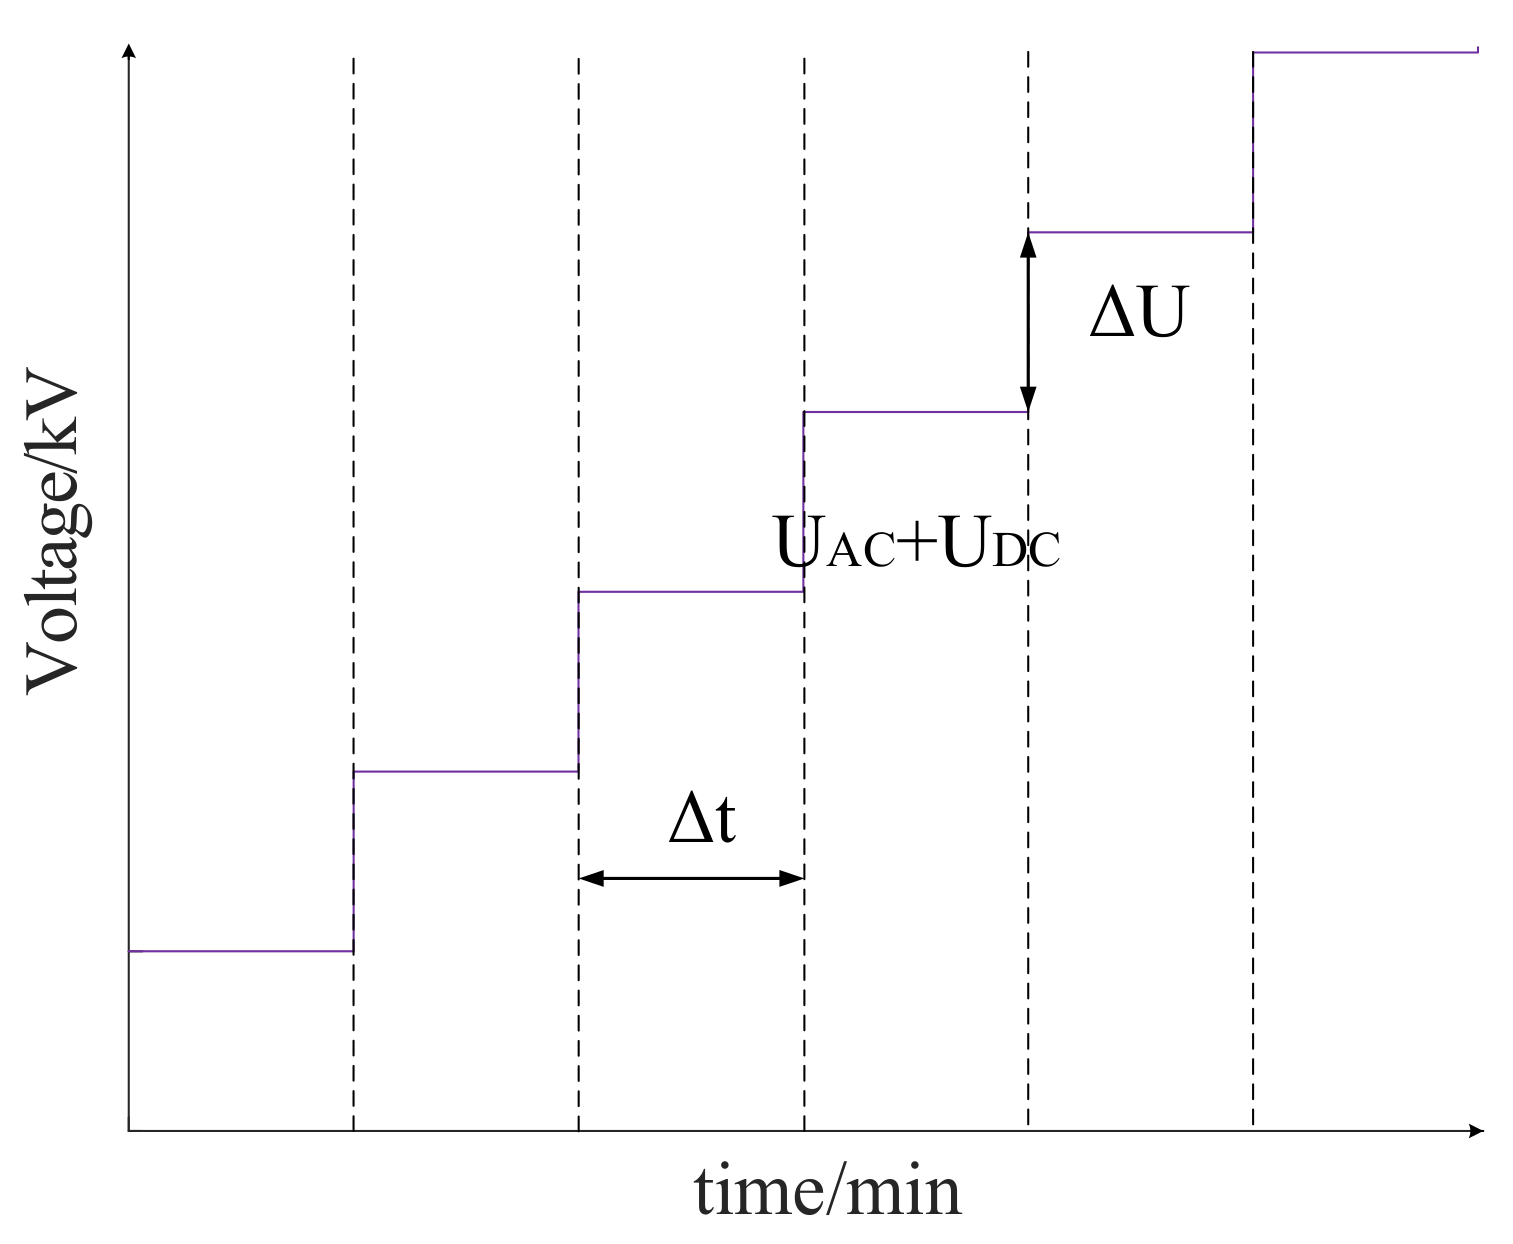
2.3. Voltage Application Method
3. PD Developing Processes for Different AC/DC Proportions
3.1. AC/DC Proportion of 1:1
3.2. AC/DC Proportion of 1:3
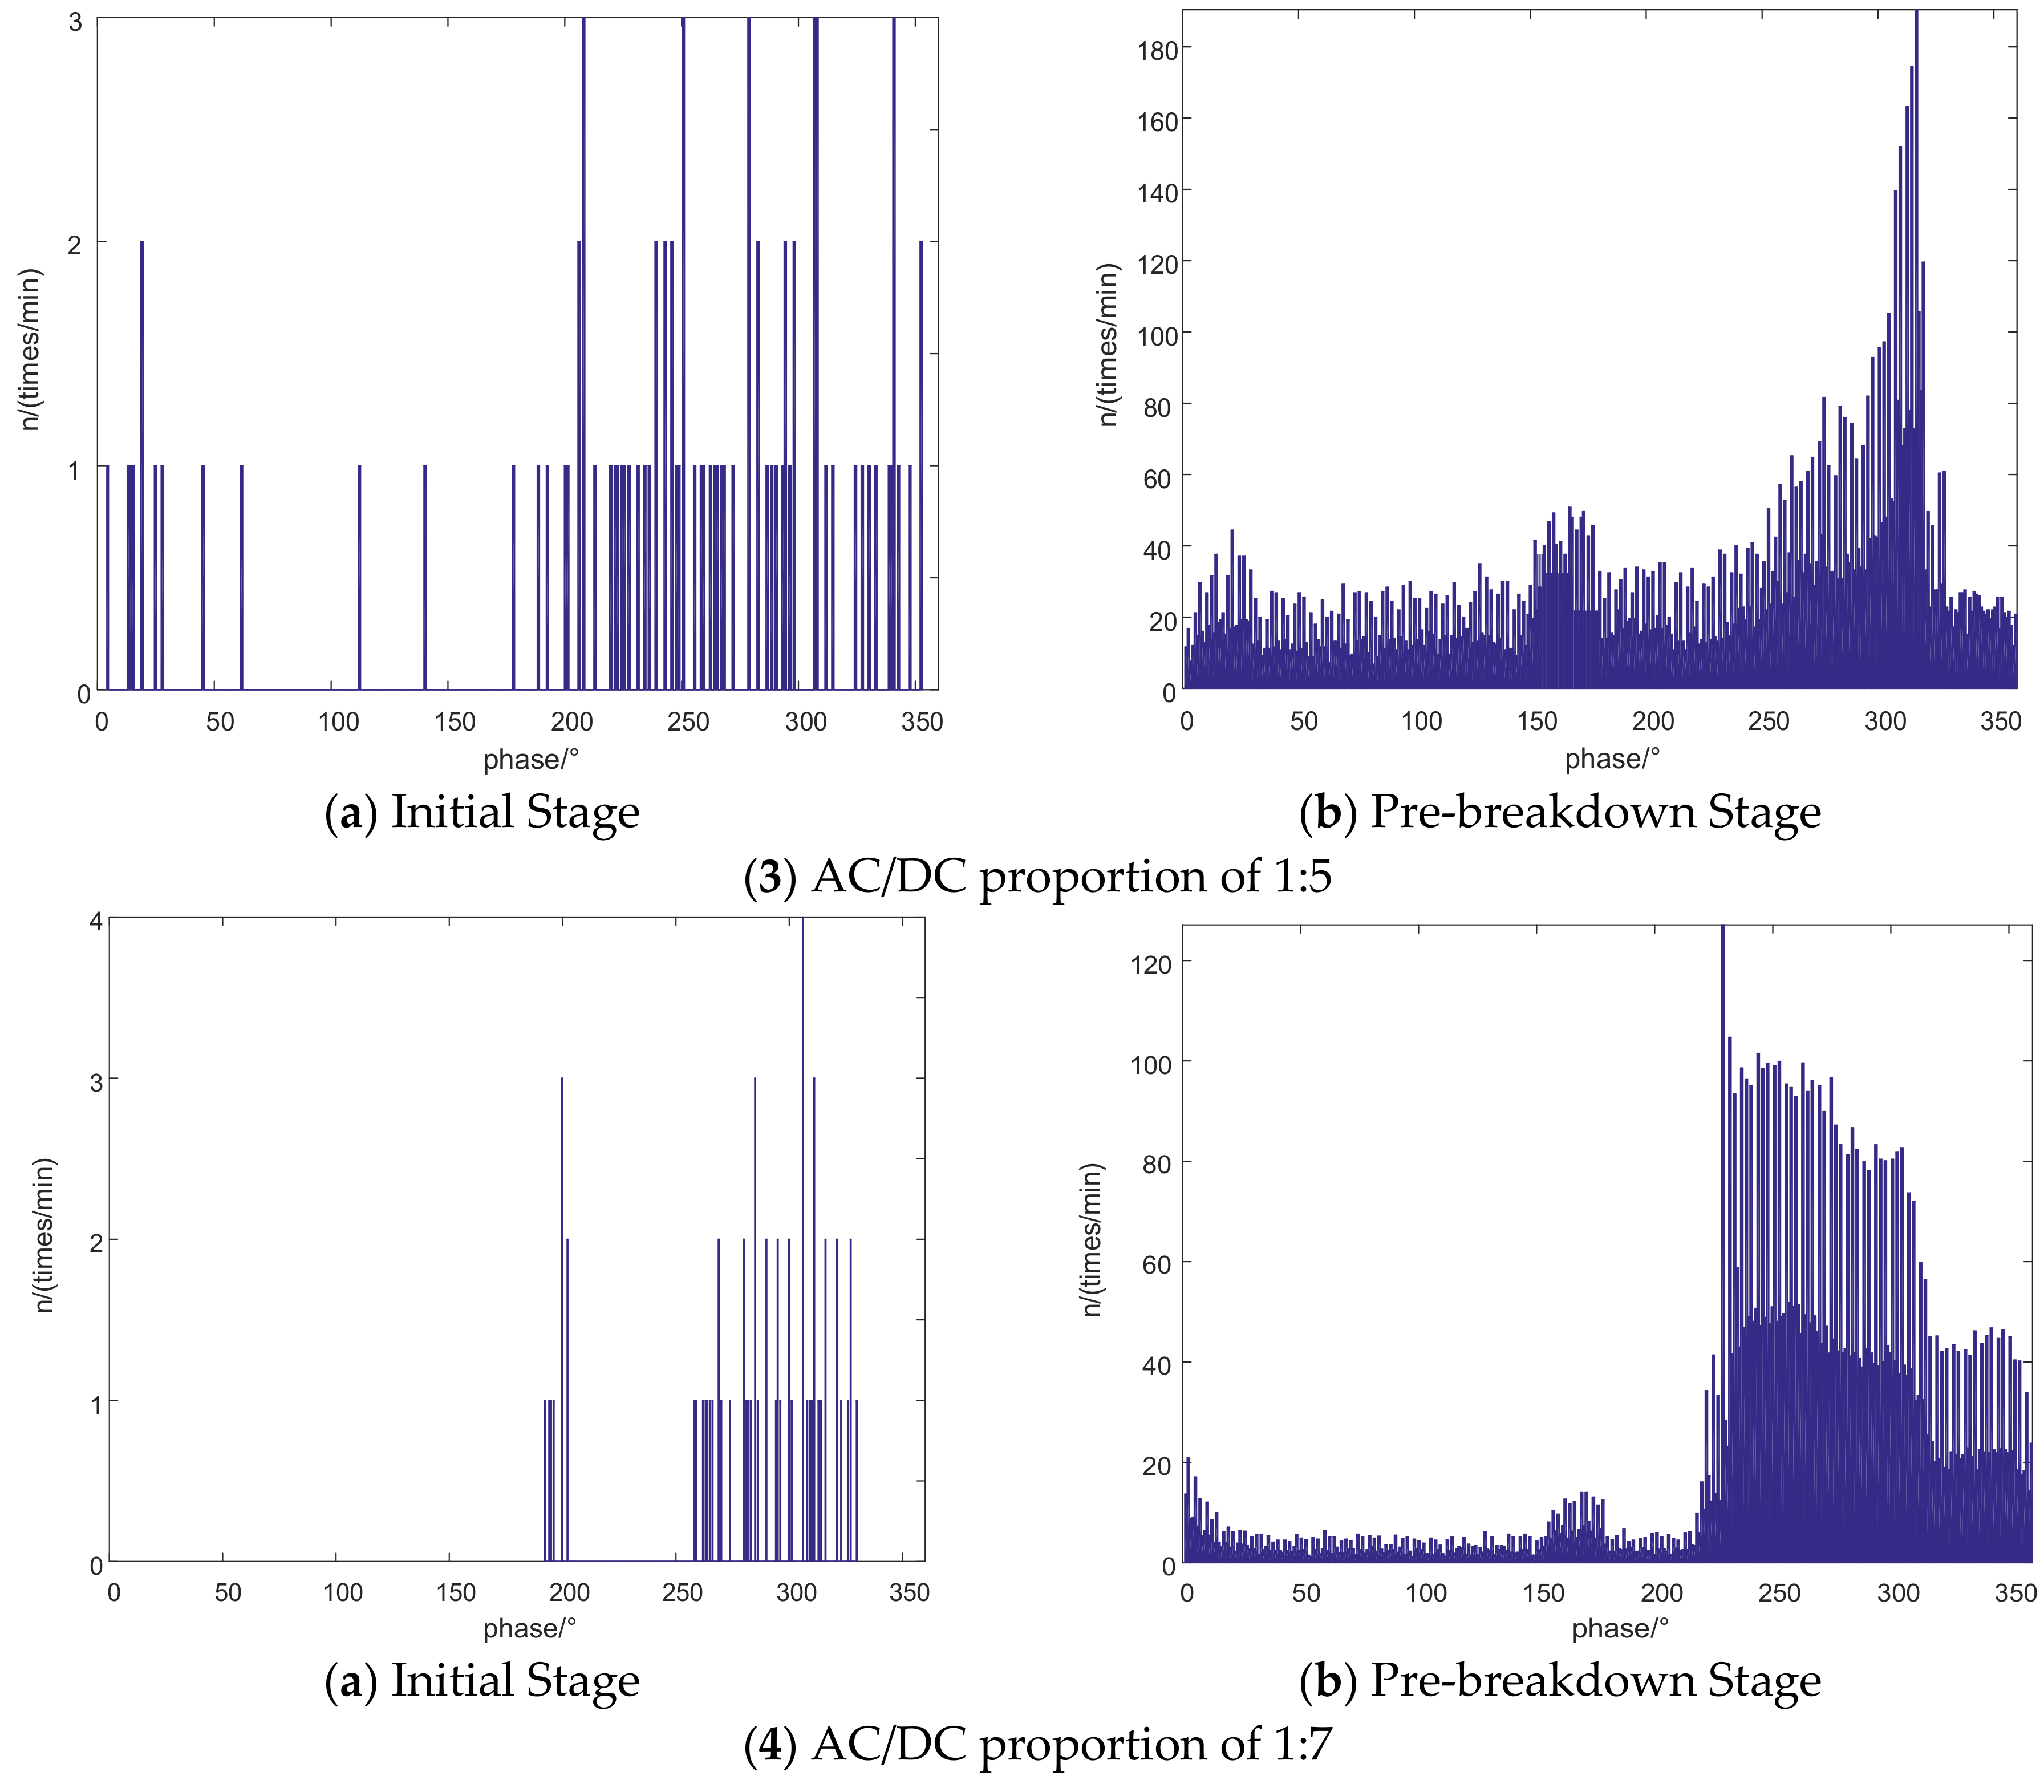
3.3. AC/DC Proportion of 1:5
3.4. AC/DC Proportion of 1:7
4. PD Characteristics under Different AC/DC Proportions
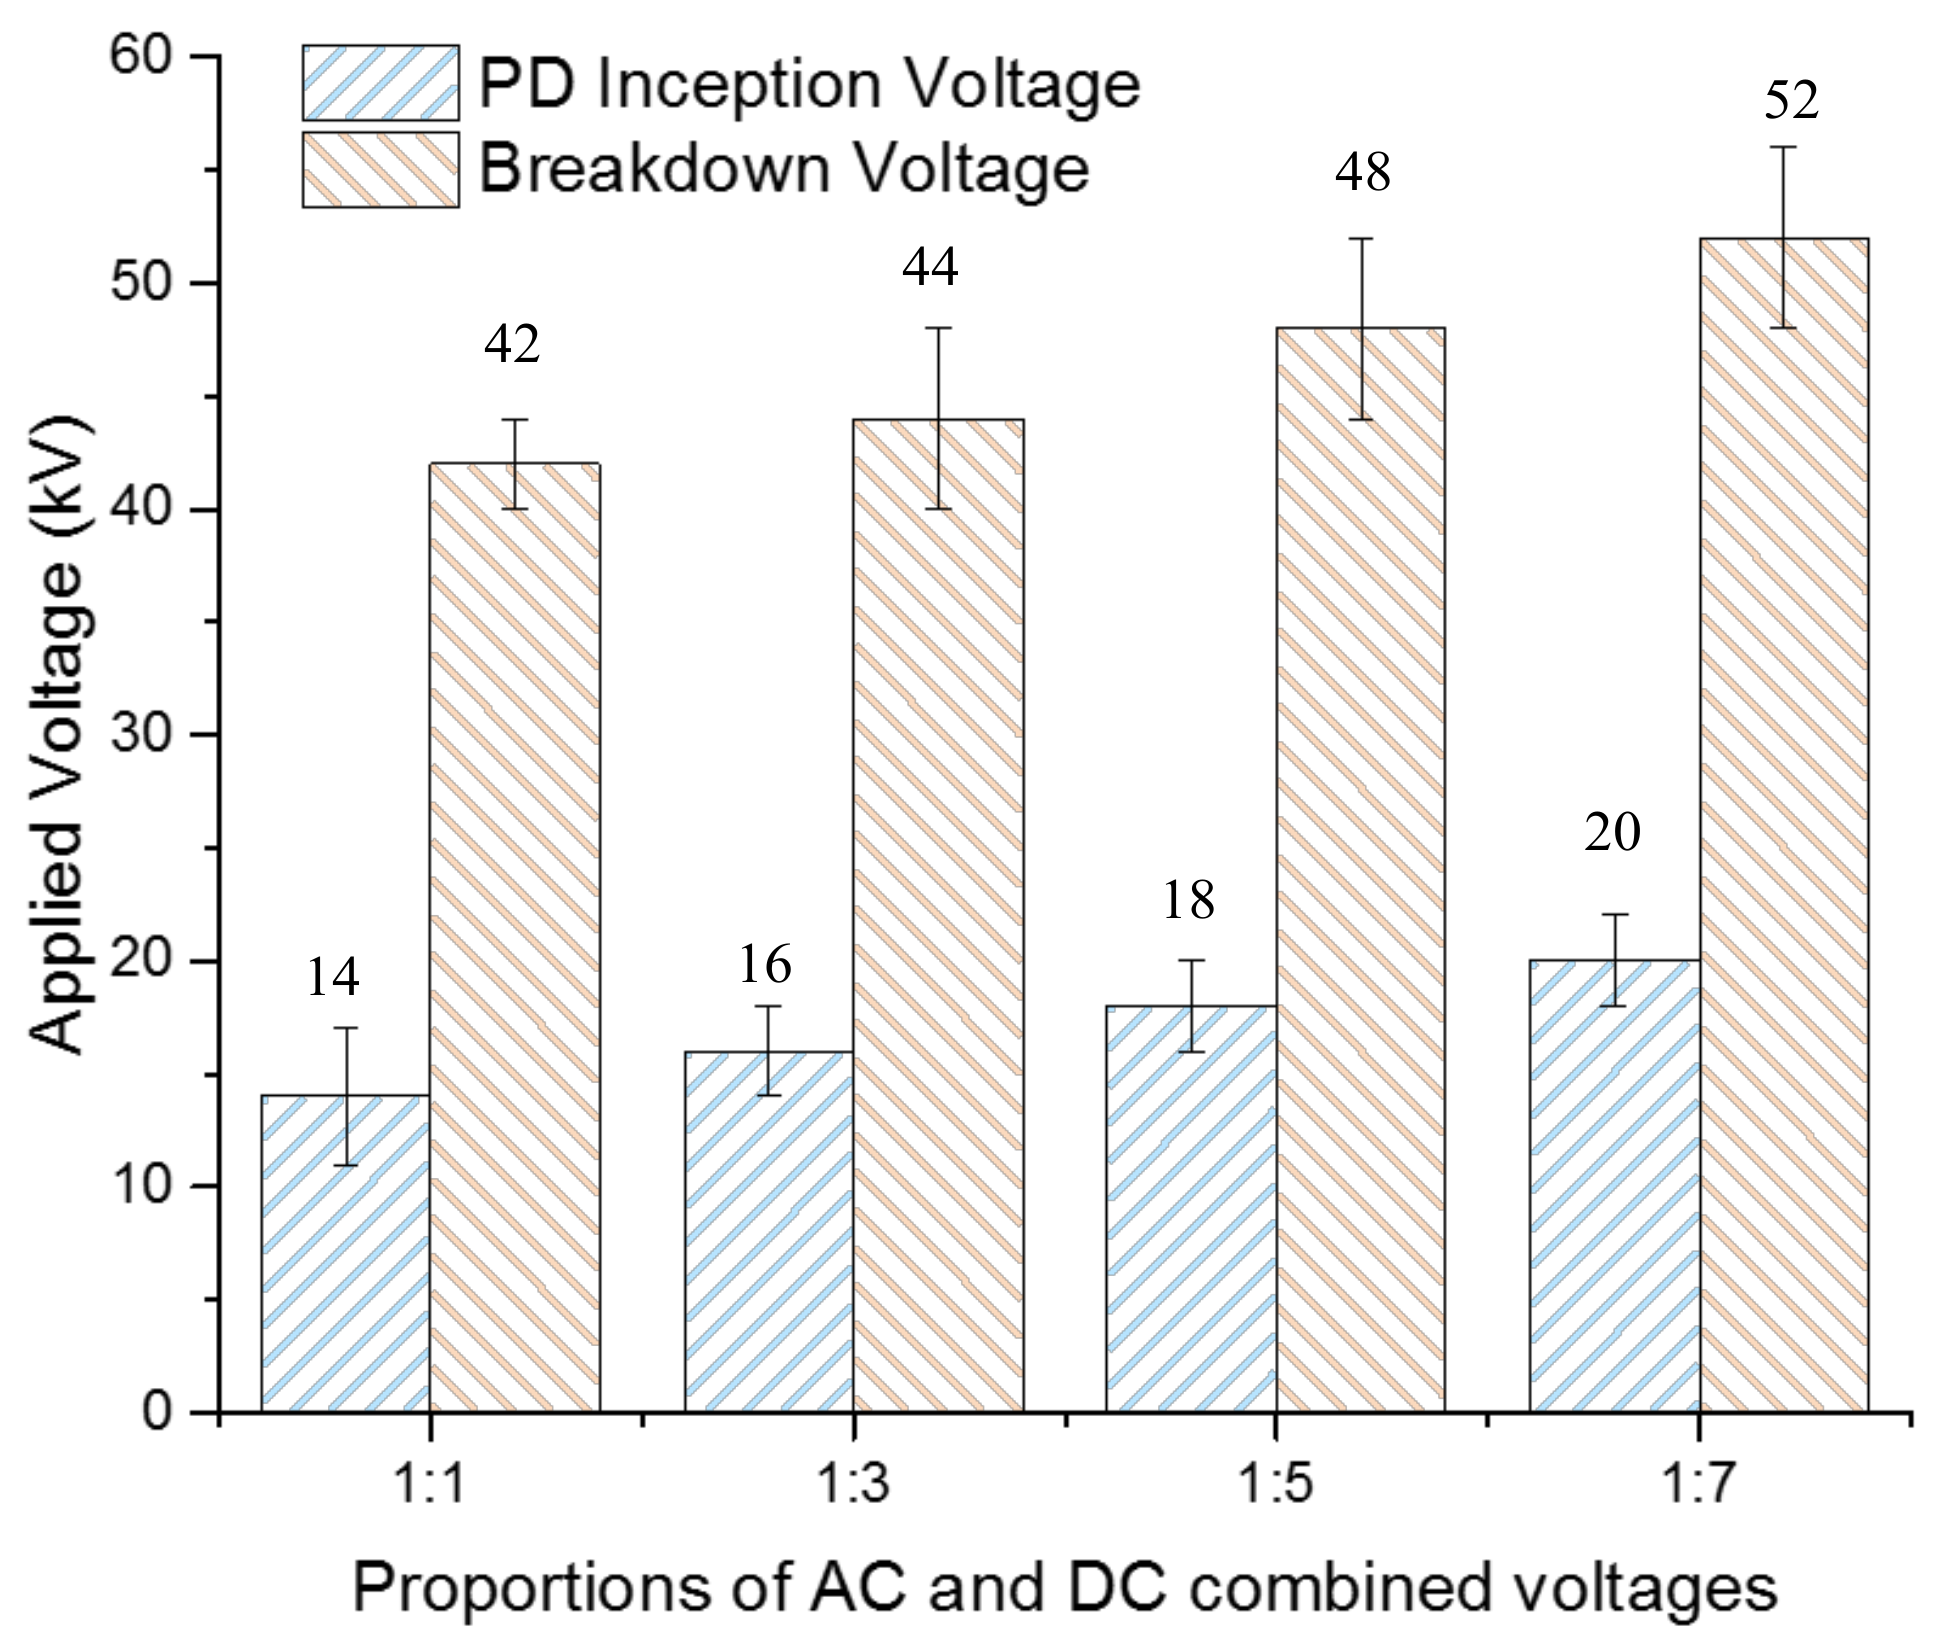
4.1. PDIVs and Breakdown Voltages under Different AC/DC Proportions
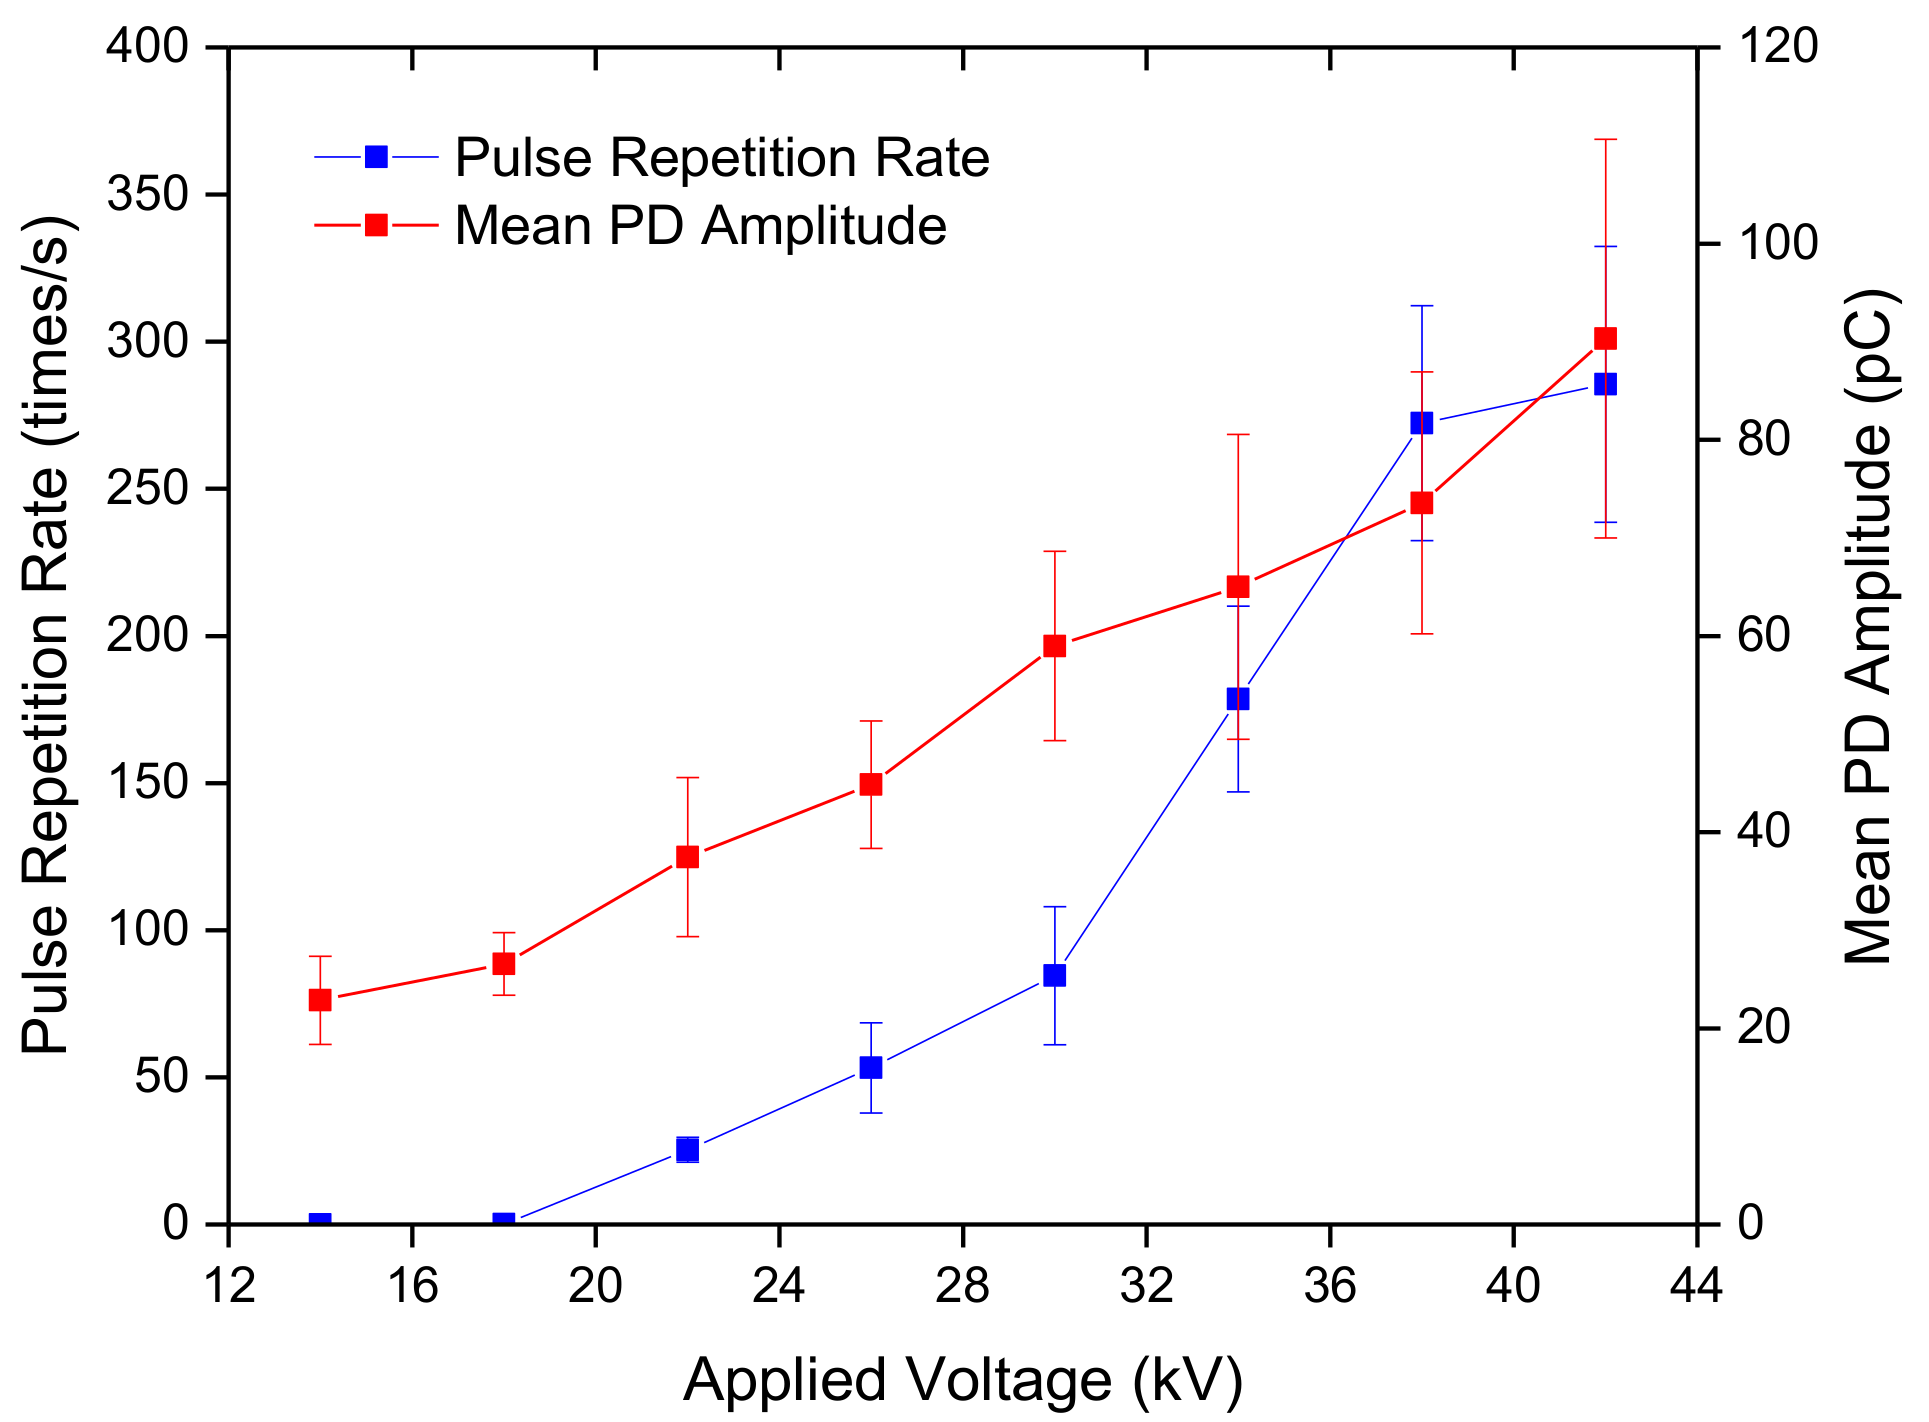
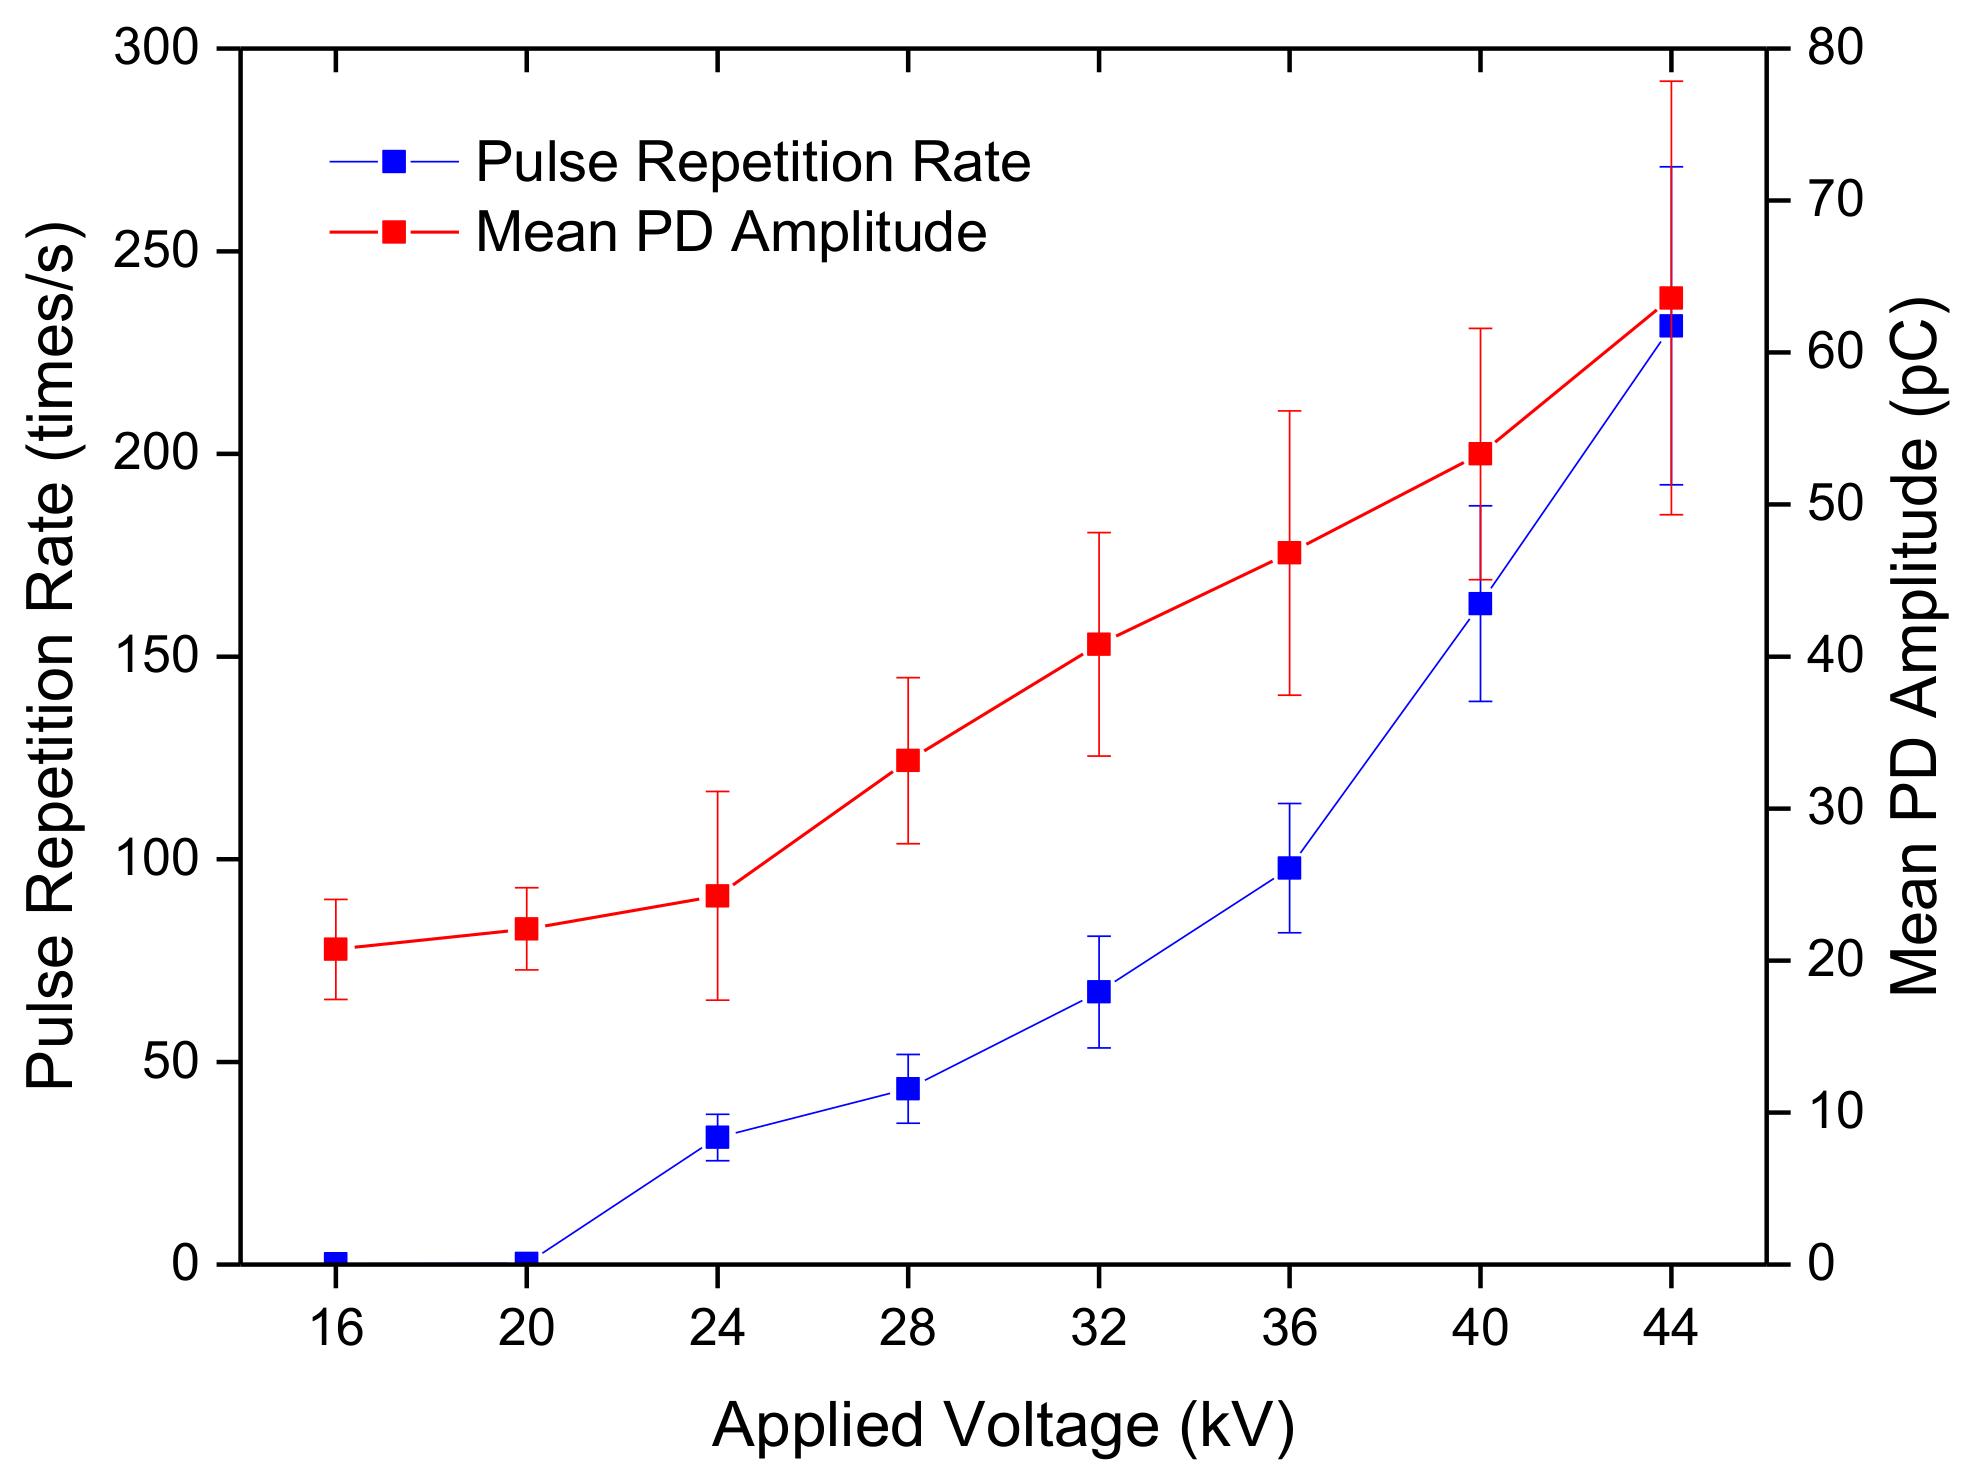
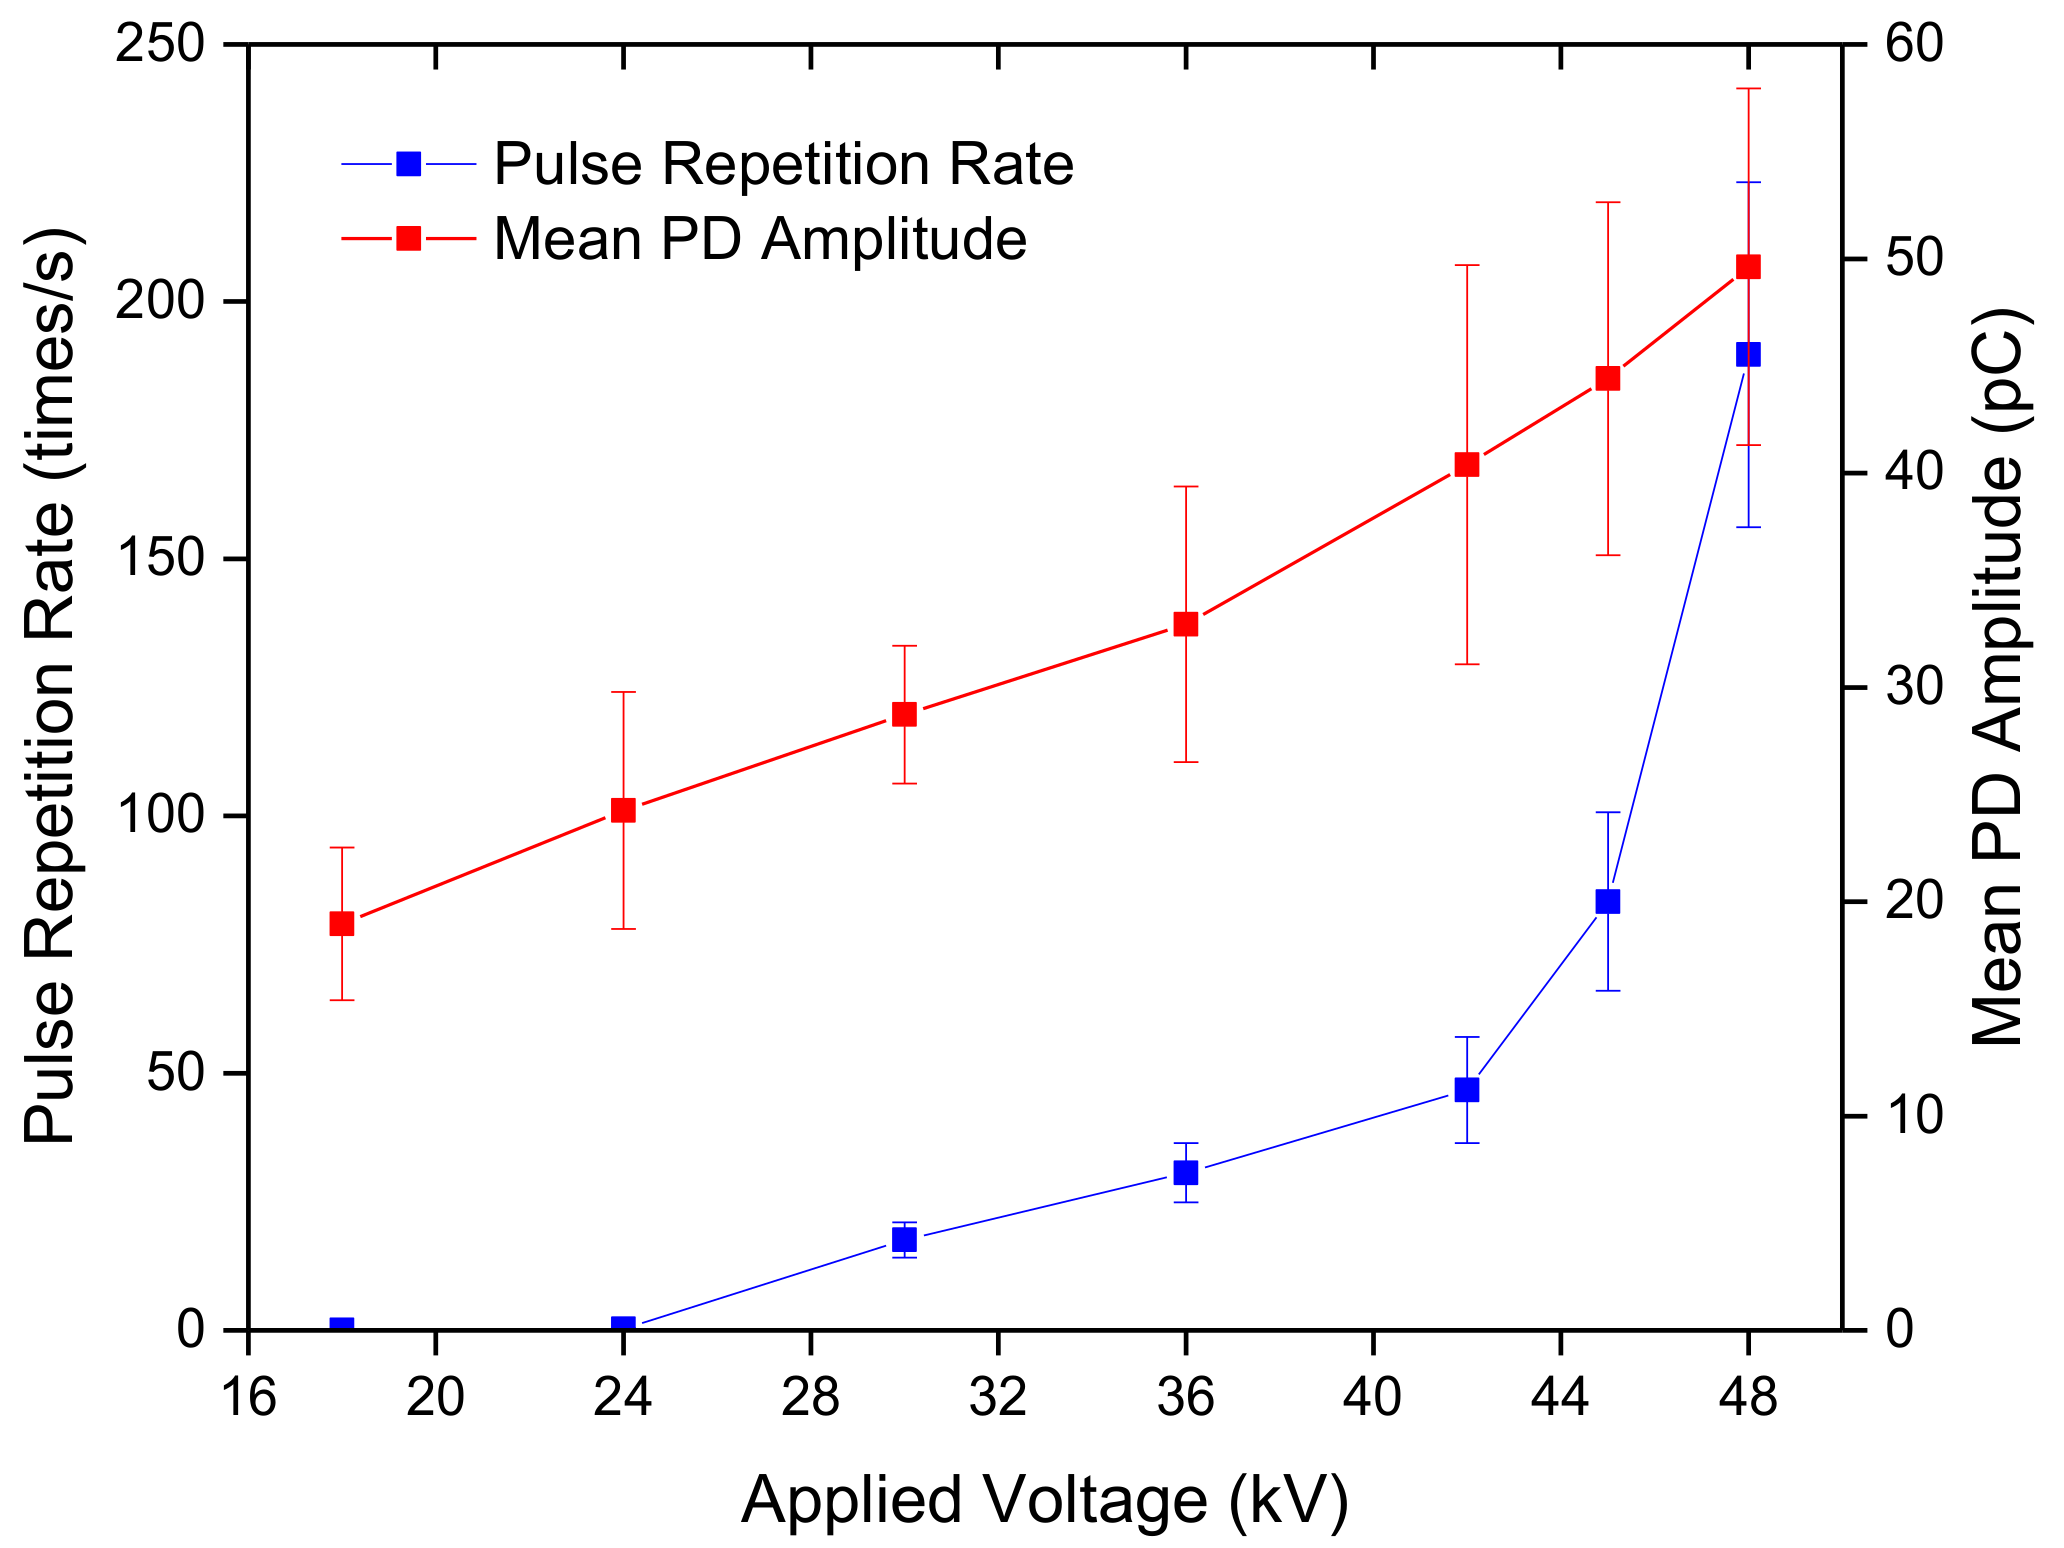
4.2. Pulse Repetition Rate under Different AC/DC Proportions
4.3. PD Amplitude under Different AC/DC Proportions
4.3.1. Trend of Max PD Amplitude
4.3.2. Trend of Mean PD Amplitude
4.3.3. Trend of Total Discharge Amplitude
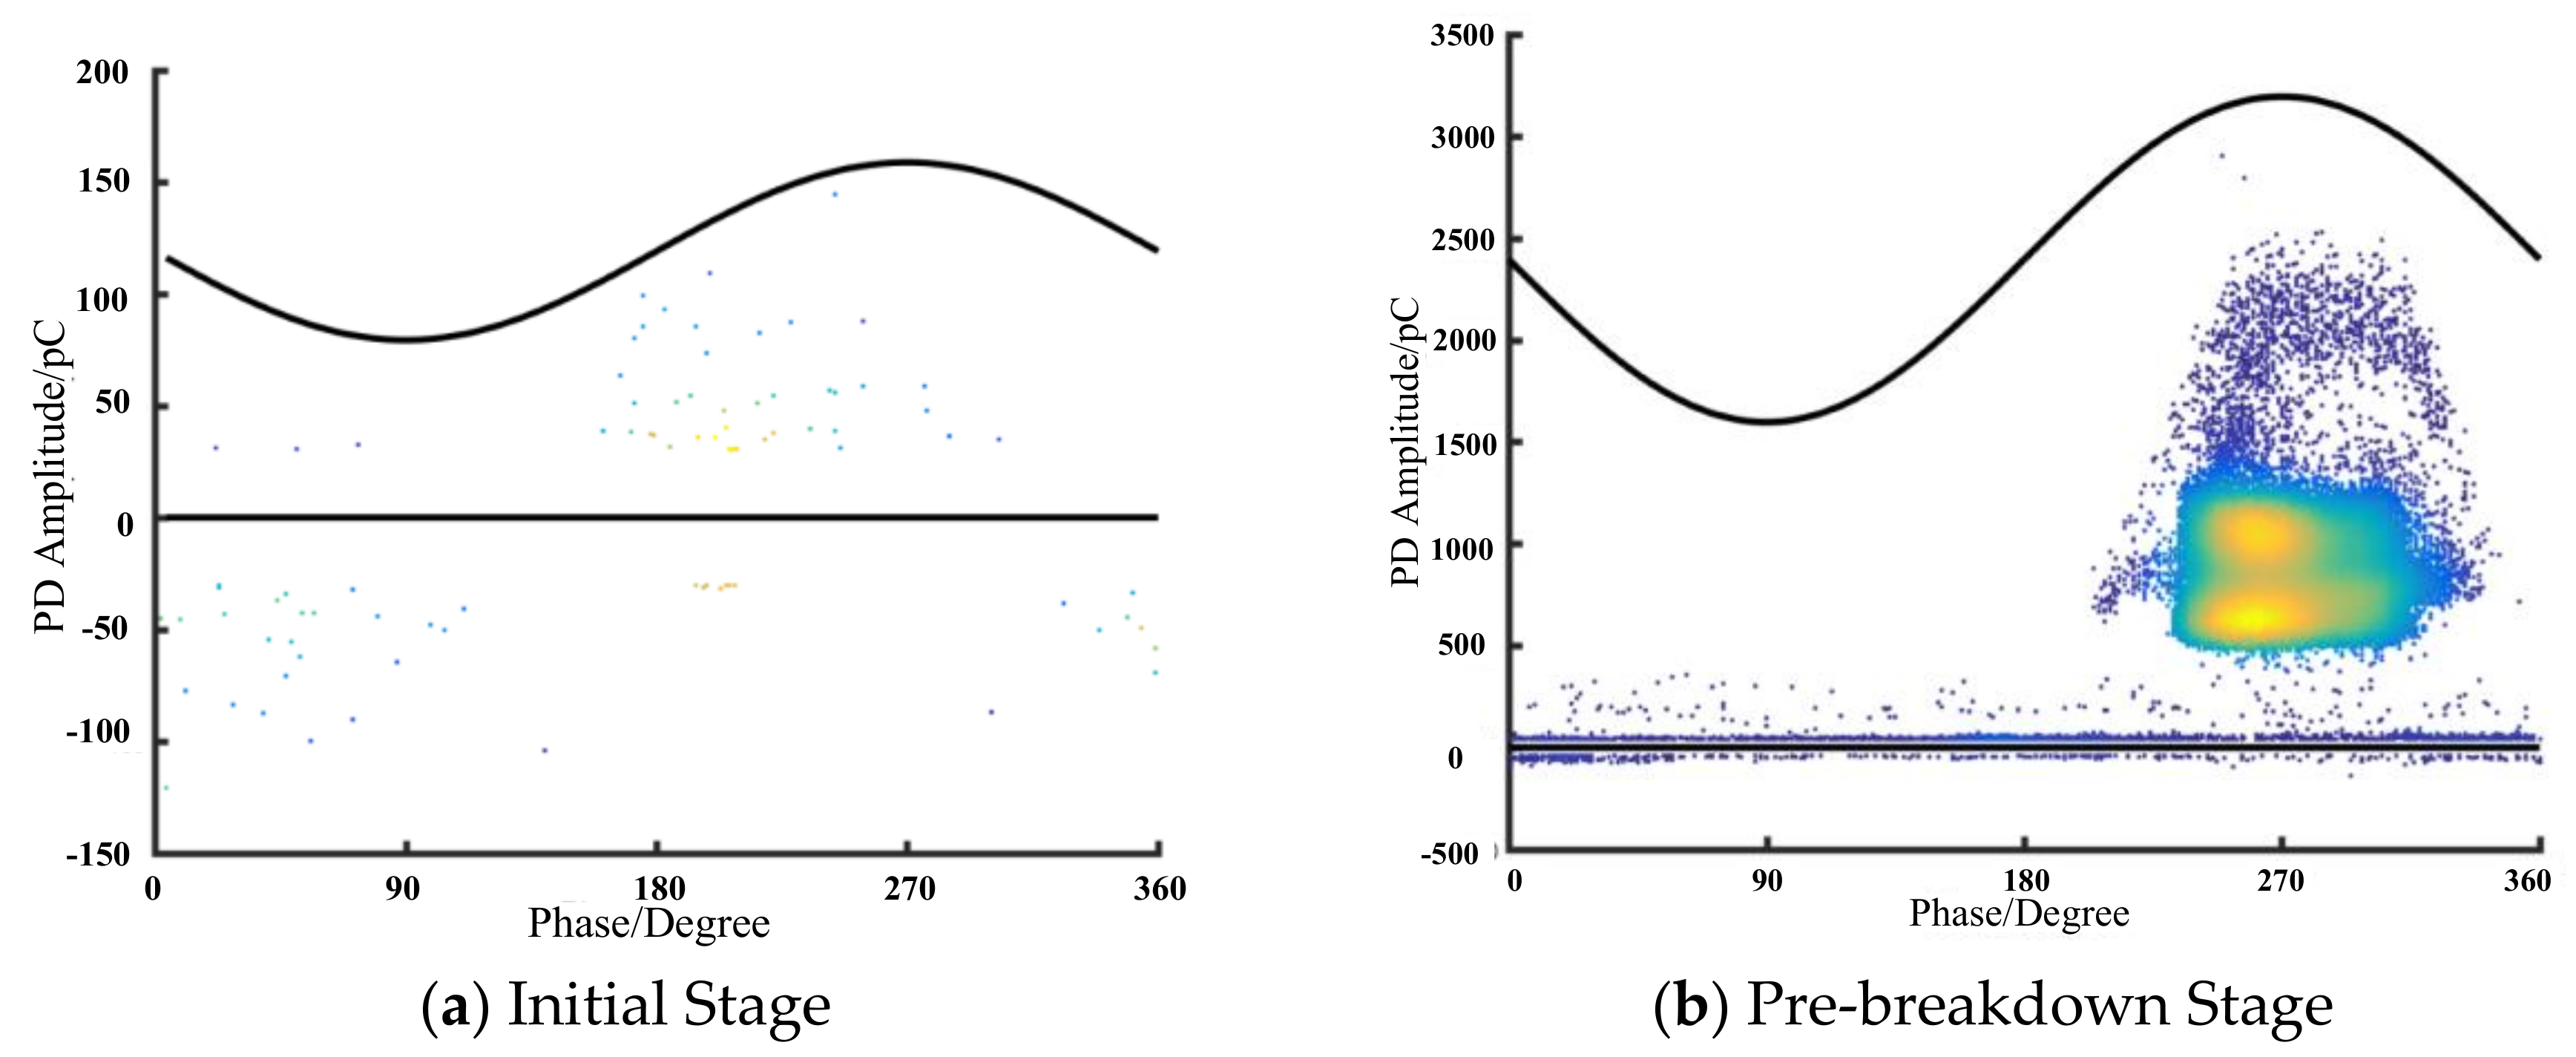
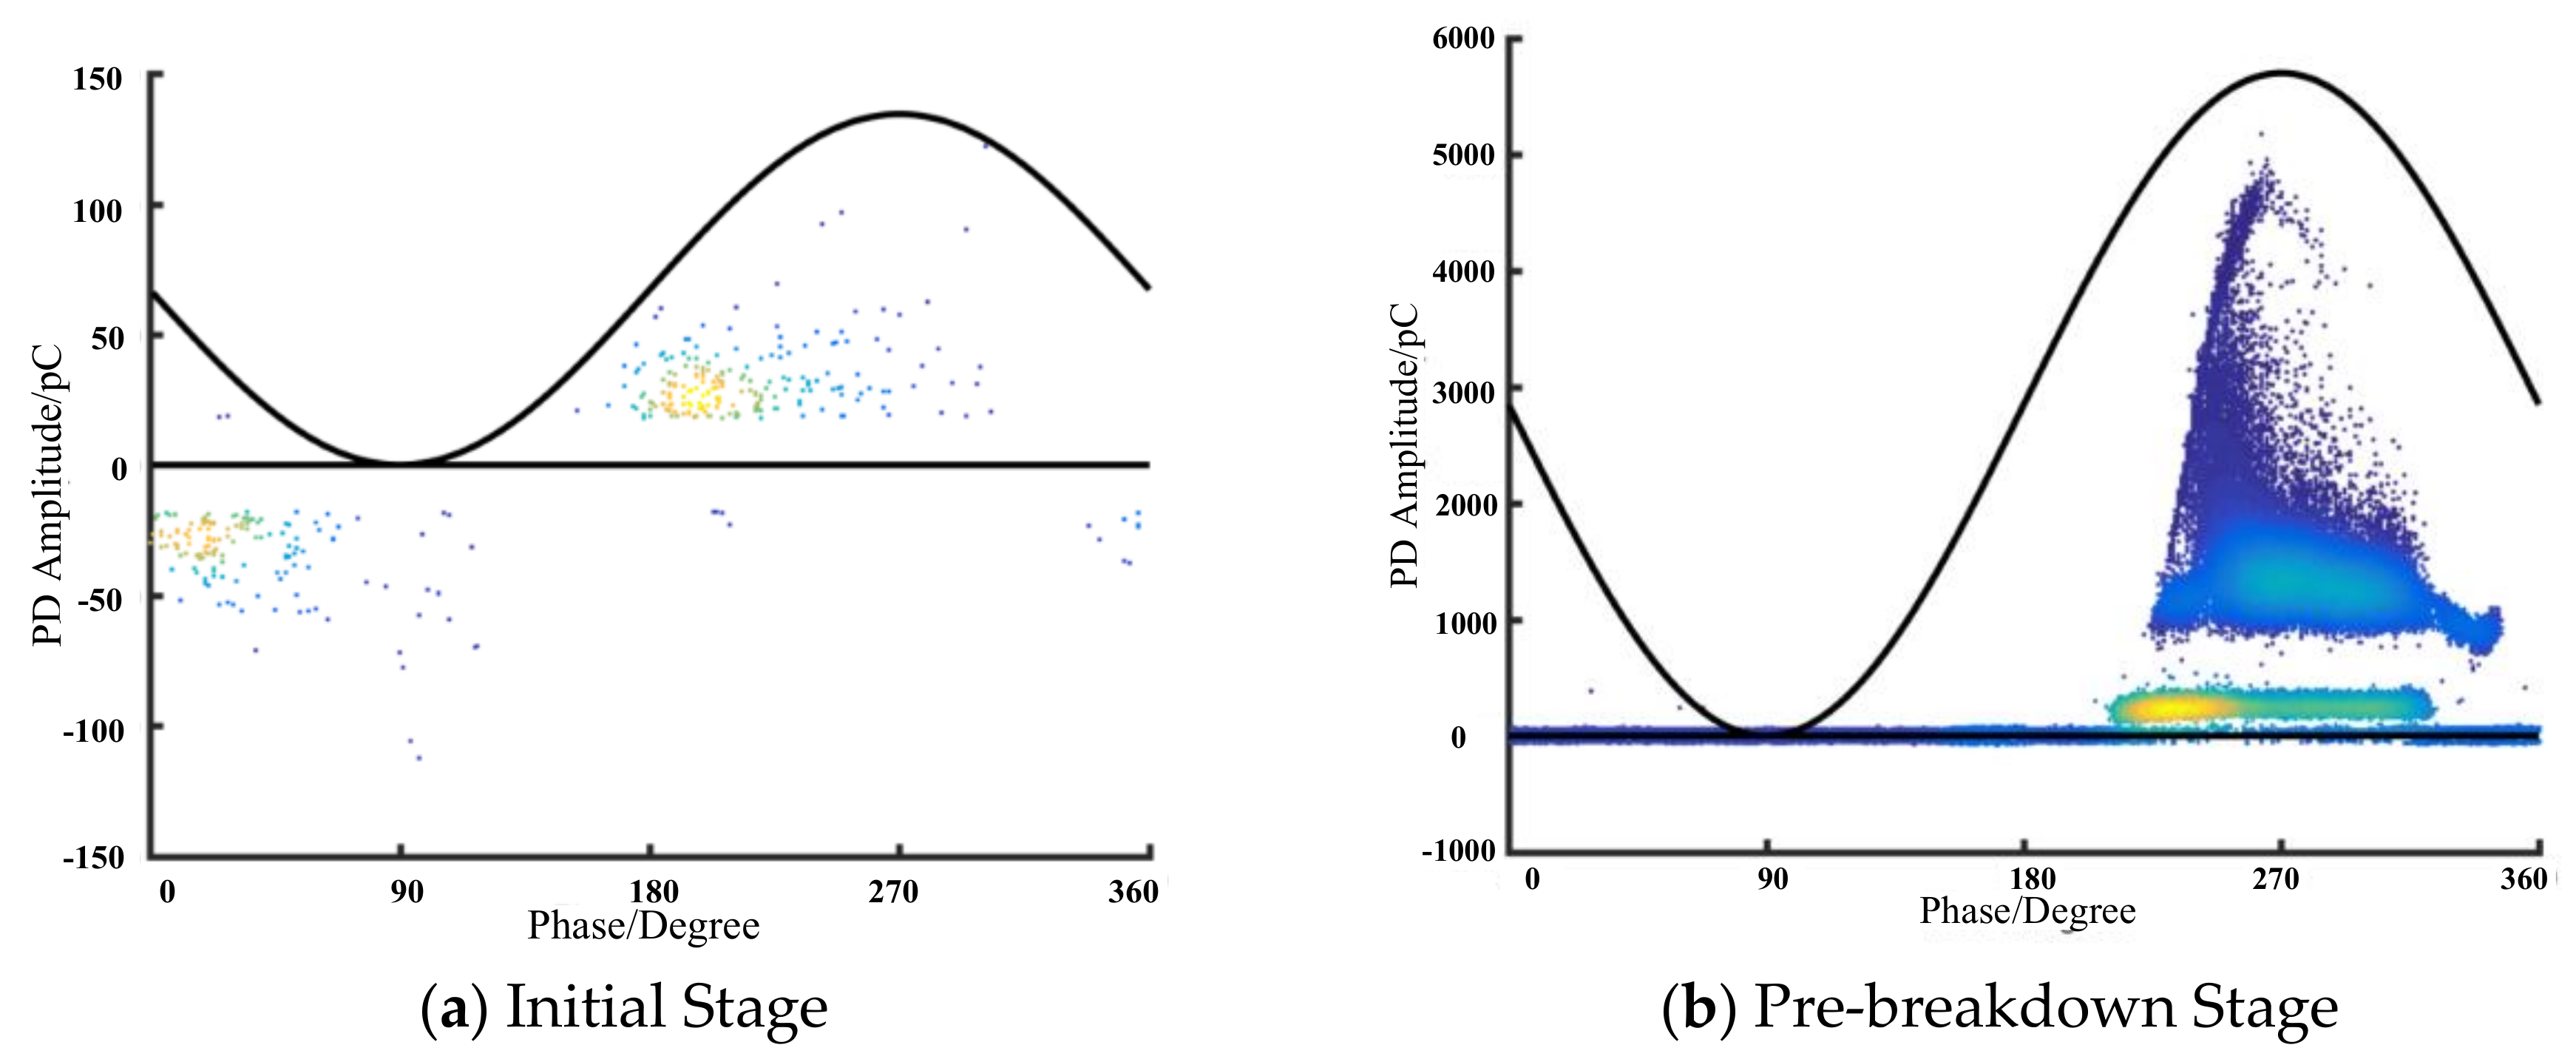
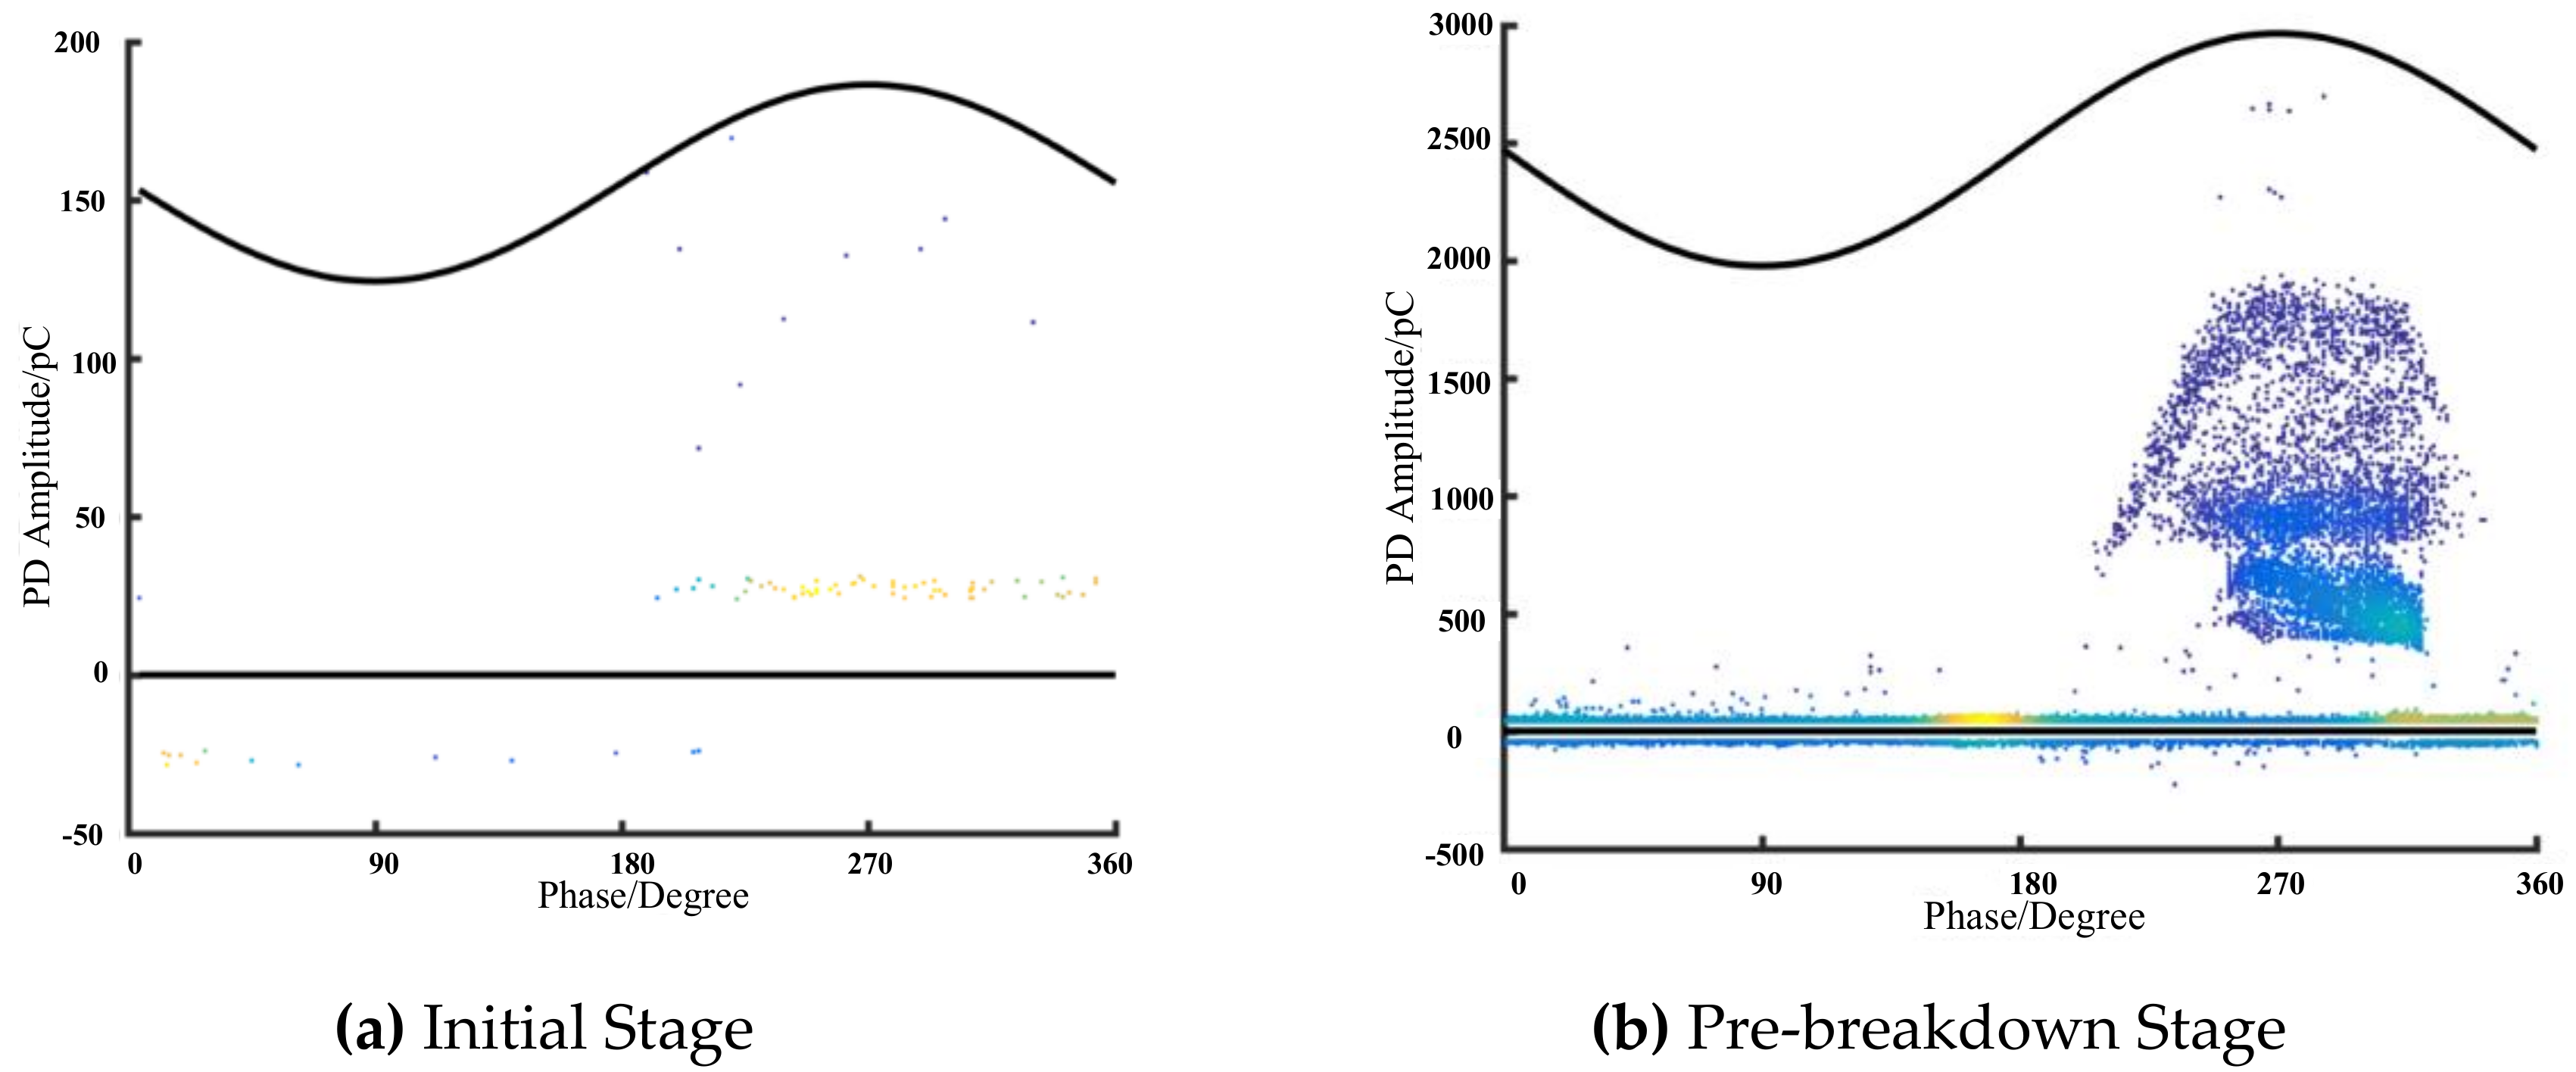
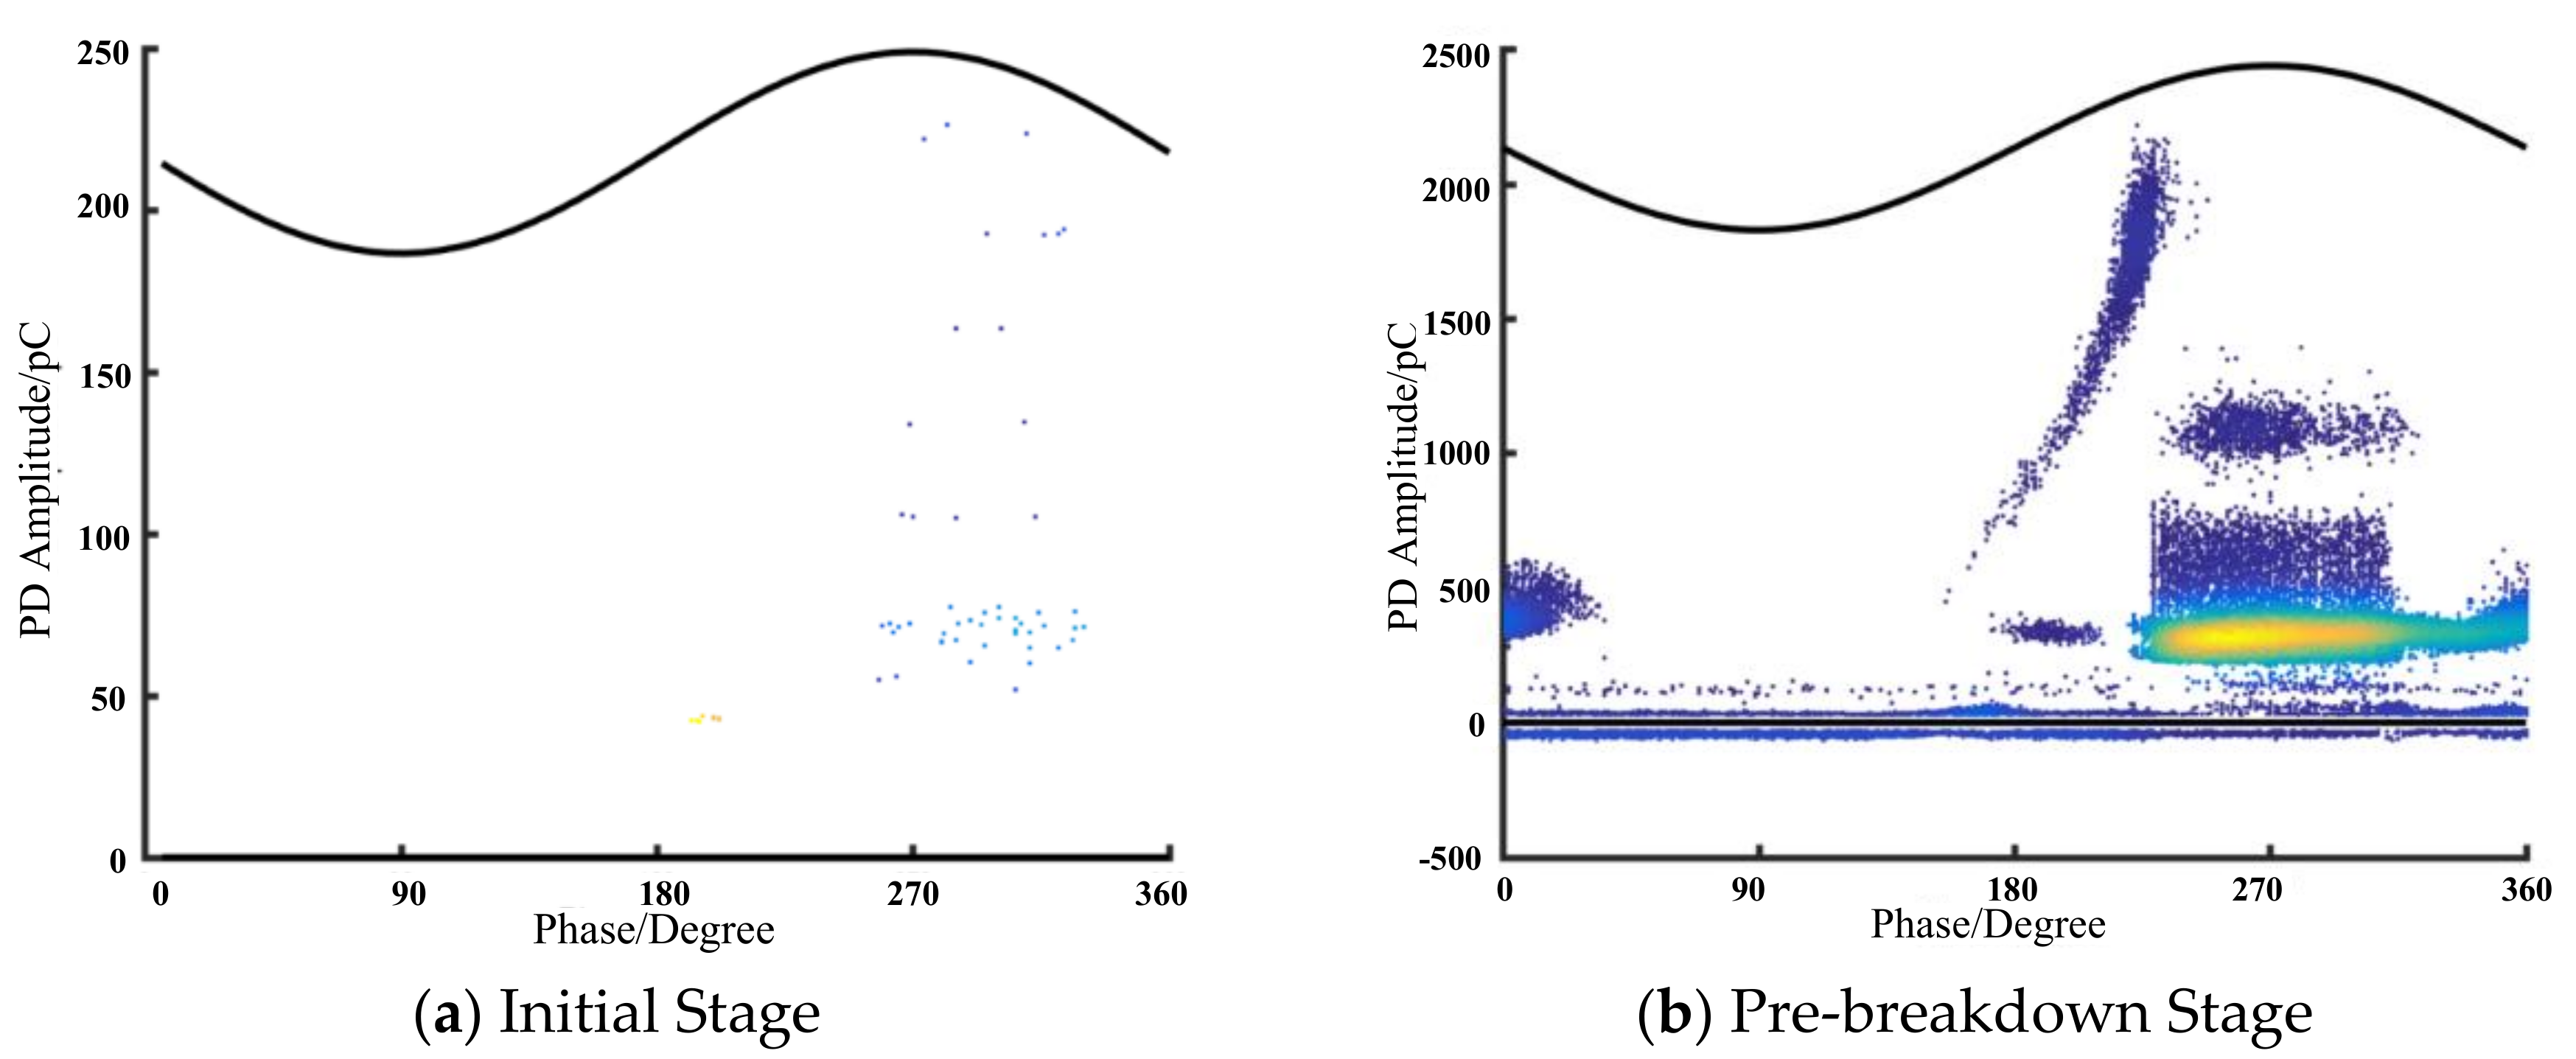
4.4. PD Phase Distribution under Different AC/DC Proportions
5. Discussions on the Influence of AC/DC Proportion
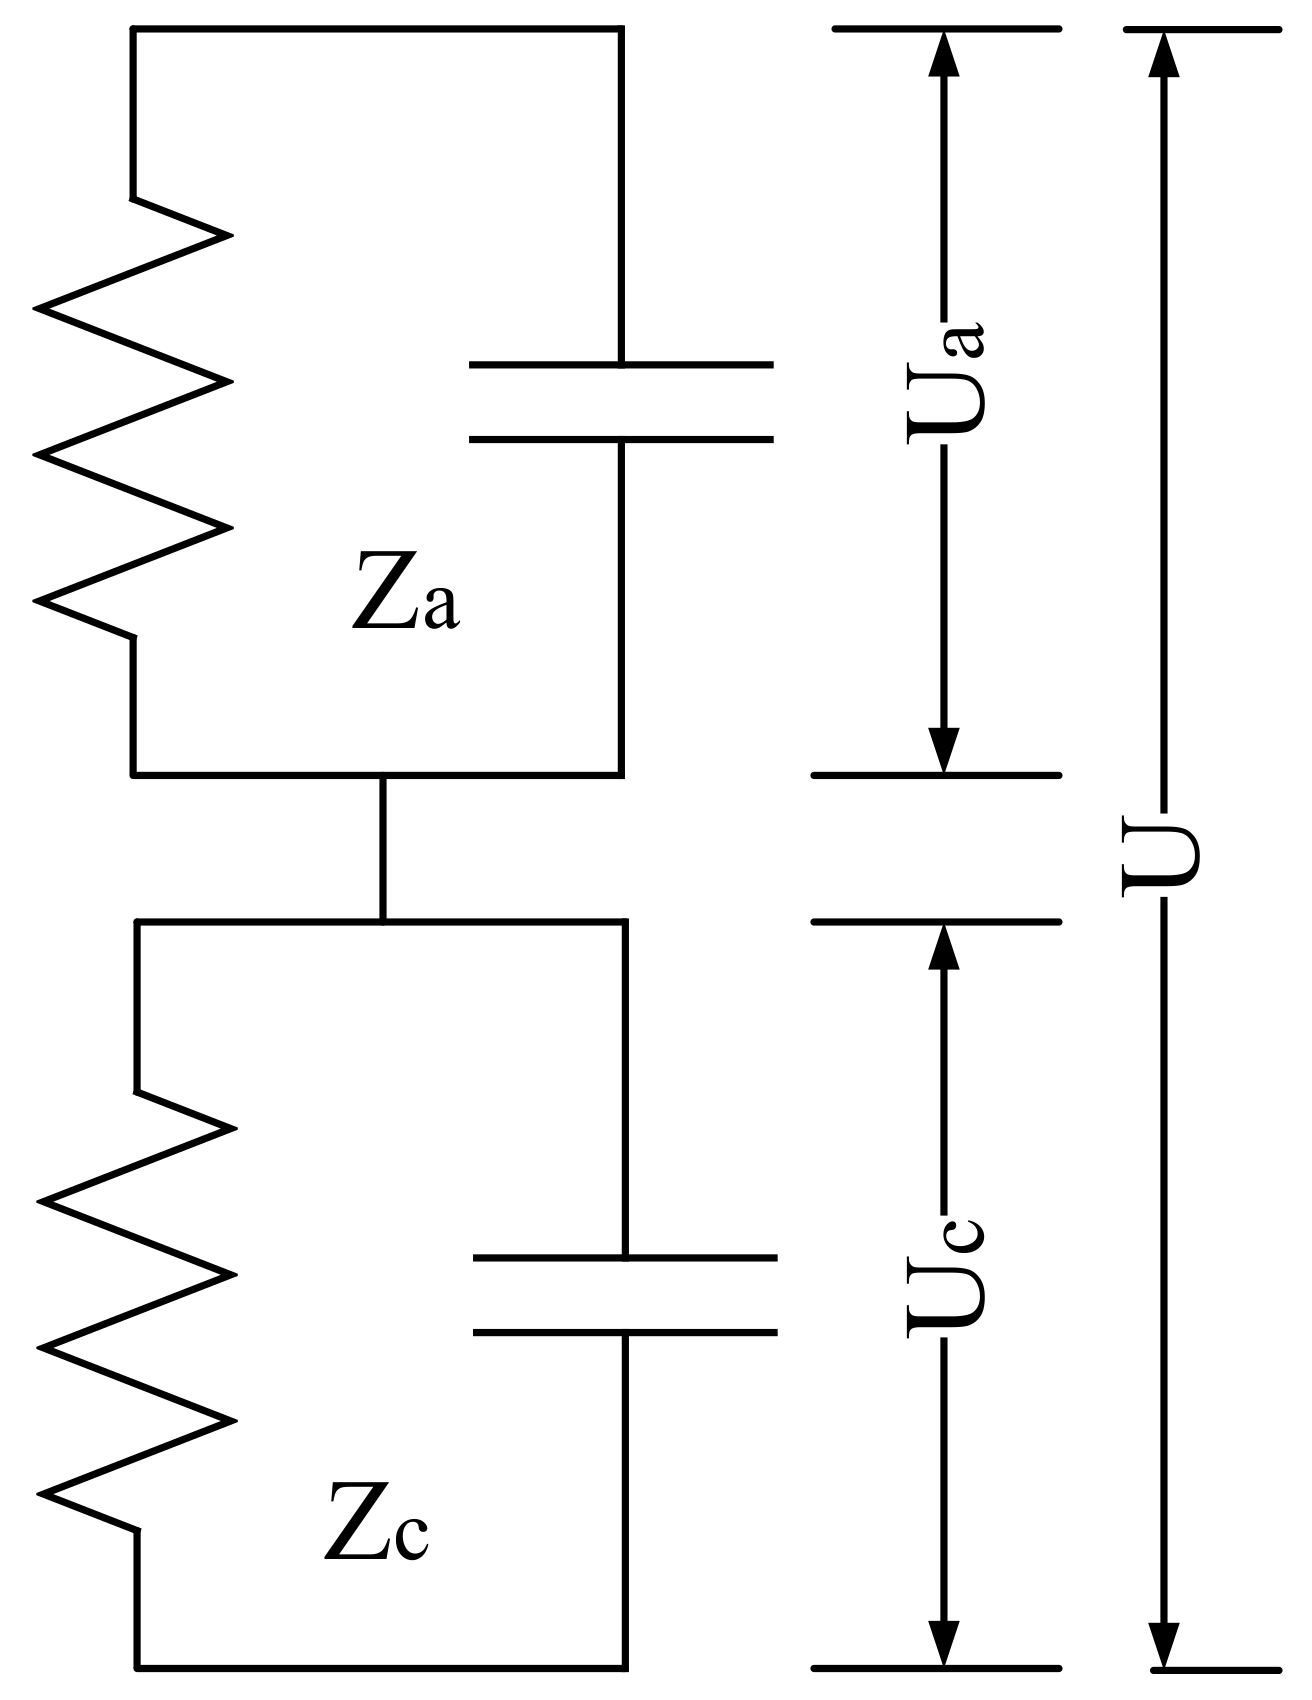
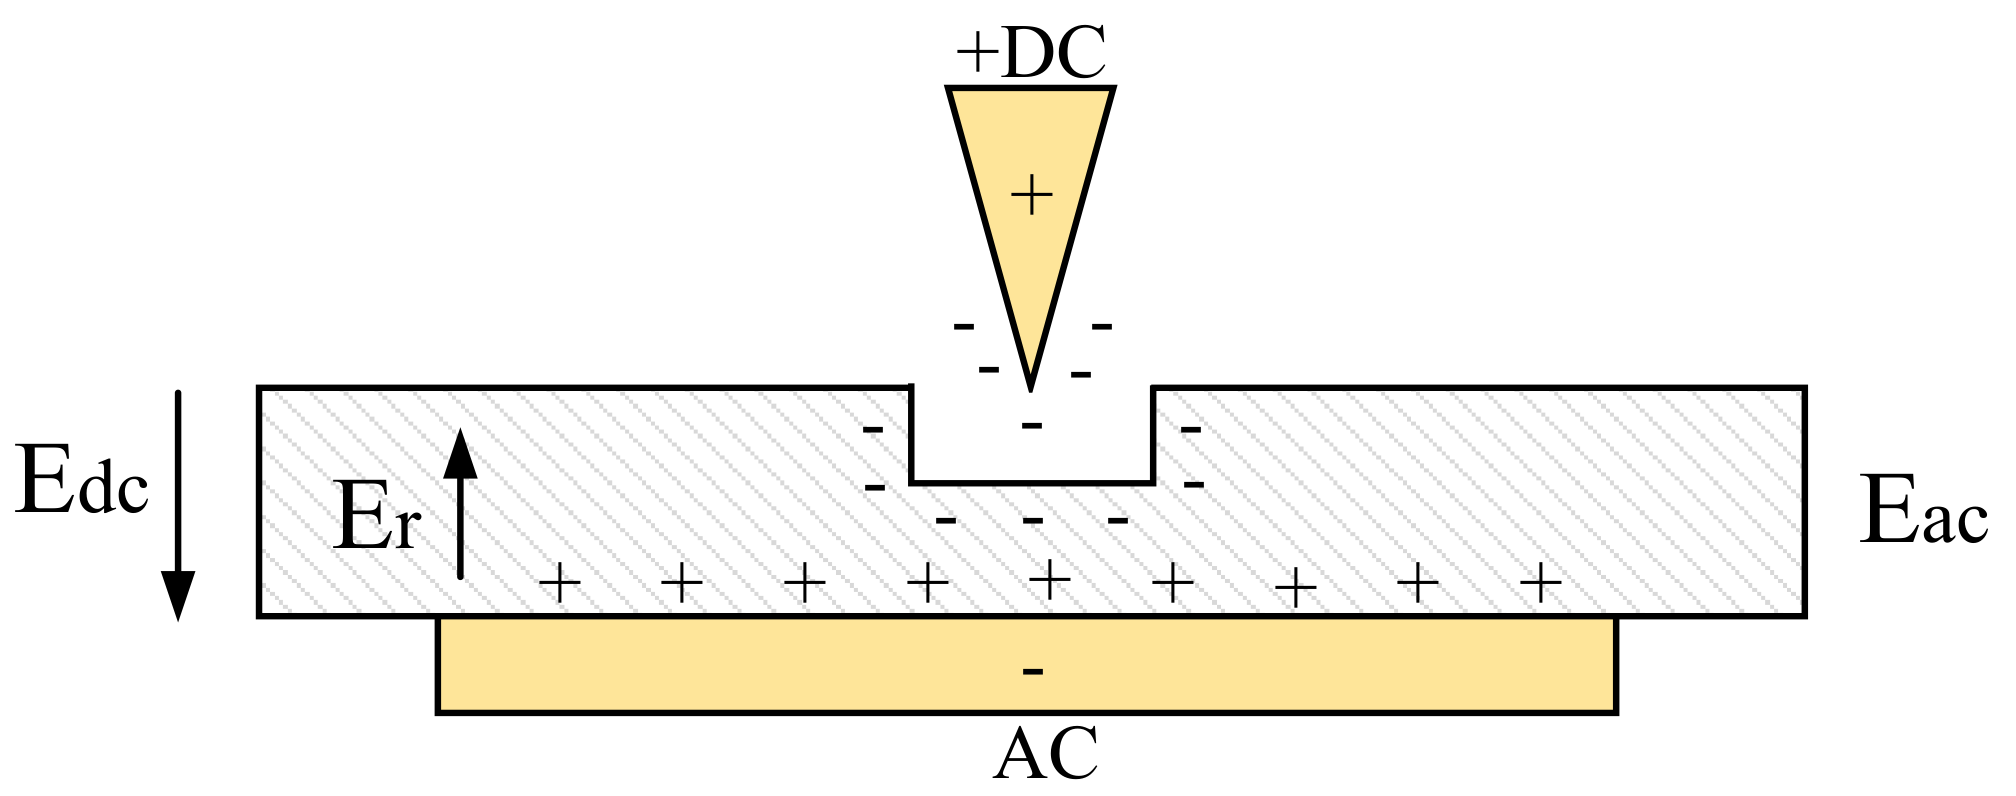
5.1. Analysis of Electric Filed Distribution
5.2. The Influence of AC/DC Proportion on the PDIV and Breakdown Voltage
5.3. The Influence of AC/DC Proportion on the PRPD Patterns
6. Conclusions
- (1)
- PDIV and breakdown voltage increase with the decrease of AC/DC proportion;
- (2)
- Both pulse repetition rate and PD amplitude increases as the applied combined voltage increases throughout the whole PD process. The increase of DC component results in the decrease of PD occurrence rate and magnitude, including max PD amplitude, mean PD amplitude and total discharge amplitude;
- (3)
- At the initial stage, the distributions of PDs gradually develop toward the phase range between 180° and 360° as AC/DC proportion decreases. When it comes to the pre-breakdown stage, discharge pulses spread from 0° to 360°, with high-magnitude PDs only taking place around 270°.
Acknowledgments
Author Contributions
Conflicts of Interest
References
- CIGRE Joint Working Group. HVDC Converter Transformers—Guide Lines for Conducting Design Reviews for HVDC Converter Transformers; Technical Brochures A2/B4.28; International Council on Large Electric Systems: Paris, French, 2010. [Google Scholar]
- Teague, W.L.; McWhirter, J.H. Dielectric measurements on new power transformer insulation. IEEE Trans. Power Appar. Syst. 1952, 71, 743–752. [Google Scholar]
- International Electrotechnical Commission. IEC 60270 High-Voltage Test Technique—Partial Discharge Measurements; International Electrotechnical Commission: Geneva, Switzerland, 2000. [Google Scholar]
- Bartnikas, R. Partial discharges: Their mechanism, detection and measurement. IEEE Trans. Dielectr. Electr. Insul. 2002, 9, 763–808. [Google Scholar] [CrossRef]
- Montanari, G.C. Insulation diagnosis of high voltage apparatus by partial discharge investigation. In Proceedings of the 8th International Conference on Properties and Applications of Dielectric Materials, Bali, Indonesia, 26–30 June 2006. [Google Scholar]
- Morshuis, P.H.F.; Smit, J.J. Partial discharge at DC voltage: Their mechanism detection and analysis. IEEE Trans. Dielectr. Electr. Insul. 2005, 12, 328–340. [Google Scholar] [CrossRef]
- Wang, Y.H.; Wei, X.L.; Chen, Q.G.; Huang, Y.R.; Nie, H.Y. Breakdown characteristics of converter transformer insulation under composite AC and DC voltage. In Proceedings of the IEEE 9th International Conference on Properties and Applications of Dielectric Materials, Harbin, China, 19–23 July 2009; pp. 634–637. [Google Scholar]
- Sarathi, R.; Koperundevi, G. UHF technique for Identification of partial discharge in a composite Insulation under AC and DC voltages. IEEE Trans. Dielectr. Electr. Insul. 2008, 15, 1724–1730. [Google Scholar] [CrossRef]
- Sha, Y.; Zhou, Y.; Zhang, L.; Huang, M.; Jin, F. Measurement and simulation of partial discharge in oil-paper insulation under the combined AC-DC voltage. J. Electrost. 2013, 71, 540–546. [Google Scholar] [CrossRef]
- Takahashi, E.; Tsutsumi, Y.; Okuyama, K.; Ogata, F. Partial discharge characteristics of oil-immersed insulation systems under DC, combined AC-DC and DC reversed polarity voltage. IEEE Trans. Power Appar. Syst. 1976, 95, 411–420. [Google Scholar] [CrossRef]
- Hao, M.; Zhou, Y.; Chen, G.; Wilson, G.; Jarman, P. Space charge behavior in oil gap and impregnated pressboard combined system under HVDC stresses. IEEE Trans. Dielectr. Electr. Insul. 2016, 23, 848–858. [Google Scholar] [CrossRef]
- Li, J.; Liao, R.; Grzybowski, S.; Yang, L. Oil-paper aging evaluation by fuzzy clustering and factor analysis to statistical parameters of partial discharges. IEEE Trans. Dielectr. Electr. Insul. 2010, 17. [Google Scholar] [CrossRef]
- Sha, Y.; Zhou, Y.; Li, J.; Wang, J. Partial discharge characteristics in oil-paper insulation under combined AC-DC voltage. IEEE Trans. Dielectr. Electr. Insul. 2014, 21, 1529–1539. [Google Scholar] [CrossRef]
- Wu, H.; Li, C.; Qi, B.; Zhao, X.; Lv, J.; Zhao, L. The electric field distribution in oil-paper insulation under combined AC-DC voltage. In Proceedings of the IEEE International Conference on Condition Monitoring and Diagnosis, Bali, Indonesia, 23–27 September 2012; pp. 1097–1101. [Google Scholar]
- Qi, B.; Wei, Z.; Li, C.; Gao, Y.; Zhang, X. Influences of different ratios of AC-DC combined voltage on internal gas cavity discharge in oil-pressboard insulation. IEEE Trans. Power Deliv. 2016, 31, 1026–1033. [Google Scholar] [CrossRef]
- International Electrotechnical Commission. IEC Standard 60641: Specification for Pressboard and Press-Paper for Electrical Purposes; International Electrotechnical Commission: Geneva, Switzerland, 2008. [Google Scholar]
- International Electrotechnical Commission. IEC Standard 60243: Electrical Strength of Insulating Materials Test Methods; International Electrotechnical Commission: Geneva, Switzerland, 1998. [Google Scholar]
- IEEE Work Group. Recommended dielectric tests and test procedures for converter transformers and smoothing. IEEE Trans. Power Deliv. 1986, 3, 161–166. [Google Scholar]
- IEEE Work Group. IEEE Standard C57.129-2007: Standard for General Requirements and Test Code for Oil-Immersed HVDC Converter Transformers; IEEE: New York, NY, USA, 2008. [Google Scholar]
- Laughari, J.R. A short method of estimating life time of polypropylenes film using step-stress tests. IEEE Trans. Dielectr. Electr. Insul. 1990, 25, 1180–1182. [Google Scholar] [CrossRef]
- Tang, L.C. Analysis of step-stress accelerated-life-test data: A new approach. IEEE Trans. Reliab. 1996, 45, 69–74. [Google Scholar] [CrossRef]
- Li, J.; Han, X.; Liu, Z.; Yao, X.; Li, Y. PD characteristics of oil-pressboard insulation under AC and DC mixed voltage. IEEE Trans. Dielectr. Electr. Insul. 2016, 23, 444–450. [Google Scholar] [CrossRef]
- Okubo, H.; Wakamatsu, M.; Inoue, N.; Kato, K.; Koide, H. Charge behavior in flowing oil in oil/pressboard insulation system by electro-optic field measurement. IEEE Trans. Dielectr. Electr. Insul. 2003, 10, 956–962. [Google Scholar] [CrossRef]
- Chen, G. Research on the feature extraction of DC space charge behavior of oil-paper insulation. Sci. China Technol. Sci. 2011, 54, 1315–1324. [Google Scholar]
- Radwan, R.M.; El-Dewieny, R.M.; Metwally, I.A. Investigation of static electrification phenomenon due to transformer oil flow in electric power apparatus. IEEE Trans. Electr. Insul. 1992, 27, 278–286. [Google Scholar] [CrossRef]
- Ciobanu, R.; Schreiner, C.; Pfeiffer, W.; Baraboi, B. Space charge evolution in oil-paper insulation for dc cables application. In Proceedings of the IEEE 14th International Conference on Dielectric Liquids, Graz, Austria, 12 July 2002; pp. 321–324. [Google Scholar]
- Majidi, M.; Fadali, M.S.; Etezadi-Amoli, M.; Oskuoee, M. Partial discharge pattern recognition via sparse representation and ANN. IEEE Trans. Dielectr. Electr. Insul. 2015, 22, 1061–1070. [Google Scholar] [CrossRef]
- Majidi, M.; Oskuoee, M. Improving pattern recognition accuracy of partial discharges by new data preprocessing methods. Electr. Power Syst. Res. 2015, 119, 100–110. [Google Scholar] [CrossRef]


| AC/DC Proportion | PDIV/kV | Breakdown Voltage/kV | ||||
|---|---|---|---|---|---|---|
| AC | DC | Combined | AC | DC | Combined | |
| 1:1 | 8.5 | 8.5 | 17 | 21 | 21 | 42 |
| 1:3 | 4.5 | 13.5 | 18 | 11 | 33 | 44 |
| 1:5 | 3.2 | 16 | 19.2 | 8 | 40 | 48 |
| 1:7 | 2.5 | 17.5 | 20 | 6.5 | 45.5 | 52 |
| AC/DC Proportion | Initial Stage | Pre-Breakdown Stage | Whole Process |
|---|---|---|---|
| 1:1 | 4.63 | 285.50 | 112.45 |
| 1:3 | 1.46 | 231.57 | 79.34 |
| 1:5 | 1.43 | 189.68 | 52.61 |
| 1:7 | 0.99 | 137.66 | 34.06 |
| AC/DC Proportion | Initial Stage/pC | Pre-Breakdown Stage/pC |
|---|---|---|
| 1:1 | 173.4 | 5644.5 |
| 1:3 | 176.22 | 3303.3 |
| 1:5 | 251.94 | 2714.2 |
| 1:7 | 255.18 | 2466.4 |
| AC/DC Proportion | Initial Stage/pC | Pre-Breakdown Stage/pC | Whole Process/pC |
|---|---|---|---|
| 1:1 | 22.85 | 90.32 | 52.45 |
| 1:3 | 20.73 | 63.59 | 38.09 |
| 1:5 | 18.96 | 49.62 | 34.19 |
| 1:7 | 14.88 | 34.77 | 23.6 |
| AC/DC Proportion | Initial Stage/nC | Pre-Breakdown Stage/nC |
|---|---|---|
| 1:1 | 5.05 | 507.36 |
| 1:3 | 3.51 | 187.45 |
| 1:5 | 2.26 | 110.54 |
| 1:7 | 2.03 | 80.12 |
| AC/DC Proportion | Initial Stage | Pre-Breakdown Stage | ||
|---|---|---|---|---|
| Positive | Negative | Positive | Negative | |
| 1:1 | 0~80 | 160~250 | - | 210~320 |
| 1:3 | 10~60 | 160~250 | - | 230~310 |
| 1:5 | 10~30 | 200~340 | 150~180 | 250~310 |
| 1:7 | - | 260~320 | - | 220~360 |
© 2017 by the authors. Licensee MDPI, Basel, Switzerland. This article is an open access article distributed under the terms and conditions of the Creative Commons Attribution (CC BY) license (http://creativecommons.org/licenses/by/4.0/).
Share and Cite
Sun, J.; Li, X.; Zhu, L.; Ji, S.; Cui, Y. Partial Discharge of Needle-Plane Defect in Oil-Paper Insulation under AC and DC Combined Voltages: Developing Processes and Characteristics. Energies 2017, 10, 1759. https://doi.org/10.3390/en10111759
Sun J, Li X, Zhu L, Ji S, Cui Y. Partial Discharge of Needle-Plane Defect in Oil-Paper Insulation under AC and DC Combined Voltages: Developing Processes and Characteristics. Energies. 2017; 10(11):1759. https://doi.org/10.3390/en10111759
Chicago/Turabian StyleSun, Jiantao, Xining Li, Lingyu Zhu, Shengchang Ji, and Yanjie Cui. 2017. "Partial Discharge of Needle-Plane Defect in Oil-Paper Insulation under AC and DC Combined Voltages: Developing Processes and Characteristics" Energies 10, no. 11: 1759. https://doi.org/10.3390/en10111759