A Cascade Disaster Caused by Geological and Coupled Hydro-Mechanical Factors—Water Inrush Mechanism from Karst Collapse Column under Confining Pressure

 ,
,
Abstract
:1. Introduction
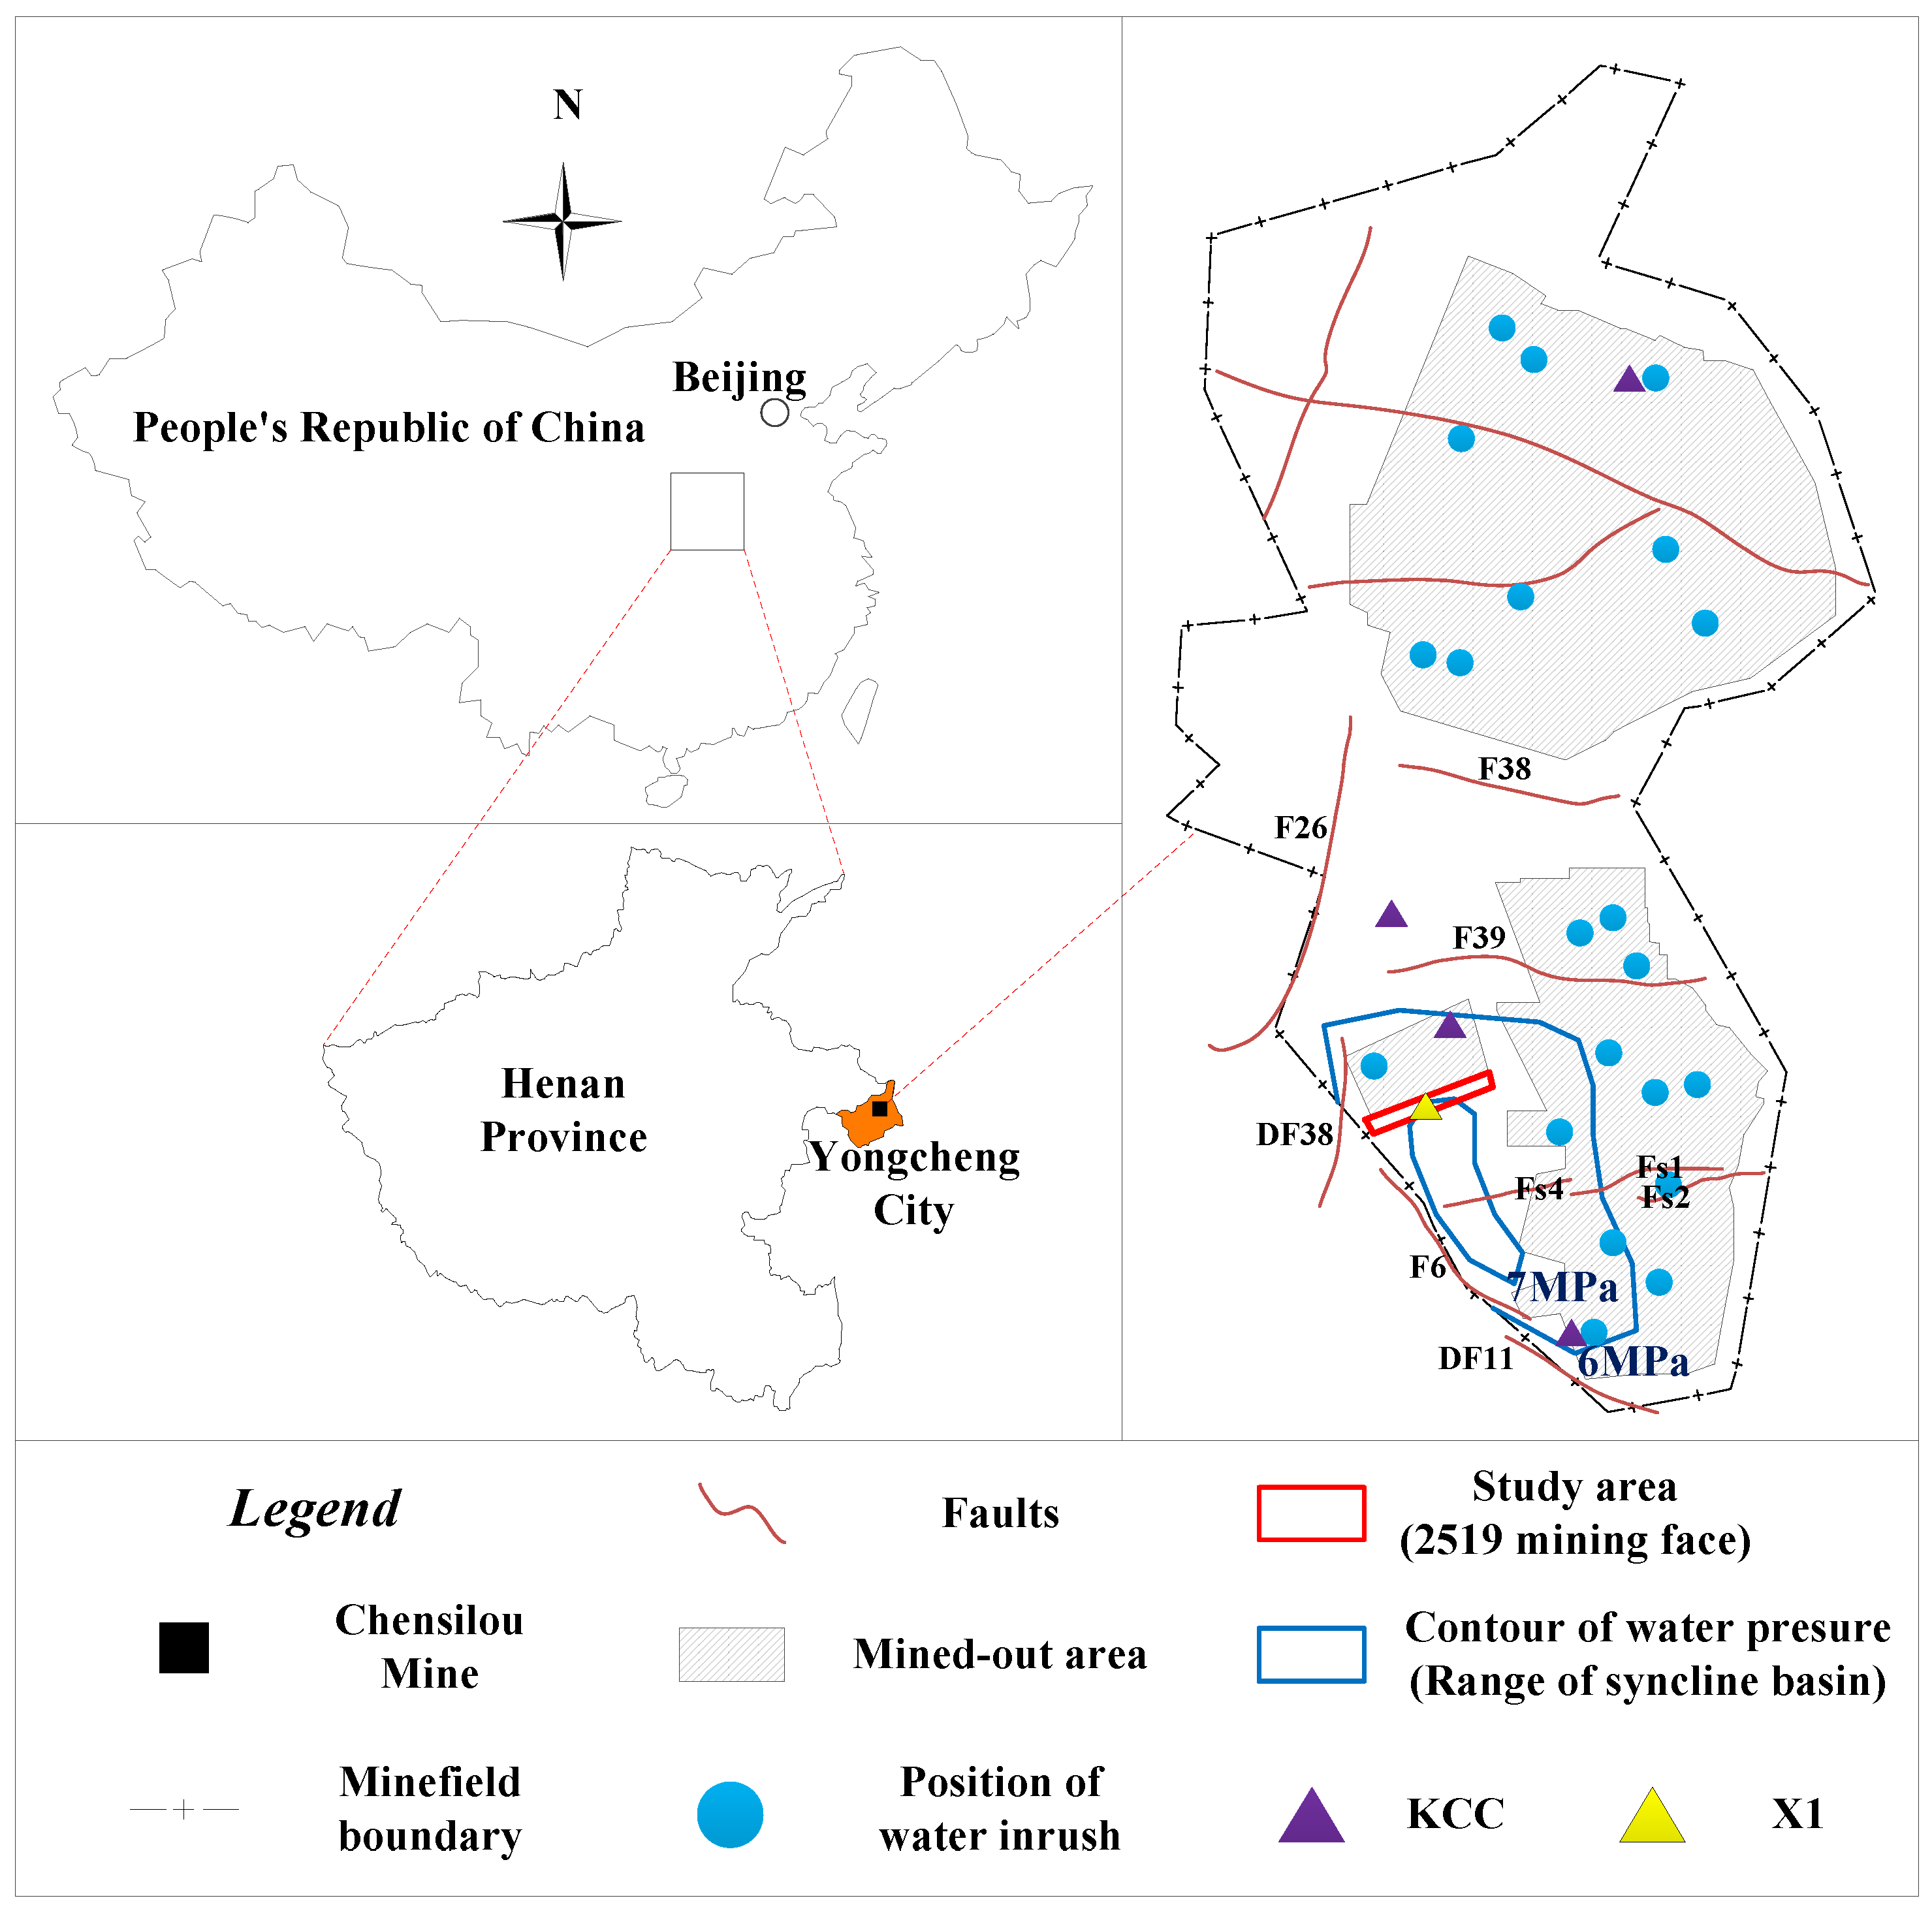
2. Study Area
2.1. Overview of the Chensilou Mine
2.2. Engineering Situations at 2519 Mining Face
3. In-Situ Test
3.1. Connectivity Experiment
3.2. Water Pressure Monitoring Test in Two Side-Walls
4. Constitutive Model and Verification
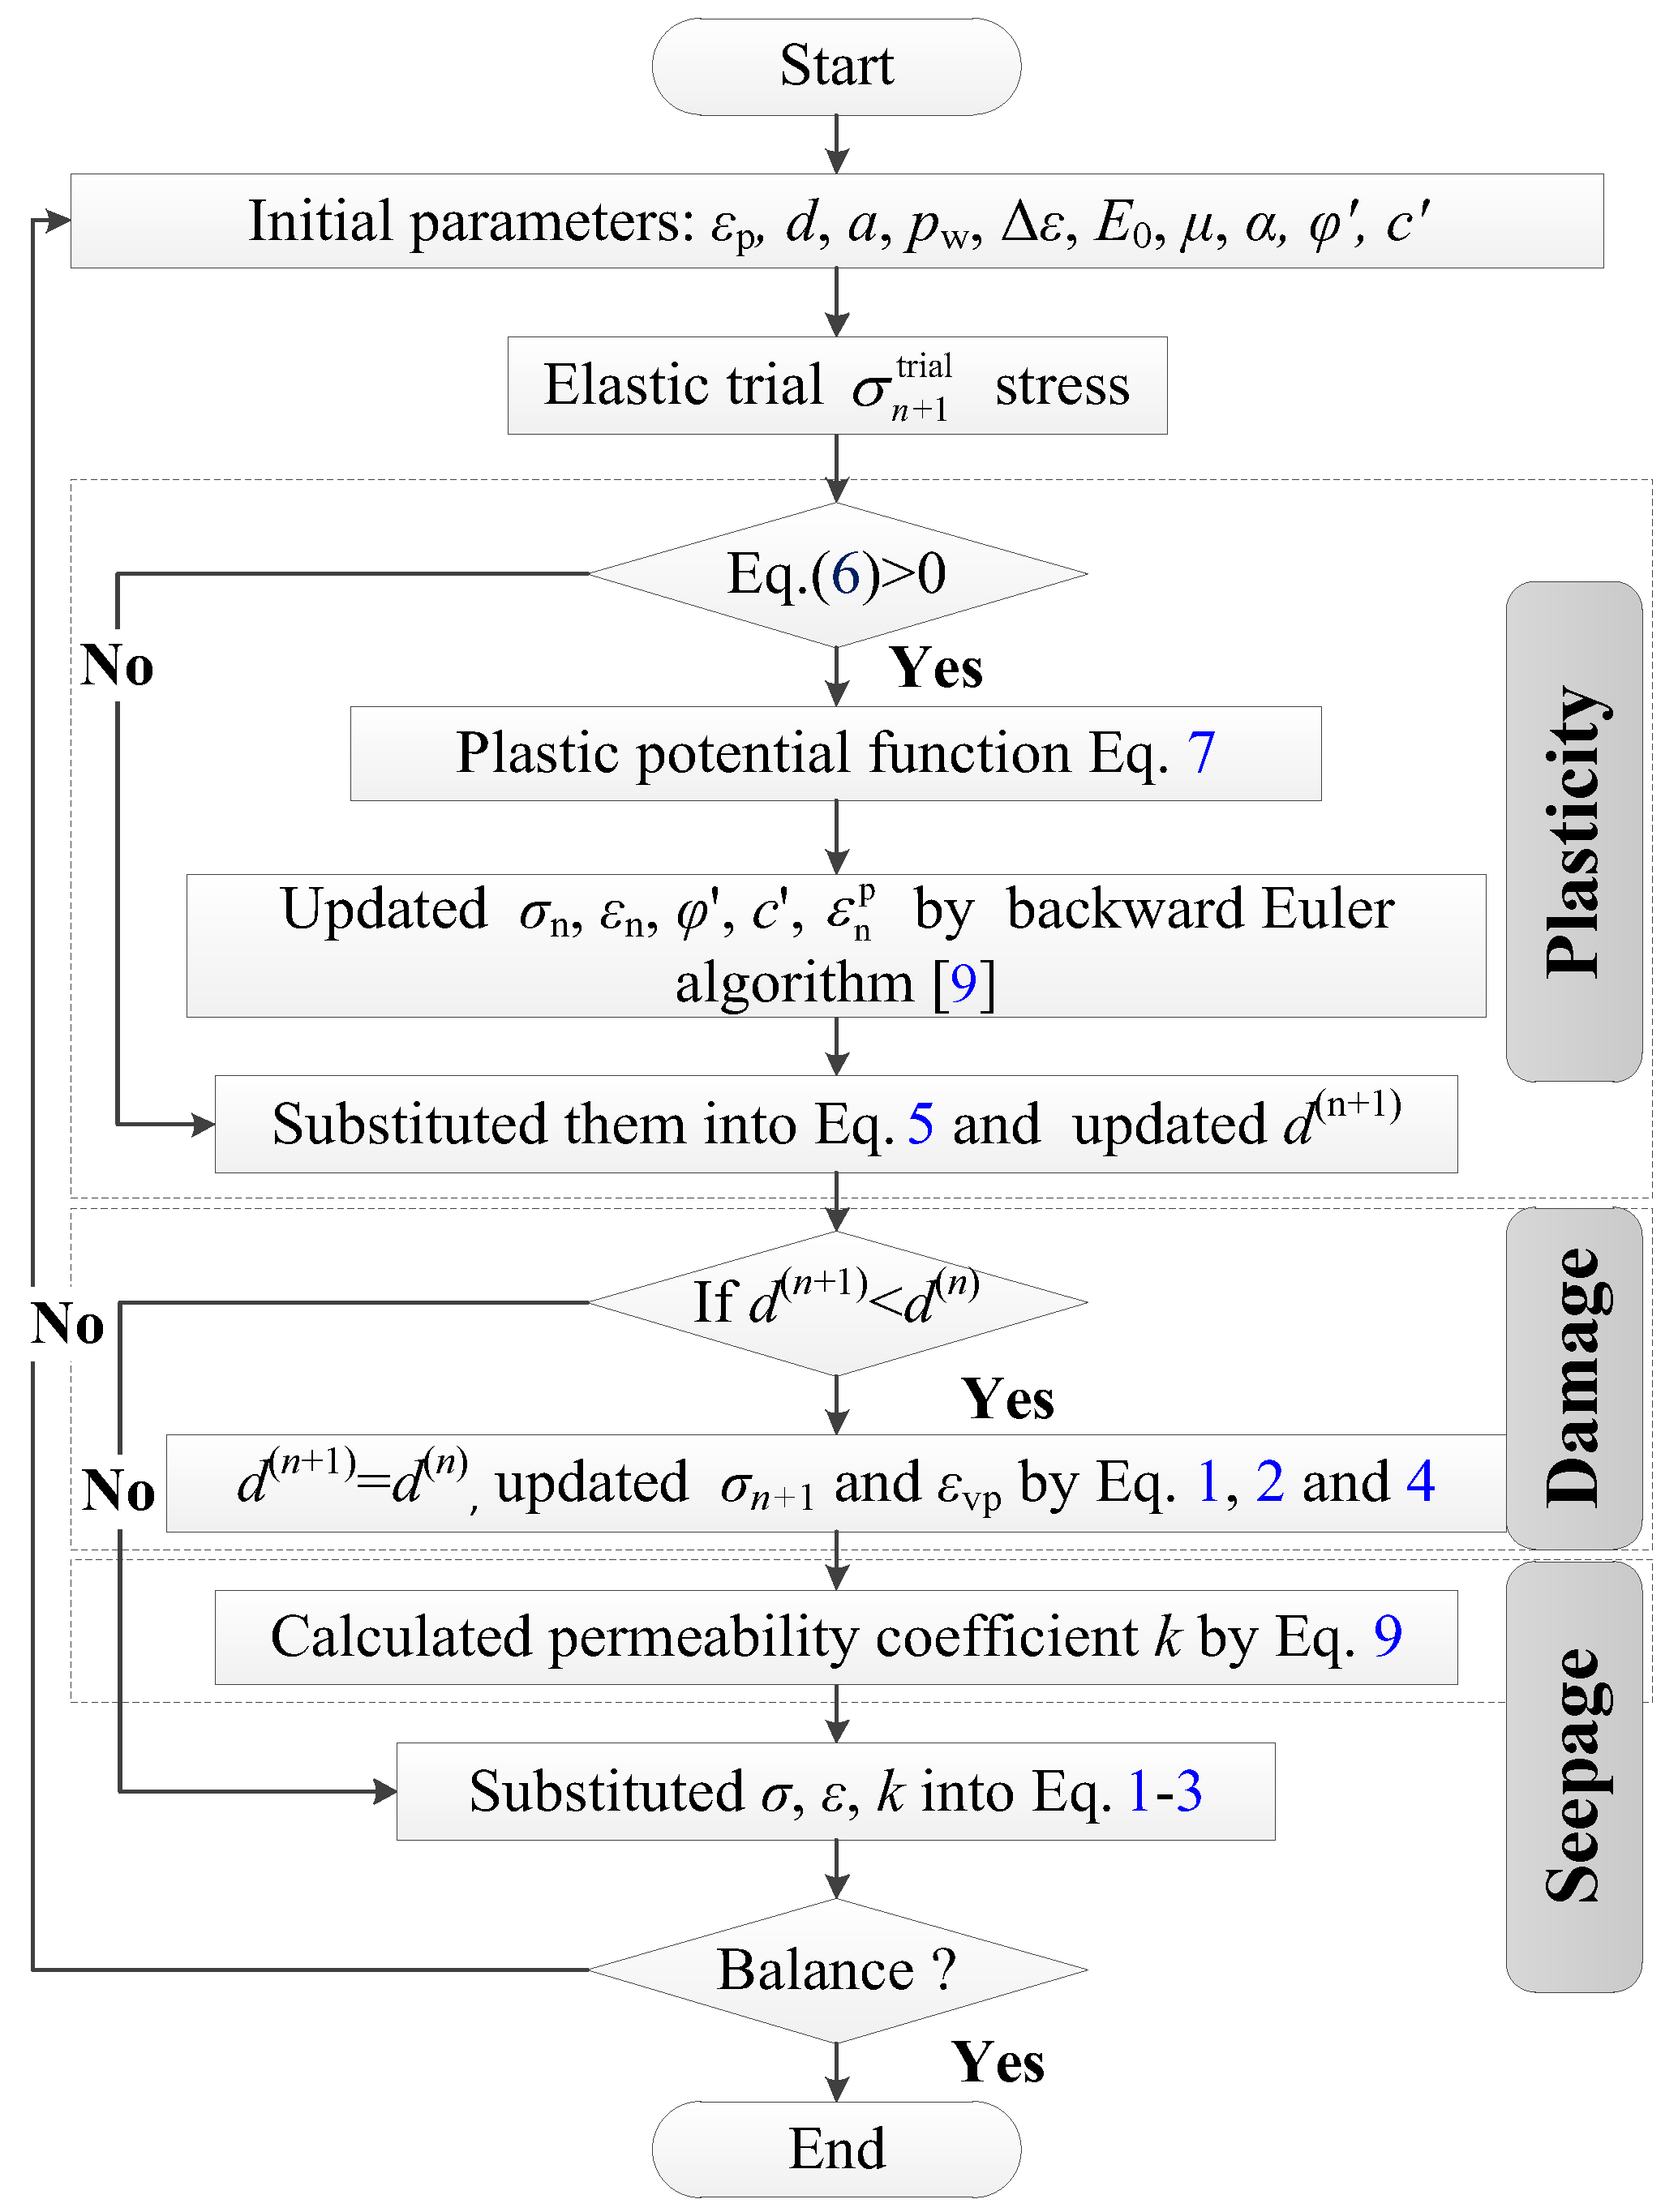
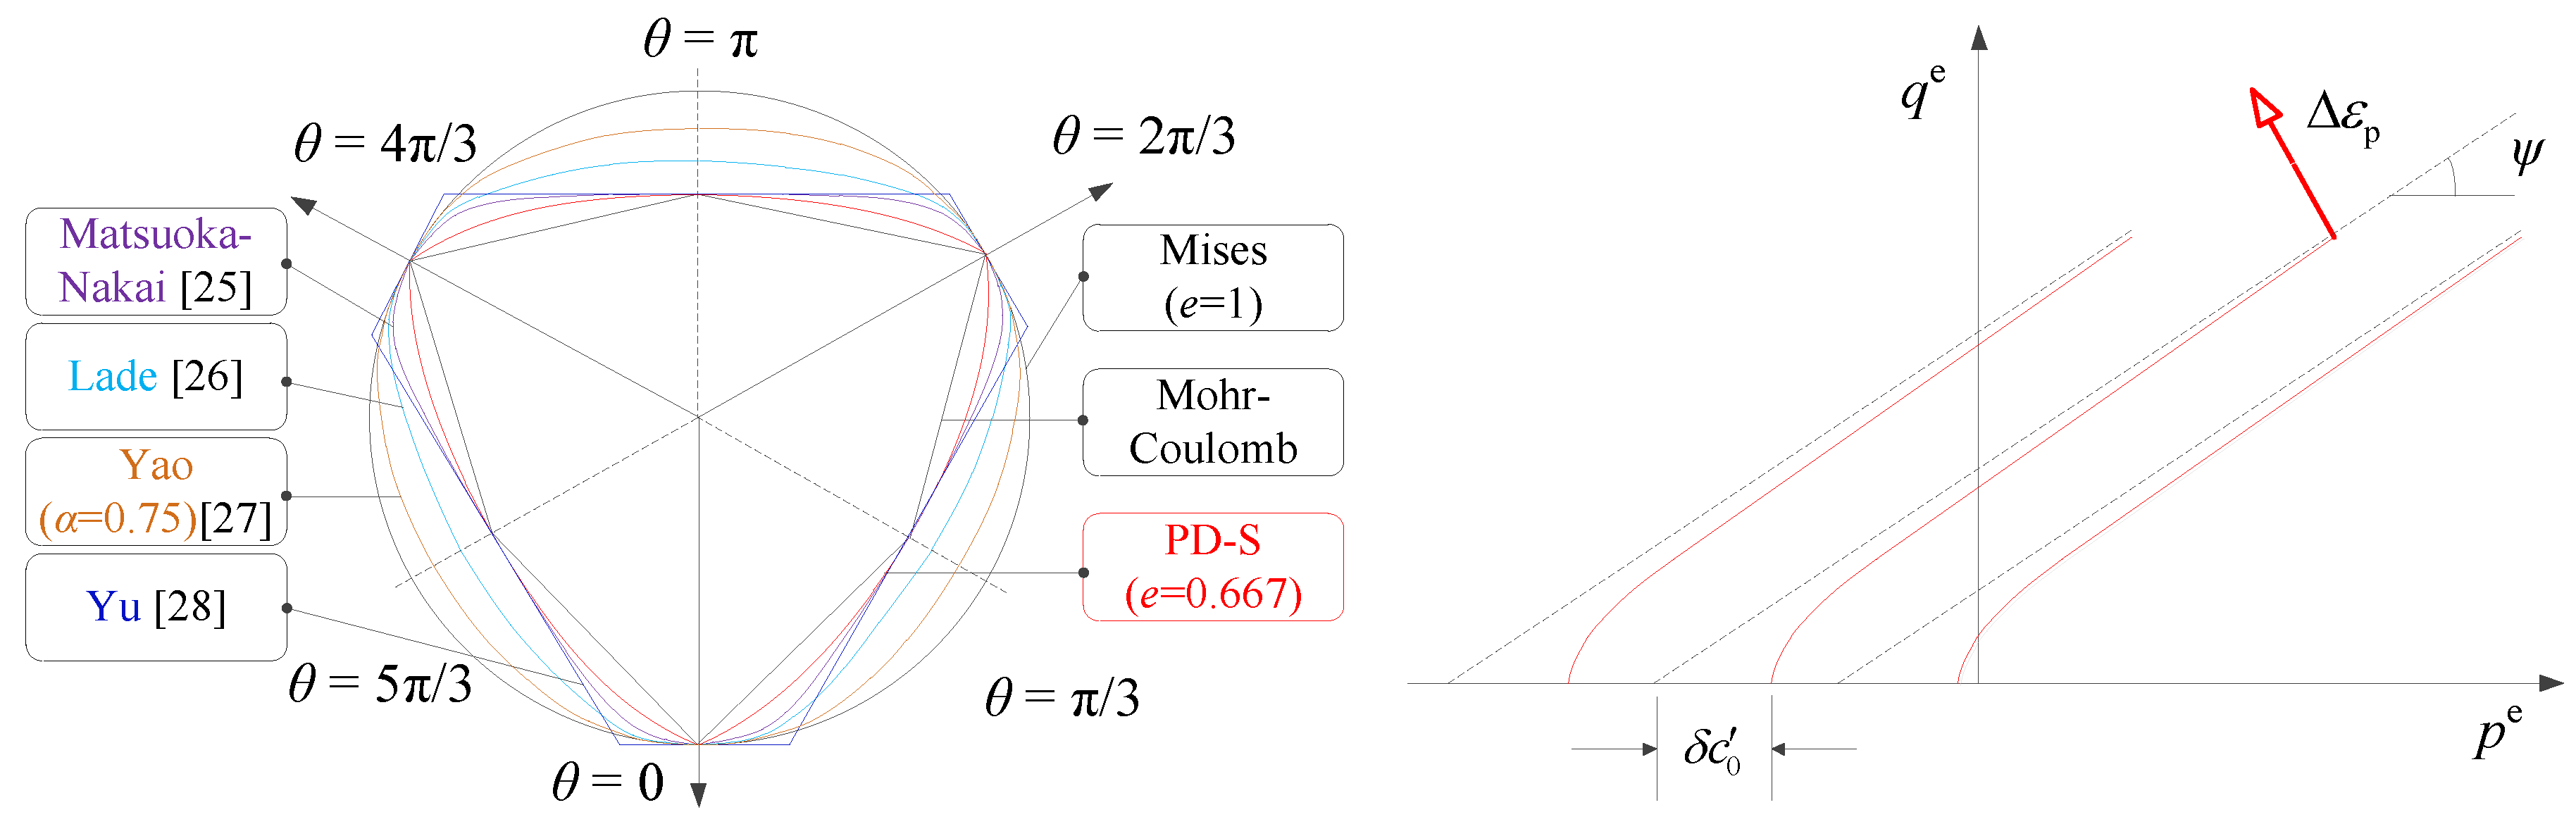
4.1. Plastic Damage-Seepage Coupled Model
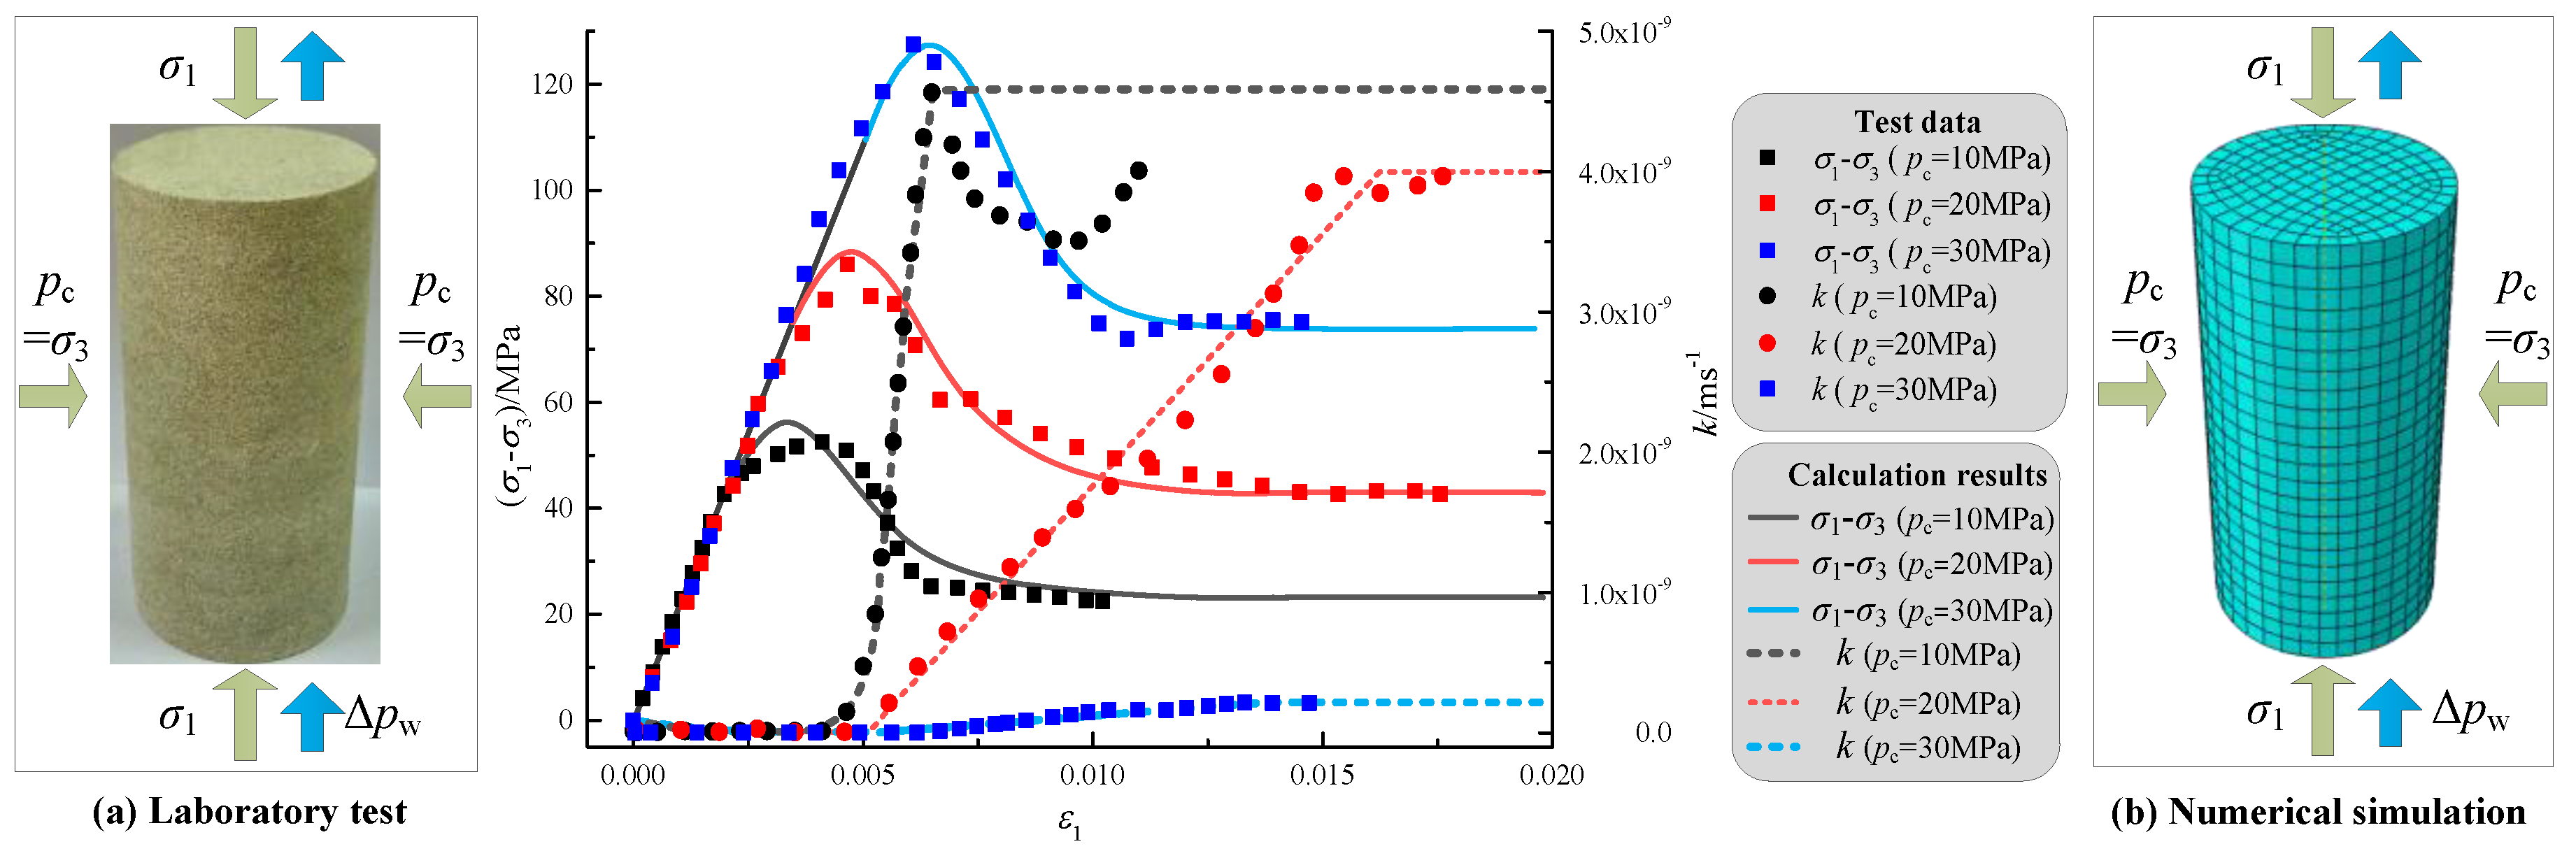
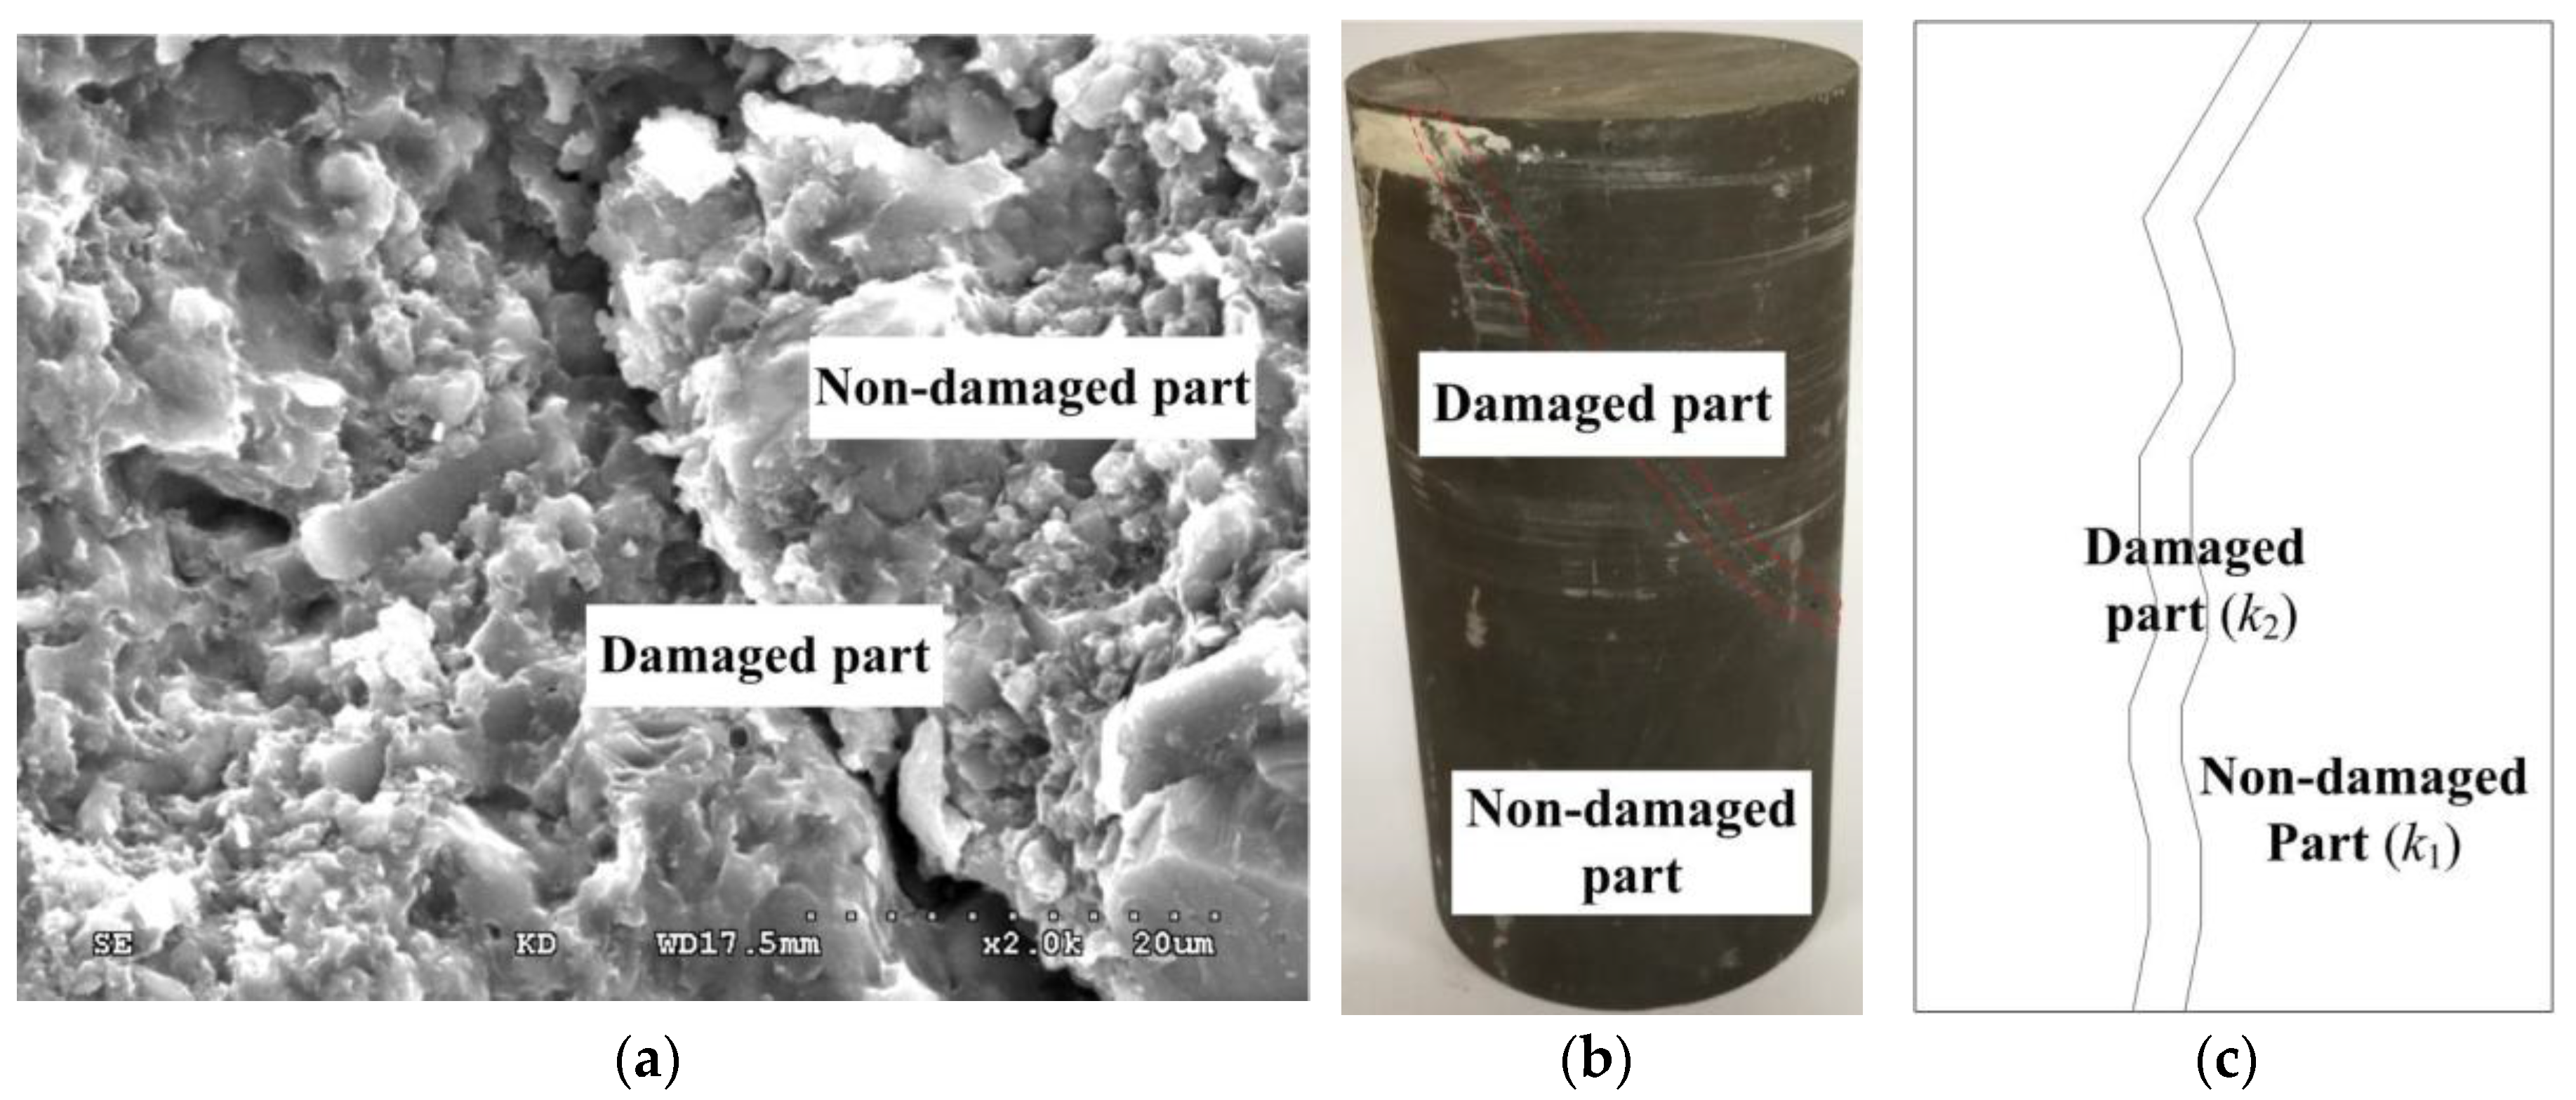
4.2. Validation by Laboratory Tests
5. Results and Discussion
5.1. Material Parameters and Calculation Results
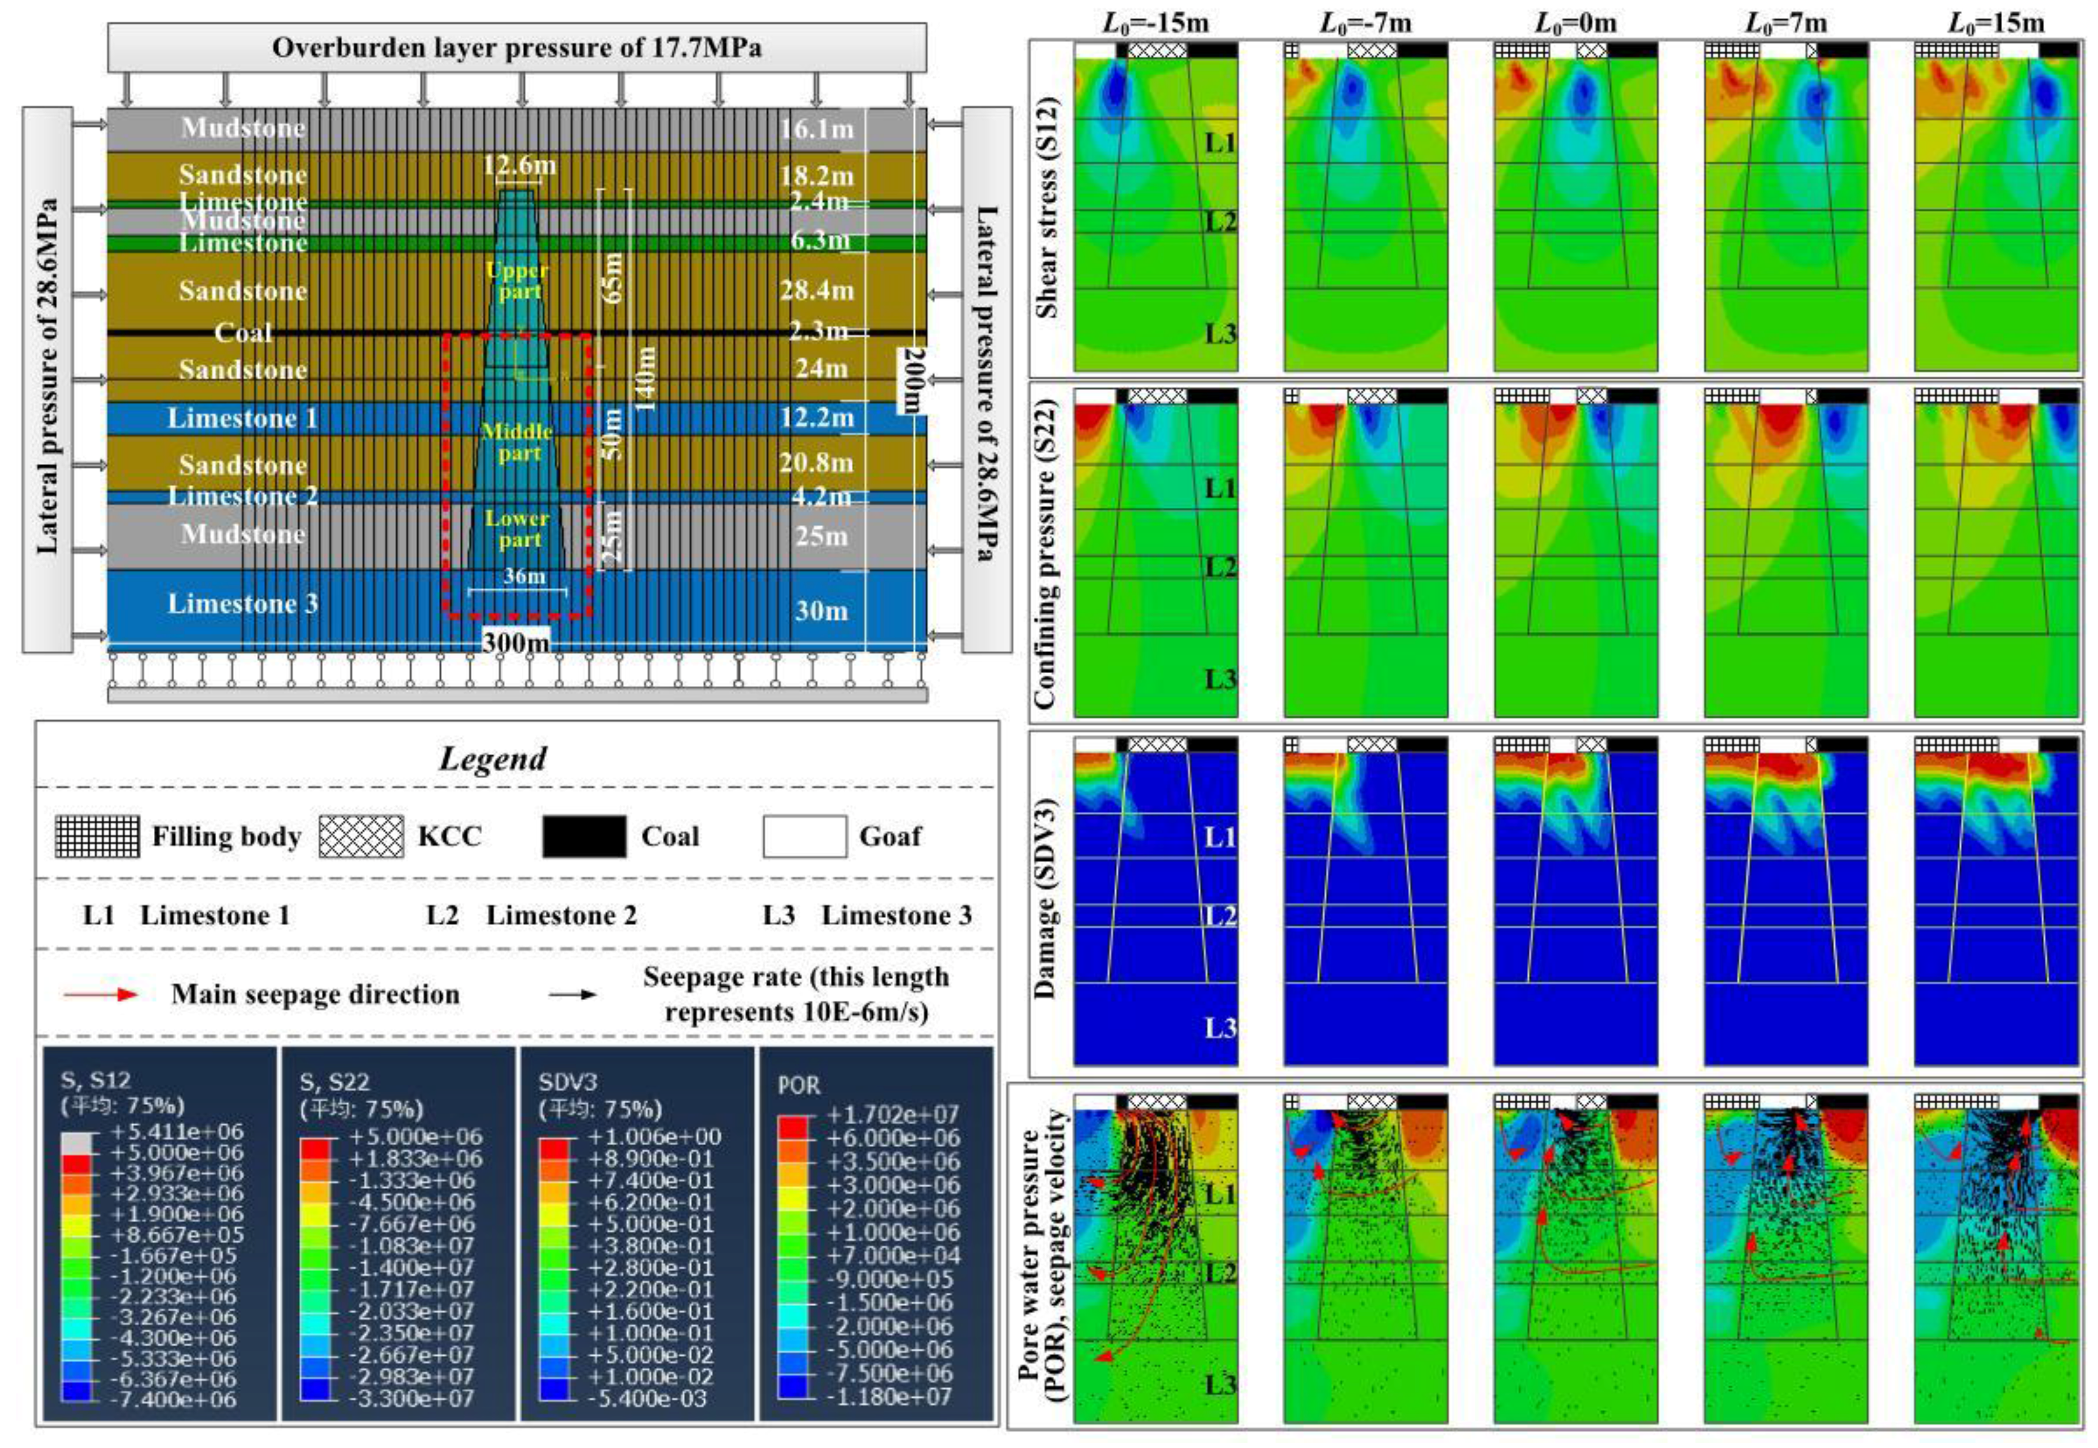
5.1.1. Shear Stress and Vertical Stress (i.e., Confining Pressure)
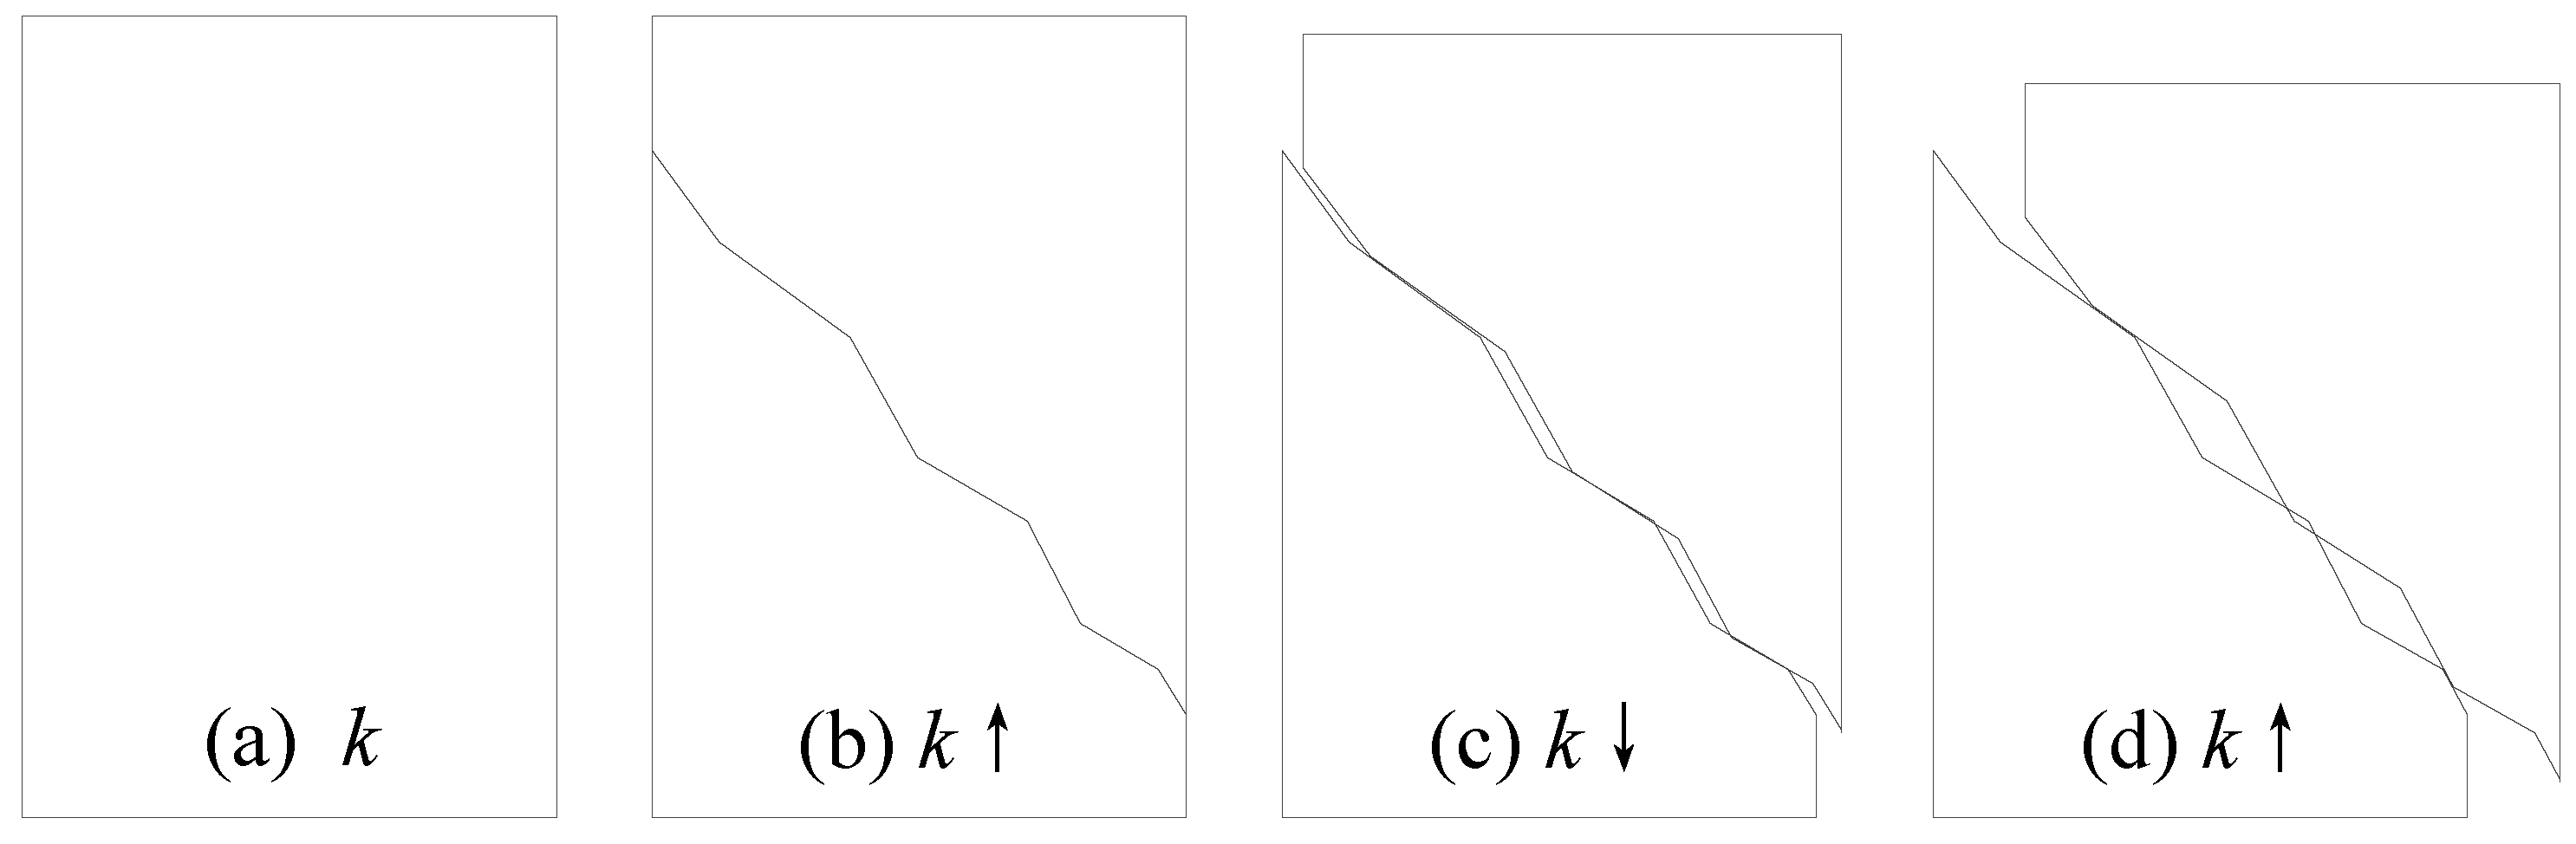
5.1.2. Damage Zone
5.1.3. Pore Water Pressure and Seepage Vector
5.2. Discussion
6. Conclusions
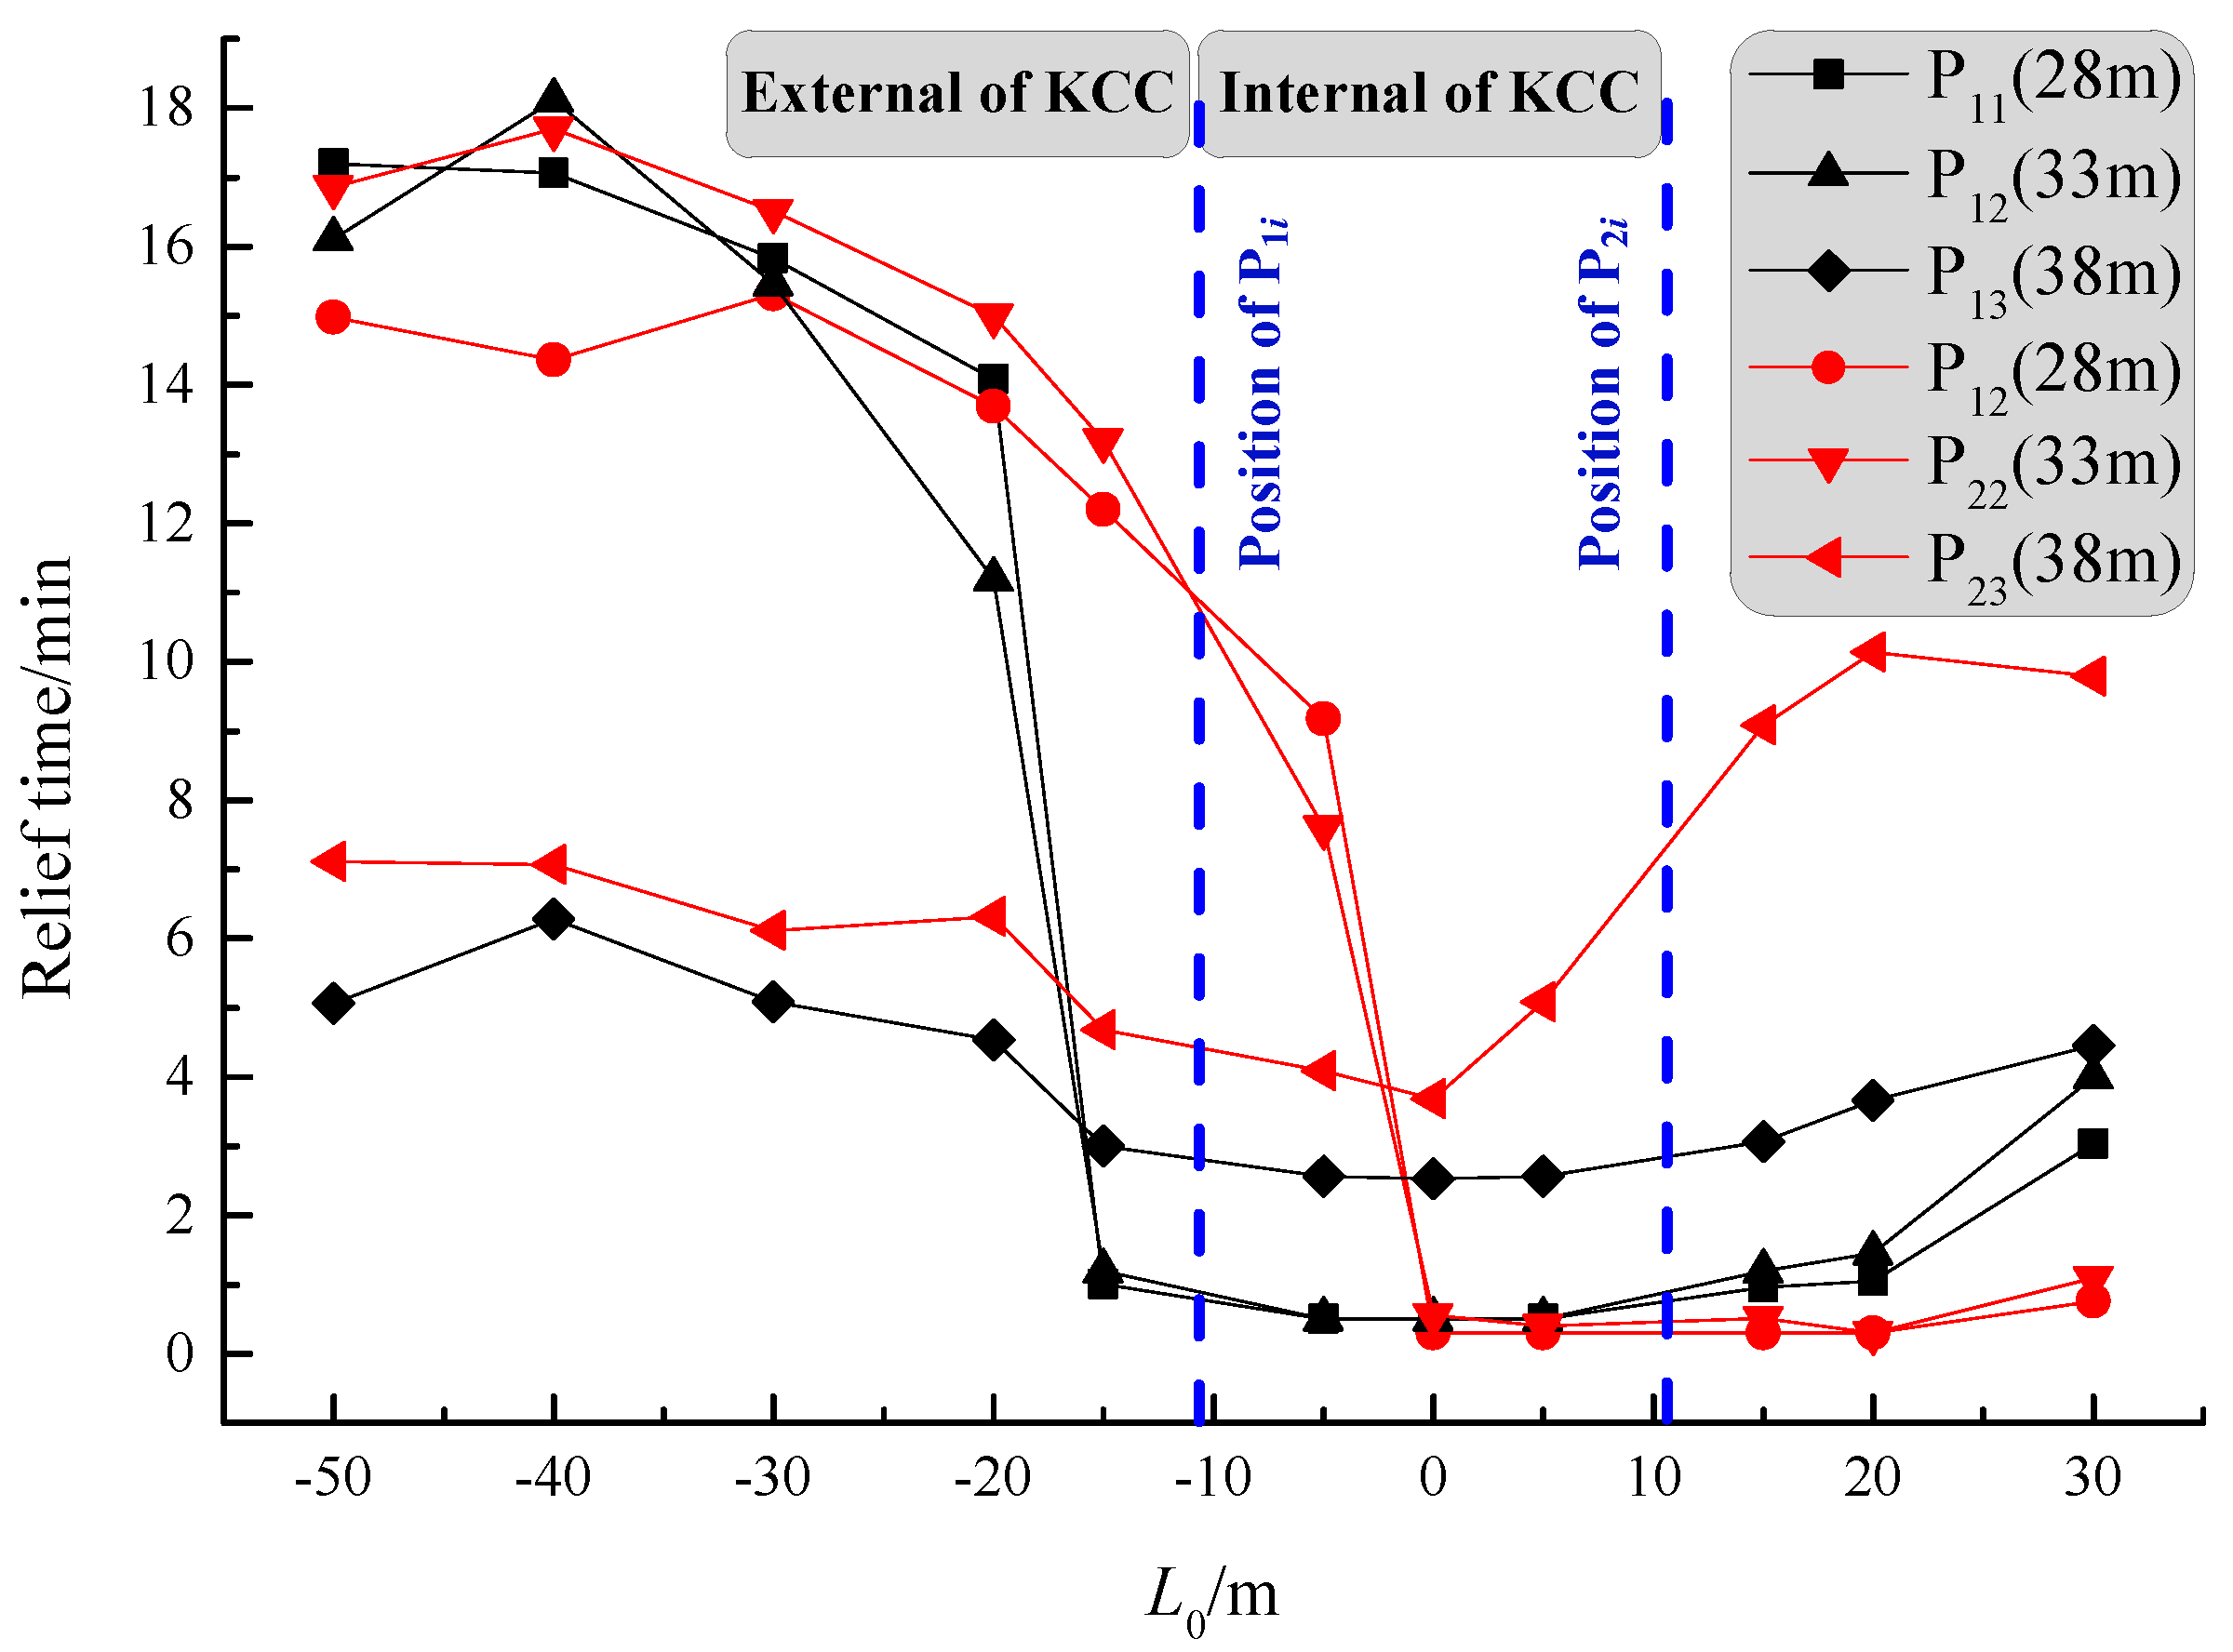
- The reasonableness of the in-situ test method determines the accuracy of the test results. Connectivity experiment is an important method to ensure the safety of coal mining. The water pressure monitoring test in two side-walls, which is suitable for good permeability of the KCC, has been developed. According to the relief time of water pressure, the damage thickness of the side-wall far away from the starting cut is smaller than that near the starting cut, and the maximum depth of damage zone reaches limestone 1.
- Shear stress is one of the important factors in determining the damage thickness. In the process of mining advance, the shear stress concentration area below the coal face leads to formation of a damage zone, and this phenomenon is more pronounced near the side-wall of KCC due to a strong shear dislocation between the two materials with different mechanical properties. Consistent with the results of in-situ tests, the maximum damage thickness is about 37.7 m, and it is located in the left side-wall.
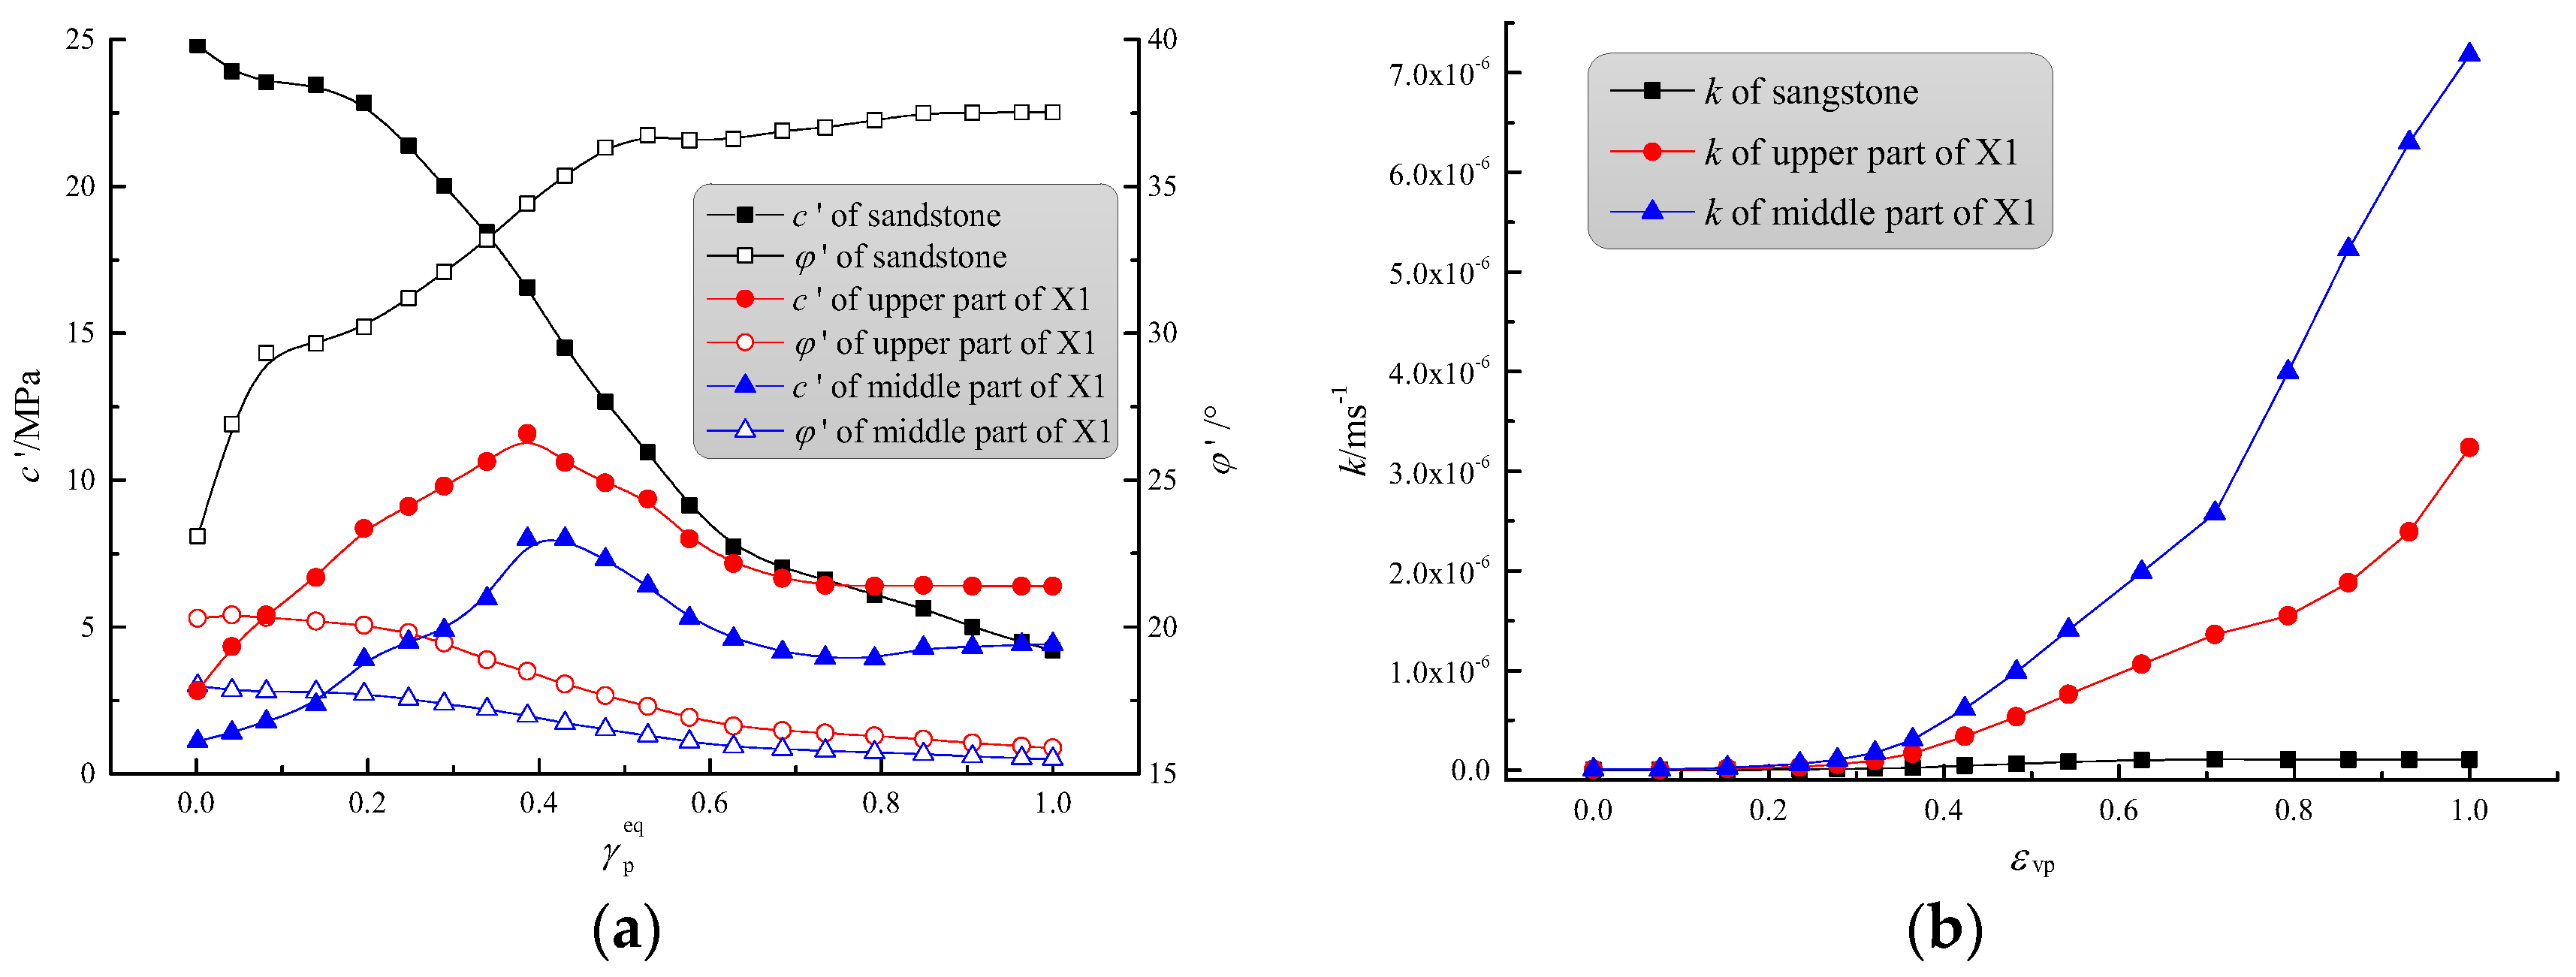
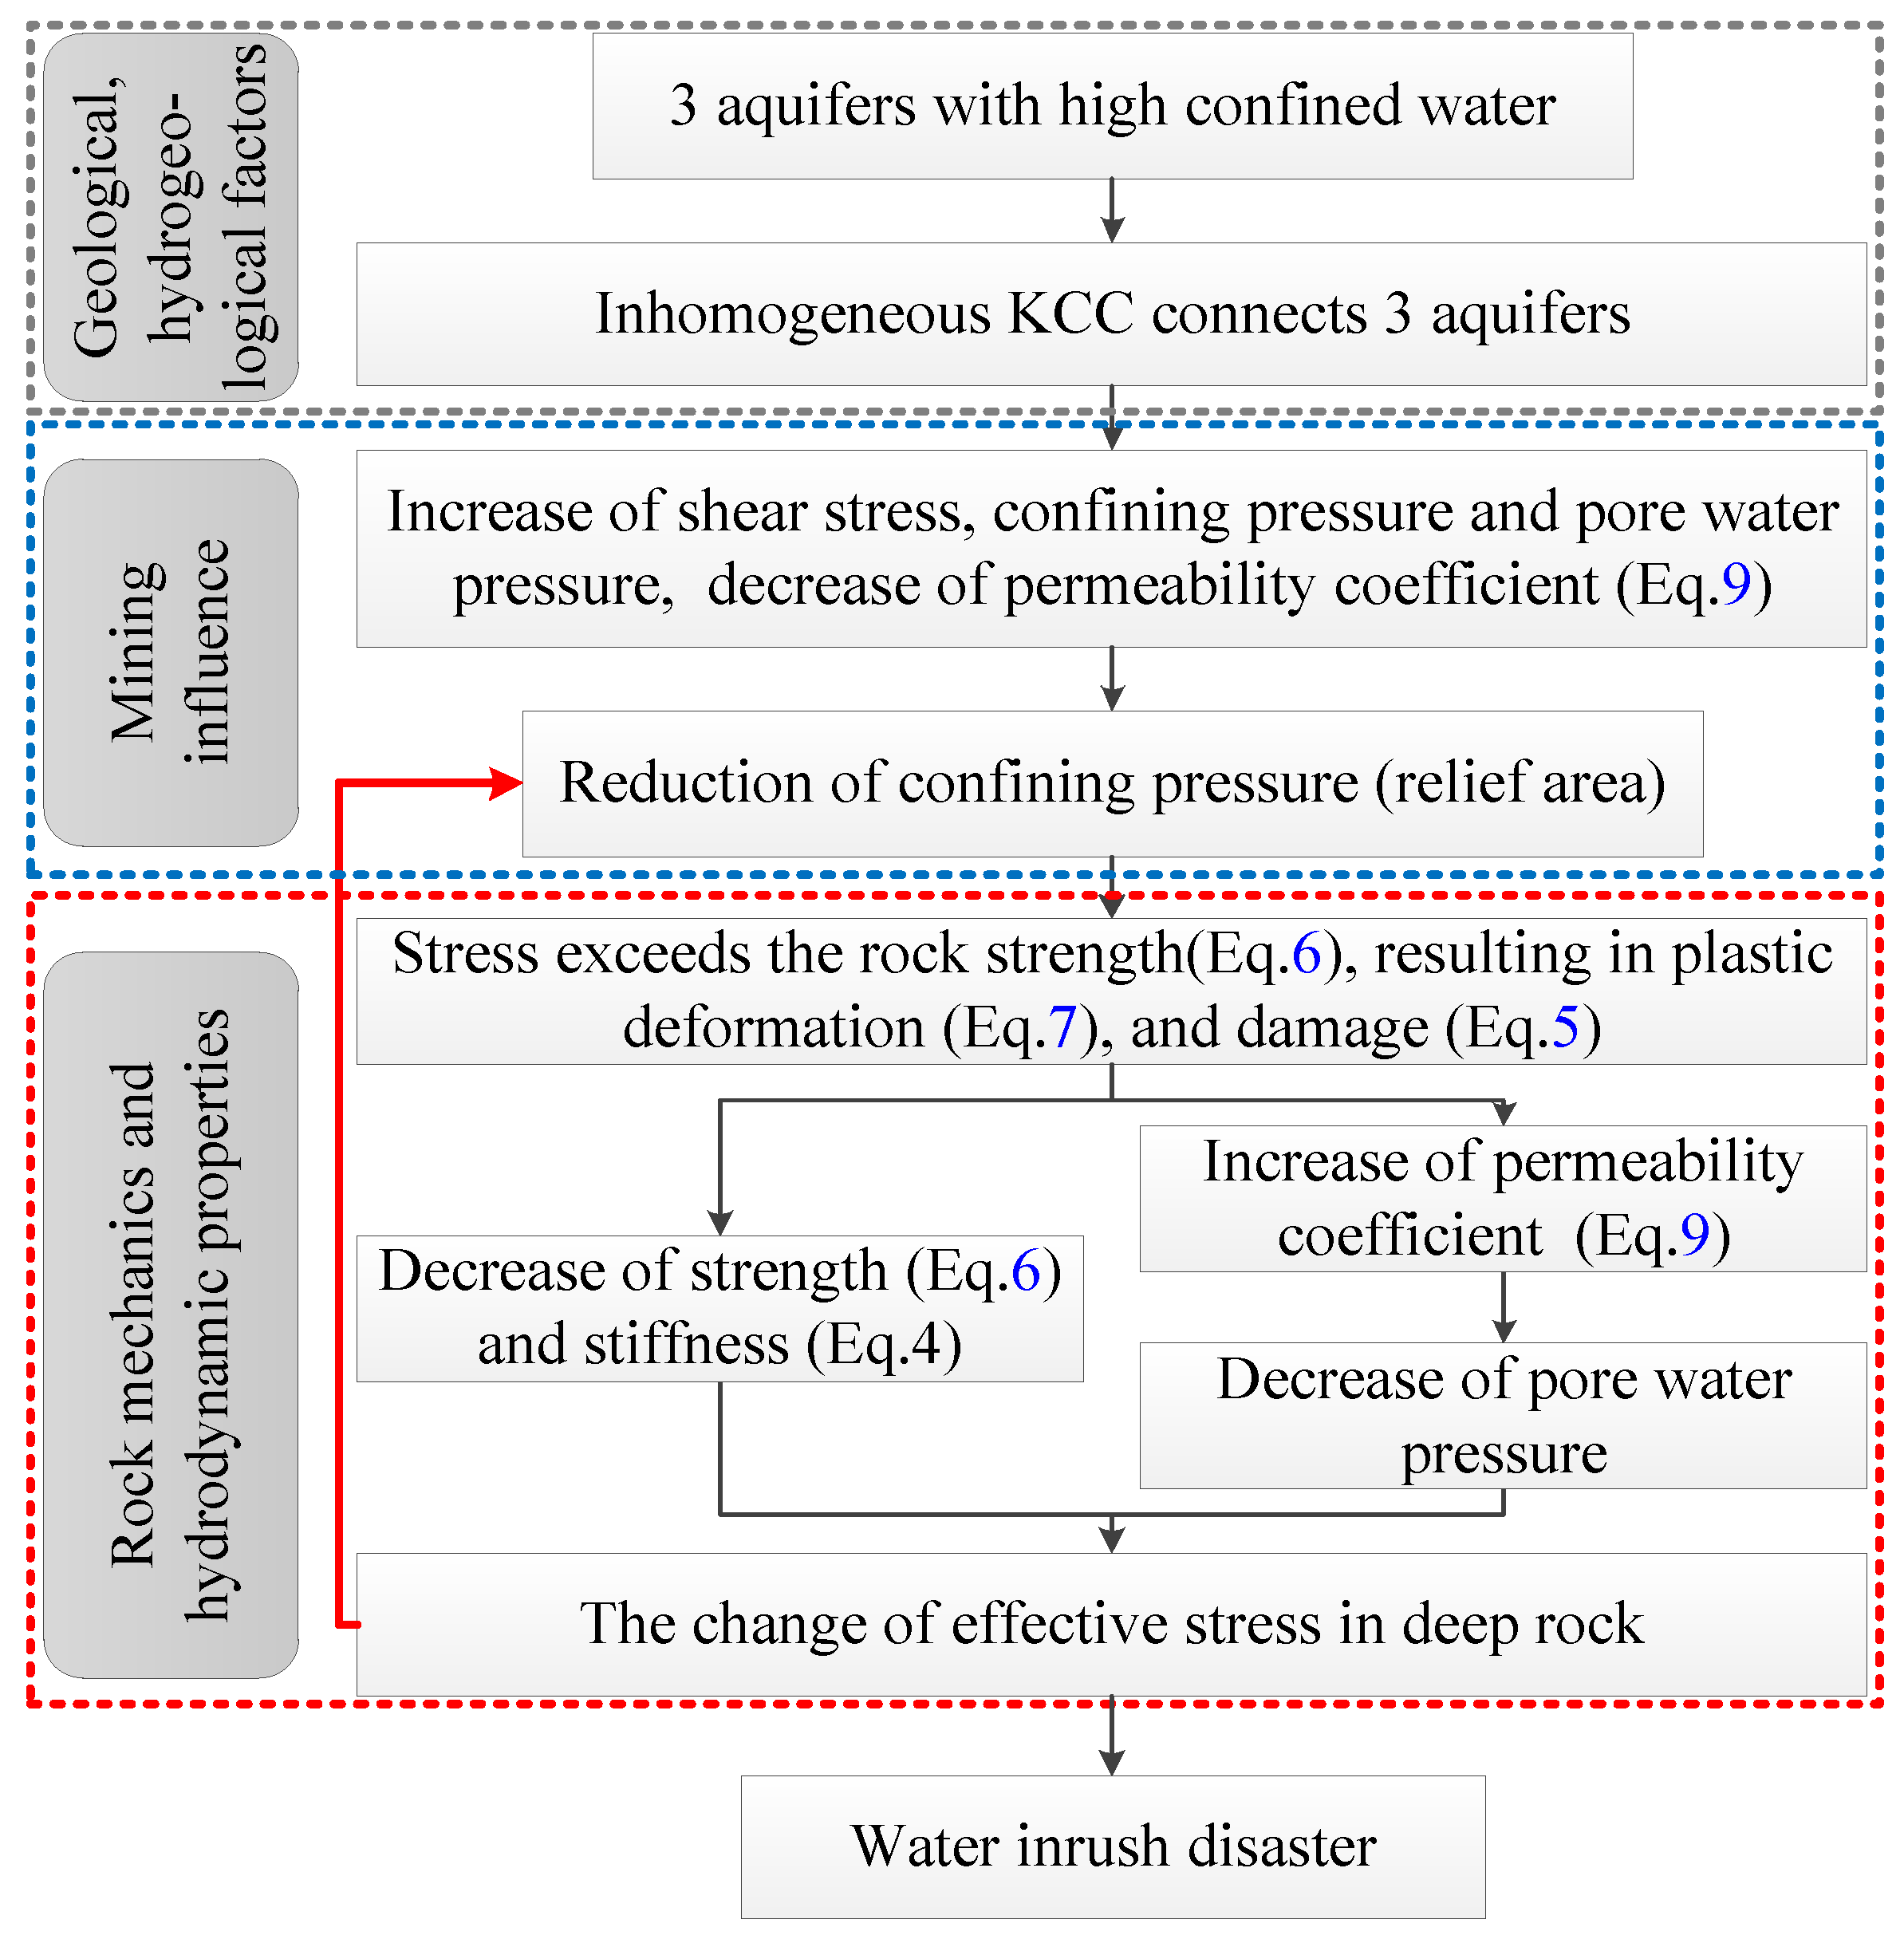
- Confining pressure plays a crucial role in the water inrush mechanism of KCC. With the decrease of confining pressure, deviatoric stress can cause further plastic strain increases, rock damage and permeability, and a reduction of strength and stiffness. Meanwhile the pore water pressure changes from positive to negative, and the effective stress in the rock will damage the deeper rock, or force the rock to become more fractured in the damage zone. This broken rock can cause stress changes, especially the confining pressure in the KCC. Thus a cascade of vicious water inrush disaster cycles forms.
Acknowledgments
Author Contributions
Conflicts of Interest
References
- Booth, C.J. Groundwater as an environmental constraint of longwall coal mining. Environ. Geol. 2006, 49, 796–803. [Google Scholar] [CrossRef]
- Odintsev, V.N.; Miletenko, N.A. Water inrush in mines as a consequence of spontaneous hydrofracture. J. Min. Sci. 2015, 51, 423–434. [Google Scholar] [CrossRef]
- Istvan, B.; Lucien, D.; Ferenc, S. Bayesian analysis of underground flooding. Water Resour. Res. 1982, 18, 1110–1116. [Google Scholar]
- Ma, D.; Miao, X.; Bai, H.; Huang, J.; Pu, H.; Wu, Y.; Zhang, G.; Li, J. Effect of mining on shear sidewall groundwater inrush hazard caused by seepage instability of the penetrated karst collapse pillar. Nat. Hazards 2016, 82, 73–93. [Google Scholar] [CrossRef]
- Cook, A.C. Australian Black Coal; Australian Institute of Mining and Metallurgy: Illawarra, Australia, 1975. [Google Scholar]
- Huang, Z.; Jiang, Z.; Qian, Z.; Cao, D. Analytical and experimental study of water seepage propagation behavior in the fault. Acta Geodyn. Geomater. 2014, 176, 361–370. [Google Scholar] [CrossRef]
- Li, H.; Bai, H.B.; Wu, J.J.; Zhao, H.M.; Ma, K. A method for prevent water inrush from karst collapse column: A case study from sima mine, china. Environ. Earth Sci. 2017, 76, 493. [Google Scholar] [CrossRef]
- Bai, H.B.; Ma, D.; Chen, Z.Q. Mechanical behavior of groundwater seepage in karst collapse pillars. Eng. Geol. 2013, 164, 101–106. [Google Scholar] [CrossRef]
- Qian, X.P. The formation of gypsum karst collapse-collum and its hydrogeological significance. Carsologica Sin. 1988, 4, 344–348. [Google Scholar]
- Yuan, D. Karstology of China; Geological Publishing House: Beijing, China, 1994. [Google Scholar]
- Shi, J.; Lian, D.; Yang, S. A discussion of karst collapse. Geol. Min. Res. North China Mag. 1998, 13, 264–266. [Google Scholar]
- Yin, S.X.; Wu, Q.; Wang, S.X. Water-bearing characteristics and hydro-geological models of karstic collapse columns in north China. Chin. J. Rock. Mech. Eng. 2005, 24, 77–82. [Google Scholar]
- Zhang, J.F.; Zhang, H.L.; Meng, D.; Cao, J. Numerical simulation of rock deformation and seepage field with a fully-water karstic collapse column under mining influence. Chin. J. Rock. Mech. Eng. 2009, 28, 77–82. [Google Scholar]
- Li, Z.; Feng, G.; Zhai, C. Study on “triangle” water-inrush mode of strong water-guide collapse column. J. Cent. South. Univ. 2016, 23, 2402–2409. [Google Scholar] [CrossRef]
- Zhang, C.; Tu, S. Control technology of direct passing karstic collapse pillar in longwall top-coal caving mining. Nat. Hazards 2016, 84, 17–34. [Google Scholar] [CrossRef]
- Yin, S.X.; Zhang, J. Impacts of karst paleo-sinkholes on mining and environment in northern China. Environ. Geol. 2005, 48, 1077–1083. [Google Scholar] [CrossRef]
- Ou, S.; Wang, L.; Wang, P. Numerical analysis of seepage flow characteristic of collapse column under the influence of mining. Int. J. Min. Sci. Technol. 2013, 23, 237–244. [Google Scholar] [CrossRef]
- Zhang, J.C. Investigations of water inrushes from aquifers under coal seams. Int. J. Rock. Mech. Min. Sci. 2005, 42, 350–360. [Google Scholar] [CrossRef]
- Zhu, W.C.; Wei, C.H. Numerical simulation on mining-induced water inrushes related to geologic structures using a damage-based hydromechanical model. Environ. Earth Sci. 2011, 62, 43–54. [Google Scholar] [CrossRef]
- Liu, E.L.; He, S.M. Effects of cyclic dynamic loading on the mechanical properties of intact rock samples under confining pressure conditions. Eng. Geol. 2012, 125, 81–91. [Google Scholar] [CrossRef]
- Bai, H.B.; Miao, X.X. Hydrogeological characteristics and mine water inrush prevention of late Paleozoic coalfields. J. China Univ. Min. Technol. 2016, 45, 1–10. [Google Scholar]
- Li, L.C.; Tang, C.A.; Liang, Z.Z.; Ma, T.H.; Zhang, Y.B. Numerical simulation on water inrush process due to activation of collapse columns in coal seam floor. J. Min. Saf. Eng. 2009, 26, 158–162. [Google Scholar]
- Boresi, A.P.; Lynn, P.P.; Hung, Y.Y. Elasticity in Engineering Mechanics; Elsevier: Amsterdam, The Netherlands, 2011. [Google Scholar]
- Fei, K.; Zhang, J.W. Application of ABAQUS in Geotechnical Engineering; China Water & Power Press: Beijing, China, 2013. [Google Scholar]
- Matsuoka, H.; Nakai, T. Relationship among Tresca, Mises, Mohr-Coulomb and Matsuoka-Nakai failure criteria. Soils Found. 2008, 25, 123–128. [Google Scholar] [CrossRef]
- Woodward, P.K. Earth pressure coefficients based on the Lade-Duncan failure criterion. Eng. Struct. 1997, 19, 733–737. [Google Scholar] [CrossRef]
- Yao, Y.P.; Zhang, B.Y.; Zhu, J.G. Behaviours, constitutive models and numerical simulation of soils. China Civ. Eng. J. 2012, 45, 127–150. [Google Scholar]
- Zan, Y.W.; Yu, M.H. Generalized nonlinear unified strength theory of rock. J. Southwest Jiaotong Univ. 2013, 48, 616–624. [Google Scholar]
- Luo, Z.H.; Zhu, Z.D.; Ruan, H.N.; Shi, C. Extraction of microcracks in rock images based on heuristic graph searching and application. Comput. Geosci. 2015, 85, 22–35. [Google Scholar] [CrossRef]
- Yin, L.M.; Chen, J.T.; Sun, W.B. Experimental Study on three dimensional coupled stress-seepage law of single fracture. Appl. Mech. Mater. 2013, 353, 524–528. [Google Scholar] [CrossRef]
- Peng, S.S. Longwall Mining; Science Press: Beijing, China, 2011. [Google Scholar]
- Cheng, Y.M.; Wang, J.A.; Xie, G.X.; Wei, W.B. Three-dimensional analysis of coal barrier pillars in tailgate area adjacent to the fully mechanized top caving mining face. Int. J. Rock. Mech. Min. Sci. 2010, 47, 1372–1383. [Google Scholar] [CrossRef]
- Yin, H.; Lefticariu, L.; Wei, J. In situ dynamic monitoring of stress revolution with time and space under coal seam floor during longwall mining. Environ. Earth Sci. 2016, 75, 1249–1260. [Google Scholar] [CrossRef]
- Wang, Y.; Yang, W.; Li, M.; Liu, X. Risk assessment of floor water inrush in coal mines based on secondary fuzzy comprehensive evaluation. Int. J. Rock. Mech. Min. Sci. 2012, 52, 50–55. [Google Scholar] [CrossRef]
- Gao, Y.; Zhang, Q.S.; Xu, B.S.; Li, W. Study of mining roof abutment pressure distribution law. Rock Soil Mech. 2010, 31, 1309–1313. [Google Scholar]
- Wang, Y.; Yang, W.L.; Deng, J.; Wu, B.L.; Li, Z.Y.; Wang, M.Z. Accumulation system of cohabitating muti-energy minerals and their comprehensive exploration in sedimentary basin—A case study of Ordos basin, NW China. Acta Geol. Sin. 2014, 88, 815–824. [Google Scholar]


| Water Pressure in P01/Mpa | Injection Time/min | Water Flow in P02/m3 |
|---|---|---|
| 0–1 | 15 | 0.101 |
| 1–2 | 15 | 0.132 |
| 2–4 | 15 | 0.227 |
| 4–4.5 | 15 | 0.413 |
| 4.5–5 | 15 | 0.682 |
| Water Pressure in P03/Mpa | Injection Time/min | Water Flow in P02/m3 |
|---|---|---|
| 0–2 | 15 | 0.110 |
| 2–4 | 15 | 0.152 |
| 4–4.5 | 15 | 0.235 |
| 4.5–5 | 15 | 0.416 |
| 5–5.2 | 15 | 0.635 |
| E0/GPa | μ | e | a | ψ/° | c’/MPa | φ’/° | pw/MPa | k0(k1)/ms−1 | k2/ms−1 | α | n/% | A1 | A2 | B1 | B2 |
|---|---|---|---|---|---|---|---|---|---|---|---|---|---|---|---|
| 20.40 | 0.26 | 0.667 | 0.0106 | 23 | 25.2 | 32 | 3.5 | 1.98 × 10⁻¹² | 4.56 × 10⁻⁹ | 0.76 | 3.1 | 7.62 | 0.3 | 6.17 | 0.54 |
| E0/GPa | μ | e | a | ψ/° | c’/MPa | φ’/° | pw/MPa | k0(k1)/ms−1 | k2/ms−1 | α | n/% | A1 | A2 | B1 | B2 | |
|---|---|---|---|---|---|---|---|---|---|---|---|---|---|---|---|---|
| Coal | 1.52 | 0.25 | 0.667 | 0.11 | 20 | 10.2 | 23 | 0 | 9.73 × 10⁻¹² | 7.17 × 10⁻⁹ | 0.01 | 3.0 | 4.12 | 0.21 | 4.83 | 0.37 |
| Mudstone | 1.31 | 0.32 | 0.667 | 0.15 | 17 | 4.7 | 21 | 0 | 3.62 × 10⁻¹² | 6.18 × 10⁻⁹ | 0.01 | 2.5 | 3.16 | 0.12 | 2.23 | 0.20 |
| Sandstone | 8.73 | 0.26 | 0.667 | 0.010 | 22 | 15.2 | 28 | 0 | 9.37 × 10⁻¹⁰ | 1.04 × 10⁻⁷ | 0.80 | 8 | 7.82 | 0.33 | 6.06 | 0.74 |
| Limestone | 16.7 | 0.22 | 0.667 | 0.007 | 28 | 18.7 | 35 | 3.0/3.3/7.0 | 1.05 × 10⁻⁹ | 9.25 × 10⁻⁶ | 0.85 | 8.3 | 9.31 | 0.45 | 7.57 | 0.82 |
| Upper X1 | 1.03 | 0.25 | 0.667 | 0.12 | 20 | 5.3 | 26 | 2.0 | 4.76 × 10⁻⁹ | 3.24 × 10⁻⁶ | 0.88 | 7.2 | 2.86 | 0.14 | 2.16 | 0.30 |
| Middle X1 | 0.95 | 0.30 | 0.667 | 0.15 | 18 | 3.0 | 23 | 3.3 | 8.5 × 10⁻⁹ | 7.18 × 10⁻⁶ | 0.91 | 8.5 | 3.58 | 0.20 | 2.54 | 0.25 |
| Lower X1 | 0.78 | 0.32 | 0.667 | 0.22 | 12 | 2.1 | 18 | 7.0 | 4.36 × 10⁻⁸ | 8.23 × 10⁻⁵ | 0.97 | 9.6 | 4.64 | 0.37 | 3.66 | 0.28 |
© 2017 by the authors. Licensee MDPI, Basel, Switzerland. This article is an open access article distributed under the terms and conditions of the Creative Commons Attribution (CC BY) license (http://creativecommons.org/licenses/by/4.0/).
Share and Cite
Li, H.; Bai, H.; Wu, J.; Ma, Z.; Ma, K.; Wu, G.; Du, Y.; He, S. A Cascade Disaster Caused by Geological and Coupled Hydro-Mechanical Factors—Water Inrush Mechanism from Karst Collapse Column under Confining Pressure. Energies 2017, 10, 1938. https://doi.org/10.3390/en10121938
Li H, Bai H, Wu J, Ma Z, Ma K, Wu G, Du Y, He S. A Cascade Disaster Caused by Geological and Coupled Hydro-Mechanical Factors—Water Inrush Mechanism from Karst Collapse Column under Confining Pressure. Energies. 2017; 10(12):1938. https://doi.org/10.3390/en10121938
Chicago/Turabian StyleLi, Hao, Haibo Bai, Jianjun Wu, Zhanguo Ma, Kai Ma, Guangming Wu, Yabo Du, and Shixin He. 2017. "A Cascade Disaster Caused by Geological and Coupled Hydro-Mechanical Factors—Water Inrush Mechanism from Karst Collapse Column under Confining Pressure" Energies 10, no. 12: 1938. https://doi.org/10.3390/en10121938