
Pollutant Formation during the Occurrence of Flame Instabilities under Very-Lean Combustion Conditions in a Liquid-Fuel Burner

 , , ,
, , ,
Abstract
:1. Introduction
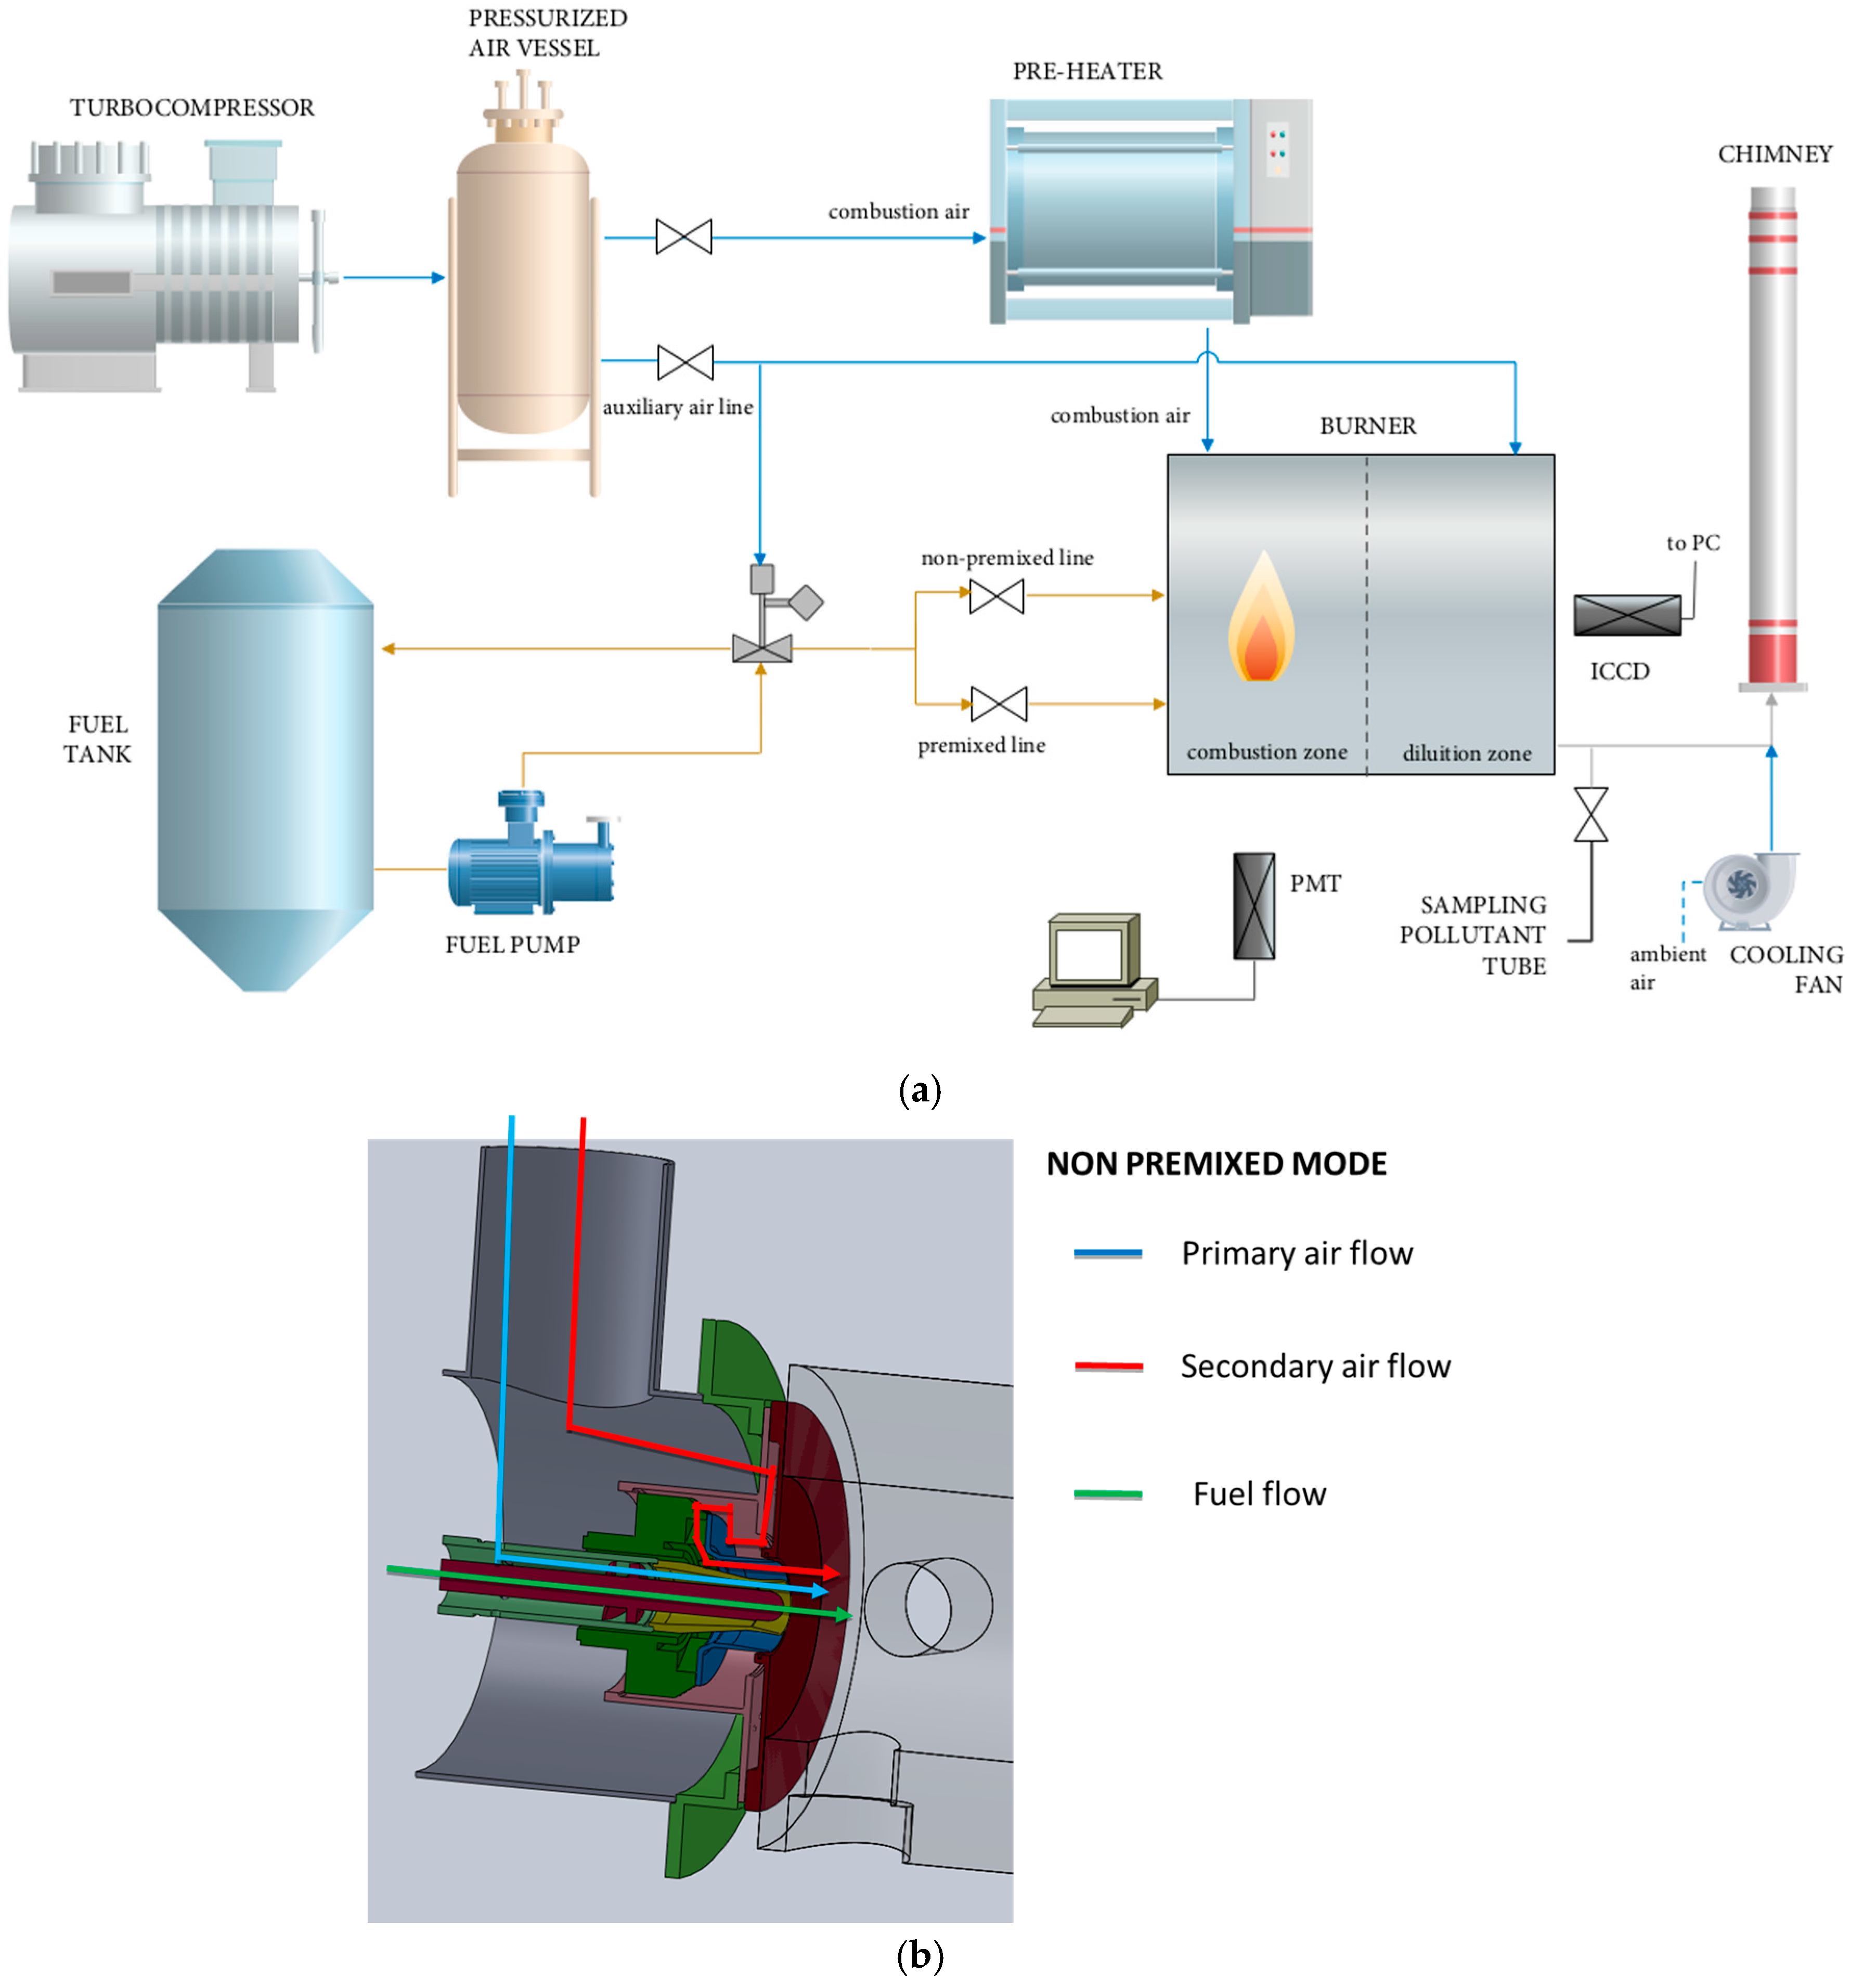
2. Experimental Set-Up
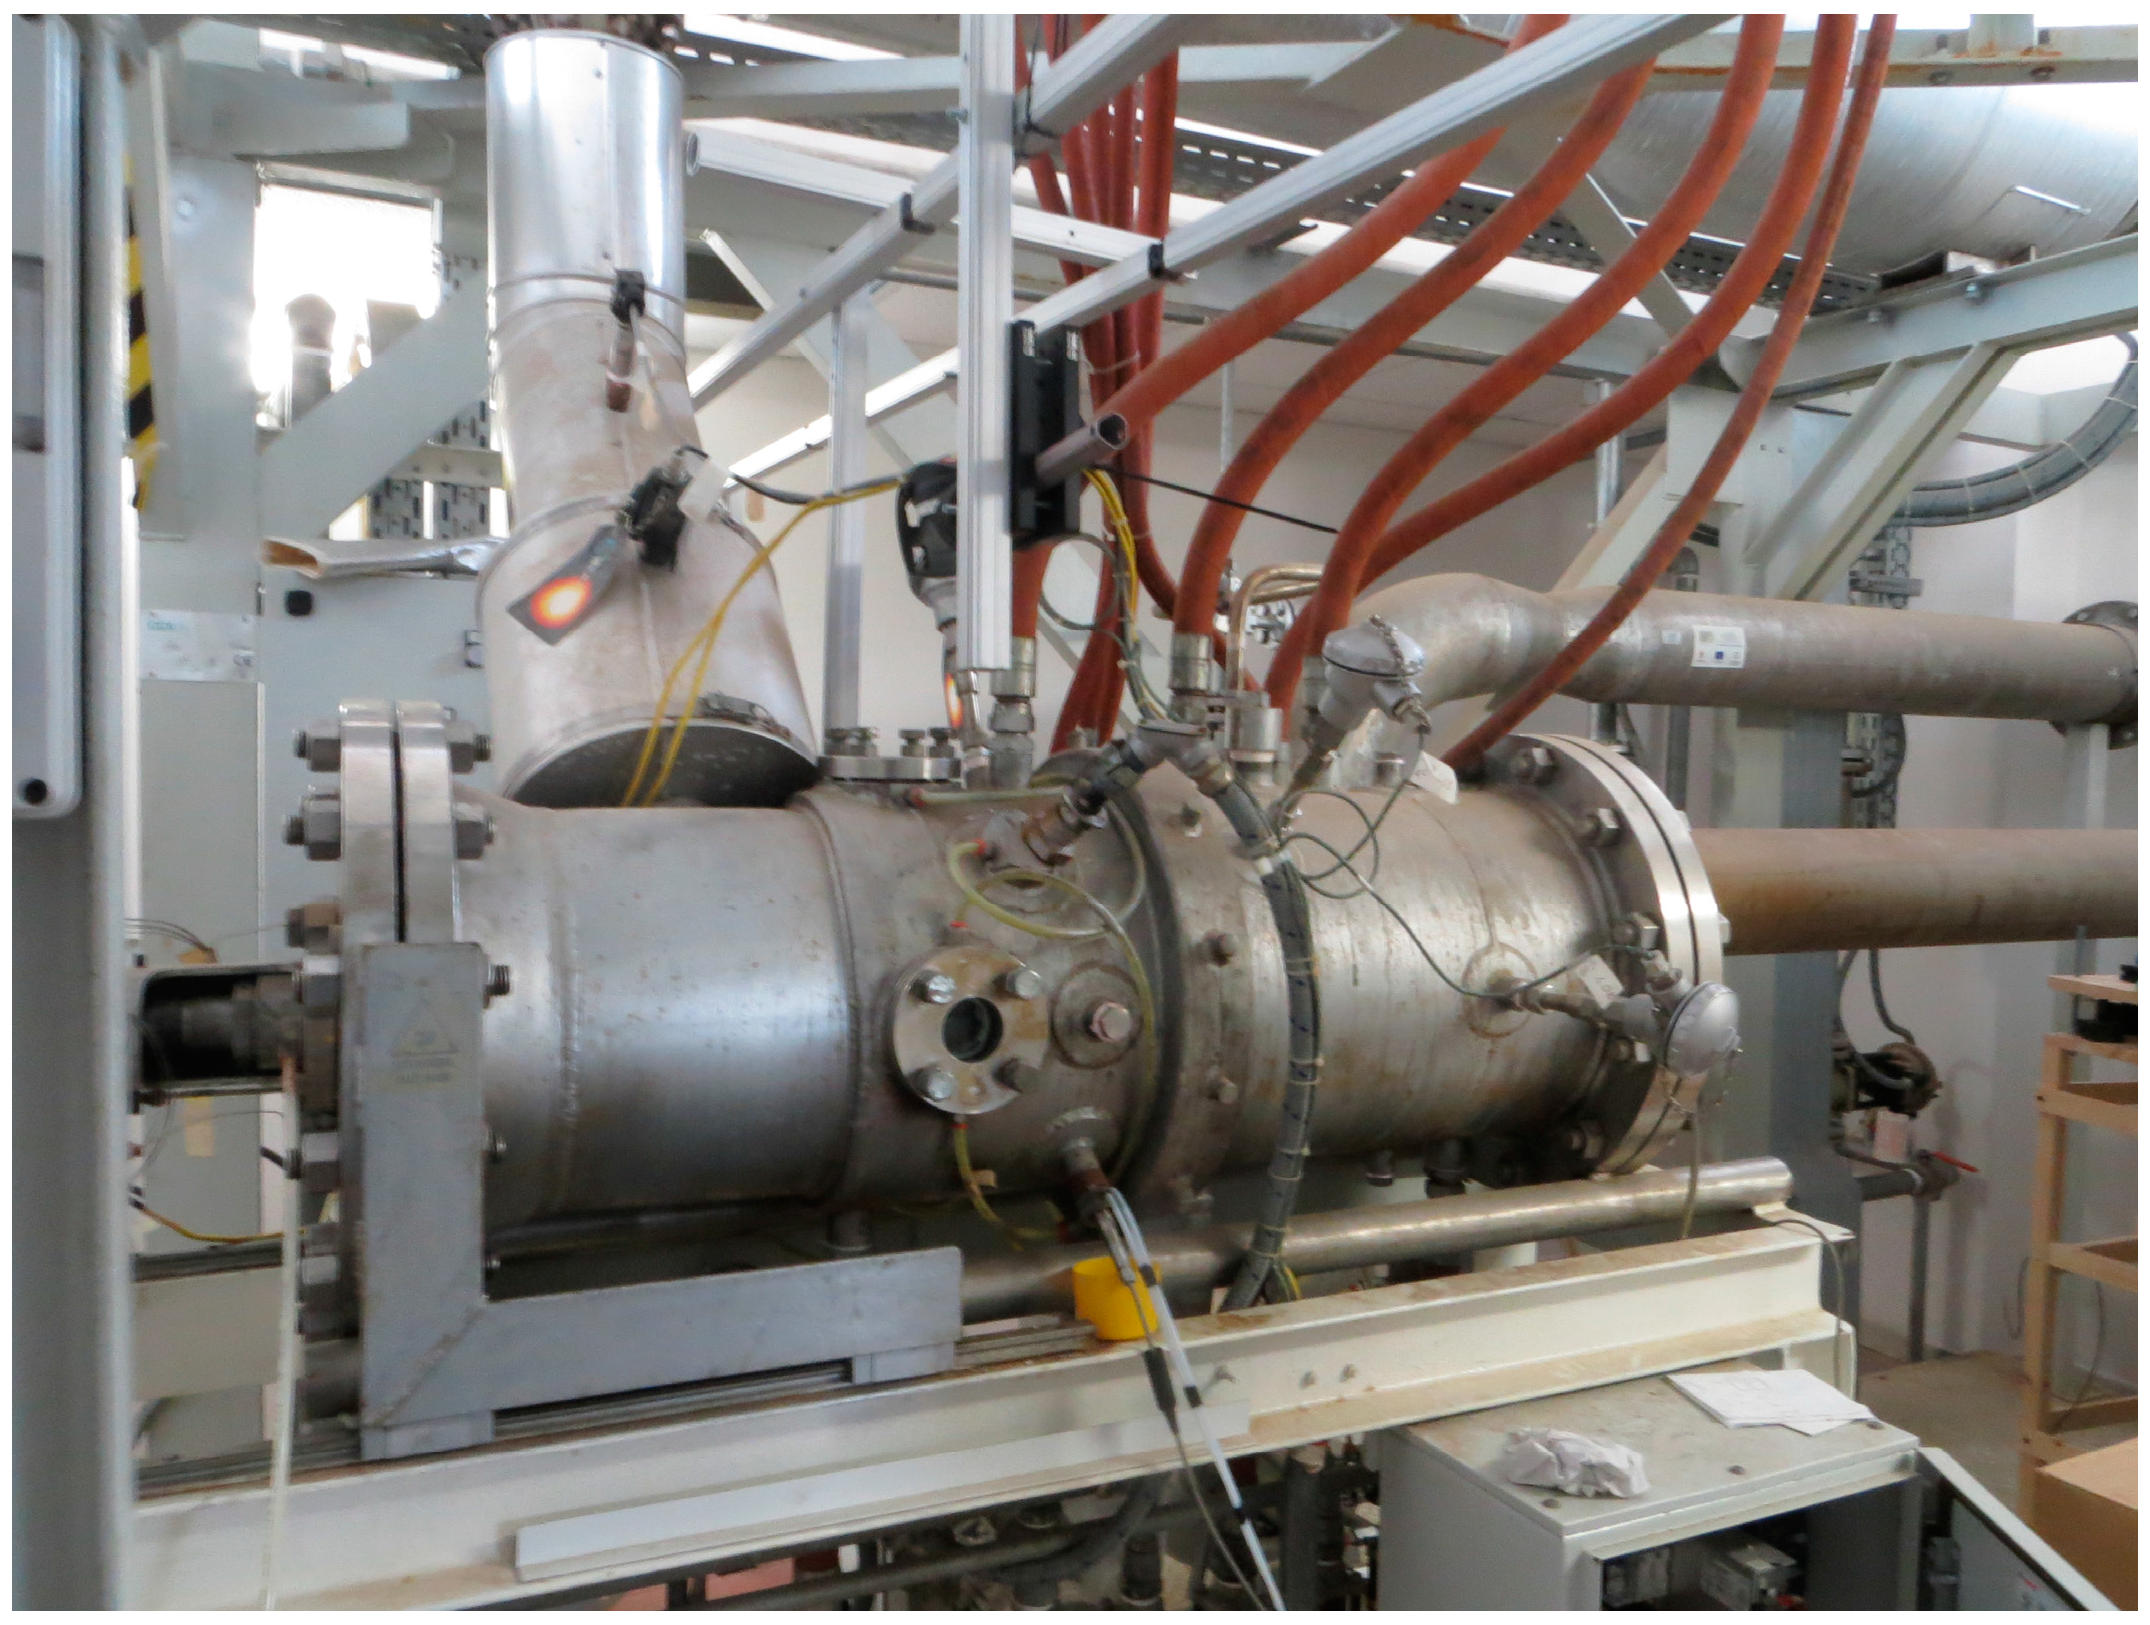
2.1. Combustor Facility and Flame Conditions
2.2. Chemiluminescence Data Acquisition and Processing
2.3. Gaseous Emissions Measurements
2.4. Particle Size Measurements: DMA SYSTEM and ELPI System
3. Experimental Results and Discussion
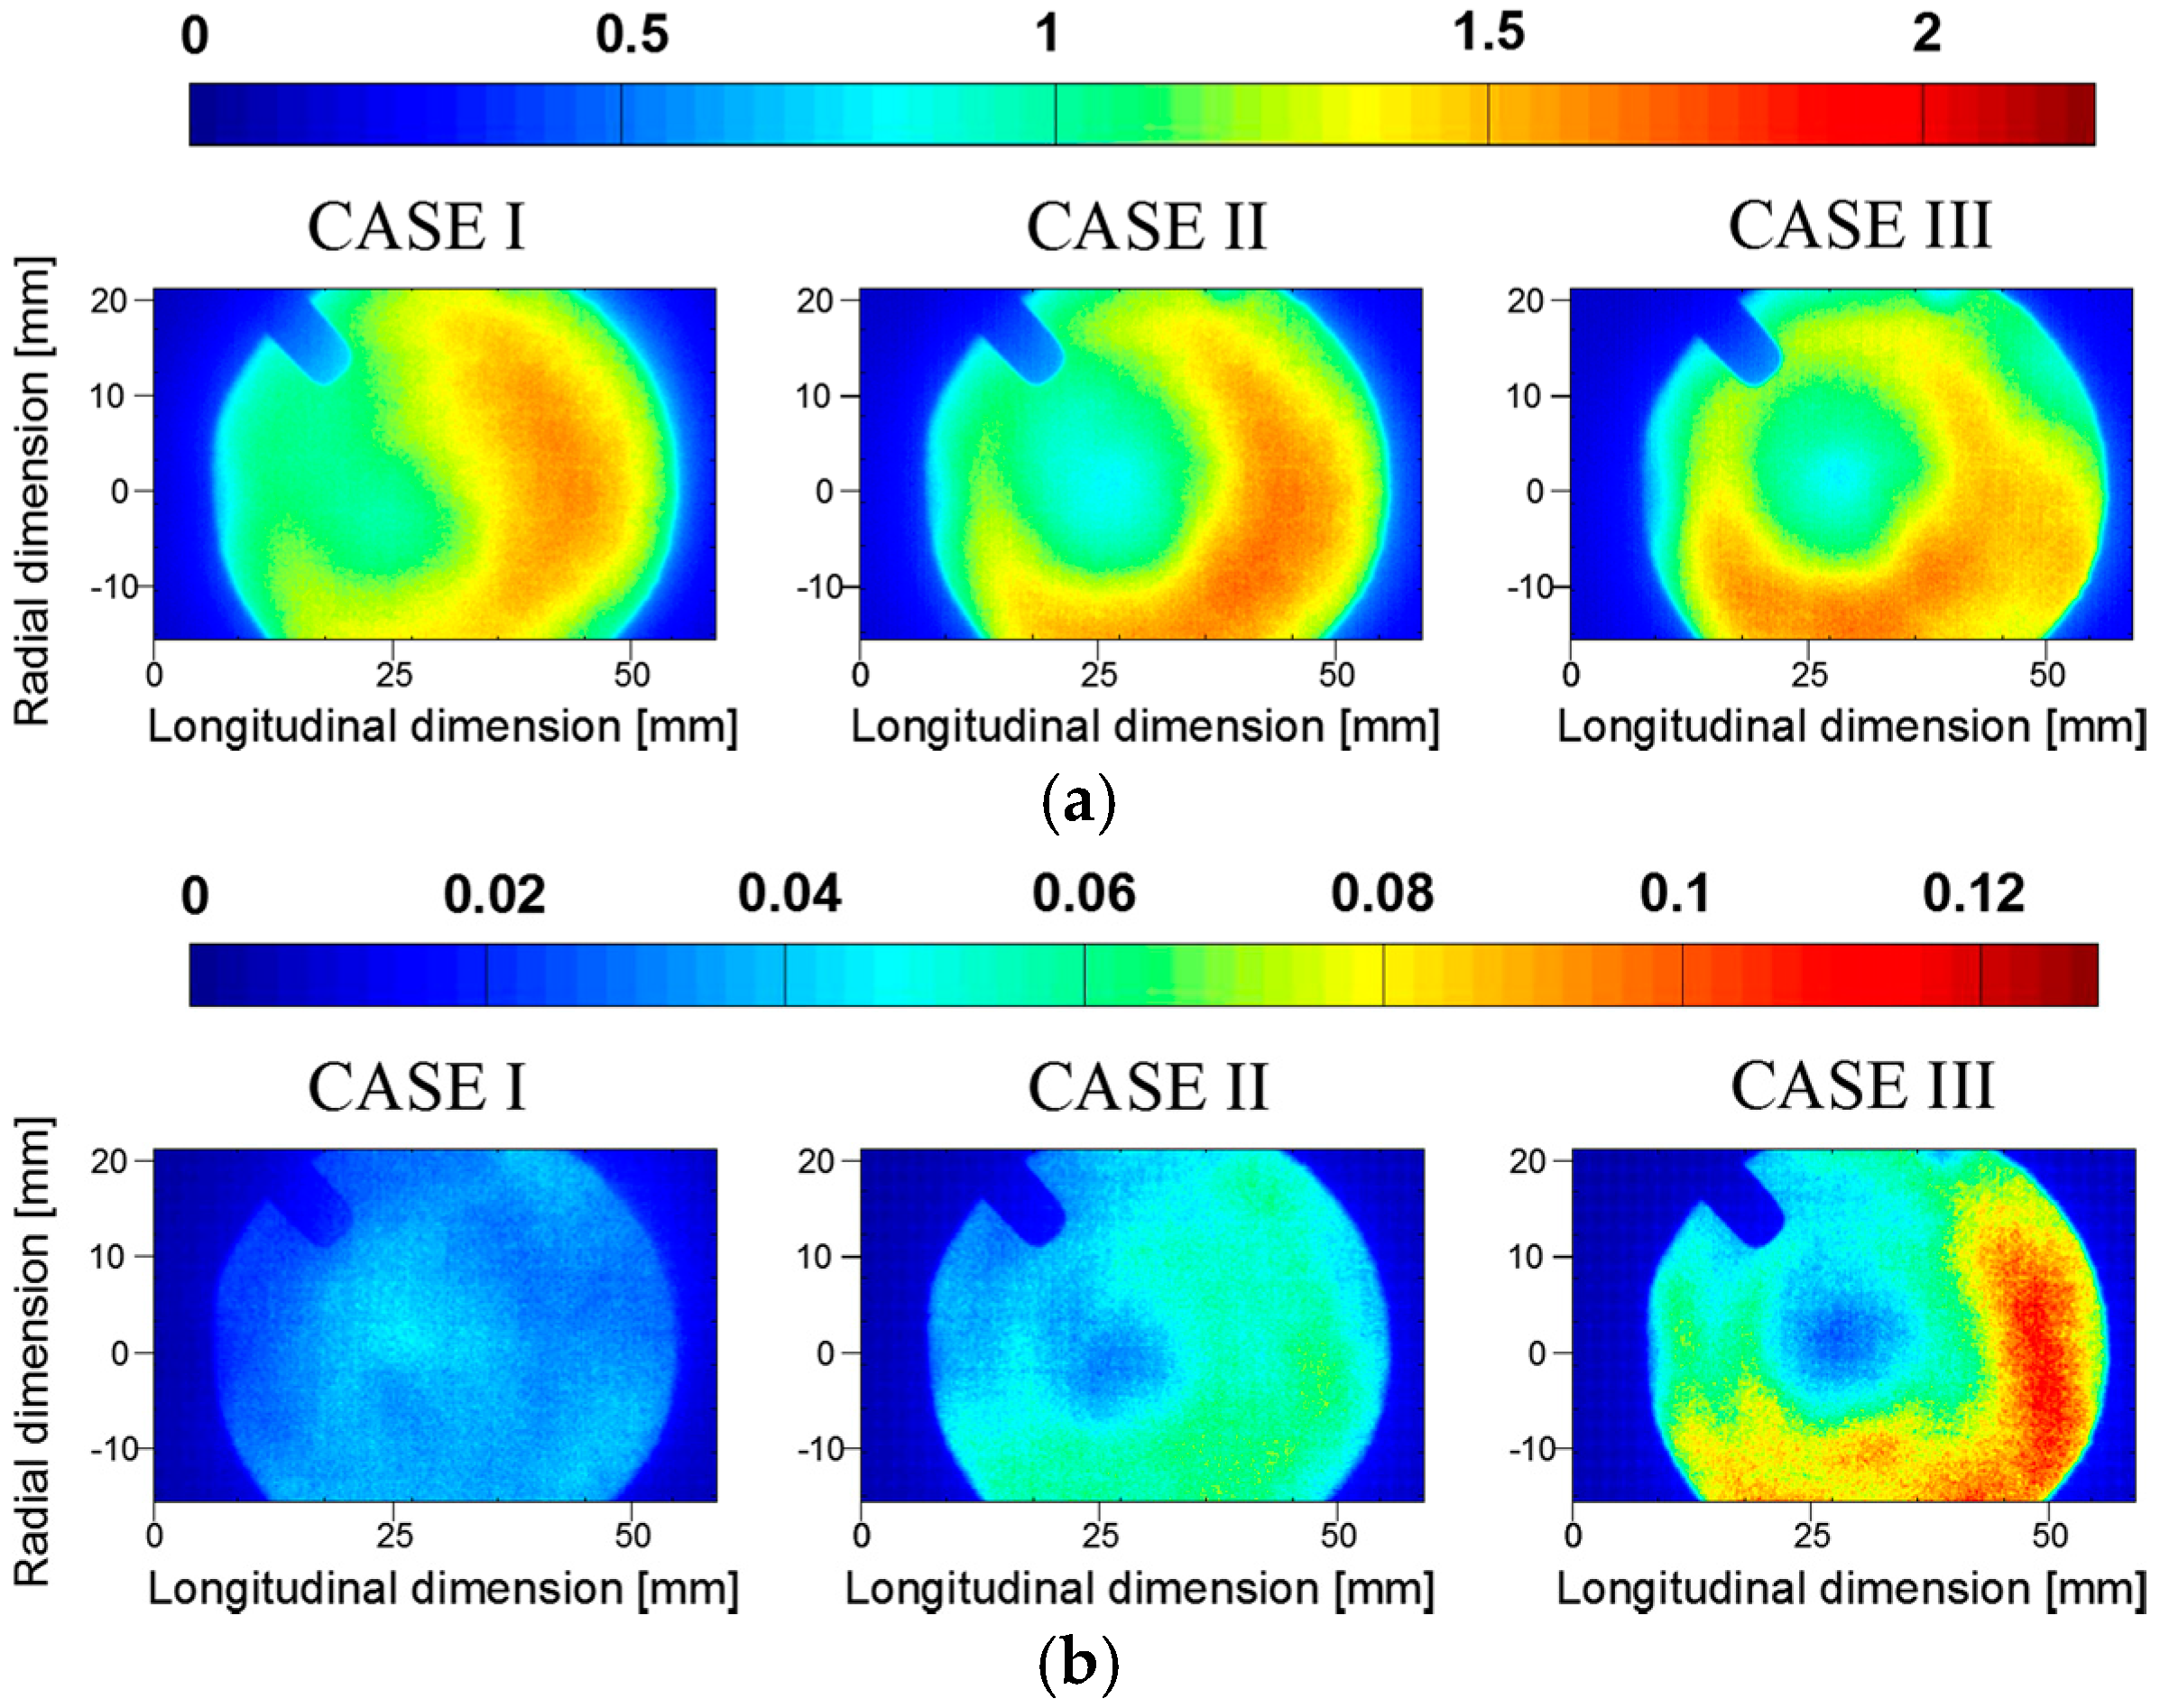
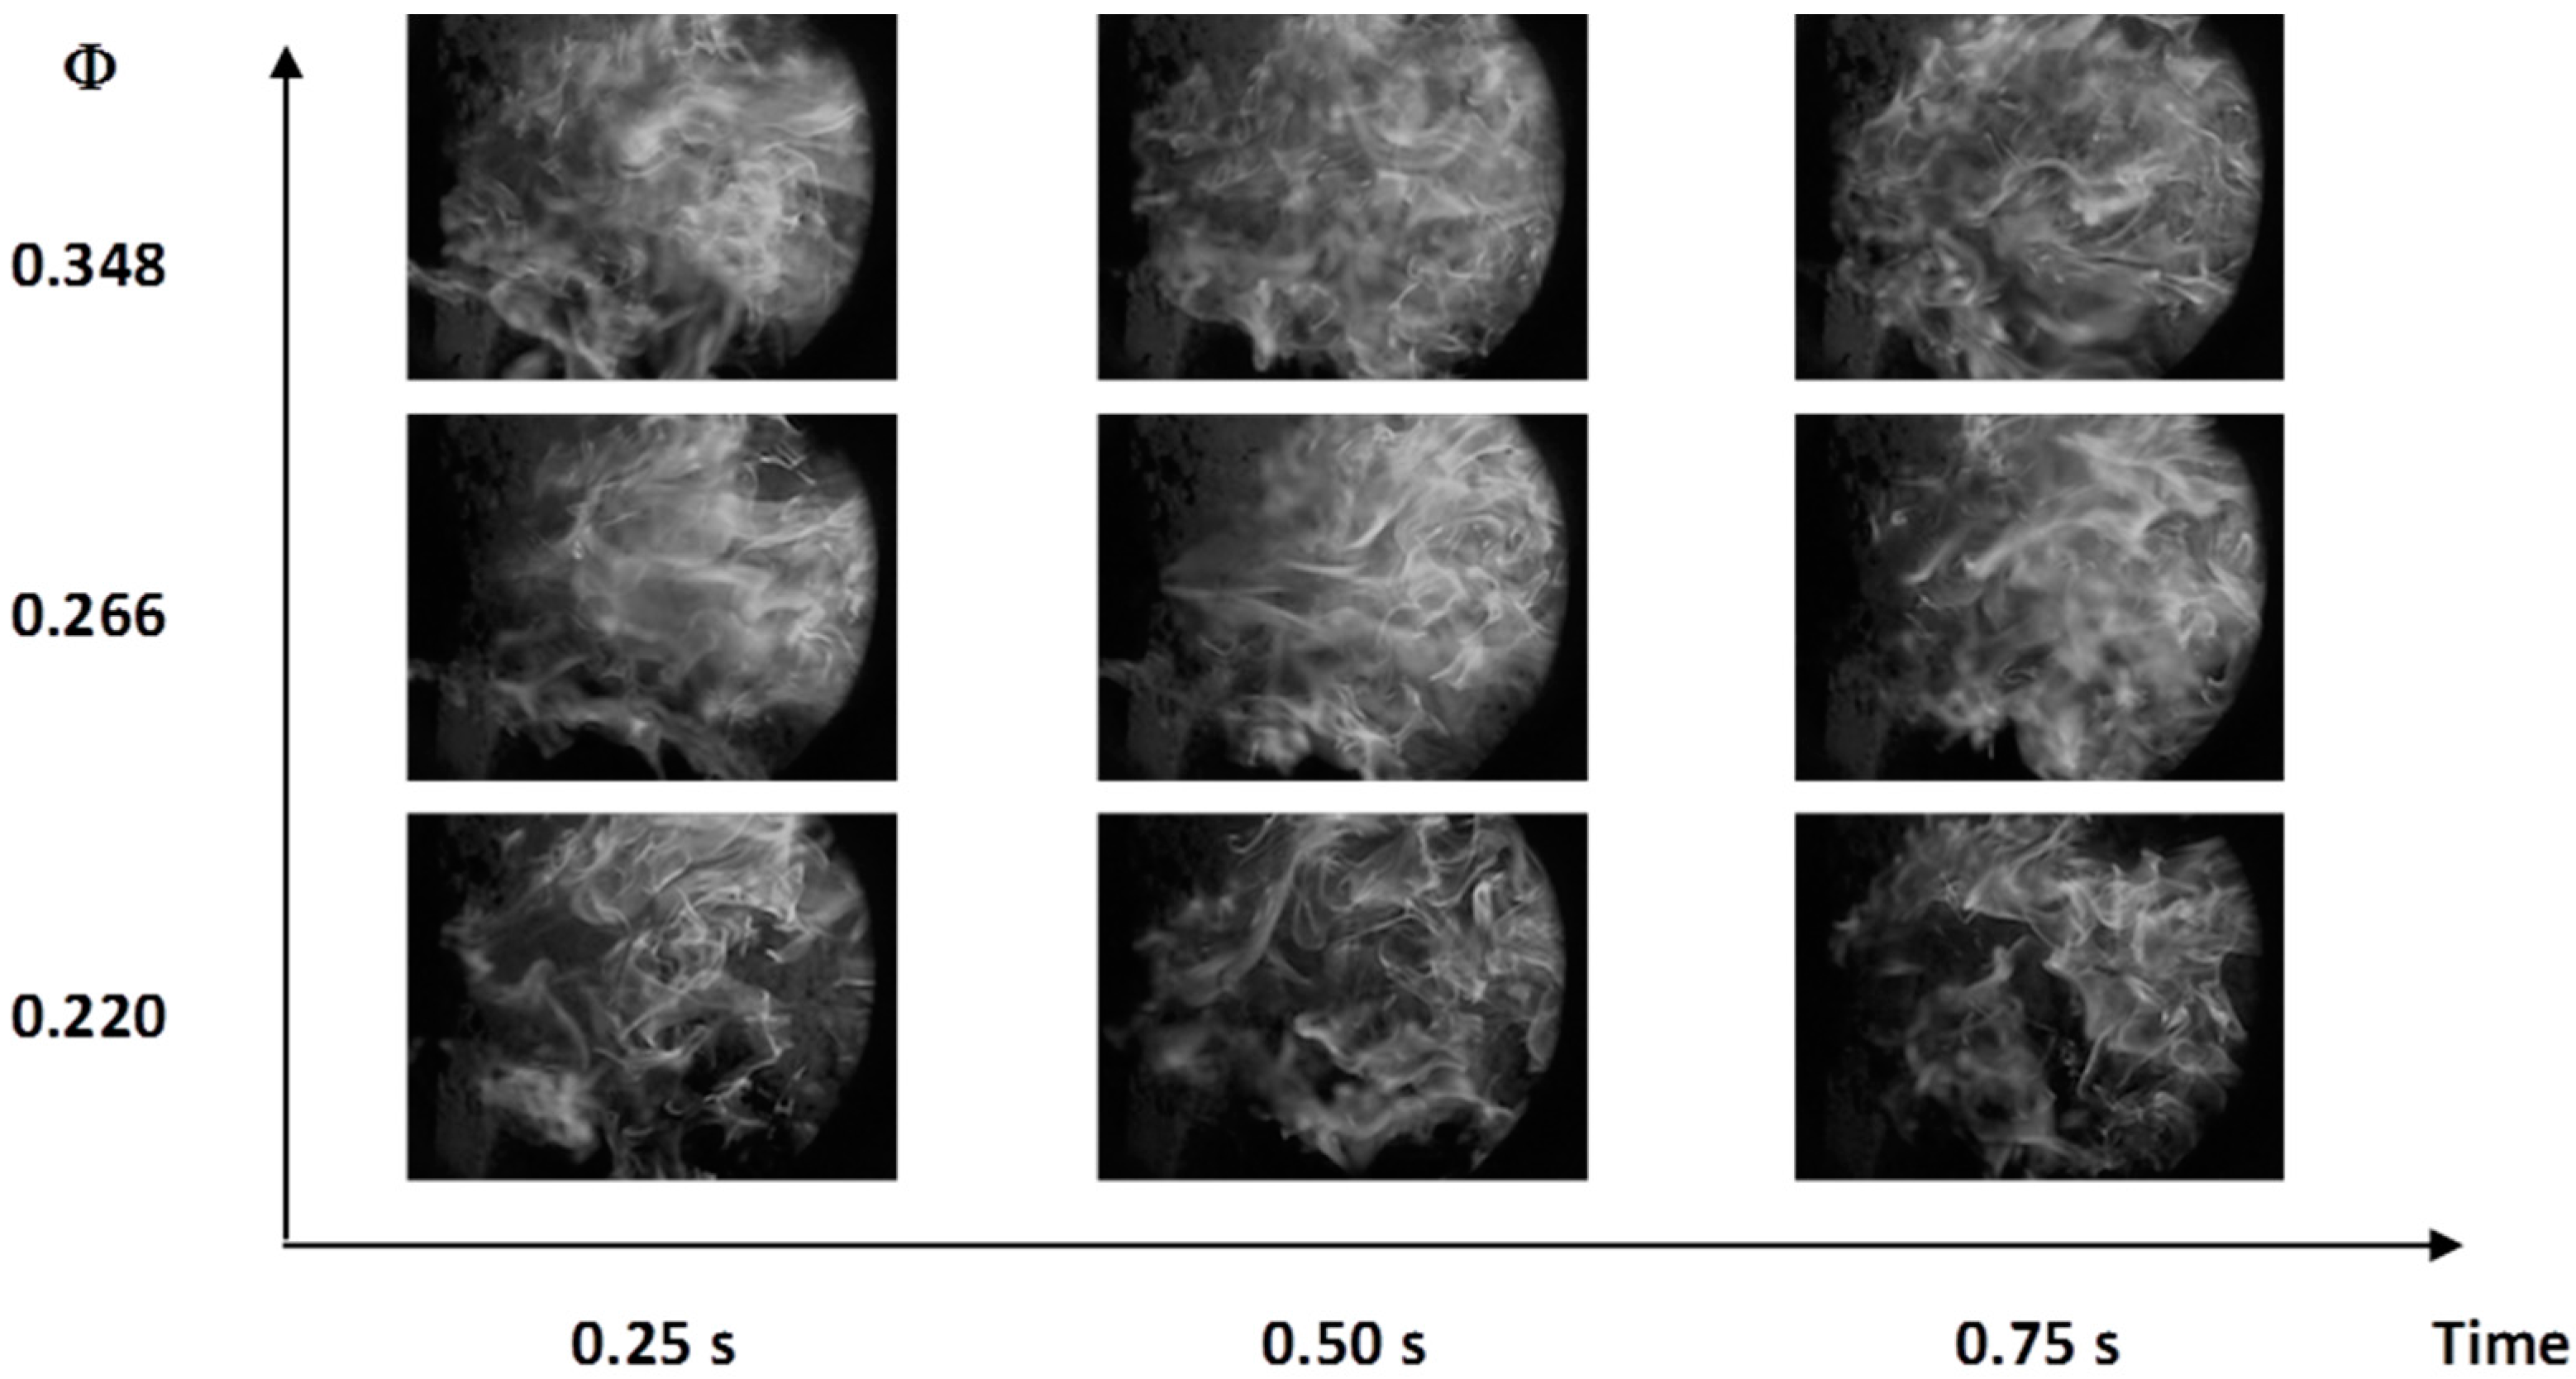
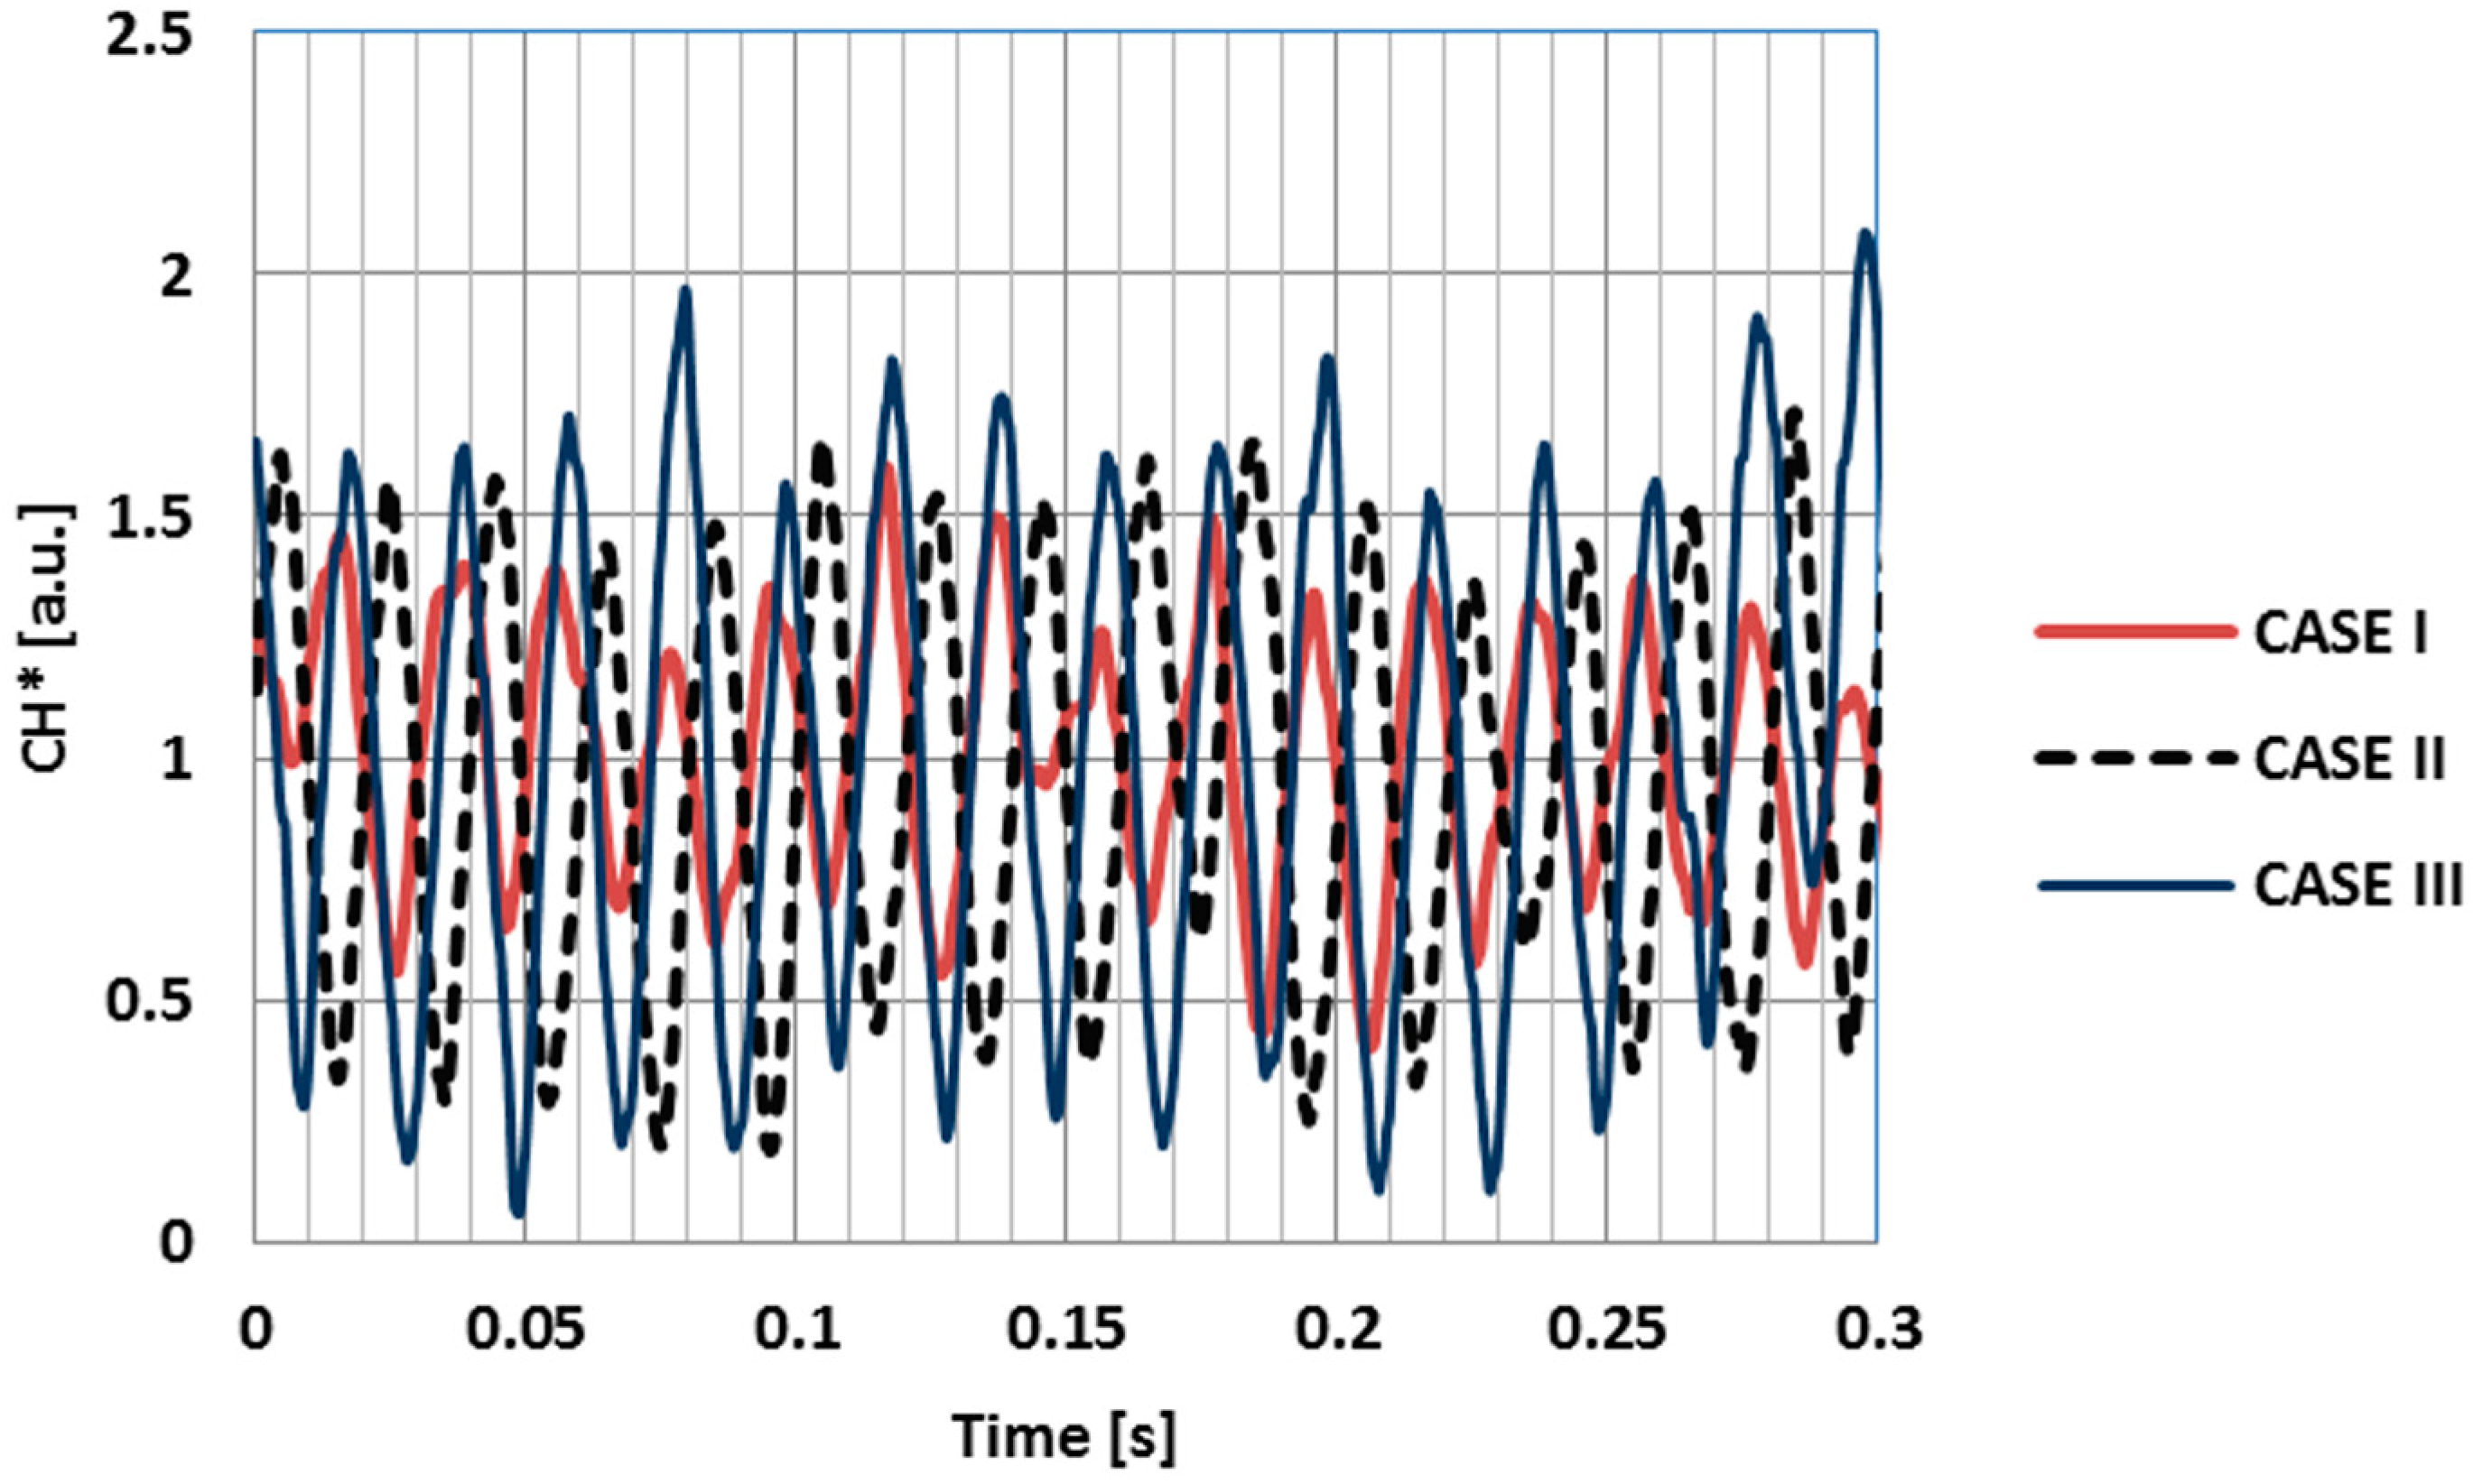
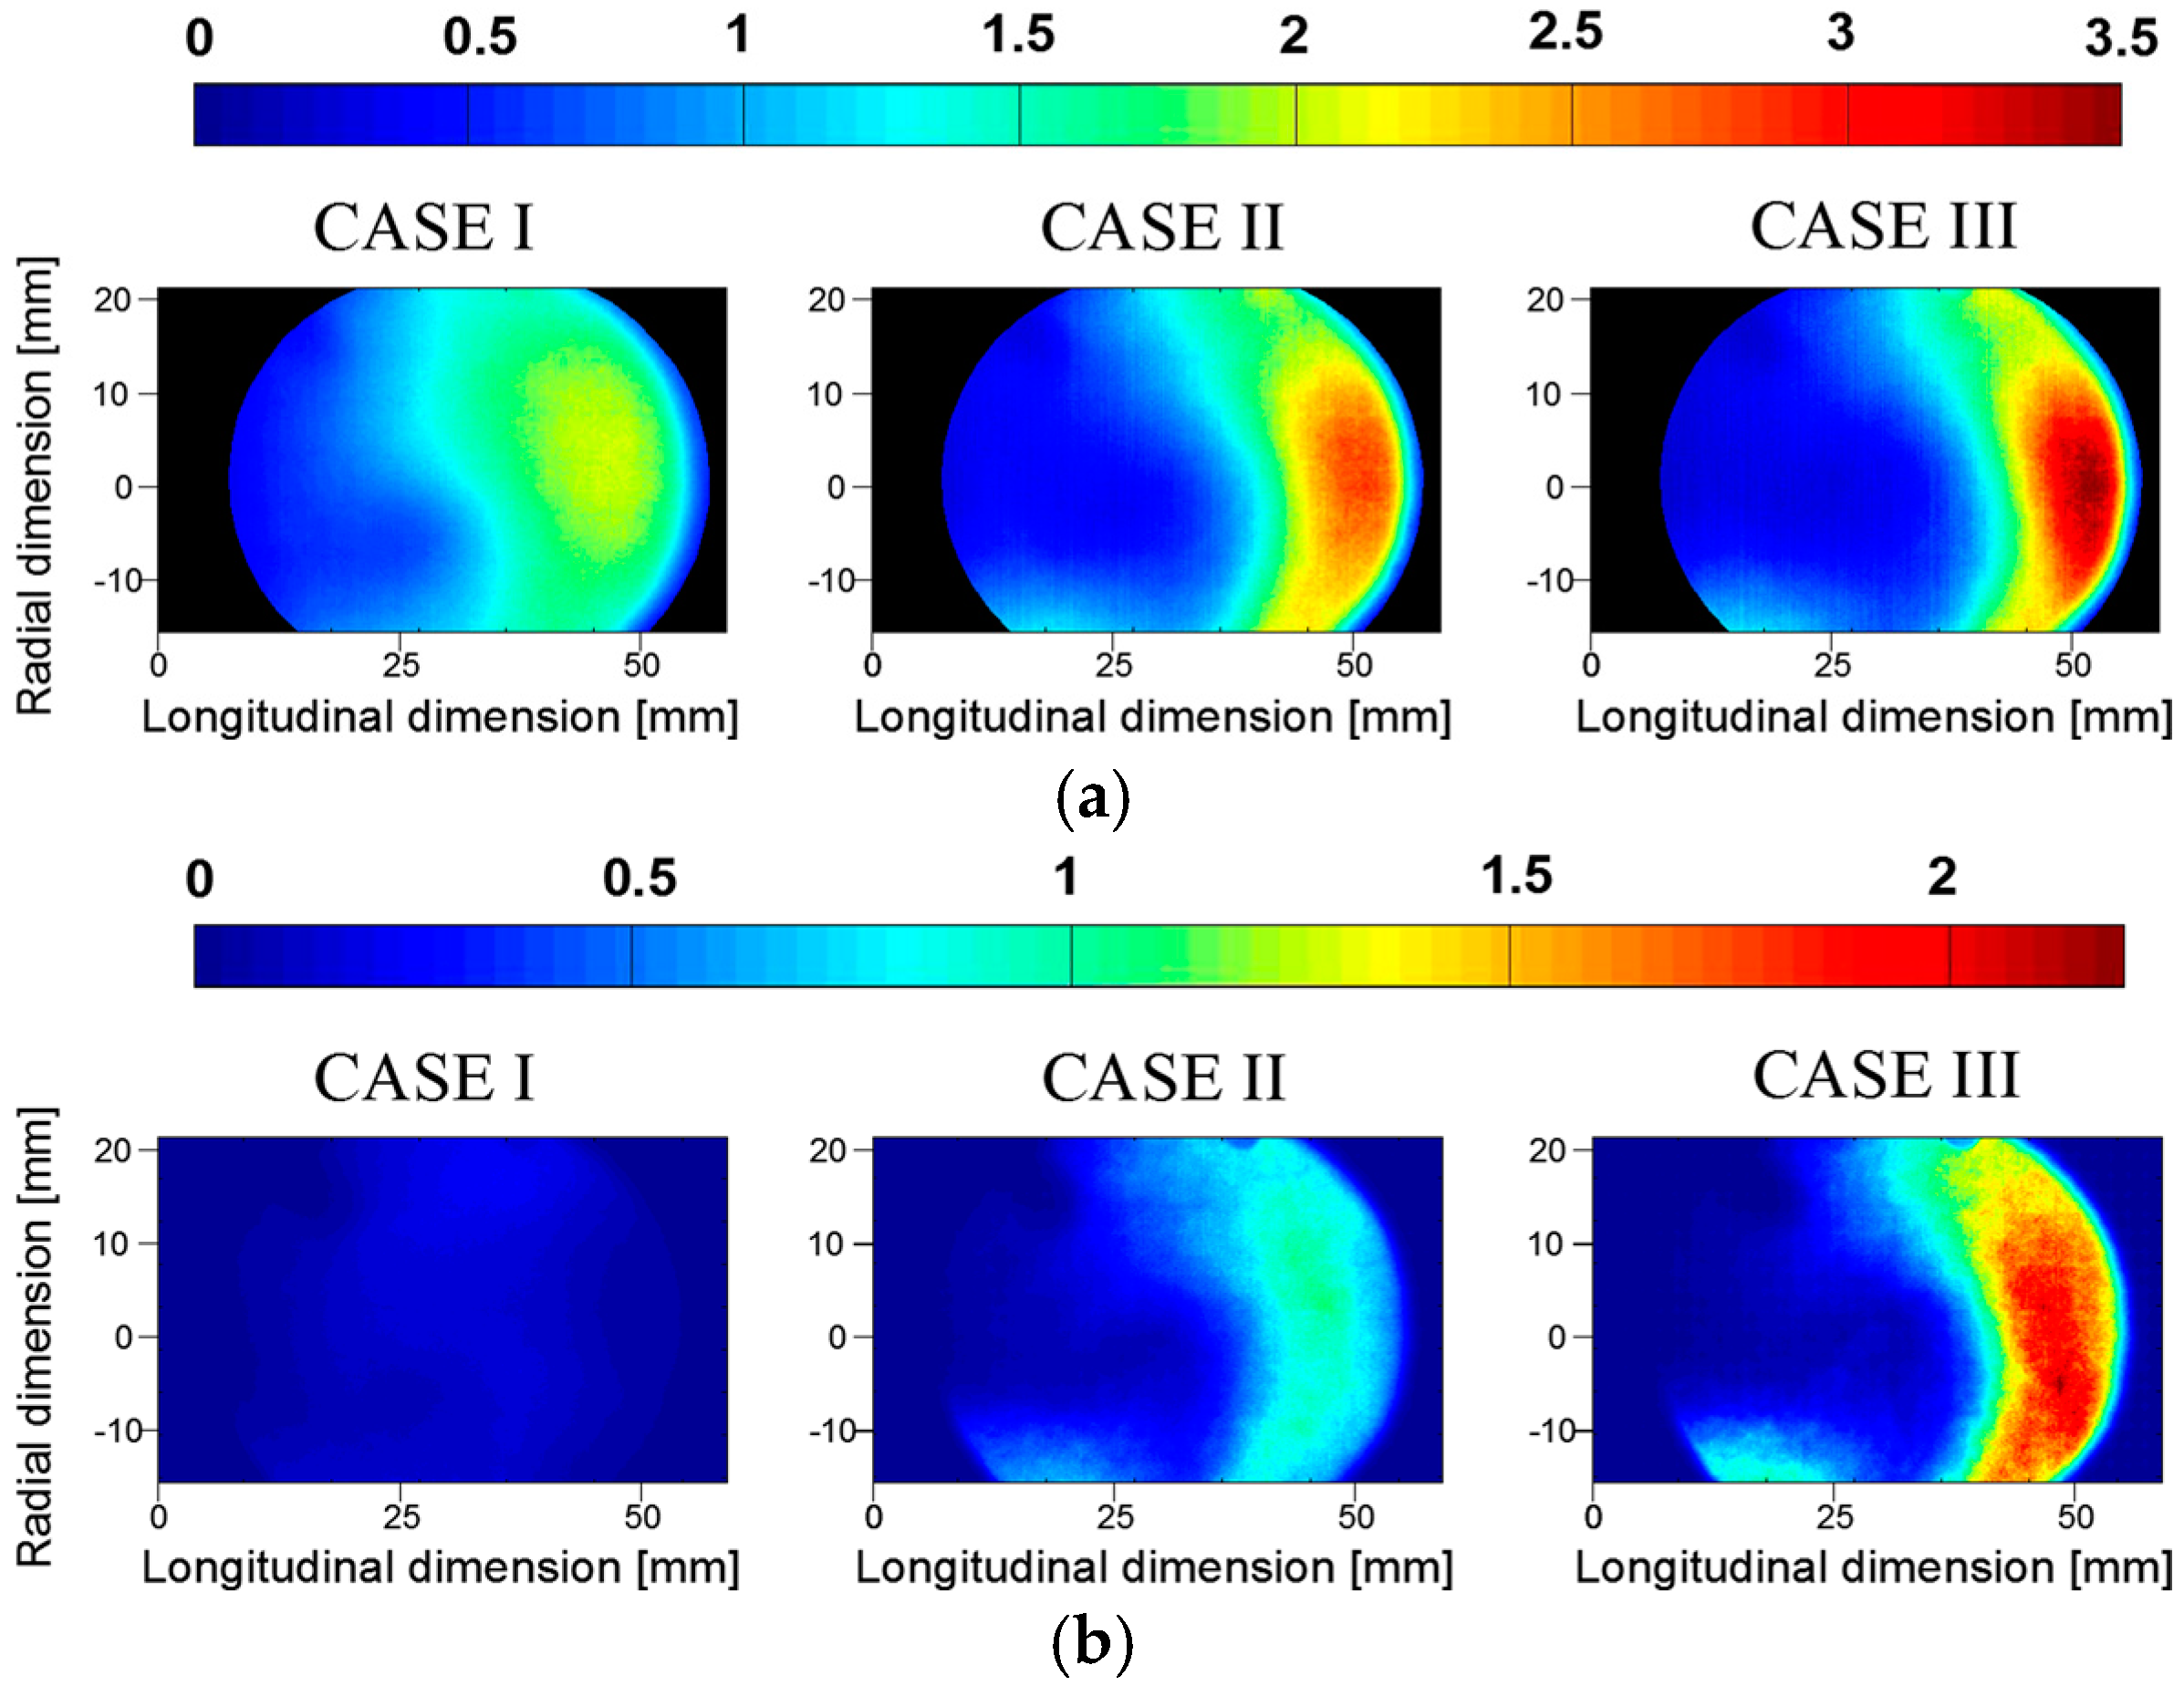
3.1. Flame Characterization and Instability Detection by Chemiluminescence
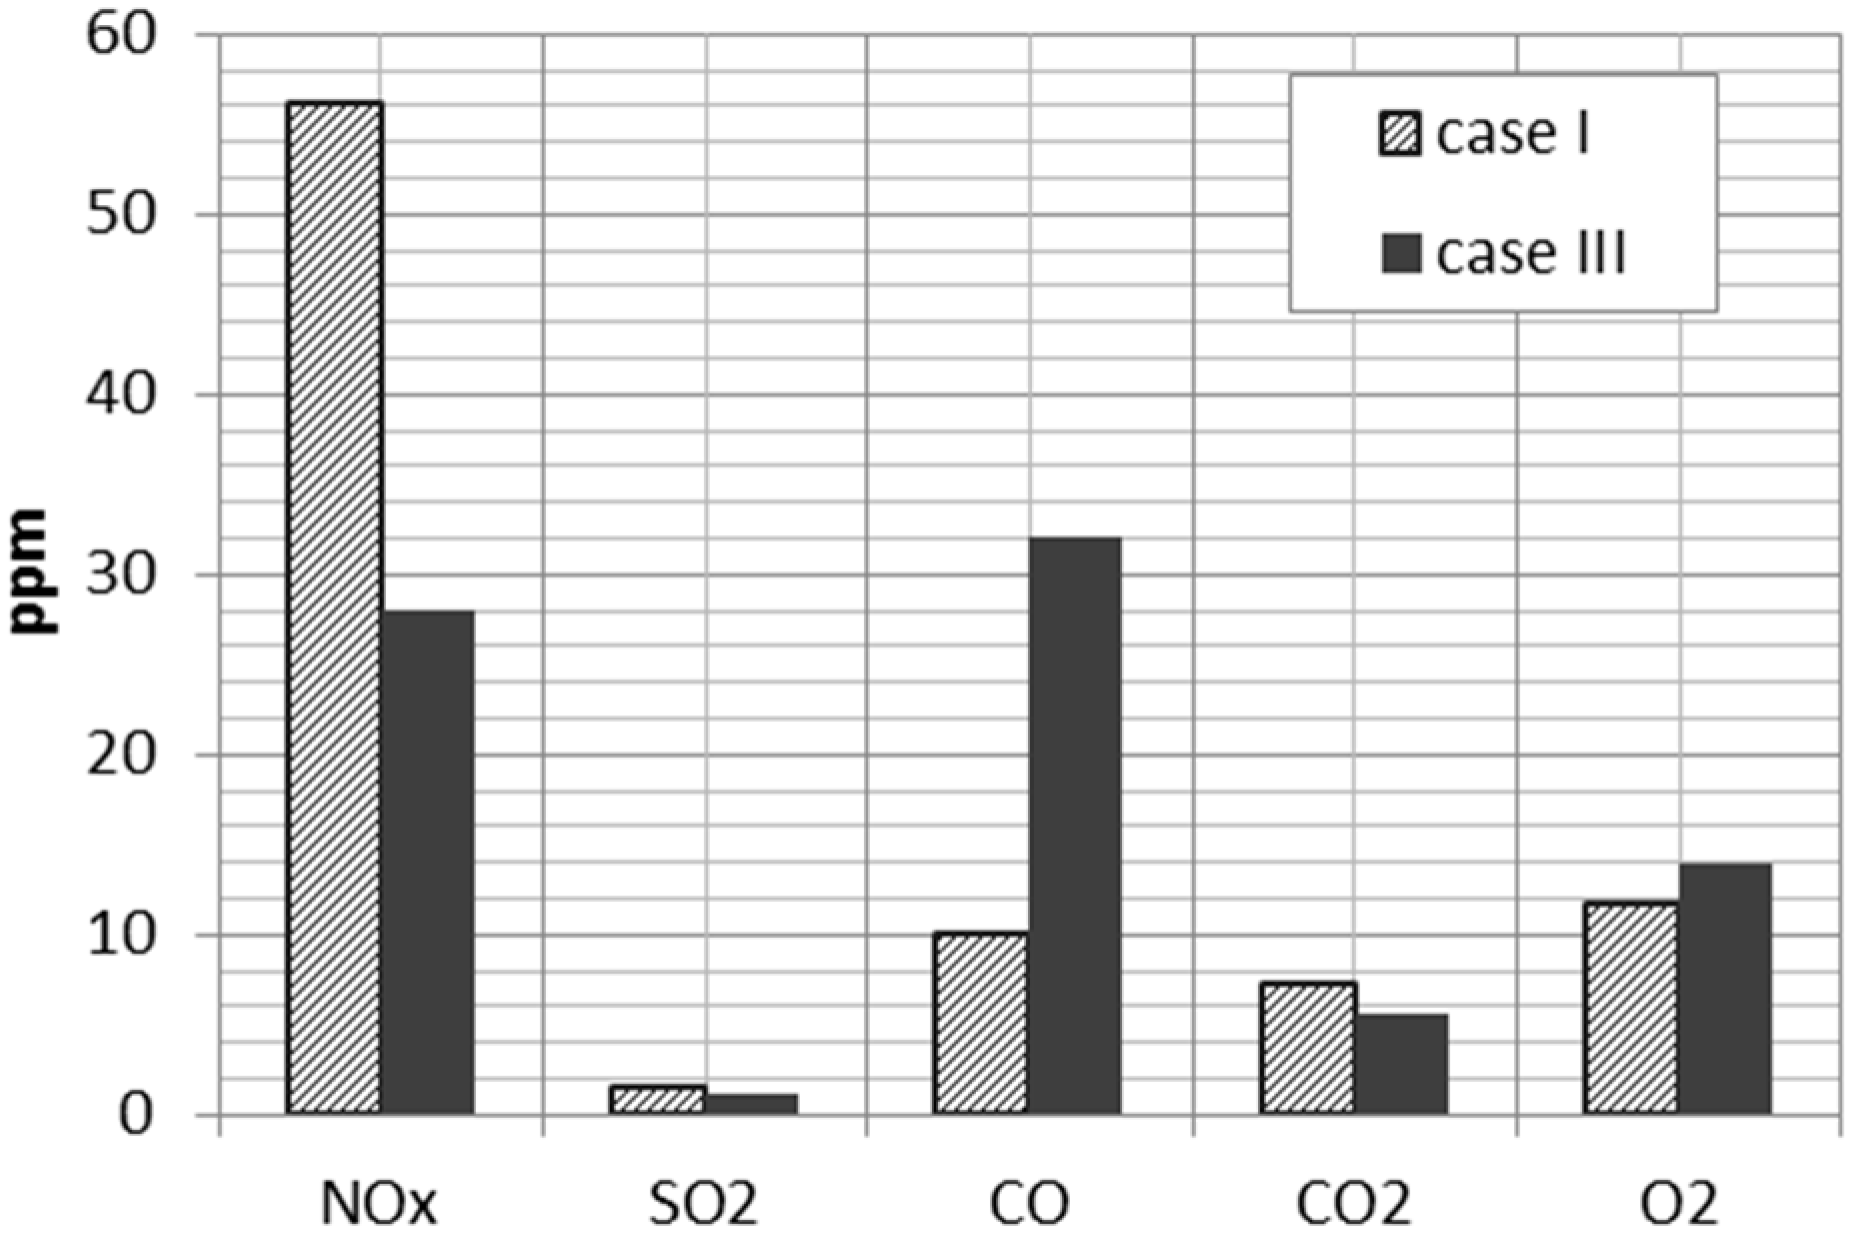
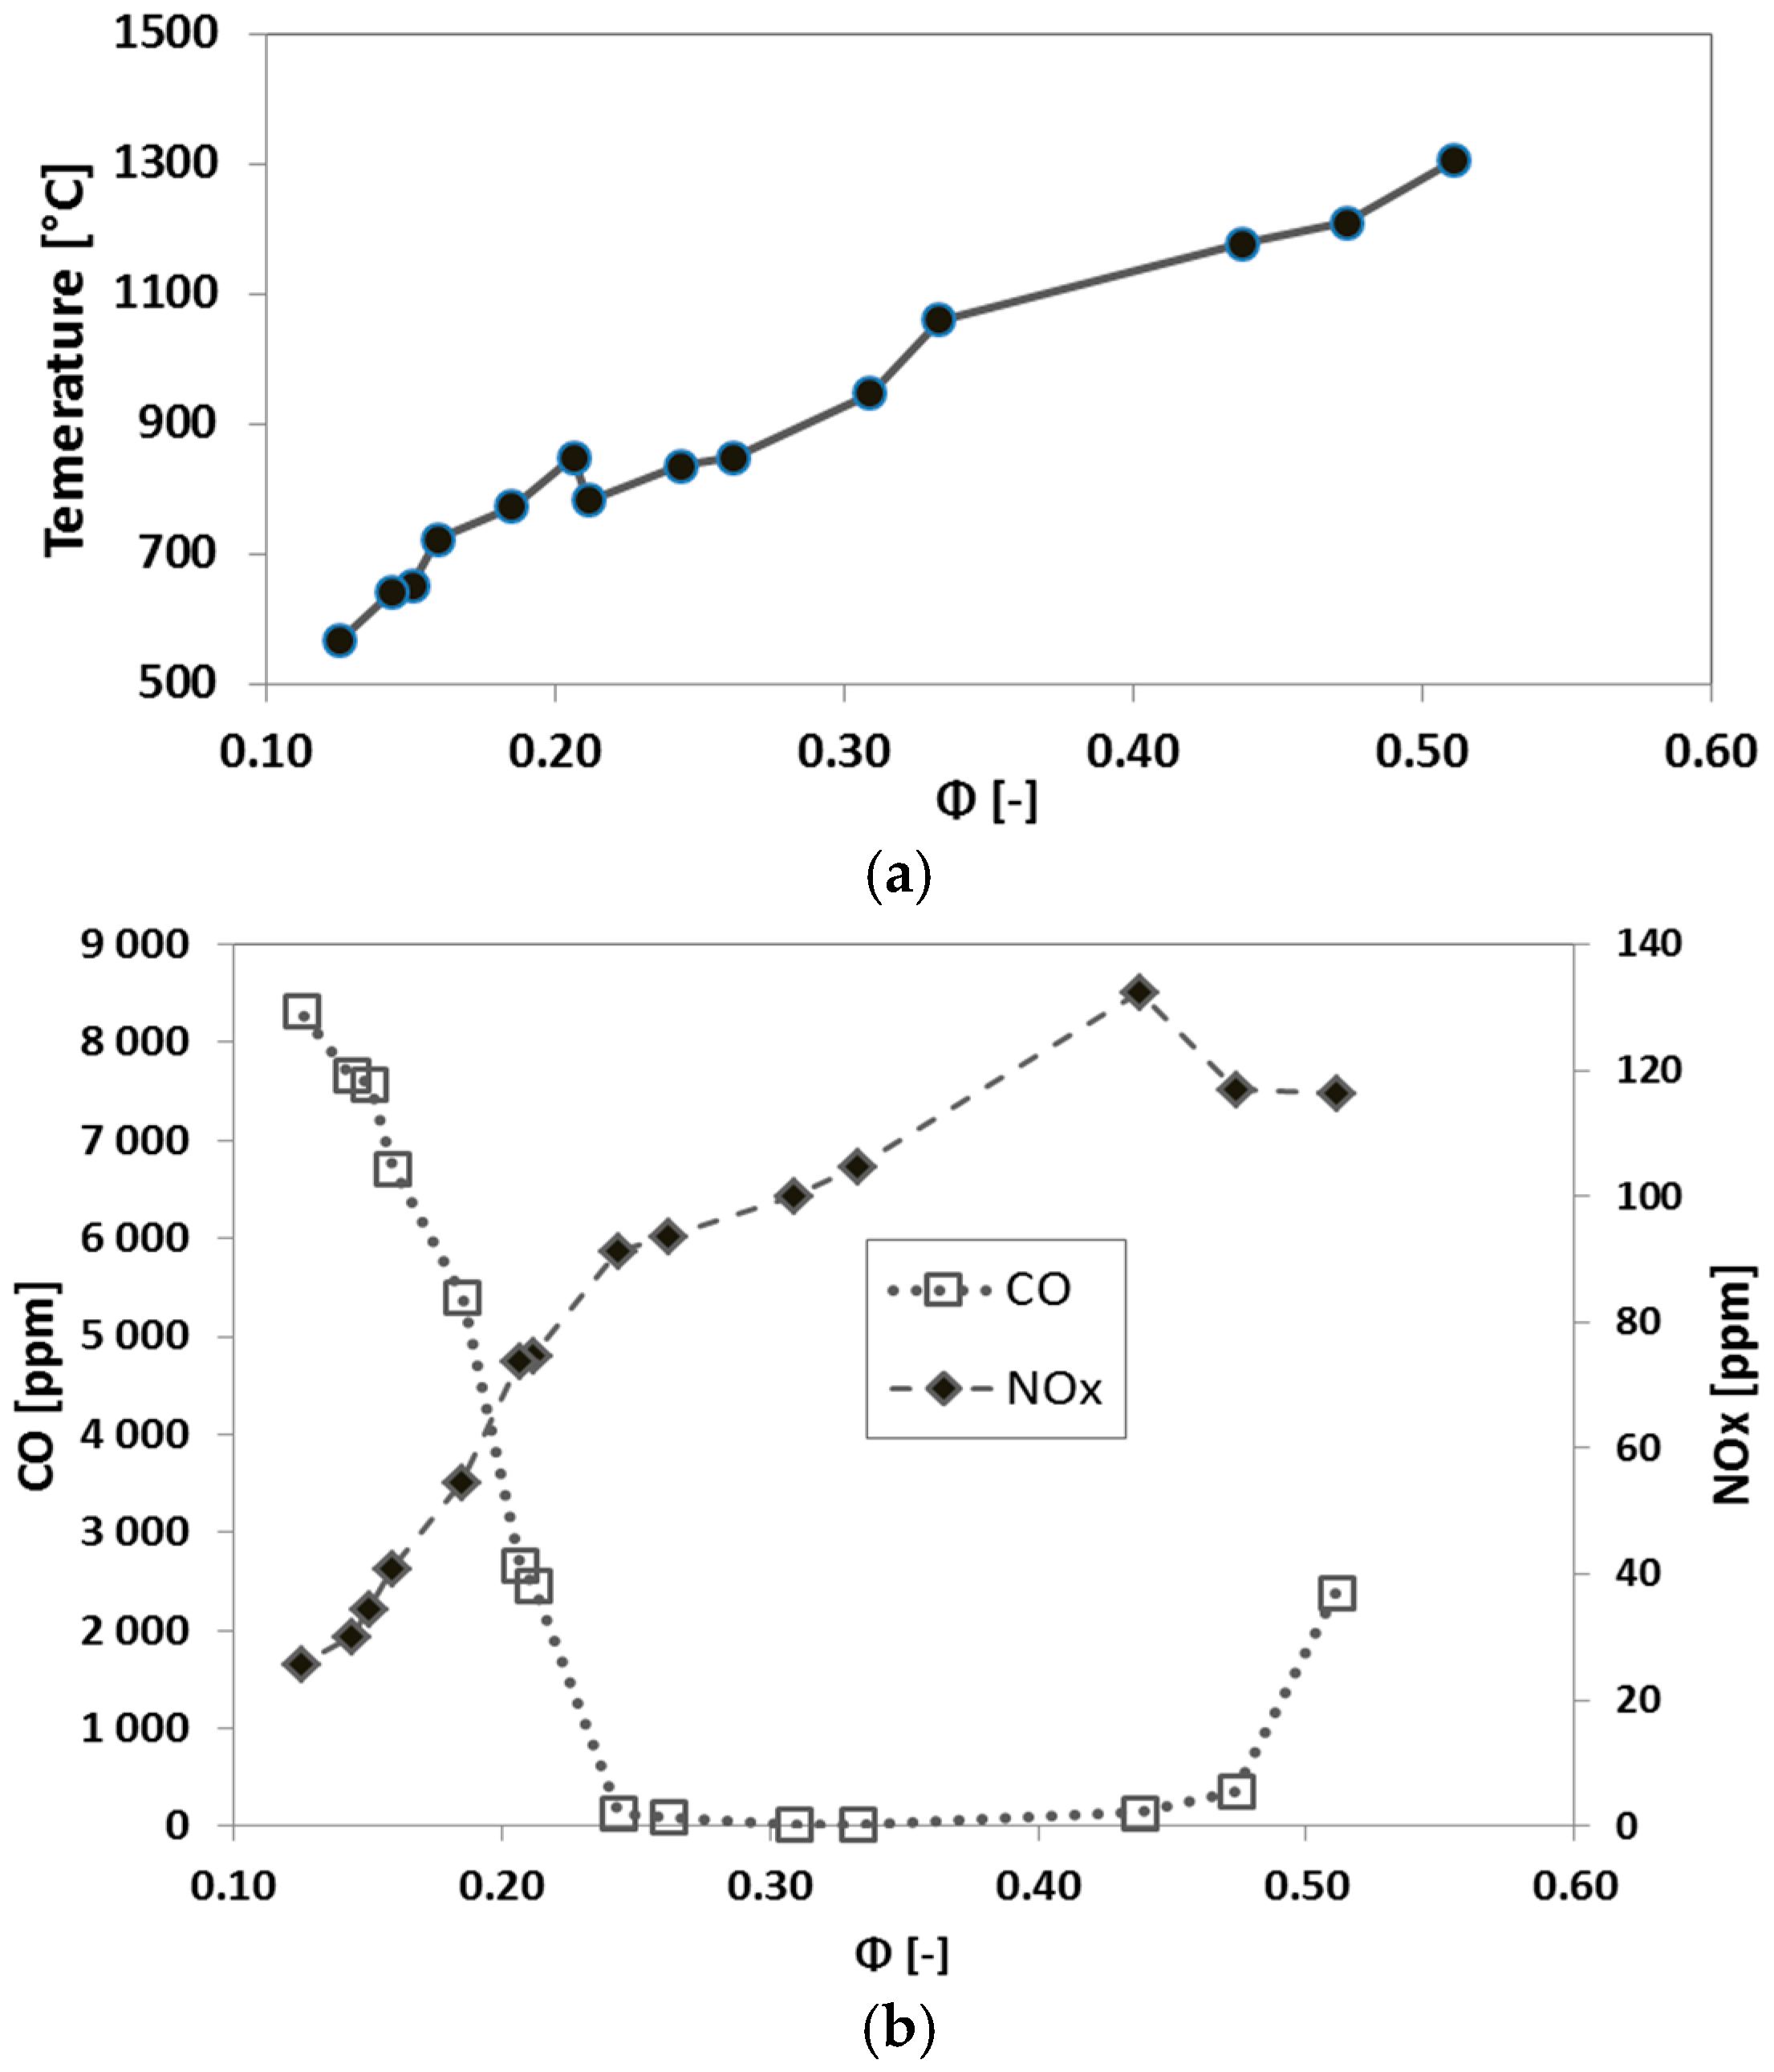
3.2. Analysis of the Exhaust Gas Emissions
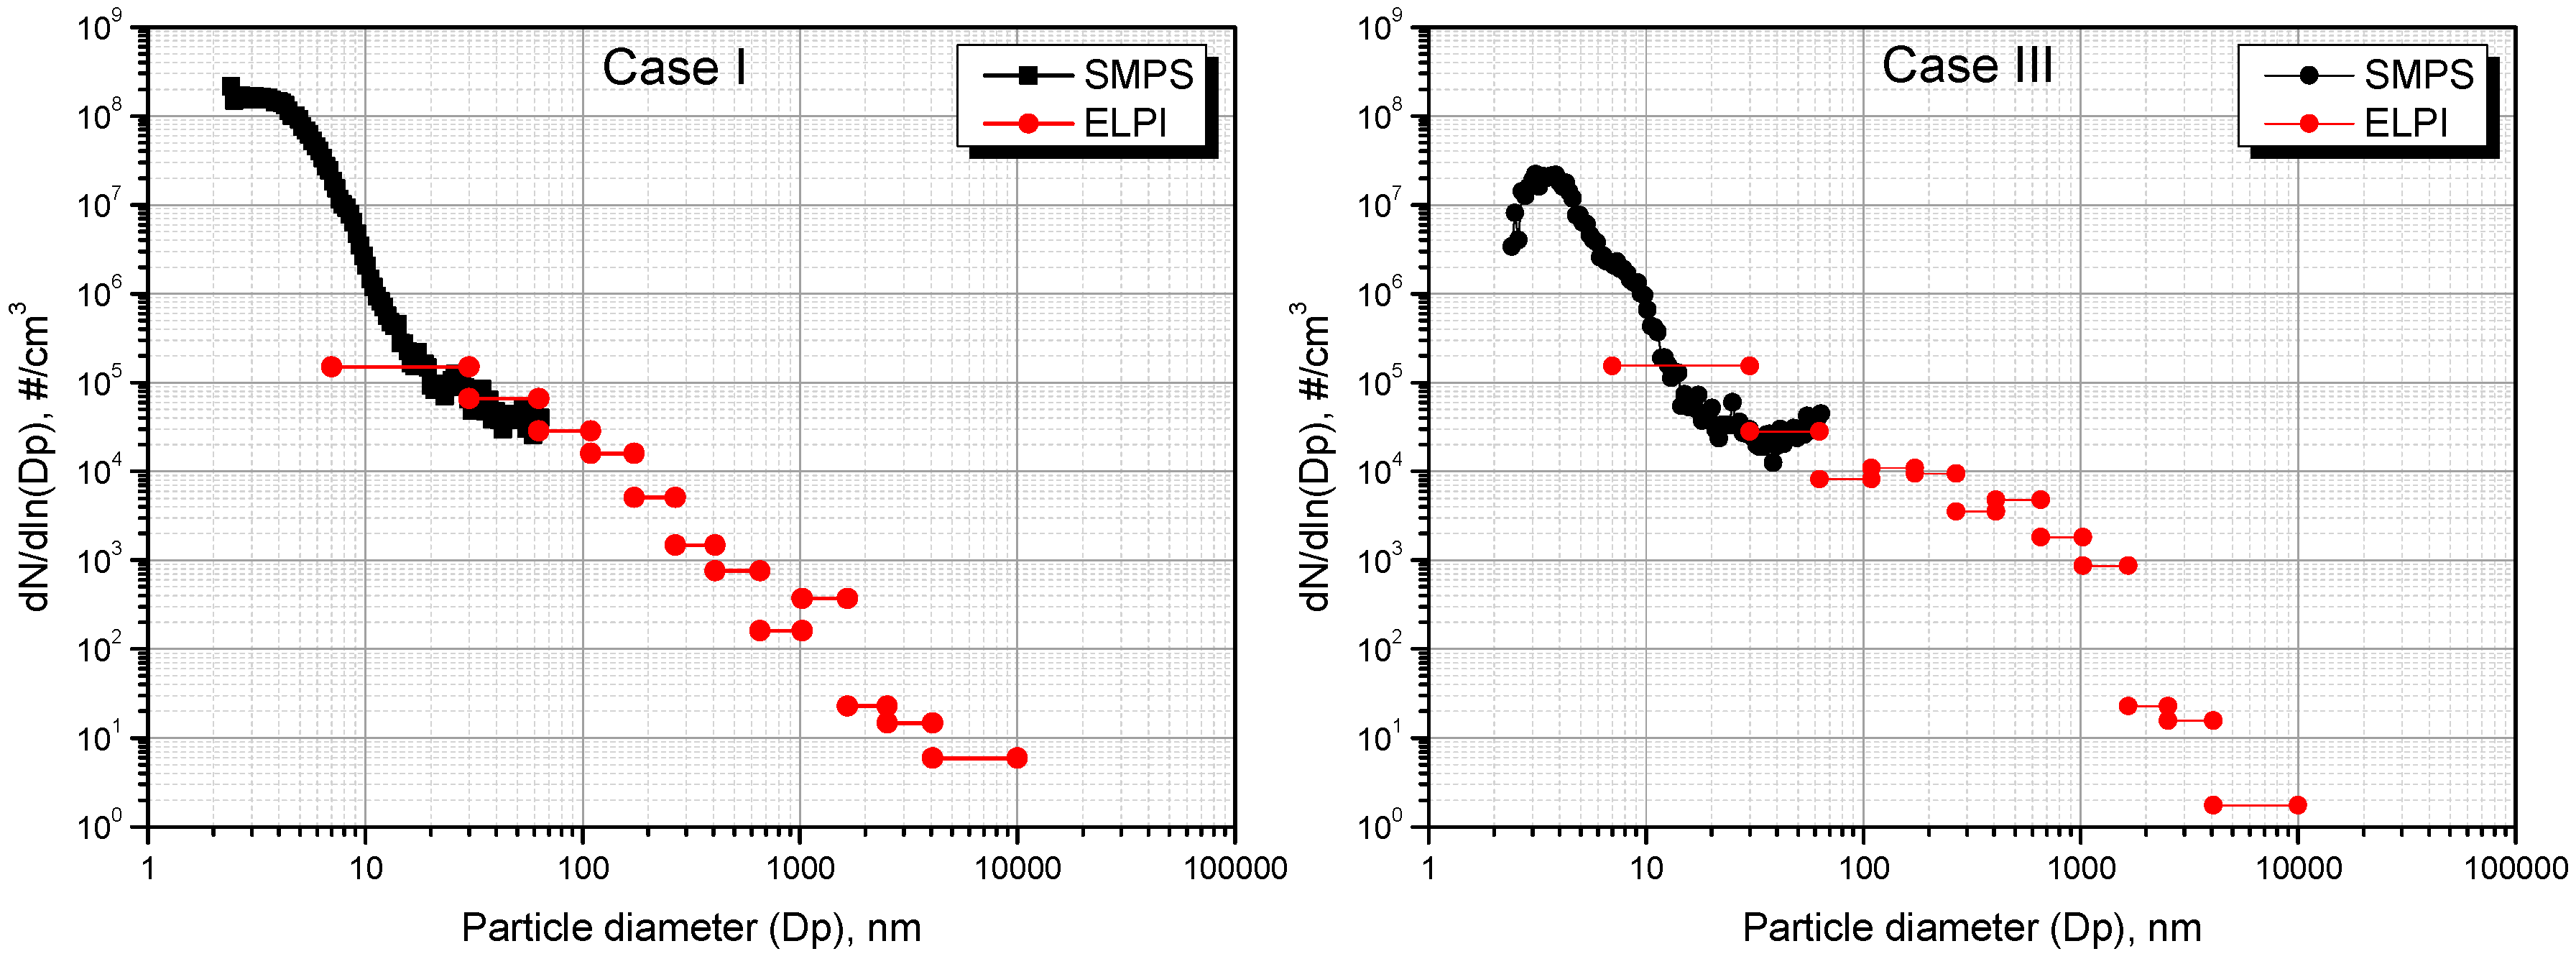
3.3. Particle Concentrations and Number Size Distributions
4. Conclusions
Acknowledgments
Author Contributions
Conflicts of Interest
References
- Lazik, W.; Doerr, T.; Bake, S.; Bank, R.; Rackwitz, L. Development of lean-burn low-NOx combustion technology at rolls-royce deutschland. In Proceedings of the ASME Turbo Expo 2008: Power for Land, Sea, and Air, Berlin, Germany, 9–13 June 2008; Volume 3, pp. 797–807.
- Schildmacher, K.U.; Koch, R.; Bauer, H.J. Experimental characterization of premixed flame instabilities of a model gas turbine burner. Flow Turbul. Combust. 2006, 76, 177–197. [Google Scholar] [CrossRef]
- Matalon, M. Intrinsic flame instabilities in premixed and nonpremixed combustion. Annu. Rev. Fluid Mech. 2007, 39, 163–191. [Google Scholar] [CrossRef]
- Campa, G.; Camporeale, S.M. Prediction of the thermoacoustic combustion instabilities in practical annular combustors. J. Eng. Gas Turbines Power 2014, 136, 091504. [Google Scholar] [CrossRef]
- Füri, M.; Papas, P.; Monkewitz, P.A. Non-premixed jet flame pulsations near extinction. Proc. Combust. Inst. 2000, 28, 831–837. [Google Scholar] [CrossRef]
- Rosentsvit, L.; Levy, Y.; Erenburg, V.; Sherbaum, V.; Ovcharenko, V.; Chudnovsky, B.; Herszage, A.; Talanker, A. Extension of the combustion stability range in dry low NOx lean premixed gas turbine combustor using a fuel rich annular pilot burner. J. Eng. Gas Turbines Power 2014, 136, 051509. [Google Scholar] [CrossRef]
- Lieuwen, T.C.; Yang, V. (Eds.) Combustion Instabilities in Gas Turbine Engines: Operational Experience, Fundamental Mechanisms, and Modeling; American Institute of Aeronautics and Astronautics (AIAA): Washington, DC, USA, 2006.
- Kabiraj, L.; Sujith, R.I. Nonlinear self-excited thermoacoustic oscillations: Intermittency and flame blowout. J. Fluid Mech. 2012, 713, 376–397. [Google Scholar] [CrossRef]
- Nair, V.; Sujith, R.I. Intermittency as a transition state in combustor dynamics: An explanation for flame dynamics near lean blowout. Combust. Sci. Technol. 2015, 187, 1821–1835. [Google Scholar] [CrossRef]
- Nicholson, H.; Field, J. Some Experimental techniques for the investigation of mechanism of flame stabilization in the wakes of bluff bodies. Symp. Combust. Flame Explos. Phenom. 1948, 3, 44–68. [Google Scholar] [CrossRef]
- Muruganandam, T.M.; Nair, S.; Scarborough, D.; Neumeier, Y.; Jagoda, J.; Lieuwen, T.; Seitzman, J.; Zinn, B. Active control of lean blowout for turbine engine combustors. J. Propuls. Power 2005, 21, 807–814. [Google Scholar] [CrossRef]
- Ballester, J.; Sanz, A.; González, M.A. Investigation of the characteristics and stability of air-staged flames. Exp. Therm. Fluid Sci. 2008, 32, 776–790. [Google Scholar] [CrossRef]
- Hernández, R.; Ballester, J. Flame imaging as a diagnostic tool for industrial combustion. Combust. Flame 2008, 155, 509–528. [Google Scholar] [CrossRef]
- Töreyin, B.U.; Dedeoǧlu, Y.; Güdükbay, U.; Çetin, A.E. Computer vision based method for real-time fire and flame detection. Pattern Recognit. Lett. 2006, 27, 49–58. [Google Scholar] [CrossRef]
- Tuntrakoon, A.; Kuntanapreeda, S. Image-Based Flame Control of a Premixed Gas Burner Using Fuzzy Logics; Lecture Notes in Computer Science; Springer: Berlin/Heidelberg, Germany, 2003; Volume 2871, pp. 673–677. [Google Scholar]
- Sun, D.; Lu, G.; Zhou, H.; Yan, Y. Condition monitoring of combustion processes through flame imaging and kernel principal component analysis. Combust. Sci. Technol. 2013, 185, 1400–1413. [Google Scholar] [CrossRef]
- Ballester, J.; García-Armingol, T. Diagnostic techniques for the monitoring and control of practical flames. Prog. Energy Combust. Sci. 2010, 36, 375–411. [Google Scholar] [CrossRef]
- Ballester, J.; Hernández, R.; Sanz, A.; Smolarz, A.; Barroso, J.; Pina, A. Chemiluminescence monitoring in premixed flames of natural gas and its blends with hydrogen. Proc. Combust. Inst. 2009, 32, 2983–2991. [Google Scholar] [CrossRef]
- Yi, T.; Santavicca, D.A. Flame spectra of a turbulent liquid-fueled swirl-stabilized lean-direct injection combustor. J. Propuls. Power 2009, 25, 1058–1067. [Google Scholar] [CrossRef]
- Keshav, S.; Utkin, Y.G.; Nishihara, M.; Rich, J.W.; Adamovich, I.V.; Bao, A. Studies of chemi-ionization and chemiluminescence in supersonic flows of combustion products. J. Thermophys. Heat Transf. 2008, 22, 157–167. [Google Scholar] [CrossRef]
- Allouis, C.; Pagliara, R.; Saponaro, A. Fast infrared imaging for combustion stability analysis of industrial burners. Exp. Therm. Fluid Sci. 2012, 43, 2–8. [Google Scholar] [CrossRef]
- Allouis, C.; Beretta, F.; Ferrante, A.; Saponaro, A. Fast Infrared Imaging To Study Industrial Burner Combustion. In Proceedings of the 2009 European Combustion Meeting, Istanbul, Turkey, 5–9 July 2009.
- Smith, G.P.; Luque, J.; Park, C.; Jeffries, J.B.; Crosley, D.R. Low pressure flame determinations of rate constants for OH(A) and CH(A) chemiluminescence. Combust. Flame 2002, 131, 59–69. [Google Scholar] [CrossRef]
- De Giorgi, M.G.; Sciolti, A.; Campilongo, S.; Ficarella, A. Assessment of the combustion behavior of a pilot-scale gas turbine burner using image processing. In Proceedings of the ASME 2014 Power Conference, Baltimore, MA, USA, 28–31 July 2014.
- De Giorgi, M.G.; Sciolti, A.; Pescini, E.; Ficarella, A. Frequency analysis and predictive identification of flame stability by image processing. In Proceedings of the 8th International Conference on Energy Sustainability Sustainable Collocated with the ASME 2014 12th International Conference on Fuel Cell Science, Engineering and Technology, Boston, MA, USA, 30 June–2 July 2014.
- Ruao, M.; Costa, M.; Carvalho, M. A NOx diagnostic system based on a spectral ultraviolet/visible imaging device. Fuel 1999, 78, 1283–1292. [Google Scholar] [CrossRef]
- De Giorgi, M.G.; Sciolti, A.; Campilongo, S.; Ficarella, A. Image processing for the characterization of flame stability in a non-premixed liquid fuel burner near lean blowout. Aerosp. Sci. Technol. 2016, 49, 41–51. [Google Scholar] [CrossRef]
- De Giorgi, M.G.; Sciolti, A.; Campilongo, S.; Ficarella, A. Experimental data regarding the characterization of the flame behavior near lean blowout in a non-premixed liquid fuel burner. Data Brief 2016, 6, 189–193. [Google Scholar] [CrossRef] [PubMed]
- Memrecam®. User’s Manual. Available online: http://www.nacinc.com/products/memrecam-high-speeddigital-cameras/gx-3 (accessed on 15 July 2016).
- Thorlabs Amplified Photomultiplier User Manual. Available online: http://www.thorlabs.de/thorcat/17400/PMM01-Manual.pdf (accessed on 15 July 2016).
- National Instruments Data Acquisition (DAQ) Device NI-USB6008 Specifications. Available online: http://www.ni.com/datasheet/pdf/en/ds-218 (accessed on 15 July 2016).
- Phantom Micro M320 High-Speed Digital Camera. Available online: https://www.abelcine.com/store/Phantom-Miro-M320S-High-Speed-Digital-Camera/ (accessed on 15 July 2016).
- High-Speed Intensified Camera Attachment. Available online: http://www.lambertinstruments.com/hicatt (accessed on 15 July 2016).
- De la Mora, J.F.; de Juan, L.; Eichler, T.; Rosell, J. Differential mobility analysis of molecular ions and nanometer particles. TrAC Trends Anal. Chem. 1998, 17, 328–339. [Google Scholar] [CrossRef]
- Marjamäki, M.; Keskinen, J.; Chen, D.R.; Pui, D.Y.H. Performance evaluation of the electrical low-pressure impactor (ELPI). J. Aerosol Sci. 2000, 31, 249–261. [Google Scholar] [CrossRef]
- Keskinen, J.; Pietarinen, K.; Lehtimäki, M. Electrical low pressure impactor. J. Aerosol Sci. 1992, 23, 353–360. [Google Scholar] [CrossRef]
- Allouis, C.; Beretta, F.; Minutolo, P.; Pagliara, R.; Sirignano, M.; Sgro, L.A.; D’Anna, A. Measurements of ultrafine particles from a gas-turbine burning biofuels. Exp. Therm. Fluid Sci. 2010, 34, 258–261. [Google Scholar] [CrossRef]
- Guyot, D.; Guethe, F.; Schuermans, B.; Lacarelle, A.; Paschereit, C. CH*/OH* Chemiluminescence Response of an Atmospheric Premixed Flame Under Varying Operating Conditions. In Proceedings of the ASME, Turbo Expo 2010: Power for Land, Sea, and Air, Glasgow, UK, 14–18 June 2010; Volume 2, pp. 933–944.
- Kittelson, D.B.; Watts, W.F.; Johnson, J.P. On-road and laboratory evaluation of combustion aerosols—Part1: Summary of diesel engine results. J. Aerosol Sci. 2006, 37, 913–930. [Google Scholar] [CrossRef]
- Kittelson, D.B.; Watts, W.F.; Johnson, J.P. On-road and laboratory evaluation of combustion aerosols—Part2: Summary of spark ignition engine results. J. Aerosol Sci. 2006, 37, 931–949. [Google Scholar] [CrossRef]
- De Filippo, A.; Mariq, M.M. Diesel nucleation mode particles: Semivolatile or solid? Environ. Sci. Technol. 2008, 42, 7957–7962. [Google Scholar] [CrossRef] [PubMed]
- Heikkilä, J.; Virtanen, A.; Rönkkö, T.; Keskinen, J.; Aakko-Saksa, P.; Murtonen, T. Nanoparticle emissions from a heavy-duty engine running on alternative diesel fuels. Environ. Sci. Technol. 2009, 43, 9501–9506. [Google Scholar] [CrossRef] [PubMed]
- D’Anna, A. Combustion-formed nanoparticles. Proc. Combust. Inst. 2009, 32, 593–613. [Google Scholar] [CrossRef]
- Michelsen, H.A. Probing soot formation, chemical and physical evolution, and oxidation: A review of in situ diagnostic techniques and needs. Proc. Combust. Inst. 2017, 36, 717–735. [Google Scholar] [CrossRef]
- Commodo, M.; De Falco, G.; Bruno, A.; Borriello, C.; Minutolo, P.; D’Anna, A. Physicochemical evolution of nascent soot particles in a laminar premixed flame: From nucleation to early growth. Combust. Flame 2015, 162, 3854–3863. [Google Scholar] [CrossRef]
- Dobbins, R.A.; Fletcher, R.A.; Chang, H.C. The evolution of soot precursor particles in a diffusion flame. Combust. Flame 1998, 115, 285–298. [Google Scholar] [CrossRef]
- Sirignano, M.; Bartos, D.; Conturso, M.; Dunn, M.; D’Anna, A.; Masri, A.R. Detection of nanostructures and soot in laminar premixed flames. Combust. Flame 2017, 176, 299–308. [Google Scholar] [CrossRef]


| Case | Air (g/s) | Fuel (g/s) | Φ |
|---|---|---|---|
| I | 83.92 | 1.81 | 0.348 |
| II | 84.23 | 1.54 | 0.266 |
| III | 86.10 | 1.30 | 0.220 |
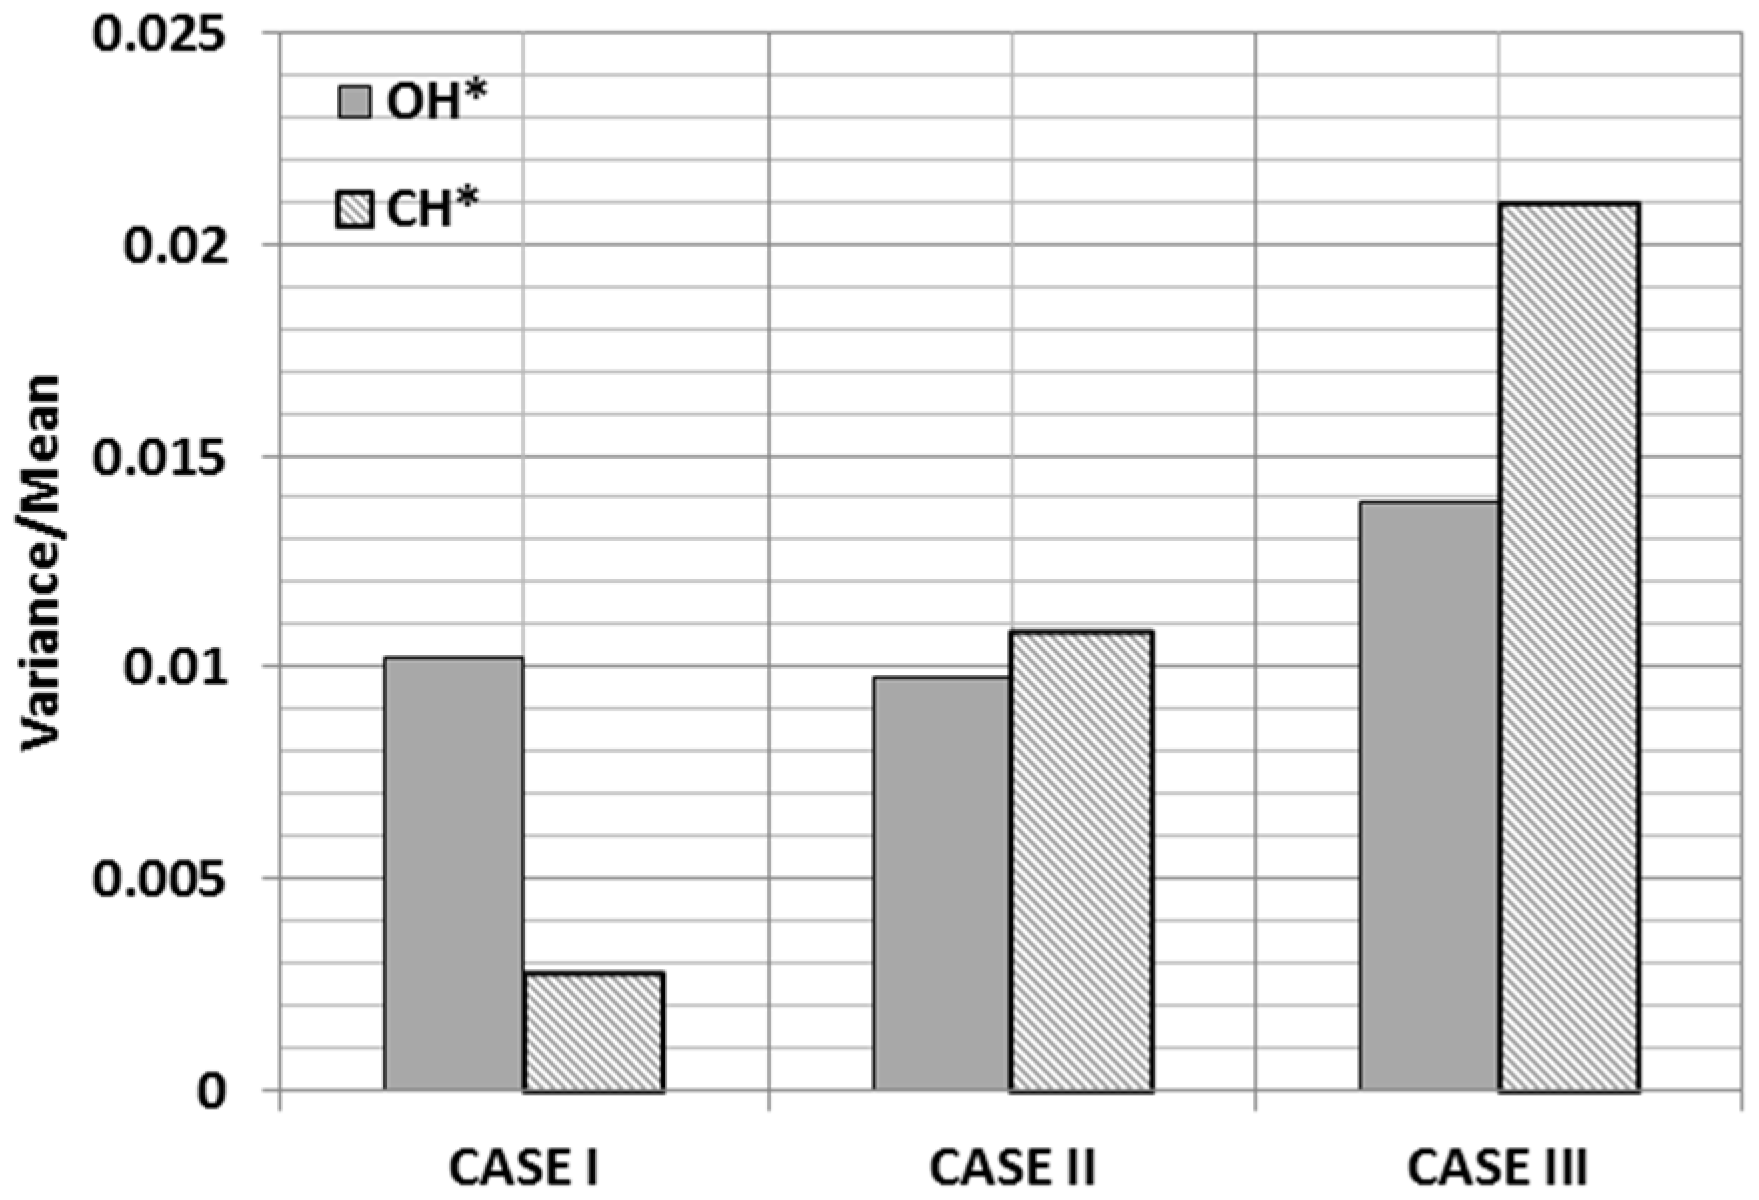
| Case | OH* Mean Value | OH* Variance | CH* Mean Value | CH* Variance | CH*/OH* Mean Value |
|---|---|---|---|---|---|
| I | 4.903 | 0.050 | 23.300 | 0.065 | 4.752 |
| II | 5.008 | 0.049 | 14.810 | 0.161 | 2.957 |
| III | 4.463 | 0.062 | 12.175 | 0.256 | 2.728 |
© 2017 by the authors. Licensee MDPI, Basel, Switzerland. This article is an open access article distributed under the terms and conditions of the Creative Commons Attribution (CC BY) license ( http://creativecommons.org/licenses/by/4.0/).
Share and Cite
De Giorgi, M.G.; Campilongo, S.; Ficarella, A.; De Falco, G.; Commodo, M.; D’Anna, A. Pollutant Formation during the Occurrence of Flame Instabilities under Very-Lean Combustion Conditions in a Liquid-Fuel Burner. Energies 2017, 10, 352. https://doi.org/10.3390/en10030352
De Giorgi MG, Campilongo S, Ficarella A, De Falco G, Commodo M, D’Anna A. Pollutant Formation during the Occurrence of Flame Instabilities under Very-Lean Combustion Conditions in a Liquid-Fuel Burner. Energies. 2017; 10(3):352. https://doi.org/10.3390/en10030352
Chicago/Turabian StyleDe Giorgi, Maria Grazia, Stefano Campilongo, Antonio Ficarella, Gianluigi De Falco, Mario Commodo, and Andrea D’Anna. 2017. "Pollutant Formation during the Occurrence of Flame Instabilities under Very-Lean Combustion Conditions in a Liquid-Fuel Burner" Energies 10, no. 3: 352. https://doi.org/10.3390/en10030352