
Pyrolysis of Polyolefins Using Rotating Arc Plasma Technology for Production of Acetylene


Key Laboratory of Biomass Chemical Engineering, College of Chemical and Biological Engineering, Zhejiang University, Hangzhou 310027, Zhejiang, China
*
Author to whom correspondence should be addressed.
Energies 2017, 10(4), 513; https://doi.org/10.3390/en10040513
Submission received: 17 February 2017
/
Revised: 21 March 2017
/
Accepted: 26 March 2017
/
Published: 10 April 2017
(This article belongs to the Section I: Energy Fundamentals and Conversion)
Abstract
:Polyolefin, as one of the most widely used macromolecule materials, has been one of the most serious threats to the environment. Current treatment methods of waste polyolefin including landfill, incineration, and thermal degradation have suffered from severe problems such as secondary pollution and the generation of other toxic substances. In this article, we report for the first time a high-efficiency method to produce high-value C2H2 from polyolefins using a rotating direct current arc plasma reactor, using polyethylene and polypropylene as feedstocks. The essence of this method is that a reductive atmosphere of pyrolysis enables a thermodynamic preference to C2H2 over other carbon-containing gas and the rotating direct current arc plasma reactor allows for a uniform distribution of high temperature to ensure high conversion of polymers. Thermodynamic simulation of product composition was performed, and the effect of plasma input power, polyolefin feed rate, and working gas flow rate on the pyrolysis results was experimentally investigated. It was found that, with proper parameter control, approximately complete conversion of carbon in polyolefin could be obtained, with a C2H2 selectivity higher than 80% and a C2H2 yield higher than 70%. These results not only create new opportunities for the reuse of polymer waste, but are also instructive for the green production of C2H2.
1. Introduction
The 21st century has been recognized as the era of polymers. Despite its short history, polymer has been one of the most widely used materials in industry and daily life, due to excellent properties such as low density, resistance to fatigue and corrosion, great strength, sound insulation, and low maintenance cost [1,2,3]. Polyolefin, represented by polyethylene and polypropylene, is the most common polymeric material [4,5]; polyethylene alone has a global production of 155 t. However, severe pollution problems accompany the wide use of polymer because polymeric material is stable and is not prone to decomposition reactions under usual environmental conditions [6,7], which means the deposition of polyethylene in landfills requires a great deal of space. With the exception of a few polymers that can be handled by environmentally friendly degradation, polymeric waste treatment is achieved by landfill, incineration or thermal degradation [7,8,9,10,11,12], which causes secondary pollution or generates other toxic substances such as dioxin [13]. Therefore, the development of reliable recycling or decomposition methods is an urgent necessity.
Thermal plasma technology has attracted great interest in recent years due to great advantages, such as those shown in the direct pyrolysis of coal, hydrocarbons, biomass and solid waste into primary petrochemicals via its properties such as high temperature, high energy density and large numbers of active particles [14,15,16,17,18,19,20,21,22,23,24,25]. It is also regarded as a means of recycling macromolecule materials more efficiently, by converting them into monomers or light hydrocarbon gas that can be reused in the polymer production cycle or other ways, making it the subject of several investigations. Guddeti et al. used an induction-coupled radio frequency plasma-heated reactor to convert polyethylene and polypropylene into light gases such as propylene, ethylene and methane in argon atmosphere [26,27]. Chang et al. tried thermal plasma pyrolysis of used tires for the production of syngas in argon atmosphere [28]. Although these studies achieved good conversions, a significant shortcoming is that the main pyrolysis product in these studies are olefins, methane and syngas, whose economic value is low. Moreover, olefins can be obtained more economically via petroleum routes, while methane is present in nature as natural gas and shale gas, and syngas is also widely available. Therefore, the search for an efficient method of turning polymers into more valuable products with higher conversion and yield is attracting more and more interest.
To address the above problems, we report here for the first time a highly efficient method of producing C2H2 from polyolefins with a rotating direct current arc plasma reactor, using polyethylene and polypropylene as feedstocks. C2H2 has a higher commercial price than C2H4 and syngas, and is scarcely produced from the petroleum and natural gas industry. The essence of our strategy is that a reductive atmosphere of pyrolysis enables a thermodynamic preference to C2H2 over other carbon-containing gases, and the rotating DC arc plasma reactor allows for a uniform distribution of high temperature to ensure the high conversion of polymers. Under optimum conditions, an approximately complete carbon conversion was achieved, with a C2H2 yield of 81.4% and a selectivity of 83.8%. In fact, nowadays the dominant technology for producing C2H2 is the hydrolyzation of calcium carbide, which requires heavy consumption of water and energy and causes severe CO2 discharge. Thus these results not only create new opportunities for the reuse of polymer waste, but are also instructive for the green production of C2H2.
2. Materials and Methods
2.1. Model Feedstock and Injection
Powder of high density polyethylene, as well as polypropylene, obtained from Shanghai GuanBu Electromechanical Technology Co., Ltd. (Shanghai, China), were used as feedstock. The particle size of polyethylene varied from 20 μm to 80 μm, while polypropylene particle size varied from 100 μm to 230 μm. The polyethylene powder was fluidized in a flow of argon carrier gas and fed from a screw feeder into the plasma torch. The feed rate could be adjusted from 12 g/min to 30 g/min.
2.2. Thermodynamic Simulation
The simulation of pyrolysis reaction of polyethylene was performed in the program Chemkin 4.1. An equilibrium model was used to carry out the simulation of thermal equilibrium composition of the pyrolysis result, with species considered including H2, O2, H2O(g), C(g), CH4, CO, CO, CH2O, CH3OH, C2H2, C2H4, C2H6, C3H6 and C3H8. The input temperature varied from 1000 K to 5000 K, with pressure at 0.1 MPa.
2.3. Reactor Set-Up
A schematic diagram of the rotating DC arc plasma system, which consists of a plasma torch, an injector, a quenching unit and a sampling device, was shown in Figure 1. The torch, with an inner diameter of 25 mm, consists of a tube shaped copper anode and a rod shaped tungsten cathode, both water-cooled. A field coil was designed around the copper anode in order to generate a magnetic field, which would make the arc rotate with a high speed. The rotating arc would not only form a uniform and stable jet at extremely high temperature (>3000 K), but also contribute to the mixing of feedstock and working gas. The operating parameters of the plasma reactor are listed in Table 1.
2.4. Gas Analysis
The product gas was analyzed by a gas chromatograph (KEXIAO, GC-1690) (Hangzhou Kexiao Chemical Equipment Co., Ltd., Hangzhou, China) with a thermal conductivity detector (TCD), and PLOT 5A molecular sieve packed column followed by PLOT Q capillary column.
2.5. Evaluation of Pyrolysis
The carbon conversion to gaseous product (X), selectivity and yield of acetylene (Se and Y), and the specific energy consumption of acetylene (SEC) were the main parameters to evaluate the pyrolysis results, which were calculated as follows:
where mi is the flow rate of gaseous component i in g/min, Ci% is the mass fraction of C in gaseous component i in kg/kg, mfs is the feed rate in g/min, Cfs% is the mass fraction of C in feedstock in kg/kg, U and I are the working voltage and current, respectively in V and A.
3. Results and Discussion
3.1. Thermodynamic Simulation
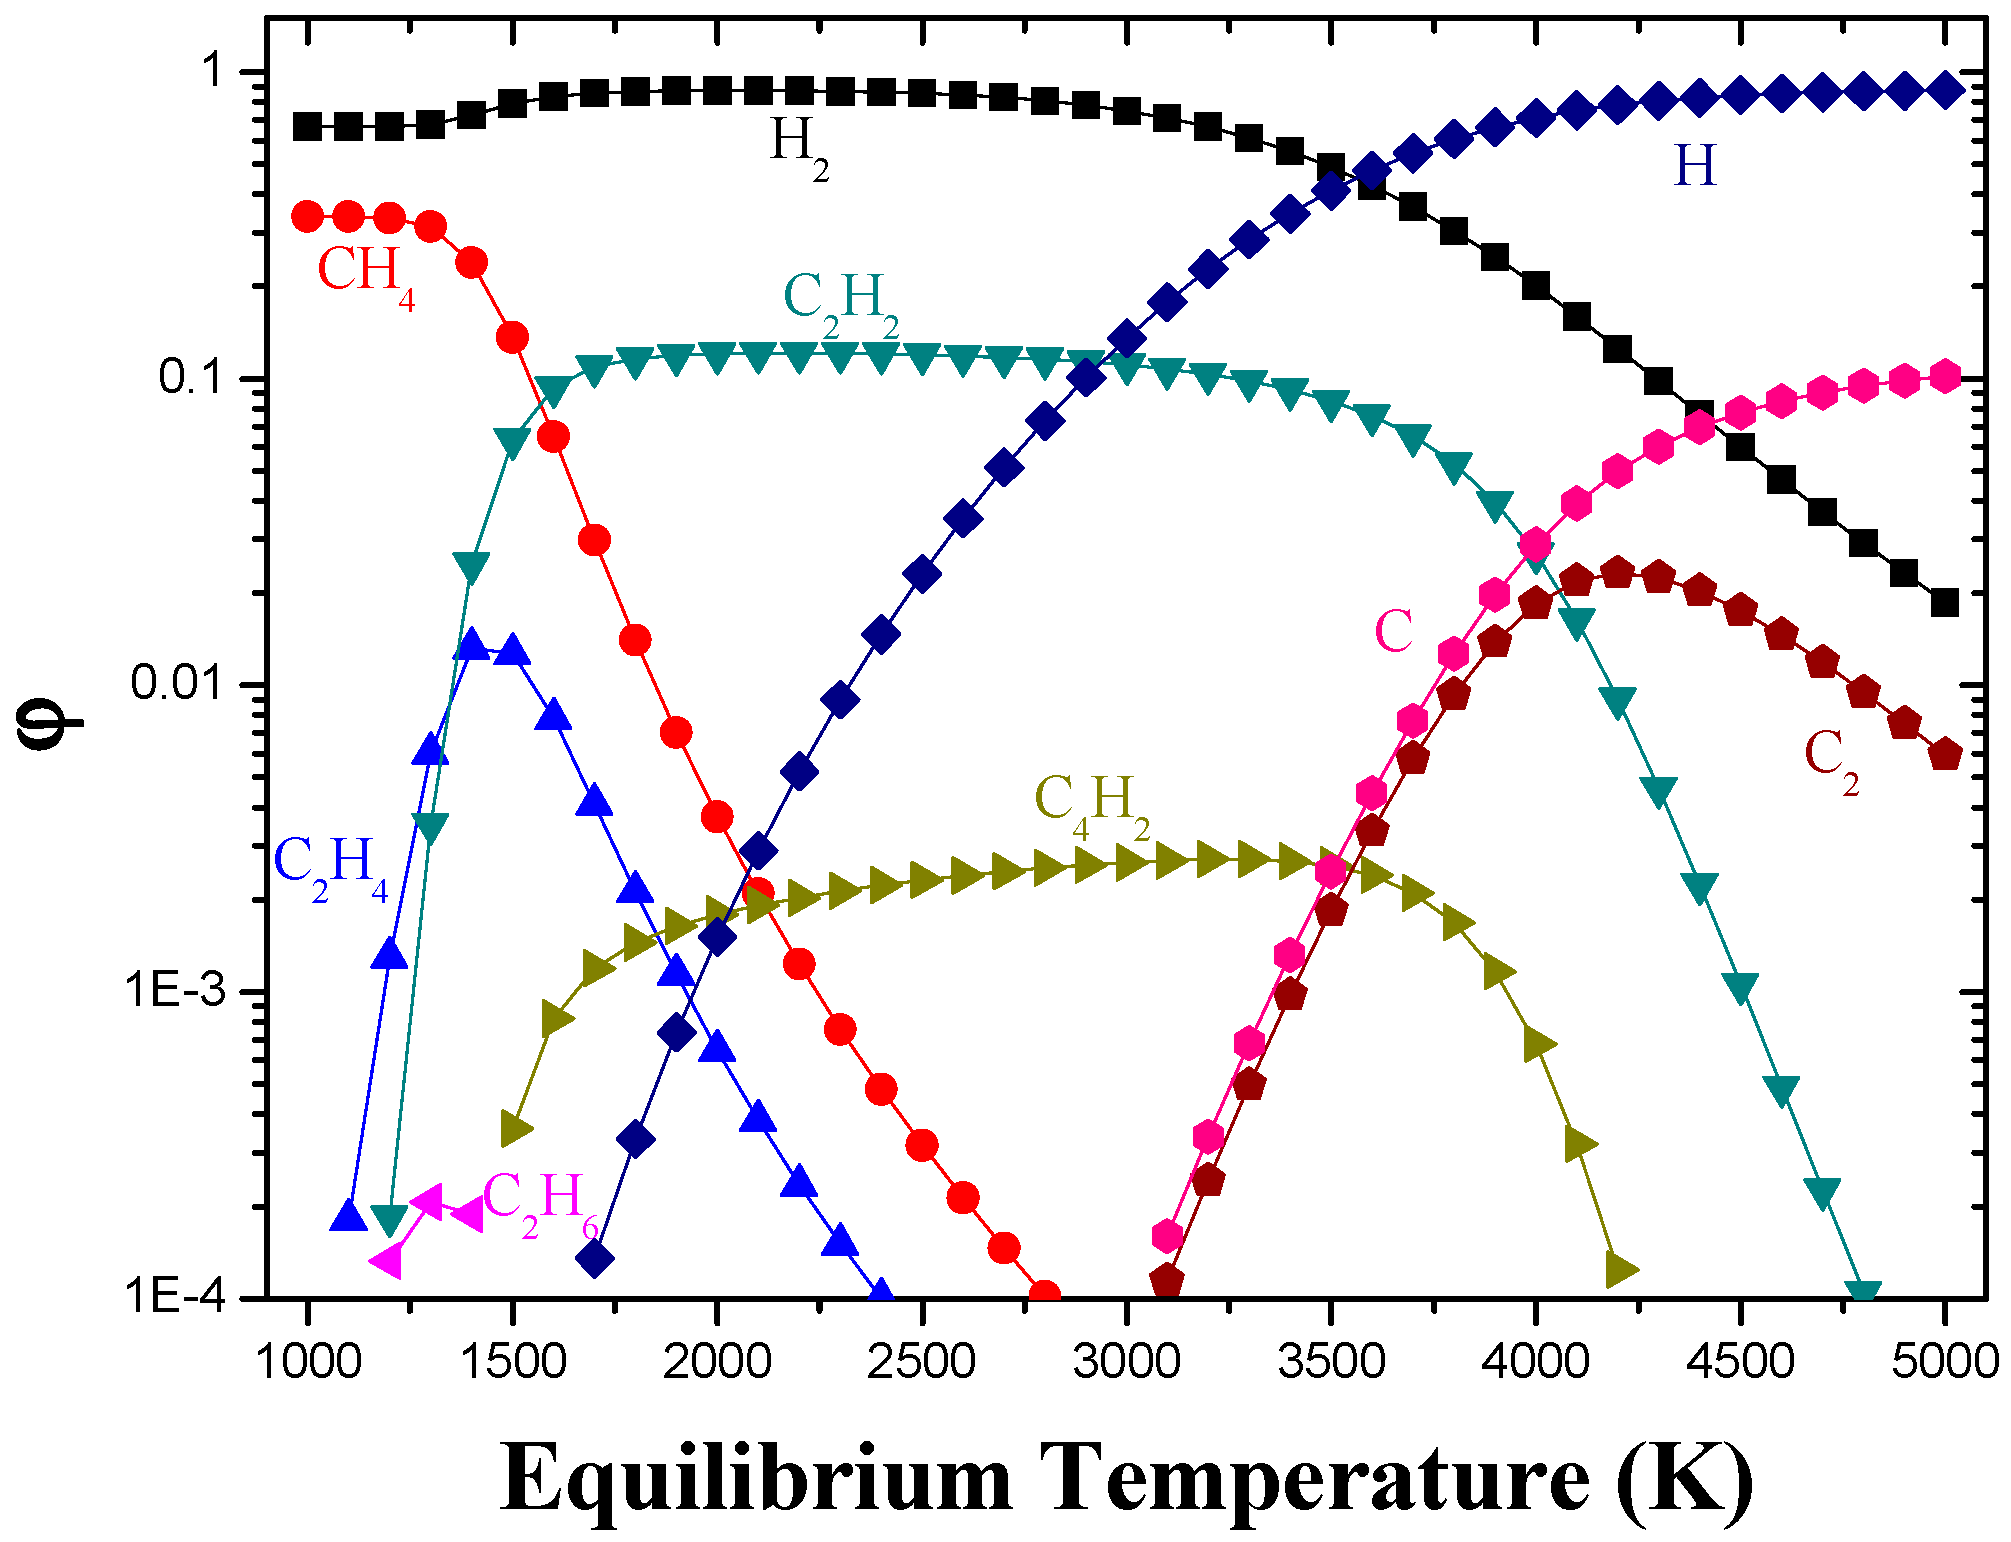
Thermodynamic simulation of polyethylene (PE) pyrolysis was carried out in order to qualitatively predict the product of the reaction. The H/C ratio was set at 7.92, which was the same H/C as one series of the experiments described below in Section 3.2 (PE feed rate at 17.65 g/min and the working gas flow rate at 5 Nm3/h). Thermal plasma pyrolysis is proved to be a reaction completed in extremely short time (0.4 ms for small molecular hydrocarbons in gas or liquid state and 4 ms for coal particles) by the studies reported [19,29]. The equilibrium temperature varied from 1000 K to 5000 K. Figure 2 shows the results of simulation: a variety of gaseous products were present in the product gas. The main hydrocarbon products (present in mole fractions higher than 1%) were C2H2, C2H4 and CH4. C2H2 content stabilized at 10% at 1500–3000 K, while mole fractions of C2H4 and CH4 dropped rapidly with increasing temperature. With further increase in temperature to over 3000 K, carbon would turn from hydrocarbons into gaseous carbons (C and C2), which was not what we expected. As shown in Figure 2, C2H2 could be obtained as the main gaseous hydrocarbon product at a relatively high temperature, therefore proving it a promising route to utilize PE waste.
3.2. Effect of Input Power and Feed Rate
The balance of heat transfer in the plasma torch, which was controlled by the input power of the plasma system and the characteristics of the working gas and feedstock, was the key parameter of the mass flow rate in the system. Three groups of experiments were carried out to investigate the influence of input power, feed rate and working gas flow rate on the pyrolysis of PE. First, we carried out a series of experiments in order to investigate the effect of input power and PE feed rate on the plasma conversion of PE powder into acetylene. PE powder was injected into the plasma torch at feed rates of 12 g/min and 17.65 g/min, with a constant working gas flow rate at 5 Nm3/h, a carrier gas flow rate at 1 Nm3/h, and magnetic flux intensity at 0.077 T, while the input power varied from 14 kW to approximately 26 kW.
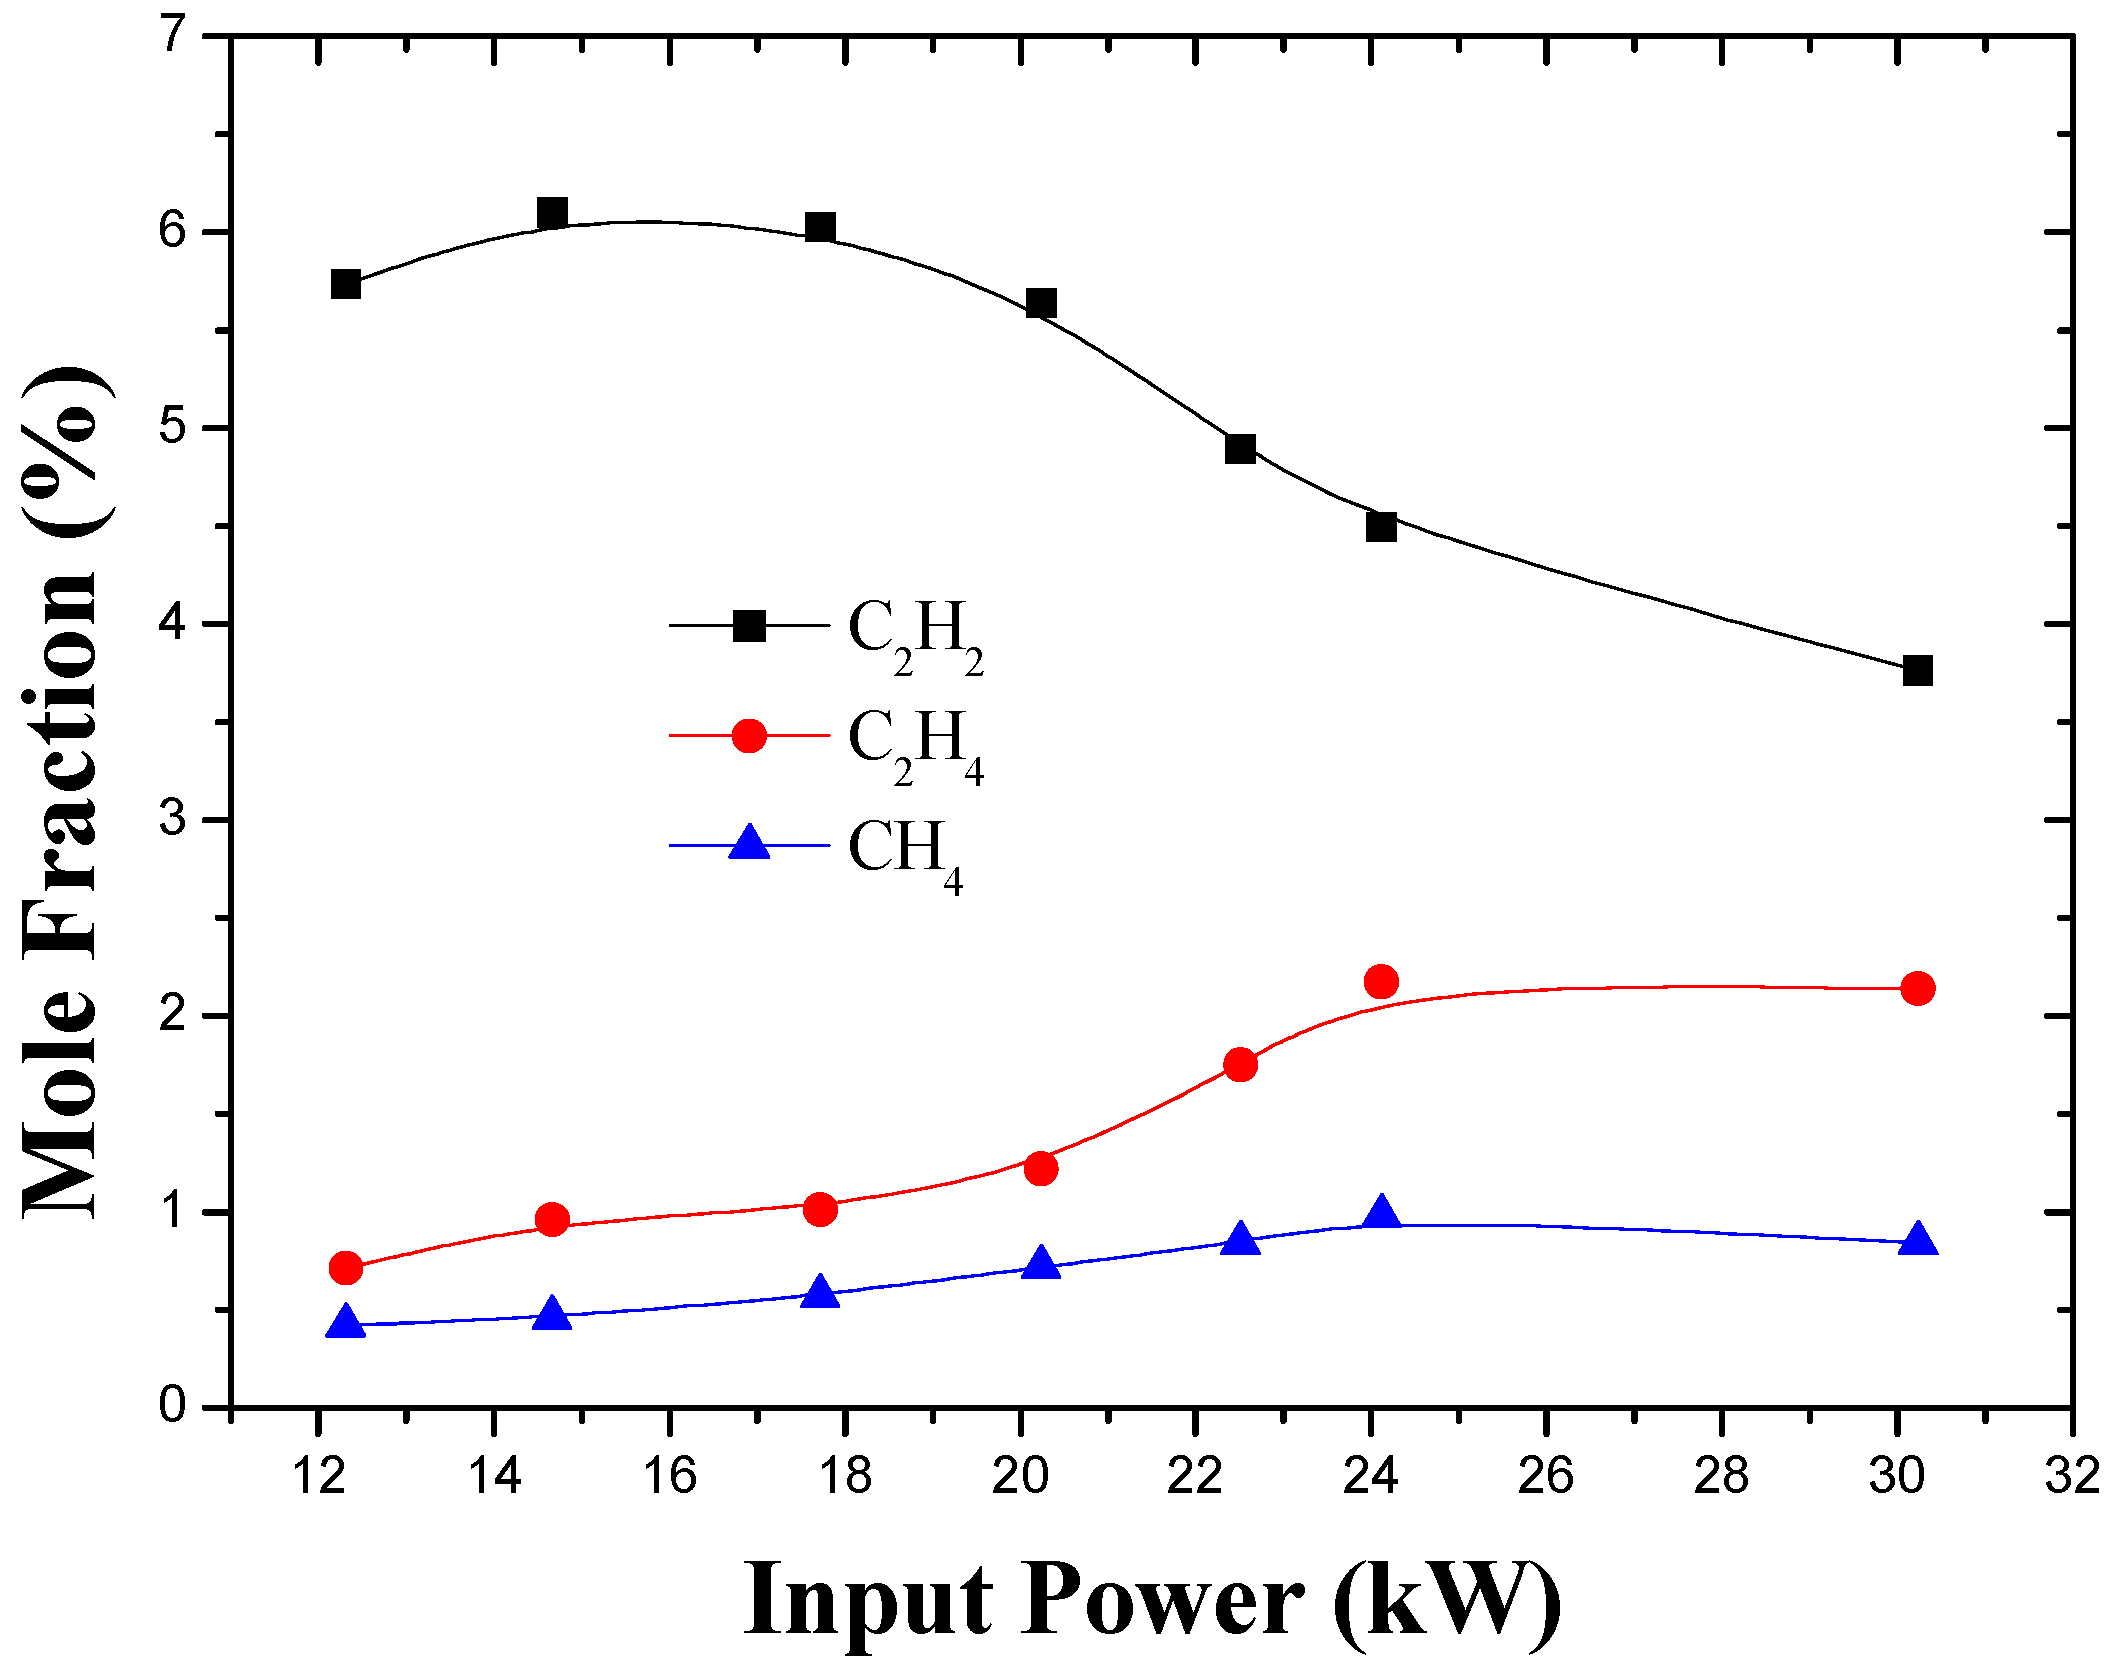
The product gases were principally mixtures of hydrogen and light hydrocarbons such as acetylene, ethylene and methane, as well as ignorable amounts of C3s (<0.01 mol % of the product gas). Hydrogen was one of the pyrolysis products, but it could be separated and reused as working gas, therefore it is not discussed in the experimental results. Figure 3 shows the product distribution as functions of input power at different feed rates. The mole fraction of C2H2, which was the target product, showed a slow decrease with increased input power, from 6.13% to 2.73% at 12 g/min and from 9.42% to 6.12% at 17.65 g/min, respectively. However, the mole fraction of C2H4 and CH4 kept going up with input power. At a feed rate of 12 g/min, C2H4 concentration increased from 0.45% to 1.23% as input power varied from 10.64 kW to 24.24 kW, while CH4 concentration increased from 0.23% to 0.56% at the same time. Variation in input power affects the key parameters of pyrolysis, temperature and energy density, in the plasma reactor. Higher temperature and energy density coming with higher input power form a larger volume of plasma flow, which prolongs the residence time of feedstock in the high temperature region. In an overheated atmosphere, acetylene undergoes the decomposition reaction shown below, which is an irreversible reaction, and the quenching rate would not be high enough to prevent acetylene from turning into ethylene due to the wall-type heat exchanger (Quick quenching would prevent acetylene to undergo the decomposition reaction, in which acetylene would turn into carbon black and hydrogen. Hydrogen would react with radicals, such as C2H5 and n-C3H7•, and form side products, mainly C2H4 and CH4). This is why C2H2 concentration declined with increasing input power while the concentration of side products (C2H4 and CH4) increased. Comparison in the composition of product gas at varied feed rates should be noted. Concentrations of all gaseous products (C2H2, C2H4 and CH4) were approximately 1.5 times higher as the feed rate rose from 12 g/min to 17.65 g/min, resembling the multiple of feed rate increase. Increasing the PE quantity increases the hydrogen and carbon in the plasma system. Therefore, the chemical reactions producing hydrocarbons take place more easily, which leads to a higher yield of gaseous products. As observed, some differences between the experimental results and the simulation are present, mainly due to the extreme working conditions (e.g., nonuniform high temperature and high input power) in real reactor and the fact that the quenching process could not be included in thermodynamic simulation. But the most important prediction of simulation that the presence of carbon was mainly in the form of acetylene within a large temperature range, was proved by the experimental results.
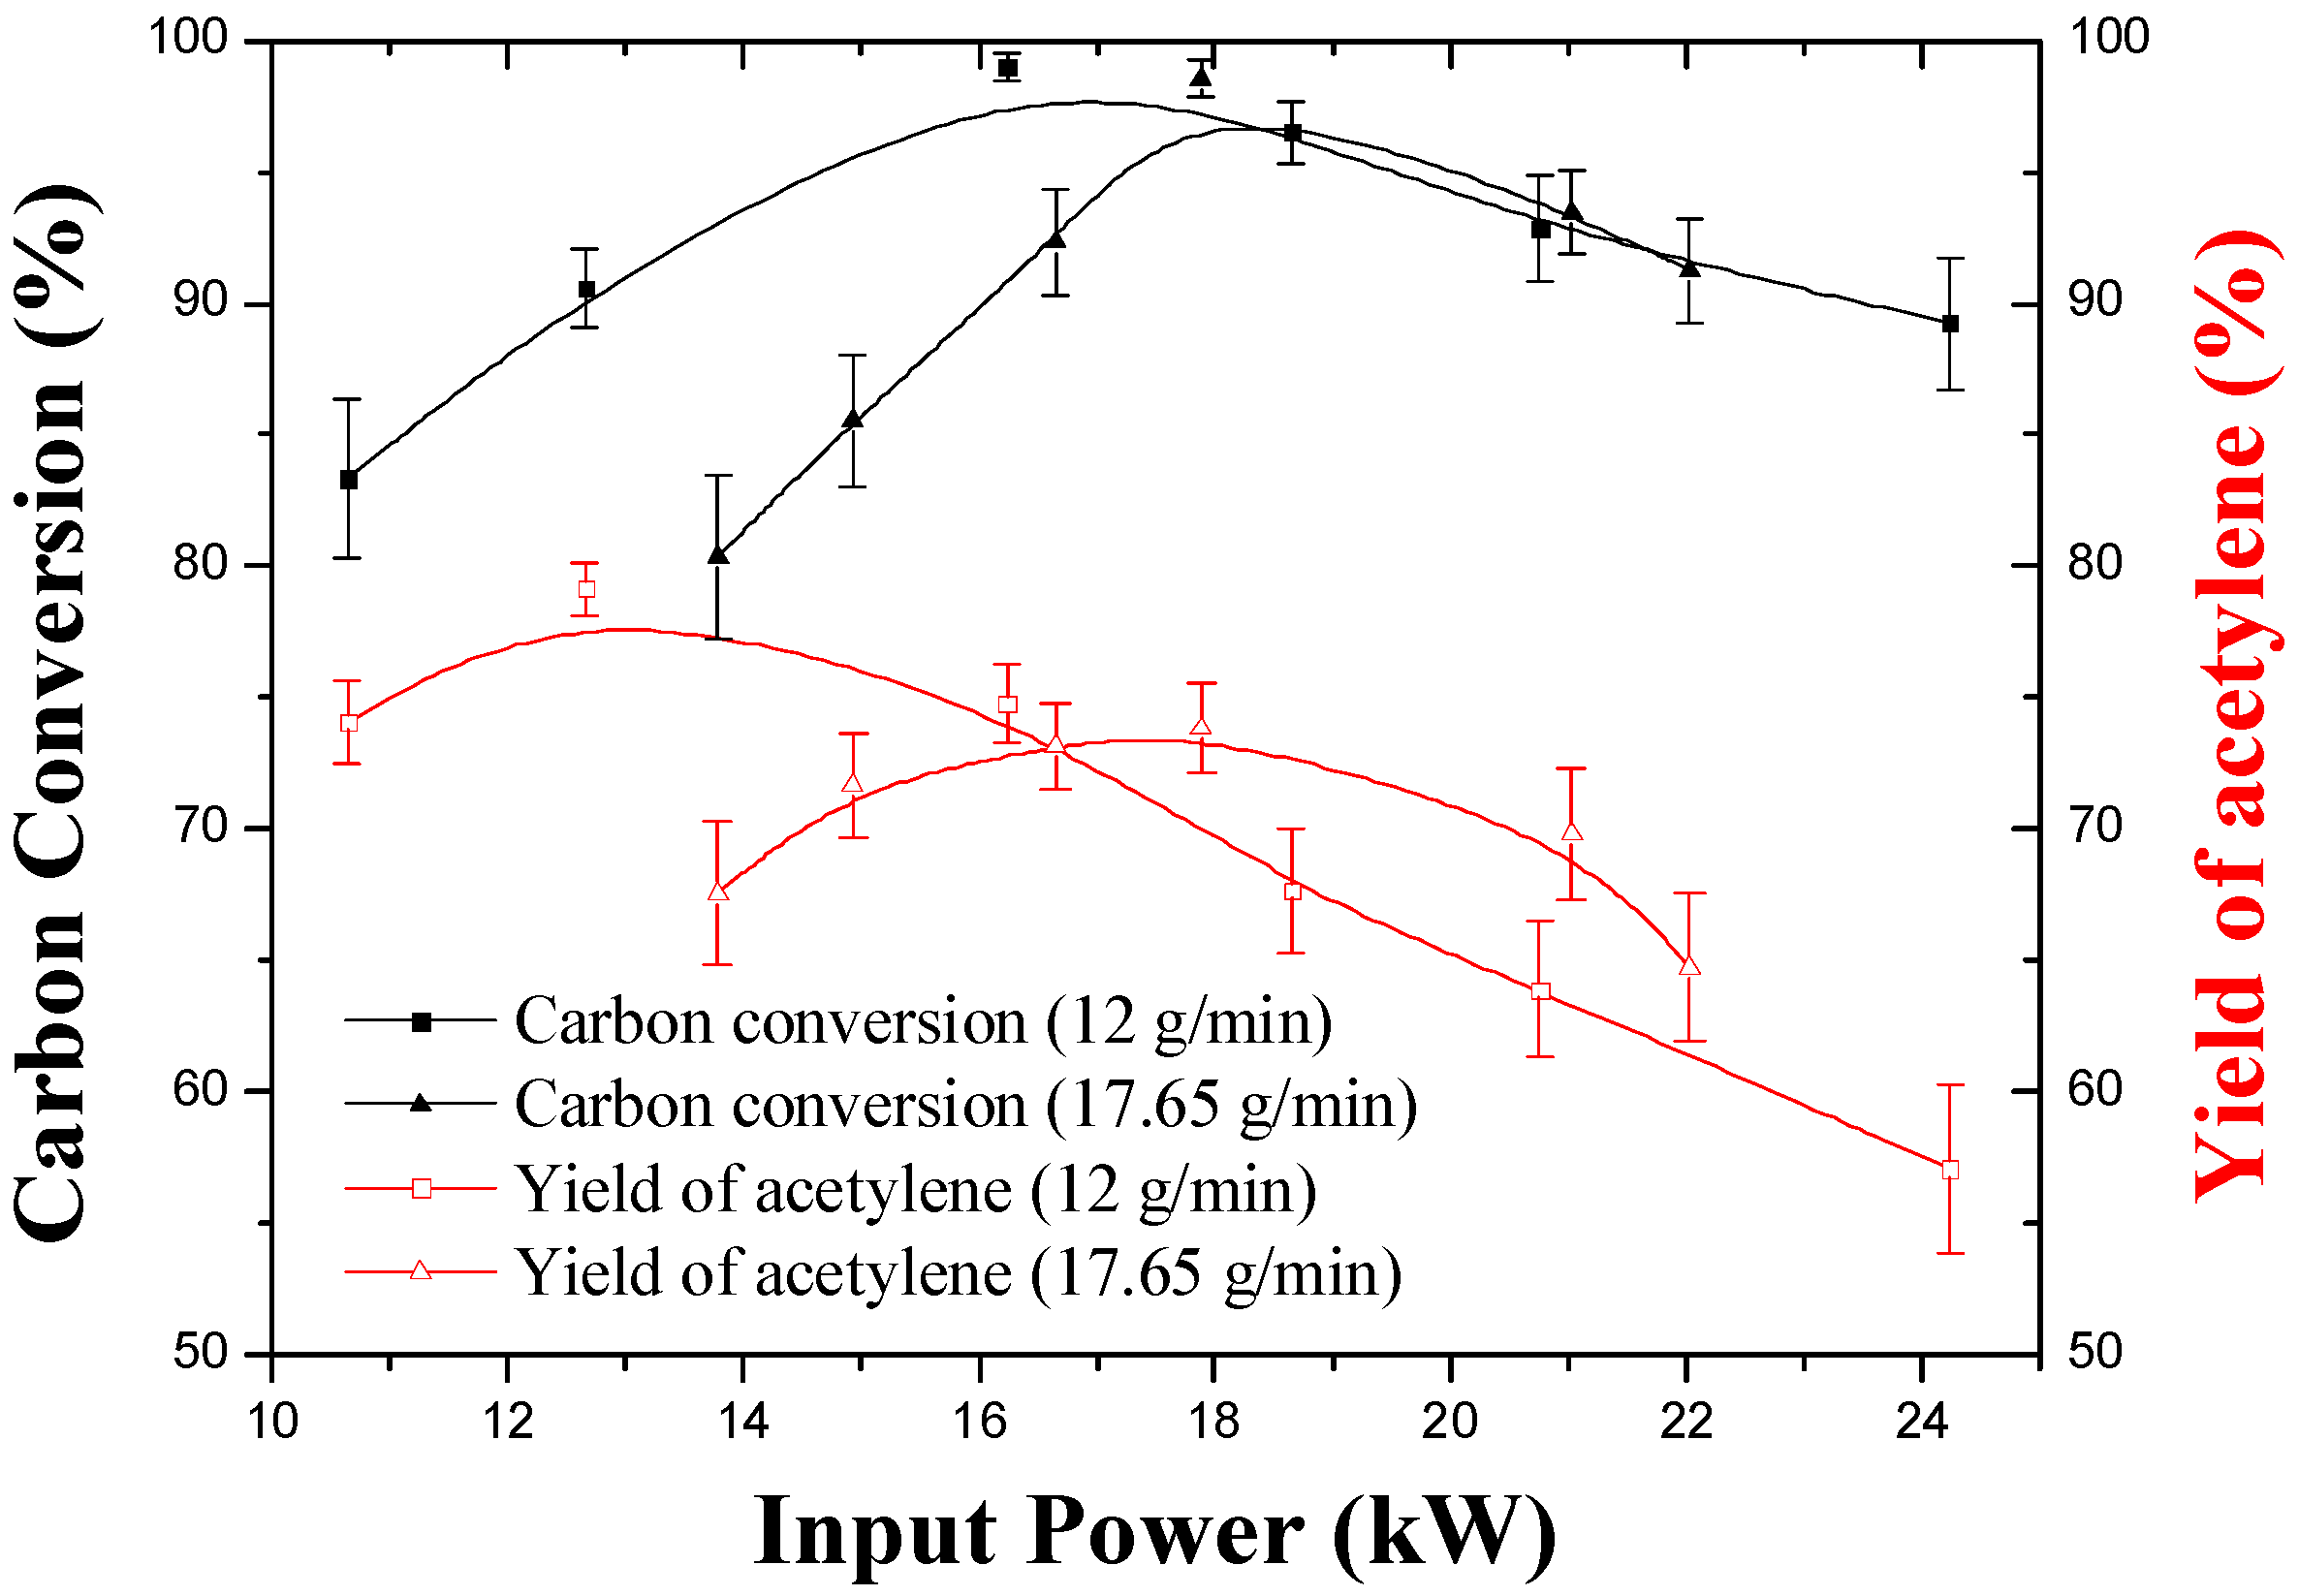
With the observed variation in product gas compositions, it was obvious that the selectivity of acetylene would decline with an increase in input power, as shown in Figure 4. It should be noticed that a higher feed rate was beneficial for a higher selectivity of C2H2, due to the fact that the temperature in the plasma reactor was relatively low at a higher feed rate since more energy was used for pyrolysis. The variations of the carbon conversion and the yield of C2H2 are illustrated in Figure 5. Carbon conversion and the yield of C2H2 both showed a steady initial increase followed by decreasing variation. The maximum carbon conversion rates, 12 g/min and 17.65 g/min (respectively 99.01% and 98.53%) were obtained at input power 16.24 kW and 17.89 kW. This means that approximately complete carbon conversion could be achieved with proper control of input power. The initial increase in input power favors a higher carbon conversion due to the fact that low input power was not enough for complete PE pyrolysis, while a further increase in input power leads to an overheated atmosphere, which is beneficial for the decomposition reaction of acetylene and lowers the carbon conversion. Acetylene yield is related to carbon conversion and the selectivity of acetylene; thus peak yield of acetylene was achieved at a relatively low input power and decreased rapidly due to the decline in both carbon conversion and selectivity of acetylene. Carbon conversion and acetylene yield both peaked under higher input power at a higher feed rate, owing to the fact that more energy was required to achieve a proper temperature for acetylene production with more PE fed into the reactor.
Figure 6 shows the effect of input power on the specific energy consumption (SEC) of C2H2 at varied feed rates. Increased input power favored a higher specific energy consumption of C2H2 at both feed rates. It is also quite obvious that a higher feed rate was beneficial for a lower specific energy consumption of C2H2 due to the higher yield of C2H2; faster growing in SEC was observed at input power higher than 16.24 kW at 12 g/min and 17.89 kW at 17.65 g/min, which are also the input powers where carbon conversion peaked. Optimal specific energy consumption of C2H2 of 21.35 kWh/kg-C2H2 was obtained at 13.78 kW, 17.65 g/min-within the studied power range, which is a little higher than that in the previously reported study (10–15 kWh/kg-C2H2) on hydrocarbons pyrolysis for acetylene [19]. This may result from two factors. First, the heating and mass-transfer efficiency for the polymer particles during pyrolysis should be lower than that for the gaseous hydrocarbon molecules. Second, the thermal efficiency of the lab-scale plasma reactor is relatively low compared with larger reactor.
Based on the results of this series of experiments, it could be concluded that a higher input power, which would lead to a longer feedstock residence time in the high temperature region, would lower the selectivity of acetylene and was beneficial for the formation of side products, therefore leading to a higher specific energy consumption of C2H2. Carbon conversion and yield of acetylene would increase to a peak before beginning to decrease with input power. A higher feed rate would cause higher production of gaseous products and a better specific energy consumption of C2H2, and require higher input power to get the best carbon conversion and yield of acetylene. The most proper input power and feed rate should be decided based on comprehensive consideration of the various parameters including carbon conversion, yield of C2H2, selectivity, and specific energy consumption.
3.3. Effect of Working Gas Flow Rate
In order to investigate the influence of working gas (H2) flow rate on pyrolysis, the working gas flow rate was set at 3 Nm3/h, 5 Nm3/h and 7 Nm3/h, with feed rate at 17.65 g/min, carrier gas flow rate at 1 Nm3/h, magnetic flux density at 0.077 T and input power ranging from 10 kW to 30 kW. In this series of experiments, we did not take the mole fraction of C2H2 and C2H4 into account because the amounts of product gas weren’t the same for the varied working gas flow rate. However, the selectivity and the yield of C2H2 could still be used to evaluate the pyrolysis results since the feed rates were kept unchanged. It is also worth mentioning that higher working gas flow rate would lead to a higher arc voltage, therefore lead to a higher input power.
Figure 7 shows an obvious decrease in the selectivity of C2H2 with the increase of input power. It also shows that higher working gas flow rate favored higher selectivity of C2H2 under equal input power, due to lower energy density, which was favorable for a higher selectivity of acetylene as stated above, in Section 3.2. But a lower working gas flow rate would take an obviously lower input power with it, making it possible to achieve higher selectivity, possibly even over 85%.
The influence of the working gas flow rate on carbon conversion and the yield of C2H2 is illustrated in Figure 8. As shown, carbon conversions at 3 Nm3/h, 5 Nm3/h and 7 Nm3/h gas flow rate all peaked, respectively 95% at 15.22 kW, 98.53% at 17.89 kW and 97.68% at 23.91 kW, before they began to decrease, following the similar variation in the yield of C2H2, which peaked respectively at 77.43%, 73.84% and 75.63% before beginning to decrease. It should be noted that carbon conversion and acetylene yield would reach their peaks at a higher input power when the gas flow rate was high, since a higher gas flow rate would reduce the energy density so that higher input power would be required to get the energy density most suitable for acetylene formation. With proper controlled conditions, a high carbon conversion (>95%) and a high yield of C2H2 (>70%) could be achieved at all three working gas flow rates. Higher input power for high carbon conversion and C2H2 yield was required at the higher gas flow rates.
The variation in SEC of C2H2 at varied working gas flow rates is shown in Figure 9. It is obvious that a lower working gas flow rate was beneficial for better SEC of C2H2. At a gas flow rate of 3 Nm3/h and with 11.26 kW input power, the best SEC of C2H2 (15.69 kWh/kg-C2H2) was achieved.
As seen in this series of experiments, a lower working gas flow rate, leading to a lower arc voltage and input power, made it easier to achieve higher selectivity of acetylene (>85%) and lower specific energy consumption, and required lower input power to obtain a satisfying carbon conversion and yield of acetylene. At 15.12 kW input power and a 17.65 g/min feed rate, product gas with a carbon conversion of 94.54%, C2H2 yield of 77.43%, C2H2 selectivity of 81.90% and an SEC of C2H2 of 19.86 kWh/kg-C2H2 was obtained, which is quite an impressive pyrolysis result.
3.4. Polypropylene Pyrolysis
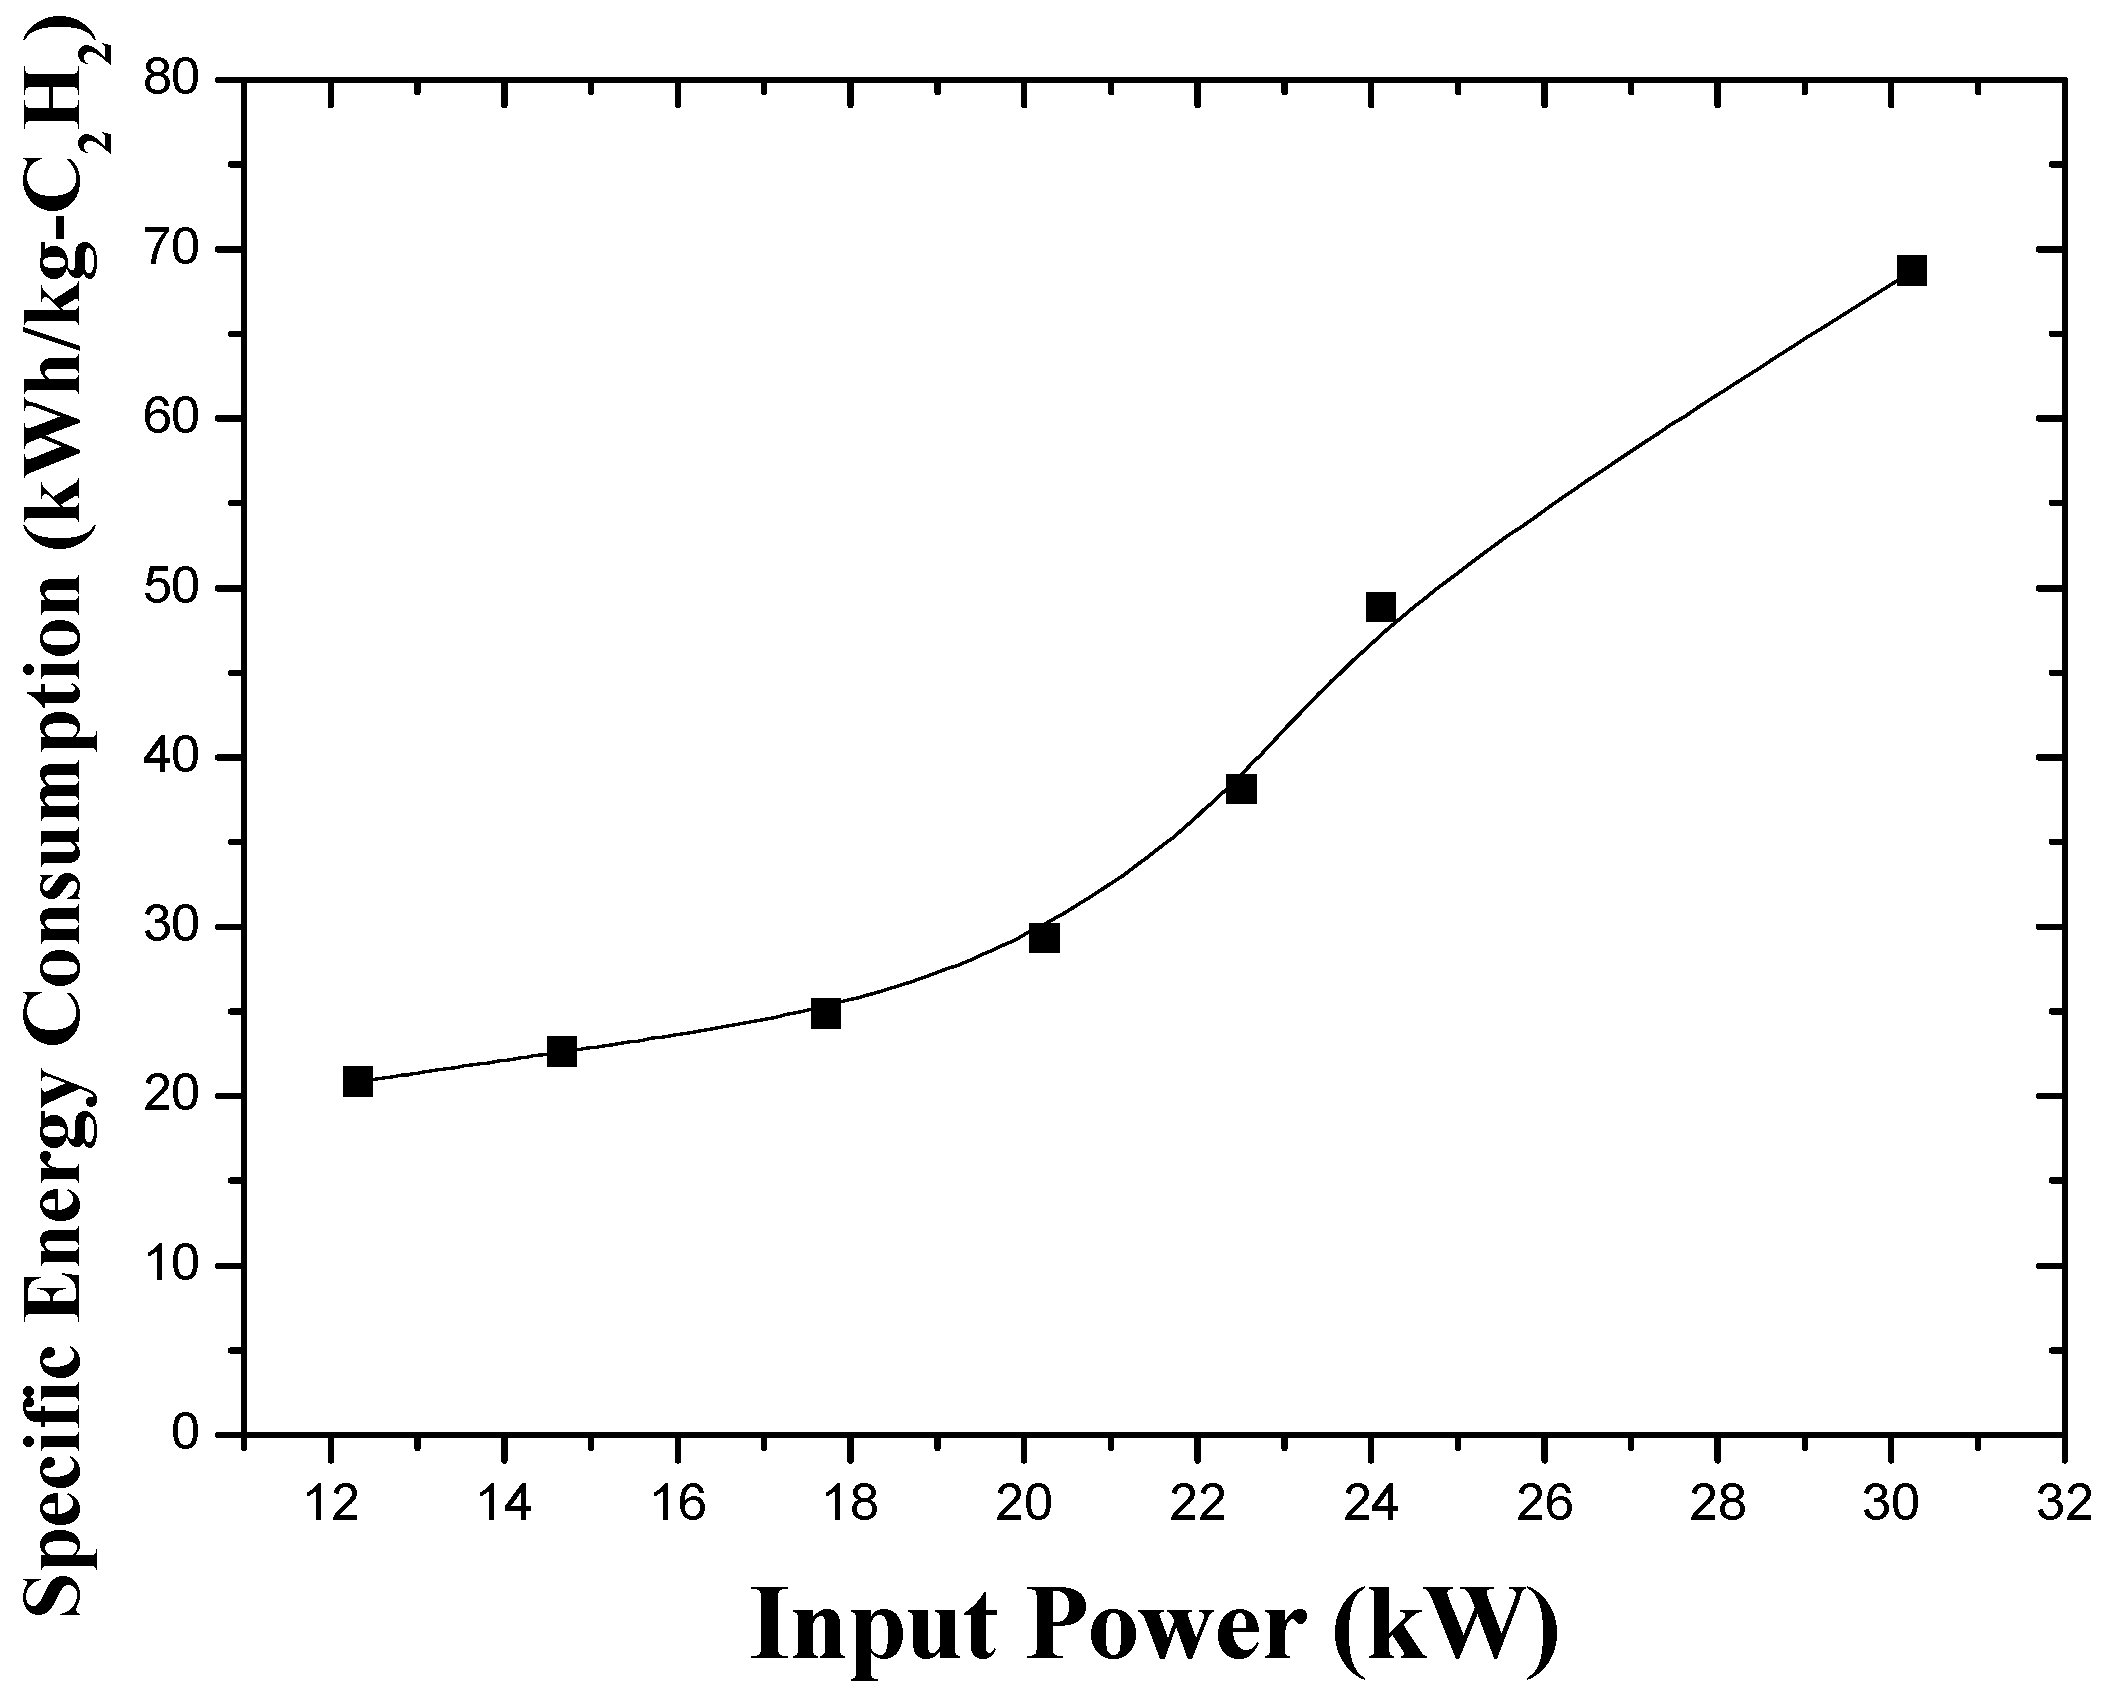
Polypropylene is also a widely used polyolefin. A series of experiments on polypropylene pyrolysis was carried out to see if thermal plasma was also an efficient route to the utilization of polypropylene. Propylene was fed into the plasma torch at 17.65 g/min, with working gas flow rate set at 5 Nm3/h and carrier gas flow rate at 1 Nm3/h. The product gas composition was quite similar to that of PE pyrolysis: mostly C2H2, C2H4 and CH4. The variation in the composition of product gas is shown in Figure 10. The mole fraction of C2H2 peaked at 6% and then dropped gradually with increased input power, while the concentrations of C2H4 and CH4 increased with input power due to the temperature variation within the plasma reactor as input power changed.
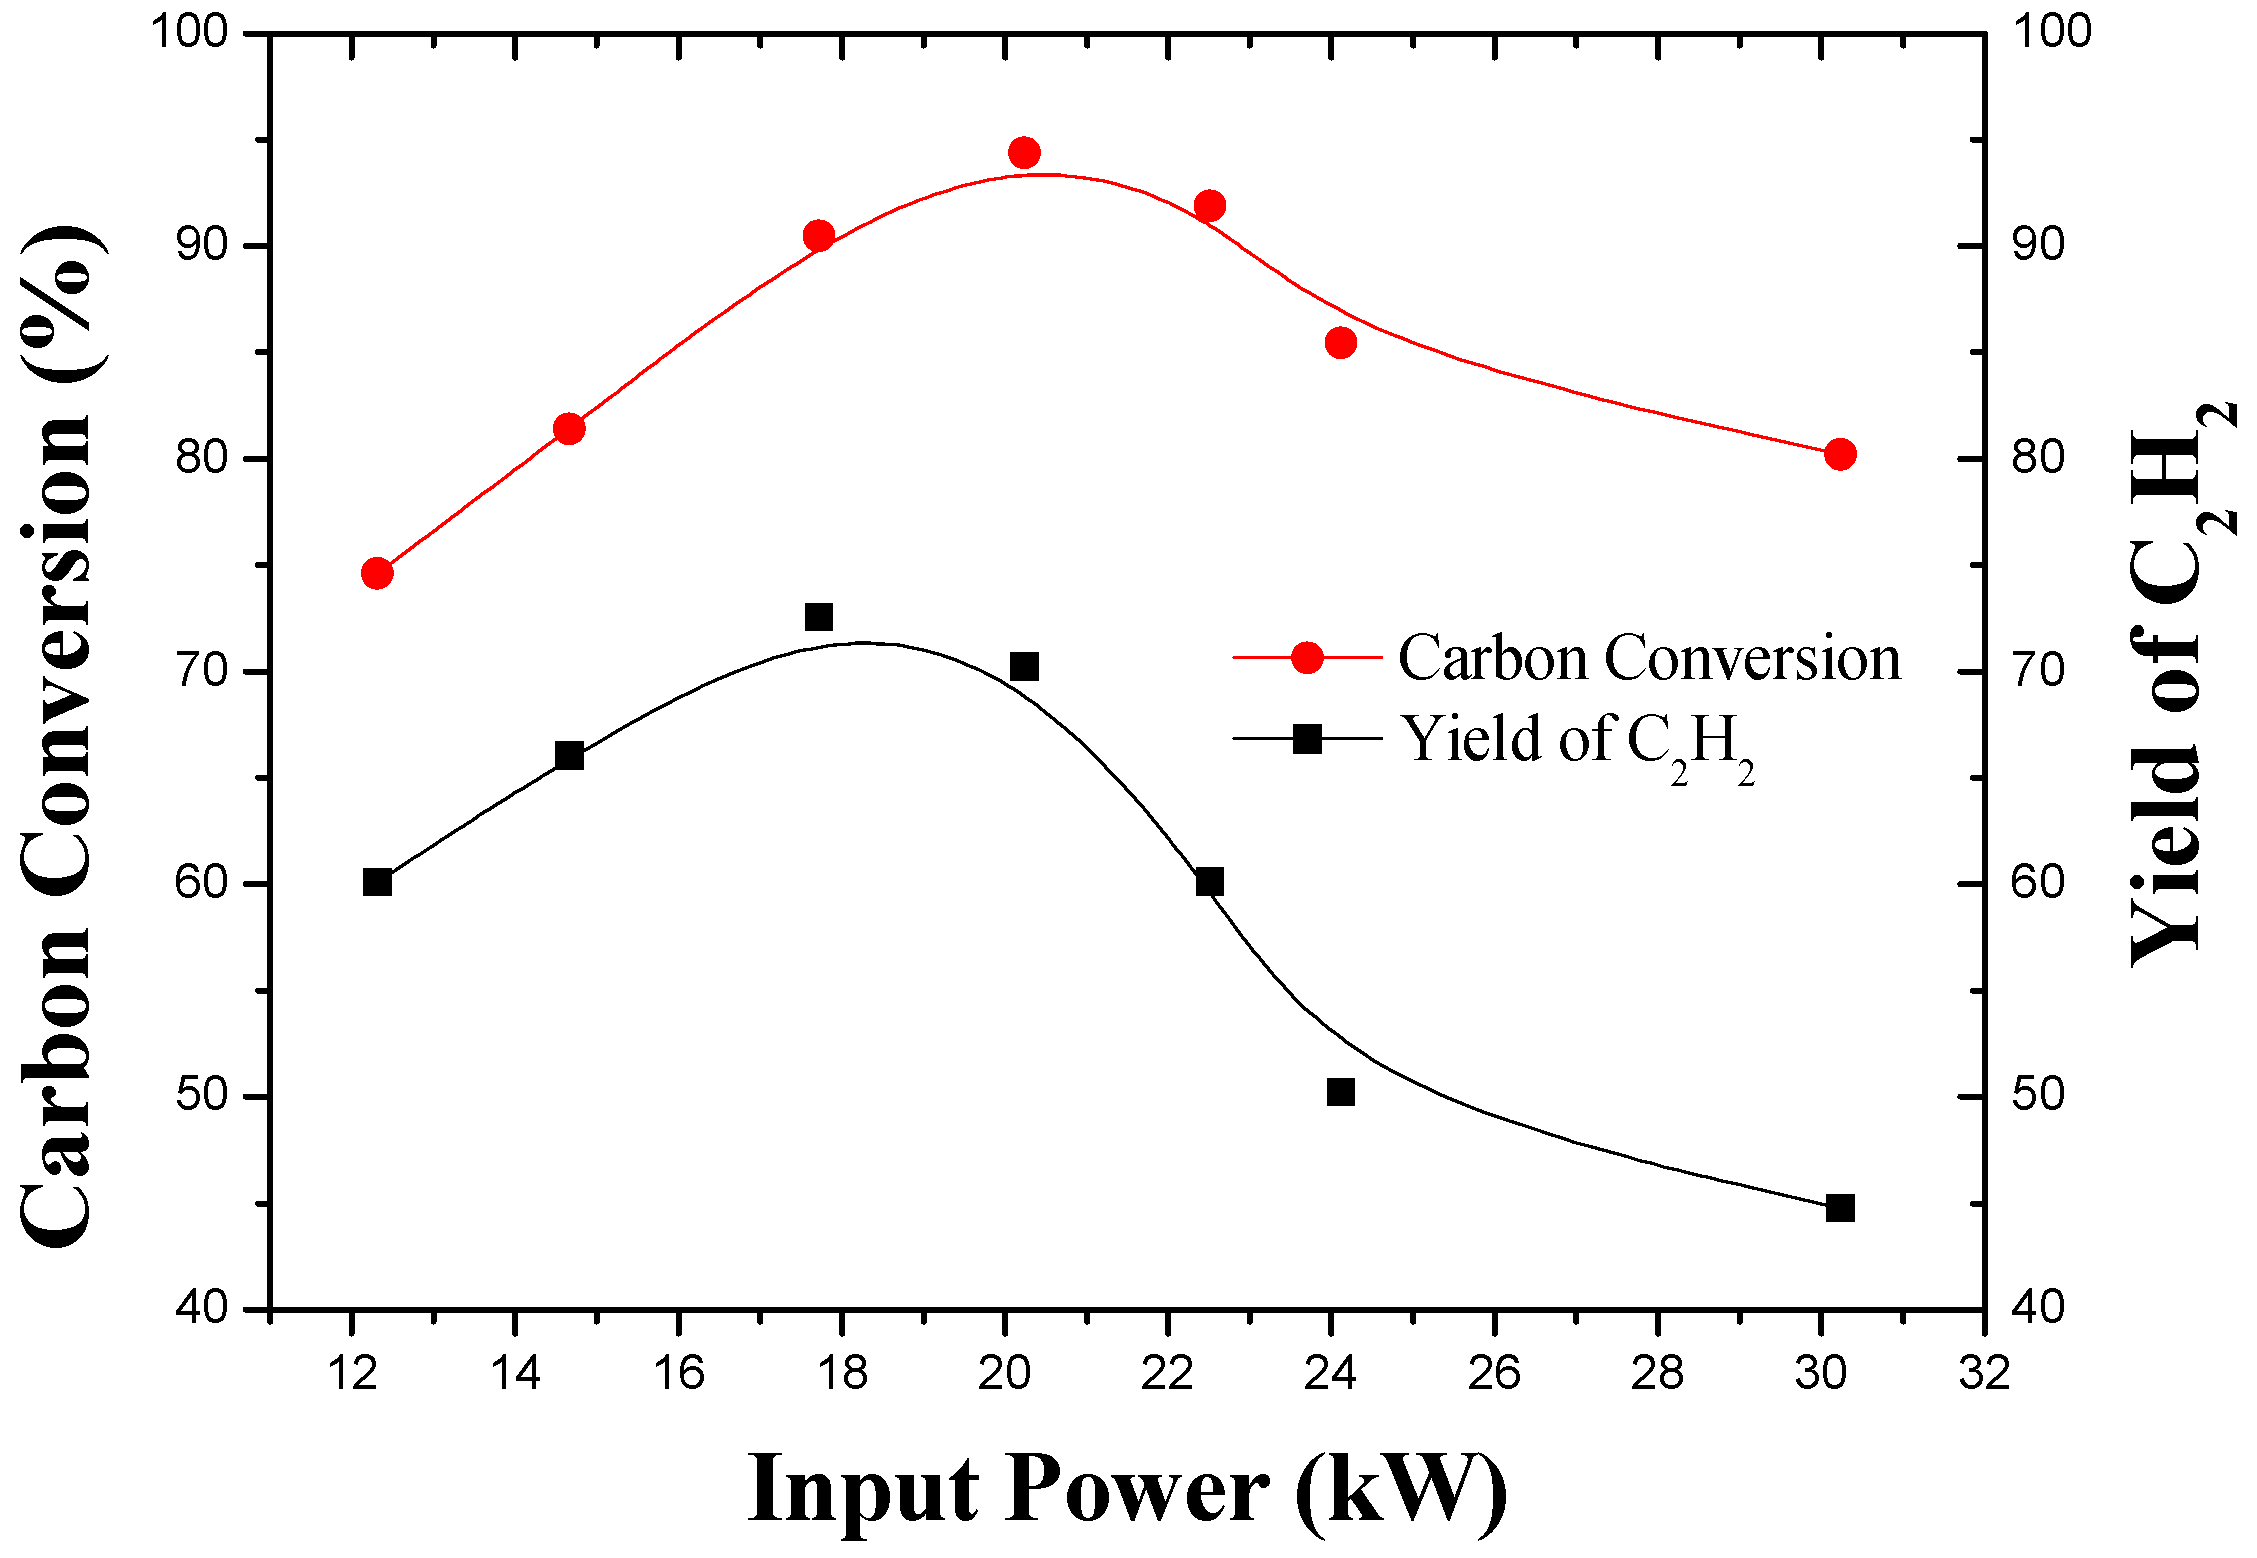
The effect of input power on the selectivity of C2H2 is illustrated in Figure 11. With the variation in the composition of product gas shown in Figure 10, it was quite obvious that the selectivity of C2H2 would decrease with increased input power, which is exactly as Figure 11 shows. The carbon conversion and yield of C2H2 is shown in Figure 12, which follows a similar tendency to that in PE pyrolysis. Carbon conversion and the yield of C2H2 peaked respectively at 94.37% and 72.55%, before decreasing with input power due to the variation in the temperature in the reactor with varied input power. Figure 13 shows the variation in specific energy consumption (SEC) of C2H2 with varied input power. With proper working parameters, the SEC of C2H2 could be 20 kWh/kg-C2H2, which is quite impressive. Variations among the results could be found among the pyrolysis results of polyethylene and polypropylene. It is speculated that the variation in particle size and molecular structure are the main cause of the results. The particle size would influence the rate of heat transfer and gasification, therefore would affect the results of pyrolysis. The methyl group on the carbon chain of polypropylene would affect the random main-chain scission, depolymerization and the side-group reactions, but the specific effect on pyrolysis is not clear.
Based on the experiments described in this section, it can be concluded that thermal plasma is a promising route to utilize polypropylene. Therefore, it may be expected that thermal plasma technology could be used in the utilization of other polyolefins.
4. Conclusions
The feasibility of plasma pyrolysis of polyolefin for production of C2H2 using a rotating arc plasma reactor has been demonstrated for the first time on a laboratory scale, using powder of polyethylene and PP as model feedstock. The gaseous products were principally a mixture of light hydrocarbons, mostly C2H2 along with some C2H4 and CH4. Input power, feed rate and working gas flow rate were the primary parameters investigated in this work. Carbon conversion increased with the increase of input power and reached a peak of approximately 90–95% before it began to decrease with further increase of input power. Lower input power was beneficial to higher selectivity and lower SEC of C2H2. An increase of the feed rate would require higher input power to get the whole feedstock pyrolyzed, and would lead to a higher C2H2 concentration in product gas. Higher working gas flow rate would lower the energy density, so a higher input power was required to achieve a better pyrolysis result. With proper parameter control in the PE pyrolysis, a product gas with approximately 10% C2H2 could be obtained, with a selectivity higher than 80%, a yield of C2H2 higher than 70%, and a complete carbon conversion, as well as a SEC lower than 20 kWh/kg-C2H2. Impressive results were also obtained in the experiments on propylene pyrolysis. This work shows that DC arc plasma is a promising method for the production of C2H2 from polyolefins. Considering the high value and limited sources of C2H2, and the fact that it is scarcely produced from petroleum and natural gas industry, this experiment creates a new opportunity for the high-value conversion of waste polyolefins, and is also instructive for the green production of C2H2 with much less CO2 discharge and energy consumption than the calcium carbide method. In the future, more studies are needed to improve the proposed method. For example, it is necessary to develop more efficient methods of recovering energy from the high temperature pyrolysis gas to reduce the energy cost, and the characterization and utilization of the solid products from pyrolysis is also important to the overall economy of pyrolysis process. The pyrolysis of more kinds of polymer waste needs to be studied as well.
Acknowledgments
The authors are grateful for the financial support from the National Key Research and Development Program of China (2016YFB0301800) and the National High Technology Research and Development Program of China (2015AA020201).
Author Contributions
Qiwei Yang and Baogen Su conceived and designed the experiments; Ming Zhang and Jie Ma performed the experiments; Guangdong Wen and Qilong Ren analyzed the data; Ming Zhang wrote the paper.
Conflicts of Interest
The authors declare no conflict of interest.
Nomenclature
| mi | Flow rate of component i (g/min) |
| Ci% | Mass fraction of C in component i (%) |
| mfs | Feed rate (g/min) |
| Cfs% | Mass fraction of C in feedstock (%) |
| U | Arc voltage (V) |
| I | Arc current (A) |
| X | Carbon conversion to gaseous product (%) |
| Se | Selectivity of acetylene (%) |
| Y | Yield of acetylene (%) |
| SEC | Specific energy consumption of acetylene (%) |
References
- Moulay, S. Chemical modification of poly(vinyl chloride)-still on the run. Prog. Polym. Sci. 2010, 35, 303–331. [Google Scholar] [CrossRef]
- Hamad, K.; Kaseem, M.; Deri, F. Recycling of waste from polymer materials: An overview of the recent works. Polym. Degrad. Stab. 2013, 98, 2801–2812. [Google Scholar] [CrossRef]
- Achiliasa, D.S.; Roupakiasa, C.; Megalokonomosa, P.; Lappasb, A.A.; Antonakoub, E.V. Chemical recycling of plastic wastes made from polyethylene (LDPE and HDPE) and polypropylene (PP). J. Hazard. Mater. 2007, 149, 536–542. [Google Scholar] [CrossRef] [PubMed]
- Abreu, D.A.P.; Losada, P.P.; Angulo, I.; Cruz, J.M. Development of new polyolefin films with nanoclays for application in food packaging. Eur. Polym. J. 2007, 43, 2229–2243. [Google Scholar] [CrossRef]
- Pasti, L.; Melucci, D.; Contado, C.; Dondi, F.; Mingozzi, I. Calibration in thermal field flow fractionation with polydisperse standards: Application to polyolefin characterization. J. Sep. Sci. 2015, 25, 691–702. [Google Scholar] [CrossRef]
- Huang, S.-J. Polymer Waste management–biodegradation, incineration, and recycling. J. Macromol. Sci. A 1995, 32, 593–597. [Google Scholar] [CrossRef]
- He, M.; Xiao, B.; Hu, Z.; Liu, S.; Guo, X.; Luo, S. Syngas production from catalytic gasification of waste polyethylene: Influence of temperature on gas yield and composition. Int. J. Hydrogen Energy 2009, 34, 1342–1348. [Google Scholar] [CrossRef]
- Yu, J.; Sun, L.; Ma, C.; Qiao, Y.; Yao, H. Thermal degradation of PVC: A review. Waste Manag. 2016, 48, 300–314. [Google Scholar] [CrossRef] [PubMed]
- Conesa, J.A.; Font, R.; Marcilla, A.; Garcia, A.N. Pyrolysis of polyethylene in a fluidized bed reactor. Energy Fuels 1994, 8, 1238–1246. [Google Scholar] [CrossRef]
- Westerhout, R.W.J.; Waanders, J.; Kuipers, J.A.M.; Swaaij, W.P.M. Kinetics of the low-temperature pyrolysis of polyethene, polypropene, and polystyrene modeling, experimental determination, and comparison with literature models and data. Ind. Eng. Chem. Res. 1997, 36, 1955–1964. [Google Scholar] [CrossRef]
- Hınıslıoğlu, S.; Ağar, E. Use of waste high density polyethylene as bitumen modifier in asphalt concrete mix. Mater. Lett. 2004, 58, 267–271. [Google Scholar] [CrossRef]
- Ciliz, N.K.; Ekinci, E.; Snape, C.E. Pyrolysis of virgin and waste polypropylene and its mixtures with waste polyethylene and polystyrene. Waste Manag. 2004, 24, 173–181. [Google Scholar] [CrossRef] [PubMed]
- Christmann, W.; Kasiske, D.; Klöppel, K.D.; Partscht, H.; Rotard, W. Combustion of polyvinylchloride: An important source for the formation of PCDD/PCDF. Chemosphere 1989, 19, 387–392. [Google Scholar] [CrossRef]
- Ma, J.; Su, B.; Wen, G.; Ren, Q.; Yang, Y.; Yang, Q.; Xing, H. Kinetic modeling and experimental validation of the pyrolysis of propane in hydrogen plasma. Int. J. Hydrogen Energy 2016, 41, 22689–22697. [Google Scholar] [CrossRef]
- Yan, B.; Cheng, Y.; Cheng, Y. Particle-scale modeling of coal devolatilization behaviors for coal pyrolysis in thermal plasma reactors. AIChE J. 2014, 61, 913–921. [Google Scholar] [CrossRef]
- Zhang, M.; Xue, W.; Su, B.; Bao, Z.; Wen, G.; Xing, H.; Ren, Q. Conversion of glycerol into syngas by rotating DC arc plasma. Energy 2017, 123, 1–8. [Google Scholar] [CrossRef]
- Xu; Yang, X.; Sun, Y.; Zhang, J.; Song, J. MW-DC hybrid plasma conversion of natural gas to acetylene. Acta Chim. Sin. 2005, 63, 625–630. [Google Scholar]
- Gehrmann, K.; Schmidt, H. Pyrolysis of hydrocarbons using a hydrogen plasma. In Proceedings of the 8th World Petroleum Congress, Moscow, Russia, 13–18 June 1971. [Google Scholar]
- Beiers, H.G.; Baumann, H.; Bittner, D.; Klein, J.; Jüntgen, H. Pyrolysis of some gaseous and liquid hydrocarbons in hydrogen plasma. Fuel 1988, 67, 1012–1016. [Google Scholar] [CrossRef]
- Tao, X.; Dai, W.; Chen, Q.; Yin, Y.; Dai, X. Experimental study on production of acetylene from natural gas by plasma jet. Nat. Gas Ind. 2006, 26, 131–134. [Google Scholar]
- Chen, H.; Xie, K. Thermodynamic analysis of the hydrogen-carbon system for acetylene production by plasma. Chin. J. Process Eng. 2002, 2, 112–117. [Google Scholar]
- Arena, U. Process and technological aspects of municipal solid waste gasification: A review. Waste Manag. 2012, 32, 625–639. [Google Scholar] [CrossRef] [PubMed]
- Sakai, S.; Hiraoka, M. Municipal solid waste incinerator residue recycling by thermal processes. Waste Manag. 2000, 20, 249–258. [Google Scholar] [CrossRef]
- Zhang, Q.; Dor, L.; Fenigshtein, D.; Yang, W.; Blasiak, W. Gasification of municipal solid waste in the Plasma Gasification Melting process. Appl. Energy 2012, 90, 106–112. [Google Scholar] [CrossRef]
- Kerzelis, R.; Mecius, V.; Valinciute, V.; Valincius, V. Waste and biomass treatment employing plasma technology. High Temp. Mater. Processes 2004, 8, 273–282. [Google Scholar] [CrossRef]
- Guddeti, R.R.; Knight, R.; Grossmann, E.D. Depolymerization of polyethylene using induction-coupled plasma technology. Plasma Chem. Plasma Process. 2000, 20, 37–64. [Google Scholar] [CrossRef]
- Guddeti, R.R.; Knight, R.; Grossmann, E.D. Depolymerization of polypropylene in an induction-coupled plasma (ICP) reactor. Ind. Eng. Chem. Res. 2000, 39, 1171–1176. [Google Scholar] [CrossRef]
- Chang, J.-S.; Gu, B.-W.; Looy, P.C.; Chu, F.-Y.; Simpson, C.J. Thermal plasma pyrolysis of used old tires for production of syngas. J. Environ. Sci. Health A 1996, 31, 1781–1799. [Google Scholar] [CrossRef]
- Baumann, H.; Bitter, D.; Beiers, H.G.; Klein, J.; Jüntgen, H. Pyrolysis of coal in hydrogen and helium plasmas. Fuel 1988, 67, 1120–1123. [Google Scholar] [CrossRef]
Figure 1.
Schematic diagram of 50 kW rotating DC arc plasma reactor. 1—material feeder, 2—DC power supply, 3—cathode, 4—field coil, 5—anode, 6—heat exchanger, 7—GC, 8—quenching unit.
Figure 1.
Schematic diagram of 50 kW rotating DC arc plasma reactor. 1—material feeder, 2—DC power supply, 3—cathode, 4—field coil, 5—anode, 6—heat exchanger, 7—GC, 8—quenching unit.
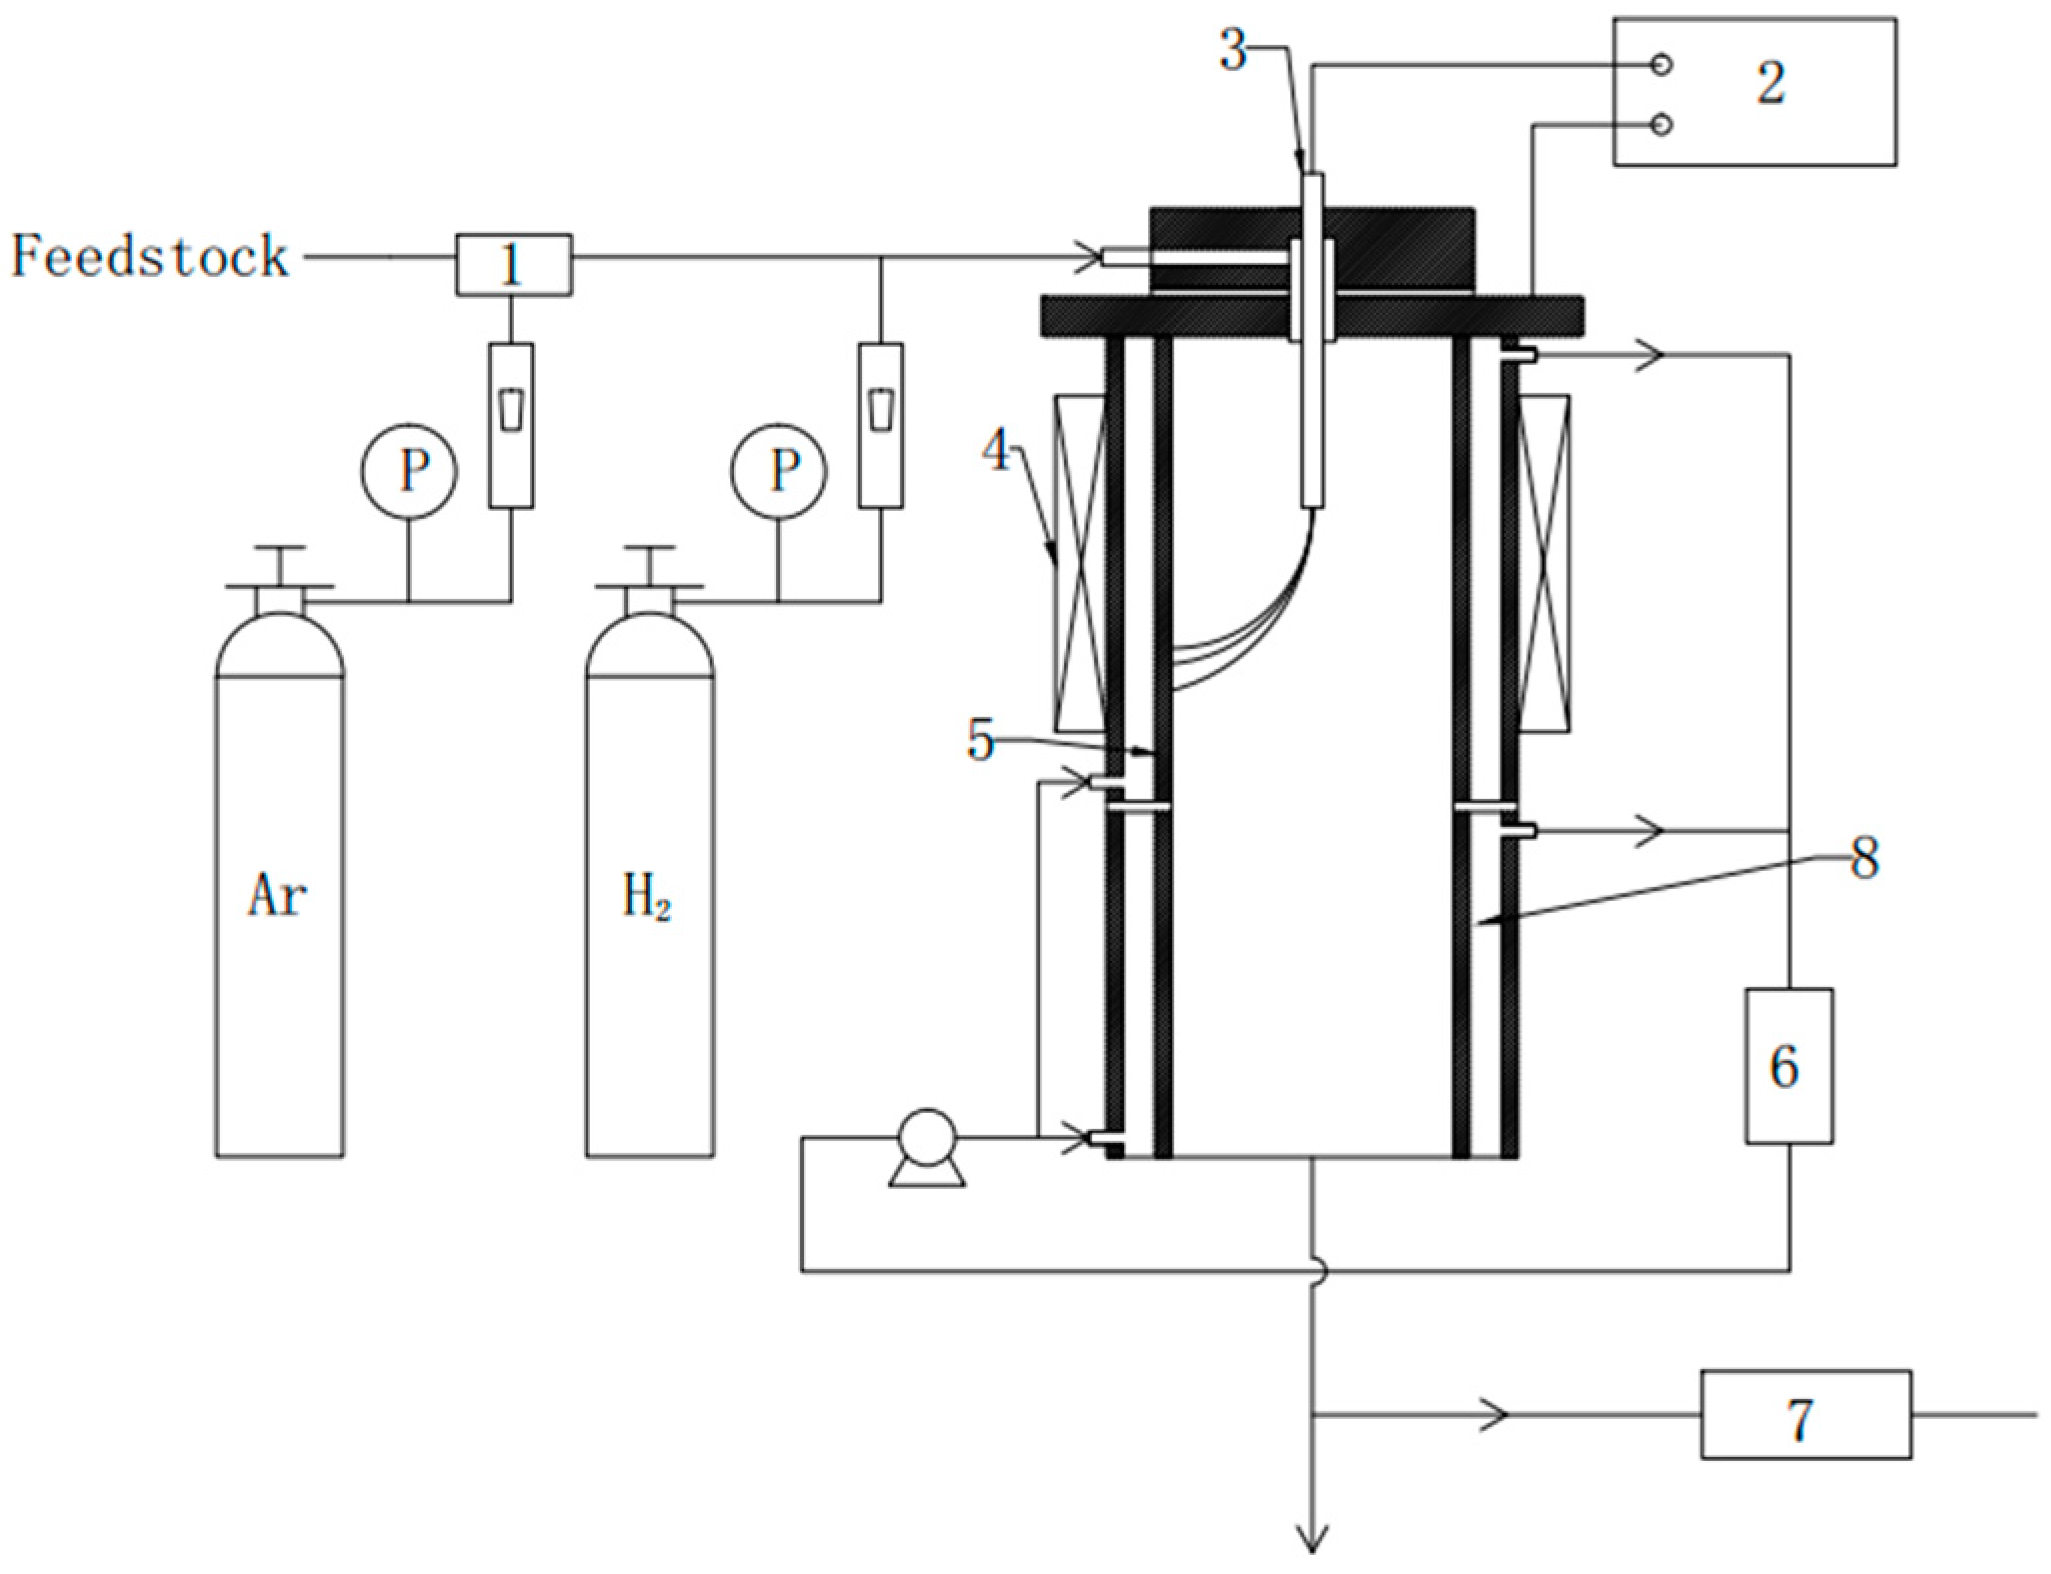
Figure 2.
Thermodynamic simulation of PE pyrolysis in equilibrium model.

Figure 3.
Effects of input power on the product gas composition at feed rate of 12 g/min (a) and 17.65 g/min (b) (Carrier gas flow rate: 1 Nm3/h; working gas flow rate: 5 Nm3/h; magnetic flux intensity: 0.077 T).
Figure 3.
Effects of input power on the product gas composition at feed rate of 12 g/min (a) and 17.65 g/min (b) (Carrier gas flow rate: 1 Nm3/h; working gas flow rate: 5 Nm3/h; magnetic flux intensity: 0.077 T).
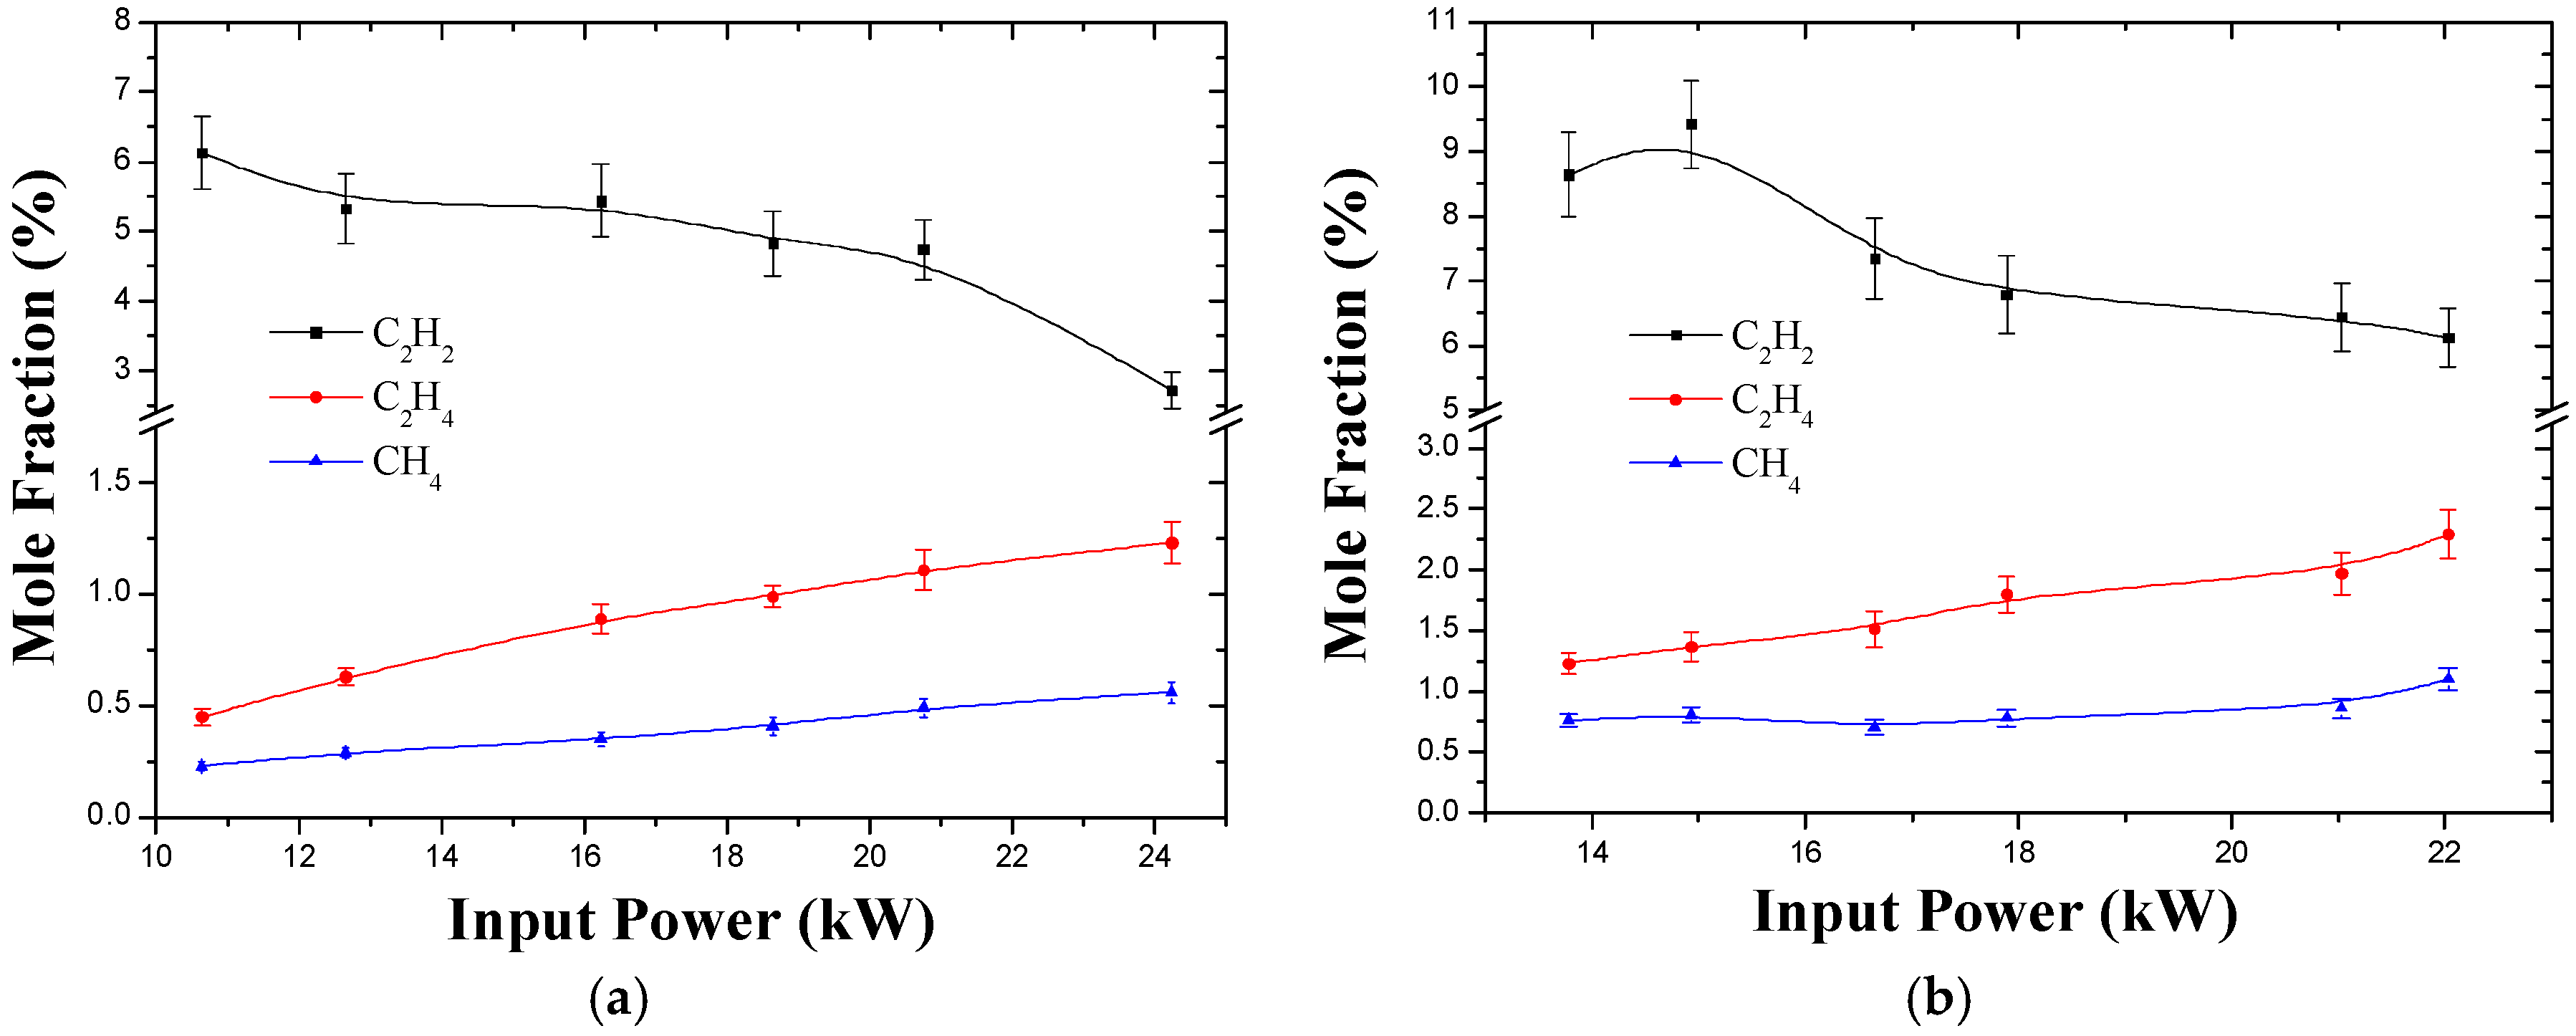
Figure 4.
Effects of input power on the selectivity of C2H2 at feed rate of 12 g/min and 17.65 g/min (Carrier gas flow rate: 1 Nm3/h; working gas flow rate: 5 Nm3/h; magnetic flux intensity: 0.077 T).
Figure 4.
Effects of input power on the selectivity of C2H2 at feed rate of 12 g/min and 17.65 g/min (Carrier gas flow rate: 1 Nm3/h; working gas flow rate: 5 Nm3/h; magnetic flux intensity: 0.077 T).
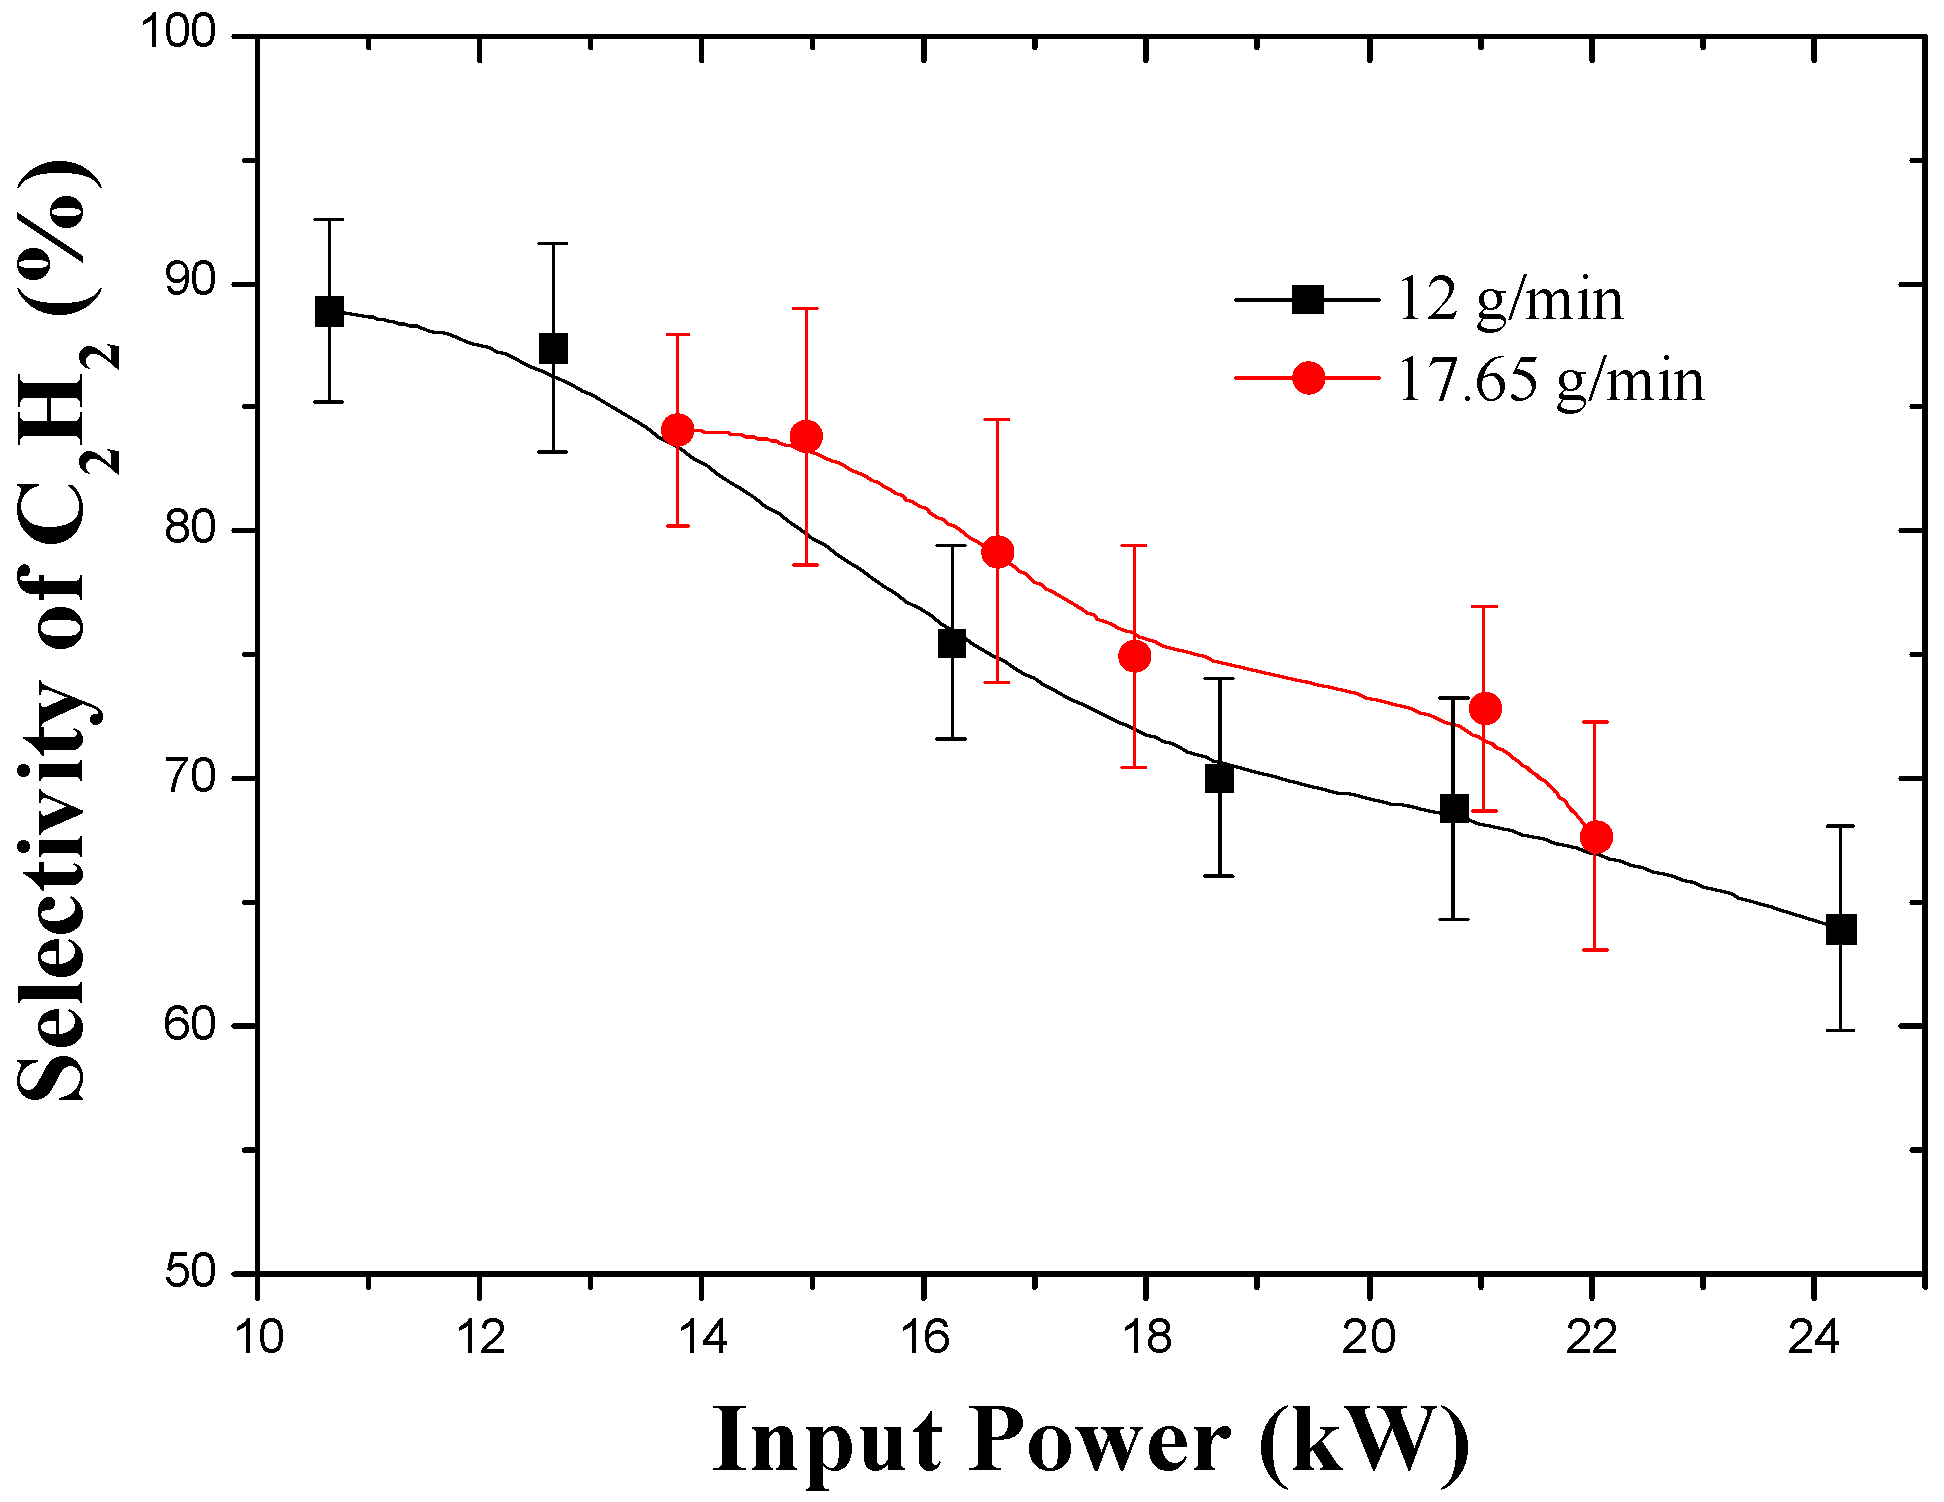
Figure 5.
Effects of input power on the carbon conversion and yield of C2H2 at feed rate of 12 g/min and 17.65 g/min (Carrier gas flow rate: 1 Nm3/h; working gas flow rate: 5 Nm3/h; magnetic flux intensity: 0.077 T).
Figure 5.
Effects of input power on the carbon conversion and yield of C2H2 at feed rate of 12 g/min and 17.65 g/min (Carrier gas flow rate: 1 Nm3/h; working gas flow rate: 5 Nm3/h; magnetic flux intensity: 0.077 T).

Figure 6.
Effects of input power on the specific energy consumption (SEC) of C2H2 at feed rate of 12 g/min and 17.65 g/min (Carrier gas flow rate: 1 Nm3/h; working gas flow rate: 5 Nm3/h; magnetic flux intensity: 0.077 T).
Figure 6.
Effects of input power on the specific energy consumption (SEC) of C2H2 at feed rate of 12 g/min and 17.65 g/min (Carrier gas flow rate: 1 Nm3/h; working gas flow rate: 5 Nm3/h; magnetic flux intensity: 0.077 T).
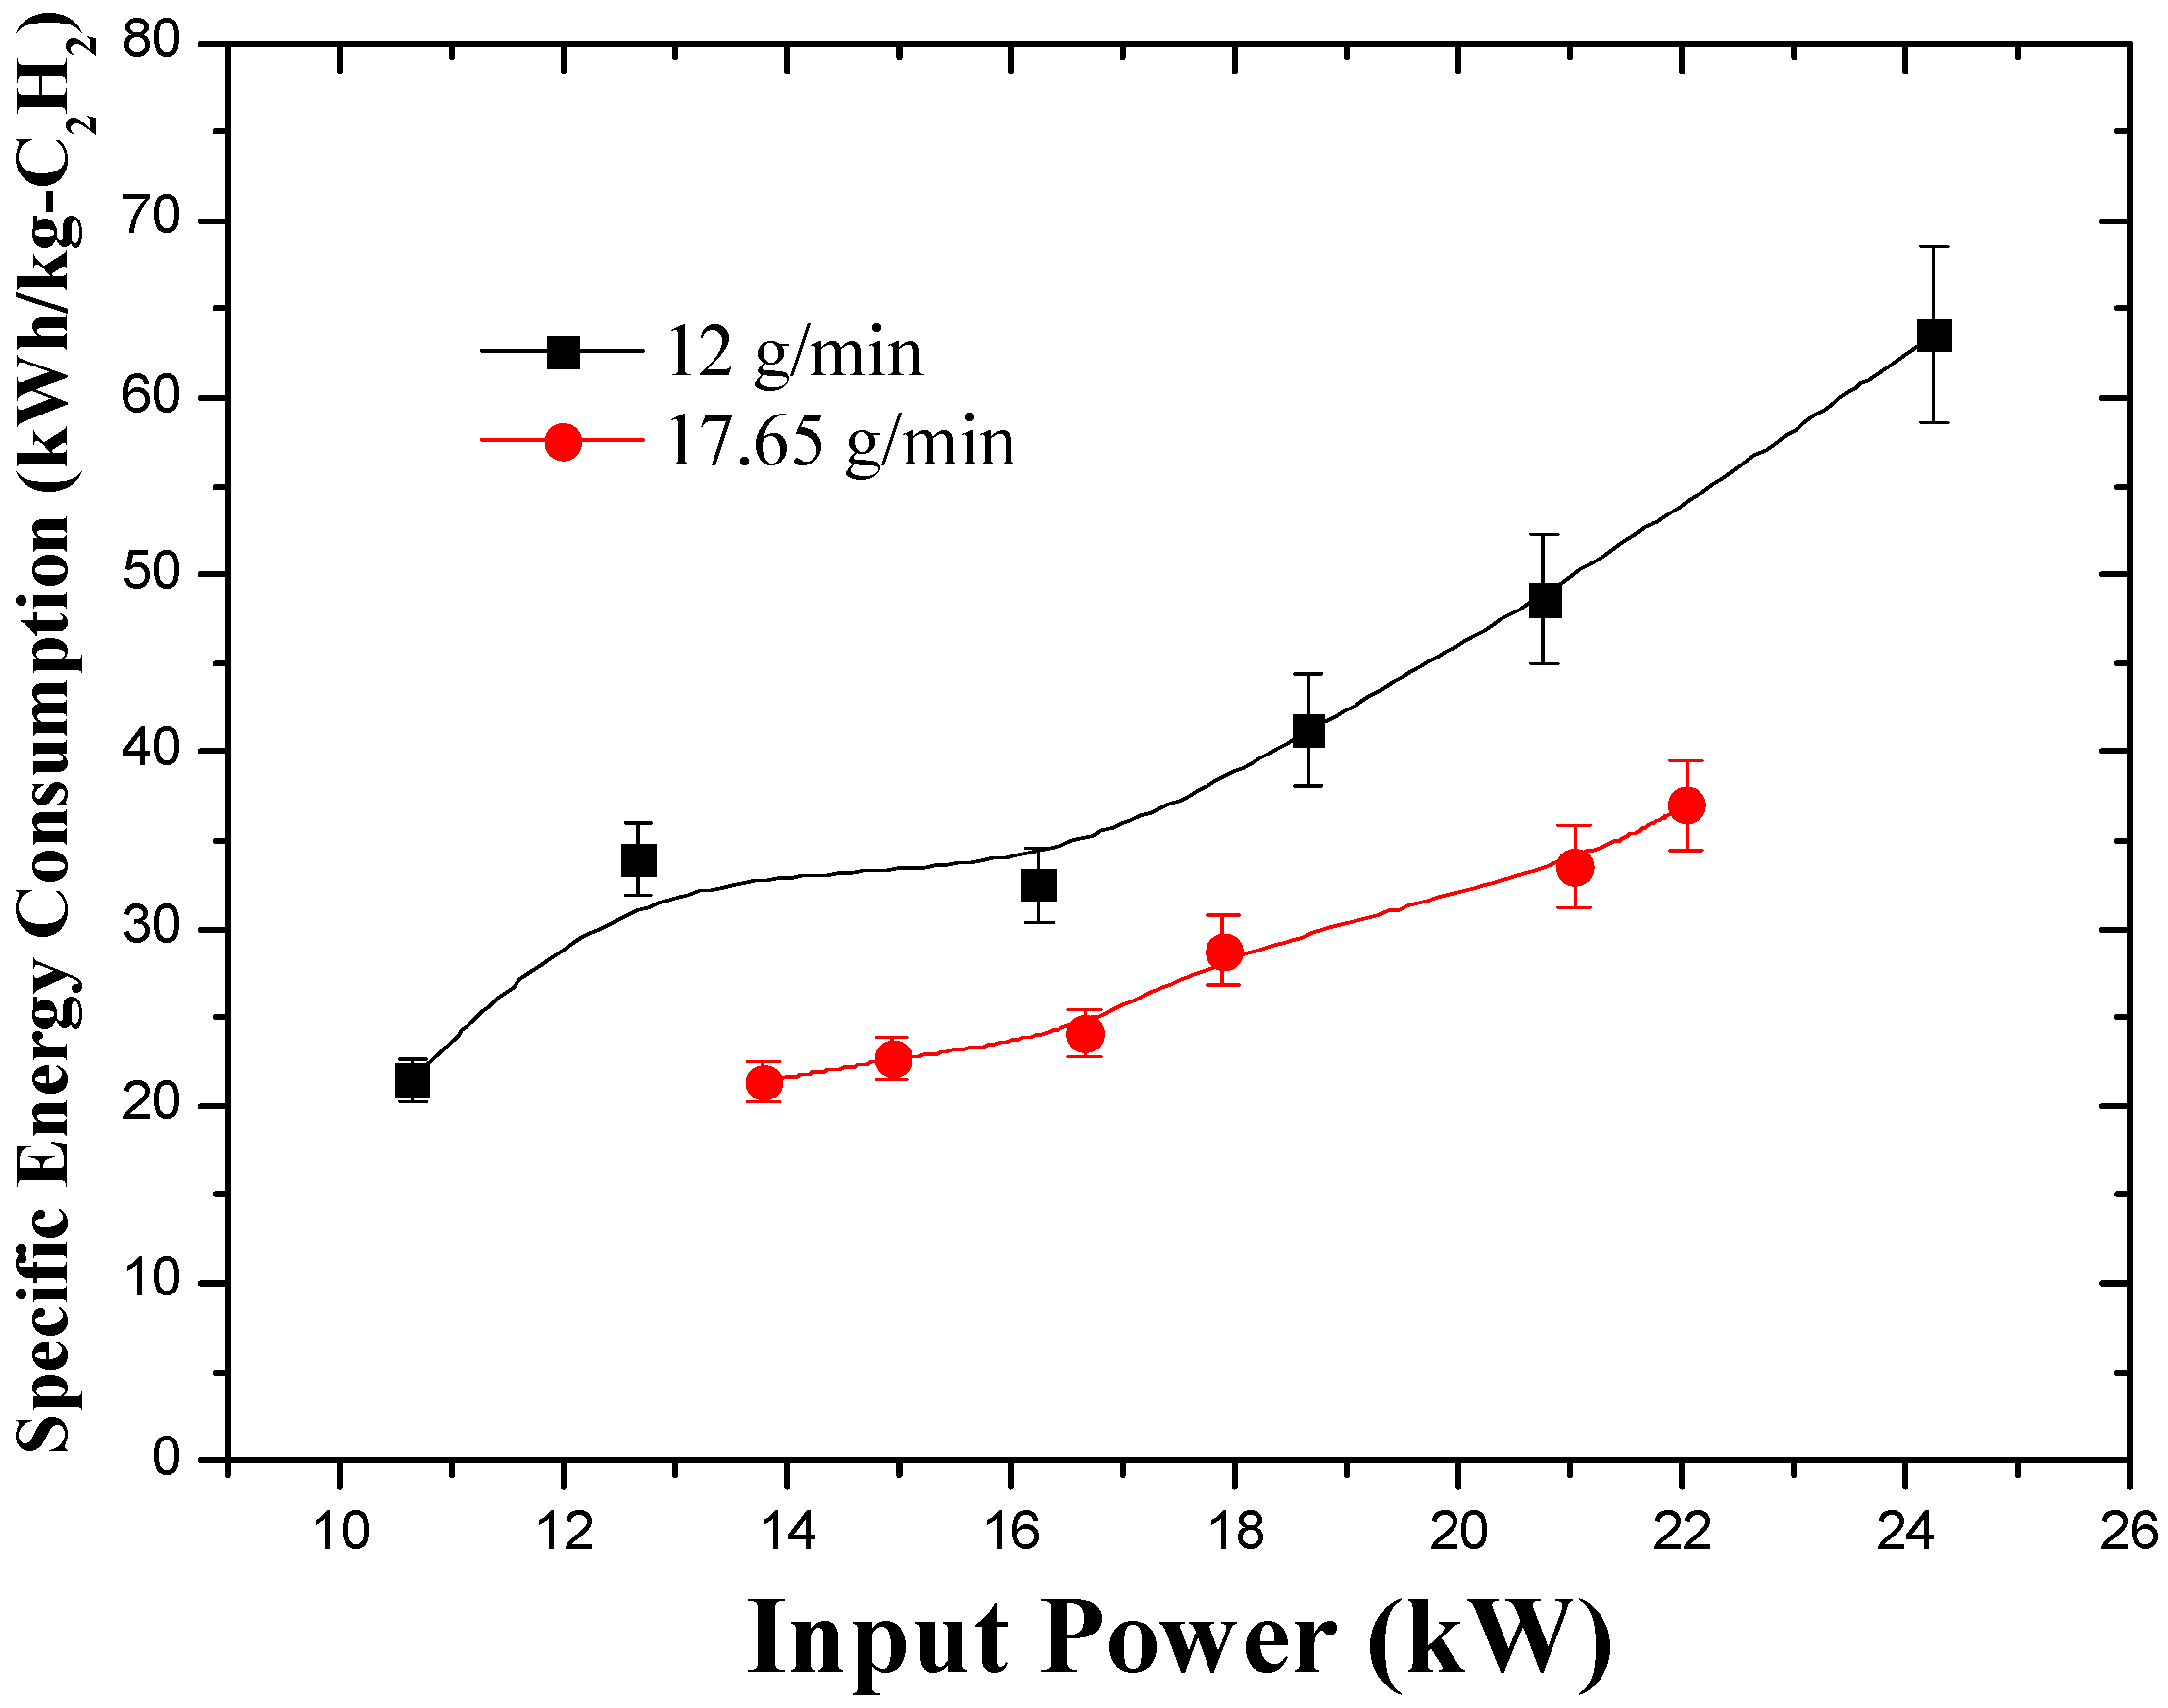
Figure 7.
Variation in the selectivity of C2H2 at working gas flow rate of 3 Nm3/h, 5 Nm3/h, 7 Nm3/h (Carrier gas flow rate: 1 Nm3/h; feed rate: 17.65 g/min; magnetic flux intensity: 0.077 T).
Figure 7.
Variation in the selectivity of C2H2 at working gas flow rate of 3 Nm3/h, 5 Nm3/h, 7 Nm3/h (Carrier gas flow rate: 1 Nm3/h; feed rate: 17.65 g/min; magnetic flux intensity: 0.077 T).
Figure 8.
Variation in the carbon conversion and selectivity of C2H2 at working gas flow rate of 3 Nm3/h, 5 Nm3/h, 7 Nm3/h (Carrier gas flow rate: 1 Nm3/h; feed rate: 17.65 g/min; magnetic flux intensity: 0.077 T).
Figure 8.
Variation in the carbon conversion and selectivity of C2H2 at working gas flow rate of 3 Nm3/h, 5 Nm3/h, 7 Nm3/h (Carrier gas flow rate: 1 Nm3/h; feed rate: 17.65 g/min; magnetic flux intensity: 0.077 T).
Figure 9.
Variation in the specific energy consumption (SEC) of C2H2 at working gas flow rate of 3 Nm3/h, 5 Nm3/h, 7 Nm3/h (Carrier gas flow rate: 1 Nm3/h; feed rate: 17.65 g/min; magnetic flux intensity: 0.077 T).
Figure 9.
Variation in the specific energy consumption (SEC) of C2H2 at working gas flow rate of 3 Nm3/h, 5 Nm3/h, 7 Nm3/h (Carrier gas flow rate: 1 Nm3/h; feed rate: 17.65 g/min; magnetic flux intensity: 0.077 T).
Figure 10.
Variation in composition of product gas with varied input power (Carrier gas flow rate: 1 Nm3/h; working gas flow rate: 5 Nm3/h; feed rate: 17.65 g/min; magnetic flux intensity: 0.077 T).
Figure 10.
Variation in composition of product gas with varied input power (Carrier gas flow rate: 1 Nm3/h; working gas flow rate: 5 Nm3/h; feed rate: 17.65 g/min; magnetic flux intensity: 0.077 T).

Figure 11.
Variation in the selectivity of C2H2 with varied input power (Carrier gas flow rate: 1 Nm3/h; working gas flow rate: 5 Nm3/h; feed rate: 17.65 g/min; magnetic flux intensity: 0.077 T).
Figure 11.
Variation in the selectivity of C2H2 with varied input power (Carrier gas flow rate: 1 Nm3/h; working gas flow rate: 5 Nm3/h; feed rate: 17.65 g/min; magnetic flux intensity: 0.077 T).
Figure 12.
Variation in carbon conversion and the yield of C2H2 with varied input power (Carrier gas flow rate: 1 Nm3/h; working gas flow rate: 5 Nm3/h; feed rate: 17.65 g/min; magnetic flux intensity: 0.077 T).
Figure 12.
Variation in carbon conversion and the yield of C2H2 with varied input power (Carrier gas flow rate: 1 Nm3/h; working gas flow rate: 5 Nm3/h; feed rate: 17.65 g/min; magnetic flux intensity: 0.077 T).

Figure 13.
Variation in specific energy consumption of C2H2 with varied input power (Carrier gas flow rate: 1 Nm3/h; working gas flow rate: 5 Nm3/h; feed rate: 17.65 g/min; magnetic flux intensity: 0.077 T).
Figure 13.
Variation in specific energy consumption of C2H2 with varied input power (Carrier gas flow rate: 1 Nm3/h; working gas flow rate: 5 Nm3/h; feed rate: 17.65 g/min; magnetic flux intensity: 0.077 T).


Table 1.
Operating parameters of plasma reactor.
| Process Parameters | Range | Optimum |
|---|---|---|
| Current (A) | 60–200 | 80–100 |
| Voltage (V) | 180–270 | 200 |
| Input power (kW) | 10–30 | 12–15 |
| Magnetic flux intensity (T) | 0.020–0.096 | 0.096 |
| Feed rate (g/min) | 10–20 | / |
| Carrier gas (Ar) (Nm3/h) | 1 | 1 |
| Working gas (H2) (Nm3/h) | 3–7 | 5 |
© 2017 by the authors. Licensee MDPI, Basel, Switzerland. This article is an open access article distributed under the terms and conditions of the Creative Commons Attribution (CC BY) license (http://creativecommons.org/licenses/by/4.0/).
Share and Cite
MDPI and ACS Style
Zhang, M.; Ma, J.; Su, B.; Wen, G.; Yang, Q.; Ren, Q. Pyrolysis of Polyolefins Using Rotating Arc Plasma Technology for Production of Acetylene. Energies 2017, 10, 513. https://doi.org/10.3390/en10040513
AMA Style
Zhang M, Ma J, Su B, Wen G, Yang Q, Ren Q. Pyrolysis of Polyolefins Using Rotating Arc Plasma Technology for Production of Acetylene. Energies. 2017; 10(4):513. https://doi.org/10.3390/en10040513
Chicago/Turabian StyleZhang, Ming, Jie Ma, Baogen Su, Guangdong Wen, Qiwei Yang, and Qilong Ren. 2017. "Pyrolysis of Polyolefins Using Rotating Arc Plasma Technology for Production of Acetylene" Energies 10, no. 4: 513. https://doi.org/10.3390/en10040513
Note that from the first issue of 2016, this journal uses article numbers instead of page numbers. See further details here.