
CO2 Foam Stability Improvement Using Polyelectrolyte Complex Nanoparticles Prepared in Produced Water


Chemical and Petroleum Engineering Department, University of Kansas, Lawrence, KS 66046, USA
*
Author to whom correspondence should be addressed.
Energies 2017, 10(4), 516; https://doi.org/10.3390/en10040516
Submission received: 31 January 2017
/
Revised: 28 February 2017
/
Accepted: 6 April 2017
/
Published: 11 April 2017
(This article belongs to the Special Issue Nanotechnology for Oil and Gas Applications)
Abstract
:Despite the increasing interest in CO2 foam flooding for enhanced oil recovery applications, it is challenging to have a successful field operation as the performance of the surfactant is often affected by the presence of crude oil and salinity of the water. It is also challenging to dispose of huge amounts of water associated with the field operation. Due to the incompatibility of the produced water with chemicals used in the foam system, the produced water cannot be used as an injecting fluid. The objective of this project is to design a chemical system compatible with produced water which may fully utilize the oil field produced water as an injecting fluid and make the foam injection economically viable and environmentally friendly. In this study, we investigate the performance of a foam system with a surfactant and the addition of polyelectrolyte and polyelectrolyte complex nanoparticles (PECNP) in various salinities of produced water. A recipe is developed to prepare a nanoparticle solution that is sustainable in high salinity produced water. The rheological property of the foam, the stability, and durability of the foam with and without the presence of crude oil are measured and compared as the water salinity is changed. It is found that foam stability and durability deteriorated when water salinity increased. However, by the addition of polyelectrolyte and PECNP in the system, the foam stability and durability was improved even in high salinity water with or without the presence of crude oil.
1. Introduction
The oil and gas industry has been using CO2 as an Enhanced Oil Recovery technique since the 1950s [1]. The potential of CO2 in contacting the bypassed area and reducing the trapped oil and its dynamic miscibility at lower temperatures compared to other gases has made it a good candidate for enhanced oil recovery applications. The high solubility of CO2 in the crude oil, for reservoirs which have a pressure above the minimum miscibility pressure of CO2 in oil, lowers the viscosity of the oil by 5–10 fold [2,3]. Due to the unfavorable mobility ratio of CO2 flooding, viscous fingering, gravity override, and poor sweep efficiency, several methods have been implemented to improve the usage of CO2 for enhanced oil recovery applications [4]. The alternate injection of water with CO2, water alternating gas (WAG) process, and foam injection are the commonly applied methods to improve the mobility of CO2 in the displacement process. Although WAG alleviates the problem of the unfavorable mobility ratio between the displacing agent and the oil, while improving the vertical sweep efficiency in multi-layer reservoirs, it is reportedly damaging the injectivity of both water and CO2 [5]. On the other hand, foam is effective in reducing gas mobility in a broad range of rock permeability. Laboratory and field observations seem to suggest a greater effect in high permeability zones when the tested porous medium is heterogeneous [6,7,8]. Foam is a special colloidal dispersion that consists of a gas, a liquid, and a foaming agent [9]. The quality of the foam is defined as the ratio of the gas volume to the total volume, and is between 60% and 90% for enhanced oil recovery applications. The effectiveness of surfactant generated CO2 foam very much depends on the surfactant characteristics [10].
The presence of crude oil affects the foam properties and destabilizes the foam by spreading the oil on the foam lamellae [11]. Moreover, the adsorption of the oil by the porous media changes the wettability of the rock and hardens the foam generation and degeneration [12].
Using nanoparticles as a stabilizer for the surfactant generated CO2 foam has been studied by other researchers [13]. Changing the concentration of the surfactants is assumed to affect the foam films and make the films more stable. However, using polyelectrolytes with opposite charges than the surfactant can be an alternative to the surfactant concentration changes [14]. Forming the polyelectrolyte/surfactant complexes in oppositely charged systems of surfactant and polyelectrolyte, also stabilizes the foam film by decreasing the surface elasticity [15].
Kalyanaraman et al. [13] developed a system of nanoparticles for stabilizing the foam in the presence of crude oil. They proved that their nanoparticle system had the capability of making foam more stable in low salinity systems of up to 2% KCl brine. Applying their nanoparticle system resulted in increasing the oil recovery and sweep efficiency of the reservoir.
Large volumes of produced water from oil fields is a very important concern for the oil industry [16]. Disposal, treatment, and re-injection of the produced water are the available methods for handling the oil field produced water [17]. Water disposal is restrictedly controlled by environmental regulations. Since handling and treatment of the produced water increases operational costs and needs special equipment, re-injecting the produced water into the reservoir is the most optimized method to handle the produced water [18]. Re-injection of the produced water in enhanced oil recovery applications reduces the treatment difficulties while lowering the usage of fresh water in the oil industry.
The main objective of this research is to stabilize the surfactant generated CO2 foam using polyelectrolyte complex nanoparticles (PECNP) in high salinity produced water and in the presence of crude oil. In this paper, the polyelectrolyte complex nanoparticle (PECNP) system with an optimized ratio of polyethylenimine to dextran sulfate was developed for different salinities. Particle size and zeta potential measurements were conducted and the most optimized ratios of polyelectrolyte to dextran sulfate were selected. Interfacial tension measurements were conducted to determine the critical micelles concentration (CMC) of the surfactant systems. Thereafter, the rheology of the different systems of CO2 foam was studied using an in-house foam rheometer. Finally, view cell tests were conducted to observe the supercritical CO2 foam stability and durability with and without the Mississippian crude oil in the system.
2. Materials
2.1. Polyethylenimine
Polyethylenimine (PEI) or polyaziridine is a polymer with a repeating unit composed of an amine group and a two carbon aliphatic CH2CH2 spacer. The PEI which has been used is the branched polycation and has a density of 1.03 g/mL at 25 degrees Celsius. It was purchased from Sigma Aldrich, St. Louis, MO, USA (Lot# MKBN3988V, CAS# 9002-98-6).
2.2. Dextran Sulfate
The Dextran Sulfate (DS) that has been used is a polyanion and has an average molecular weight of 500,000. It also was purchased from Sigma Aldrich (Lot# 156852, CAS# 9011-18-1).
2.3. Surfactant
SURFONIC N-120 surfactant or Nonoxynol-12 is the 12-mole Ethoxylate of Nonylphenol. It is a water soluble, surface-active agent which is compatible with other nonionic surfactants and with most anionic and cationic surfactants. The company reported that this product is a nonionic surfactant, though our zeta potential measurements showed that it has an anionic nature with a tendency to adsorb to positively charged particles. The zeta potential for a 0.1 wt % surfactant solution in 33,667 and 67,333 ppm salinity of diluted Mississippian limestone play (MLP) brine was −1.16 and −12.29 mV, respectively, which shows the anionic nature of the surfactant. The theoretical molecular weight for this surfactant is 748 and the theoretical hydroxyl number is 75. This surfactant was provided by Huntsman chemicals, Woodlands, TX, USA (Lot# E312D33, CAS# 9016-45-9).
2.4. Mississippian Brine
The formulation of a brine from the MLP brine sample was prepared in Deionized (DI) water and a synthetic brine was made based on that and was used for all the tests. The composition and related information of the salts in the brine are shown in Table 1. In order to obtain different salinities, the MLP brine was diluted using DI water in proper ratios. For example, in order to prepare the salinity of 33,667 ppm, the MLP brine was diluted six times and in order to prepare the salinity of 67,333 ppm, the MLP brine was diluted three times.
2.5. Crude Oil
Mississippian crude oil was used for the view cell experiments. The density and viscosity were measured to be 0.82 g/cc and 3.88 cP, respectively, at 40 degrees Celsius. The asphaltene content of this crude oil was measured to be approximately 0.5 wt %.
3. Sample Preparation
3.1. Surfactant Solutions
The surfactant solution was prepared in two different salinities of 33,667 and 67,333 ppm. It was stirred for 30 min at 500 rpm. The final concentration of the surfactant in all the solutions was kept at 0.1 wt %.
3.2. Polyethylenimine Solution
The PEI solution was prepared in two different salinities of MLP brine (33,667 and 67,333 ppm). It was stirred for 30 min at 500 rpm. The final concentration of the PEI in the solution was 1 wt %. A 600 mL sample of the PEI solution was prepared for each salinity. The pH of the solution was around 10 and it was lowered to 8 by adding 5.5 mL of 12N Hydrochloric acid (HCl).
3.3. Dextran Sulfate Solution
The DS solution was prepared in two different salinities of MLP brine (33,667 and 67,333 ppm). It was stirred for 30 min at 500 rpm. The final concentration of the DS in the solution was 1 wt %.
3.4. Nanoparticle Solutions
For preparing the nanoparticle systems, different combinations of PEI:DS were prepared and the best ratio of PEI:DS was selected based on the zeta potential and particle size measurements, which are presented under the Results and Discussion section. In this study, four different ratios of 1, 2, 3, and 4 for PEI to DS were prepared and the ratio of 3:1:0.1 of PEI:DS:brine was selected. The sample was stirred for 30 min at 500 rpm. All the samples are presented in Table 2 and Table 3. The nanoparticle solutions were prepared in the brine of up to 200,000 ppm salinity and they were stable in two ratios of 3:1:0.1 and 4:1:0.1 for PEI:DS:brine. The limiting factor for the experiments was the surfactant.
3.5. PEI-Surfactant and PECNP-Surfactant Systems
After preparing the surfactant solution and the nanoparticle solution in any specific brine, the PEI:surfactant and the PECNP:surfactant systems were mixed in the ratios of 1:9 and 2:8 for the two different salinities of 33,667 and 67,333 ppm, respectively. Then the solutions were stirred for 30 min at 500 rpm. The final concentration of the surfactant in the solutions was kept at 0.1 wt %.
4. Methods
4.1. Zeta Potential and DLS Particle Size Measurements
In order to select the best ratio of PEI:DS, the mean particle size and zeta potential were measured using a Brookhaven ZetaPALS instrument (Brookhaven Instruments Corporation, New York, NY, USA) which works based on Brownian movement.
The Zeta potential or electrokinetic potential, which is a factor for determining the charge stability of the colloidal nanoparticles, is a measure of the effective electric charge on the nanoparticle surface. The potential difference between the bulk fluid in which the particles are dispersed and the layer of the fluid which contains the oppositely charged ions is determined as the zeta potential [19].
The magnitude of the zeta potential is a representative of the stability of the system. By increasing the zeta potential, the electrostatic repulsion and therefore, the stability of the nanoparticle system increases.
Dynamic Light Scattering (DLS) has been used for measuring the diameter and the electrical double layer of nanoparticles.
4.2. Interfacial Tension Measurements
Before preparing the samples, finding the critical micelle concentration (CMC) was the first step.
All physio-chemical properties of a surfactant depend on the concentration of that surfactant, which means that if we plot them versus the concentration, there would be an abrupt change in the slope of the graph when micelles start to generate. After that sudden change, there is a plateau for all of the properties. That concentration is determined as the Critical Micelle Concentration (CMC) [20]. Keeping the concentration of the surfactant below the CMC is very important in order to preserve the surface activity of the surfactant.
One method to find the CMC is to measure the Interfacial Tension (IFT) and plot it versus the surfactant concentration. For this experiment, the rising bubble method was used and the CMC has been found by plotting the IFT values versus the surfactant concentrations. The IFT decreases by increasing the surfactant concentration and the CMC is the point at which we reach a plateau in the graph. The CMC measurements will be shown in the Results section. A schematic diagram of this setup is presented in Figure 1.
4.3. Rheology Measurements
The main purpose of the rheological measurements is to measure the bulk viscosity of different samples including the surfactant generated CO2 foam, PEI-surfactant generated CO2 foam, and PECNP-surfactant generated CO2 foam. The results of this study in the rheological measurement section clearly show that the CO2 foam is a shear thinning fluid.
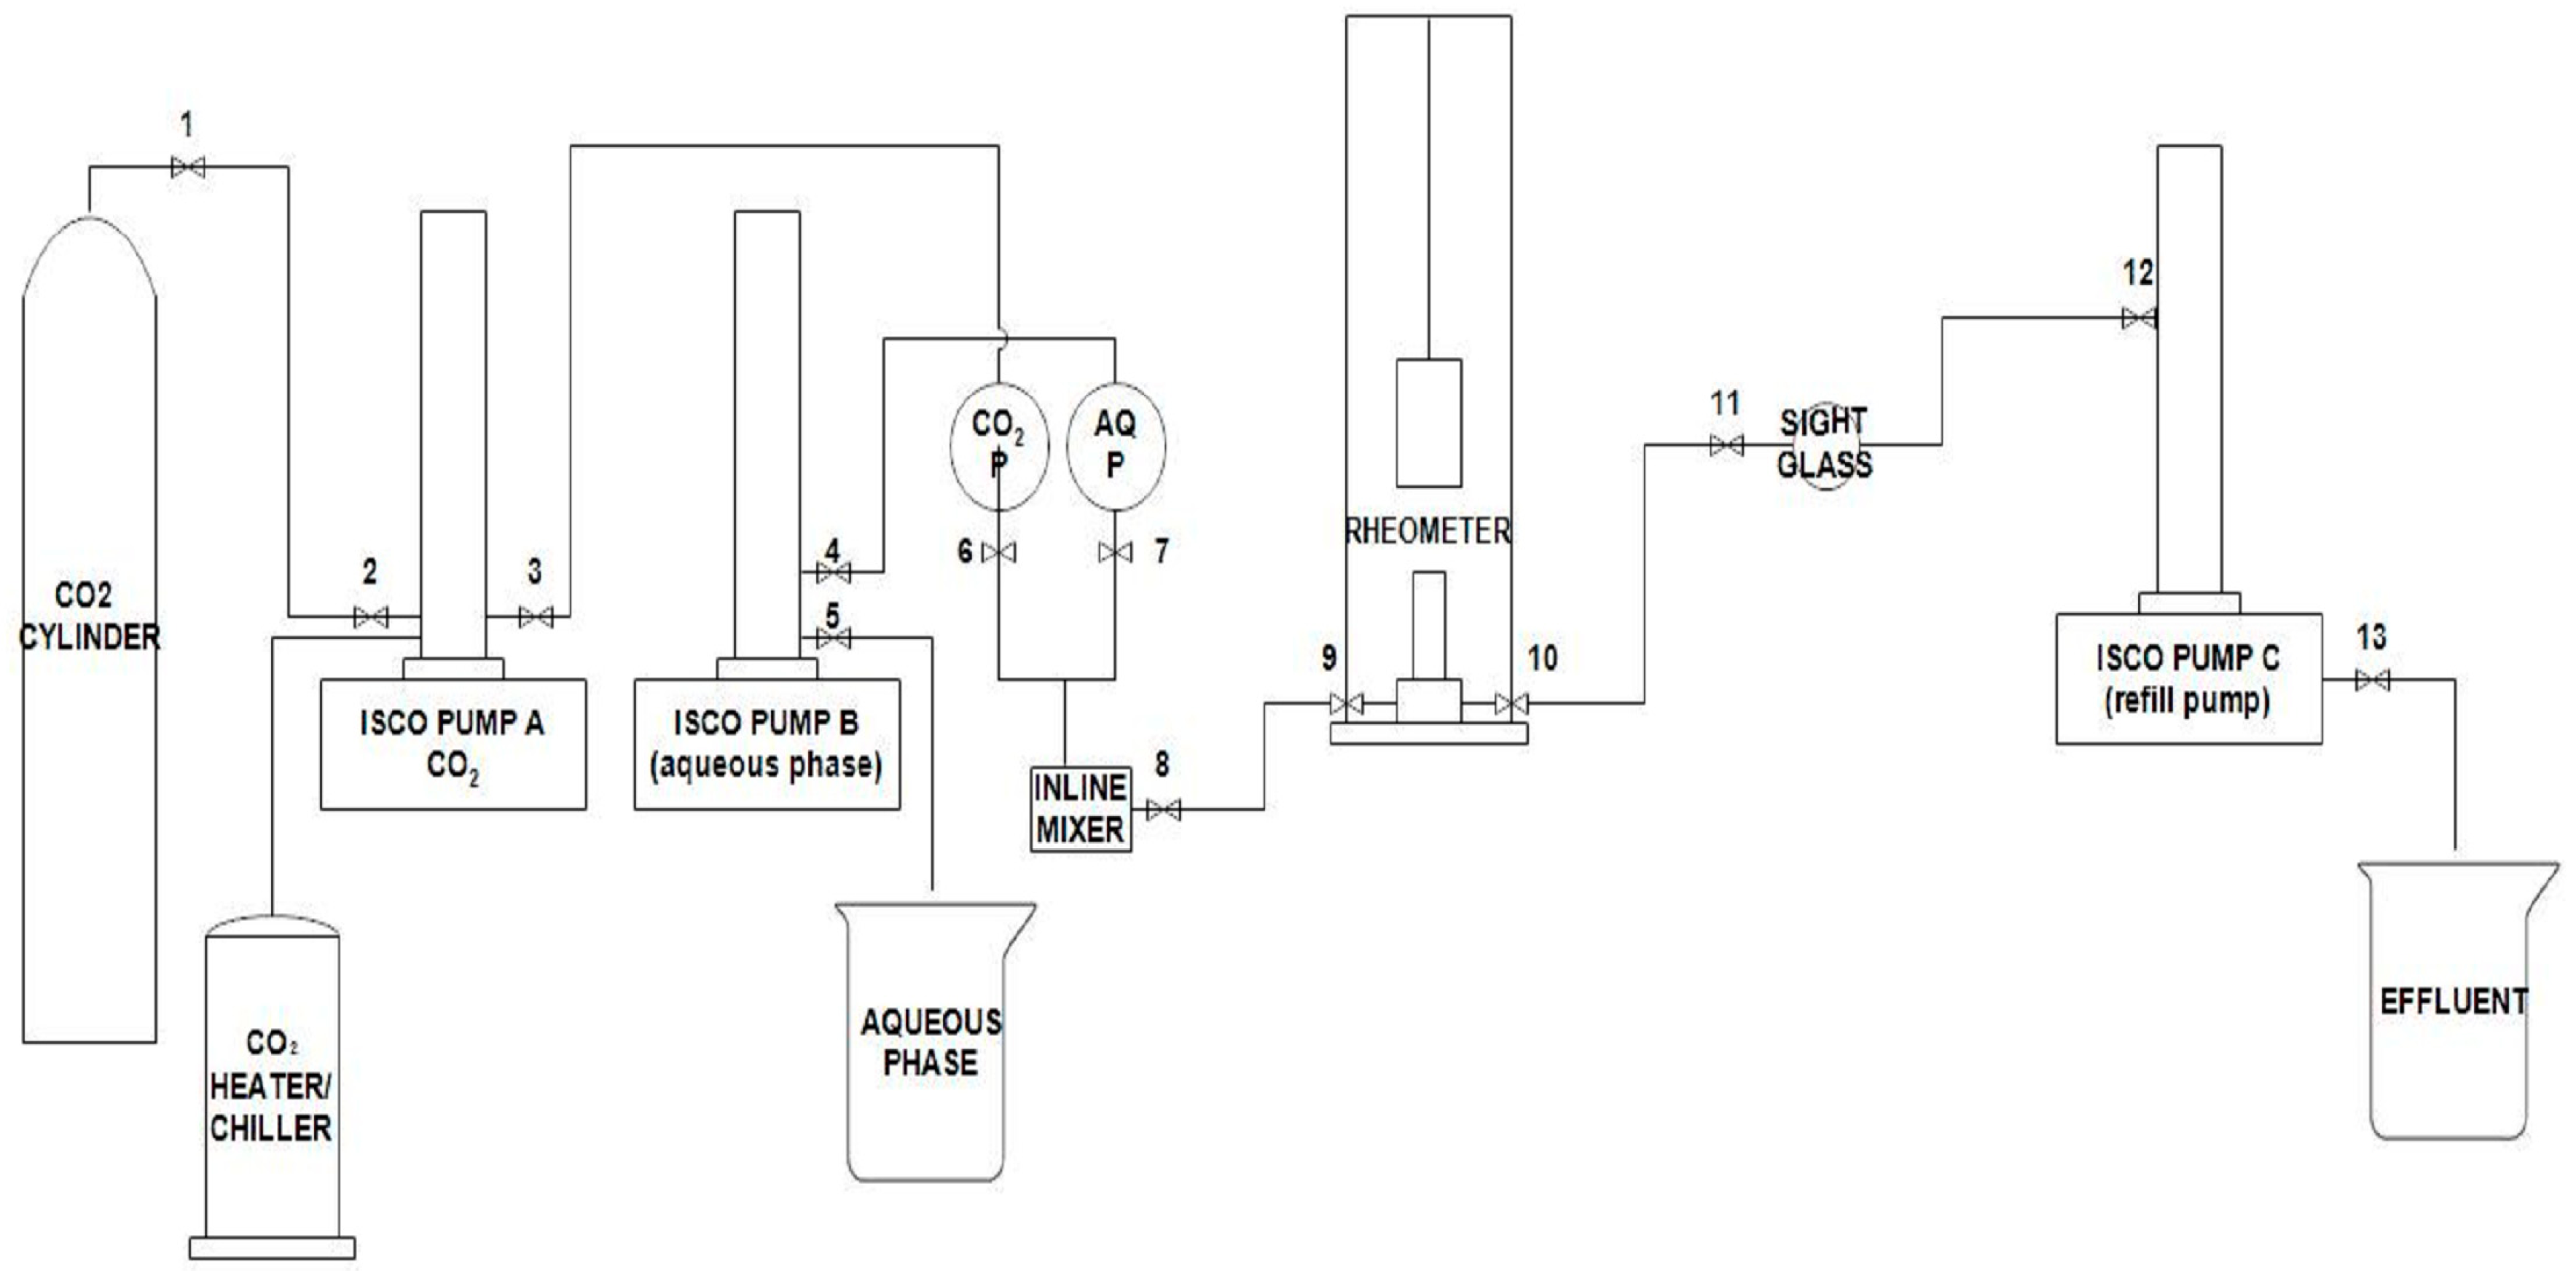
An Anton Paar rheometer was used for the rheological measurements. A schematic diagram of this setup is shown in Figure 2. For these measurements, CO2 in the supercritical state was mixed with the aqueous phase by passing it through a 7-micron inline mixer. The measuring cup has two co-axial cylinders. There is an annulus between them which was filled by the produced foam. Next, shear stress was applied on the outer cylinder, it was rotated, and the viscosity of that foam was determined. The pressure and temperature of the system was maintained at 1350 psi and 40 degrees Celsius, respectively.
The viscosity vs. shear rate was monitored. After foam generation, the pumps were stopped and the measuring cup was isolated by closing the proper valves. The measurement was continued by conducting the shear ramp. In the ramp test, the foam was sheared with the shear rates reduced from 2000 s−1 to 100 s−1 and then in a reversed order for a total time of 15 min at 30 s intervals.
4.4. View Cell Testing
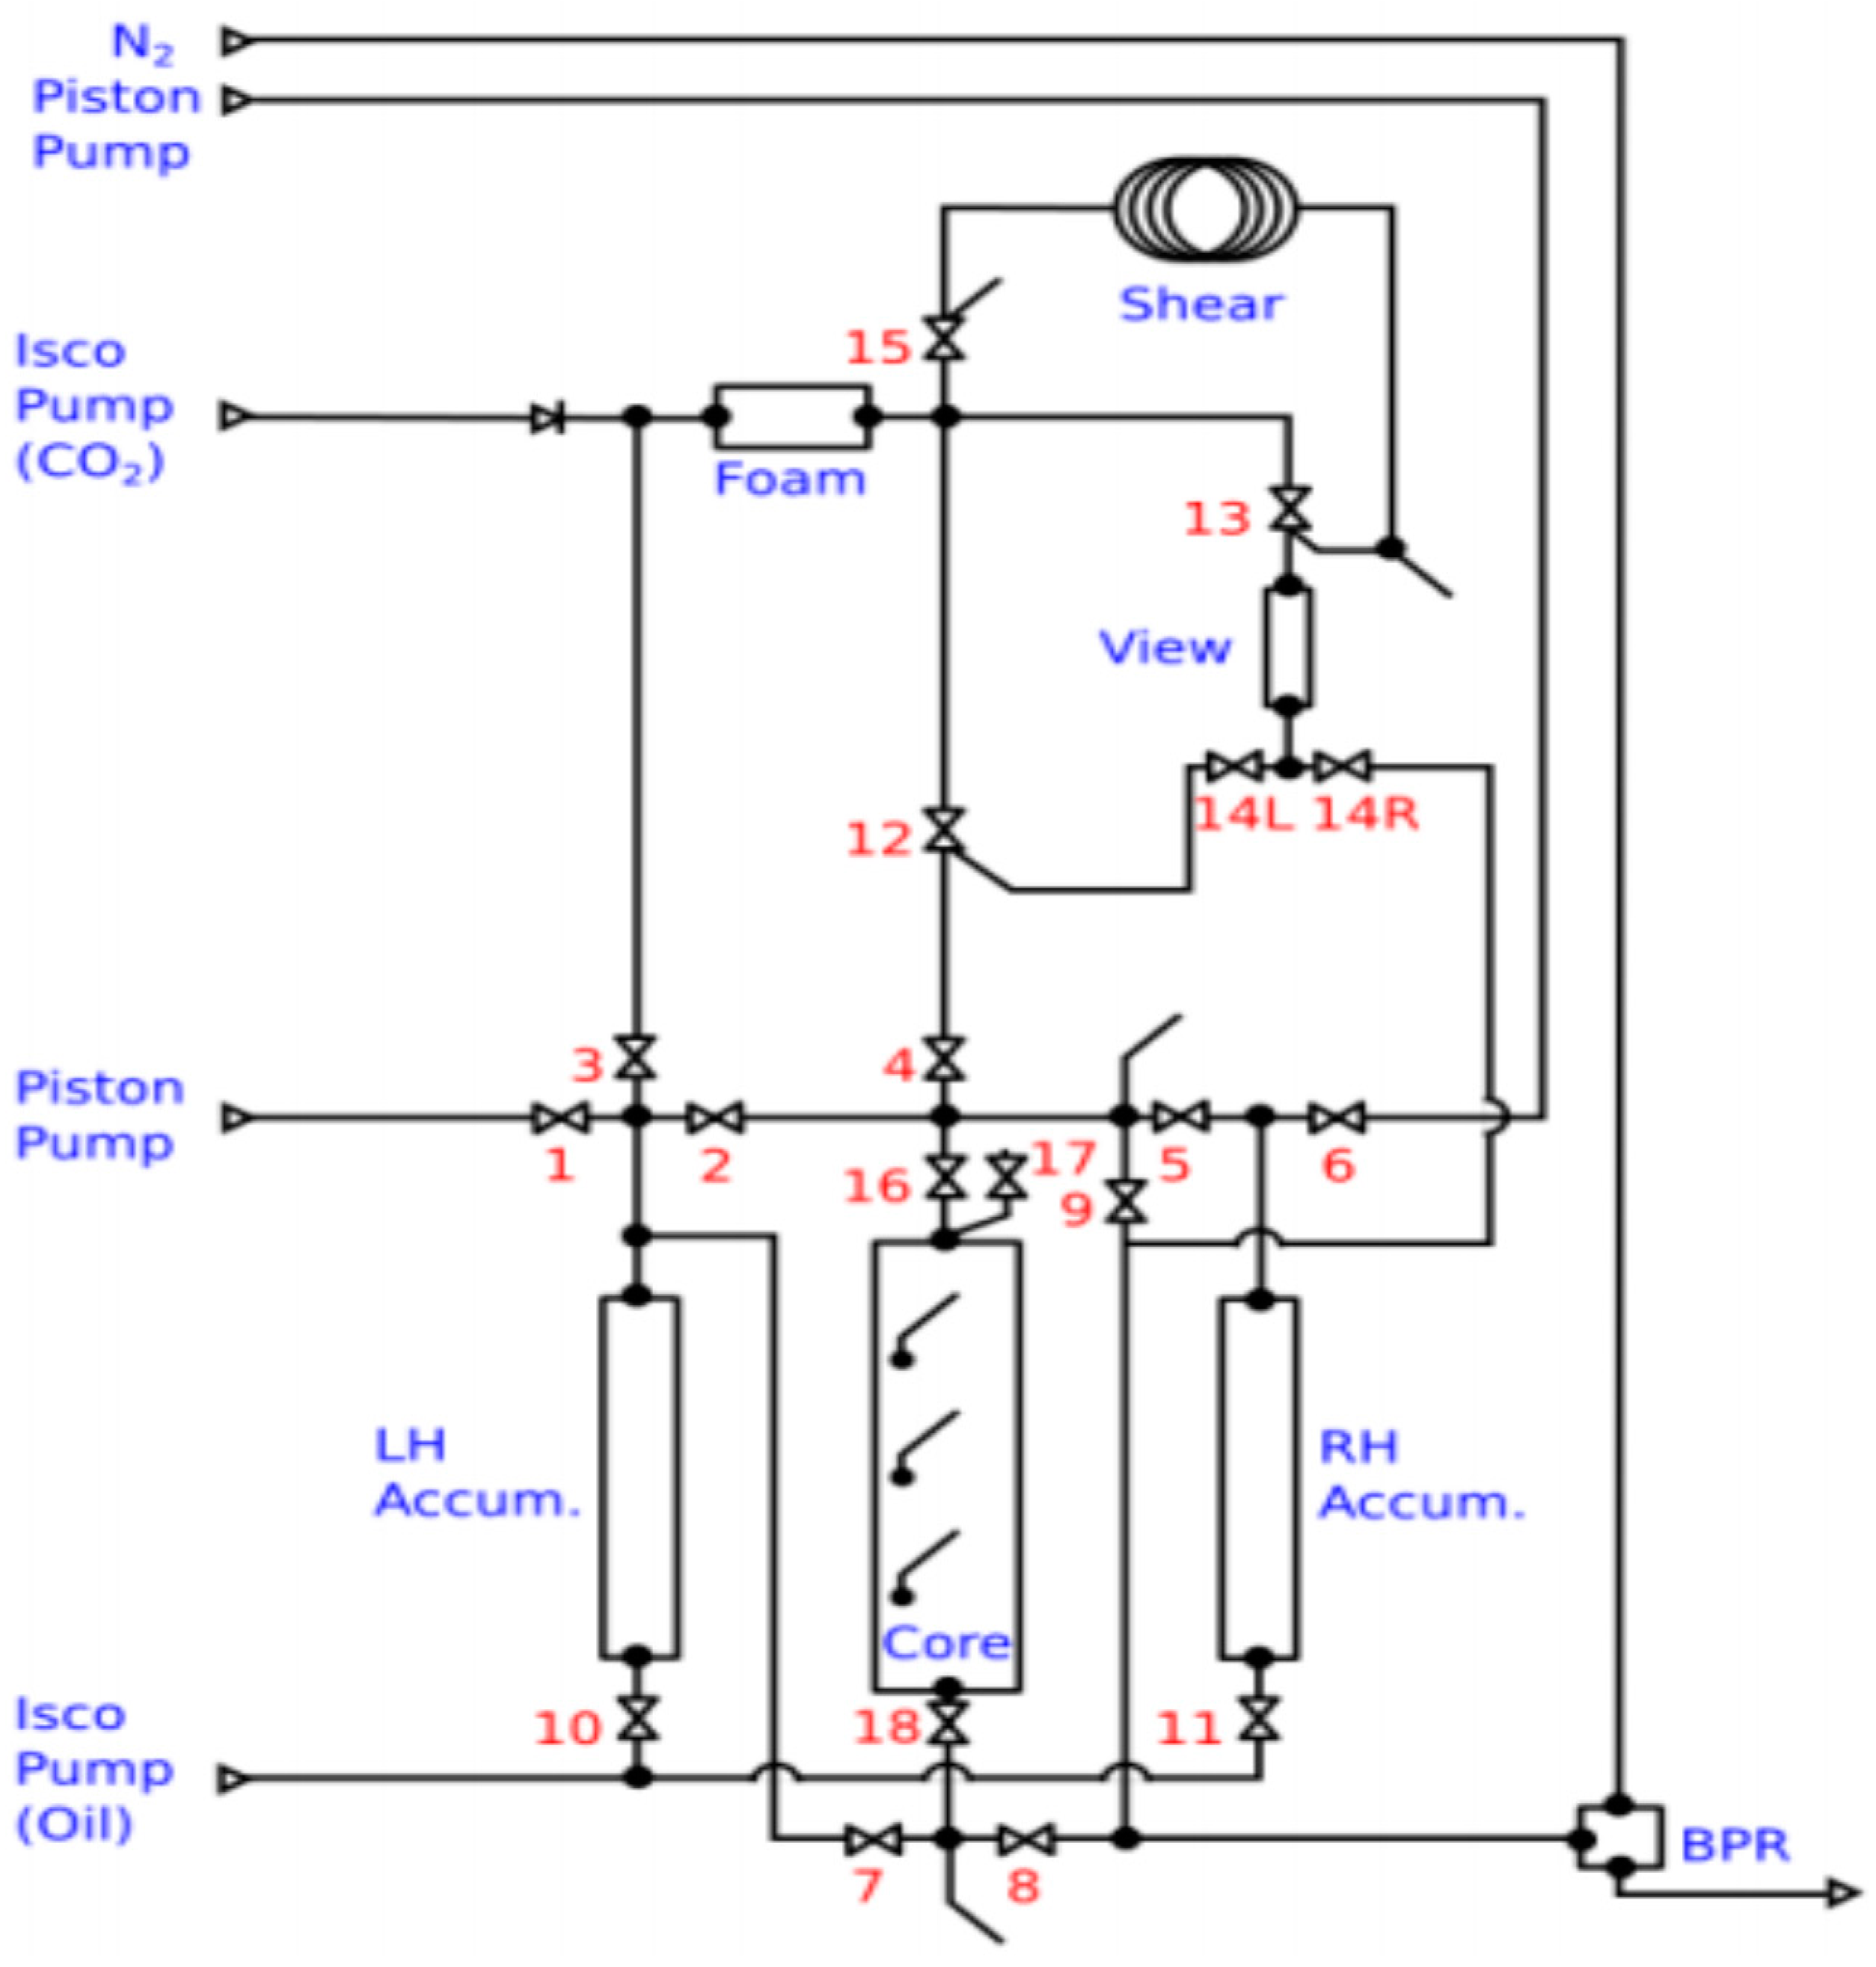
The experimental setup was designed with a sapphire view cell able to withstand high temperatures and pressures. The view cell setup was used to determine the stability and durability of the foam with and without the crude oil in the system. A schematic diagram for this setup is shown in Figure 3.
The first series of the experiments were performed without any oil in the system. A transfer cylinder was filled by the aqueous phase which was the surfactant, PEI-surfactant, or PECNP-surfactant while a temperature controlled Teledyne ISCO pump was filled by CO2. Then by increasing the temperature to 40 degrees Celsius, the pressure reached 1350 psi. For generating foam, the aqueous phase and the supercritical CO2 were passed through a 7-micron inline mixer. Then the view cell was filled by the generated foam and it was isolated to monitor the foam decay versus time.
The next series of experiments were done with the Mississippian crude oil in the system. In this series, after filling the view cell by the generated foam, the oil was introduced into the view cell, displaced the generated foam, and filled to 25 percent of the view cell’s length. Then the foam decay versus time was monitored for all of our systems.
5. Results and Discussion
5.1. Particle Size and Zeta Potential Results
Table 2 and Table 3 show the particle size and zeta potential measurements for different ratios of PEI:DS and PECNP:surfactant in two salinities of 33,667 and 67,333 ppm of diluted MLP brine, respectively.
In both salinities, precipitations occurred with the ratios of 1:1:0.1 and 2:1:0.1 of PEI: DS: Brine. From Table 2, it can be observed that batch 1 gave the highest zeta potential values for the 33,667 ppm salinity of diluted MLP brine and was selected for continuing the tests. It can be seen that in 67,333 ppm salinity, batches 2 and 4 gave the highest zeta potential values (Table 3), and by considering the view cell testing results without the crude oil in the system, it was found that batch 4 performed better compared to batch 2 and it was selected for continuing the tests in this salinity. Note that the term “mobility” in these tables refers to electrophoretic mobility.
5.2. Interfacial Tension Measurement Results
The critical micelle concentration (CMC) was determined by plotting the interfacial tension (IFT) versus the surfactant concentration. Figure 4 and Figure 5 show the interfacial tension plots versus the concentration of the surfactant for the two different salinities of 33,667 and 67,333 ppm of diluted MLP brine. It can be observed that the CMC is between 0.11 and 0.12. Therefore, the final concentration of 0.1 of the surfactant was chosen for all of the experiments.
5.3. Rheology Measurement Results
The nanoparticles have a small effect on the bulk viscosity and their major effect is on the surface viscosity.
In the ramp test, by using the power-law fluid model, which provides the relationship between the effective viscosity and the shear rate, the amount of the flow consistency index (K) and the flow behavior index (n) were found.
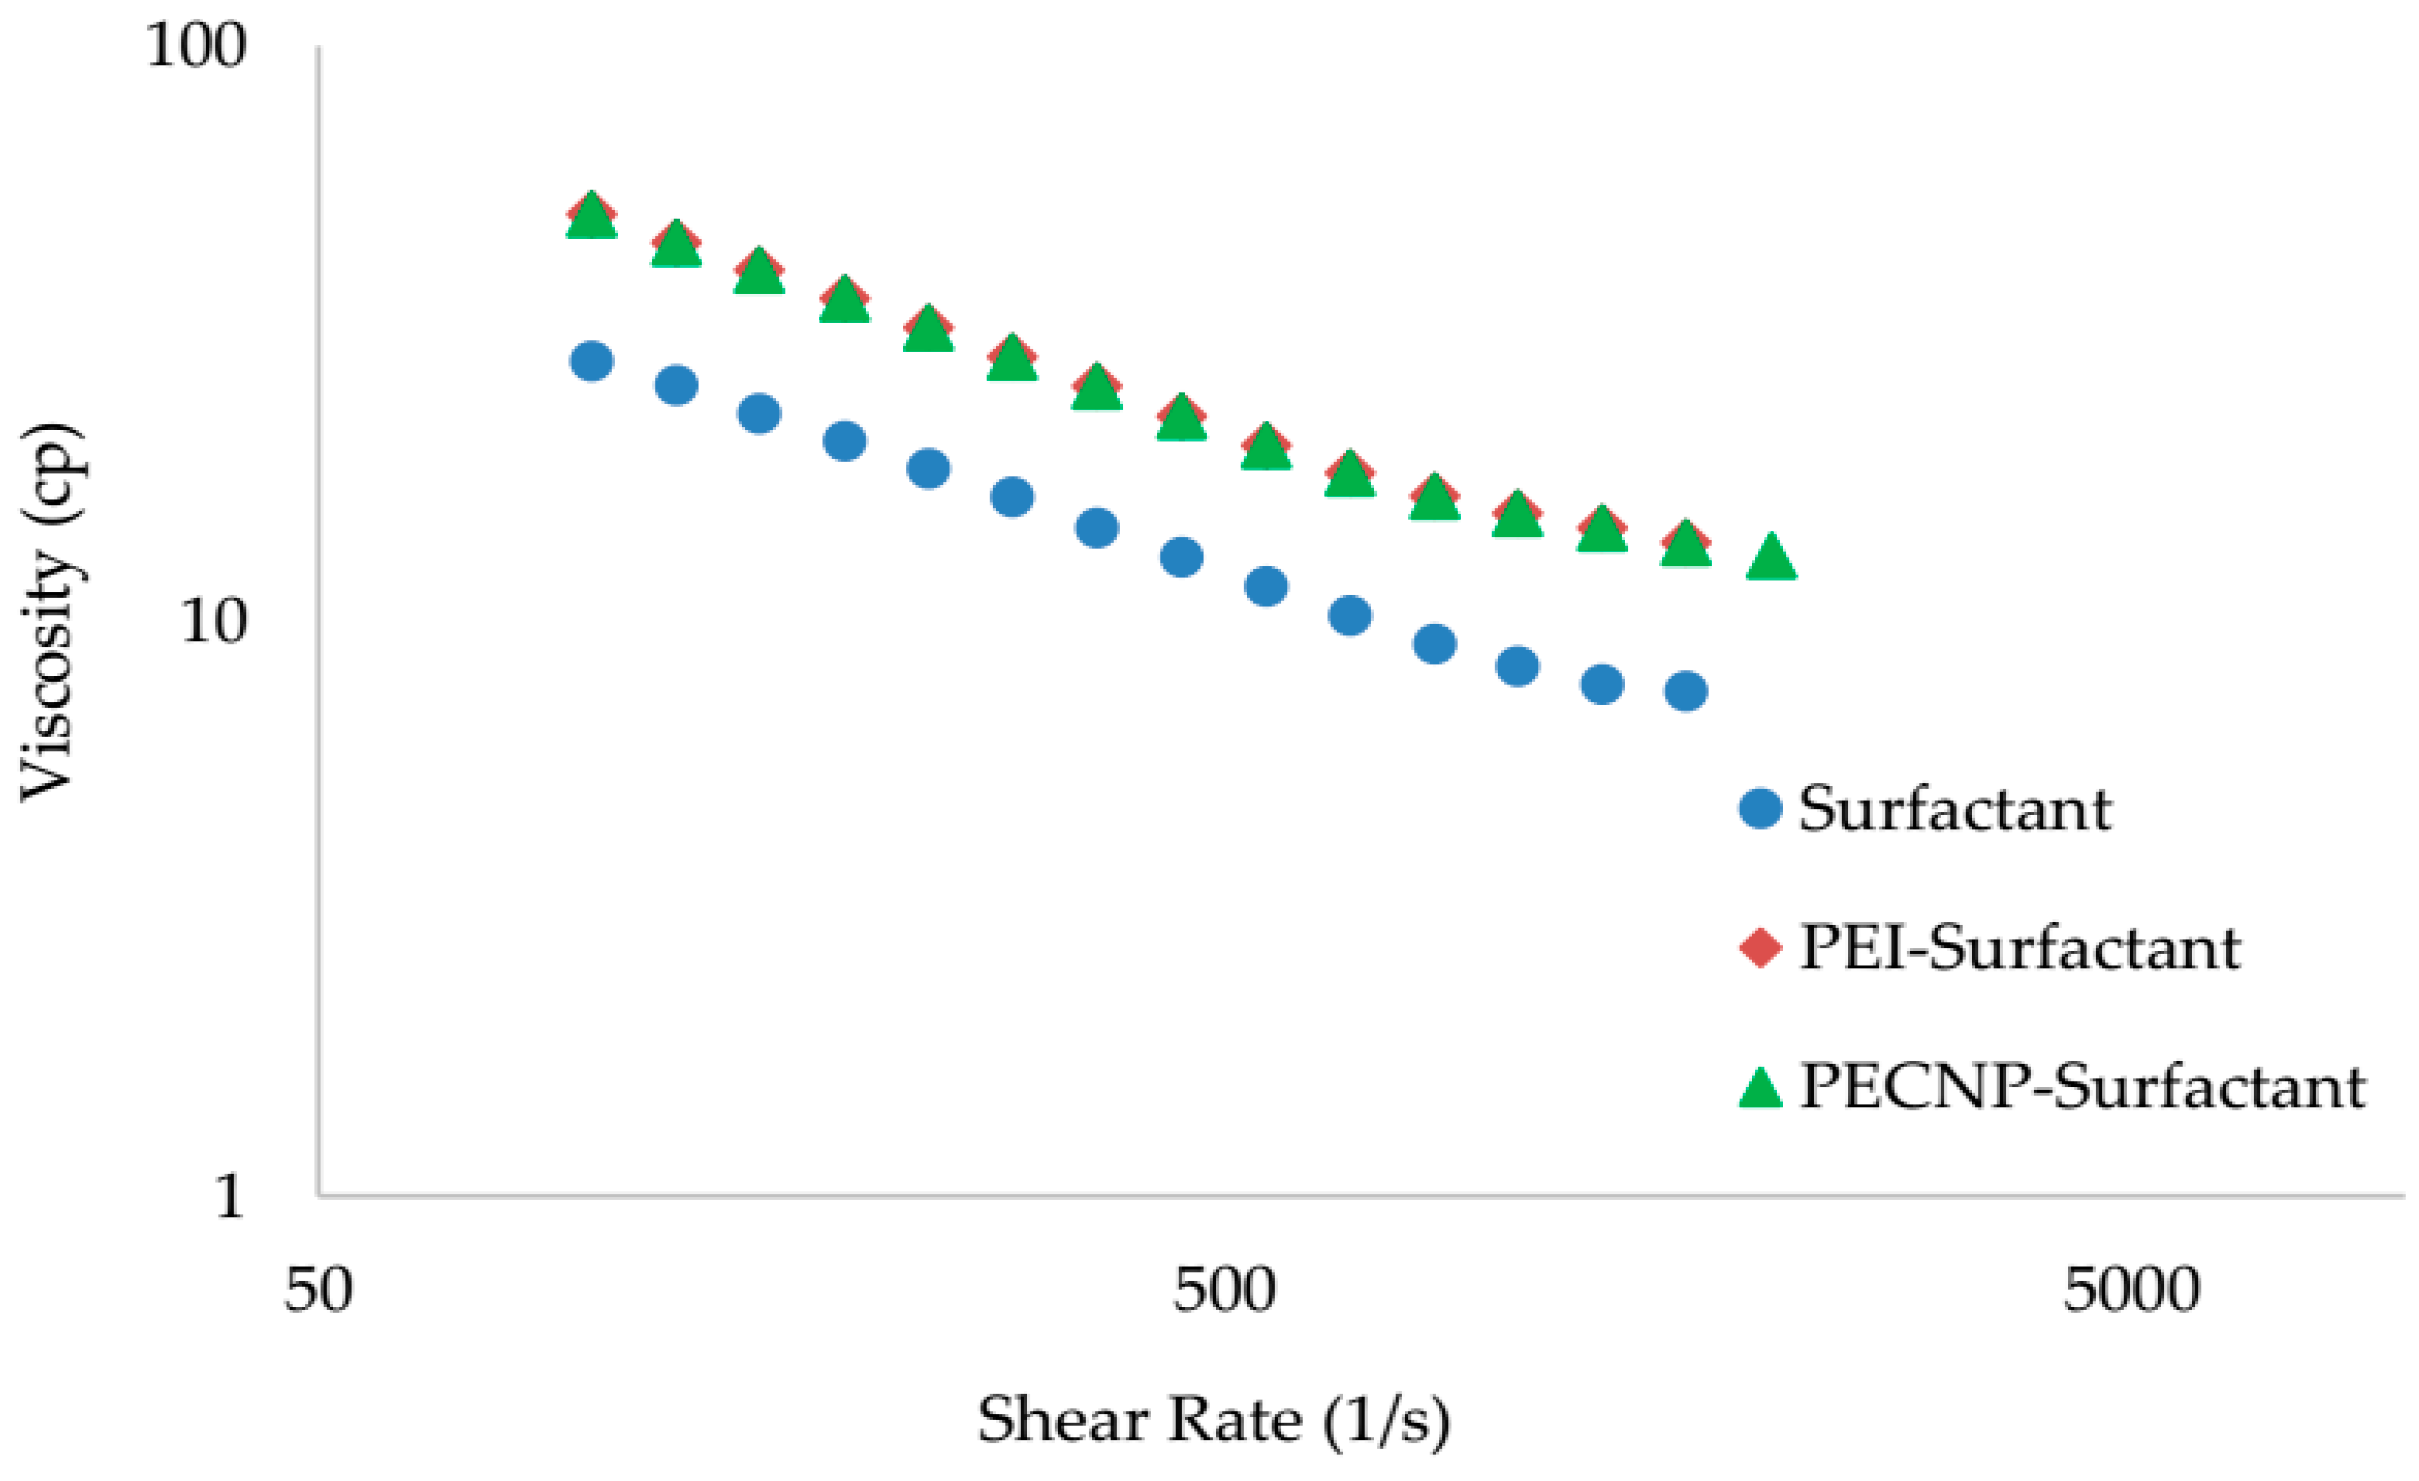
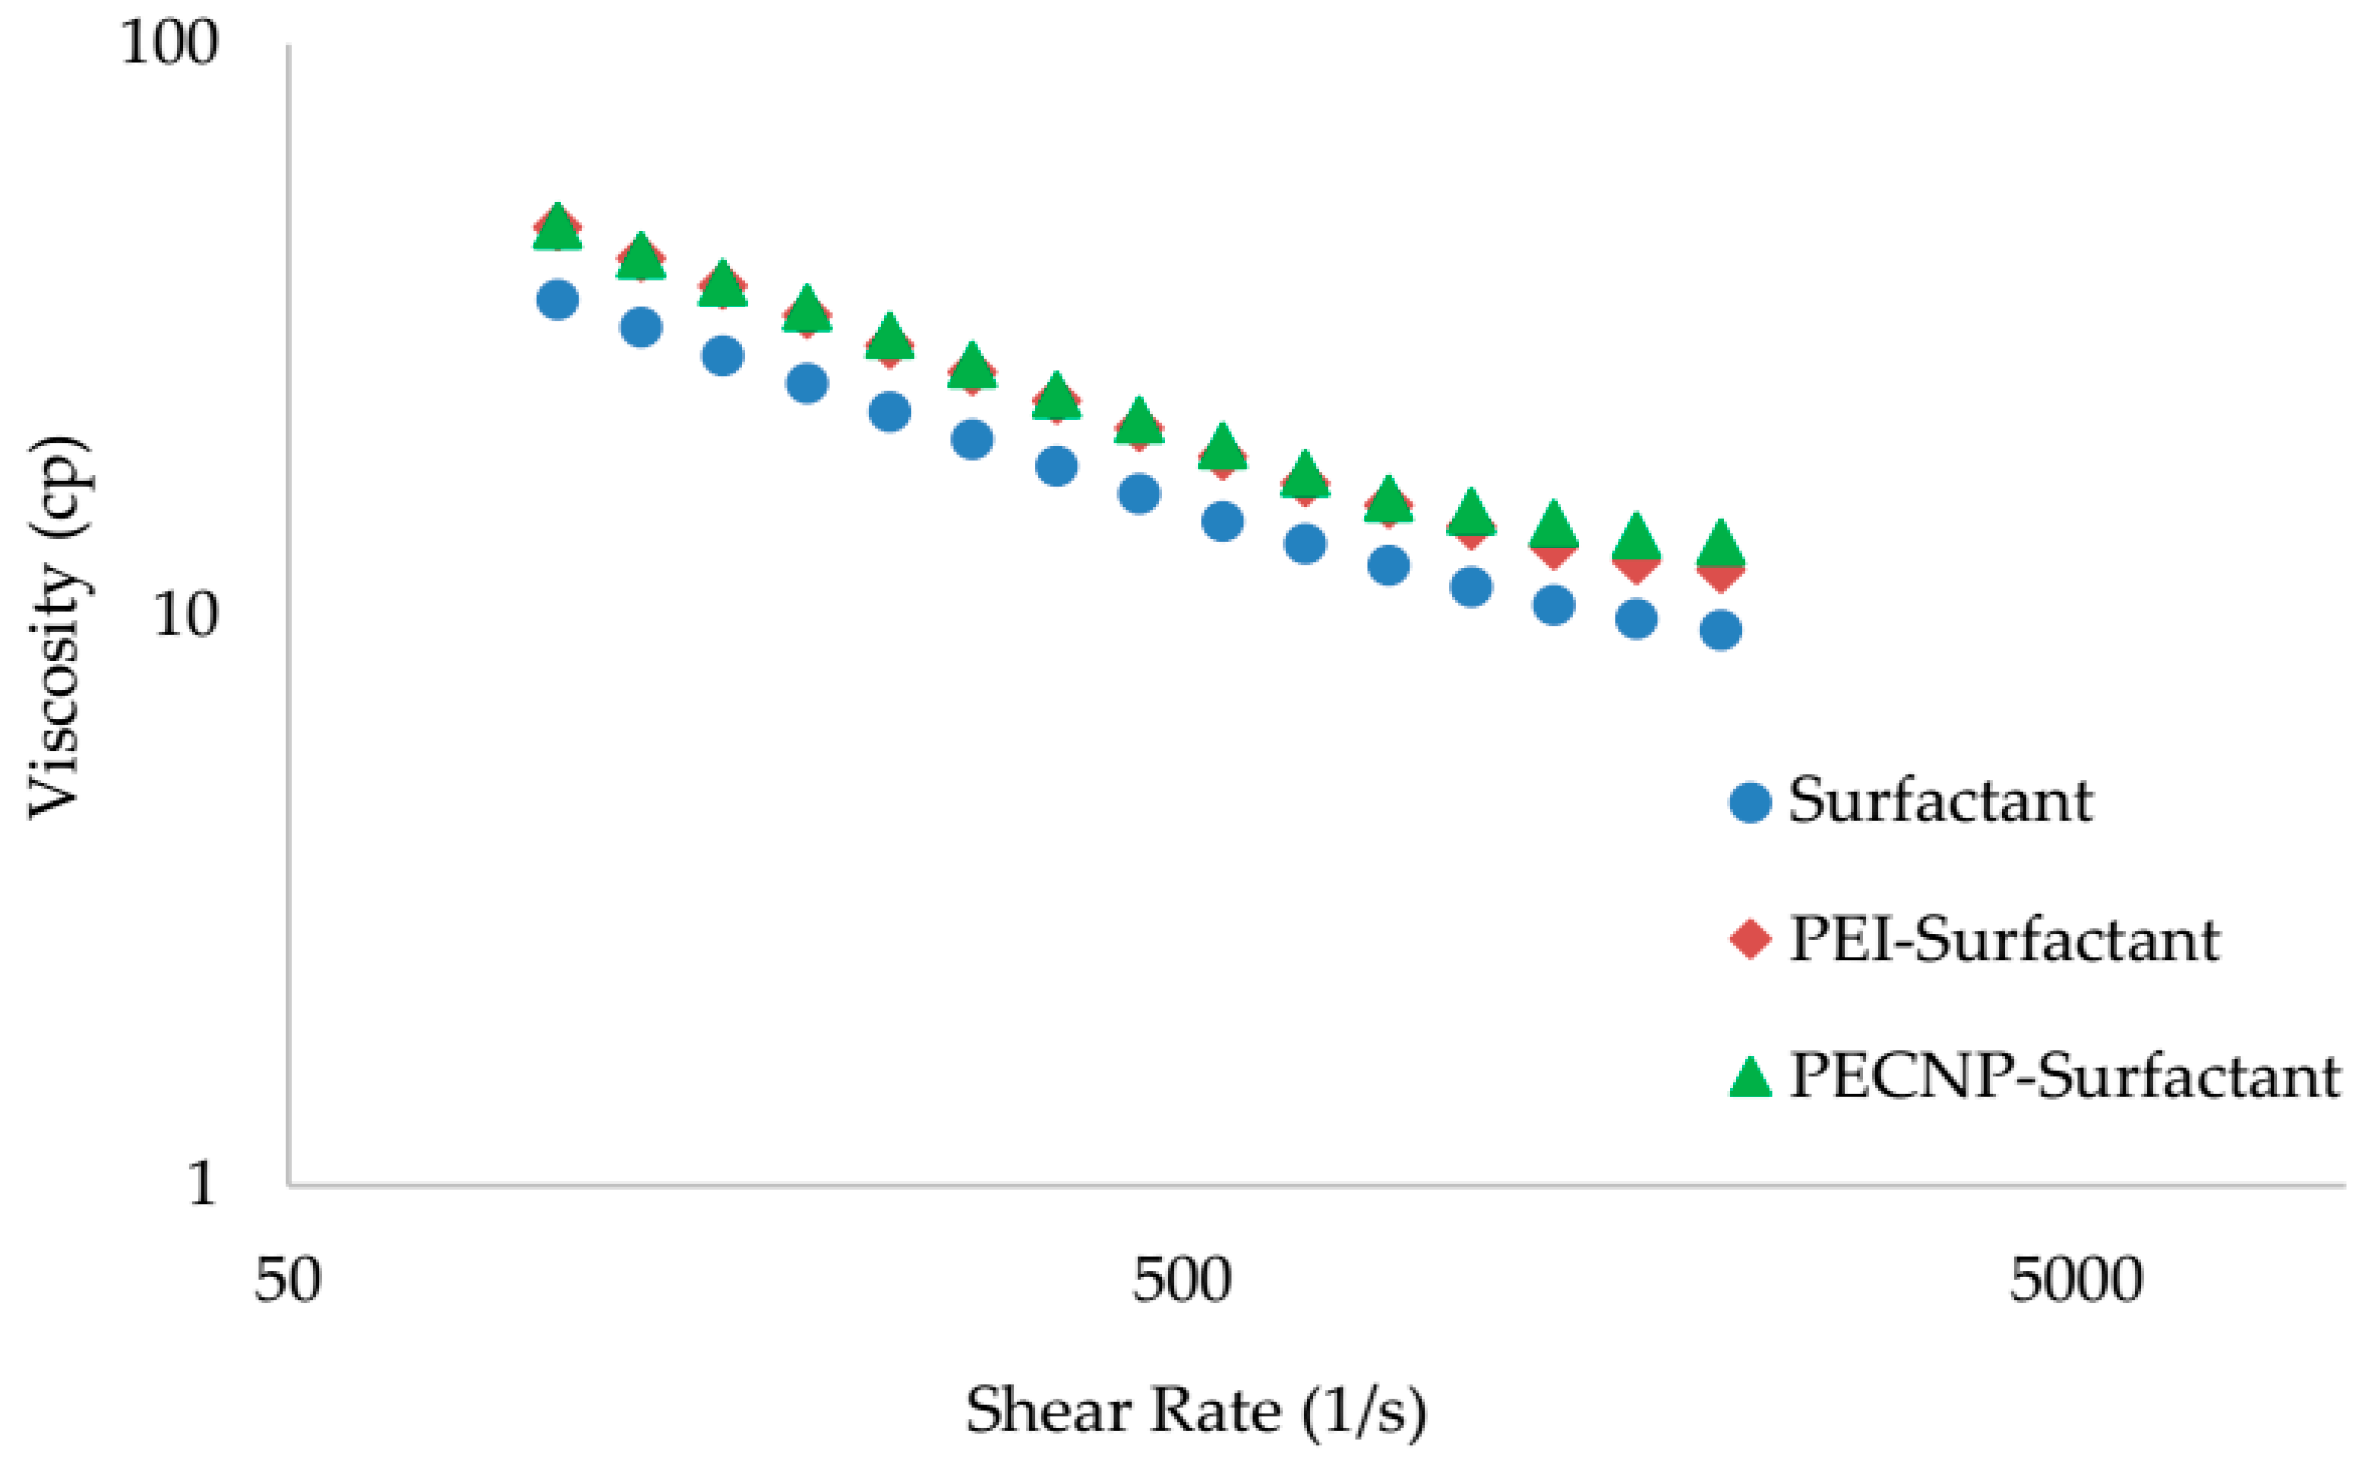
Figure 6 and Figure 7 show the viscosity vs. shear rate for the three different systems of surfactant generated CO2 foam, PEI-surfactant generated CO2 foam, and PECNP-surfactant generated CO2 foam. Table 4 and Table 5 show the computed flow consistencies and flow behavior indices for all the CO2 generated foam systems for the two different salinities of 33,667 and 67,333 ppm of diluted MLP brine, respectively. By comparing the values, it can be found that the CO2 foam generated by the PECNP-surfactant shows the most optimized results in the lower salinity, since it has the highest consistency index and a low behavior index. However, the PECNP-surfactant generated CO2 foam improves the foam viscosity in the higher salinity as well.
5.4. View Cell Testing without Crude Oil
In the view cell tests, the most optimized ratio of PECNP:surfactant was chosen by producing foam and monitoring the foam decay time in an isolated view cell. Figure 8 and Figure 9 show the comparison for two different salinities of 33,667 and 67,333 ppm of diluted MLP brine. The ratio of 1:9 and the ratio of 2:8 showed the most optimized performances in the two different salinities of 33,667 and 67,333 ppm of diluted MLP brine, respectively. Thereafter, the three CO2 foam systems, surfactant, PEI-surfactant, and PECNP-surfactant, were compared (Figure 10 and Figure 11). It was found that the PECNP-surfactant generated CO2 foam system showed the most optimized results in both salinities of 33,667 and 67,333 ppm. Compared to the foam which is generated by the surfactant only, adding PEI and PECNP to the surfactant solution improves the foam stability by 100% and generates a longer lasting foam, resulting in a higher amount of oil production.
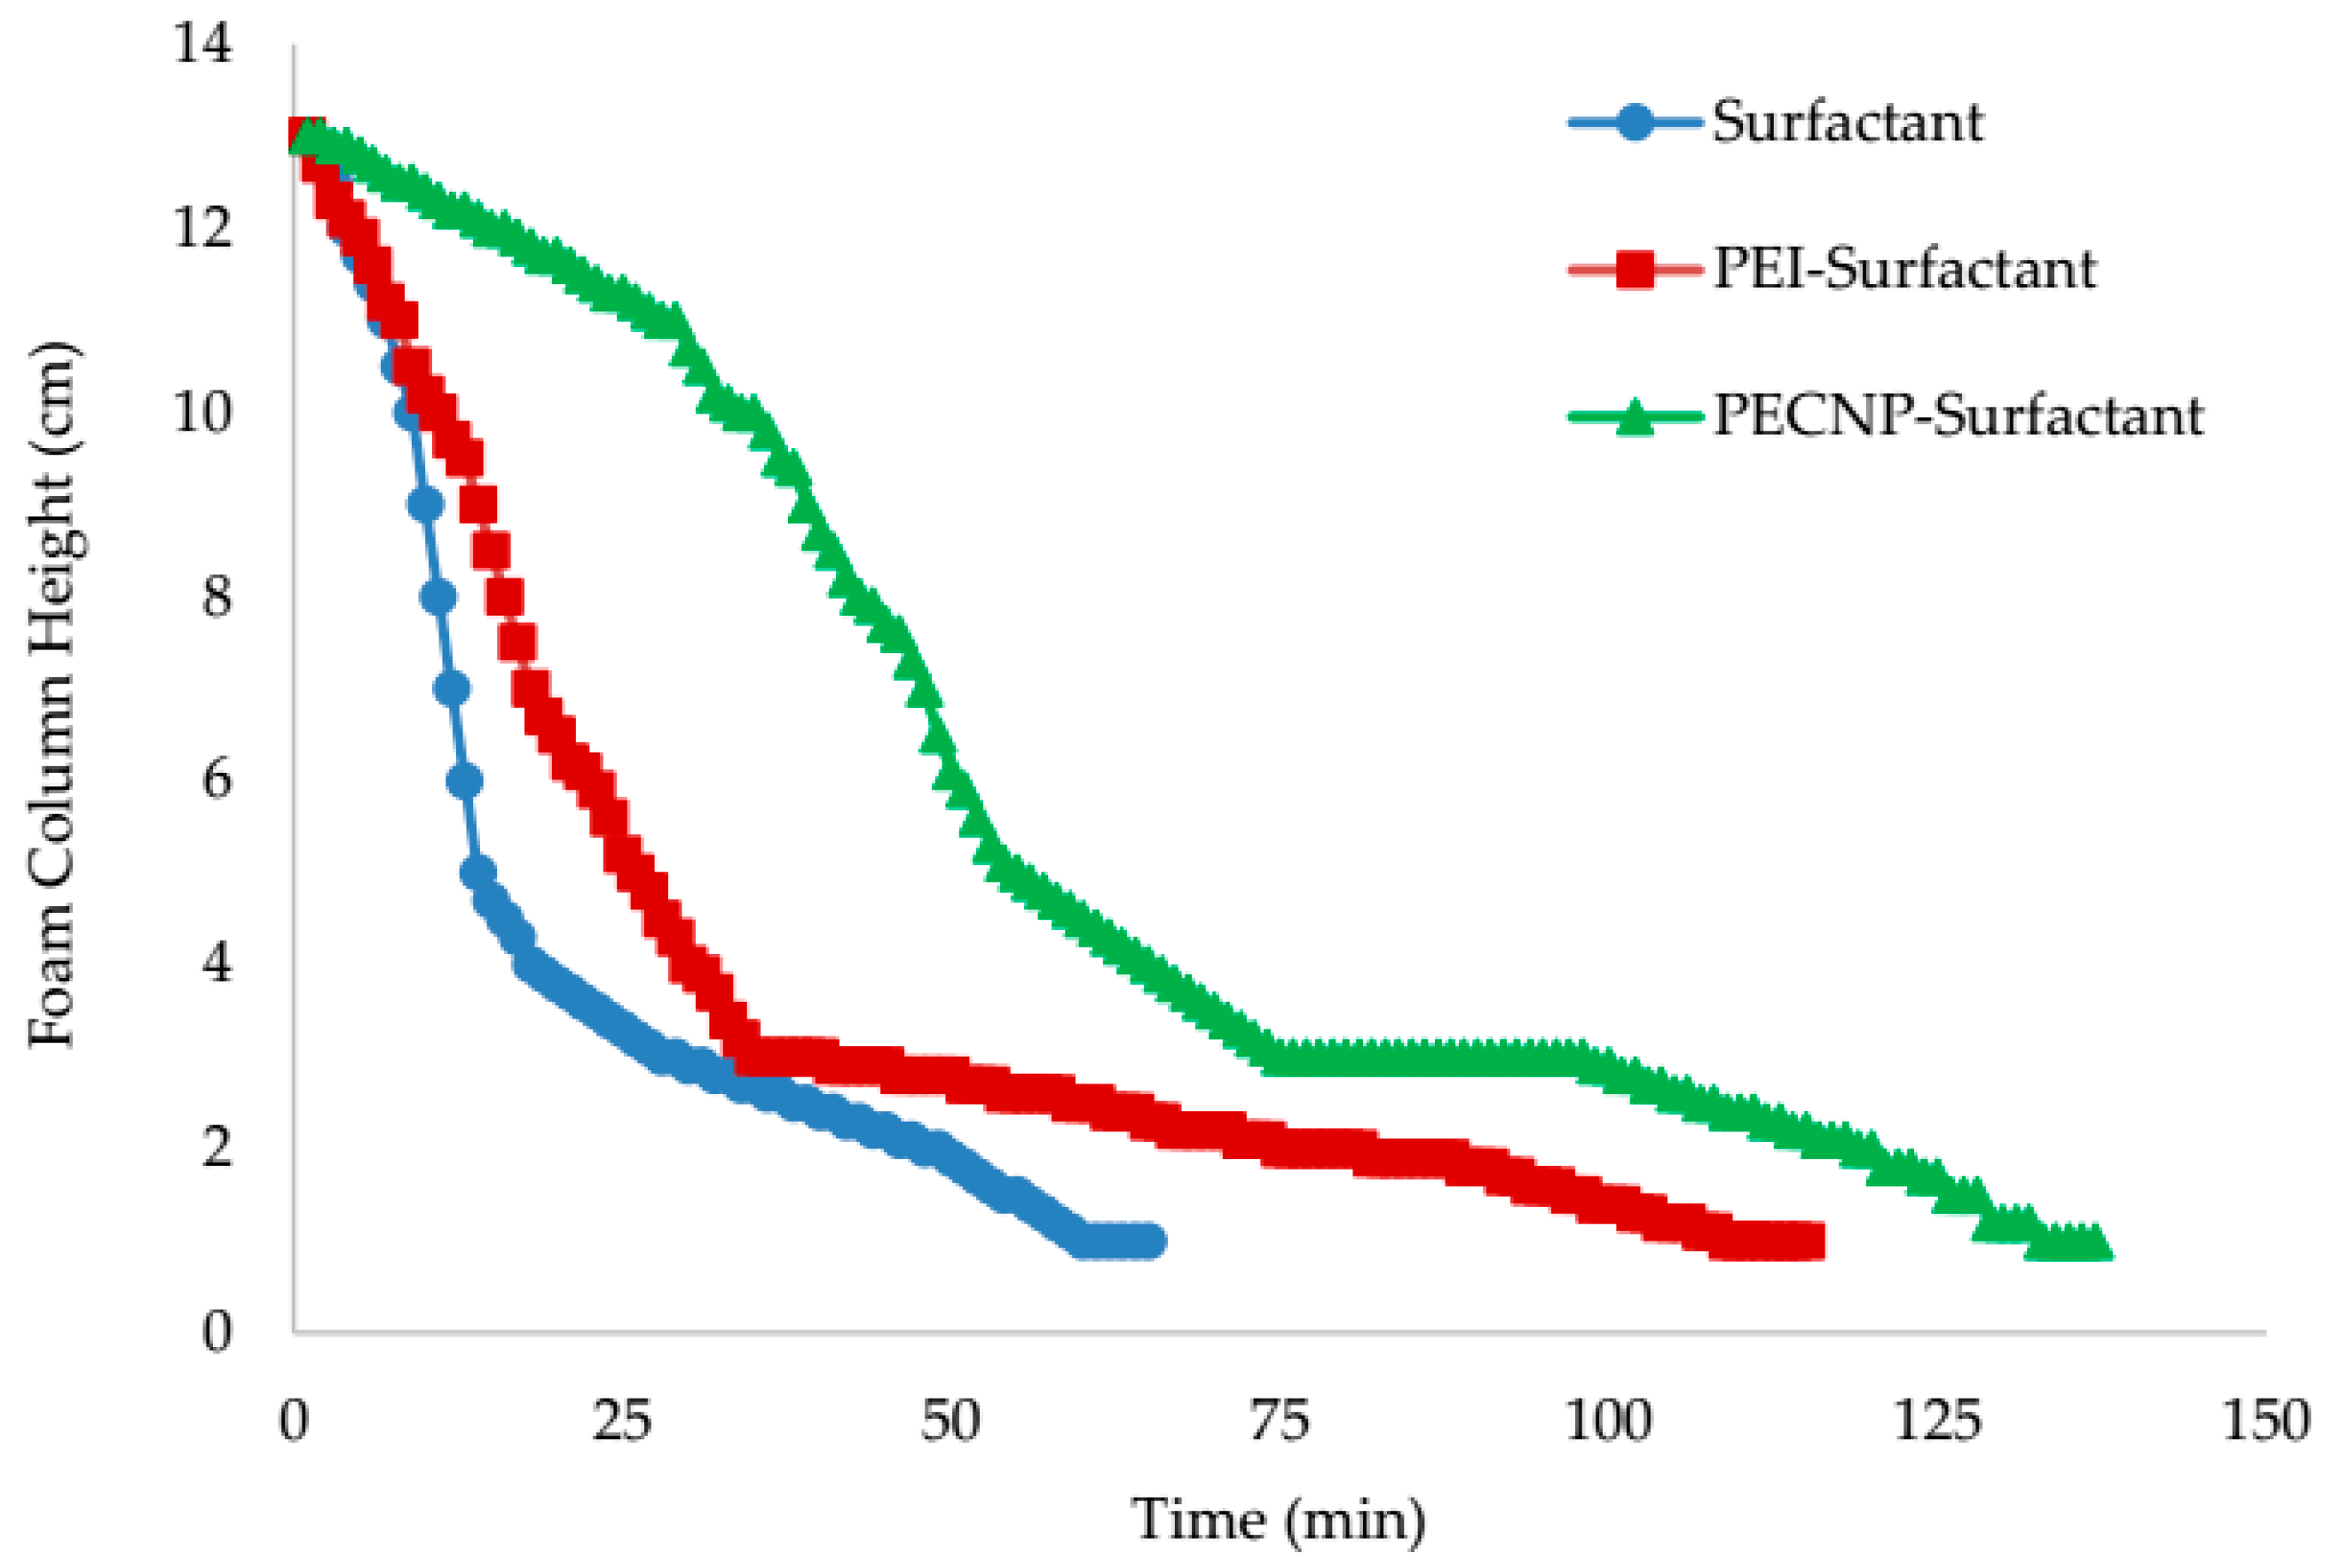
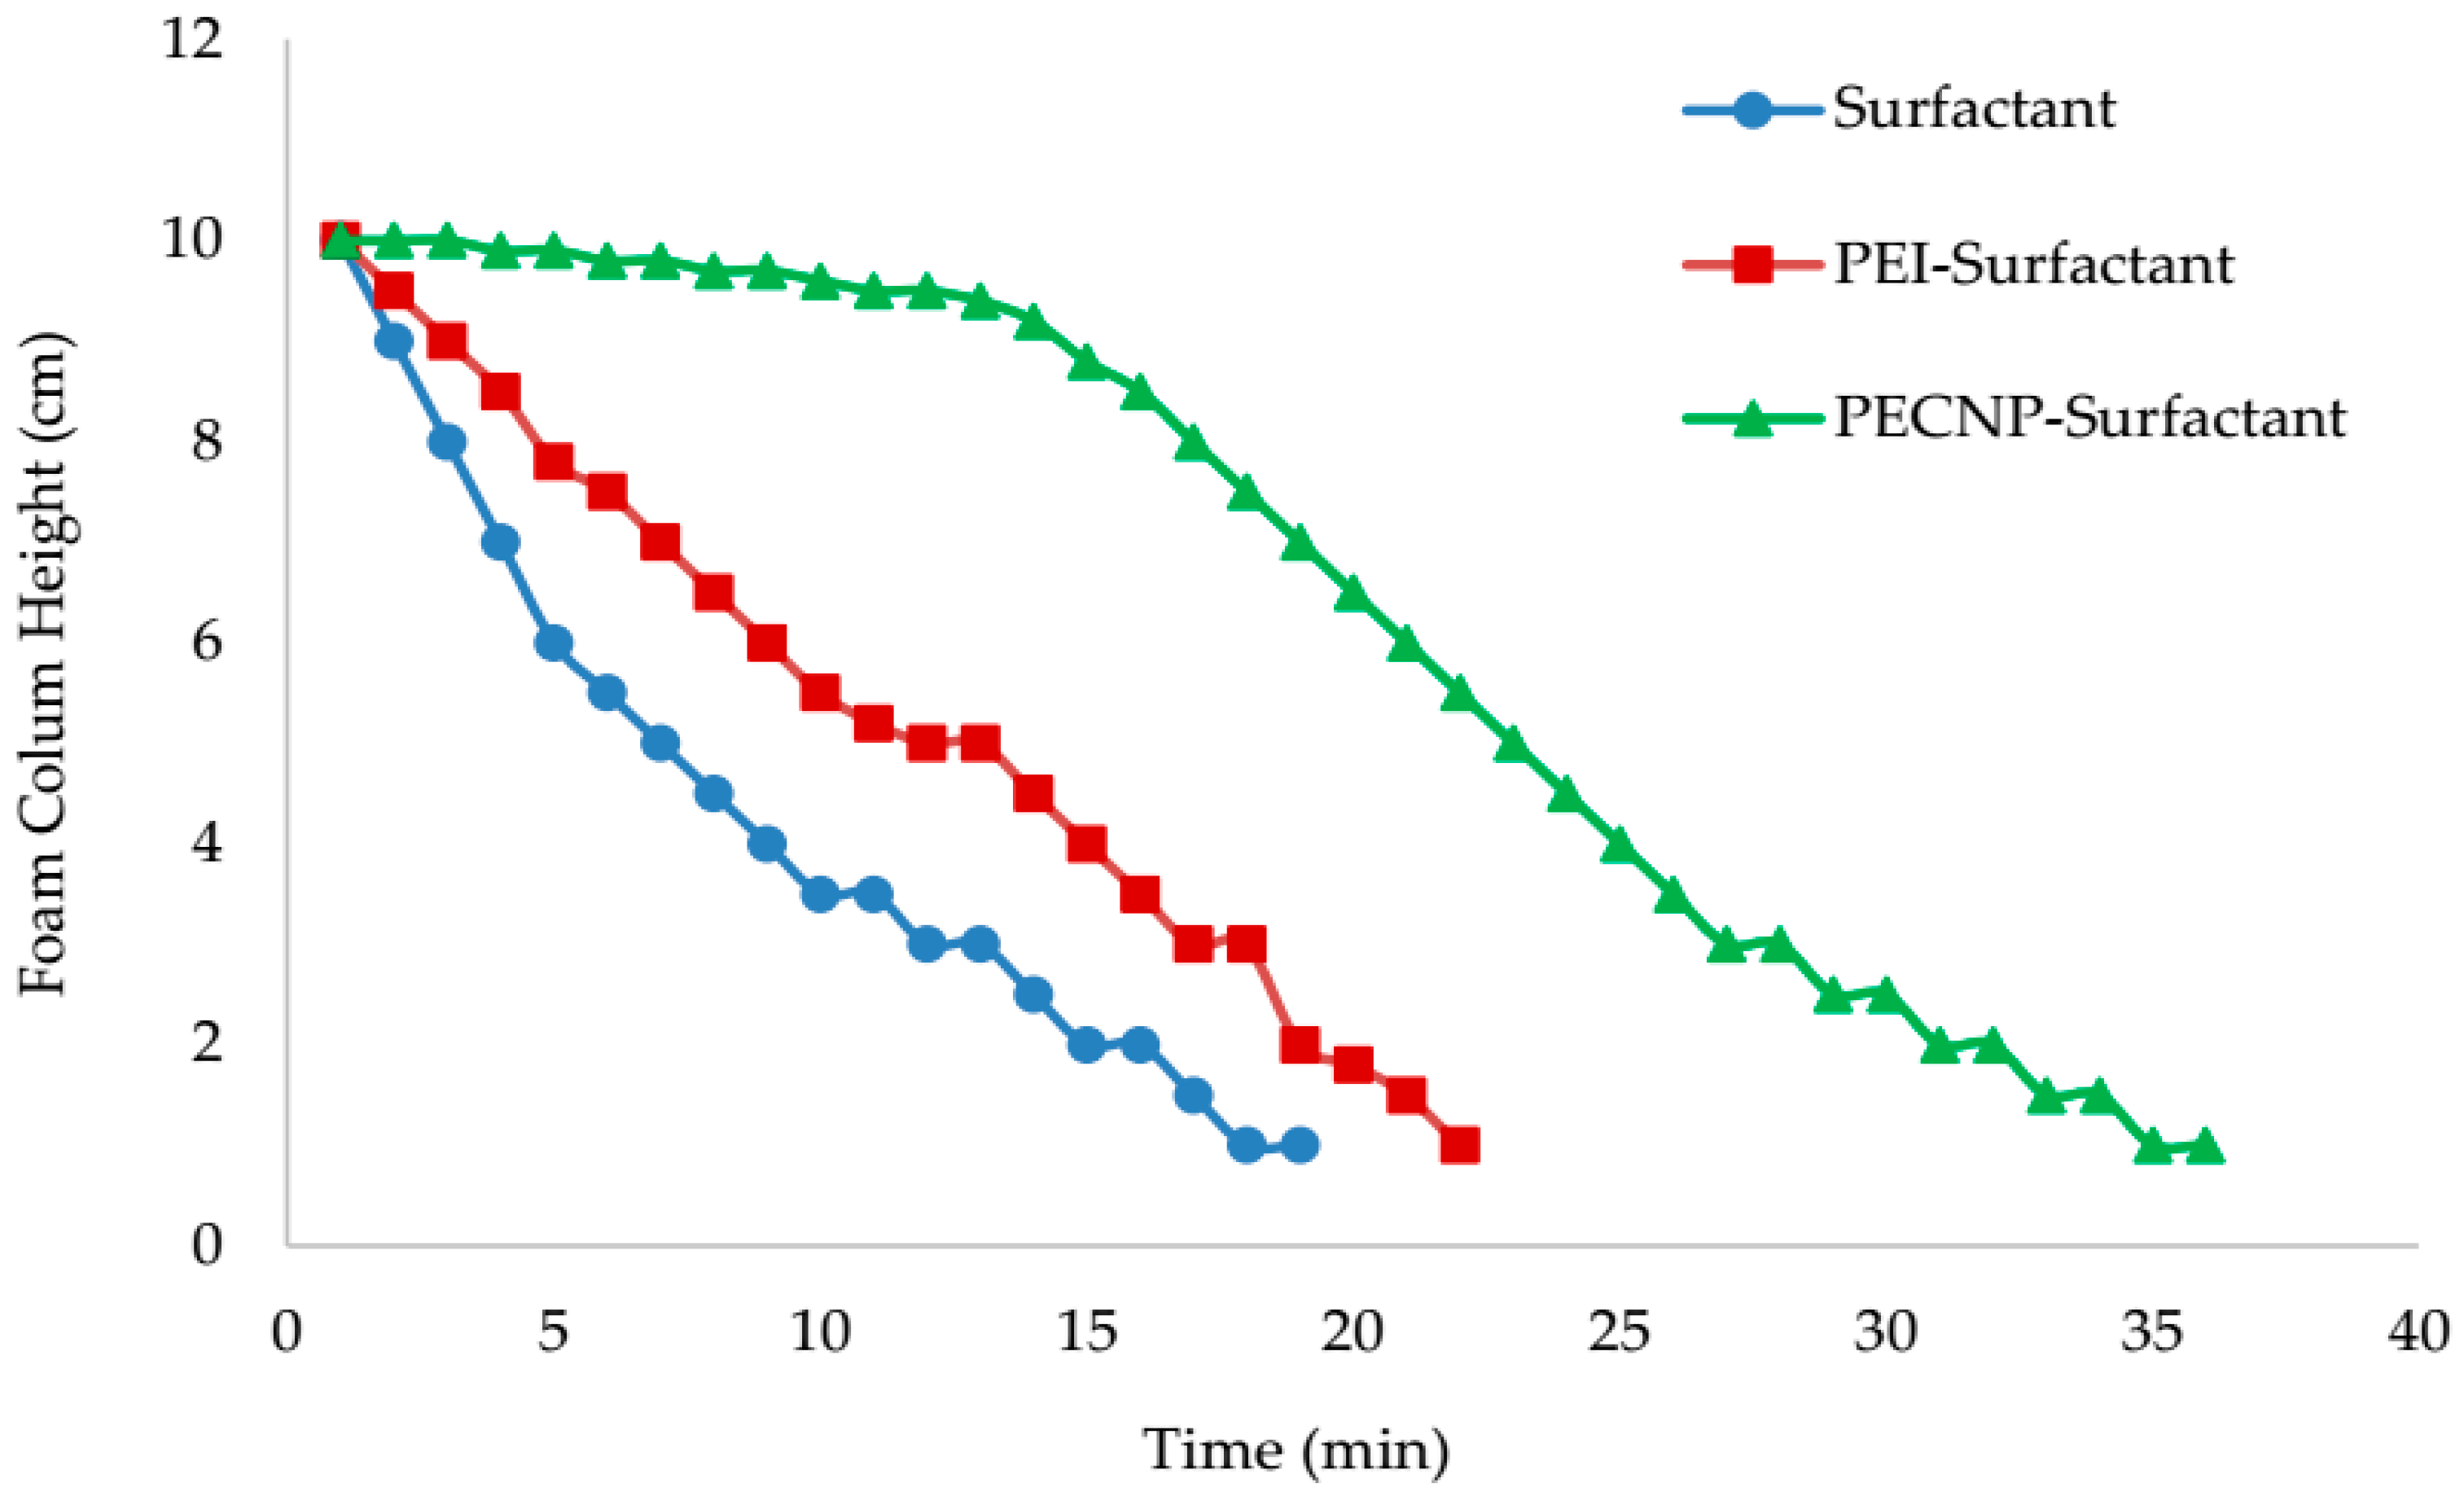
5.5. View Cell Testing with the Mississippian Crude Oil
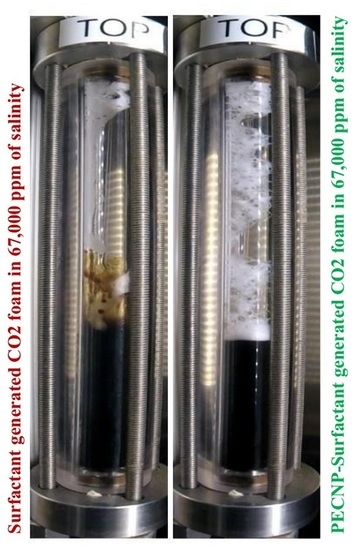
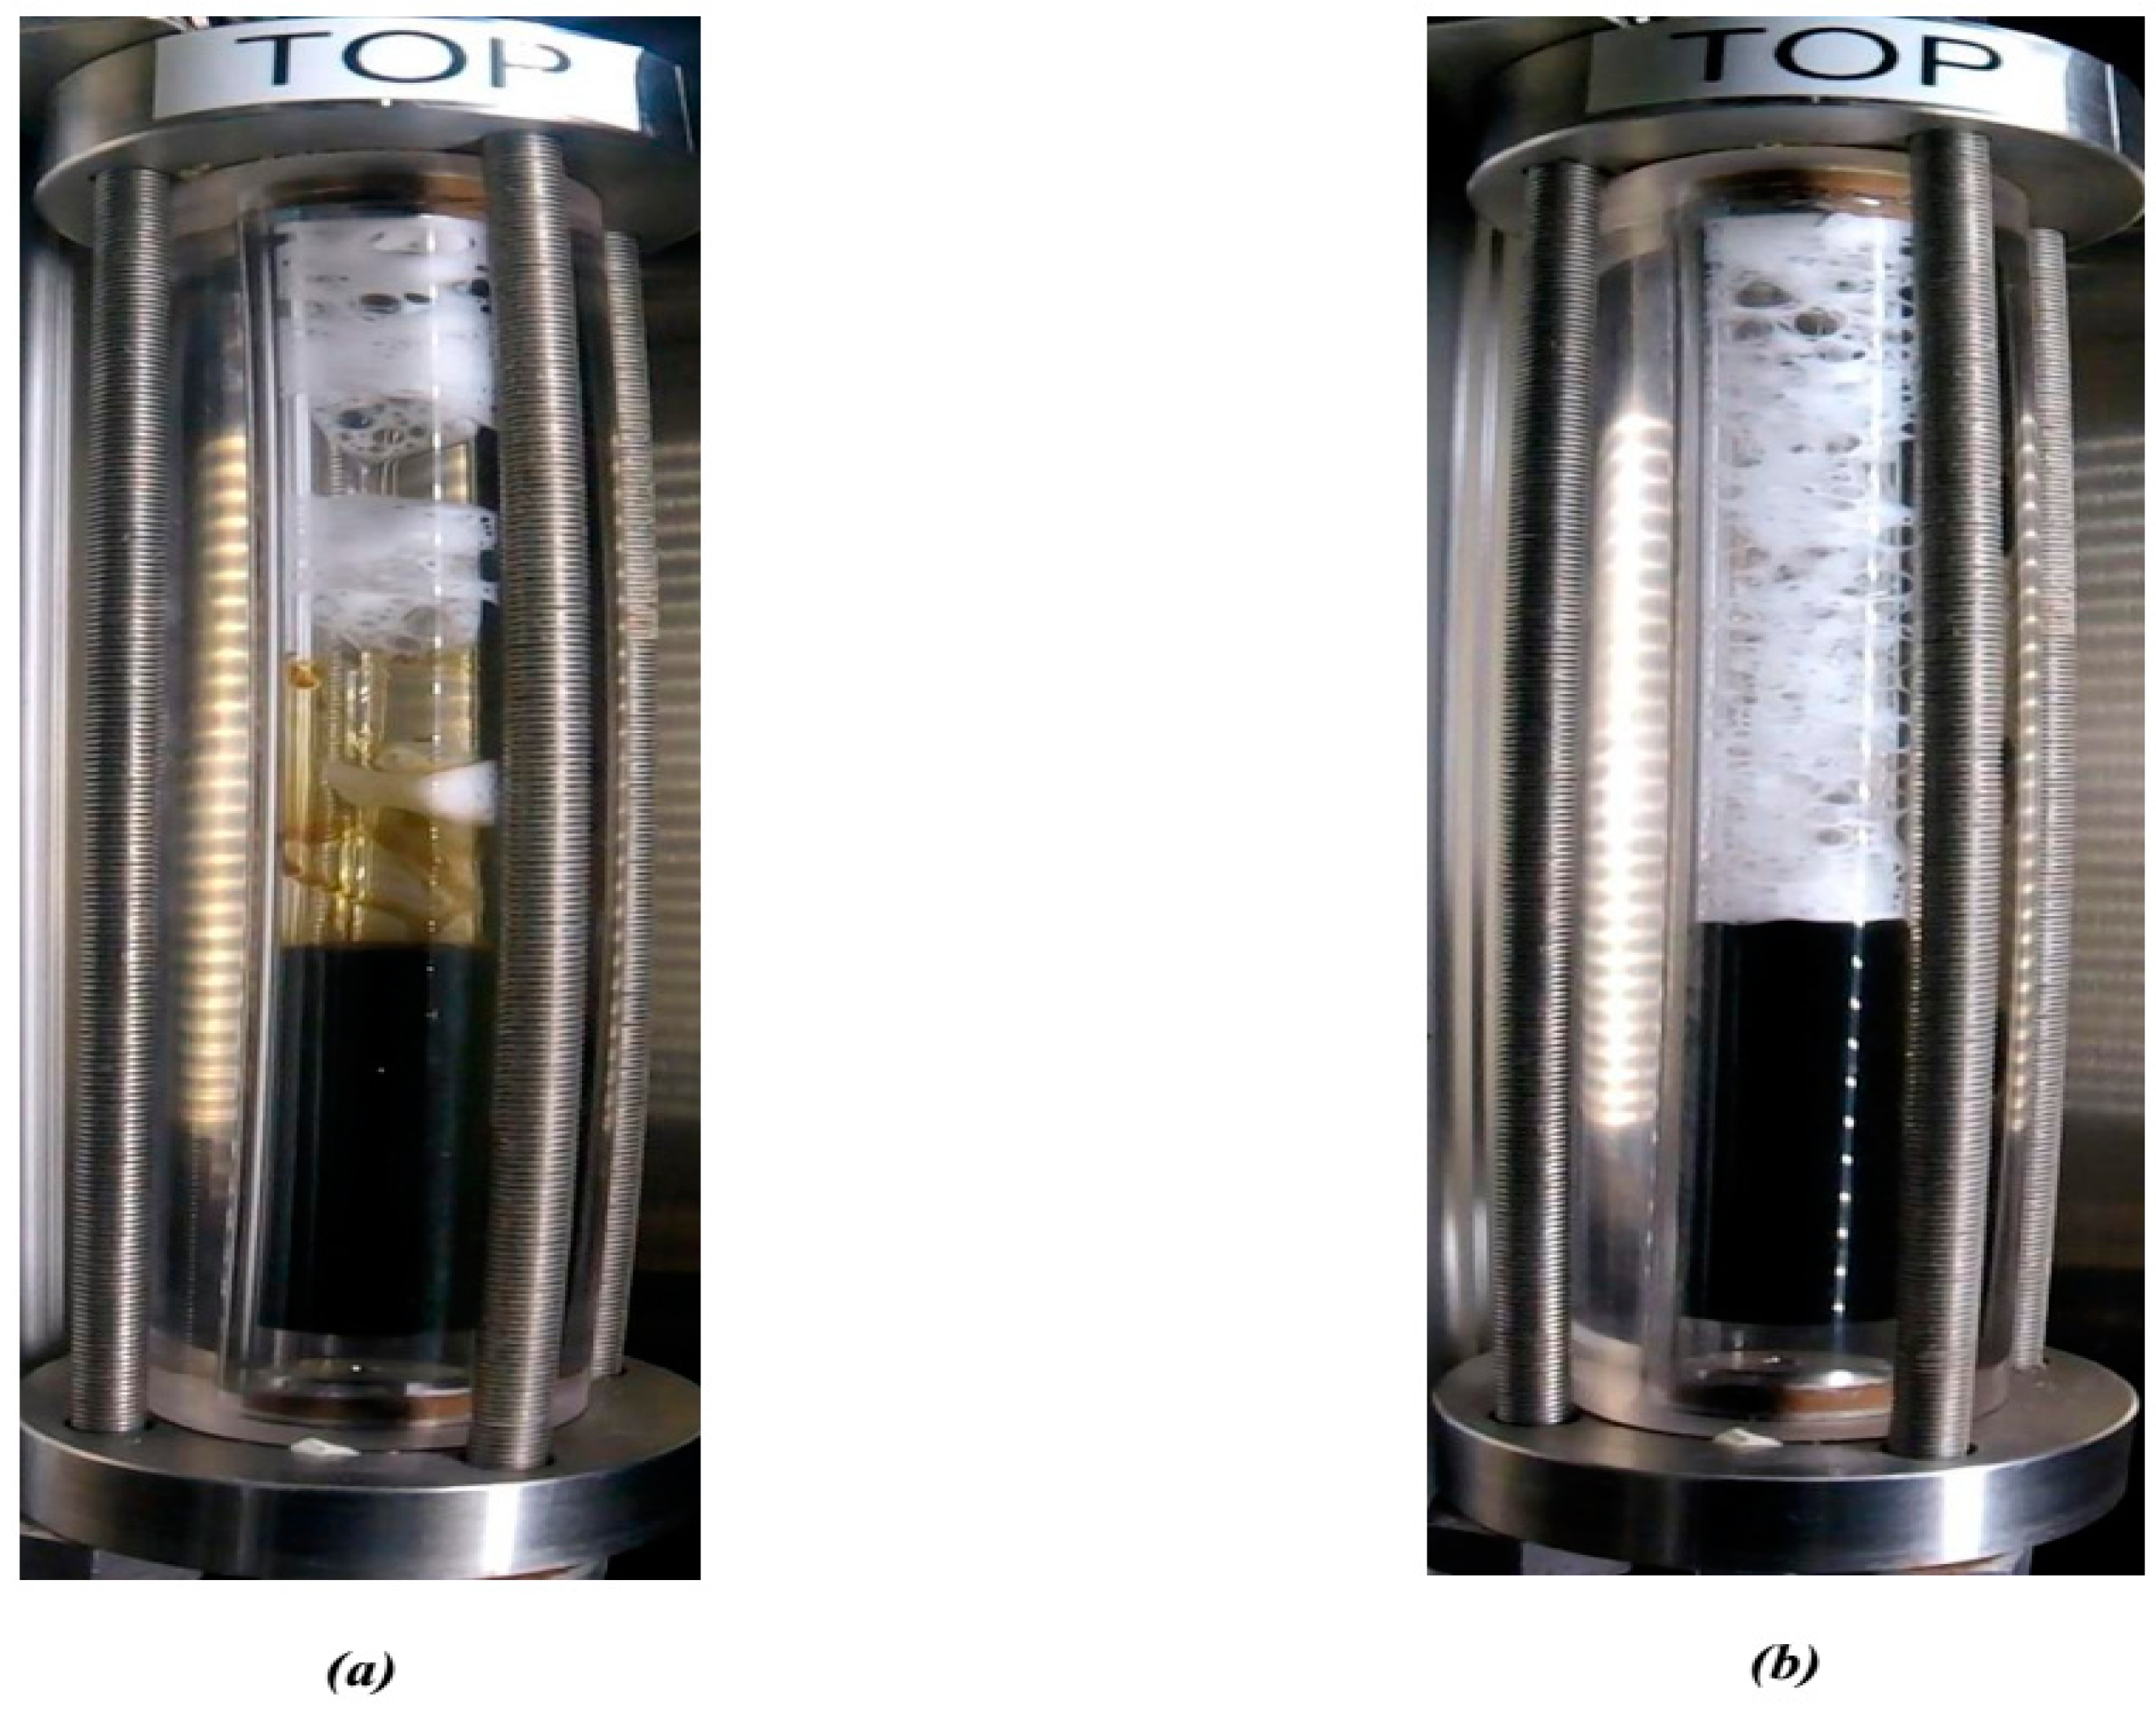
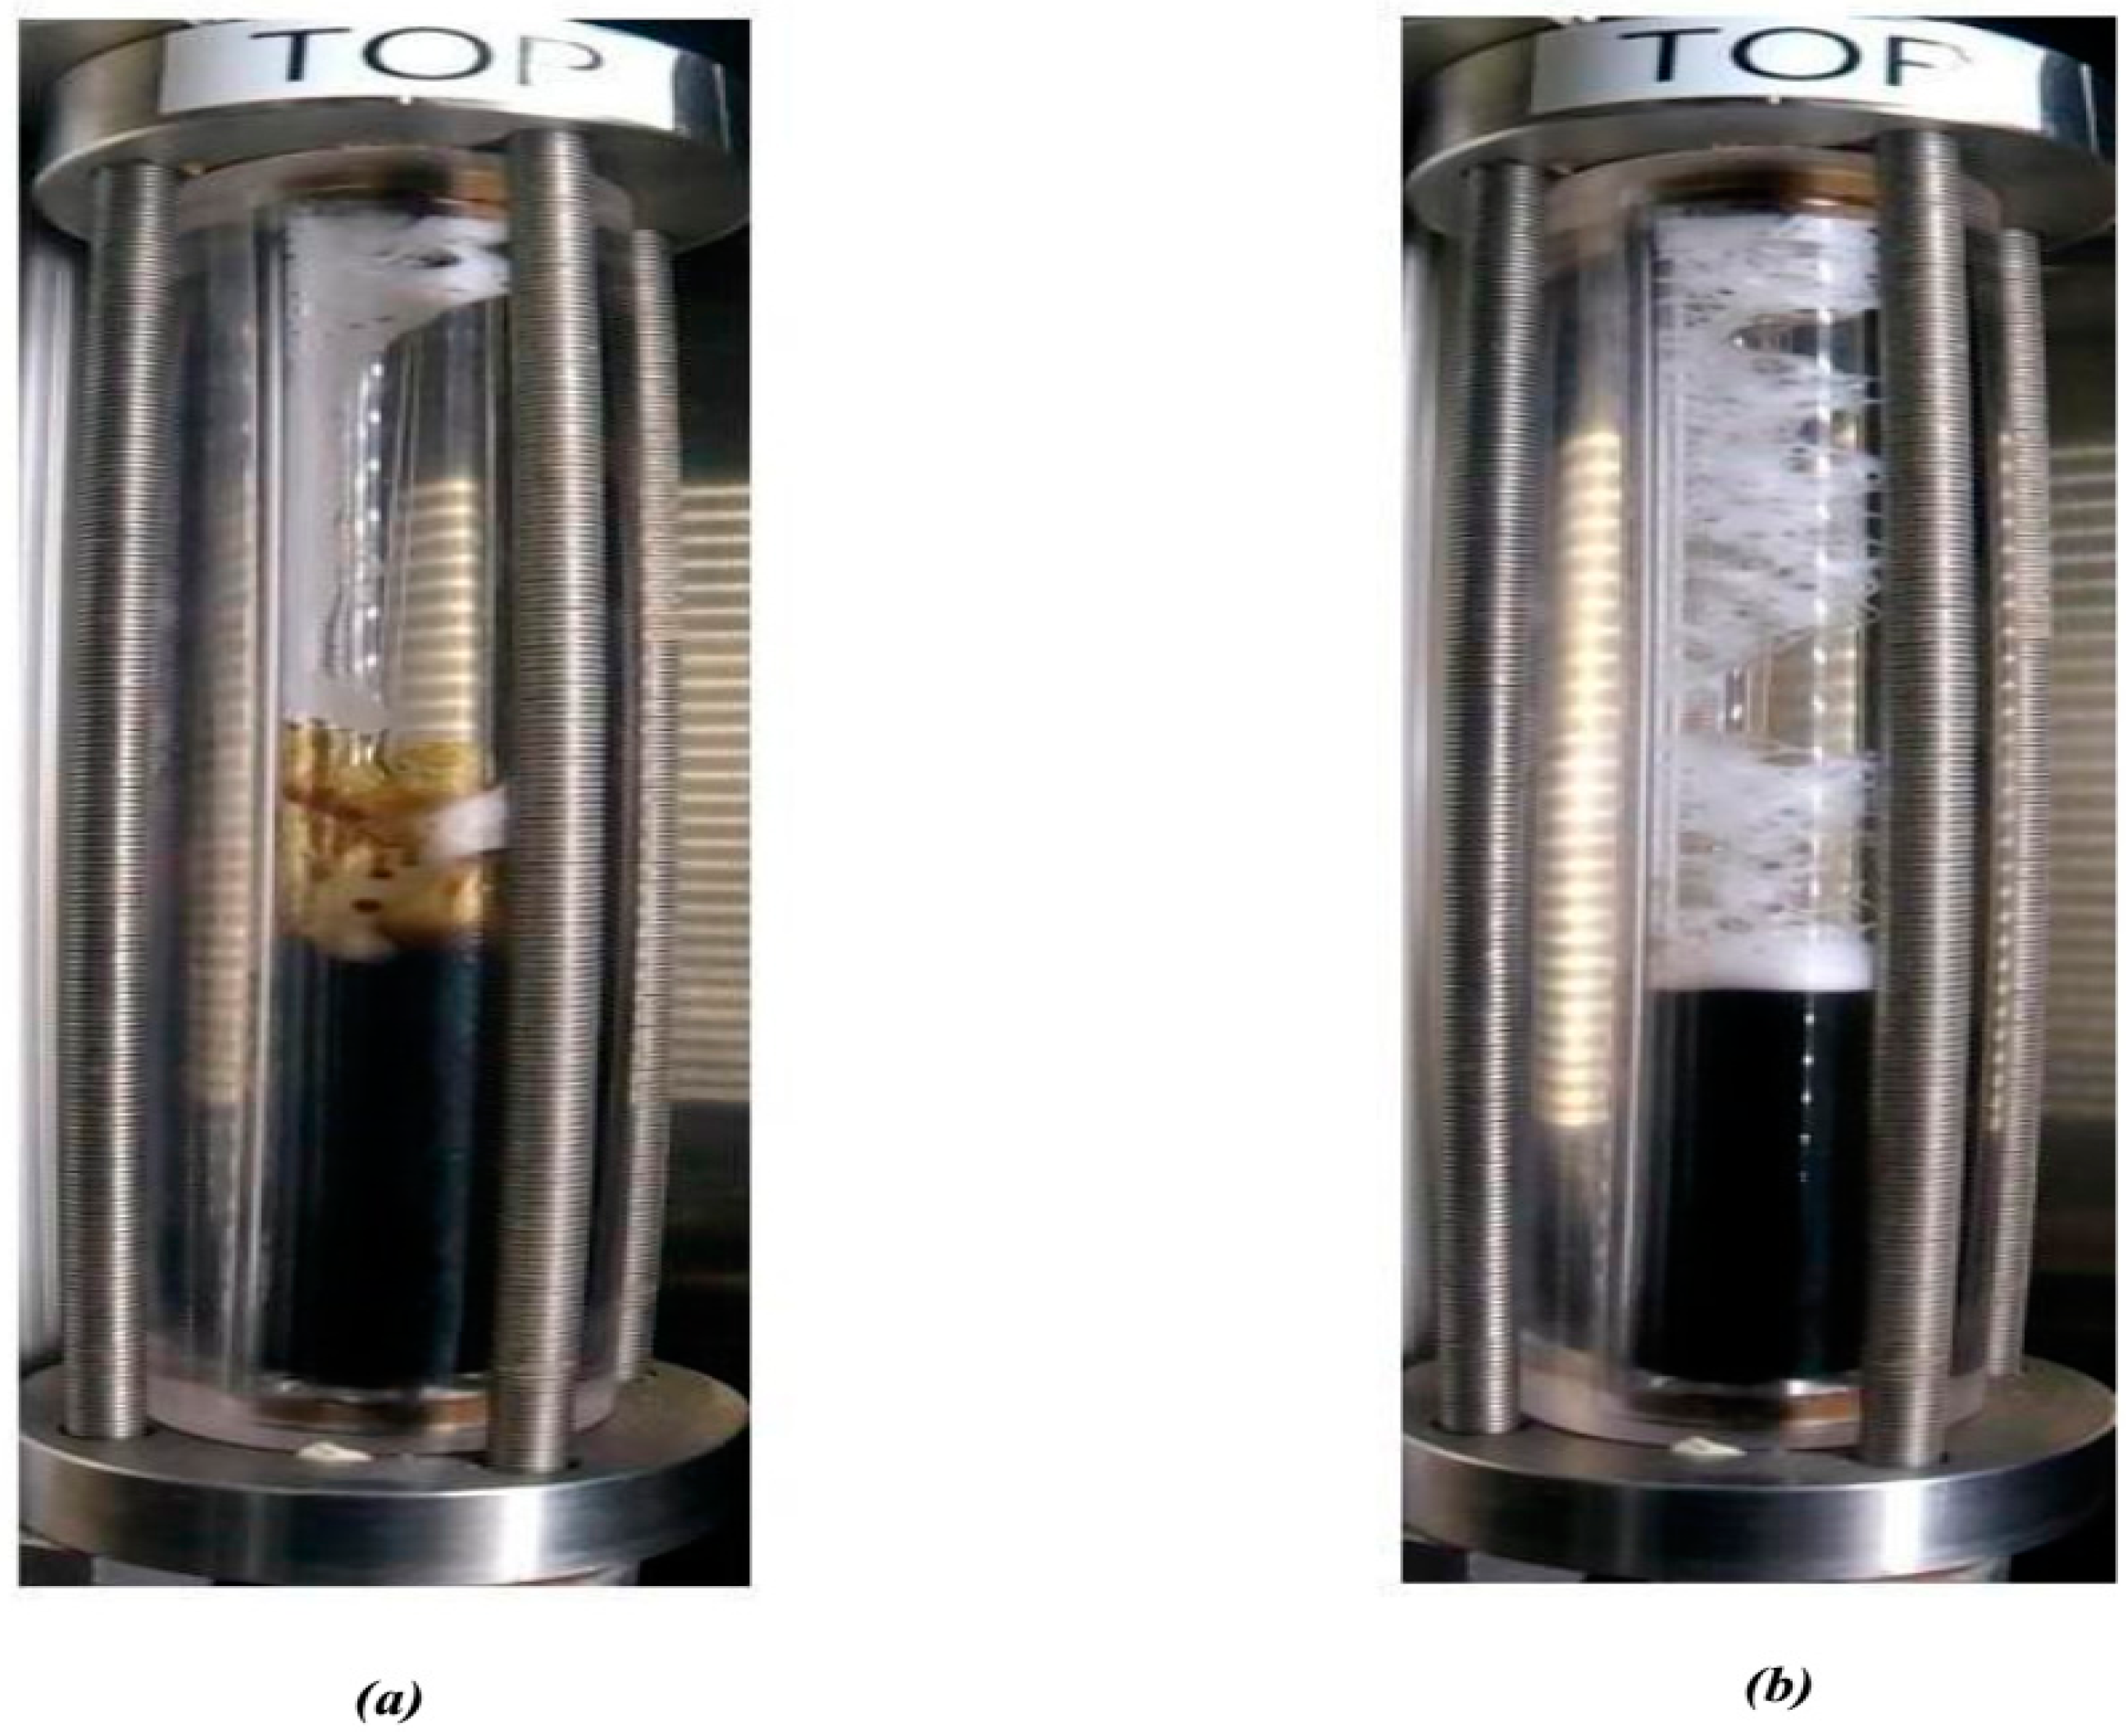
The foam durability was tested by the interaction of different CO2 foam systems with the crude oil and the results are shown in Figure 12 and Figure 13. The interaction of different CO2 foam systems with the oil was recorded for the three different systems of surfactant, PEI-surfactant, and PECNP-surfactant generated CO2 foam for the two different salinities. The PECNP-surfactant generated CO2 foam system was very stable in the presence of crude oil and at both water salinity systems tested in this work. Using polyelectrolyte nanoparticles stabilizes the surfactant generated CO2 foam and improves the durability of the foam in the presence of crude oil in the reservoirs up to 67,000 ppm salinity by at least 100%, which results in higher oil recovery and improved sweep efficiency. It is shown in Figure 14 and Figure 15 that the PECNP-surfactant generated CO2 foam has a more stable front when it reaches the crude oil. This system works at 33,000 ppm salinity, which makes it a good candidate for EOR applications in offshore locations, where they have access to sea water. Furthermore, a good portion of the conventional and unconventional resources in the United States produce brines with salinities in the range of 67,000 ppm [21], and these results can be interpreted as a valuable opportunity, as the usage of produced water with significant concentrations of divalent cations is gaining more attention due to high ratios of produced water over crude oil in the United States and other oil producing countries of the world [22].
Surfactant generated CO2 foam flooding helped with improving the recovery factor compared to CO2 flooding, but the instability of the foam in the presence of crude oil is a limiting factor for using the surfactant alone to generate the foam. Adding nanoparticles to the surfactant generated CO2 foam helps to improve the foam characteristics. The foam stability improves by strengthening the foam lamella. Nanoparticles line up and charge the foam interface. Therefore, bubbles with the same charge repel each other. This helps to thicken the lamella and prevents foam coalescence. Generating a stable foam in the presence of crude oil and in high salinity produced water can be achieved by this presented system. Improving the viscosity and stabilizing the generated foam in the presence of crude oil are the advantages of adding nanoparticles to the surfactant generated CO2 foam, which can result in increasing oil production and improving the sweep efficiency of the oil recovery process.
6. Conclusions
The addition of PEI and PECNP to the surfactant for generating supercritical CO2 foam was investigated. After analyzing the results, the following conclusions are made:
- The rheology tests indicated that adding PEI and PECNP to the surfactant solution helps to improve the rheological properties of the foam. Under the ramp test, adding PEI and PECNP helped to improve both the flow consistency and behavior indices.
- The view cell test results without the crude oil showed that adding PEI and PECNP, in any ratio of PEI:surfactant and PECNP:surfactant to the surfactant solutions, improves the foam durability. Furthermore, the PECNP-surfactant generated CO2 foam showed the highest durability compared to the surfactant generated foam and the PEI-surfactant generated CO2 foam systems.
- From the view cell test results in the presence of the crude oil, it can be concluded that the PECNP-surfactant generated CO2 foam is more durable compared to the other two systems of the PEI-surfactant and surfactant generated CO2 foam. Additionally, the PECNP-surfactant generated CO2 foam stabilizes the interface of the foam when it reaches to the crude oil.
Acknowledgments
We would like to thank the Kansas Interdisciplinary Consortium Carbonates (KICC) and the NSF EPCoR for funding this project. In addition, the authors would like to thank Zach Kessler and Scott Ramskill from the Tertiary Oil Recovery Program (TORP) and the Chemical and Petroleum Engineering department at the University of Kansas for their kind help in installing the setups.
Author Contributions
Negar Nazari helped with designing some of the experiments, performed all the experiments, analyzed the data, and wrote the paper. Jyun-Syung Tsau helped with designing some of the experiments, helped with the data analysis, and gave comments on the paper. Reza Barati, the PI of the project, contributed to the generation of the idea, designing of the experimental work, helped with analyzing the results, and modified the first draft of the paper several times.
Conflicts of Interest
The authors declare no conflict of interest.
Nomenclatures
| Shear stress, lb/ft2 | |
| Flow consistency index | |
| Flow behavior index | |
| Viscosity, cp | |
| Effective viscosity, cp | |
| γ | Shear rate, s−1 |
References
- Langston, M.; Hoadley, S.; Young, D. Definitive CO2 Flooding Response in the SACROC Unit. In Proceedings of the Enhancced Oil Recovery Symposium, Tulsa, OK, USA, 16–21 April 1988. [Google Scholar]
- Holm, W.L. CO2 Flooding: Its Time Has Coming. J. Pet. Technol. 1982, 34, 2739. [Google Scholar] [CrossRef]
- Stalkup, F.I. Miscible Displacement. In Monograph; Society of Petroleum Engineers: Dallas, TX, USA, 1983; Volume 8. [Google Scholar]
- Green, D.; Willhite, P. Enhanced Oil Recovery; Society of Petroleum Engineers (SPE): Richardson, TX, USA, 1998. [Google Scholar]
- Barati, R.; Pennel, S.; Matson, M.; Linroth, M. Overview of CO2 Injection and WAG Sensitivity in SACROC. In Proceedings of the Improved Oil Recovery Conference, Tulsa, OK, USA, 11–13 April 2016. [Google Scholar]
- Bernard, G.G.; Holm, L.W. Method for Recovering Oil from Subterranean Formations. U.S. Patent 3,342,256, 19 September 1967. [Google Scholar]
- JPT Staff. CO2 Foam Floods: Foam Properties and Mobility Reduction Effectiveness. J. Pet. Technol. 1998. [Google Scholar] [CrossRef]
- Fried, A. The Foam-Drive Process for Increasing the Recovery of Oil; Report of Investigation 5866; USBM: Washington, DC, USA, 1961. [Google Scholar]
- Lord, D.L. Analysis of Dynamic and Static Foam Behavior. J. Pet. Technol. 1981, 33, 39–45. [Google Scholar] [CrossRef]
- Tsau, J.S.; Heller, J.P. Evaluation of Surfactants for CO2 Foam Mobility Control. In Proceedings of the Permian Basin Oil and Gas Recovery Conference, Midland, TX, USA, 18–20 March 1992. [Google Scholar]
- Farajzadeh, R.; Andrianov, A.; Krastev, R.; Hirasaki, G.J.; Rossen, W.R. Foam-Oil Interaction in Porous Media: Implications for Foam Assisted Enhanced Oil Recovery. Adv. Colloid Interface Sci. 2012. [CrossRef]
- Schramm, L.L. Foam Sensitivity to Crude Oil in Porous Media; Foams, Fundamentals and Applications in the Petroleum Industry, American Chemical Society: Washington, DC, USA, 1994. [Google Scholar]
- Kalyanaraman, N.; Arnold, C.; Gupta, A.; Tsau, J.S.; Barati, R. Stability Improvement of CO2 Foam for Enhanced Oil Recovery Applications Using Polyelectrolytes and Polyelectrolyte Complex Nanoparticles. In Proceedings of the SPE Asia Pacific Enhanced Oil Recovery Conference, Kuala Lumpur, Malaysia, 11–13 August 2015. [Google Scholar]
- Kristen-Hochrein, N.; Laschewsky, A.; Miller, R.; Klitzing, R.V. Stability of Foam Films of Oppositely Charged Polyelectrolyte/Surfactant Mixtures: Effect of Isoelectric Point. J. Phys. Chem. 2011, 115, 14475–14483. [Google Scholar] [CrossRef] [PubMed]
- Kristen, N.; Klitzing, R.V. Effect of Polyelectrolyte/Surfactant Combinations on the Stability of Foam Films. Soft Matter 2009, 6, 849–861. [Google Scholar] [CrossRef]
- Patel, C.; Barrufet, M.A.; Petriciolet, A.B. Effective Resource Management of Produced Water in Oil and Gas Operations. In Proceedings of the Canadian International Petroleum Conference, Calgary, AB, Canada, 8–10 June 2004. [Google Scholar]
- Evans, P.; Robinson, K. Produced Water Management-Reservoir and Facilities Engineering Aspects. In Proceedings of the Middle East Oil Show and Conference, Bahrain, 20–23 February 1999. [Google Scholar]
- Caudle, D.D. Produced Water Regulations in United States: Then, Now and in the Future. In Proceedings of the SPE Annual Technical Conference and Exhibition, San Antonio, TX, USA, 29 September–2 October 2002. [Google Scholar]
- International Union of Pure and Applied Chemistry (IUPAC). Compendium of Chemical Terminology (The Gold Book); Blackwell Scientific: Oxford, UK, 1997. [Google Scholar]
- Schramm, L.L.; Marangoni, G. Surfactants and Their Solutions: Basic Principles. In Surfactants: Fundamentals and Applications in the Petroleum Industry; Cambridge University Press: Cambridge, UK, 2000; pp. 9–10. [Google Scholar]
- Guerra, K.; Dahm, K.; Dundorf, S. Oil and Gas Produced Water Management and Beneficial Use in the Western United States; Science and Technology Program Report; U.S. Department of the Interior Bureau of Reclamation: Denver, CO, USA, 2011. [Google Scholar]
- Folarin, Y.; An, D.; Caffrey, S.; Soh, J.; Sensen, C.W.; Voordouw, J.; Jack, T.; Voordouw, G. Contribution of Make-up Water to the Microbial Community in an Oilfield from Which Oil is Produced by Produced Water Re-injection. Int. Biodeterior. Biodegrad. 2013, 81, 44–50. [Google Scholar] [CrossRef]
Figure 1.
Schematic diagram of the interfacial tension measurement setup [13] (with permission from Society of Petroleum Engineers, 2015).
Figure 1.
Schematic diagram of the interfacial tension measurement setup [13] (with permission from Society of Petroleum Engineers, 2015).
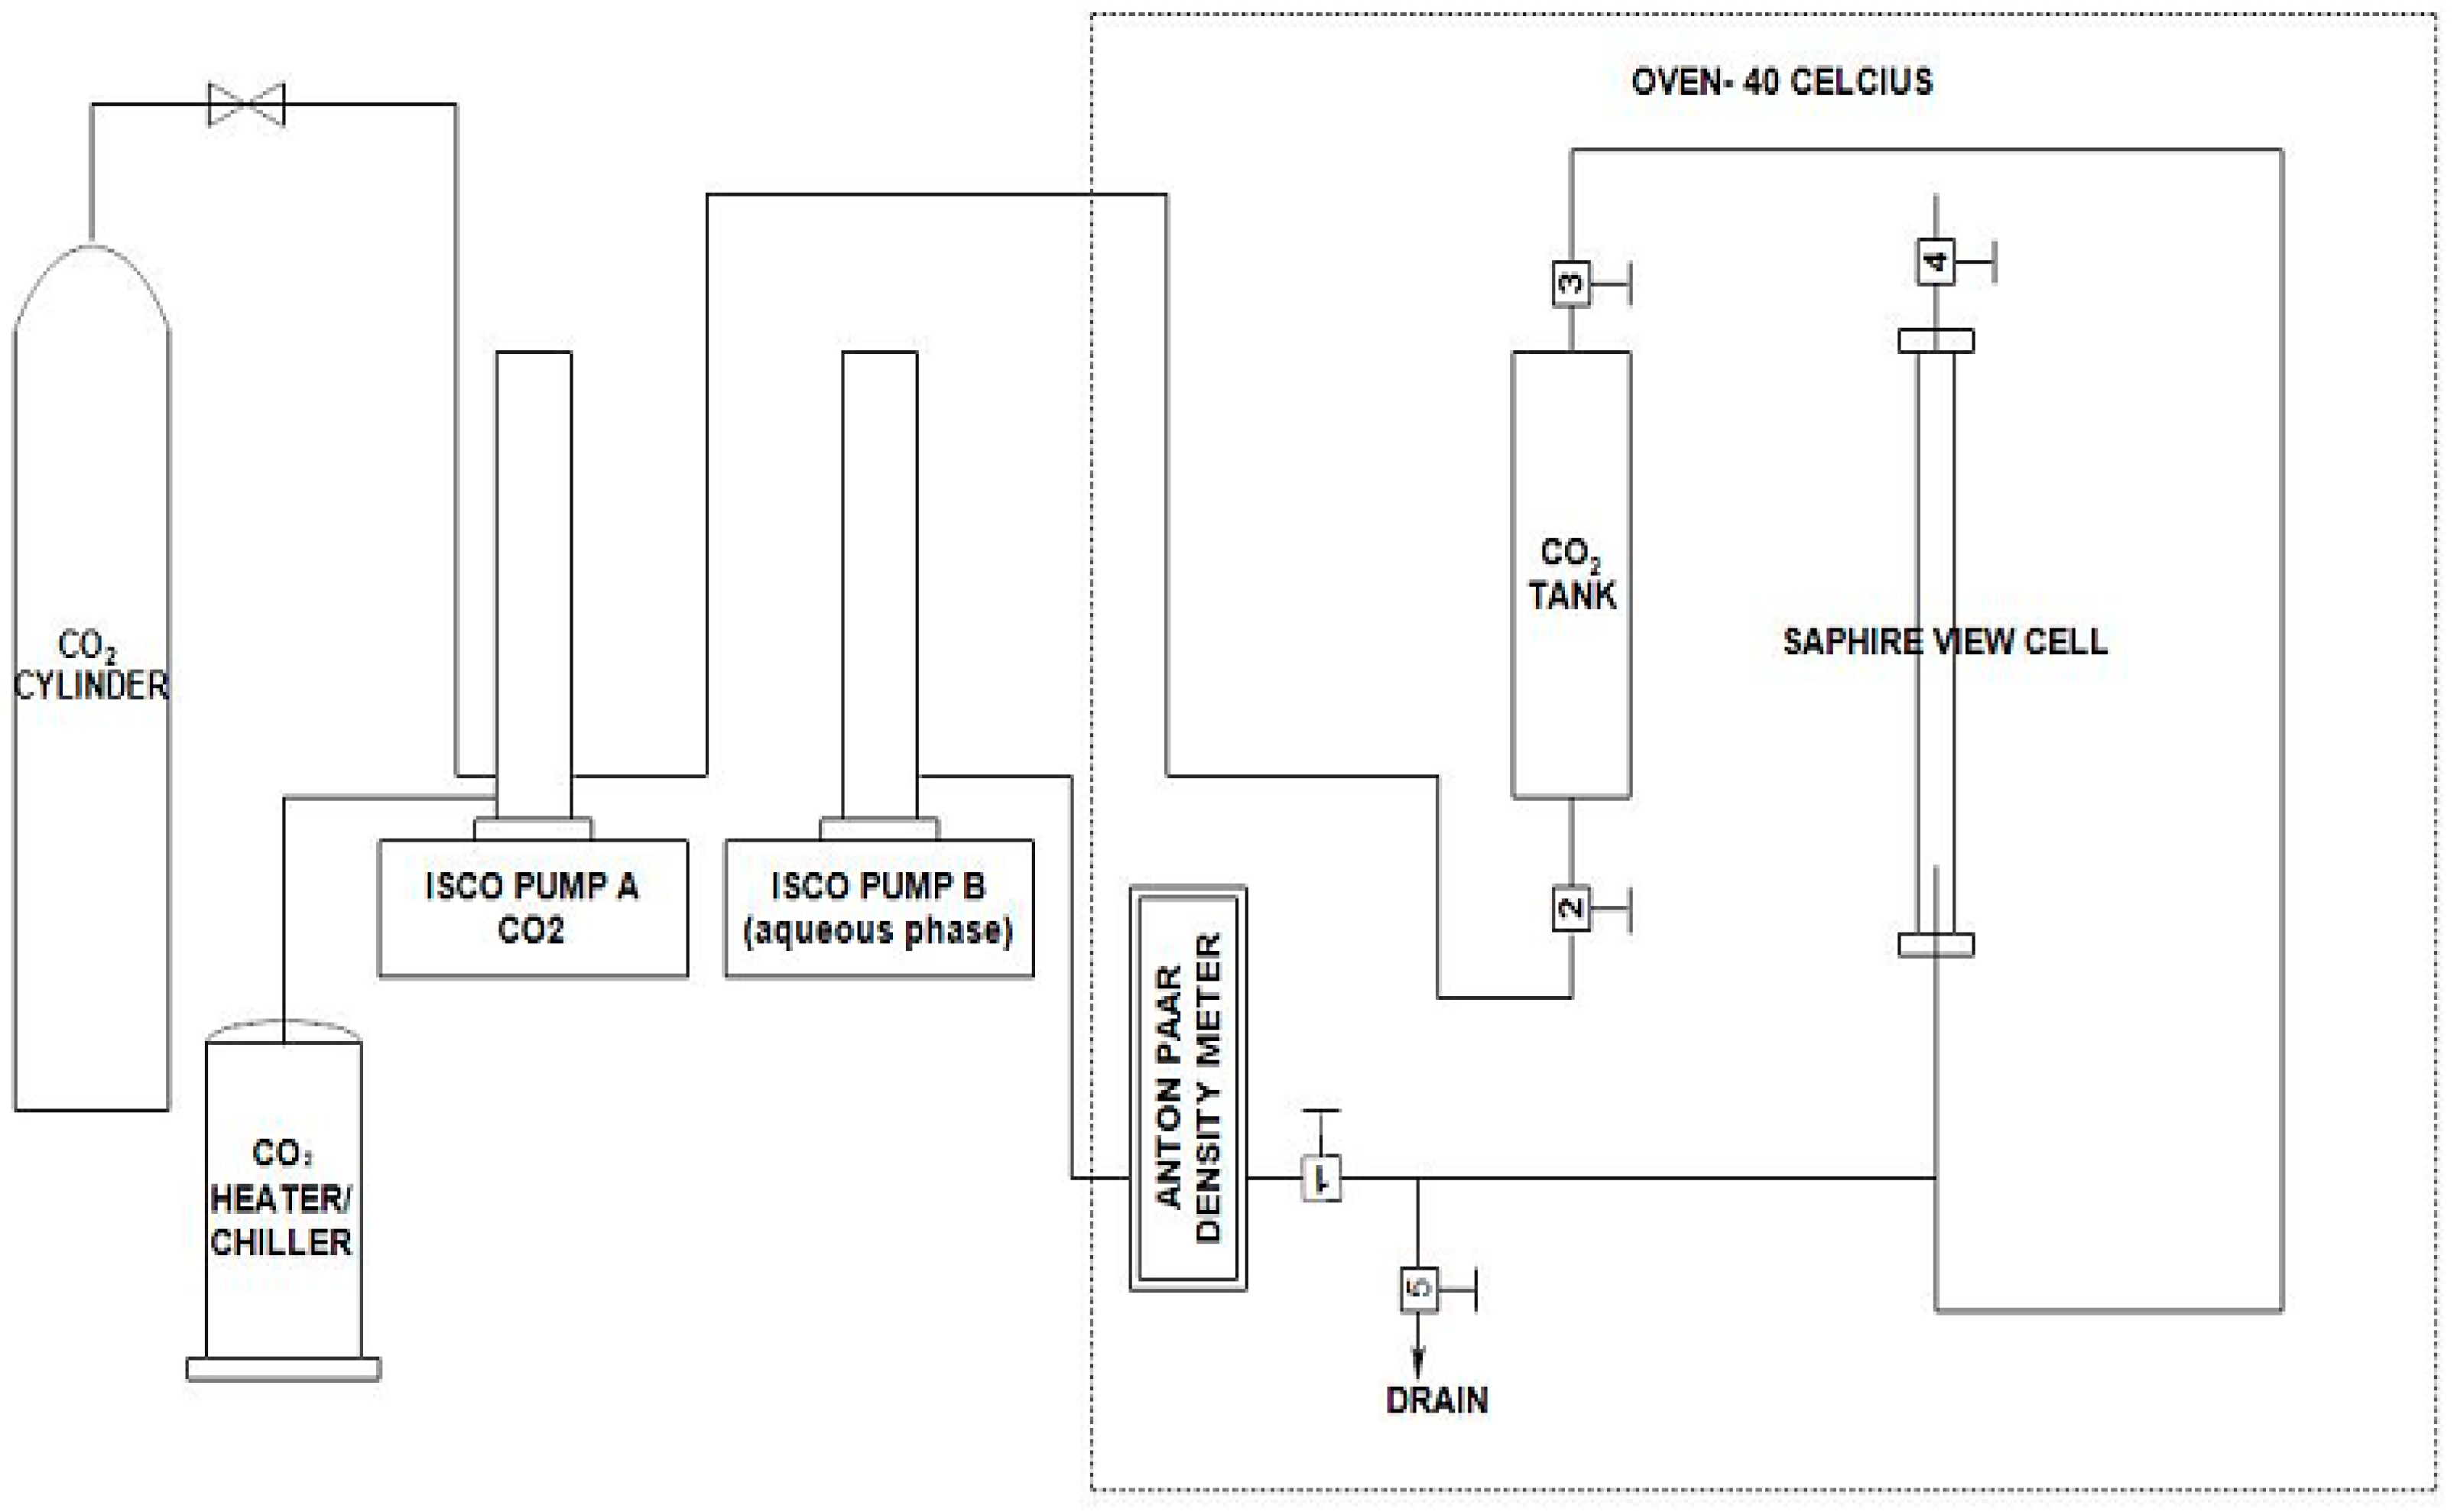
Figure 2.
Schematic diagram of the Anton Paar rheometer setup [13] (with permission from Society of Petroleum Engineers, 2015).
Figure 2.
Schematic diagram of the Anton Paar rheometer setup [13] (with permission from Society of Petroleum Engineers, 2015).

Figure 3.
Schematic diagram of the Anton Paar rheometer setup [13] (with permission from Society of Petroleum Engineers, 2015).
Figure 3.
Schematic diagram of the Anton Paar rheometer setup [13] (with permission from Society of Petroleum Engineers, 2015).

Figure 4.
Interfacial tension vs. the surfactant concentration for different systems in 33,667 ppm salinity of diluted MLP brine.
Figure 4.
Interfacial tension vs. the surfactant concentration for different systems in 33,667 ppm salinity of diluted MLP brine.
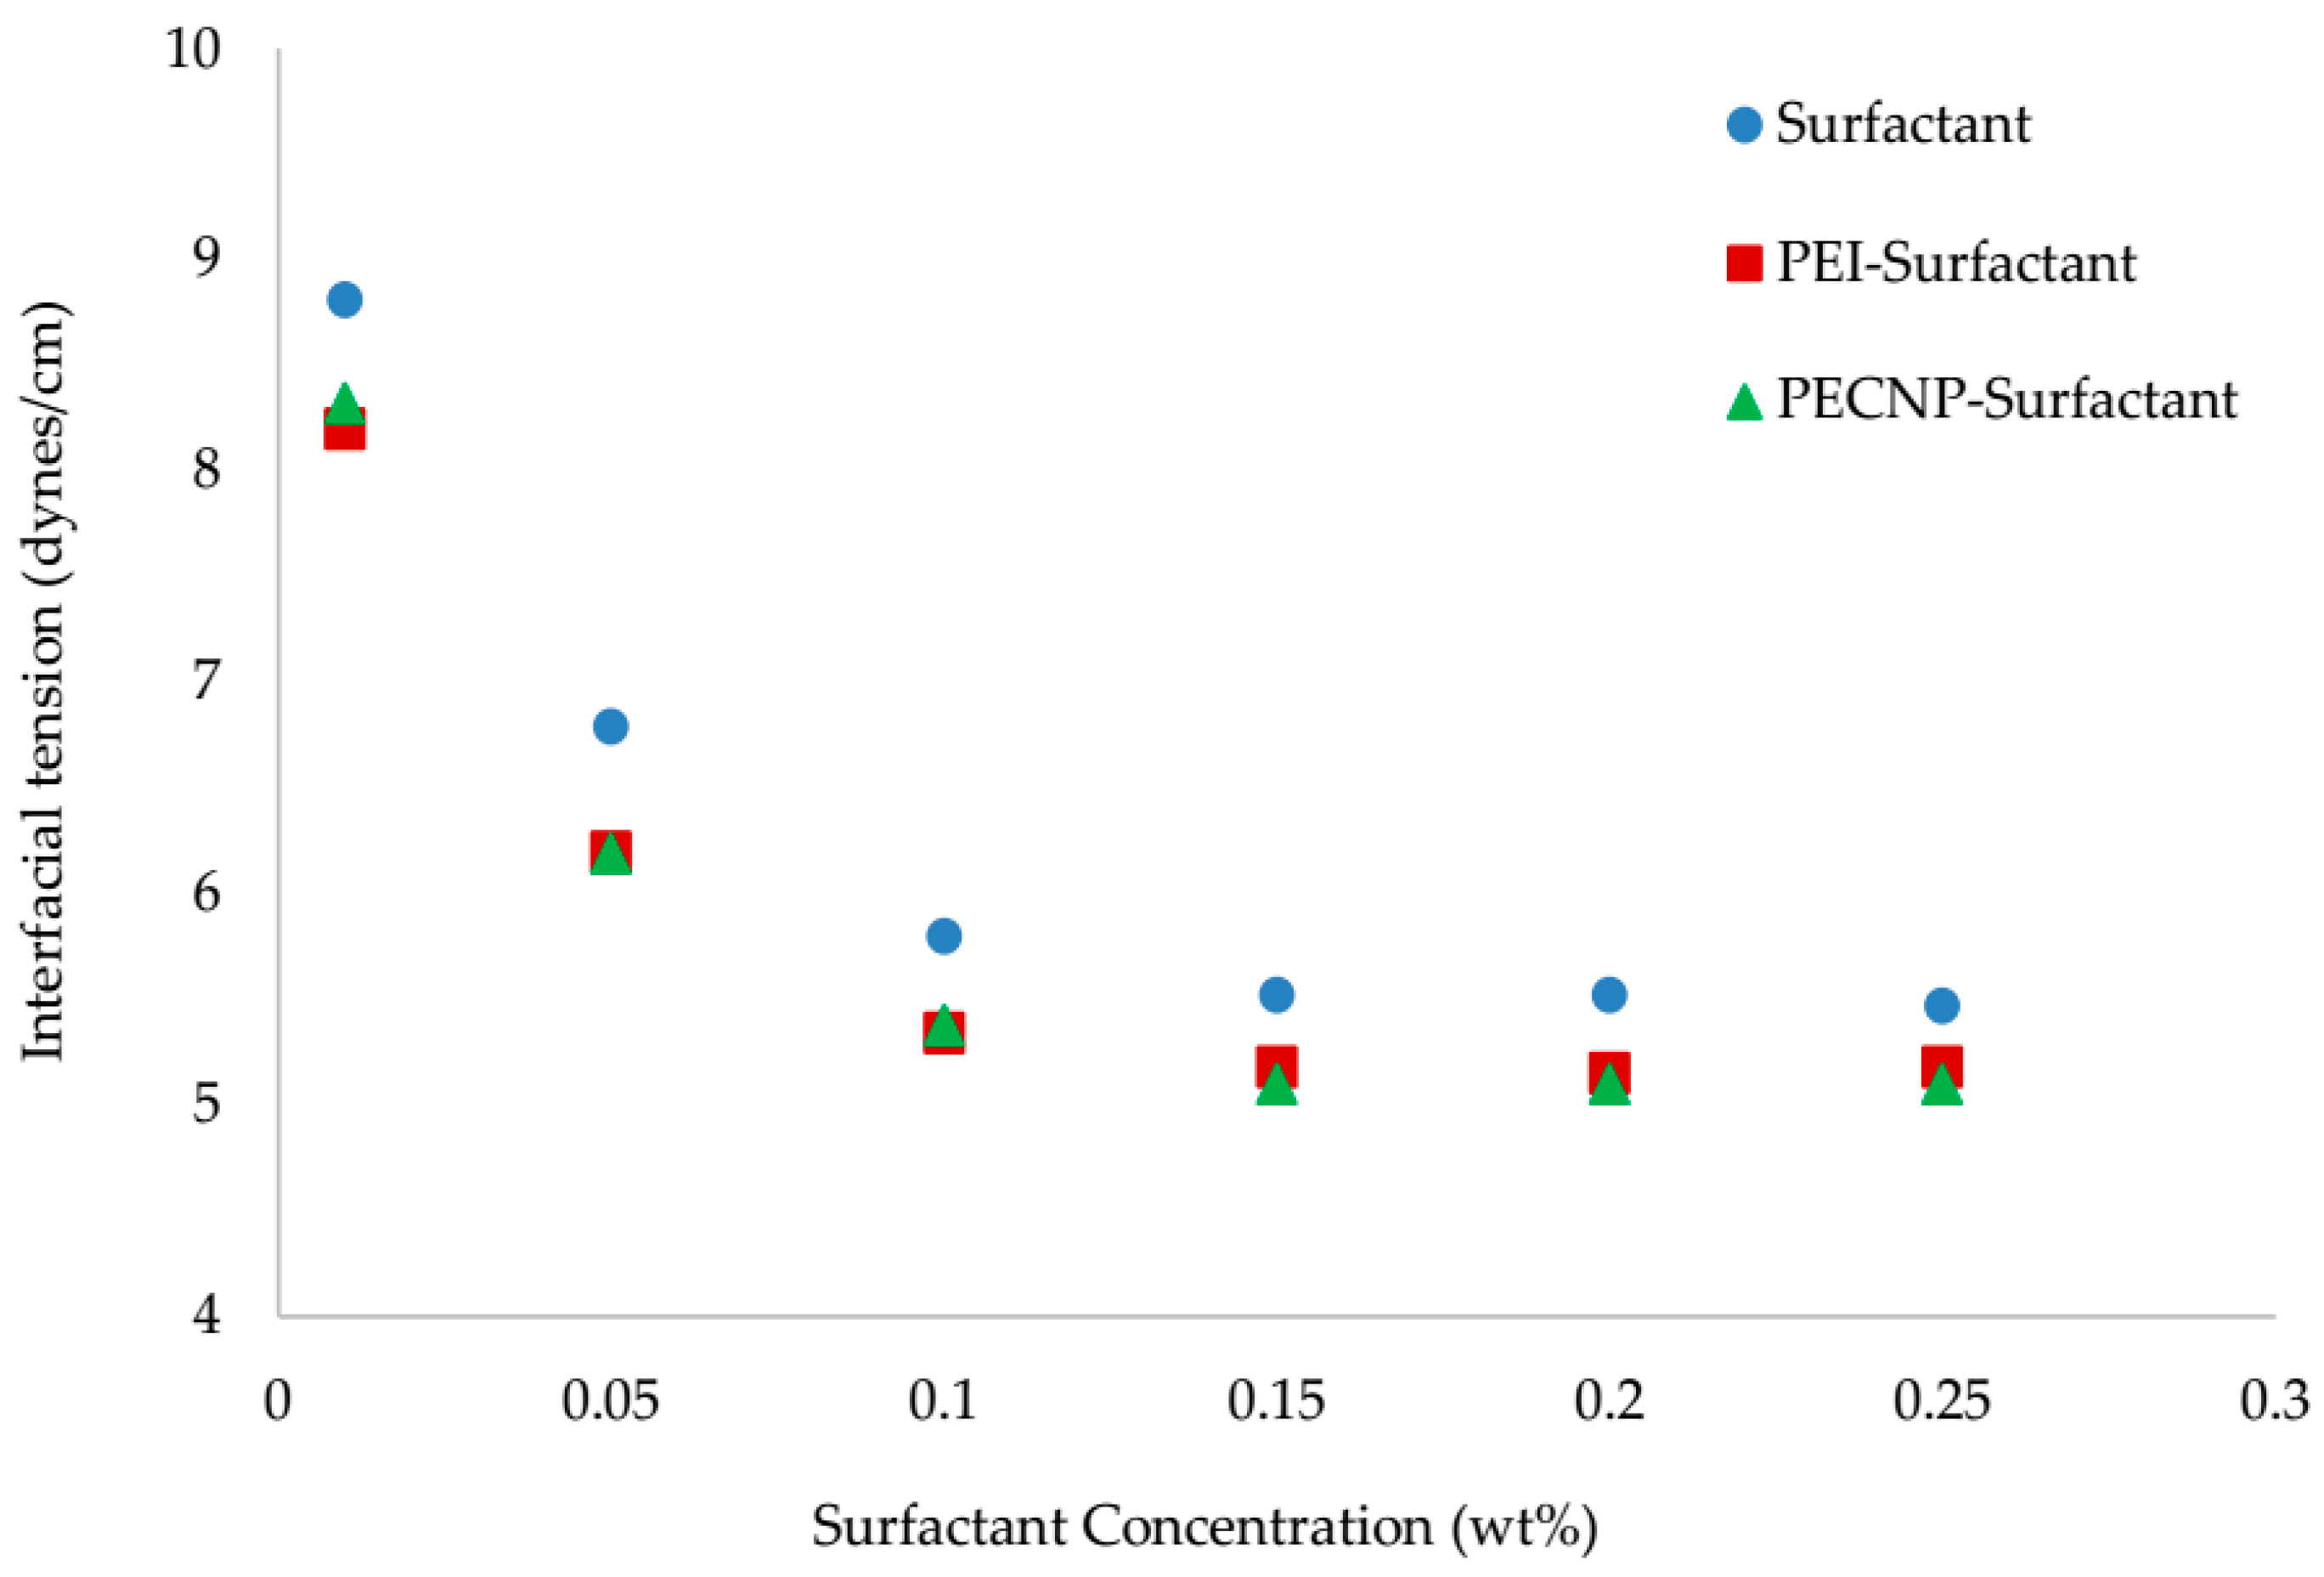
Figure 5.
Interfacial tension vs. the surfactant concentration for different systems in 67,333 ppm salinity of diluted MLP brine.
Figure 5.
Interfacial tension vs. the surfactant concentration for different systems in 67,333 ppm salinity of diluted MLP brine.
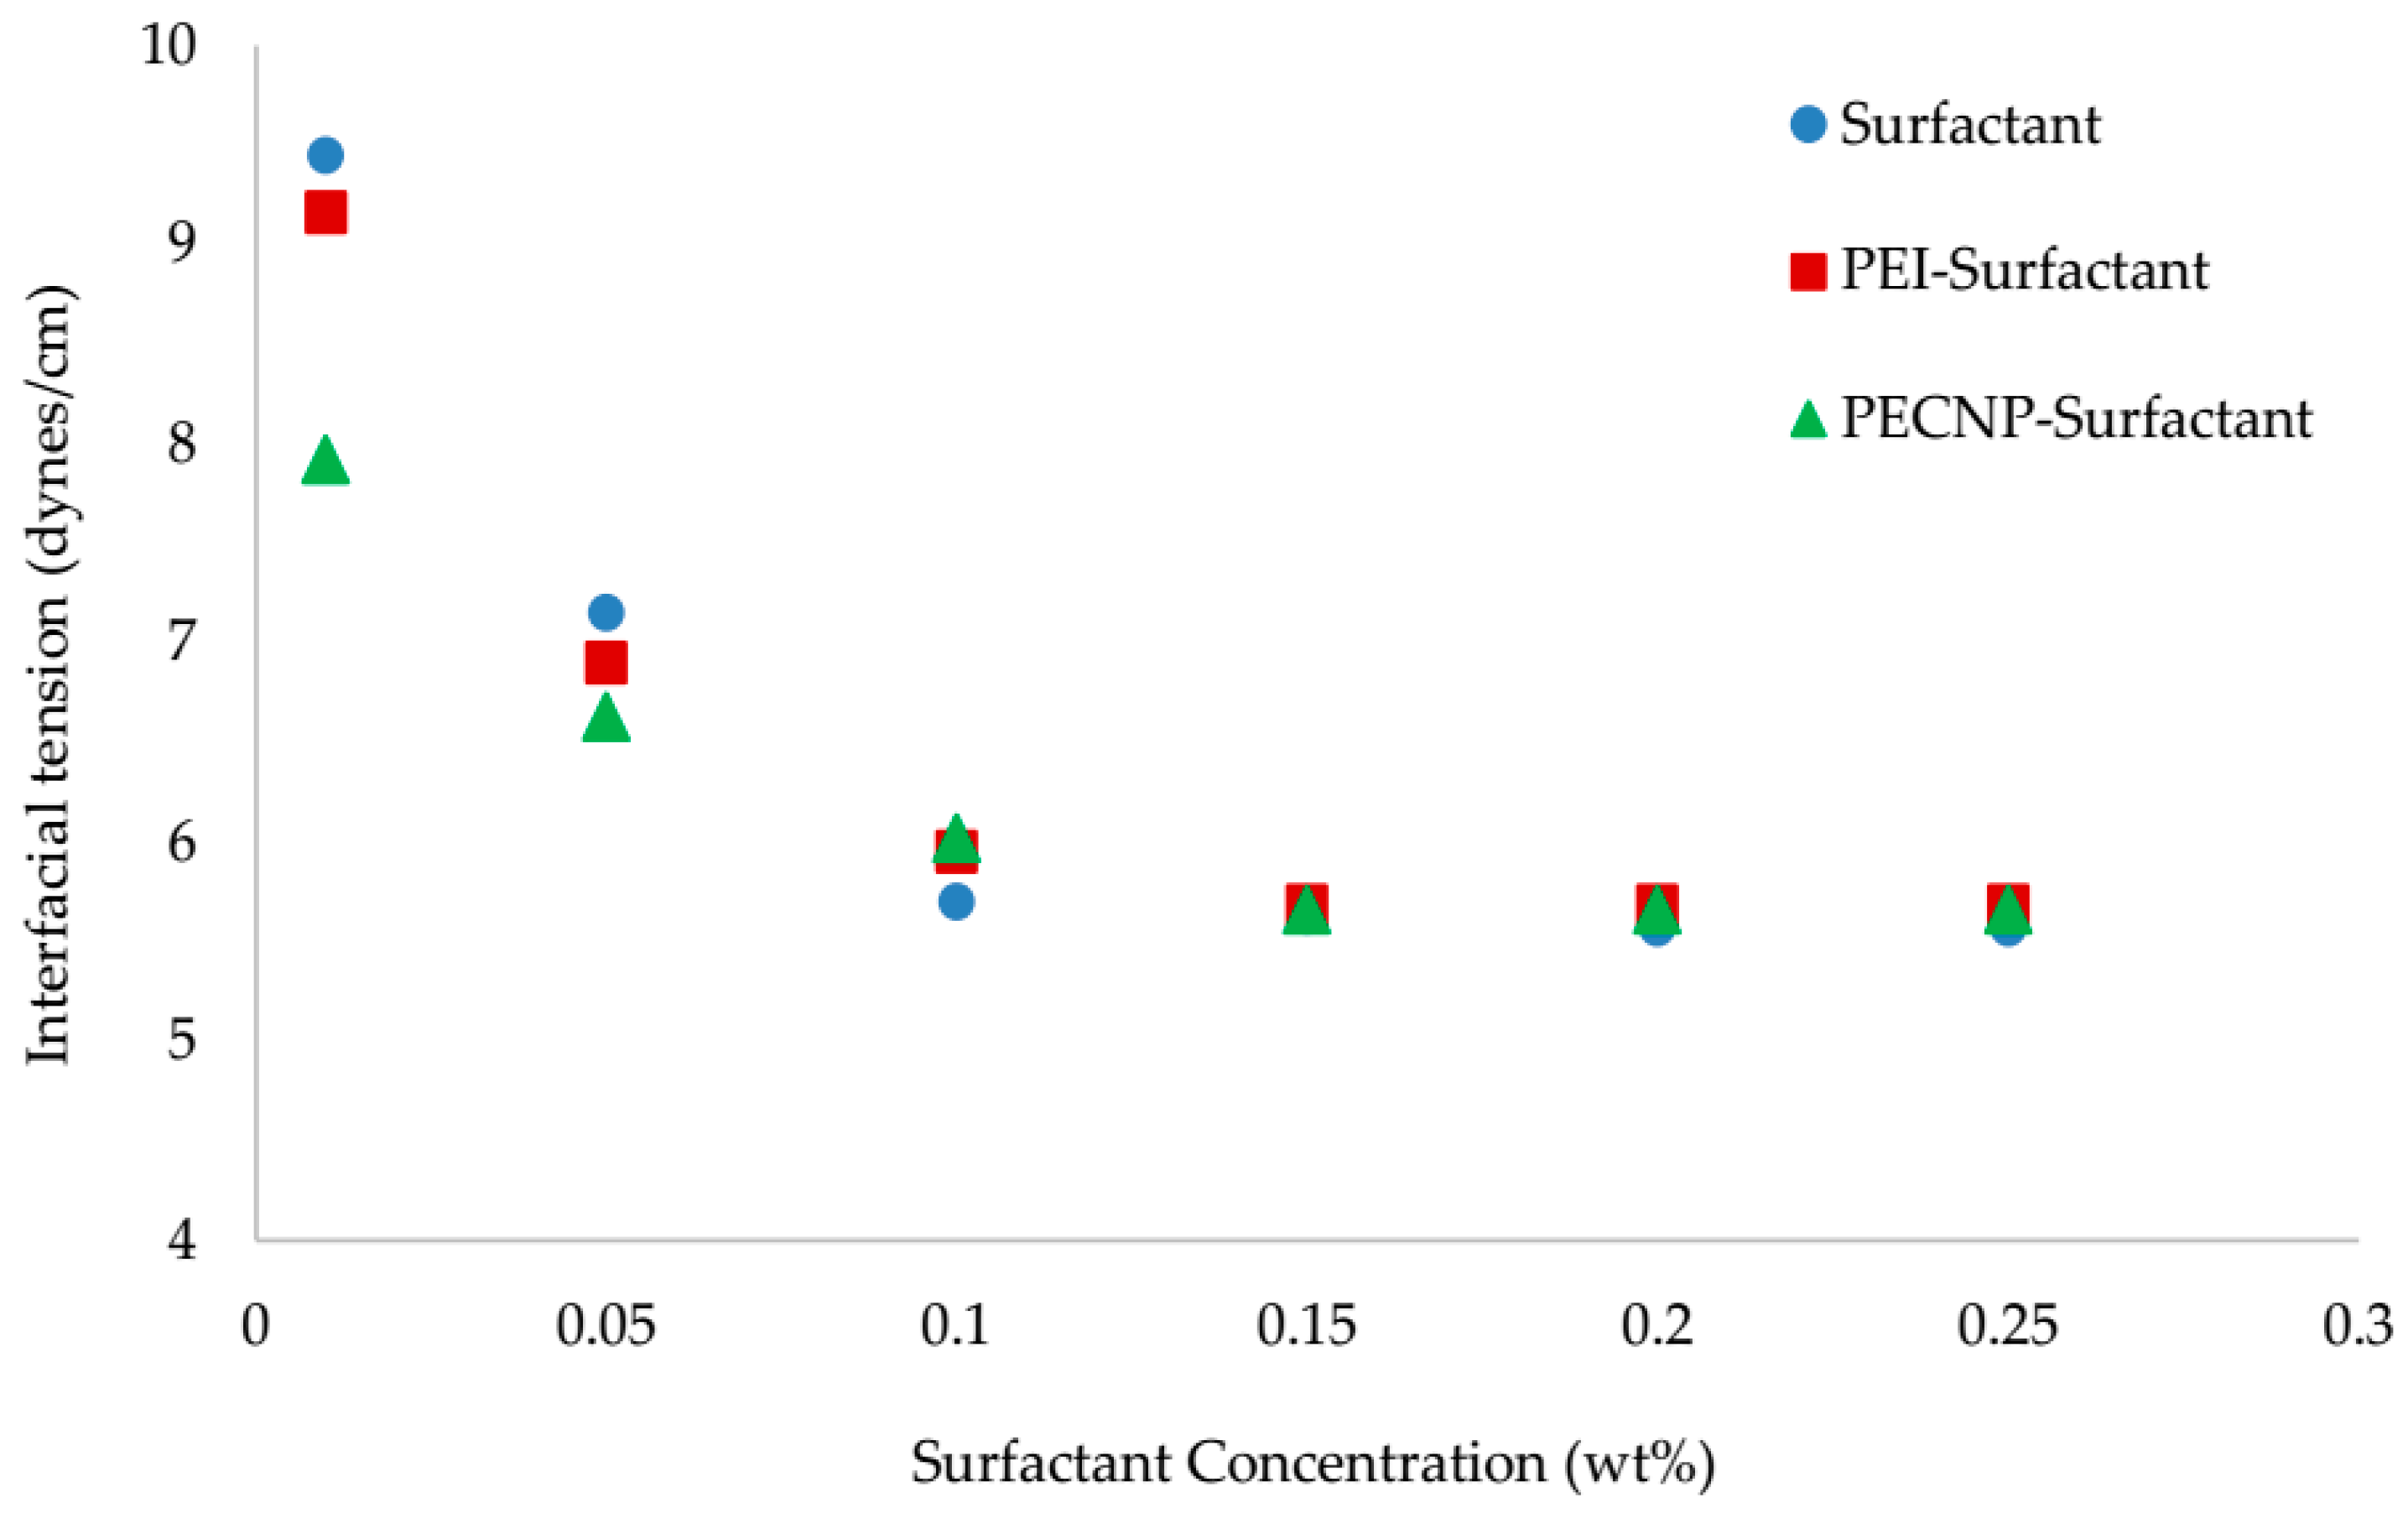
Figure 6.
The viscosity vs. shear rate for three different systems at 33,667 ppm salinity of diluted MLP brine.
Figure 6.
The viscosity vs. shear rate for three different systems at 33,667 ppm salinity of diluted MLP brine.

Figure 7.
The viscosity vs. shear rate for three different systems at 67,333 ppm salinity of diluted MLP brine.
Figure 7.
The viscosity vs. shear rate for three different systems at 67,333 ppm salinity of diluted MLP brine.

Figure 8.
The foam decay time for the surfactant and different ratios of PECNP:surfactant in 33,667 ppm salinity of diluted MLP brine. The ratio of 1:9 shows the best result.
Figure 8.
The foam decay time for the surfactant and different ratios of PECNP:surfactant in 33,667 ppm salinity of diluted MLP brine. The ratio of 1:9 shows the best result.
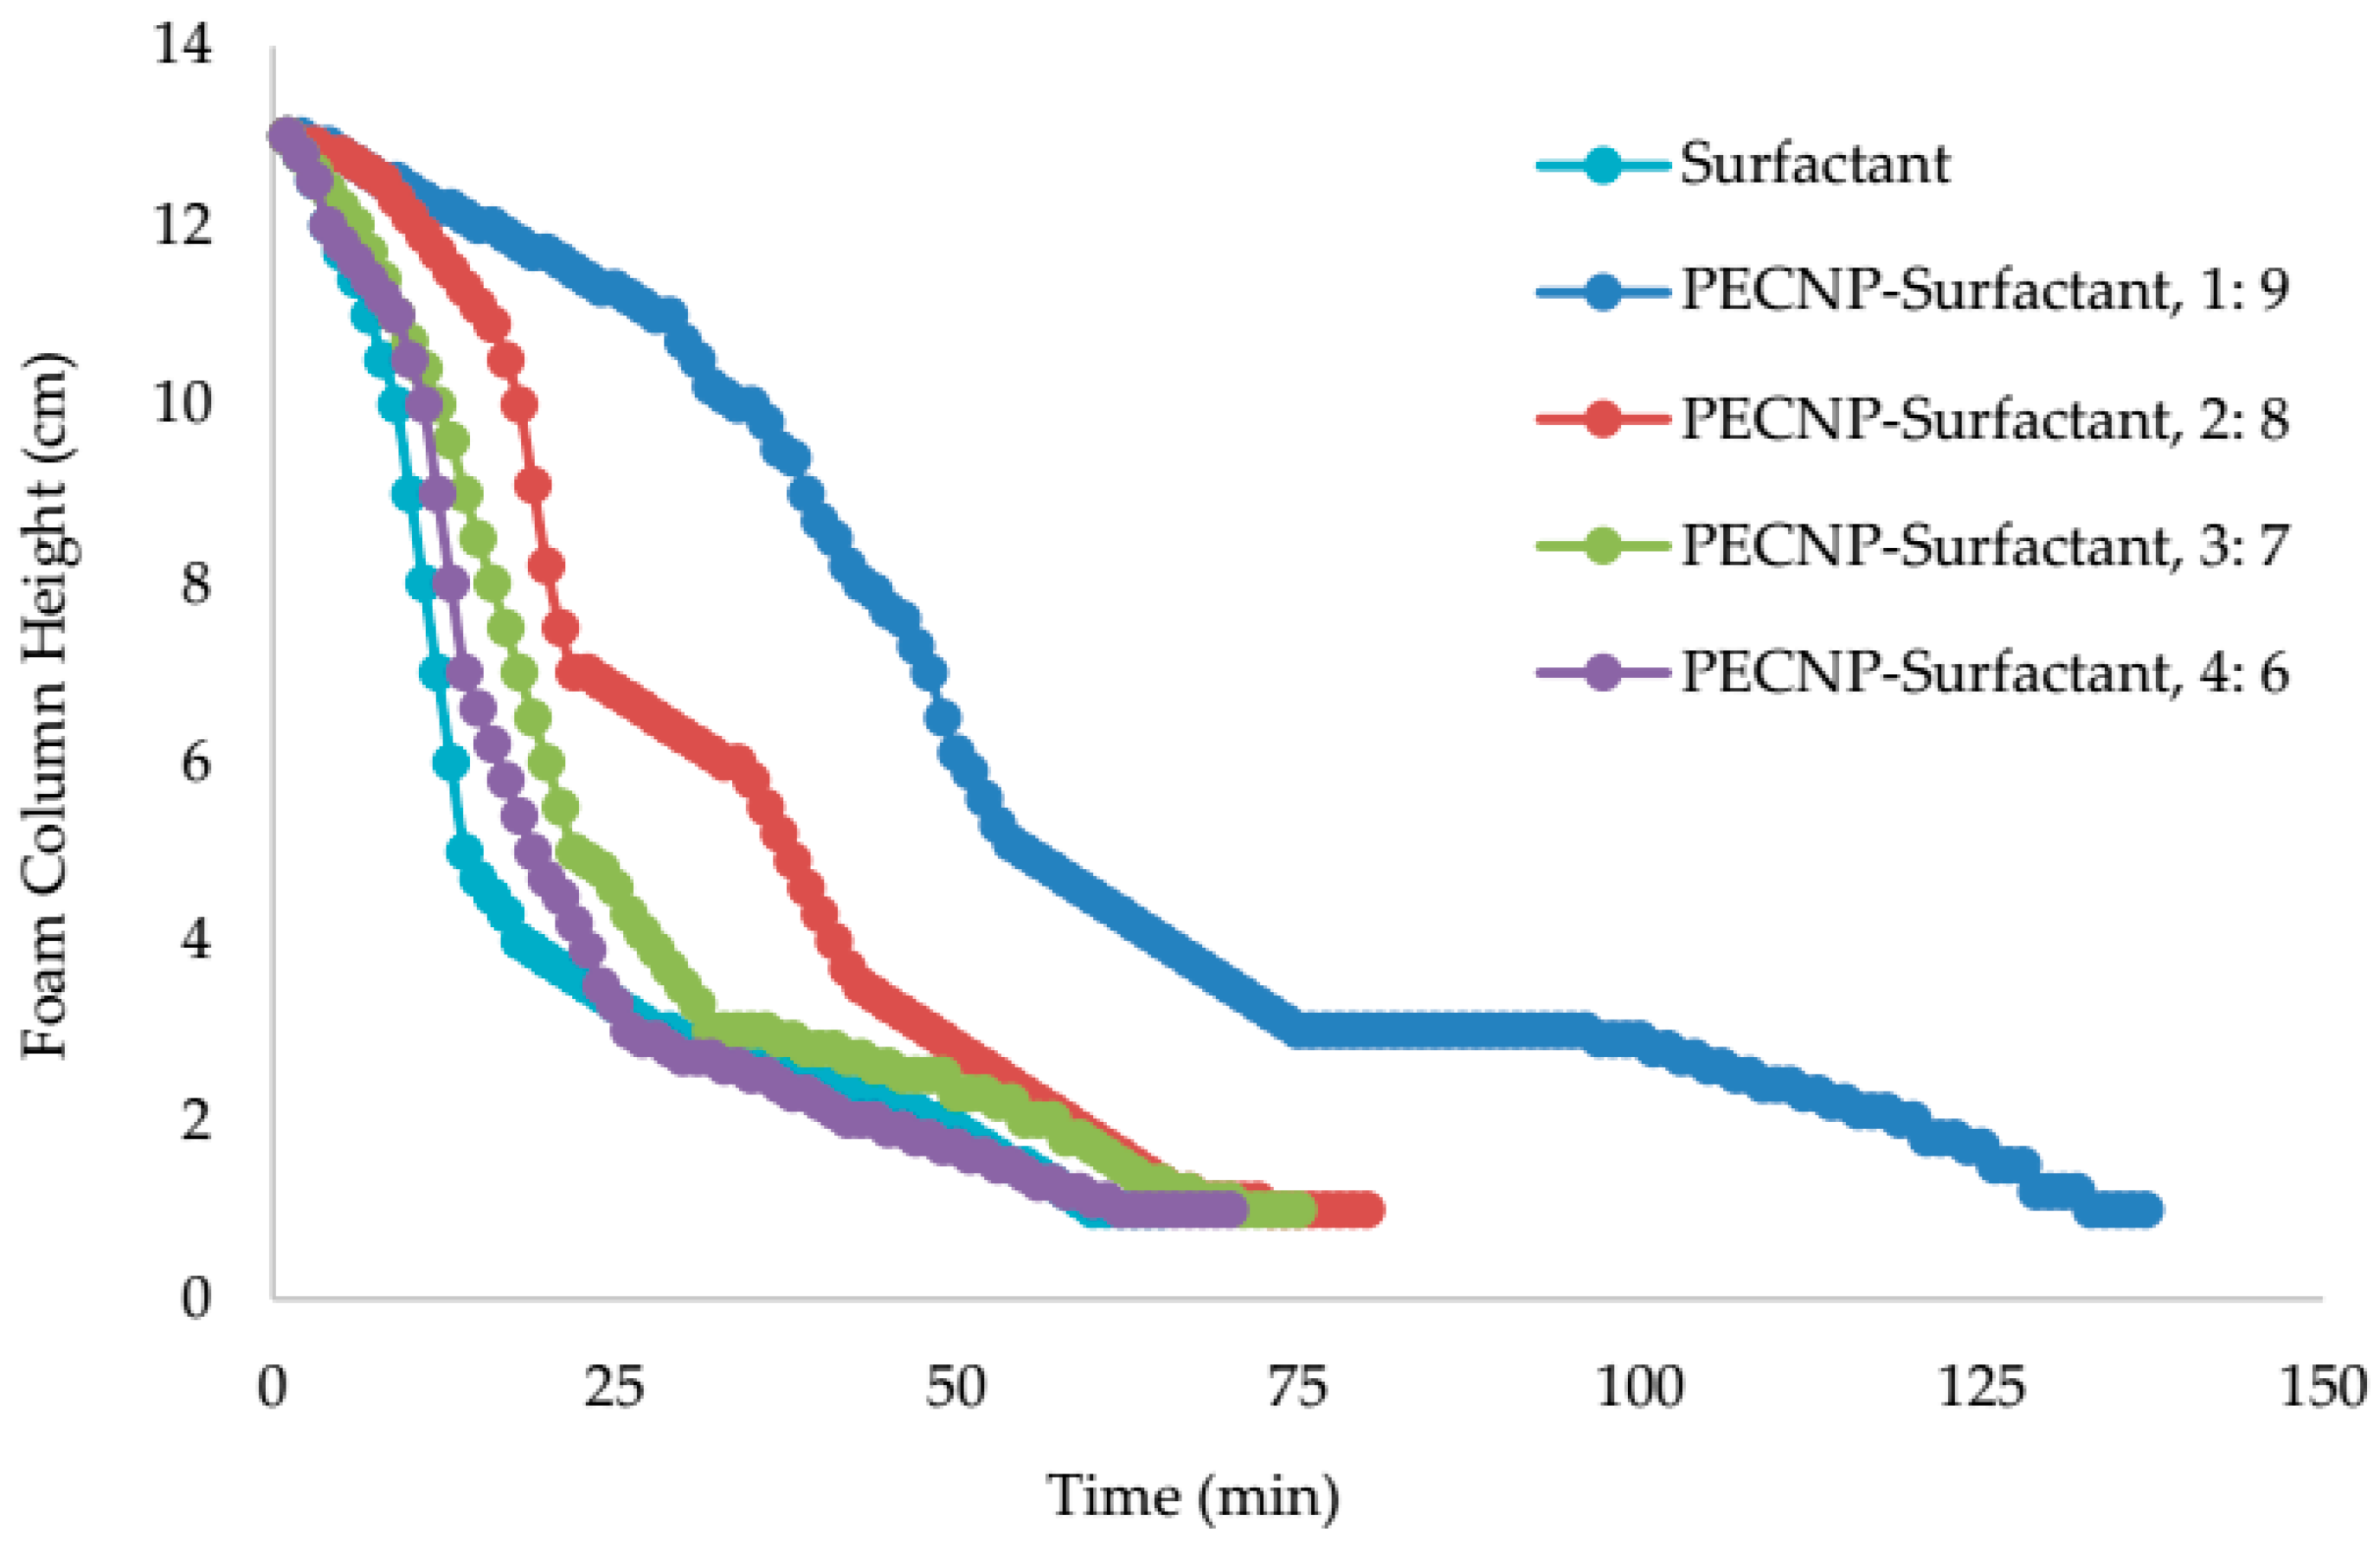
Figure 9.
The foam decay time for the surfactant and different ratios of PECNP:surfactant in 67,333 ppm salinity of diluted MLP brine. The ratio of 2:8 shows the best result.
Figure 9.
The foam decay time for the surfactant and different ratios of PECNP:surfactant in 67,333 ppm salinity of diluted MLP brine. The ratio of 2:8 shows the best result.
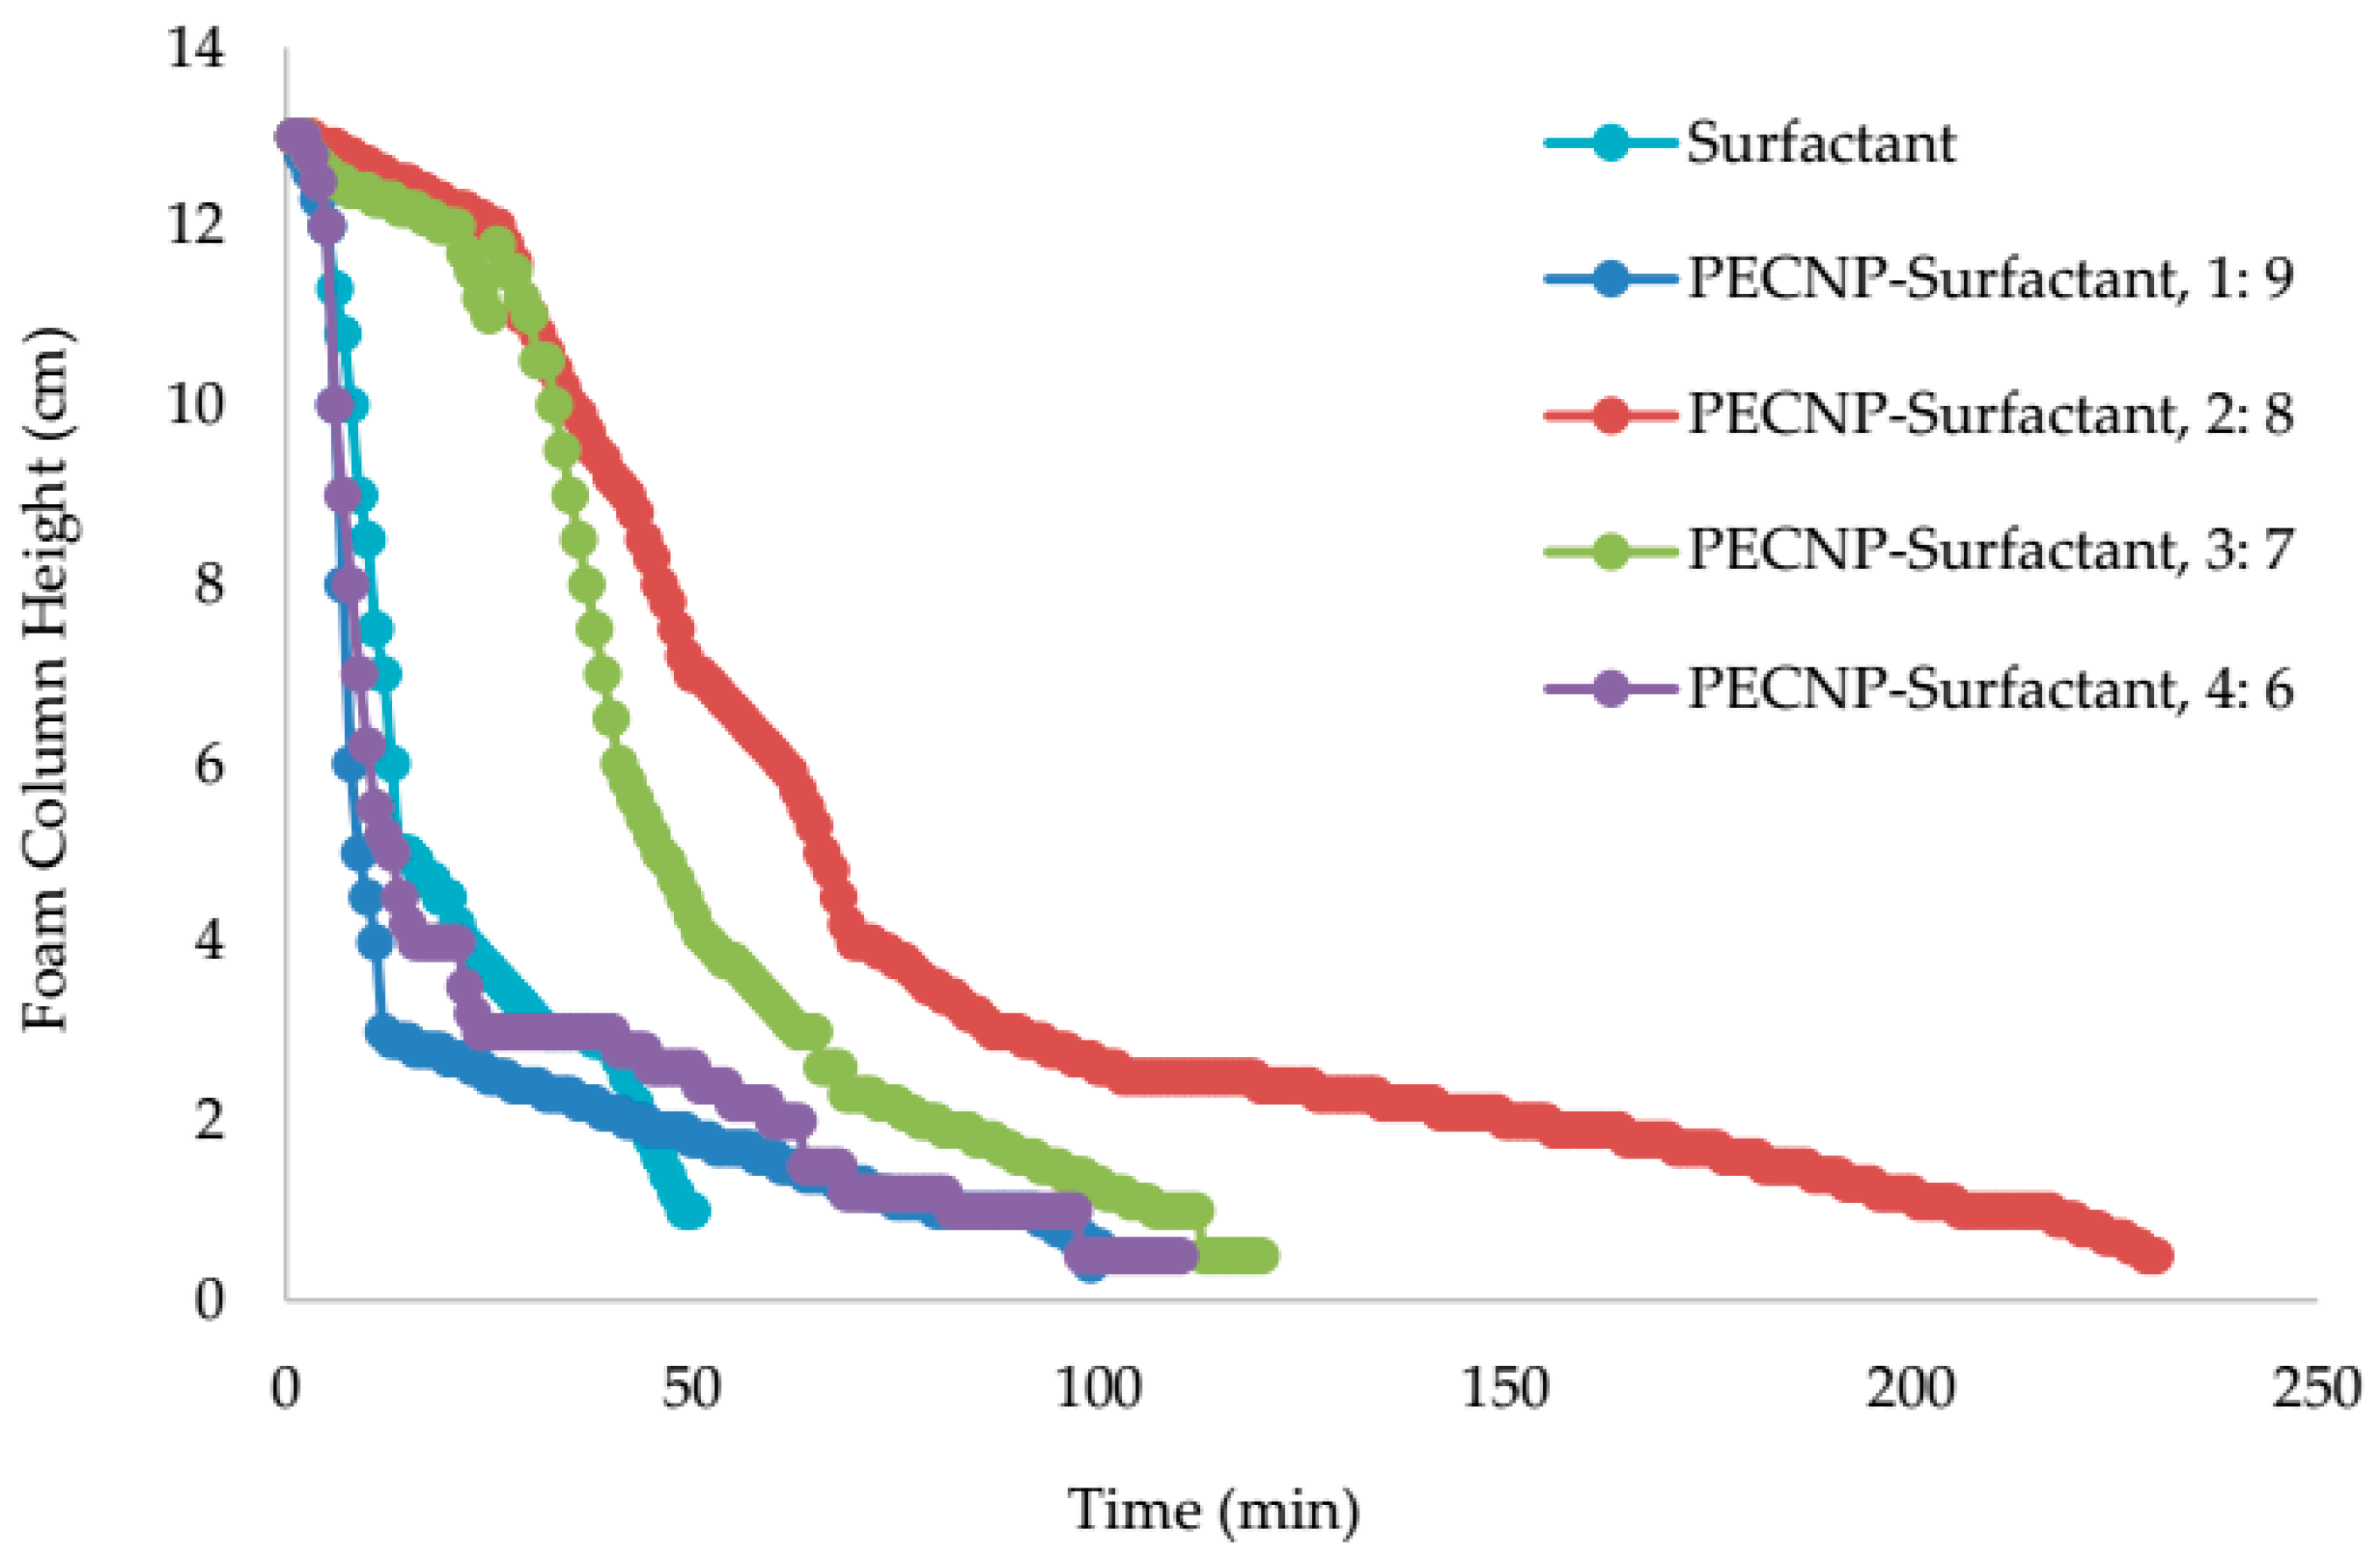
Figure 10.
The foam decay time for three different systems of generated CO2 foam in 33,667 ppm salinity of diluted MLP brine without crude oil in the system. The PECNP-surfactant shows the best result.
Figure 10.
The foam decay time for three different systems of generated CO2 foam in 33,667 ppm salinity of diluted MLP brine without crude oil in the system. The PECNP-surfactant shows the best result.

Figure 11.
The foam decay time for three different systems of generated CO2 foam in 67,333 ppm salinity of diluted MLP brine without crude oil in the system. The PECNP-surfactant shows the best result.
Figure 11.
The foam decay time for three different systems of generated CO2 foam in 67,333 ppm salinity of diluted MLP brine without crude oil in the system. The PECNP-surfactant shows the best result.
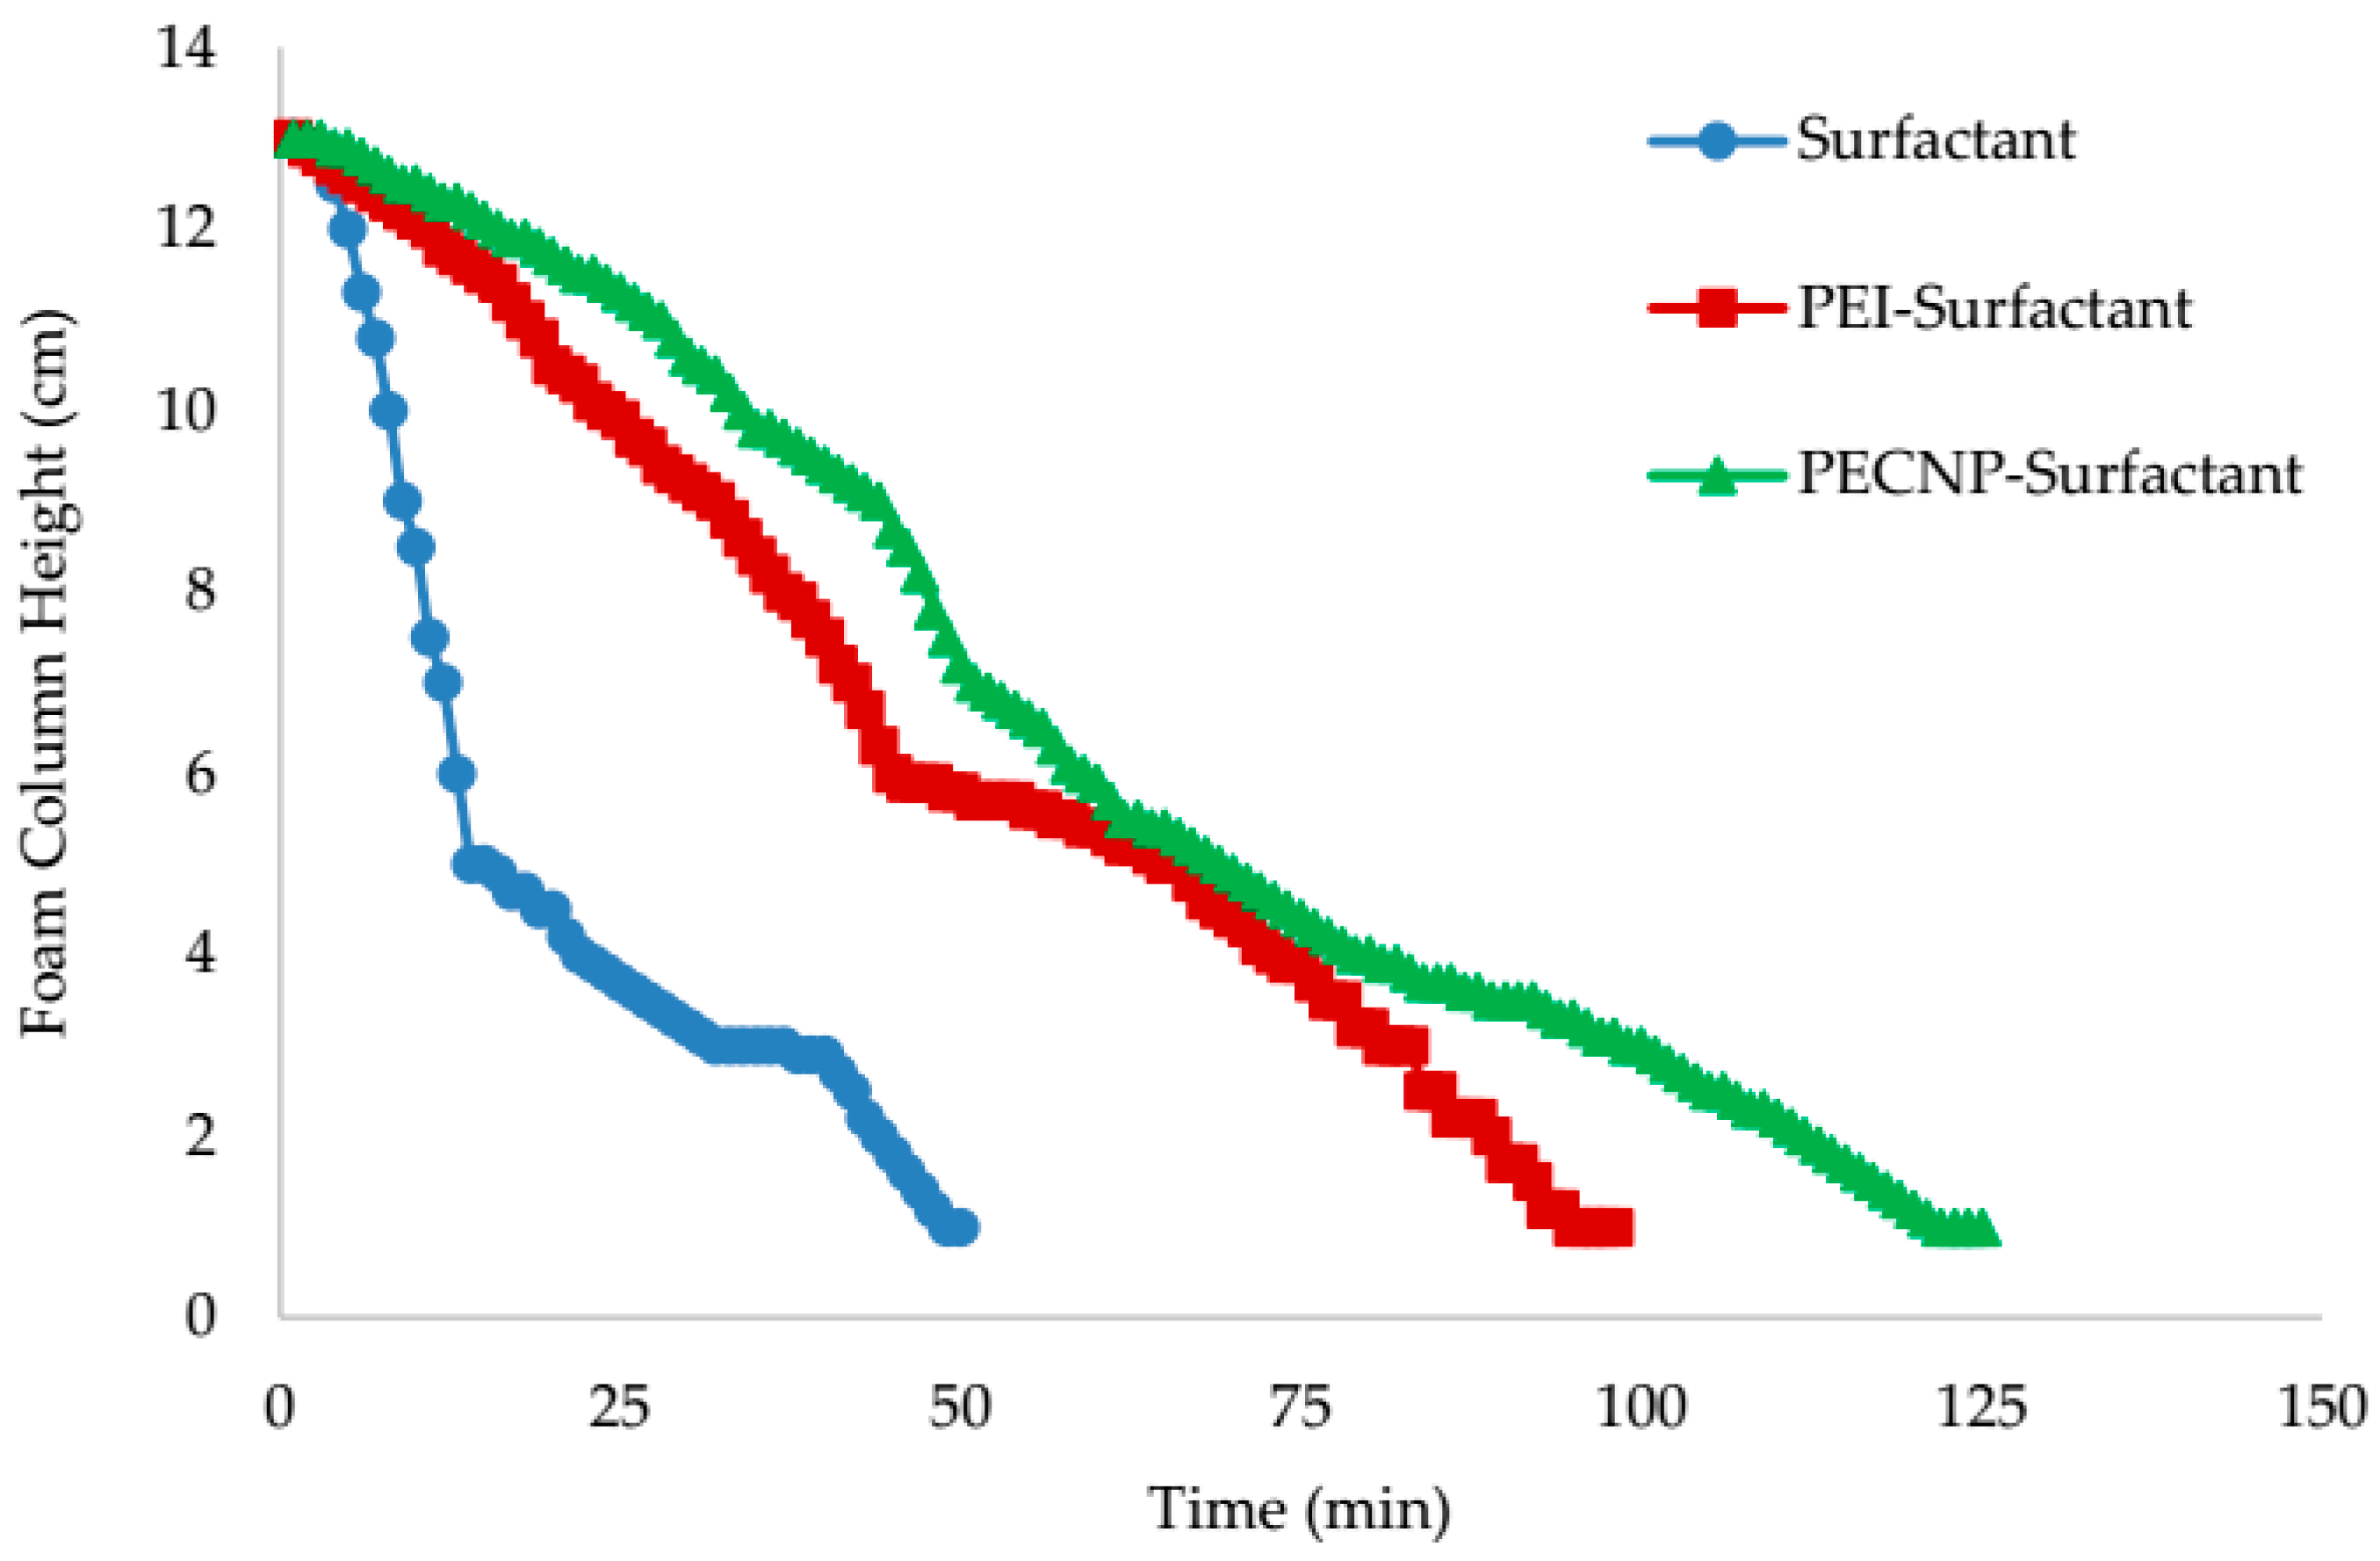
Figure 12.
Foam decay vs. time for three different systems of generated CO2 foam in 33,667 ppm salinity of diluted MLP brine in the presence of Mississippian crude oil. The PECNP-surfactant system shows the most durable foam system in the presence of crude oil.
Figure 12.
Foam decay vs. time for three different systems of generated CO2 foam in 33,667 ppm salinity of diluted MLP brine in the presence of Mississippian crude oil. The PECNP-surfactant system shows the most durable foam system in the presence of crude oil.

Figure 13.
Foam decay vs. time for three different systems of generated CO2 foam in 67,333 ppm salinity of diluted MLP brine in the presence of Mississippian crude oil. The PECNP-surfactant system shows the most durable foam system in the presence of crude oil.
Figure 13.
Foam decay vs. time for three different systems of generated CO2 foam in 67,333 ppm salinity of diluted MLP brine in the presence of Mississippian crude oil. The PECNP-surfactant system shows the most durable foam system in the presence of crude oil.
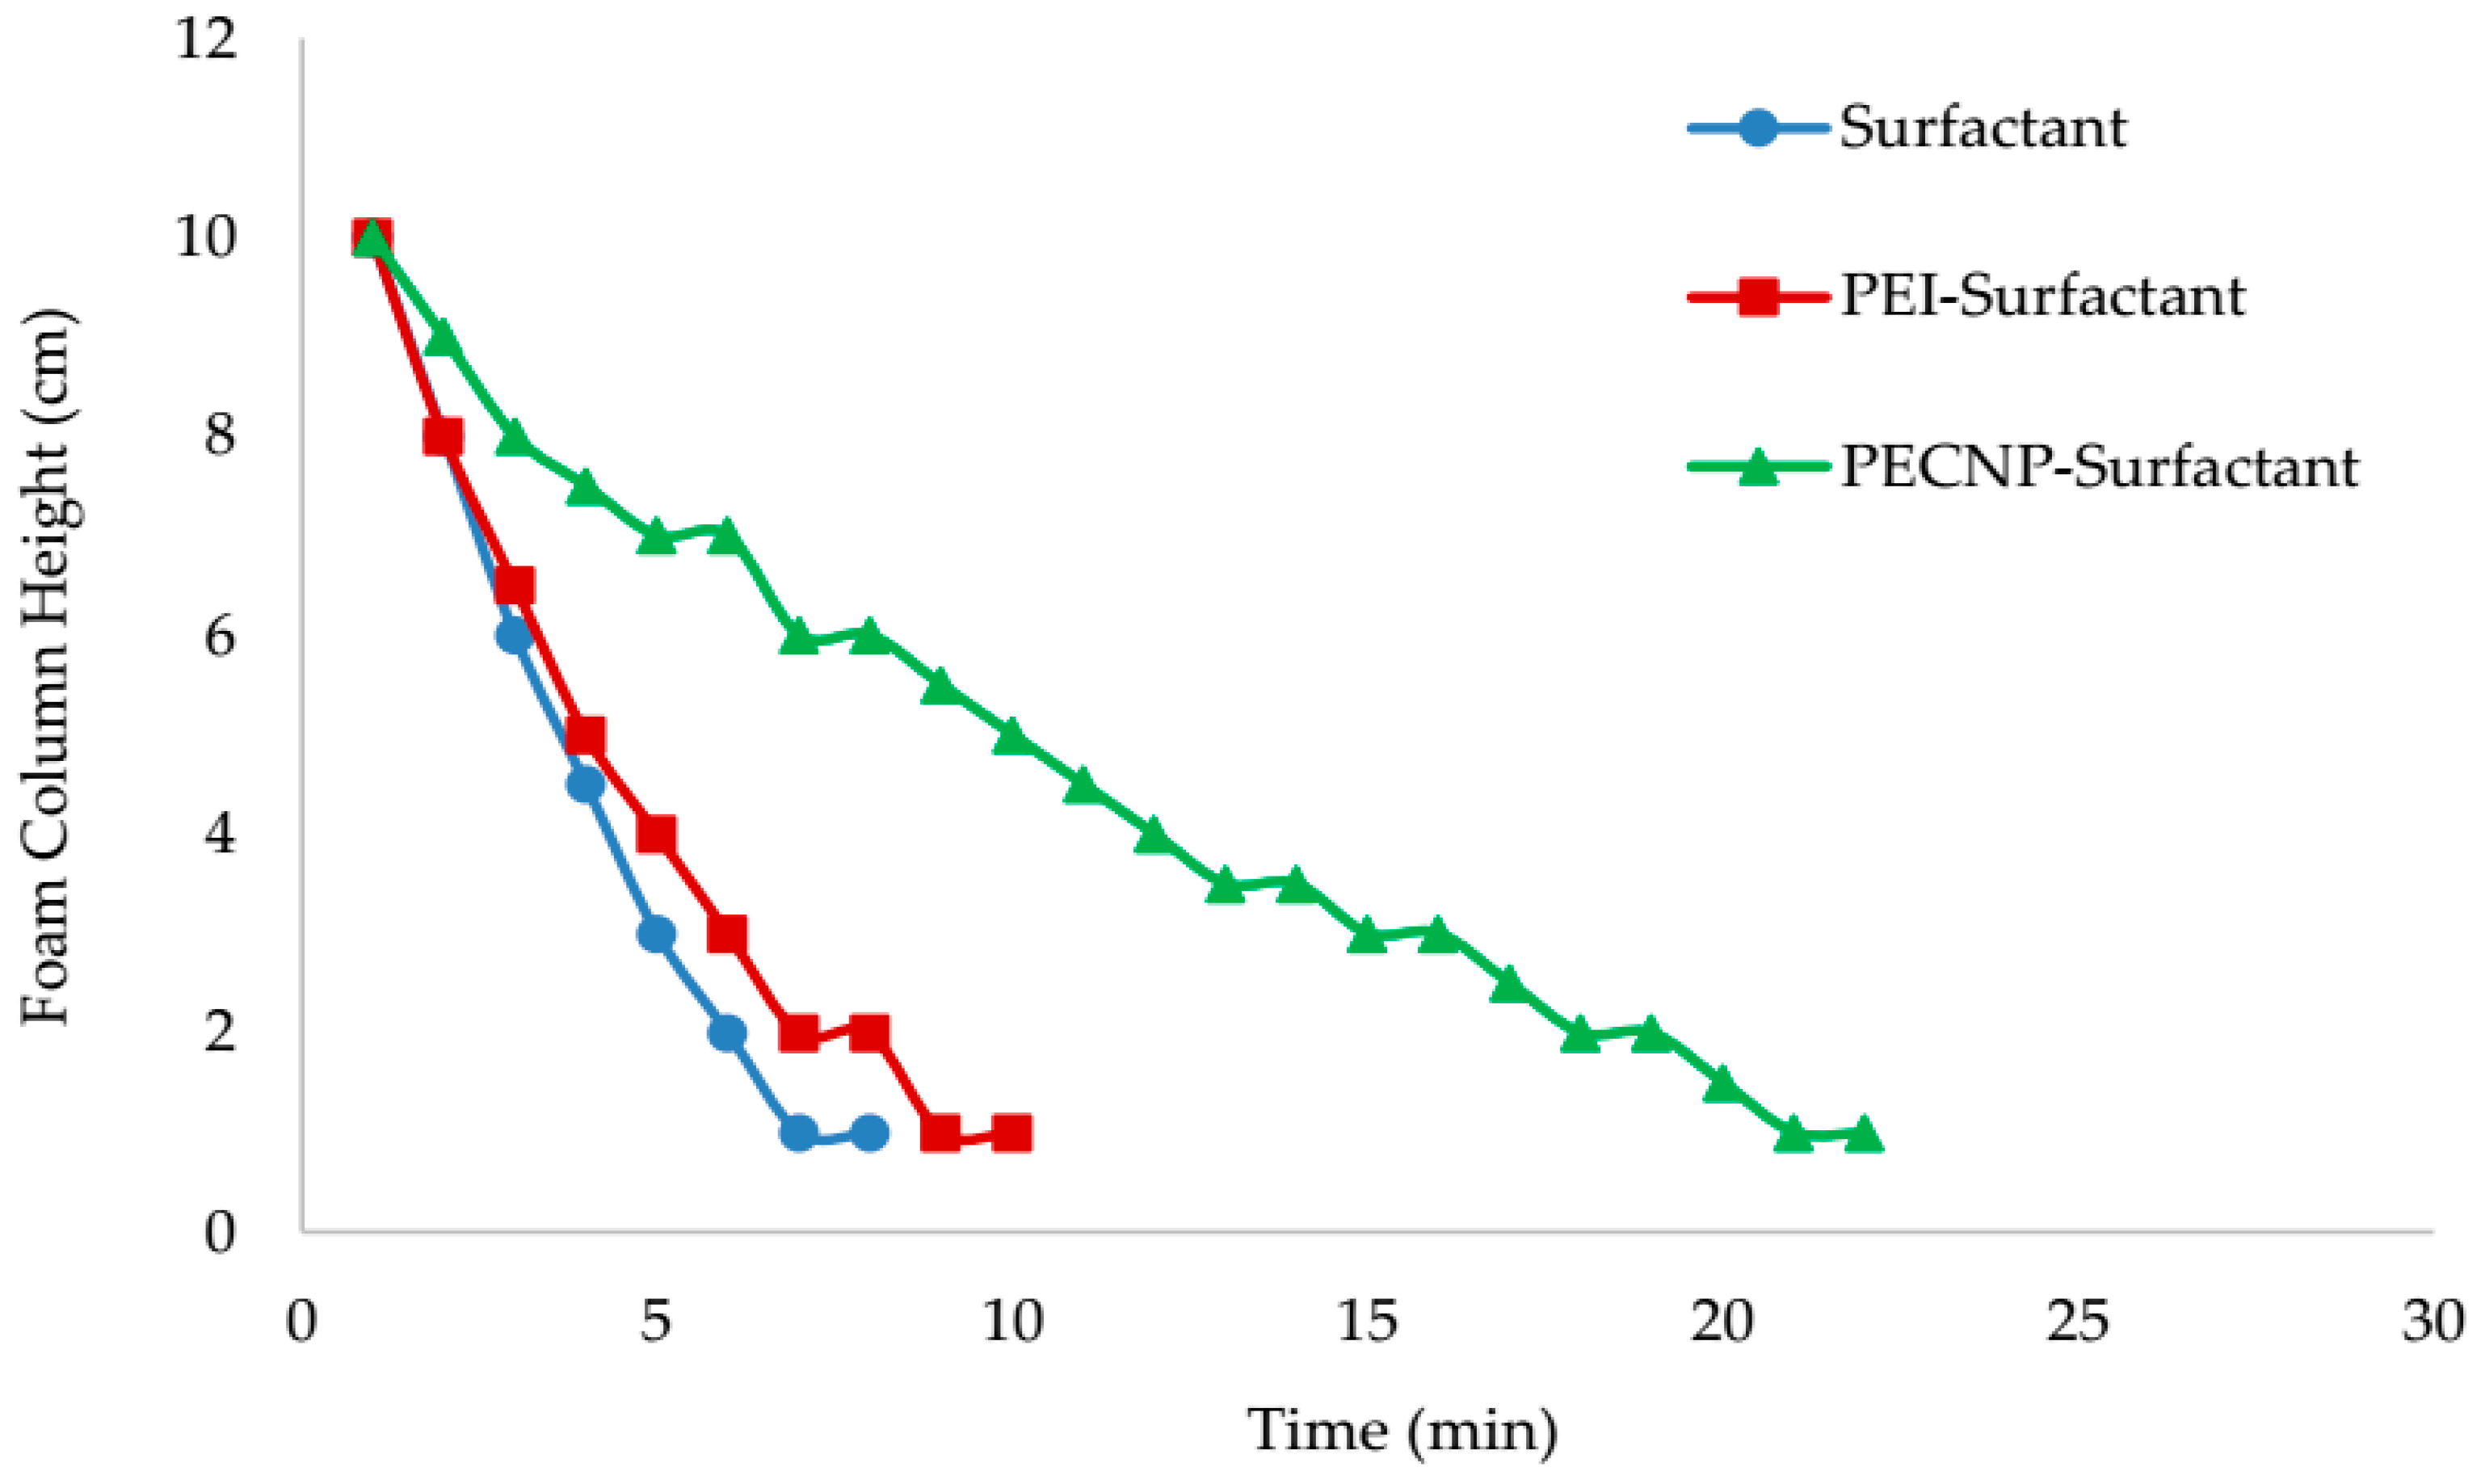
Figure 14.
CO2 foam generated by (a) surfactant and (b) PECNP-surfactant with Mississippian crude oil after 15 min in 33,667 ppm salinity of diluted MLP brine.
Figure 14.
CO2 foam generated by (a) surfactant and (b) PECNP-surfactant with Mississippian crude oil after 15 min in 33,667 ppm salinity of diluted MLP brine.

Figure 15.
CO2 foam generated by (a) surfactant and (b) PECNP-surfactant with Mississippian crude oil after 5 min in 67,333 ppm salinity of diluted MLP brine.
Figure 15.
CO2 foam generated by (a) surfactant and (b) PECNP-surfactant with Mississippian crude oil after 5 min in 67,333 ppm salinity of diluted MLP brine.


Table 1.
The final composition of the MLP brine.
| Brine Composition | Concentration (mg/L) | Provider | Lot# | CAS# | Location |
|---|---|---|---|---|---|
| NaCl | 163,661.82 | Fisher Chemical | 166221 | 7647-14-5 | Lenexa, KS |
| Na2SO4 | 1224.30 | Fisher Chemical | 134830A | 7757-82-6 | |
| KCl | 714.93 | AMRESCO | 1015C371 | 7447-40-7 | Solon, OH |
| MgCl2·6H2O | 21,759.36 | Fisher Chemical | 134660 | 7791-18-6 | |
| CaCl2·2H2O | 46,886.13 | Fisher Chemical | 159018 | 10035-04-8 | |
| SrCl2·6H2O | 1535.5989 | Fisher Chemical | 4AD13081428A | 10025-70-4 | |
| Total | 235,782.11 |
Table 2.
The summarized particle size and zeta potential values for different systems at 33,667 ppm of diluted MLP brine. The best system is highlighted.
Table 2.
The summarized particle size and zeta potential values for different systems at 33,667 ppm of diluted MLP brine. The best system is highlighted.
| Batch# | PEI:DS:Brine | PECNP:Surfactant | Final pH | Effective Diameter (nm) | Polydispersity | Zeta Potential (mV) | Mobility (μ/s)/(V/cm) |
|---|---|---|---|---|---|---|---|
| 1 | 3:1:0.1 | 1:9 | 7.91 | 108.93 ± 0.40 | 0.27 | 21.18 ± 1.41 | 1.66 |
| 2 | 3:1:0.1 | 2:8 | 7.93 | 106.57 ± 1.50 | 0.24 | 13.79 ± 2.99 | 1.08 |
| 3 | 3:1:0.1 | 3:7 | 7.94 | 102.74 ± 1.18 | 0.25 | - | - |
| 4 | 3:1:0.1 | 4:6 | 7.94 | 105.59 ± 1.87 | 0.25 | 15.30 ± 1.68 | 1.20 |
| 5 | 3:1:0.1 | 5:5 | 7.90 | 106.99 ± 2.29 | 0.25 | 5.97 ± 5.04 | 0.47 |
| 6 | 4:1:0.1 | 1:9 | 7.85 | 116.52 ± 2.14 | 0.26 | 11.00 ± 0.29 | 0.86 |
| 7 | 4:1:0.1 | 2:8 | 7.92 | 110.32 ± 1.05 | 0.26 | 4.73 ± 1.04 | 0.65 |
| 8 | 4:1:0.1 | 3:7 | 7.96 | 103.96 ± 1.42 | 0.25 | 14.93 ± 1.53 | 1.17 |
| 9 | 4:1:0.1 | 4:6 | 7.97 | 107.94 ± 0.89 | 0.25 | - | - |
| 10 | 4:1:0.1 | 5:5 | 8.00 | 108.66 ± 4.76 | 0.24 | - | - |
Table 3.
The summarized particle size and zeta potential values for different systems at 67,333 ppm of diluted MLP brine. The best systems are highlighted.
Table 3.
The summarized particle size and zeta potential values for different systems at 67,333 ppm of diluted MLP brine. The best systems are highlighted.
| Batch# | PEI:DS:Brine | PECNP:Surfactant | Final pH | Effective Diameter (nm) | Polydispersity | Zeta Potential (mV) | Mobility (μ/s)/(V/cm) |
|---|---|---|---|---|---|---|---|
| 1 | 3:1:0.1 | 1:9 | 8.08 | 114.00 ± 2.00 | 0.268 | 9.81 ± 3.99 | 0.77 |
| 2 | 3:1:0.1 | 2:8 | 8.18 | 128.08 ± 1.26 | 0.300 | 19.27 ± 0.63 | 1.51 |
| 3 | 3:1:0.1 | 3:7 | 8.12 | 128.98 ± 4.20 | 0.319 | 13.49 ± 2.44 | 1.05 |
| 4 | 3:1:0.1 | 4:6 | 8.15 | 132.71 ± 3.13 | 0.311 | 22.10 ± 0.34 | 1.84 |
| 5 | 3:1:0.1 | 5:5 | 8.25 | 120.71 ± 0.75 | 0.283 | 17.66 ± 0.67 | 1.38 |
| 6 | 4:1:0.1 | 1:9 | 8.01 | 114.38 ± 3.15 | 0.264 | 14.42 ± 2.66 | 1.13 |
| 7 | 4:1:0.1 | 2:8 | 8.21 | 103.84 ± 1.43 | 0.265 | 11.82 ± 2.10 | 0.92 |
| 8 | 4:1:0.1 | 3:7 | 8.15 | 99.71 ± 1.11 | 0.261 | 12.25 ± 3.15 | 0.96 |
| 9 | 4:1:0.1 | 4:6 | 8.15 | 107.10 ± 0.92 | 0.273 | 16.31 ± 3.57 | 1.27 |
| 10 | 4:1:0.1 | 5:5 | 8.27 | 111.88 ± 6.47 | 0.286 | 14.25 ± 4.36 | 1.11 |
Table 4.
The flow consistency and flow behavior indices which have been calculated by using the power-law model for three different systems in 33,667 ppm salinity of diluted MLP brine.
Table 4.
The flow consistency and flow behavior indices which have been calculated by using the power-law model for three different systems in 33,667 ppm salinity of diluted MLP brine.
| System | K | n | |
|---|---|---|---|
| Surfactant | 0.250 | 0.520 | 0.99 |
| PEI-Surfactant, 1:9 | 0.436 | 0.520 | 0.99 |
| PECNP-Surfactant, 1:9 | 0.440 | 0.520 | 0.99 |
Table 5.
The flow consistency and flow behavior indices which have been calculated by using the power-law model for three different systems in 67,333 ppm salinity of diluted MLP brine.
Table 5.
The flow consistency and flow behavior indices which have been calculated by using the power-law model for three different systems in 67,333 ppm salinity of diluted MLP brine.
| System | K | n | |
|---|---|---|---|
| Surfactant | 0.284 | 0.540 | 0.99 |
| PEI-Surfactant, 2:8 | 0.333 | 0.570 | 0.99 |
| PECNP-Surfactant, 2:8 | 0.360 | 0.550 | 0.99 |
© 2017 by the authors. Licensee MDPI, Basel, Switzerland. This article is an open access article distributed under the terms and conditions of the Creative Commons Attribution (CC BY) license (http://creativecommons.org/licenses/by/4.0/).
Share and Cite
MDPI and ACS Style
Nazari, N.; Tsau, J.-S.; Barati, R. CO2 Foam Stability Improvement Using Polyelectrolyte Complex Nanoparticles Prepared in Produced Water. Energies 2017, 10, 516. https://doi.org/10.3390/en10040516
AMA Style
Nazari N, Tsau J-S, Barati R. CO2 Foam Stability Improvement Using Polyelectrolyte Complex Nanoparticles Prepared in Produced Water. Energies. 2017; 10(4):516. https://doi.org/10.3390/en10040516
Chicago/Turabian StyleNazari, Negar, Jyun-Syung Tsau, and Reza Barati. 2017. "CO2 Foam Stability Improvement Using Polyelectrolyte Complex Nanoparticles Prepared in Produced Water" Energies 10, no. 4: 516. https://doi.org/10.3390/en10040516
Note that from the first issue of 2016, this journal uses article numbers instead of page numbers. See further details here.