Article

Research on Partial Discharge Source Localization Based on an Ultrasonic Array and a Step-by-Step Over-Complete Dictionary

1
State Grid Hebei Electric Power Research Institute, Shijiazhuang 050021, China
2
Department of Power Engineering, North China Electric Power University, Baoding 071003, China
3
Beijing Electric Power Corporation, Beijing 100020, China
*
Author to whom correspondence should be addressed.
Energies 2017, 10(5), 593; https://doi.org/10.3390/en10050593
Submission received: 15 March 2017 / Revised: 17 April 2017 / Accepted: 20 April 2017 / Published: 29 April 2017

Abstract

:
Partial discharge (PD) in electrical equipment is one of the major causes of electrical insulation failures. Fast and accurate positioning of PD sources allows timely elimination of insulation faults. In order to improve the accuracy of PD detection, this paper mainly studies the direction of arrival (DOA) estimation of PD ultrasonic signals based on a step-by-step over-complete dictionary. The simulation results show that the step by step dictionary can improve the operation speed and save signal processing time. Firstly, a step-by-step over-complete dictionary covering all the angles of space is established according to the expression of the steering vector for a matching pursuit direction finding algorithm, which can save computation time. Then, the step-by-step complete dictionary is set up according to the direction vector, and the atomic precision is respectively set to 10°, 1° and 0.1°. The matching pursuit algorithm is used to carry out the sparse representation of the received data X and select the optimal atom from the step-by-step complete dictionary, and the angle information contained in atoms is DOA of the PD sources. According to the direction finding results, combined with the installation location of the ultrasonic array sensor, the spatial position of a partial discharge source can be obtained using the three platform array location method. Finally, a square ultrasonic array sensor is developed, and an experimental platform for the ultrasonic array detection of partial discharges is set up and used to carry out an experimental study. The results show that the DOA estimation method based on a step-by-step over-complete dictionary can improve the direction finding precision, thereby increasing the subsequent positioning accuracy, and the spatial position estimation error of the PD source obtained under laboratory conditions is about 5 cm, making this a feasible method.

1. Introduction

The deterioration of insulation in electrical equipment is mainly caused by partial discharge (PD) [1,2,3]. Therefore, the timely identification of the partial discharge sources [4,5,6] in electrical equipment is very important for the stability of the whole power system. The principle of the ultrasonic array positioning method [7,8,9] is that a sensor array receives ultrasonic signals generated by PD sources and uses array signal processing techniques to determine the source positions. The ultrasonic array positioning method has advantages of strong anti-interference capability and high accuracy.
In the last century, Schmidt and Roy proposed the multiple signal classification method (MUSIC) [9,10,11,12,13] and the estimation of signal parameters via rotational invariance technique (ESPRIT) algorithm [14,15]. The covariance matrix of the received signal is decomposed into two signal and noise subspaces, and then an orthogonal relation is used to estimate the direction of arrival (DOA) of the signal. Although these two methods achieve good results in high Signal to Noise Ratio SNR situations, the performance is more obvious when the number of sampling points is small or the signal to noise ratio is low. Later, a lot of new algorithms like the maximum likelihood (ML) algorithm [16,17] and weighted subspace fitting techniques [18], etc., have been commonly used. Compared to these improved algorithms and subspace-based algorithms, the estimation performance of the improved algorithms is greatly improved, but the computational burden is often too large to be practical.
In addition to the design and implementation of efficient and fast decomposition algorithms, the most important task is to reduce the complexity of the algorithm, while finding the appropriate atomic type and then construct a suitable over-complete dictionary is another key issue. Mallat and Zhang [19,20] pointed out that the over-complete dictionary of atoms is a set of Gauss functions that are scalable, time shifted, and frequency adjusted, known as the Gabor atom dictionary. Because this dictionary has very good time-frequency aggregation, therefore, this kind of dictionary sparse representation clearly shows the time-frequency characteristics based on the internal signal.
In this work, a square ultrasonic array sensor [21,22] is taken as an example. Firstly, the step over-complete dictionary [23] which can effectively reduce the operation time is constructed according to the direction finding need and the array flow pattern of the sensors. Then the matching pursuit (MP) algorithm [24,25,26] is used according to the step-by-step over-complete dictionary to search for the optimal DOA estimation. Moreover, using the spatial direction finding angle, the spatial position of the PD source is determined by using the three array platforms location method. Finally, the feasibility of the theory is verified by simulations and experiments.

2. Mathematical Model of Square Ultrasonic Array

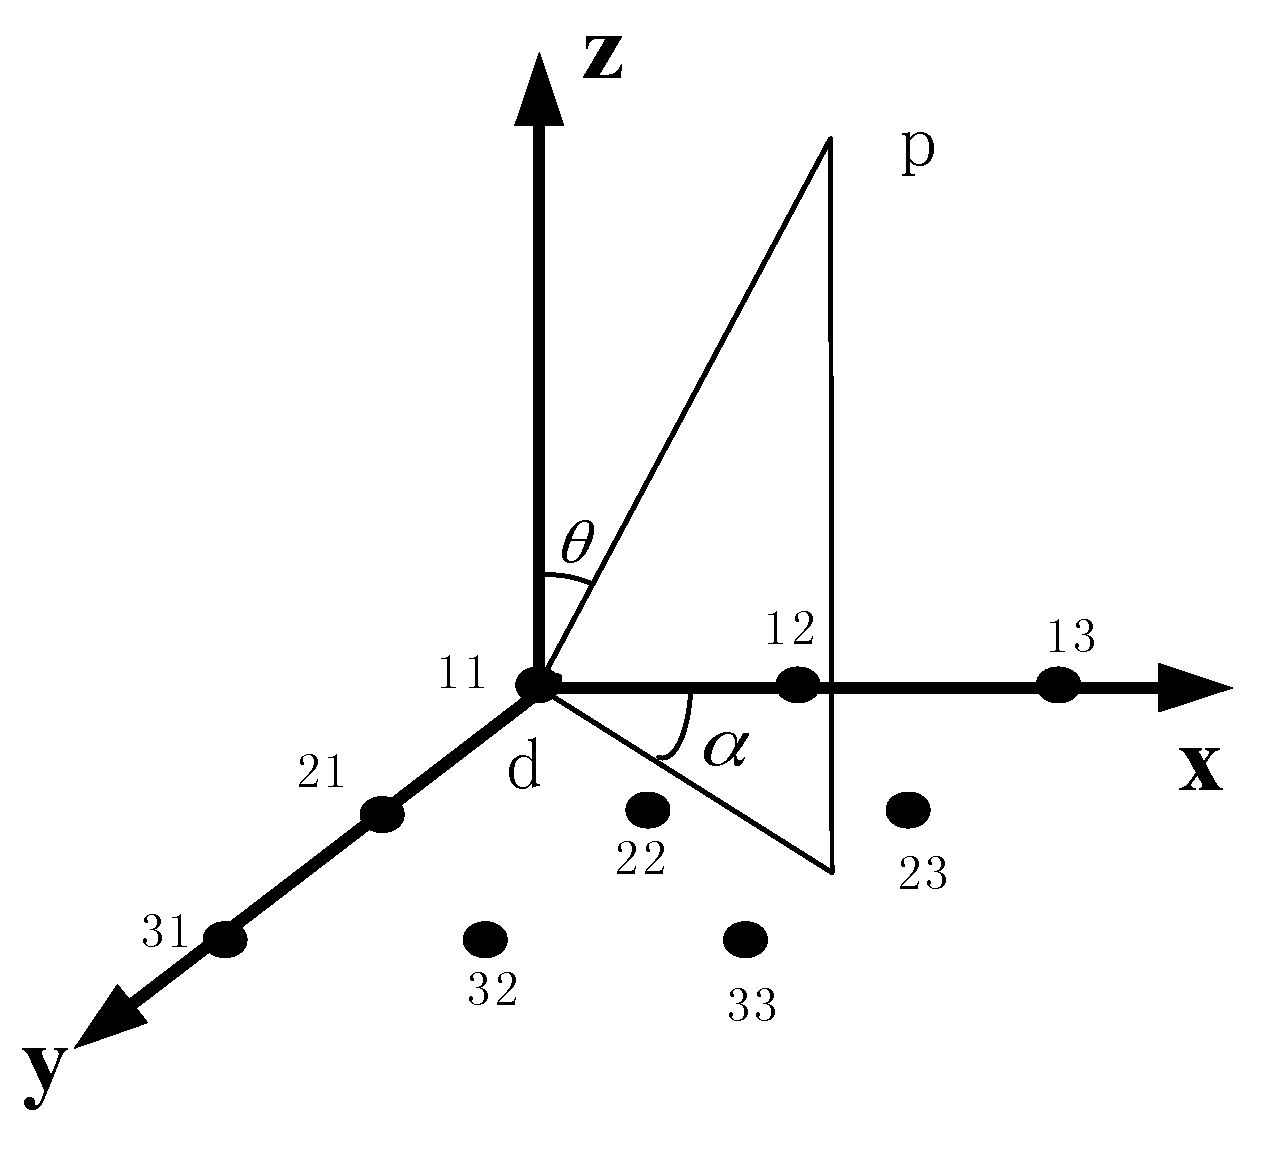
2.1. Mathematical Model of Array Signal Processing

When the estimation of the DOA of the ultrasonic signals generated by a PD source is conducted based on signal sparse decomposition theory, the first step is to build a mathematical model of the array signals. For the PD ultrasonic array detection system, we suppose that the array sensor is composed of M ultrasonic sensors, there are k PD sources, and the ultrasonic signals on the array sensor are also k, the angle of the ultrasonic signal is φ i , i = 1, 2, ..., k. Moreover, the angle of the incident signal φ i is composed of two angles, the plane angle α and the pitch angle θ for the plane square array sensor. In the ideal case, considering that each element is in the same direction and independent from each other, the received signal of the m-th element at any time t is:
x m ( t ) = i = 1 k g m i s i ( t τ m i ) + n m ( t ) , m = 1 , 2 , , M
where the gmi is the gain of the ith signal for the m-th array element, which can be normalized to 1. si is the i-th PD source. nm(t) is noise for the m-th array element. mi is time delay of the i-th spatial signal incident on the m-th array element, which contains the spatial parameters of the signal source DOA.
Because s i ( t τ ) s i ( t ) e j ω τ , i = 1 , 2 , k , the data received by the array sensor is arranged in a vector form, and the data can be obtained from the following expression:
[ x 1 ( t ) x 2 ( t ) x M ( t ) ] = [ e j ω τ 11 e j ω τ 12 e j ω τ 1 k e j ω τ 21 e j ω τ 22 e j ω τ 2 k e j ω τ M 1 e j ω τ M 2 e j ω τ M k ] [ s 1 ( t ) s 2 ( t ) s k ( t ) ] + [ n 1 ( t ) n 2 ( t ) n M ( t ) ]
where ω = 2 π f = 2 π c λ , c is speed of sound, and λ is the wavelength. Equation (2) can be characterized as follows:
X ( t ) = A ( φ ) S ( t ) + N ( t )
A is a space array of M × k dimensional vector matrix and:
A ( φ ) = [ a 1 ( φ 1 ) , a 2 ( φ 2 ) a k ( φ k ) ]
where a i ( φ i ) is oriented vector, φ i is the i-th space signal DOA (including the plane angle α and the pitch angle θ), and:
a i ( φ i ) = [ exp ( j w τ 1 i ) exp ( j w τ 2 i ) exp ( j w τ M i ) ] , i = 1 , 2 , , K ,
is the oriented vector determined by the array mainfold. τ denotes the delay between the array elements. For a different array structure, τ will have a different expression.

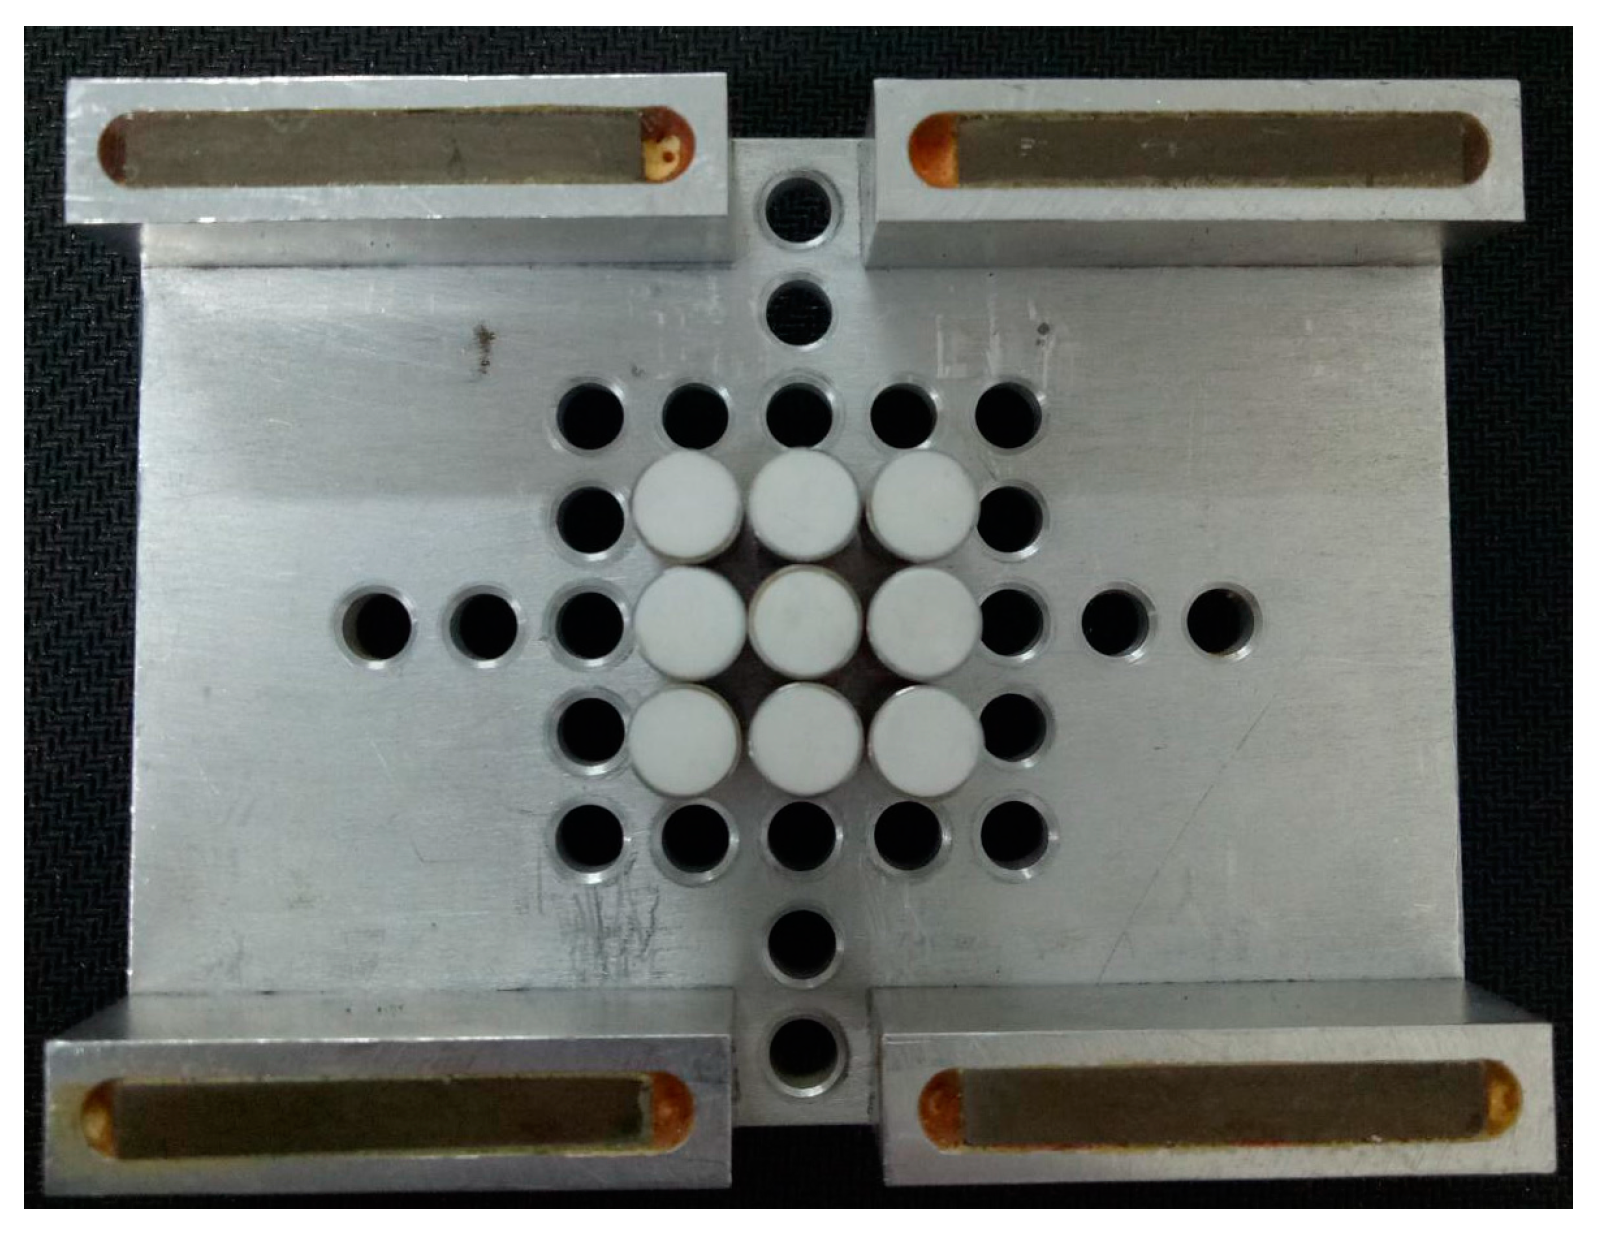
2.2. Square Ultrasonic Array Structure

In a square array ultrasonic sensor composed of m2 array elements, the array element is arranged in the form shown in Figure 1 (taking 9-yuan as example). Each edge has m elements, and according to the number of the icon of each array element number (the number ab means that the array element is located in the first a row and b column), the spacing between the array elements is d.
The ultrasonic propagation speed is set to c, the NO11 array element is taken as the reference element, where the position of the element is taken as the origin of the coordinates, and a three-dimensional rectangular coordinate system is established. Suppose that the incident signal direction is (α, θ), azimuth angle α is the angle between the reference point to the source of the connection in the X-Y plane of projection and x axis, the pitch angle θ is the angle between the reference point to the source of the connection with the z axis. Then, the geometric relations can be known, and according to the reference array, the time delay of the ultrasonic signal arriving the N O a b array element is:
τ a b = 1 c ( d a cos α sin θ + d b sin α sin θ )
where da is the distance projection between the N O a b array element and the reference array on the x axis. And db is the distance projection on the y axis. Equation (5) can be expressed as follows:
a ( α , θ ) = [ 1 exp [ j 2 π f ( d cos α sin θ + 0 sin α sin θ ) / c ] exp [ j 2 π f ( ( m 1 ) d cos α sin θ + ( m 1 ) d sin α sin θ ) / c ] ]
where f is the center frequency of the signal.

3. Ultrasonic Array Direction Finding and Location Based on Step-by-Step Over-Complete Dictionary

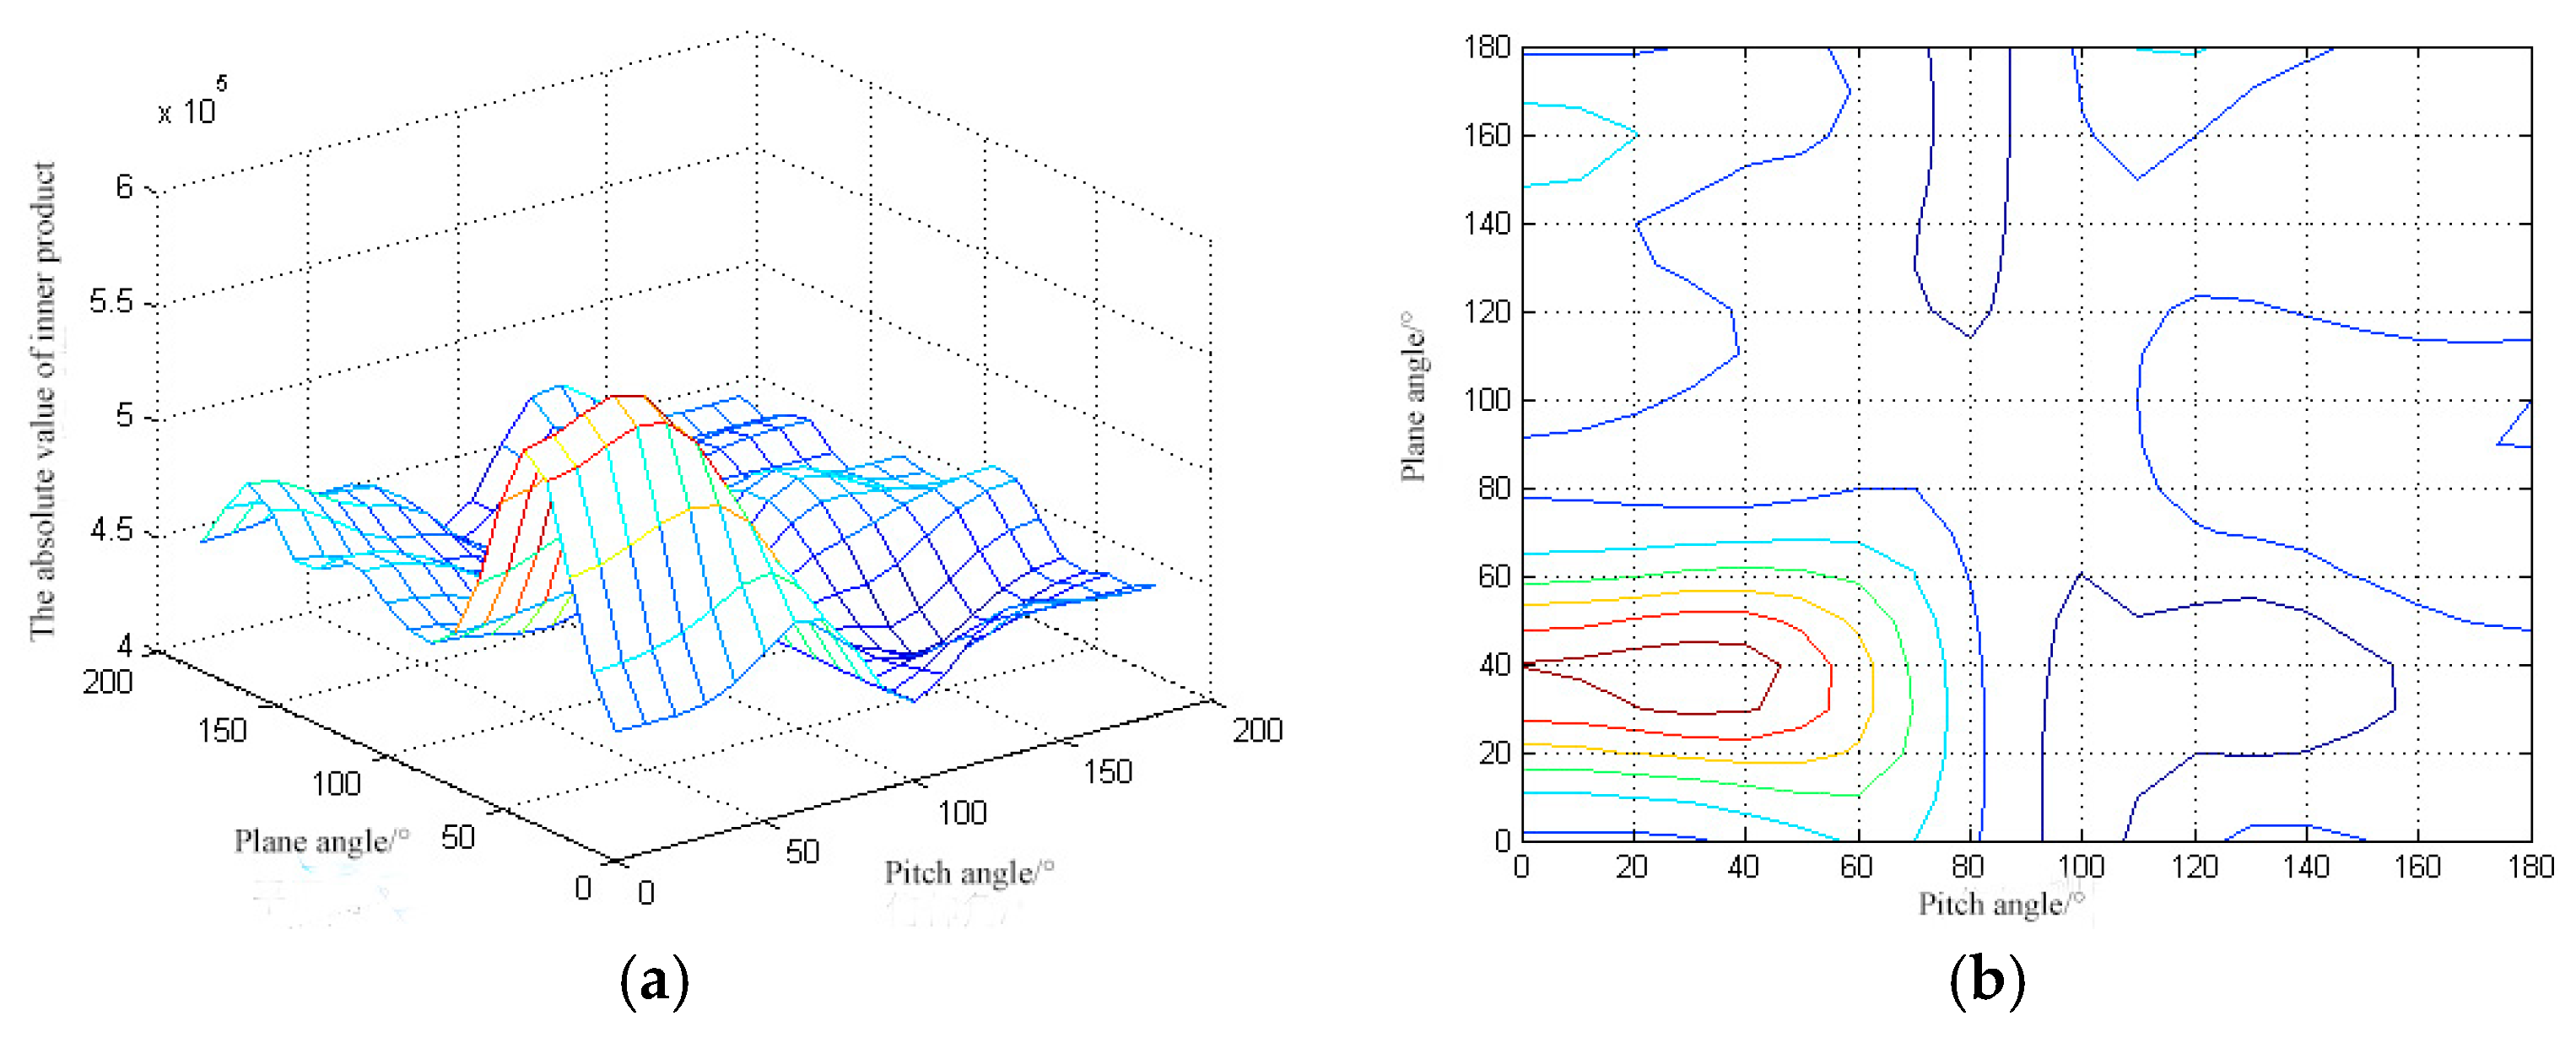
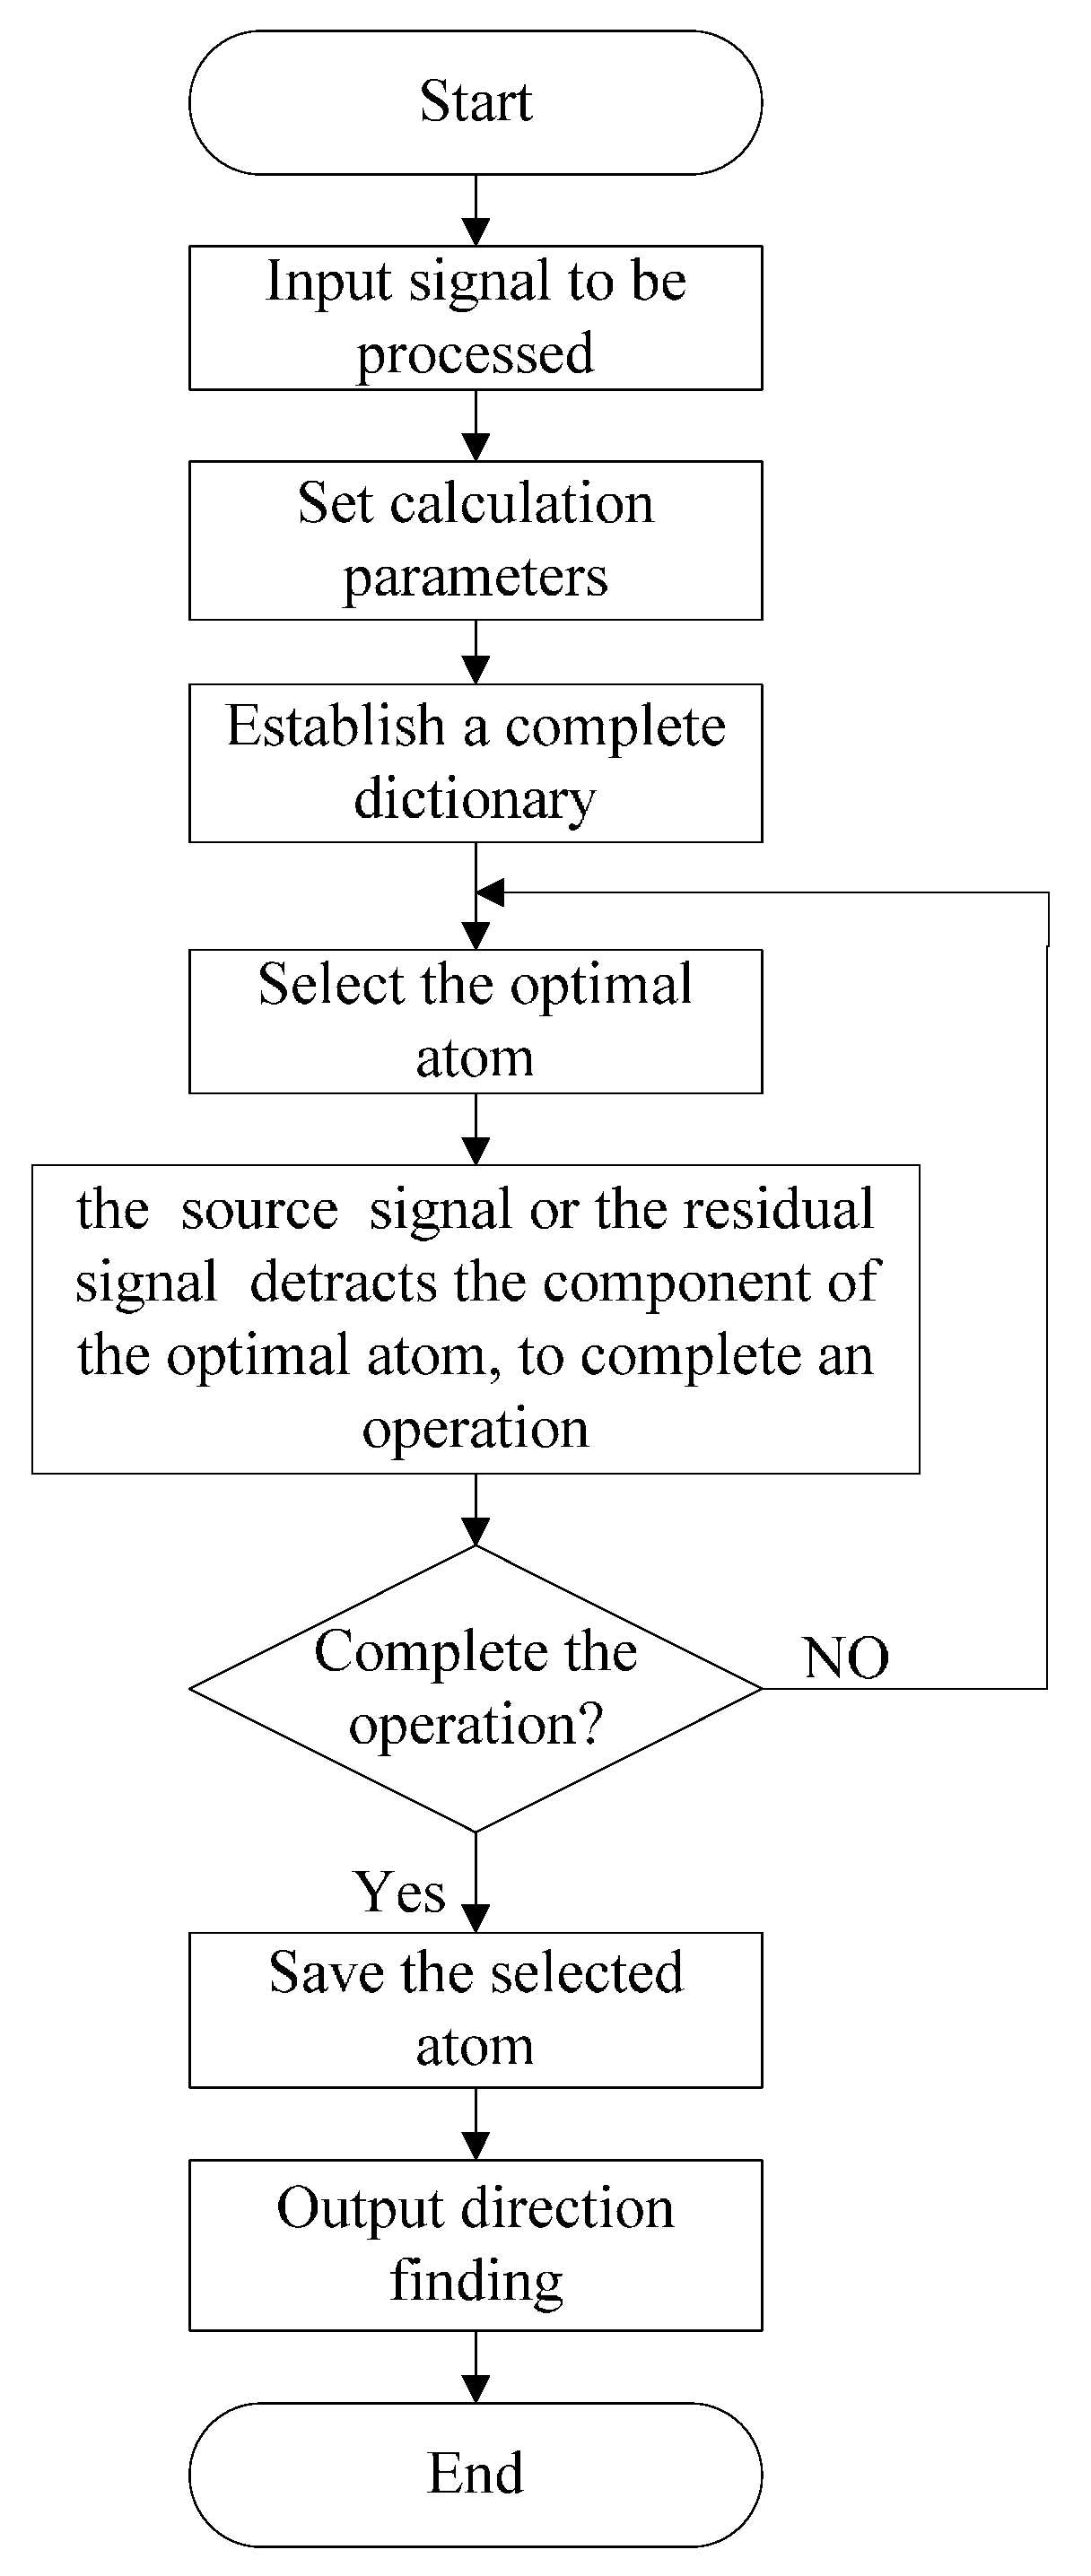
3.1. DOA Estimation Based on the Matching Pursuit Algorithm

For the ultrasonic signal DOA estimation of k PD sources, the incidence angle of the signal can be searched in the N angle vector that has been set. Usually the number of sources is much smaller than the number of angles to be searched, that is k N . An angle search vector β = [ β 1 β 2 β N ] is constructed in the angle space, which has k components which are respectively equal to φ1, φ2, …, φk. Constructing an angle search matrix is also an over-complete atomic dictionary:
A s ( β ) = [ a v ( β 1 ) , a v ( β 2 ) , .... , a v ( β N ) ]
When the matching pursuit algorithm is used to decompose the received array signal, the signal in each direction has a maximum projection value on the corresponding atom. According to the mathematical projection theory, the signal and the maximum value of the inner product of the atom can be used to find the largest projection, which means to find the best matching atom vector. Suppose the sampling point of the signal sampling is T, then output signal X is a vector matrix of M × T dimensions. Atom ανβ(n) in the As(β), n = 1, 2, ..., N, is the column vector for the M × 1 dimension. The collected array signal X forms the inner product with each atomic vector ανβ(n) in the matching pursuit algorithm. The most matched atom is selected by the size of the absolute value of the inner product, ανγ0), γ0 ∊ {0, 1, ..., N}. The most matched atomic vectors should be consistent with:
| X , a v ( β γ 0 ) | = sup | X , a v ( β n ) |
Then the received signal can be expressed in the projection of ανγ0) and the residual signal:
X = P a v ( β γ 0 ) X + R X
where P a v ( β γ 0 ) X is the projection part of the signal on the most matched atom. According to the definition of matrix projection, the projection part can be obtained from the following formula:
P α v ( β γ 0 ) X = α v ( β γ 0 ) α v ( β γ 0 ) , α v ( β γ 0 ) 1 α v H ( β γ 0 ) X = X , α v ( β γ 0 ) α v ( β γ 0 )
Repeat the above steps for the optimal matched signal residual, the signal residual is small enough after K times and meets the error requirement, then the sparse decomposition result of the array signal X(t) is:
X = n = 1 k R n X , α v ( β n ) + R k X
After the completion of the reception signal decomposition, k optimal atoms are obtained. The angular information contained in the atom is composed of the DOA estimation matrix, which is β = [β1, β2, …, βk] = [φ1, φ2, …, φk], it realizes the signal DOA estimation. The ultrasonic array signal flow chart of DOA estimation based on matching pursuit algorithm is shown in Figure 2.

3.2. The Establishment of Step over Complete Atomic Dictionary

According to the need of realizing the signal DOA estimation, a complete vector atomic dictionary is constructed based on the vector matrix As(β). For the square array sensor, β is the vector constituted by the incident azimuth and pitch angle, which is β = [α, θ], Over a complete vector atomic dictionary is As(α, θ), the range of α and θ are all 0°–180°, so the direction finding accuracy acquires a uniform value, and the vector atom is determined by the values of α and θ. According to Equation (6), the following models are established for each vector atom in the atomic dictionary of the square array sensor:
a v ( α , θ ) = { 1 exp [ j ω ( d cos α + d sin α ) sin θ / c ] exp [ j ω ( d a cos α + d b sin α ) sin θ / c ] exp [ j ω ( m d cos α + m d sin α ) sin θ / c ] }
The process of the matching algorithm to find the optimal atom is the one by one inner product of atoms between the amount of decomposition and the over-complete dictionary, so the number of atoms in a complete dictionary directly determines the amount of computation needed. For the plane shaped ultrasonic array sensor, the DOA estimation can simultaneously measure the azimuth and pitch angle, which range from 0°–180°. If the accuracy in a complete dictionary, where the accuracy is the step size of two angles in the adjacent vector atoms is set to 0.1, then the number of atoms will reach 1800 × 1800 directly according to the expected accuracy needed to establish a complete dictionary which will make the subsequent search require a huge amount of computing, so it is necessary to set up a step over-complete dictionary. In the establishment of a step over-complete dictionary, the precision of the first established over-complete dictionary is 10°, the search ranges are all 0°~180°, the first step atom number is 18 × 18, and the first rough time estimation is obtained. Then the precision of the second established over-complete dictionary is 1°, the search range is [η1 − 10°, η1 + 10°], the second step atom number is 20 × 20, and the second more accurate estimate is obtained, where the search angle is η2. Similar to the above steps, the third over-complete dictionary is established, the degree is set to 0.1°, the search range is [η2 − 1°, η2 + 1°], the third step atom number is 20 × 20, and a high accuracy DOA estimation η3 can be obtained with three precision searches, but the amount of computation required compared to a directly set precision degree like 0.1° is much smaller.

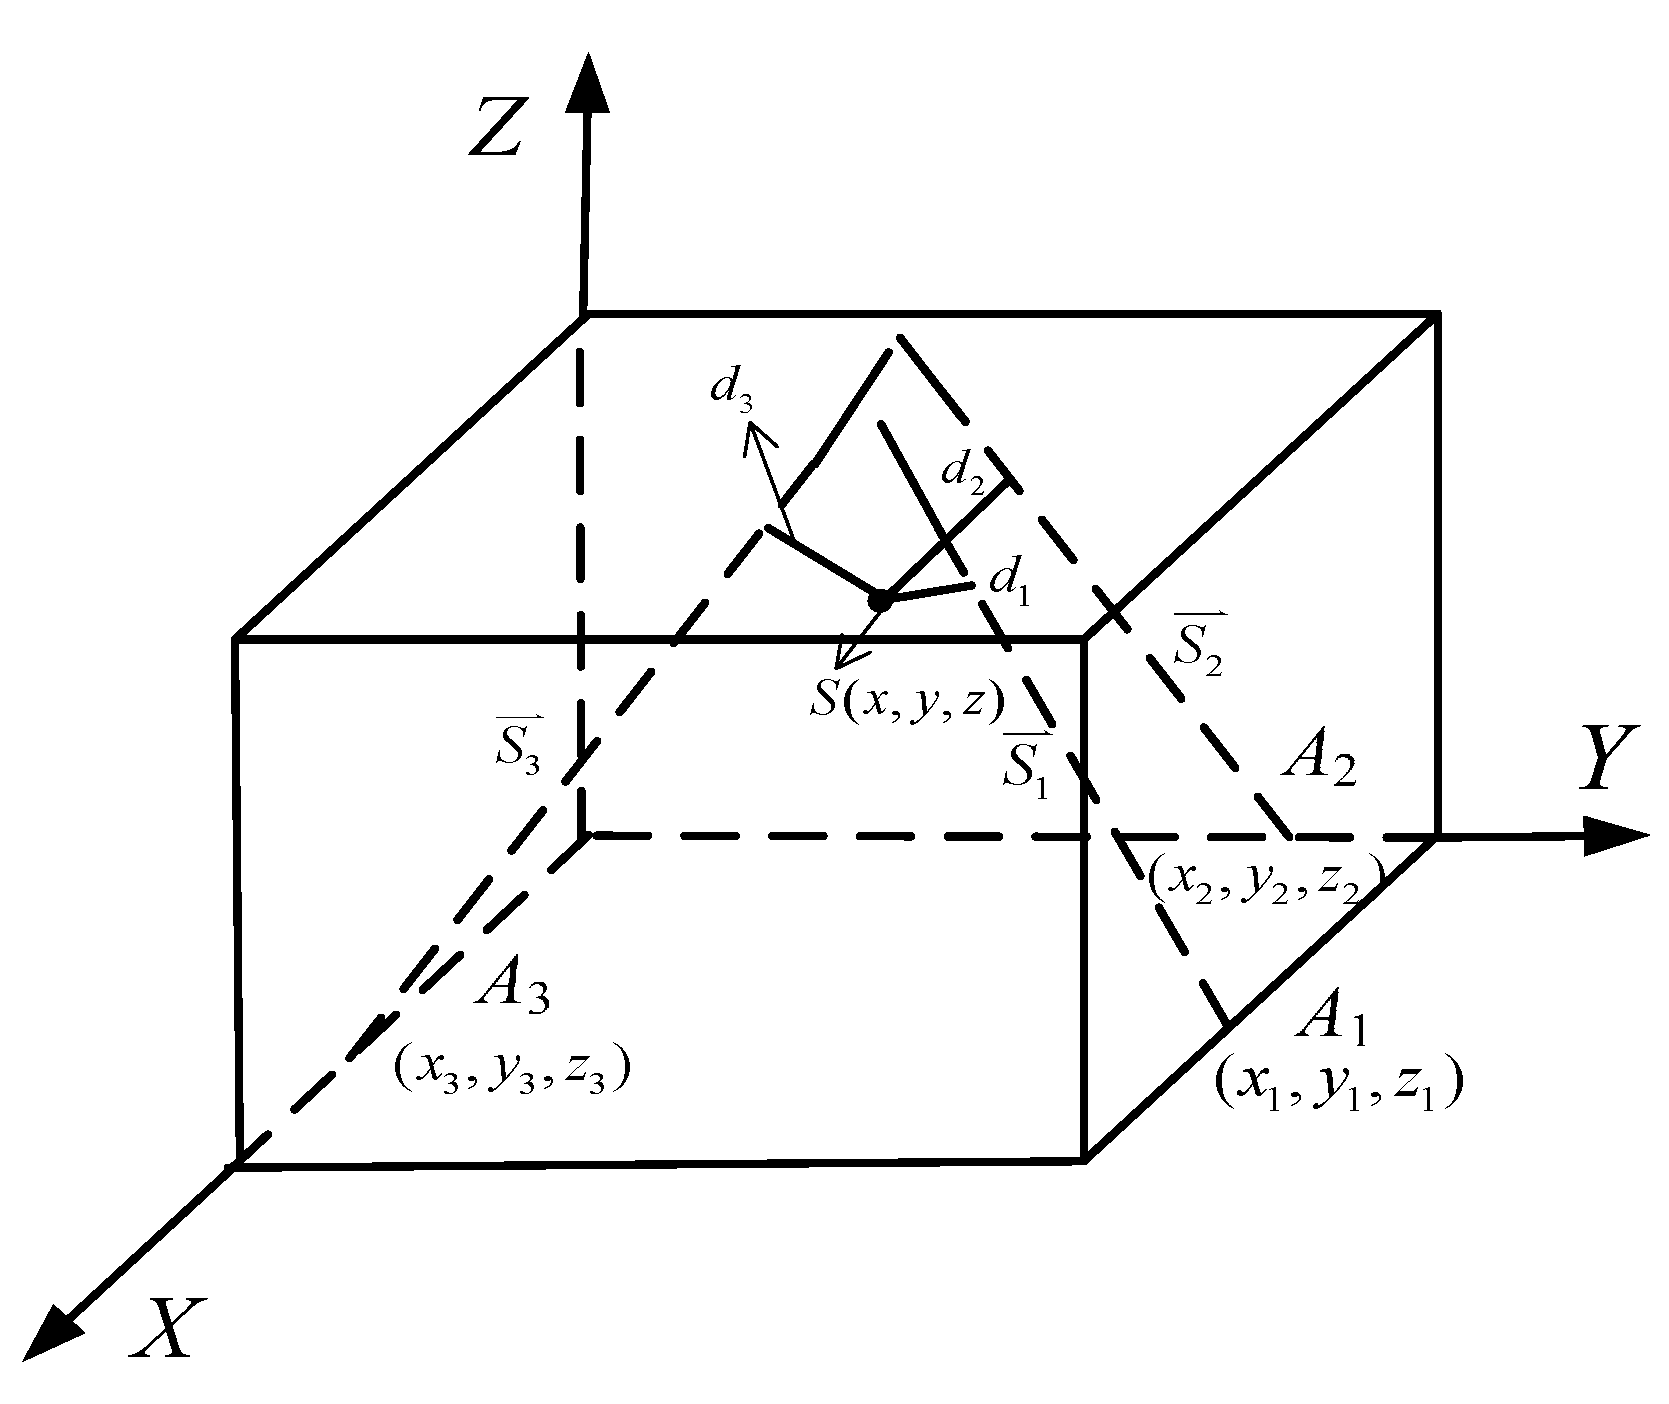
3.3. Three Array Cross Positioning Principle

The location of the PD source can’t be determined after obtaining the DOA using the MP method. In this paper, the direction finding results are used, and we combine the three array cross location method [10] to obtain the spatial position of the local source. The three array positioning principle is shown in Figure 3.
The space positions of the three groups of array sensors are set to A1 (x1, y1, z1), A2 (x2, y2, z2), A3 (x3, y3, z3), the direction finding and the position of the array sensor are obtained by using DOA estimation, then the direction finding line equation St can be obtained. The spatial coordinate of the signal source is set to S (x, y, z), and the three different direction finding lines should intersect in S (x, y, z) under ideal conditions, but there are many kinds of measurement errors, these lines are on different surfaces. Therefore, the sum function of the sum of the three straight lines can be constructed:
d = t = 1 3 d t = d 1 + d 2 + d 3
The chaotic monkey [27] algorithm is used to search optimize the space, which makes the minimum sum of the distance. The point where the d value is the smallest, is regarded as the spatial location of the source.

4. Experimental Study

To start with, the PD signals are collected by using the PD detection experimental platform in the lab. Then the matching pursuit algorithm is prepared with the help of the MATLAB (2012 v7.0, Math Works, Natick, MA, USA) programming software to capture the array signal DOA estimation. Finally, after obtaining the space angle information of the PD source, combined with the sensor array location information, the spatial position of the PD source is determined by the three array cross positioning method.

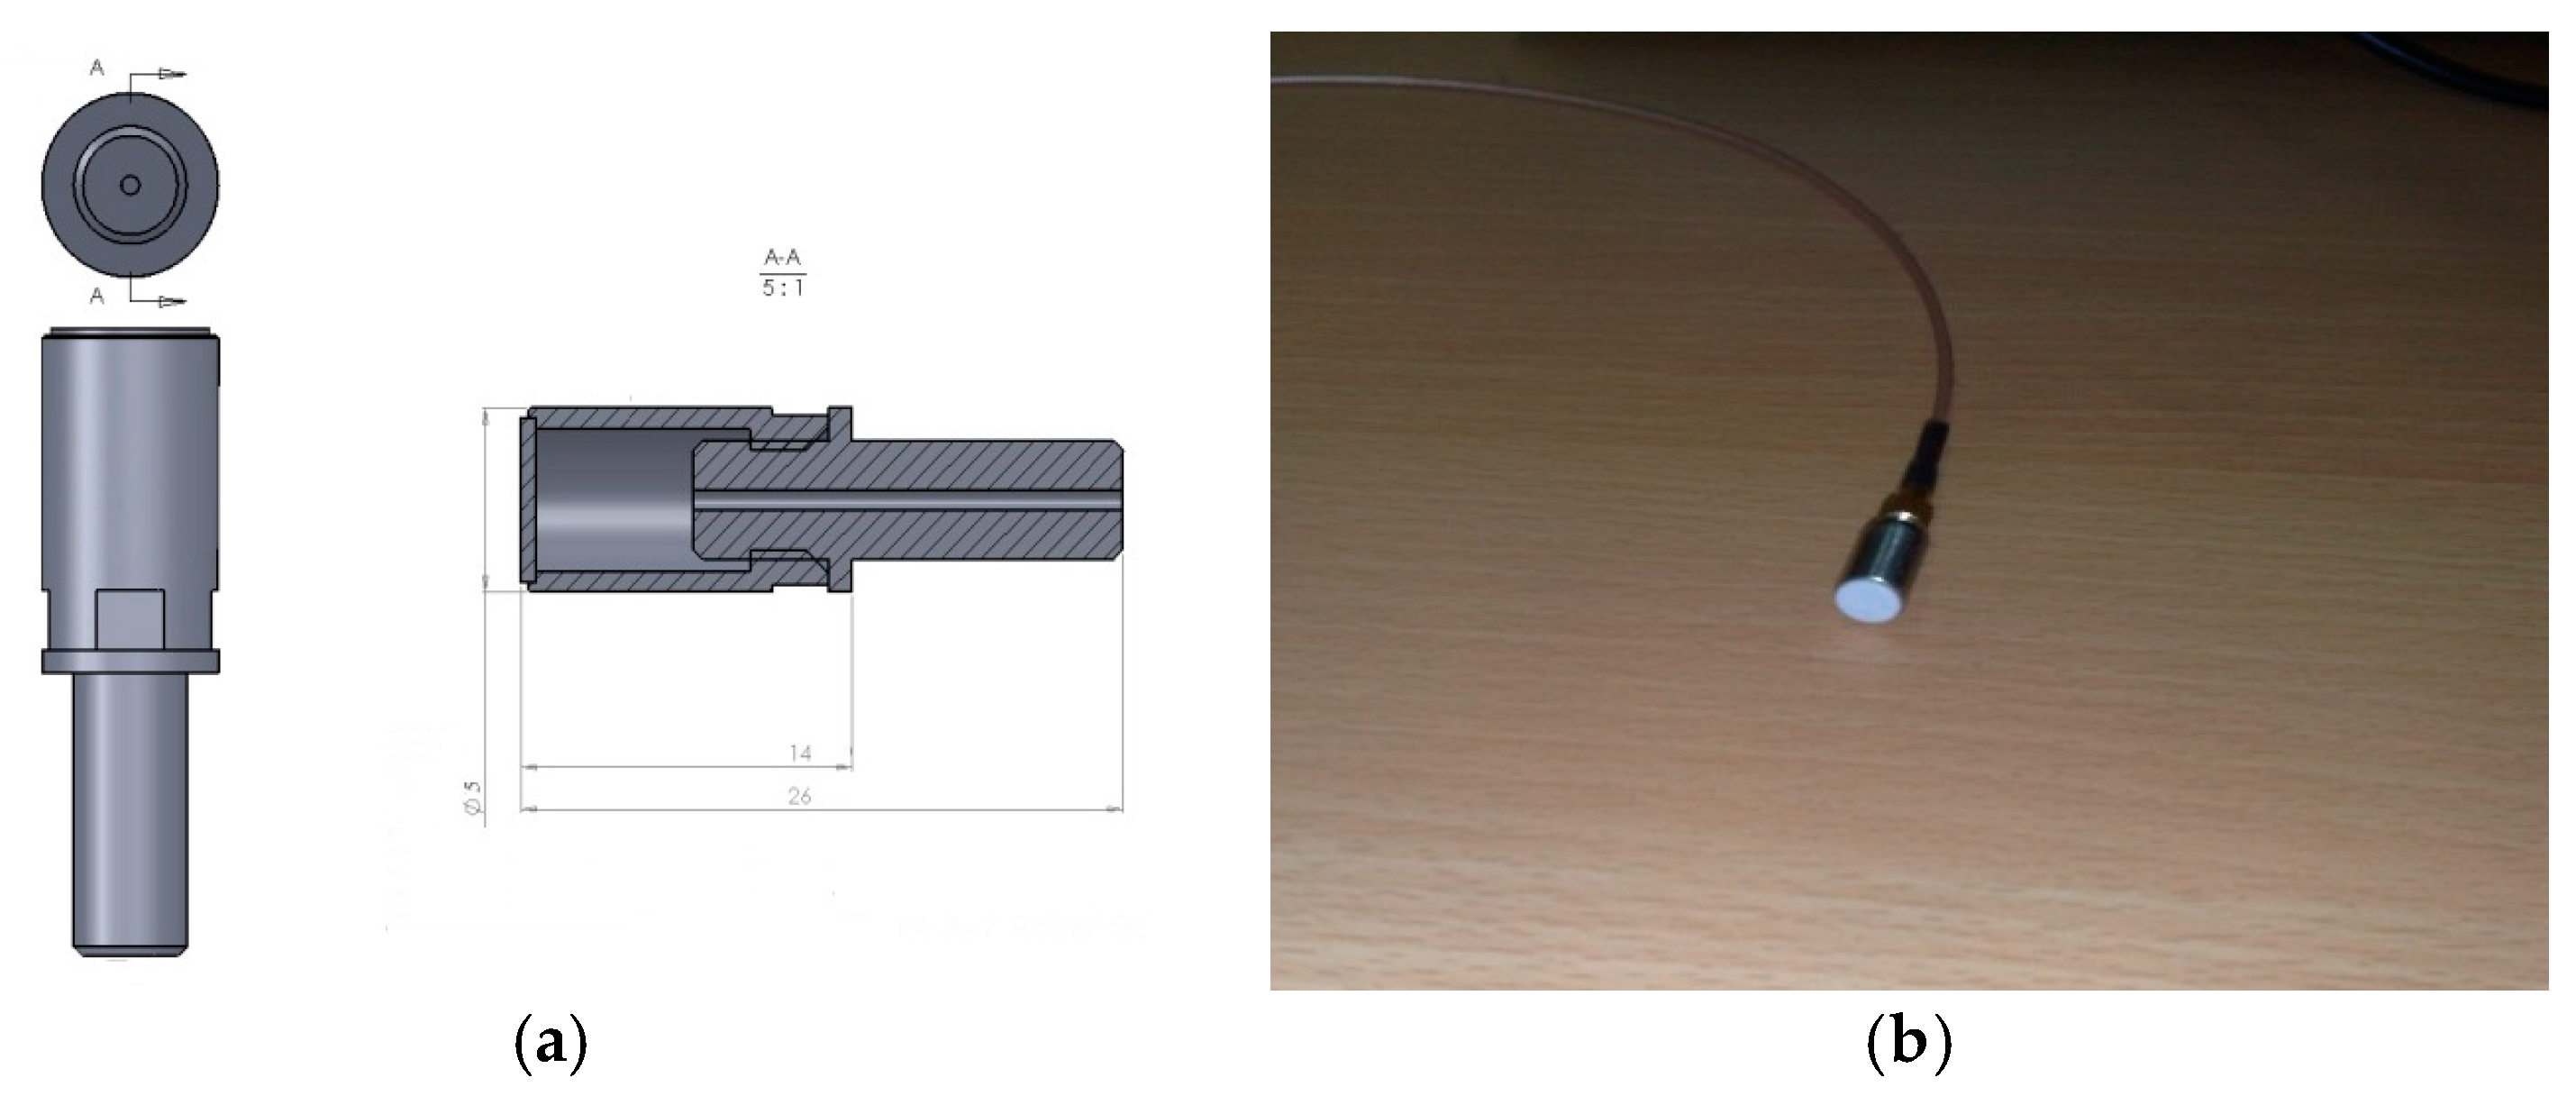
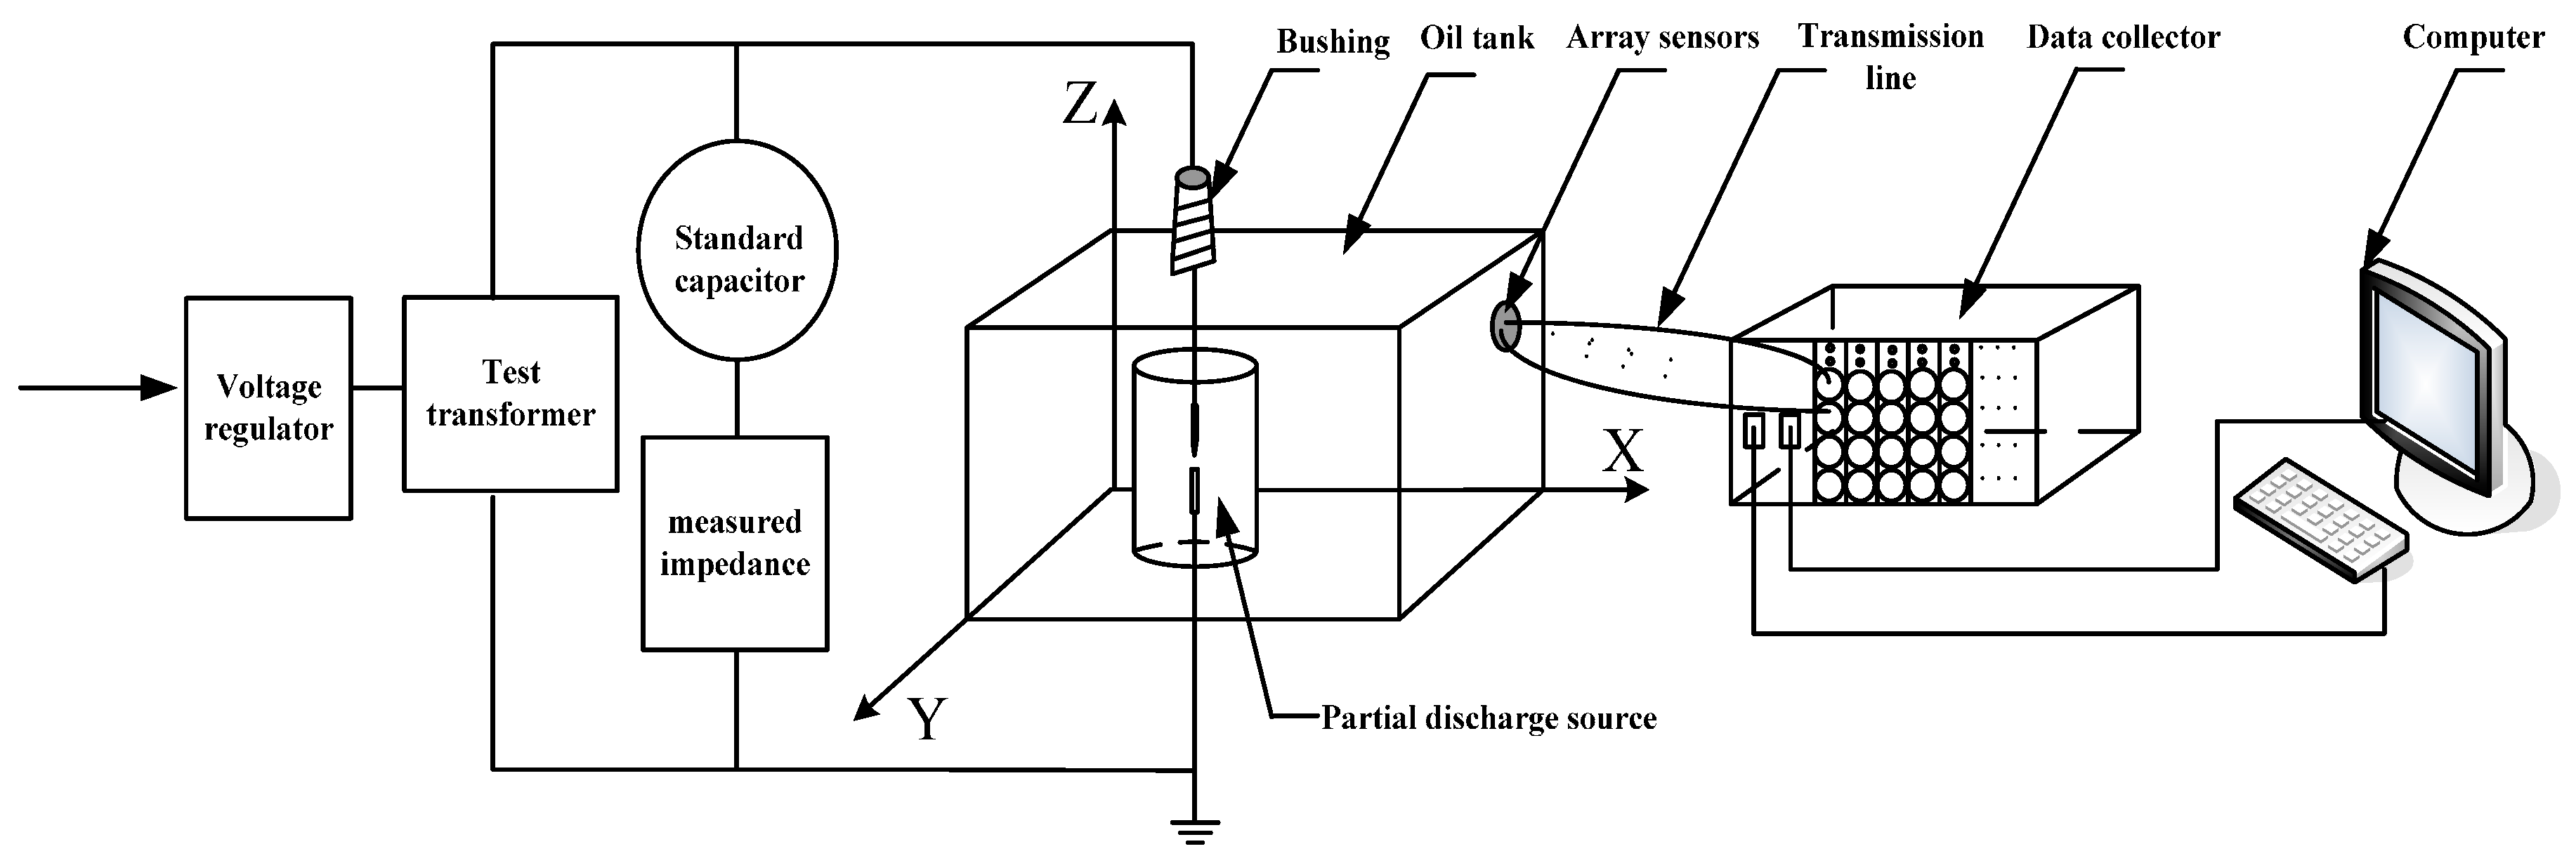
4.1. Experimental System

The main components of the PD ultrasonic array detection hardware system include: simulation of discharge system, signal receiving and transmission system, synchronous multi-channel data acquisition and processing system, and the computer. This system architecture is shown in Figure 4.
The model distribution transformer is a rectangular box body that is welded by steel plates. Three sides are composed of steel plates, and the other side is a glass plate, which makes it easy to observe the discharge source location. The body size is a length of 150 cm, width of 100 cm, and the height is 120 cm. A discharge tube (EPSON, Shenzhen, China) is used as a discharge device, and the critical discharge voltage is 230 V. The frequency of ultrasonic signals registered by the sensor array is in the range of 50 kHz–280 kHz, the center frequency is 150 kHz, and the equivalent velocity is 1500 m/s, while the wavelength is about 10 mm.
During the experimental process, the PD ultrasonic signals are acquired with a square array sensor [22,28], which is shown in Figure 5 and Figure 6. In Figure 6 there are magnets on the top and bottom sides of the assembly. The ultrasonic array sensor assembly is tightly attached on the outer wall of the electrical equipment model. Moreover, the different order square array structures are changed by changing the positions in the assembly and the array elements, as shown in Figure 6. During the experiments, the environmental noise ratio was about 10 dB. The PD ultrasonic signal is difficult to collect, and a variety of interferences could affect the experimental results. Each of the PD source locations needs to collect more data.

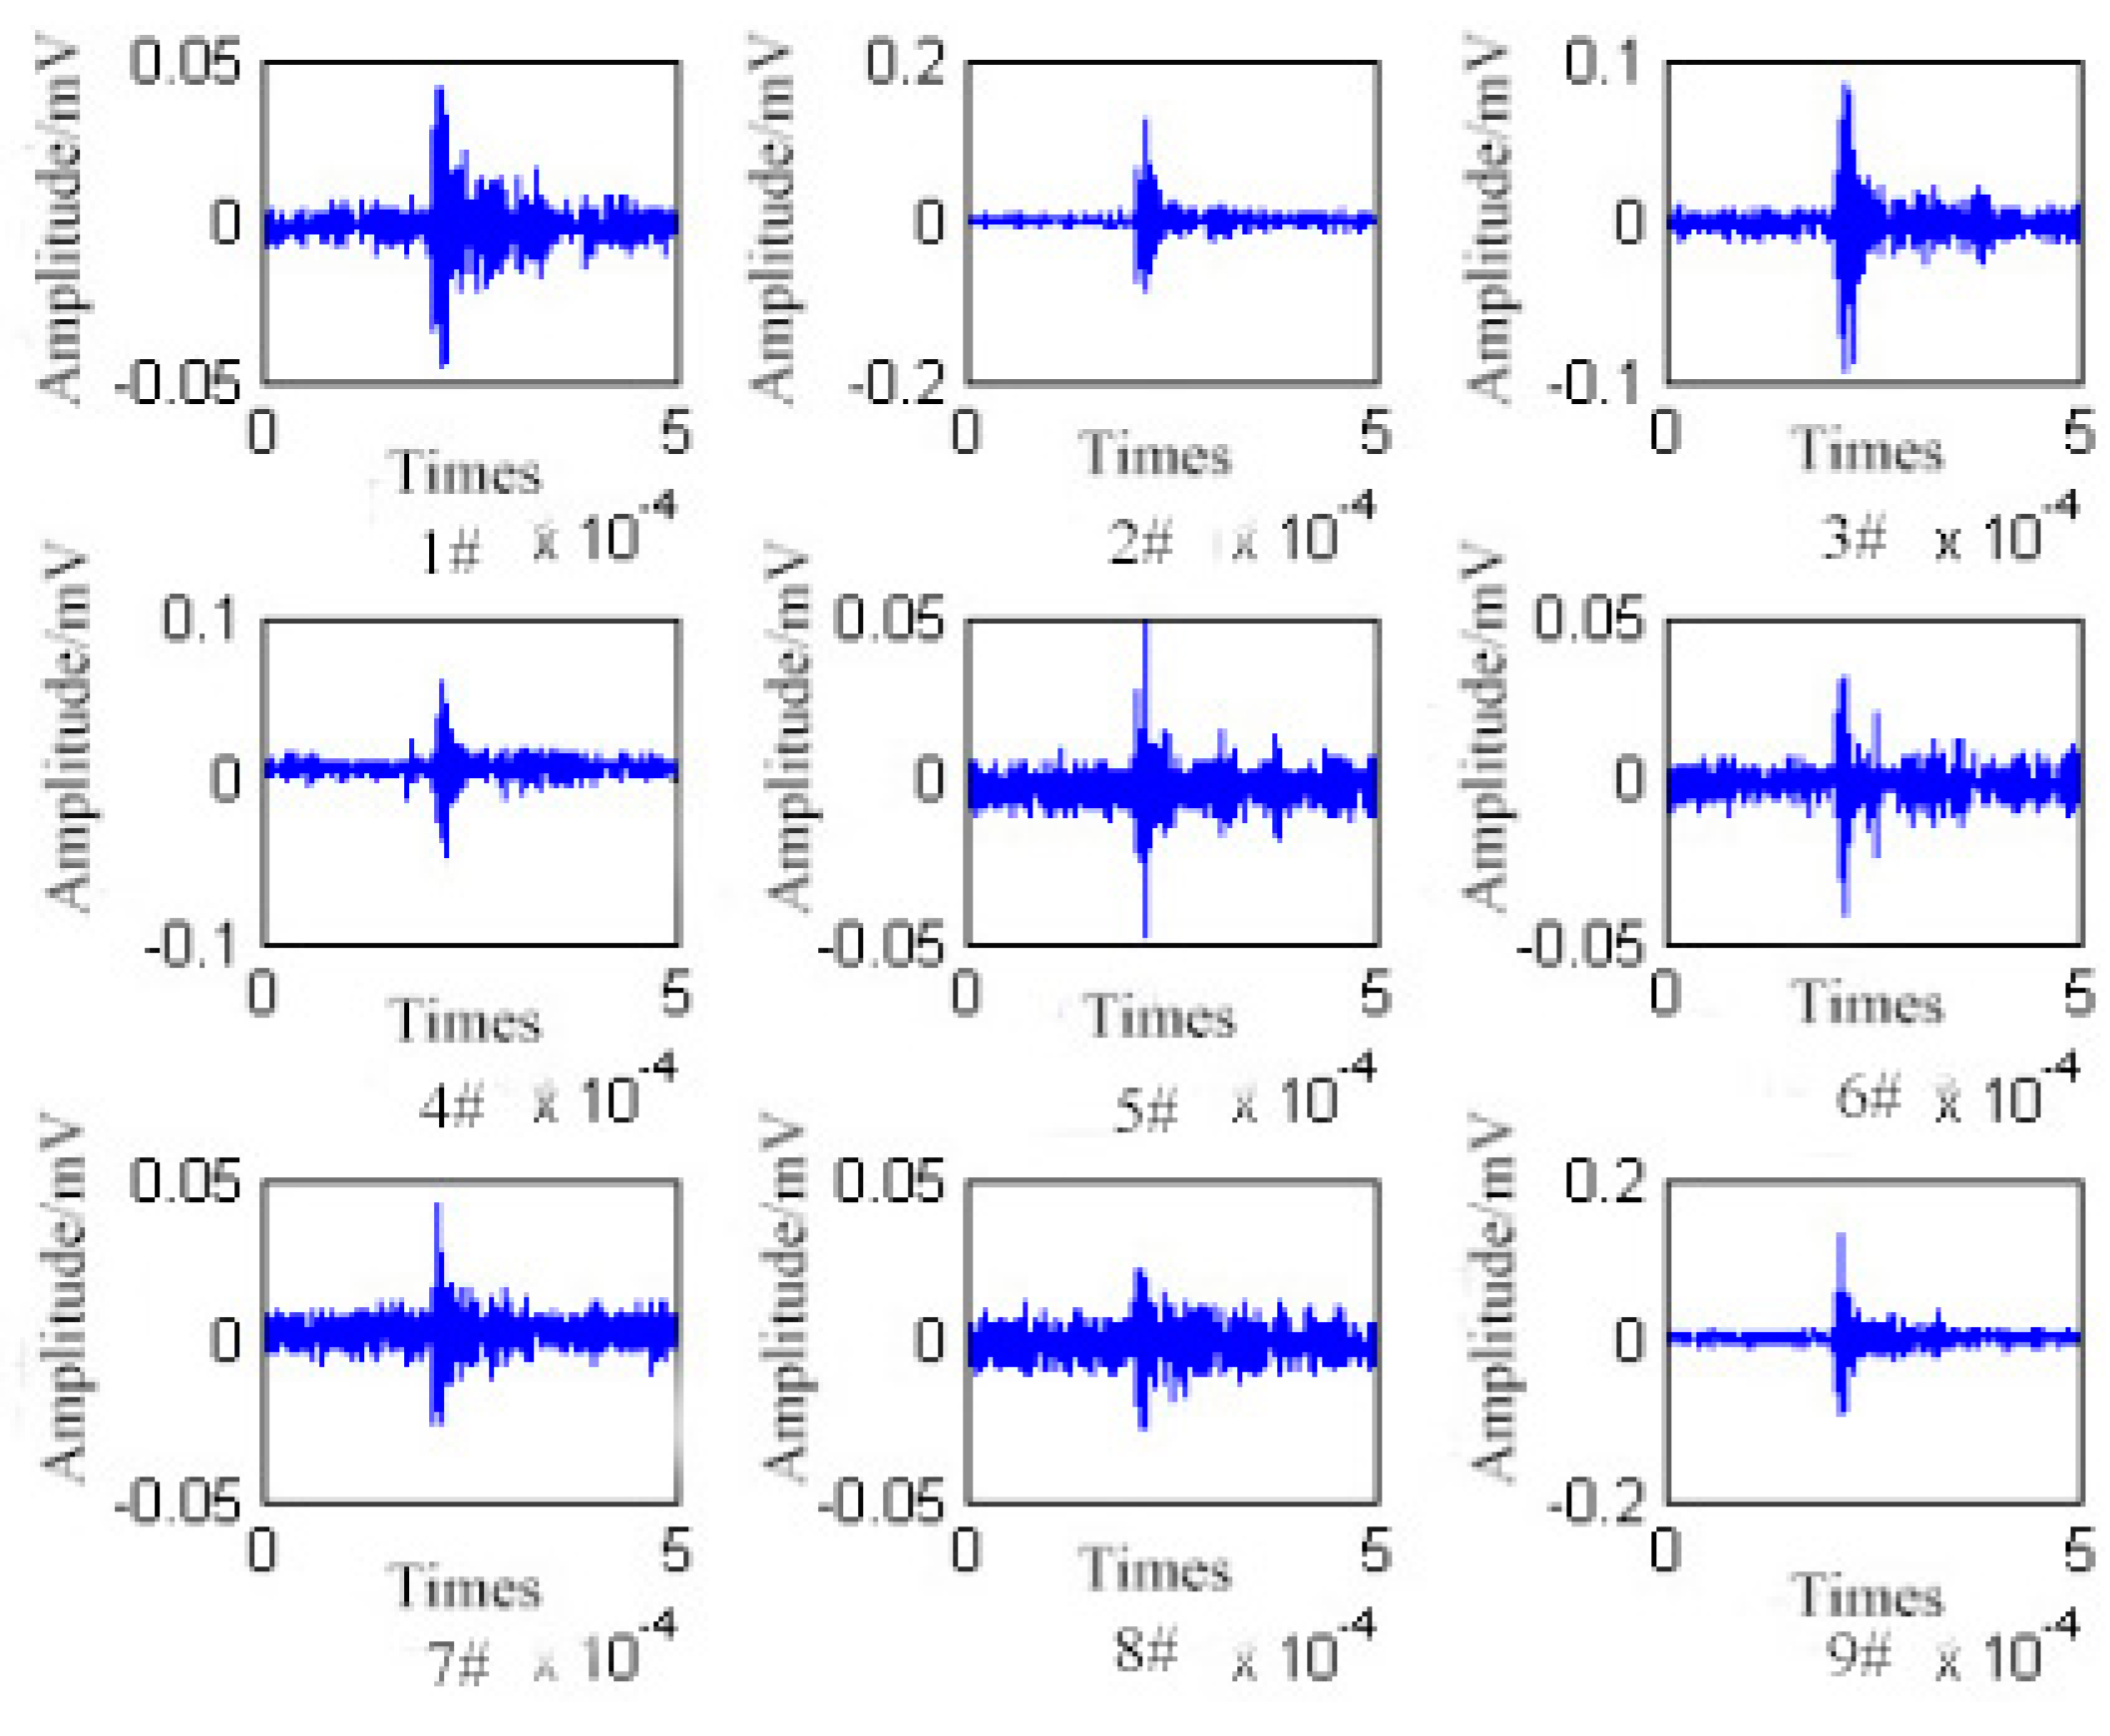
4.2. Direction Finding and Location

During the experiment, the space position of the PD source is set up in advance. Then a plurality of preset fixed sensor locations are selected the outer wall of the tank. In order to ensure the experiments are performed under the same conditions and facilitate subsequent data processing, during the experiment, the PD source location is fixed, and only the position of the ultrasonic sensor array is changed, and thus we change the relative space position. In the simulation experiments, the PD source location coordinates are (65, 15, 60) cm. The PD ultrasonic array signal waveform in oil is collected by a square ultrasonic sensor array, as shown in Figure 7.
The three array sensors are fixed at (45, 0, 20) cm, (80, 0, 20) cm, (0, 30, 40) cm, respectively. The three DOA theoretical values are: (36.9°, 32.0°), (135.0°, 27.9°), (167.0°, 73.3°). According to the principle of the matching pursuit (MP) algorithm for DOA estimation, the process of the array signal in the search for the optimal atom is to form the inner product with each atom, respectively. The absolute value of the inner product with the optimal atom is maximum. In order to represent this process visually, the absolute value of the inner product distribution from the perspective of space can be calculated.
In step-by-step over-complete dictionary, the atomic precisions are respectively 10°, 1° and 0.1°. Each finding process is divided into three steps. The ultrasonic sensor array position 1 is used as an example. The PD ultrasonic signal data is collected by an ultrasonic array sensor in position 1 and is used the MP algorithm for DOA estimation. The direction finding result is (37.5°, 31.0°). The absolute values of the inner product in the space distribution are shown in Figure 8, Figure 9 and Figure 10.
In the same way, a step and step over-complete dictionary is used to measure the direction of the remaining two positions. The measurement results for array sensor position 2 and position 3 are as follows: (134.0°, 26.7°), (167.6°, 74.6°). Then, using the three DOA positions that have been measured, the spatial position of the PD source is obtained according to the three array cross positioning principle. The results are (67.7, 17.6, 63.3) cm, and the error is 5.0 cm. The location diagram is shown in Figure 11.
Changing the position of ultrasonic sensor array, using the same way of direction finding, several groups of data acquisition and processing experiments are conducted again. The results after the data processing are shown in Table 1.
The table shows that the ultrasonic array signal is collected by the square ultrasonic sensor array based on the matching pursuit algorithm in the experimental process, and the average location error is 5.22 cm, which is in accordance with the actual requirements of the project. The results show that the step-by-step over-complete dictionary can reduce the amount of computation, speed up the computation and improve the PD detection localization accuracy.

5. Conclusions

The DOA estimation method based on sparse representation of received data is studied, and the step-by-step over-complete dictionary is established. Firstly, the steering vector of the full array ultrasonic array sensor is derived, which is used as the model of the atoms in the dictionary. Then, the direction finding method based on the direct sparse representation of the received data is applied to the detection of the local discharge ultrasonic array. Finally, an experimental study shows that based on the step-by-step over-complete dictionary of transformer partial discharge detection, the PD source localization error is 5 cm, which meets the actual needs of the project.

Acknowledgments

This work was supported by Project Supported by National Natural Science Foundation of China (51307060); Fundamental Research Funds for the Central Universities (2016ZZD07); Project of Natural Science Foundation of Hebei province (E2015502081);State Key Laboratory of Alternate Electrical Power System with Renewable Energy Source(LAPS16009).

Author Contributions

Shuguo Gao designed this paper, Ying Zhang wrote the whole manuscript, Qing Xie provided part guidance; Yuqiang Kan finished the experiment, Si Li participated the experiment, Dan Liu participated in the idea of the article, Fangcheng Lü provided a part of guidance.

Conflicts of Interest

The authors declare no conflict of interest.

References

  1. Qiu, C.R.; Wang, N.Q. Electrician Equipment Local Discharge and Its Test Technology; Mechanical Industry Publishing House: Beijing, China, 1994. [Google Scholar]
  2. Sikorski, W.; Walczak, K.; Przybylek, P. Moisture migration in an oil-paper insulation system in relation to online partial discharge monitoring of power transformers. Energies 2016, 9, 1082. [Google Scholar] [CrossRef]
  3. Xu, Y.; Liu, W.D.; Gao, W.S.; Zhang, X.C.; Wang, Y. Comparison of PD Detection Methods for Power Transformers-their Sensitivity and Characteristics in Time and Frequency Domain. IEEE Trans. Dielectr. Electr. Insul. 2016, 23, 2925–2932. [Google Scholar] [CrossRef]
  4. Polak, F.; Sikorski, W.; Siodla, K. Location of partial discharges sources using sensor arrays. In Proceedings of the 2014 International Conference on High Voltage Engineering and Application (ICHVE), Poznan, Poland, 8–11 September 2014; pp. 1–4. [Google Scholar]
  5. Luo, Y.F.; Li, Y.M.; Liu, L.C. Simulation of PD location method in oil based on UHF and ultrasonic phased array receiving theory. In Proceedings of the 2004 IEEE International Conference on Solid Dielectrics, Toulouse, France, 5–9 July 2004. [Google Scholar]
  6. Luo, R.C.; Li, W.G.; Li, C.R. A multi-target method to locate internal partial discharge sources with in transformer based on array signal. Process. Power Syst. Technol. 2006, 30, 65–69. [Google Scholar]
  7. Xie, Q.; Li, T.; Tao, J.H.; Liu, X.Y.; Liu, D.; Xu, Y.Q. Comparison of the acoustic performance and positioning accuracy of three kinds of planar partial discharge ultrasonic array sensors. IET Radar Sonar Navig. 2016, 10, 166–173. [Google Scholar] [CrossRef]
  8. Hoshi, T.; Ochiai, Y.; Rekimoto, J. Three-dimensional non-contact manipulation by opposite ultrasonic phased arrays. Jpn. J. Appl. Phys. 2014, 53, 07KE07. [Google Scholar] [CrossRef]
  9. Schmidt, R.O. Multiple emitter location and signal parameter estimation. IEEE Trans. Antennas Propag. 1986, 34, 276–280. [Google Scholar] [CrossRef]
  10. Zoltowski, M.D.; Silverstein, S.D.; Mathews, C.P. Beamspace ROOT-MUSIC for minimum redundancy linear arrays. IEEE Trans. Signal. Process. 1993, 41, 2502–2507. [Google Scholar] [CrossRef]
  11. Wu, J.F.; Yang, S.K.; Xie, H.L.; Mao, W.M. Simulation study on partial discharge orientation estimation of power transformer. J. North China Electr. Power Univ. 2007, 6, 15–18. [Google Scholar]
  12. Li, Y.-Q.; Xie, Q.; Wang, N.; Xiang, X.; Lu, F.C. Simulation of PD location in power transformer based on root multiple signal classification method. In Proceedings of the 2009 IEEE 9th International Conference on the Properties and Applications of Dielectric Materials, Harbin, China, 19–23 July 2009. [Google Scholar]
  13. Xie, Q.; Wang, N.; Xiang, X.; Li, Y.-Q.; Lu, F.C. Research on ultrasonic locating of partial discharge in power transformer based on modified multiple signal. In Proceedings of the 2009 Asia-Pacific Power and Energy Engineering Conference, Wuhan, China, 27–31 March 2009. [Google Scholar]
  14. Roy, R.; Kailath, T. ESPRIT–Estimation of signal parameters via rotational invariance techniques. IEEE Trans. Acoust. Speech Signal Process. 1989, 37, 984–995. [Google Scholar] [CrossRef]
  15. Roy, R.; Paulraj, A.; Kailath, T. ESPRIT–A subspace rotation approach to estimation of parameters of cisoids in noise. IEEE Trans. Acoust. Speech Signal Process. 1986, 34, 1340–1342. [Google Scholar] [CrossRef]
  16. Seo, B. The doubly smoothed maximum likelihood estimation for location-shifted semiparametric mixtures. Comput. Stat. Data Anal. 2017, 108, 27–39. [Google Scholar] [CrossRef]
  17. Lu, K.P.; Chang, S.T. Detecting change-points for shifts in mean and variance using fuzzy classification maximum likelihood change-point algorithms. J. Comput. Appl. Math. 2016, 308, 447–463. [Google Scholar] [CrossRef]
  18. Sun, L.; Wang, H.L.; Xiong, L.L. A novel subspace fitting method for DOA estimation based on bayesian compressive sensing. Signal Process. 2012, 28, 827–833. [Google Scholar]
  19. Mallat, S.; Zhang, Z. Matching pursuits with time-frequency dictionaries. IEEE Trans. Signal Process. 1993, 41, 3397–3415. [Google Scholar] [CrossRef]
  20. Mallat, S.; Zhang, Z. Adaptive time-frequency decomposition with matching pursuits. In Proceedings of the 1992 IEEE-SP International Symposium on Time-Frequency and Time-Scale Analysis, Victoria, BC, Canada, 4–6 October 1992. [Google Scholar]
  21. Xie, Q.; Wang, Y.Y.; Li, T. Application of signal sparse decomposition in the detection of partial discharge by ultrasonic array method. IEEE Trans. Dielectr. Electr. Insul. 2015, 22, 2031–2040. [Google Scholar] [CrossRef]
  22. Cheng, S.Y. Acoustic Performance Evaluation and Sparse Design of Partial Discharge Ultrasonic Array Sensor. Ph.D. Thesis, North China Electric Power University, Beijing, China, 2014. [Google Scholar]
  23. Song, S.P.; Li, Y.X.; Dogandzic, A. Atomic Library Optimization for Pulse Ultrasonic Sparse Signal Decomposition and Reconstruction. In Proceedings of the 42nd Annual Review of Progress in Quantitative Nondestructive Evaluation (QNDE), Minneapolis, MN, USA, 26–31 July 2015. [Google Scholar]
  24. Determe, J.F.; Louveaux, J.; Jacques, L.; Horlin, F. On the Noise Robustness of Simultaneous Orthogonal Matching Pursuit. IEEE Trans. Signal. Process. 2017, 65, 864–875. [Google Scholar] [CrossRef]
  25. Huber, P.J. Projection pursuit. Ann. Stat. 1985, 13, 435–475. [Google Scholar] [CrossRef]
  26. Klinke, S.; Grassmann, J. Projection pursuit regression. J. Am. Stat. Assoc. 2012, 76, 817–823. [Google Scholar]
  27. Hao, S.P. Chaotic Monkey Algorithm and Its Application. Master’s Thesis, Tianjin University, Tianjin, China, 2010. [Google Scholar]
  28. Li, J.S.; Luo, Y.F.; Li, J.H.; Li, Y.M. The study of phased-ultrasonic receiving-planar array transducer for PD location in power transformer. Electr. Rev. 2011, 324–328. [Google Scholar]
Figure 1. The 9-element square ultrasonic array structure sketch map.
Energies 10 00593 g001
Figure 2. The flow chart based on matching pursuit direction of arrival (DOA) estimation.
Energies 10 00593 g002
Figure 3. Schematic diagram of the three array cross location.
Energies 10 00593 g003
Figure 4. The partial discharge (PD) detection experiment system structure diagram.
Energies 10 00593 g004
Figure 5. Model and physical aspect of a single array element. (a) The form composition of element of the PD ultrasonic array sensors; and (b) the picture of element of the PD ultrasonic array sensors.
Energies 10 00593 g005
Figure 6. Nine-yuan square ultrasonic array sensor.
Energies 10 00593 g006
Figure 7. Nine channel ultrasonic signal waveforms.
Energies 10 00593 g007
Figure 8. The accuracy of array direction finding is 10° in position 1. (a) Three-dimensional map; and (b) contour map (the color is proportional to surface height, and dark red represents the highest point).
Energies 10 00593 g008
Figure 9. The accuracy of array direction finding is 1° in position 1. (a) Three-dimensional ma; and (b) contour map (the color is proportional to surface height, and dark red represents the highest point).
Energies 10 00593 g009
Figure 10. The accuracy of array direction finding is 0.1° in position 1. (a) Three-dimensional map; and (b) contour map (the color is proportional to surface height, and dark red represents the highest point).
Energies 10 00593 g010
Figure 11. The location map.
Energies 10 00593 g011
Table 1. The results of direction finding algorithm based on matching pursuit (MP).
GroupSensor PositionTheoretical AngleDirection AngleThe Three Array Positioning ResultError
(cm)(°)(°)(cm)(cm)
1(45, 0, 20)(36.9, 32.0)(35.7, 31.2)(67.7, 17.6, 63.3)5.0
(80, 0, 20)(135.0, 27.9)(134.0, 26.7)
(0, 30, 40)(167.0, 73.3)(167.6, 74.6)
2(55, 0, 35)(56.3, 35.8)(57.2, 35.0)(62.1, 12.0, 57.0)5.1
(0, 25, 35)(163.0, 69.8)(162.1, 68.6)
(45, 0, 20)(36.9, 32.0)(35.8, 31.0)
3(0, 45, 45)(155.2, 78.2)(154.3, 79.4)(62.3, 18.8, 62.4)5.3
(70, 0, 45)(108.3, 46.5)(109.5, 47.0)
(45, 0, 40)(56.3, 51.4)(55.6, 52.5)
4(55, 0, 45)(56.3, 50.3)(55.2, 51.1)(61.6, 17.2, 63.7)5.5
(0, 40, 25)(158.9, 63.3)(159.8, 64.5)
(45, 0, 20)(36.9, 32.0)(37.8, 30.4)
5(55, 0, 35)(56.3, 35.8)(55.6, 34.5)(63.6, 12.2, 64.1)5.2
(70, 0, 35)(108.3, 32.3)(107.1, 31.2)
(0, 40, 20)(158.9, 60.1)(158.1, 61.4)

