
Optimization of Hybrid Energy Storage Systems at the Building Level with Combined Heat and Power Generation


1
Department of Electrical Engineering, Northeast Electric Power University, Jilin 132012, China
2
Department of Electronic and Electrical Engineering, University of Bath, Bath BA2 7AY, UK
*
Author to whom correspondence should be addressed.
Energies 2017, 10(5), 606; https://doi.org/10.3390/en10050606
Submission received: 20 March 2017
/
Revised: 24 April 2017
/
Accepted: 25 April 2017
/
Published: 1 May 2017
(This article belongs to the Section D: Energy Storage and Application)
Abstract
:The average daily benefit to cost ratio of a building energy storage system is mainly constrained by the battery lifetime. This paper aims to minimize the average daily cost of a hybrid energy storage system (HESS) (comprised of a battery and supercapacitor) by optimizing the battery capacity. A novel optimization model is proposed with the objective to find the minimum average daily investment cost of the HESS. The objective function has two parts: (1) the investment cost formula for the battery is derived as a function of the battery capacity, which has an interdependence with the minimum state of charge (SOC) and the maximum discharge current; (2) the investment cost formula for the supercapacitor is also established as a function of battery capacity by matching the maximum battery power with that of the supercapacitor. Case studies demonstrate several ways to increase the average daily benefit to cost ratio: (1) adopting a suitable control strategy to avoid capacity saturation; (2) reducing the battery SOC to increase the threshold for the maximum discharge current (MDC) saturation; and (3) increasing MDC to raise the threshold for the SOC saturation. Results show that the average daily benefit to cost ratio is doubled compared to previous work.
1. Introduction
At present, energy consumed at the domestic building level is one of the major forms of global energy consumption [1]. The UK government aims to reduce carbon emissions by 80 percent by 2050 compared with 1990 levels [2,3]. Reducing the energy consumption at the building level through increased efficiency is an important aspect of meeting such targets.
As a key component of future smart buildings, battery energy storage systems (BESS) are well suited to domestic buildings due to their relatively safe, silent, scalable, low maintenance, and efficient characteristics [4], which can also be used to shave peak demand and shift load [5].
Erroneous battery sizing will can reduce battery lifetime, decrease system benefits and increase carbon emissions [6,7]. Also, an inappropriate BESS control strategy will further reduce battery lifetime and result in sub-optimal system benefits [6]. Moreover, selecting the right type of battery for domestic buildings is crucial [8].
The most mature battery technology is the lead acid battery, which is widely used in many applications, for example, in Uninterruptible Power Supply (UPS) systems, Electric Vehicle (EV) systems and distributed energy generation systems [9]. Nevertheless, these batteries have many drawbacks, such as short life cycles, temperature limitations and current limitations [10]. The main emphasis of this research is to maximize the life cycle of a lead acid BESS without decreasing system stability and overall benefit.
Many studies have analysed how to minimize the limitations of battery storage systems and extend battery lifetime. In previous literature, state of charge (SOC), installation capacity, maximum discharge current, discharge voltage imperfection, operation temperature and battery system control strategy were all shown to have a significant influence on battery lifetime.
In [10,11,12], it was shows that the battery lifetime and the number of cycles are closely influenced by the SOC. Reference [12] revealed that if the SOC is 50%, discharging 1 Ah electricity is equivalent to discharging 1.3 Ah of electricity over its whole lifetime. Moreover, in [13] the total cumulative battery lifetime of several lead acid batteries was shown to vary with different minimum SOC. The lifetime of the battery significantly decreases if an undersized, low capacity battery is installed in a large power system. Increasing the capacity of the battery can allow it to operate at a higher SOC, which will increase battery lifetime. However, at the building level, an energy storage system is always limited by its physical size and installation capacity.
In [14] the actual battery capacity is demonstrated to be less than the rated battery capacity if the discharging current (in A) is higher than one tenth of the rated battery capacity (in Ah) and decreases non-linearly as the discharging current increases. Also in [11], if the battery is always operated with heavy discharge currents, the battery discharge efficiency will decline and result in reduced life span of the battery.
As seen in [15], battery capacity will reduce if it is operated under low temperature conditions. It is also well known the lifetime of the battery will decrease and the standby loss will increase if the battery is operated at relatively high temperatures [16]. However, if the battery is installed in a ventilated room and the ambient building temperature is stable and suitable for the specific battery, the operating temperature will have less influence.
Although the battery output voltage imperfection can affect the battery operation, in many studies, it is always assumed that the output voltage of the battery is constant. However, in reality the output voltages are different for different discharge currents and discharge times. Considering that the difference is very small [17] and the battery discharge voltage imperfection model is normally used to model a dynamic system, the battery output voltage imperfection is excluded in this paper.
Different control strategies also exert an influence on battery use. In [15], using two groups of batteries to meet the demand instead of one battery is preferable, however, considering that the physical size and installation cost of energy storage systems are strictly limited in domestic building, only one battery is considered in this paper.
To compensate for the disadvantages of batteries, a recent development has been the addition of supercapacitors to produce a form of hybridized energy storage system (HESS). In contrast with batteries, supercapacitors have relatively low energy density but higher power density. Supercapacitors can be used to offer pulse power in hybrid energy storage systems. Because no chemical reaction takes place, the lifetime of supercapacitors is extremely long compared with batteries. The life span of supercapacitors can reach one million cycles [18,19]. Thus, in many industrial applications, the life of supercapacitors is not limited by cycling stress [19].
In addition, supercapacitors can respond very quickly to sudden changes of demand. For this reason, they are often used to smooth the load curve and let the battery discharge current change slowly. It has the benefit of improving power quality and decreasing the stress on the battery system, which can extend the life of the battery to some extent [9].
Finally, the installation cost of the supercapacitor is very expensive, but the maintenance fee is quite low (almost zero). In order to make full use of the supercapacitor capacity, correctly sizing the capacitor for the application is clearly important [10,20].
Therefore, to ensure best building energy performance, selecting and sizing suitable energy storage equipment together with designing effective control algorithms demands a whole system level approach and as such, is a crucial research area. To the best knowledge of the authors, this paper presents the first study to optimize the daily average daily benefit to cost ratio of HESS accounting for the three key factors: SOC, maximum discharge current and HESS capacity.
The main contributions of this paper are: (1) three key factors (SOC, discharge current and HESS capacity) are comprehensively considered for the optimization; (2) the main novelty is formulating all parameters in terms of the battery capacity for a given SOC and discharge current, by doing which an optimal operating region can be defined which is shown in Section 5; (3) using this approach the average daily benefit to cost ratio of the HESS is shown, in an example case study multi-energy system, to significantly increase by a factor of two compared to the previous work [1].
The rest of this paper is organized as follows: in Section 2, a case study of a building is introduced and its energy infrastructure, load data and dynamic energy supply tariff models are discussed. Section 3 illustrates how to formulate all the factors that can potentially affect HESS cost in terms of the battery capacity to optimize the average daily cost of HESS. Section 4 proposes a simple, practical control scheme to evaluate the performance of the proposed method shown in Section 3. Section 5 and Section 6 show the results of simulation and discusses the results of simulation, respectively. The conclusions will be drawn in Section 7.
2. System Definition
In this paper, a hybrid energy storage system has been designed for a detached domestic building in the UK of approximately 30 years in age, occupied by four people. Daily electricity consumption in this building was randomly generated by the CREST electricity model [21]. The model was used to generate 50 sets of load data for each month to produce realistic averages. Daily heat consumption in this building was generated by the model developed by Strathclyde University [22]. The gas price is based on current UK domestic gas price which is around 5 pence/kWh, and the electricity tariff is obtained from [23], which proposes a dynamic system of tariffs that vary on a half hourly timescale. The daily electricity price in each 30 min for different seasons is shown in Figure 1.
Compared with the conventional building, in this building, electricity can be obtained directly by the grid, and heat can be obtained from the gas grid via a boiler which burns gas to generate heat with the overall heat efficiency is assumed to be 88% [24]. Adding a high cost, high efficiency energy generator—a micro-CHP unit—in the building represents the main distinction from a conventional building. There are three main types of micro CHP technologies: Stirling engine CHP, internal combustion engine CHP and fuel cell CHP. All of them can utilize primary energy for power generation to cover domestic electric demand according to the principle of cascade utilization of energy. Meanwhile, the waste heat produced in the progress of power generation will be recovered for supplying heat demand. Even though it consumes gas, the high output efficiency by virtue of co-generation makes it a promising technology for increasing overall household energy efficiency. Compared to renewable energy, CHP is more stable and controllable, and moreover it can generate heat and electricity simultaneously. In this paper, the rated power of CHP is 3 kW, the heat efficiency is 66% and the electricity efficiency is 22% [25].
The energy storage system in this building is comprised of three technologies. The lead-acid battery and the supercapacitor are used to store electrical energy and a hot water tank is used to store heat. Overall efficiencies of the battery, supercapacitor and water tank are assumed to be 80%, 98% and 70% respectively [9]. Standby loss of the battery is 2% per month [1]. Although the standby loss of the water tank varies depending on ambient building temperature and its construction, it is assumed to be fixed at 25% per day for simplicity in this paper. The standby loss of the supercapacitor is ignored because of its low self-discharge rate. Figure 2 shows the energy carriers and the layout of energy infrastructure in the building and all parameters and values used through the paper have been summarized in Table 1.
3. HESS Optimization
3.1. Battery System Optimization
3.1.1. Optimization Function for Battery System
The battery’s installation cost and maintenance cost are directly proportional to the capacity of the battery and inversely proportional to the battery life span. The average daily cost of the battery storage system can be written as:
In Equation (1), Cb is the average daily cost of the battery storage system, Cbi is the unit price of the battery, and Cbm is the annual maintenance cost of battery. If the currency exchange between the UK pound and US dollar is 1.5 and the output voltage of battery storage system is 1 V, then Cbi and Cbm are approximately equal to 0.534 £/Ah and 0.1522 £/kAh [10]. Y is the life span of HESS in years, and Qb is the battery capacity in Ah. TL is the life span of HESS in days.
In previous sections, it has been mentioned that the life span of the battery can be greatly influenced by the battery’s minimum SOC and capacity. Thus, the life span (Y & TL) is a function of SOC and capacity. On the other hand, the effective battery capacity will reduce with the increase of battery discharge current. In other words, in order to increase discharge current without reducing the effective battery capacity Qeb, the installation battery capacity Qb needs to increase. Different constraints can lead to different optimization results.
3.1.2. Constraints
A. Discharge Current
As shown in [14], when the discharge current is greater than one tenth of battery capacity, the ratio of maximum discharge capacity and rated capacity will be less than 100%. The relationship between installation battery capacity Qb and effective battery capacity Qeb can be summarised as:
α is a scaling factor of effective battery discharge capacity and battery rated capacity. The value of α can be acquired from [14], for different maximum discharge currents. In this paper, seven discrete maximum discharge currents also presented in [14] will be used to analyse how battery discharge currents affect battery system average daily cost.
B. SOC and Battery Capacity
SOC and battery capacity are both parameters that have an influence on the battery life span. Normally battery life span in days can be expressed as:
where Qa is the cumulative capacity of batteries, Qd is the daily effective battery capacity consumption. SOC will affect Qa and battery capacity can have an influence on Qa and Qd.
As mentioned in the earlier, by limiting the depth of SOC, the cumulative capacity of batteries can be significantly improved. Thus Qa is a function of battery capacity and depth of SOC. Thus:
In (4), β is a scaling factor of battery cumulative capacity and battery rated capacity. In [26], the cycle numbers of a lead-acid battery are 200 to 225, 425 to 450 and 1200 to 1300 when the minimum SOC is limited as 0%, 50% and 70%, respectively. In this paper, the number of cycles of a lead-acid battery for deep discharge (minimum SOC = 0), medium discharge (minimum SOC = 50%) and light discharge (minimum SOC = 70%) are set as: 225, 450 and 1300. The scaling factor β can be represented as:
In (5), i is used to represent the type of discharge, for example, if i = 70, the battery is operated as a light discharge model and the minimum SOC of battery is 70%. N is the number of discharge cycles at given i and Q(SOC) is a function of effective weighting factor of the battery at different SOC. From [11], Q(SOC) can be approximately modelled as:
Similar to (4) and (5), the daily effective battery capacity consumption can be expressed as:
In (7), n is the number of full discharge cycles in a day. This is usually equal to 1, but in some extreme cases, n can be very large (for example, if the battery installation capacity Qb is very small) although this is not practical for a building level HESS so high n values will not be considered. SOC = peak% is the maximum SOC that the battery can reach. When the battery capacity increases beyond a certain point, the battery cannot be fully charged and will always work at a relatively low SOC, which will increase daily effective battery capacity consumption. Figure 3 demonstrates how battery capacity affects the system operation.
By combining Equation (1)–(7), the average daily cost of the battery storage system can be derived as:
The average daily cost of battery storage system can now be formulated as a function of just the battery capacity for a given SOC and discharge current.
3.2. Supercapacitor System Optimization
Like the battery storage system, the supercapacitor can be used to supply energy for the electrical system. However, the installation cost of the supercapacitor system is much higher than the battery system so it is not desirable to store large amounts of energy using the supercapacitor. Instead, the supercapacitor can respond quickly to load changing and smooth the load curve seen by the battery.
To give sufficient time for the battery to reach a new balance, the supercapacitor should have the ability to offer the same level of power as the battery for a short period of time. The maximum output power that the battery can offer is:
where Pmax is the maximum output power of the battery, Vb is the battery output voltage and Imax is the maximum discharge current of battery. As mentioned in the previous section, Imax is a function of battery installation capacity, which can be represented as:
In (10), μ is a time scaling factor, which represents the minimum time to fully discharge a battery. Thus, the maximum output power of the supercapacitor should be equal to the maximum output power of battery, which is:
The capacitance of the supercapacitor (Qs) can be written as (12) [27]:
where i is the average current, dV is the difference between maximum supercapacitor operation voltage and minimum supercapacitor operation voltage, dt is the discharge time and τ is the time constant of the supercapacitor. For BCAP1500, τ is 0.7 s [27]. To be more specific:
In (13) and (14), imaxs and imins are the maximum output current of the supercapacitor and the minimum output current of the supercapacitor, Vmax and Vmin are the maximum output voltage and the minimum output voltage of the supercapacitor and V0 is the HESS operation voltage.
When sizing the supercapacitor, for the supercapacitor chosen in this HESS (BCAP1500), all the parameters are constants except the supercapacitor’s maximum output power. The size of the supercapacitor is therefore directly proportional to its maximum output power. However, the maximum output power of the supercapacitor system can be influenced only by the battery installation capacity at the given maximum battery discharge current. Thus, the size of the supercapacitor only depends on the battery installation capacity when the type of supercapacitor, HESS and the maximum battery discharge current are given.
The average daily cost of the supercapacitor system is proportional to the total cost of the supercapacitor and inversely proportional to the life cycles of the HESS, so the average daily cost of the supercapacitor (Cs) can be expressed as:
In (15), Csi and Csm are the unit installation cost of the supercapacitor and the annual maintenance costs of the supercapacitor. At present exchange rates (£ against $), Csi is 0.5 £/F and Csm is 0.007 £/F [9]. Qs is the supercapacitor installation capacity, which is proportional to the battery installation capacity. Y and TL is the life span of the HESS in years and in days. The value of Y and TL depend on the life span of battery system, because the life span of the supercapacitor system is much longer than the battery. So the average daily cost of supercapacitor (Cs) only relates to battery capacity (Qb).
Therefore, the whole system optimization problem becomes finding the minimum average daily system cost (C) at the given total daily energy cost saving, Es. The objective function is:
In (16), Cb and Cs are average daily costs of the battery storage system and supercapacitor. From the previous analyses, the minimum average daily cost will only be influenced by battery capacity, if the type of supercapacitor, maximum battery discharge current and minimum battery SOC are given.
4. System Control Strategy
Clearly the choice of system control strategy has an effect on the daily energy cost saving. However, this must be fixed in order to quantify the effect of battery capacity on daily benefit to cost ratio. This section therefore proposes a simple, practical control scheme to evaluate the results of formulating all variables in terms of the battery capacity.
Considering the fact that the imported electricity price is much higher than the gas price and heat demand is much greater than the electricity demand, it is preferable to control CHP based on the electricity demand rather than heat demand for three reasons: to minimize redundant electricity, to obtain cheaper electricity from the CHP (than from the grid) and because heat via the boiler is more efficient in terms of specifically gas to heat conversion.
4.1. Electricity System Control Strategy
As shown in Figure 1, in each season, there are two high electricity price periods and three low electricity price periods every day. (In this paper, the low electricity price periods are defined as the time periods whose electricity prices are generally lower than the highest electricity price periods. Therefore, within a low electricity price period, electricity prices can be different.) These five time periods can be defined as: H1, H2, L1, L2 and L3, and are shown in Figure 4. Since low price periods cover any tariff lower than the highest price there are both low and medium tariffs in L1.
4.1.1. Electricity System Control Strategy for H1 and H2
There are two periods in a day (H1 and H2) where the electricity tariff is obviously higher than the rest of the day. In order to reduce system operational cost and maximize system benefit, there is no doubt that less electricity should be imported from the grid at this time. Therefore, at H1 and H2, electricity should be supplied by the CHP and the HESS as much as possible. The output of the HESS can be limited by battery discharge current and minimum SOC at this time.
4.1.2. Electricity System Control Strategy for L1 and L2
On the other hand, the electricity price is quite low in L1 and L2, ostensibly presenting an ideal time to use the electricity from the grid to charge the HESS. However, in this paper, instead of charging the HESS from the grid, the HESS is charged by the CHP at this time. There are two reasons behind this policy, the first being cost efficiency. Even though electricity price at L1 is low, compared with the cost electricity generated by CHP, it is still high. The second reason is energy efficiency is improved. In [28], energy losses due to power transmission and distribution are 7%. If more energy can be generated locally by CHP, energy losses due to power transmission and distribution can be reduced. Moreover, the emissions factor of gas is generally less than electricity in many countries due to the use of coal and oil based generation and system losses so there is also an environmental benefit. Thus, at L1 and L2, the CHP is switched on to supply the loads and charge the battery. In this period, if the electricity demand is lower than the power generated by the CHP, the excess electricity generated by CHP will be stored. If the demand is higher than the power generated by CHP, the difference between the generated power and the demand will be supplied by the grid.
4.1.3. Electricity System Control Strategy for L3
As mentioned before, if the system’s electricity demand can be supplied by the CHP rather than the grid, the electricity cost can be reduced, and system transmission and distribution losses will also be reduced. However, in order to reduce redundant electricity generated by the CHP and make the battery discharge to the initial value at the beginning of the day, the CHP should be turned off. Thus, from the start of L3 to the 40 min before the end of the day, the electricity control strategy is the same as H1 and H2. For the last 40 min, the CHP is switched off and the electricity demand will be supplied by the HESS. In this period, if the output of the HESS is limited by the discharge current and the minimum SOC of the battery, the difference between the HESS output and demand will be supplied by the grid. Considering BESS economical and robust operation, the last 40 min is chosen as the time to discharge battery SOC to initial value at the beginning of the day. Through simulation validation, it reveals that BESS cannot reach initial SOC if CHP is switched off later than the last 40 min of the day. However, system benefit will decrease, if CHP is switched off earlier than the last 40 min of the day. Table 2 is used to show system daily electricity operation.
4.2. Heat System Control Strategy
Heat is generated by gas in the building (no matter whether generated by CHP or boiler), and the gas price is relatively low and stable compared with the electricity price. In addition, heat storage overall efficiency is quite low and standby losses are much higher than the electricity storage system. Thus, it is preferable for the heating system to not store heat in advance. However, the CHP may generate redundant heat when it is used to generate electricity, so only this portion of heat will be stored. Considering the high standby loss of the heat storage system, the energy stored in the water tank should be utilized as soon as possible. By following this system control strategy, the daily energy cost saving will be:
In Equations (17) and (18), Es is total daily energy cost saving in pence, Pet and Pht are electricity energy demand and heat energy demand in each minute, Cet and Cgt are the electricity price and gas price in each minute respectively. Pmet and Pmht are energy supplied by the grid and energy supplied by the boiler in each minute. The boiler’s efficiency ηh and K(t) is the state of CHP. To compensate maximum daily energy saving (shown in (17)) and minimum average daily system cost (shown in (16)), this work will attempt to optimize the battery capacity when average daily energy saving is approximately 95% of its maximum value.
5. Results
Results were calculated with the battery output voltage and the maximum supercapacitor output voltage set to be 24 V, which is equal to the HESS operation voltage. The minimum supercapacitor output voltage was set as 12 V. The maximum discharge time for the supercapacitor was 10 s (i.e., the BCAP1500, with a time constant of 0.7 s). Twenty-one different scenarios (three types of SOCs and seven types of maximum discharge currents) are displayed to show how SOC, discharge current and battery capacity affect the average daily cost of HESS. By comparing with different cases, the best system combination of system parameters can be determined.
5.1. Battery System Optimization
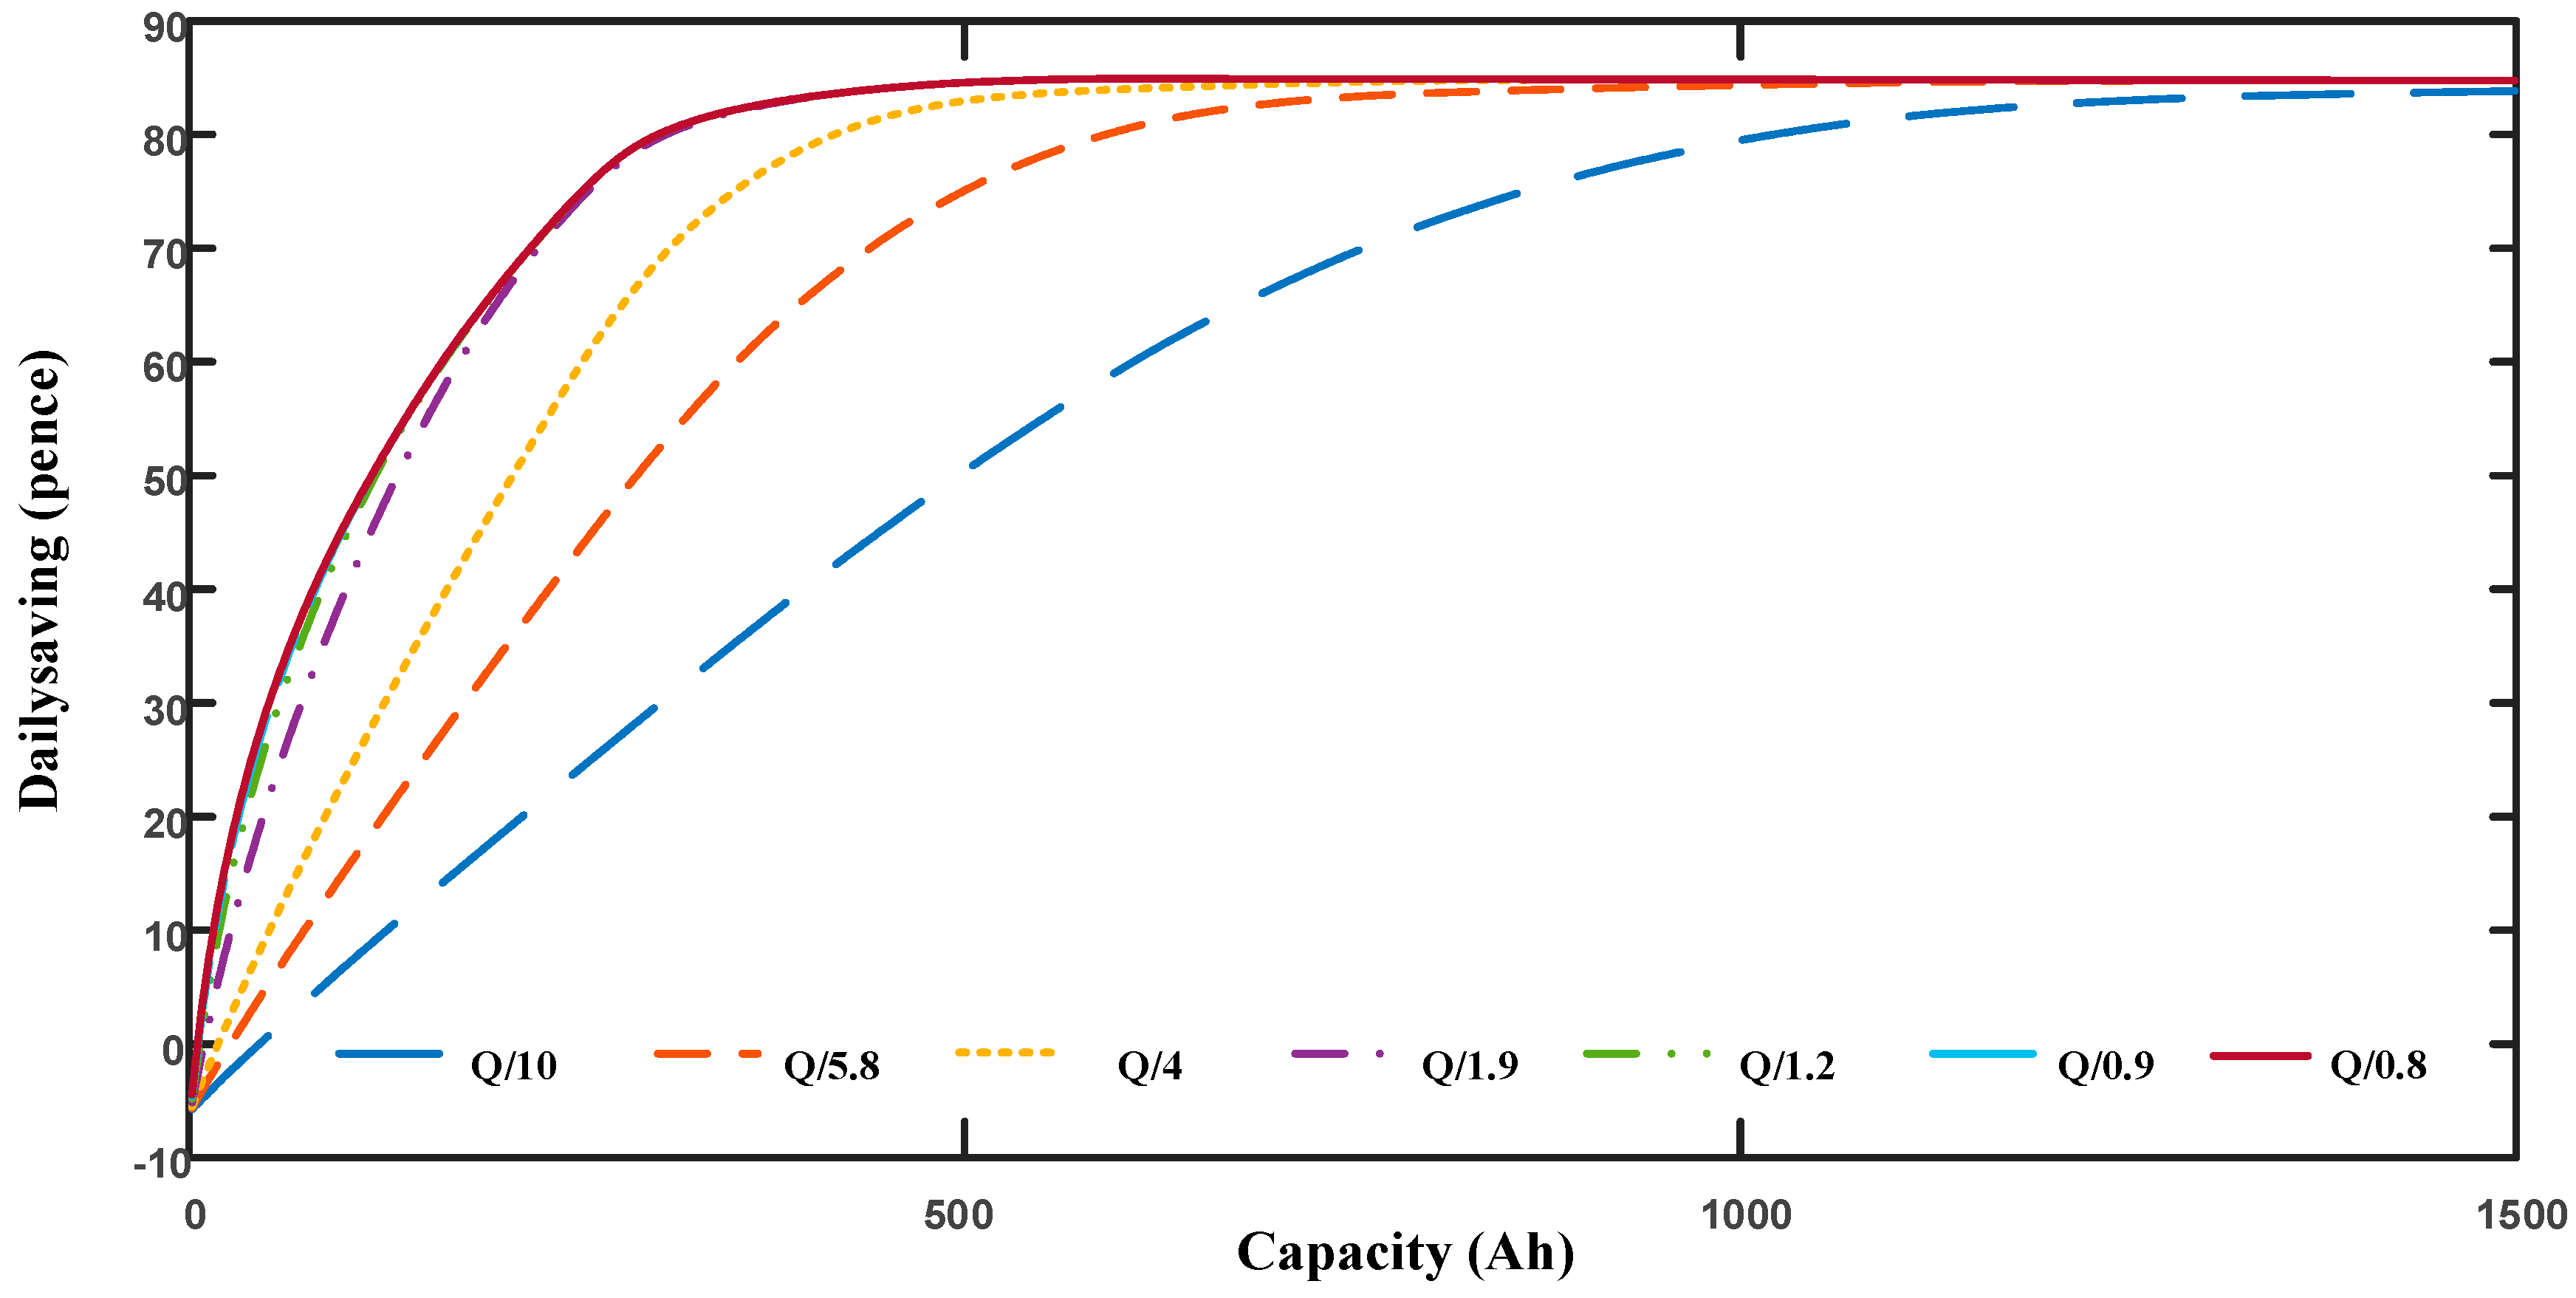
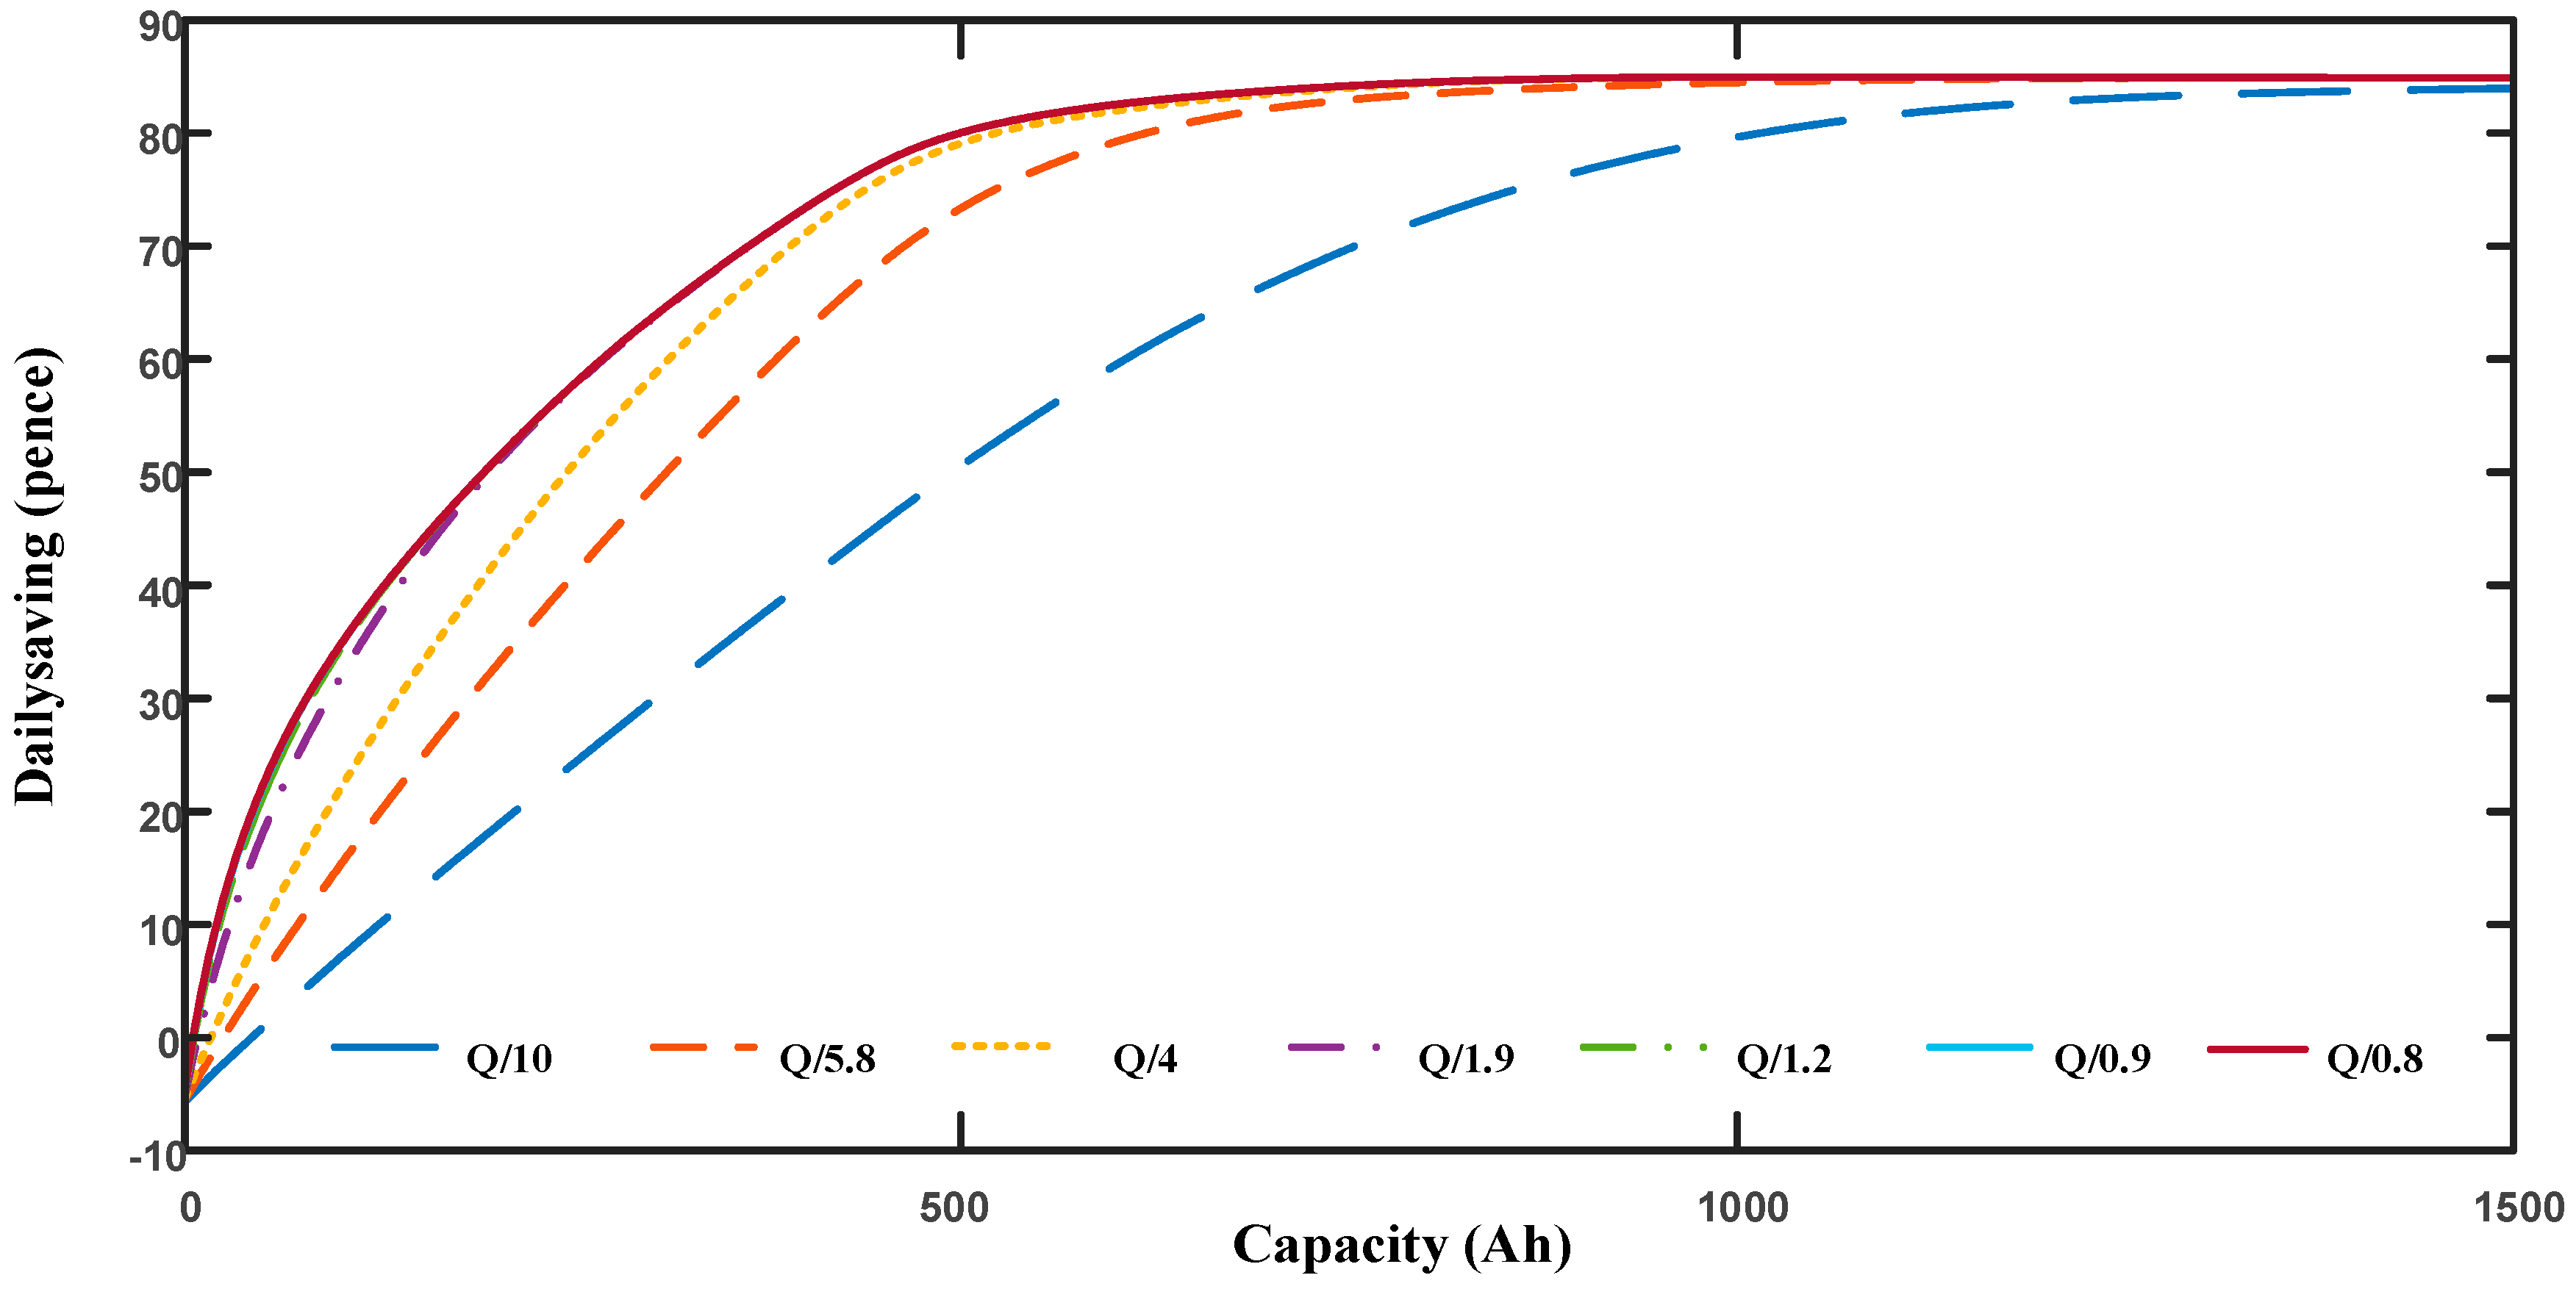
Figure 5, Figure 6 and Figure 7 show the daily energy cost saving with the control strategy mentioned in Section 4. However, the depth of battery discharging is different in the three figures. Figure 5, Figure 6 and Figure 7 are used to model deep discharge scenario (minimum SOC = 0%), medium discharge scenario (minimum SOC = 50%) and light discharge scenario (minimum SOC = 70%).
5.2. Average Daily HESS Cost
It is well known that with current technology, the average daily cost of the HESS is much higher than the average daily saving. In previous work, the average daily cost of HESS is about 14.5 times higher than the average daily saving [1]. Because the HESS can reduce the burden of the grid at peak demand time, and increase the allowable penetration of fluctuating renewable generation, governments are likely to increase subsidies on building level storage, such as the domestic HESS in order to meet emission reduction targets. Moreover, with the improvement of energy storage technology, the installation cost of the overall system will be significantly decreased in future, and is likely to go beyond breakeven point with effective control schemes.
As mentioned in Section 4.2, to compensate maximum daily energy saving and battery operation cost, the following work will attempt to optimize the battery capacity when average daily energy saving is approximately 95% of its maximum value, which is 80 pence in Figure 5, Figure 6 and Figure 7. Table 3 is used to show the average daily cost of different discharge currents under light discharge scenarios.
In order to illustrate how SOC influences system operation, Table 3 is used to show the optimized HESS at different SOCs. From Table 3, it is clear that for a light discharge scenario, the minimum average daily cost of the HESS can be acquired when maximum discharge current is set as Q/5.8. At this time, the effective battery capacity is 624 Ah and installation battery capacity is 726 Ah. The supercapacitor capacity is 144 F. The average daily cost of the battery system and supercapacitor system are 6.83 and 0.06 £/day. The average daily cost of HESS mainly depends on the battery system. From Table 3, it is also obvious that when discharge current is greater than Q/1.9, the effective battery capacity is the same, which is due to discharge current saturation.
The results in Table 4 show that for different SOCs, the best discharge current for the HESS is different. This means in order to get the global minimum average daily cost for HESS, discharge current and SOC should be adjusted comprehensively. In this case, for a small building, the global minimum average daily cost of the HESS is £6.89. The depth of discharge of battery is light and the best discharge current is Q/5.8.
6. Discussion
Simulation results show that the design of battery capacity, SOC and discharge current has significant meaning for optimising of HESS at building level with combined heat and power generation. Oversizing HESS capacity and inappropriate control strategy can reduce system benefit.
6.1. Capacity Saturation
Figure 5, Figure 6 and Figure 7 show that with the increase of the battery capacity the average daily energy saving will reach the saturation point. This saturation value, whereafter it is not influenced by the SOC and maximum discharge current, is the maximum daily energy saving. For the same system control strategy, the saturation value of daily energy saving will be the same. In this case, the maximum daily energy saving is 84.7 pence, which is about 18.9% energy cost reduction. In order to improve daily energy saving saturation beyond this value, a more advanced control strategy is required.
6.2. SOC Saturation
By comparing Figure 5, Figure 6 and Figure 7, the average daily saving curves are the same for different SOC tests, if discharge current is set as one tenth of battery capacity. However, with the increase of discharge current, the average daily saving curve will be different. In order to solve the SOC saturation problem, the system needs to operate at a higher discharge current.
6.3. Discharge Current Saturation
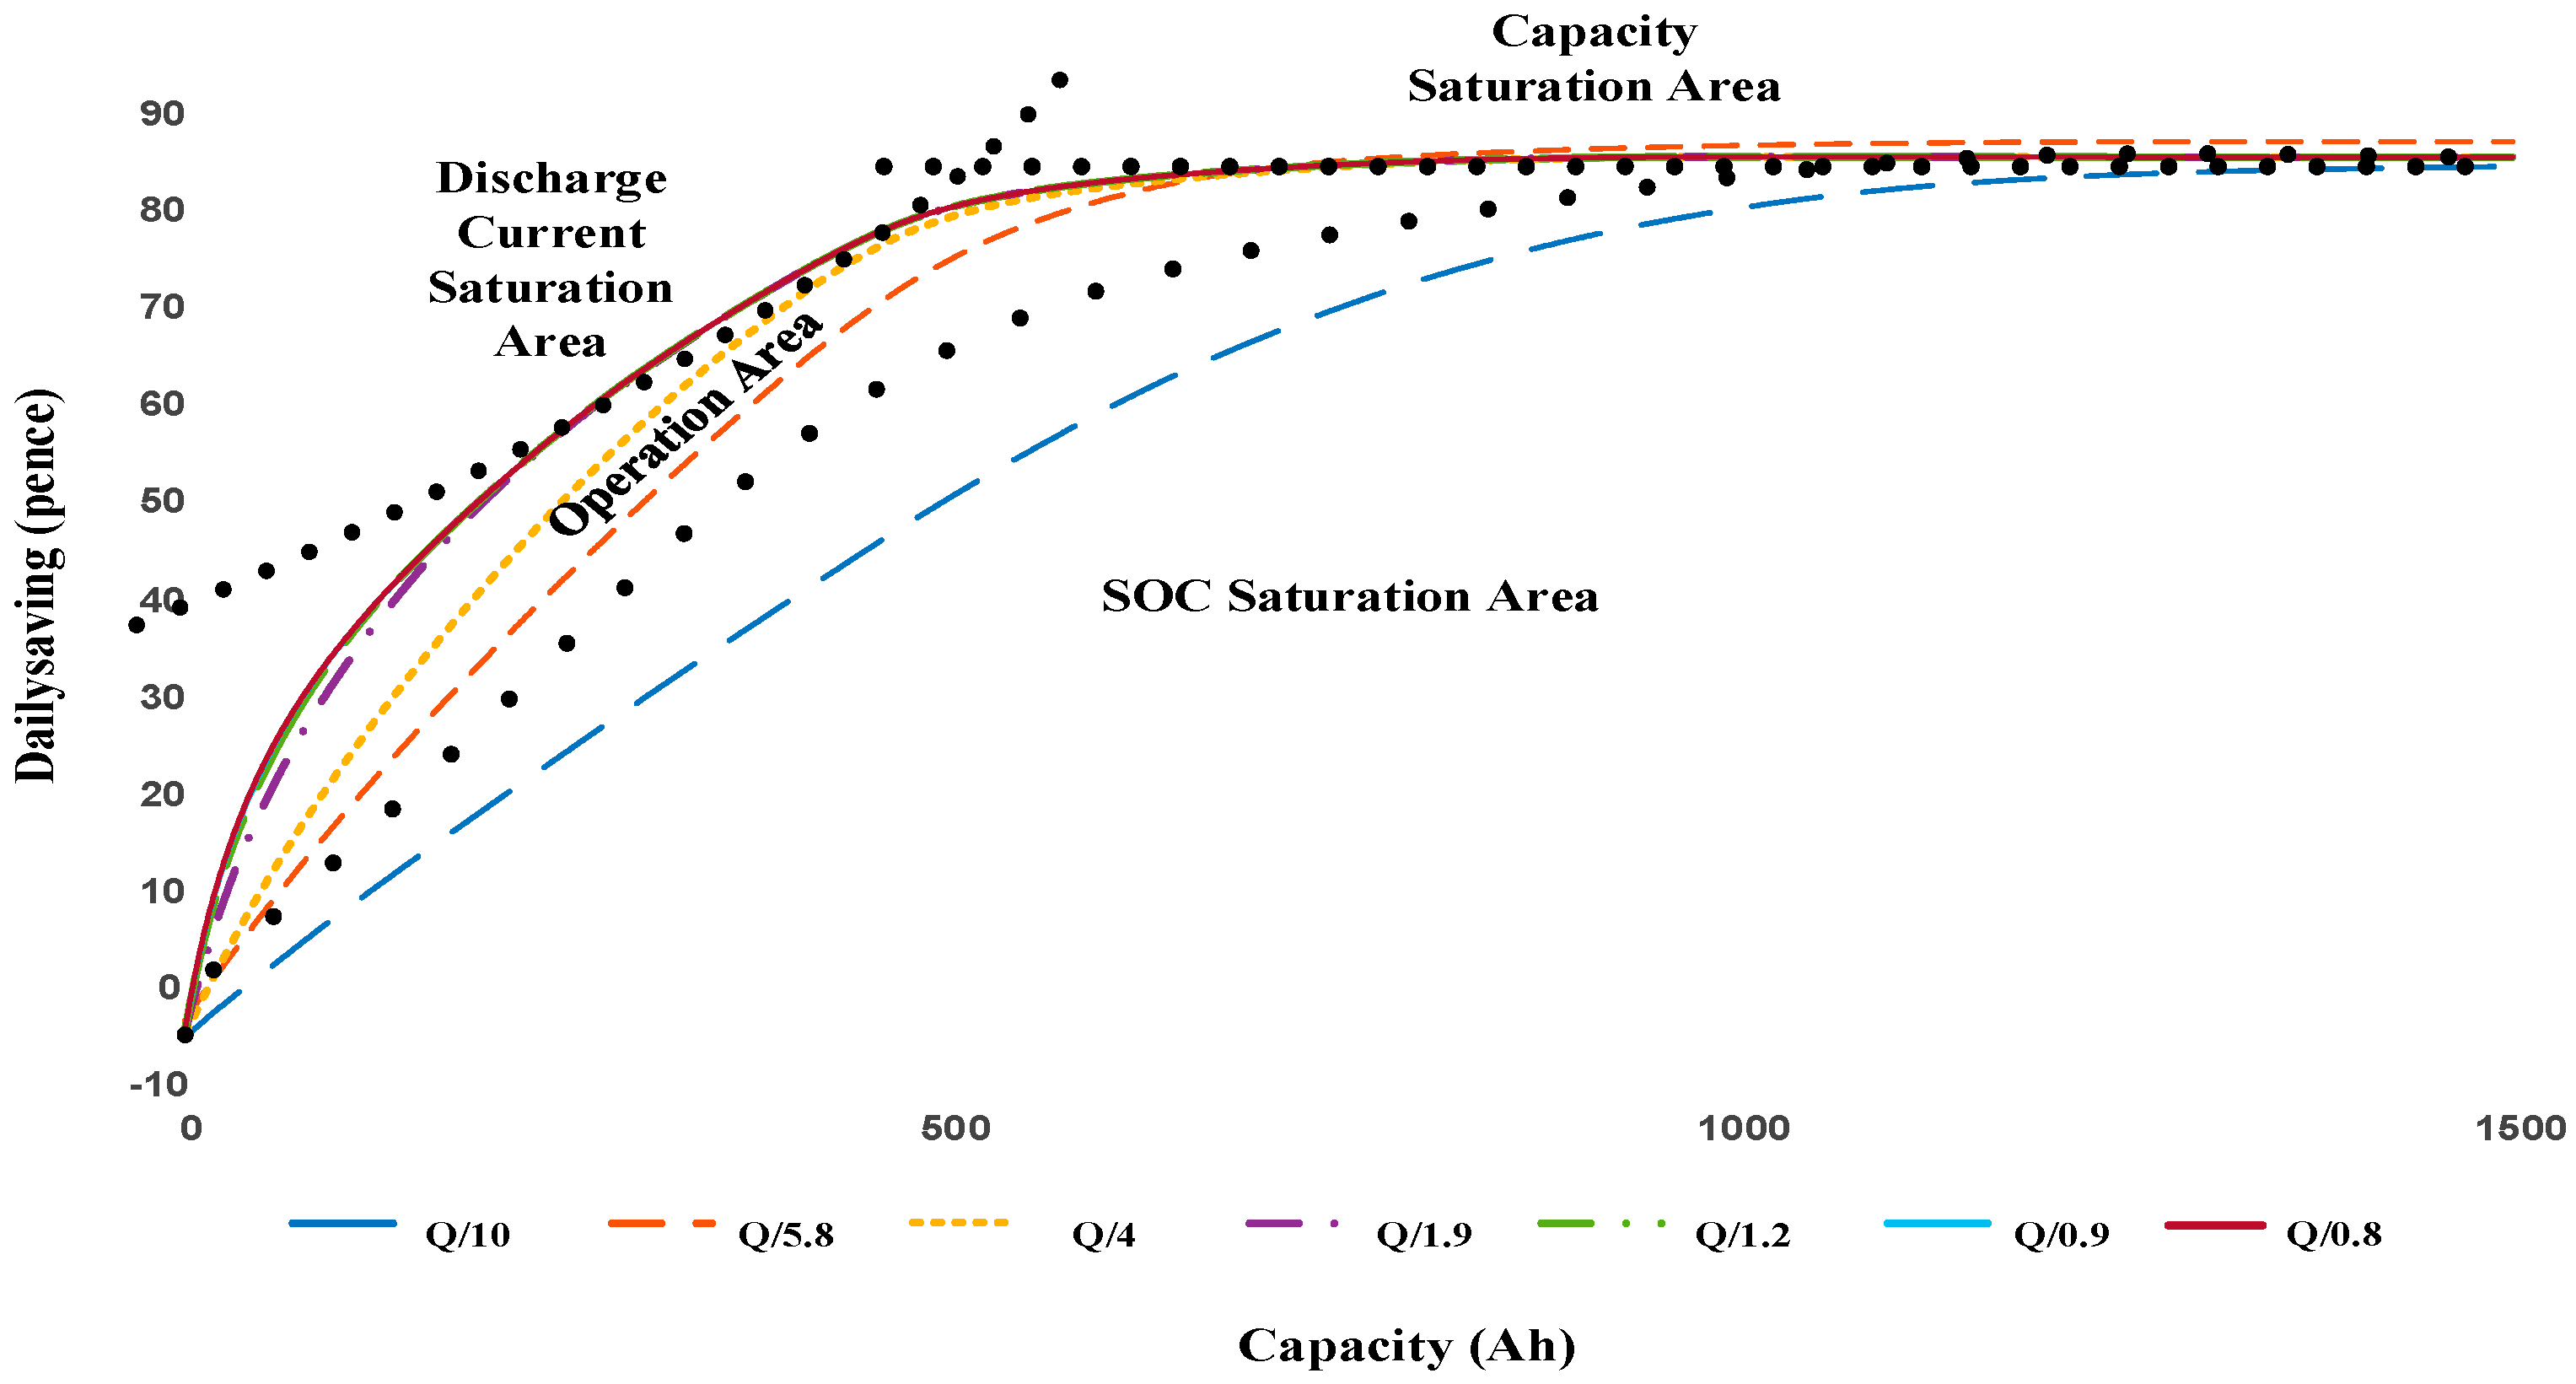
In Figure 7, when the discharge currents are higher than Q/1.9 and the battery capacities are higher than 216 Ah, the average daily saving is the same with different discharge currents. At this time, the best way to solve discharge current saturation is to decrease system minimum SOC. If system minimum SOC is decreased to 50%, the saturation value of discharge current becomes 259 Ah. Figure 8 shows the limitation of HESS operation. To make optimal use of the battery, an effective HESS should work in the operational area and avoid the saturation areas.
7. Conclusions
In this paper, a hybrid energy storage system at the building level is investigated, the factors that can influence HESS economical operation are analyzed, and a battery SOC and discharge currents control model is proposed. By applying this model, the daily investment of the HESS reduces to 7.6 times the HESS daily benefit, a twofold improvement of a smart building with battery storage system only and local low carbon generation. Even so, the daily cost of the system currently outweighs the benefit, by a factor of almost 8. However, when accounting for government subsidies and ongoing improvements in HESS technology, the economic case for storage at building level will rapidly become favorable.
The proposed optimization model for a HESS first shows three saturation factors that can influence system average daily saving. These three factors are battery capacity, maximum discharge current and SOC. To raise battery capacity saturation, a more precise system control strategy is required. To improve battery maximum discharge current saturation, the battery system needs to reduce the minimum SOC. To address the SOC saturation, the battery system needs to increase the maximum discharge current. A successful design should make full use of battery capacity and attempt to make the battery system work in the operational area without saturation caused by capacity, discharge current or SOC.
The proposed HESS optimization model also shows, different depth of battery discharges will lead to different optimized system discharge currents and different average daily costs of HESS for a given daily energy cost saving. For a small building, the best HESS system operation for the battery is light discharge and keeping the maximum discharge current about one sixth of the battery capacity.
Acknowledgments
The authors gratefully acknowledge the financial support of the University of Bath and the use of the facilities at Tsinghua University.
Author Contributions
Dongmin Yu and Simon Le Blond conceived and designed the simulation work of this paper; Huanan Liu and Gangui Yan analyzed the data; Jing Jiang wrote and typeset the paper.
Conflicts of Interest
The authors declare no conflict of interest.
References
- Mishra, A.; Irwin, D.; Shenoy, P.; Kurose, J.; Ting, Z. GreenCharge: Managing RenewableEnergy in Smart Buildings. IEEE J. Sel. Areas Commun. 2013, 31, 1281–1293. [Google Scholar] [CrossRef]
- Le Blond, S.; Li, R.; Li, F.; Wang, Z. Cost and Emission Savings from the Deployment of Variable Electricity Tariffs and advanced Domestic Energy Hub Storage Management. In Proceedings of the PES General Meeting|Conference & Exposition, National Harbor, MD, USA, 27–31 July 2014; pp. 1–5. [Google Scholar]
- UK Government. The Carbon Plan, Department of Energy and Climate Change. Available online: https://www.gov.uk/government/uploads/system/uploads/attachment_data/file/47613/3702-the-carbon-plan-delivering-our-low-carbon-future.pdf (accessed on 26 April 2017).
- Leadbetter, J.; Swan, L. Battery storage system for residential electricity peak demand shaving. Energy Build. 2012, 55, 685–692. [Google Scholar] [CrossRef]
- Agamah, S.; Ekonomou, L. Peak demand shaving and load-levelling using a combination of bin packing and subset sum algorithms for electrical energy storage system scheduling. IET Sci. Meas. Technol. 2016, 10, 477–484. [Google Scholar] [CrossRef]
- Balcombe, P.; Rigby, D.; Azapagic, A. Environmental impacts of microgeneration: Integrating solar PV, Stirling engine CHP and battery storage. Appl. Energy 2015, 139, 245–259. [Google Scholar] [CrossRef]
- Dufo-López, R.; Bernal-Agustín, J.L.; Yusta-Loyo, J.M.; Domínguez-Navarro, J.A.; Ramírez-Rosado, I.J.; Lujano, J.; Aso, J. Multi-objective optimization minimizing cost and life cycle emissions of stand-alone PV–wind–diesel systems with batteries storage. Appl. Energy 2011, 88, 4033–4041. [Google Scholar] [CrossRef]
- McManus, M.C. Environmental consequences of the use of batteries in low carbon systems: The impact of battery production. Appl. Energy 2012, 93, 288–295. [Google Scholar] [CrossRef]
- Kollimalla, S.K.; Mishra, M.K.; Narasamma, N.L. Design and Analysis of Novel Control Strategy for Battery and Supercapacitor Storage System. IEEE Trans. Sustain. Energy 2014, 5, 1137–1144. [Google Scholar] [CrossRef]
- Tianpei, Z.; Wei, S. Optimization of Battery-Supercapacitor Hybrid Energy Storage Station in Wind/Solar Generation System. IEEE Trans. Sustain. Energy 2014, 5, 408–415. [Google Scholar]
- Jenkins, D.P.; Fletcher, J.; Kane, D. Lifetime prediction and sizing of lead-acid batteries for microgeneration storage applications. IET Renew. Power Gener. 2008, 2, 191–200. [Google Scholar] [CrossRef]
- Bo, Z.; Xuesong, Z.; Jian, C.; Caisheng, W.; Li, G. Operation Optimization of Standalone Microgrids Considering Lifetime Characteristics of Battery Energy Storage System. IEEE Trans. Sustain. Energy 2013, 4, 934–943. [Google Scholar]
- Benini, L.; Bruni, D.; Mach, A.; Macii, E.; Poncino, M. Discharge current steering for battery lifetime optimization. IEEE Trans. Comput. 2003, 52, 985–995. [Google Scholar] [CrossRef]
- Papic, I. Simulation model for discharging a lead-acid battery energy storage system for load leveling. IEEE Trans. Energy Convers. 2006, 21, 608–615. [Google Scholar] [CrossRef]
- Hoxie, E.A. Some discharge characteristics of lead acid batteries. Trans. Am. Inst. Electr. Eng. Part II Appl. Ind. 1954, 73, 17–22. [Google Scholar] [CrossRef]
- Power-Sonic. Sealed Lead-Acid Batteries Technical Manual. Available online: http://www.power-sonic.co.uk/files/DA035%20-%20technical%20Manual%20(USA).pdf (accessed on 26 April 2017).
- Shuo, T.; Munan, H.; Minggao, O. An Experimental Study and Nonlinear Modeling of Discharge I–V Behavior of Valve-Regulated Lead–Acid Batteries. IEEE Trans. Energy Convers. 2009, 24, 452–458. [Google Scholar] [CrossRef]
- Gee, A.M.; Robinson, F.V.P.; Dunn, R.W. Analysis of Battery Lifetime Extension in a Small-Scale Wind-Energy System Using Supercapacitors. IEEE Trans. Energy Convers. 2013, 28, 24–33. [Google Scholar] [CrossRef]
- Linzen, D.; Buller, S.; Karden, E.; de Doncker, R.W. Analysis and evaluation of charge-balancing circuits on performance, reliability, and lifetime of supercapacitor systems. IEEE Trans. Ind. Appl. 2005, 41, 1135–1141. [Google Scholar] [CrossRef]
- Yonghua, C. Assessments of Energy Capacity and Energy Losses of Supercapacitors in Fast Charging Discharging Cycles. IEEE Trans. Energy Convers. 2010, 25, 253–261. [Google Scholar] [CrossRef]
- Richardson, M.T.I.; Infield, D.; Clifford, C. Domestic electricity use: A high-resolution energy demand model. Energy Build. 2010, 42, 1878–1887. [Google Scholar] [CrossRef]
- Steemers, R.Y.A.K. A method of formulating energy load profile for domestic buildings in the UK. Energy Build. 2005, 37, 663–671. [Google Scholar]
- Zhimin, W.; Chenghong, G.; Furong, L.; Bale, P.; Hongbin, S. Active Demand Response Using Shared Energy Storage for Household Energy Management. IEEE Trans. Smart Grid 2013, 4, 1888–1897. [Google Scholar]
- Carlon, E.; Schwarz, M.; Golicza, L.; Verma, V.K.; Prada, A.; Baratieri, M.; Haslinger, W.; Schmidl, C. Efficiency and operational behaviour of small-scale pellet boilers installed in residential buildings. Appl. Energy 2015, 155, 854–865. [Google Scholar] [CrossRef]
- Sheikhi, A.; Ranjbar, A.M.; Oraee, H. Financial analysis and optimal size and operation for a multicarrier energy system. Energy Build. 2012, 48, 71–78. [Google Scholar] [CrossRef]
- Panasonic. Lead Acid Batteries Technical Handbook. Available online: http://www.docin.com/p-1468343866.html (accessed on 26 April 2017).
- Maxwell. Maxwell Technologies BOOSTCAP Ultracapactior Cell Sizing, Rev 3. Available online: http://www.datasheetarchive.com/dl/Datasheet-095/DSA00114140.pdf (accessed on 17 February 2009).
- Lund, H.; Moller, B.; Mathiesen, B.V.; Dyrelund, A. The role of district heating in future renewable energy systems. Energy 2010, 35, 1381–1390. [Google Scholar] [CrossRef]
Figure 1.
Daily electricity price in different seasons [23].
Figure 1.
Daily electricity price in different seasons [23].
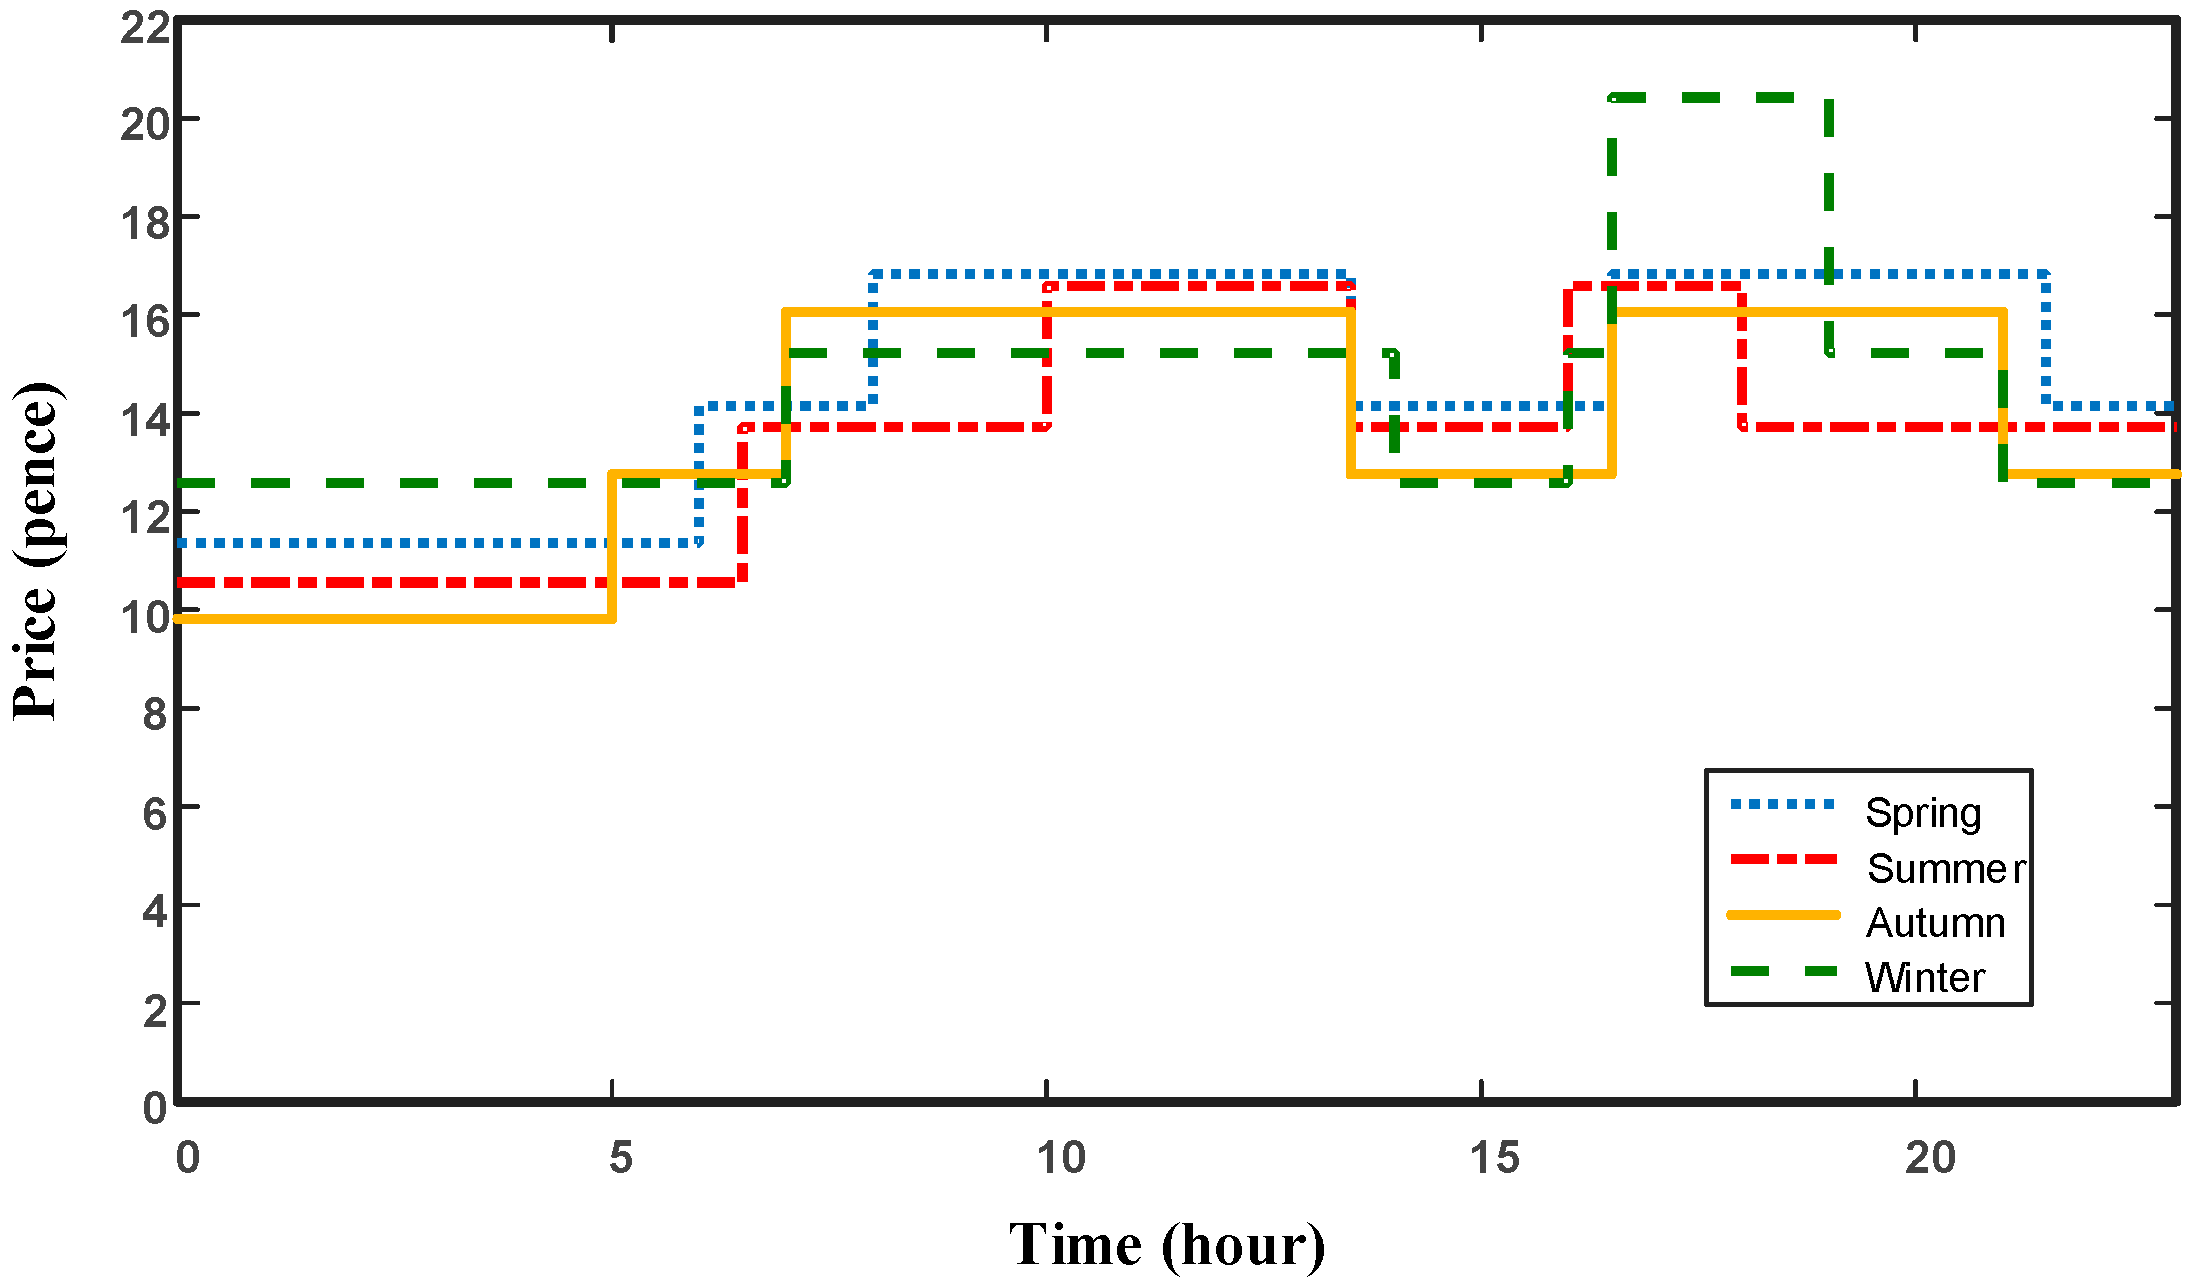
Figure 2.
Energy flow in smart building.
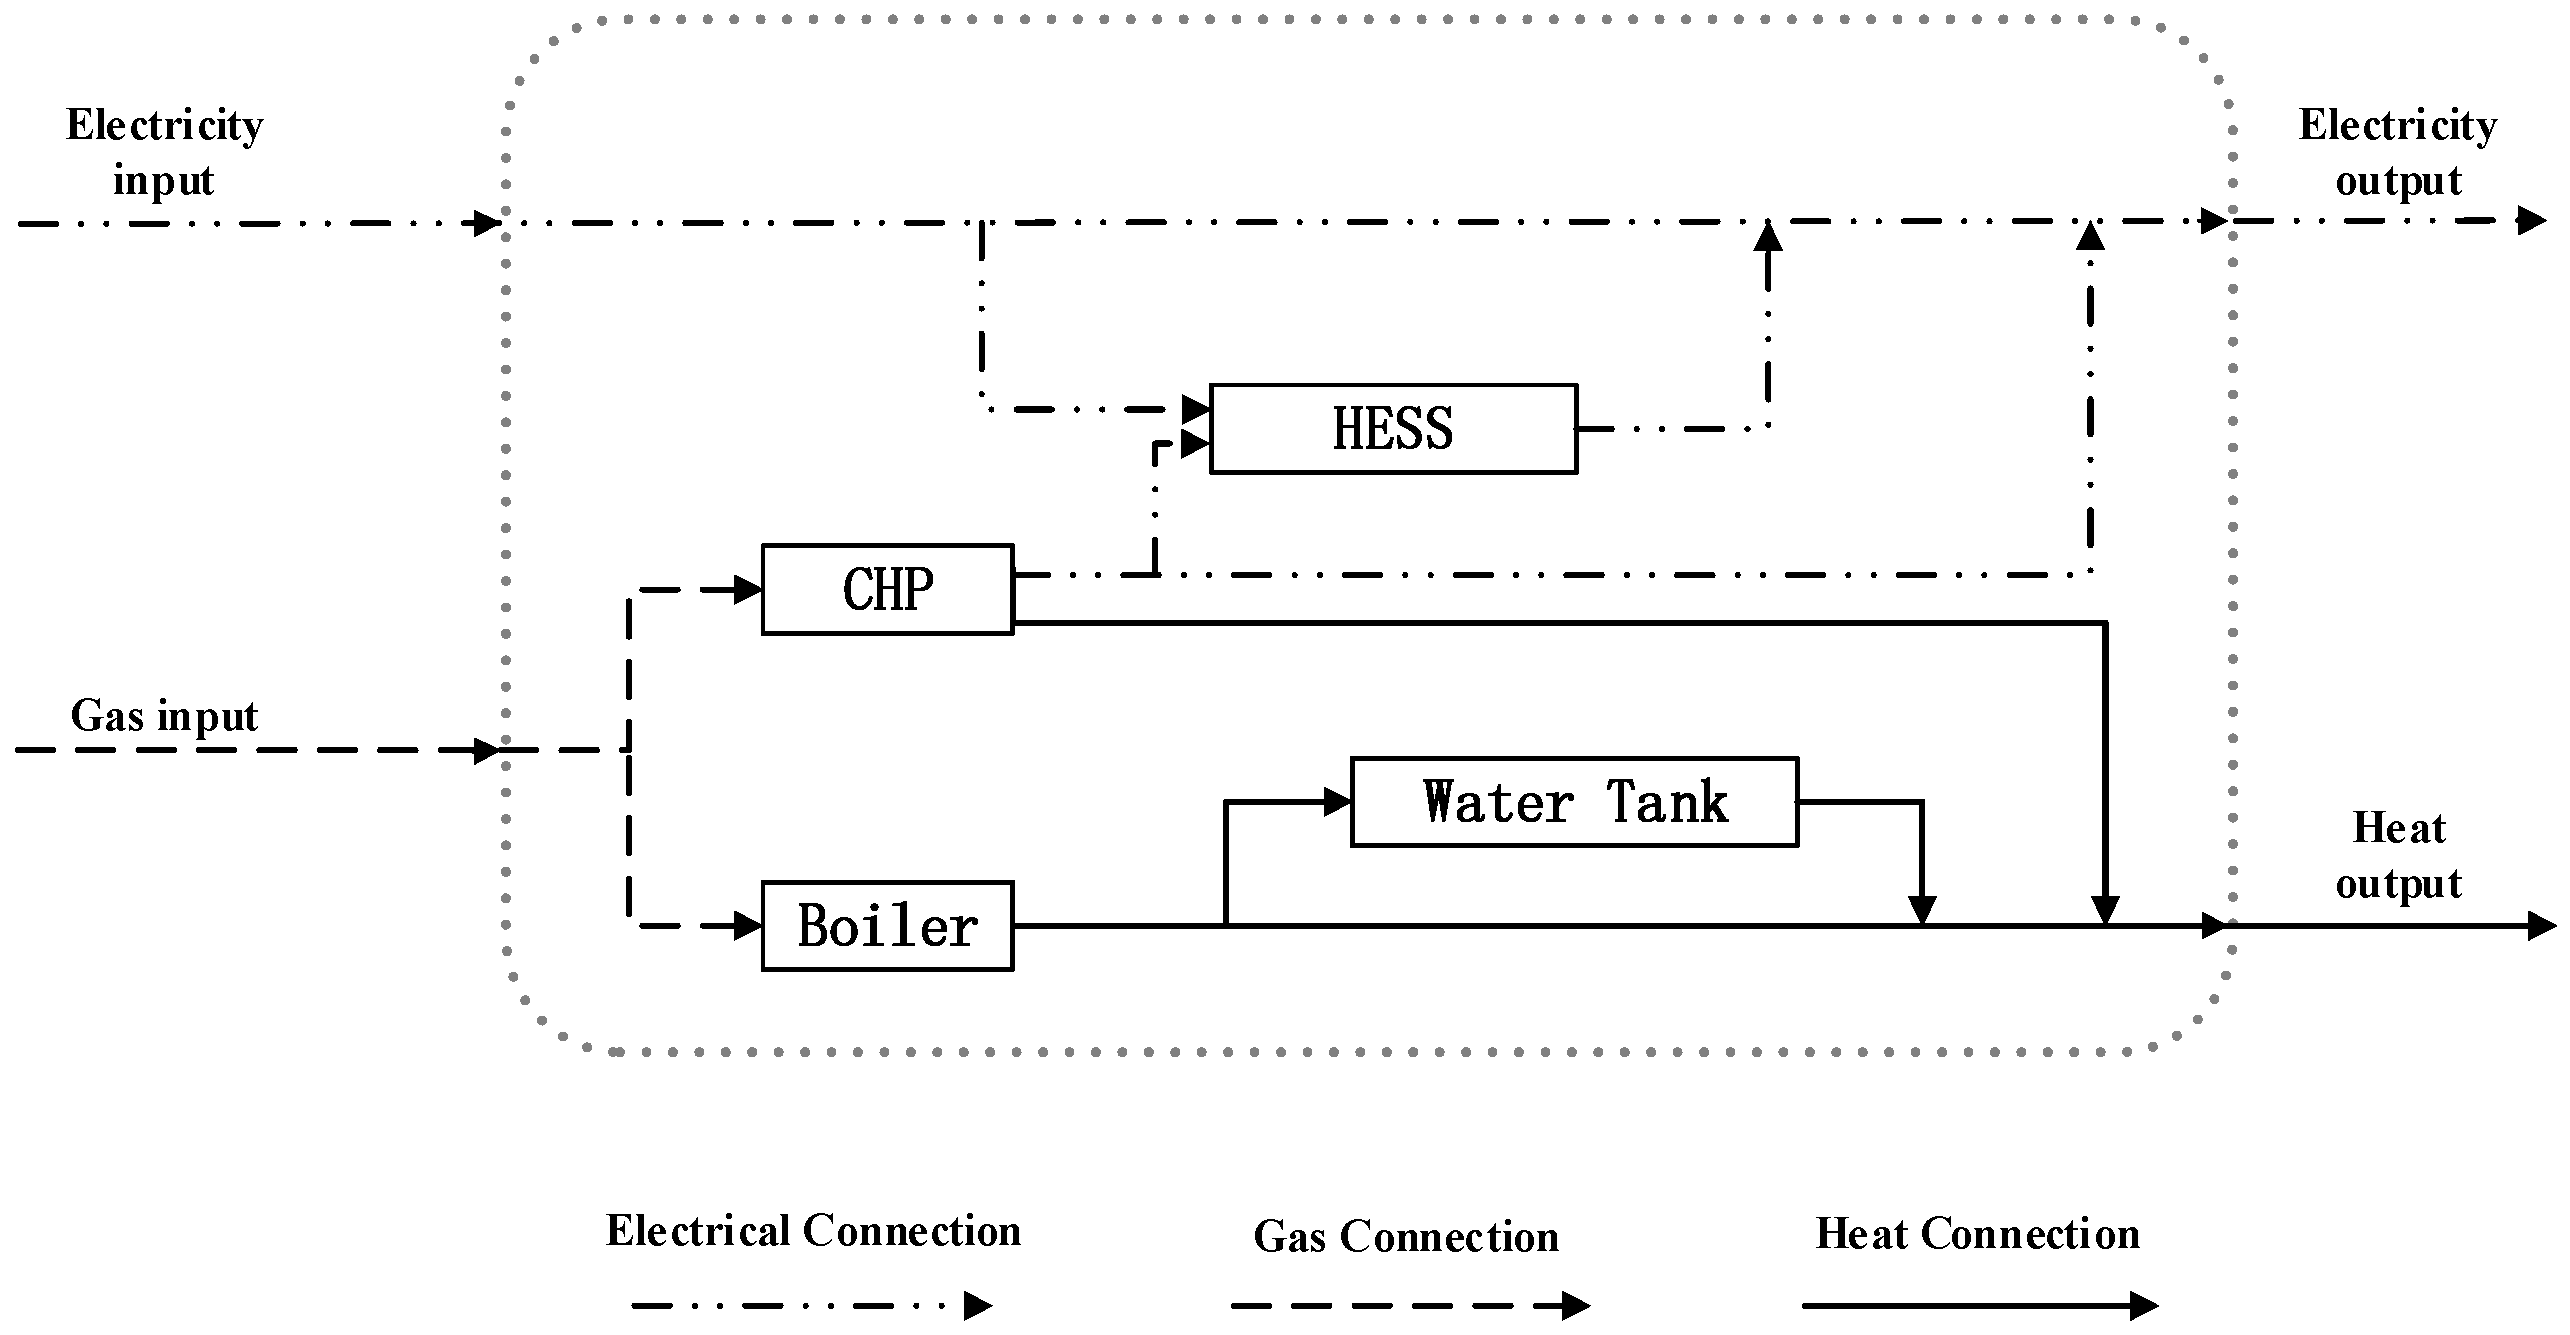
Figure 3.
Daily battery SOC curves for different battery capacity levels.
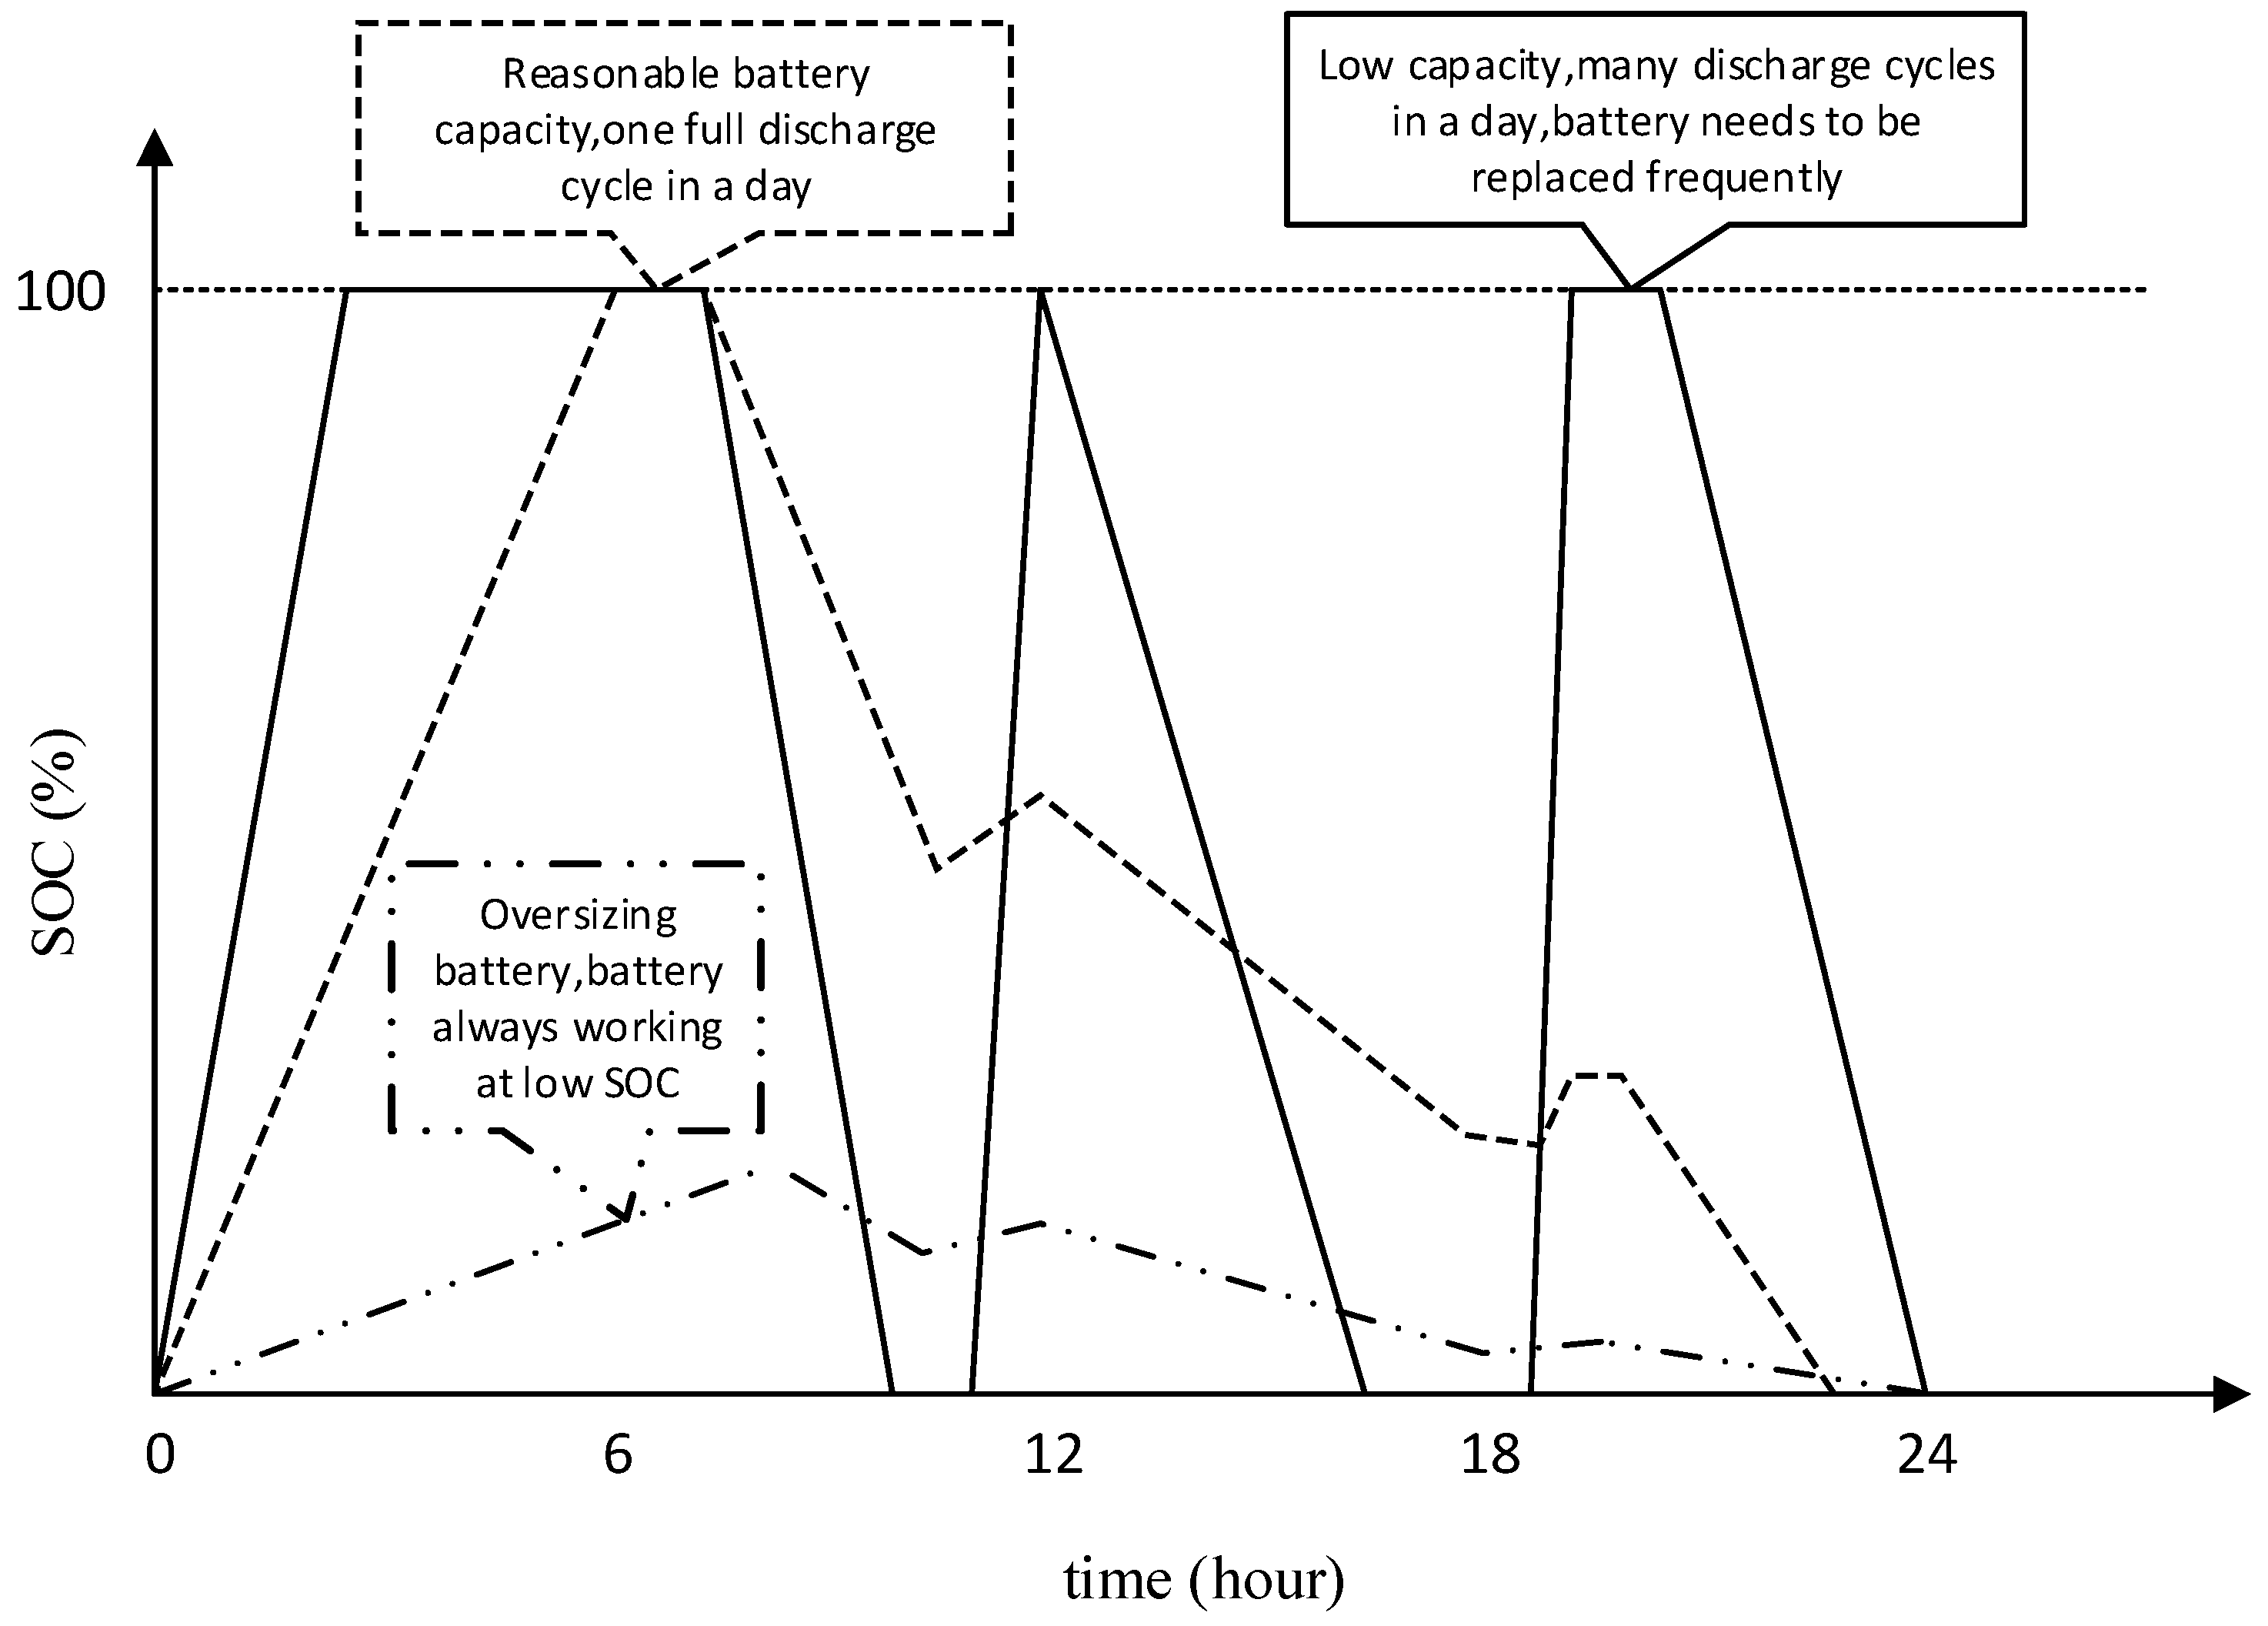
Figure 4.
Daily electricity price diagram.
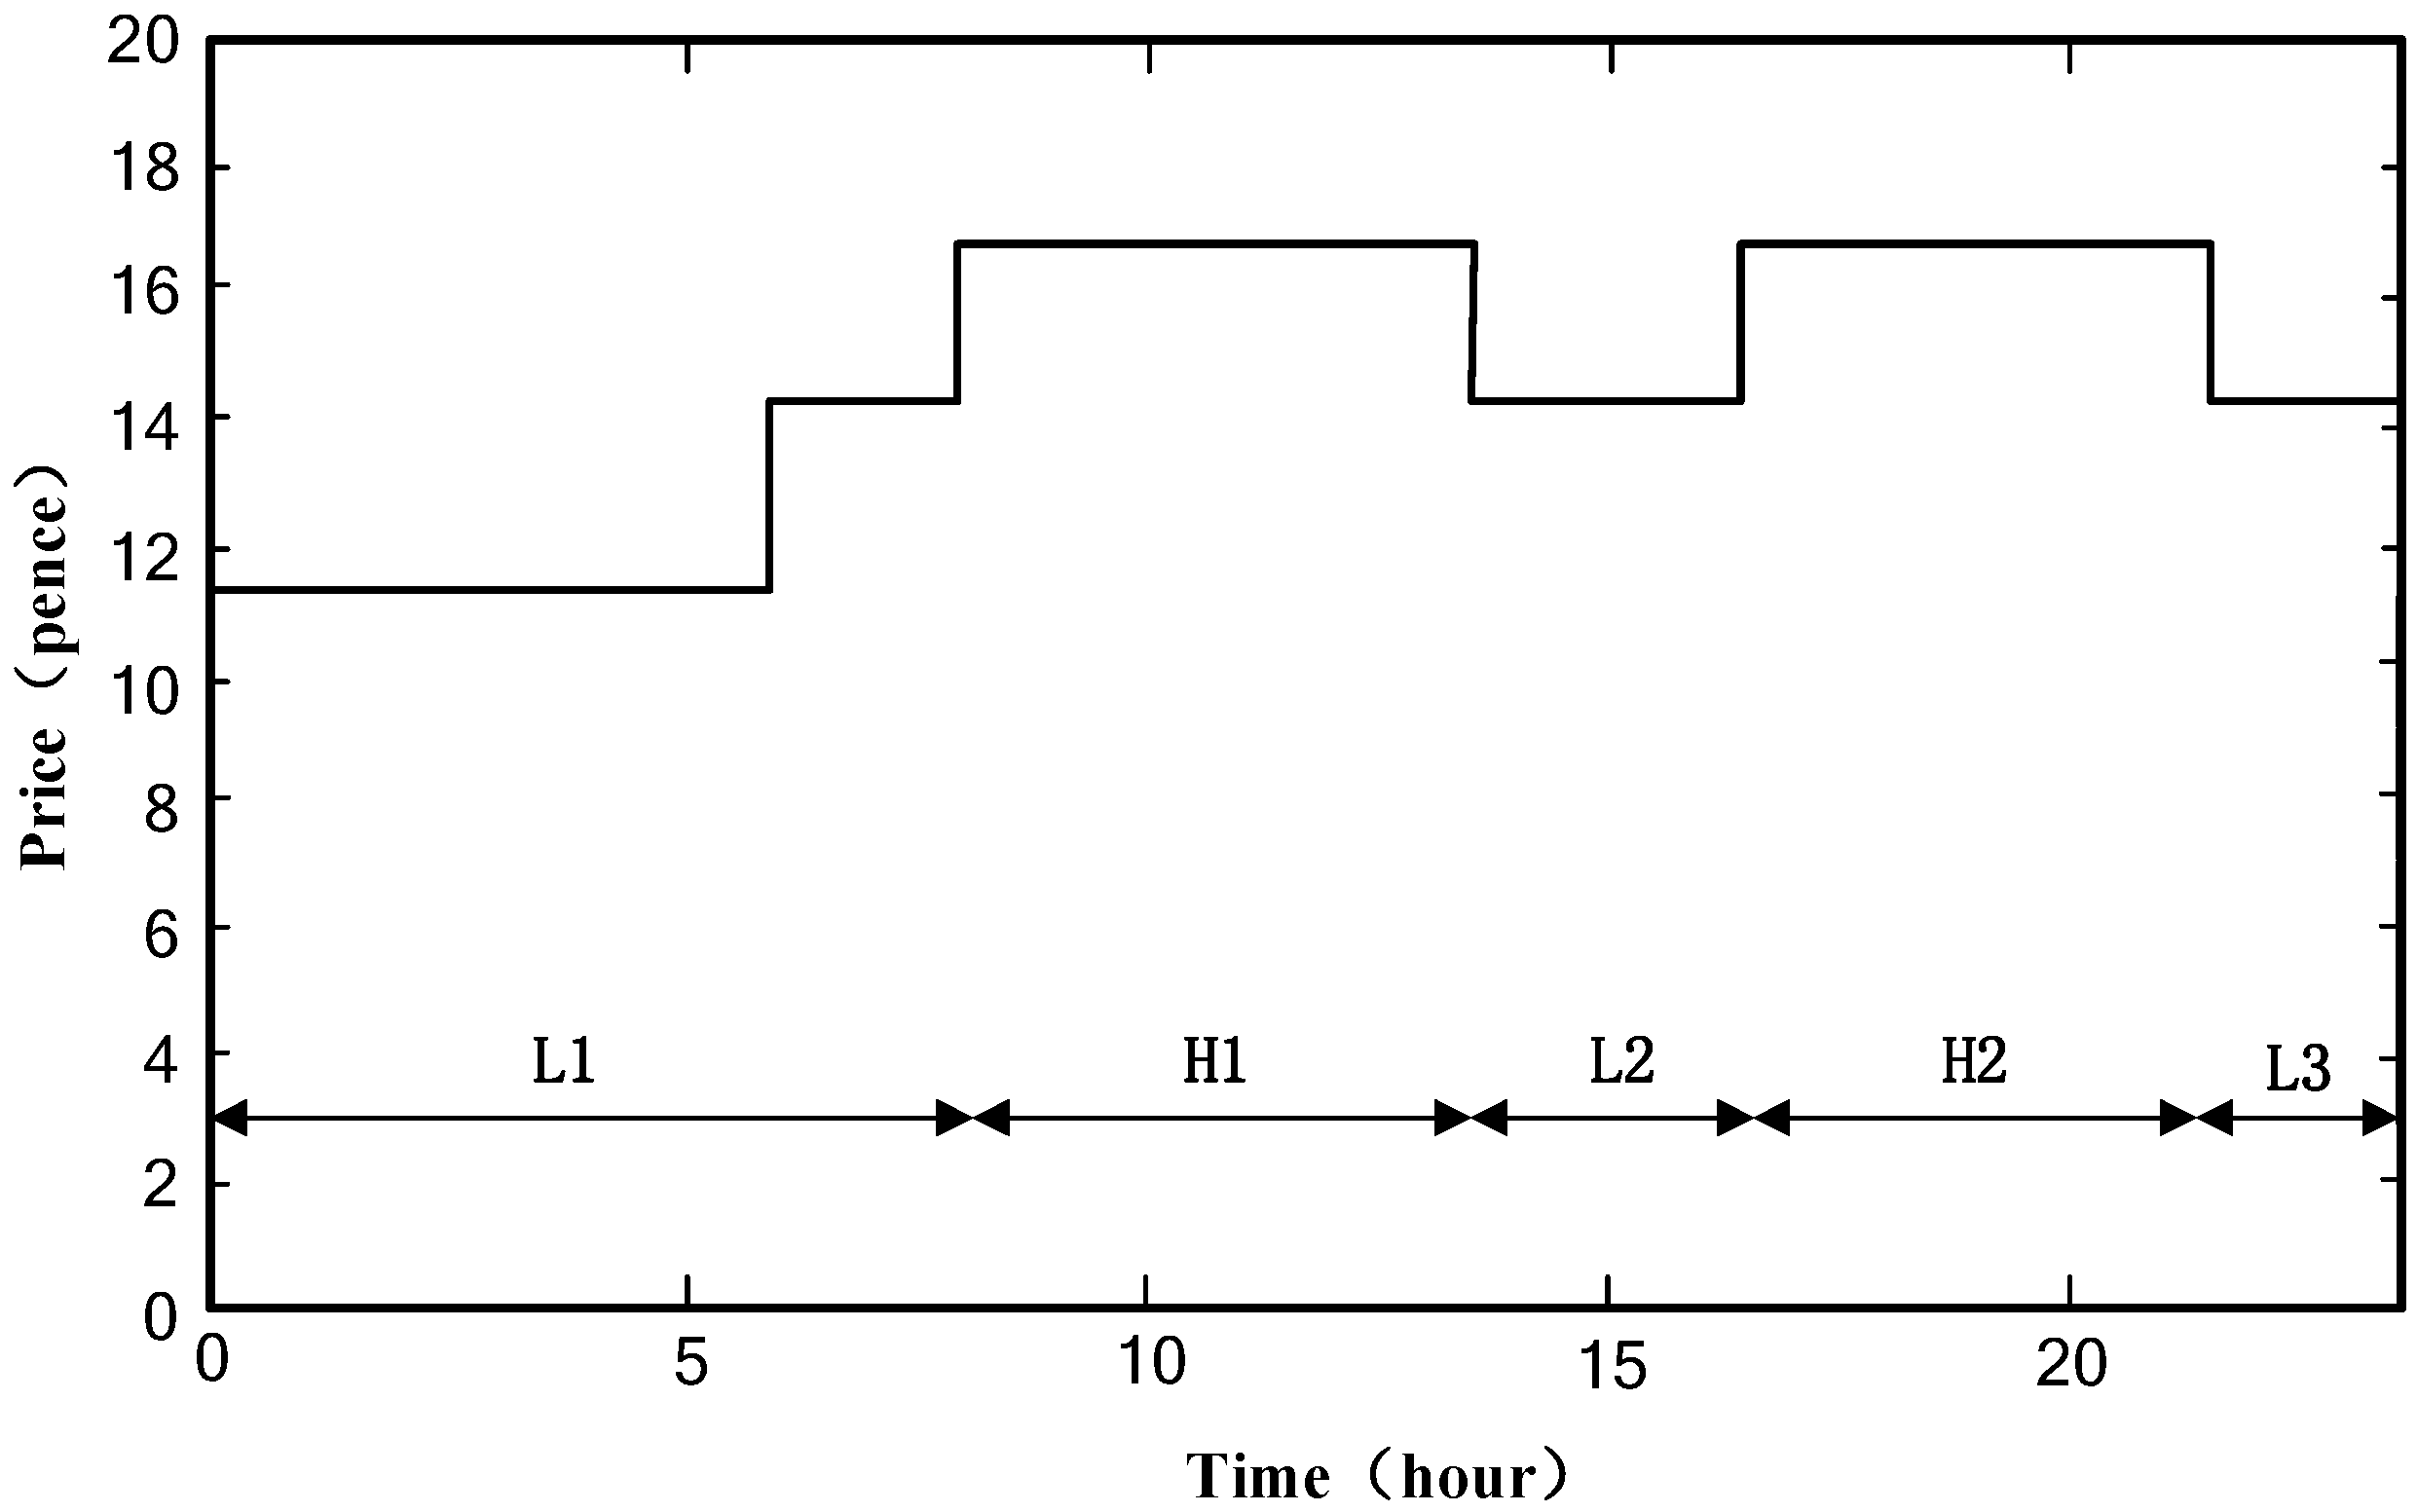
Figure 5.
Daily energy cost saving vs. battery capacity at different discharge currents (deep discharge).
Figure 5.
Daily energy cost saving vs. battery capacity at different discharge currents (deep discharge).

Figure 6.
Daily energy cost saving vs. battery capacity at different discharge currents (medium discharge).
Figure 6.
Daily energy cost saving vs. battery capacity at different discharge currents (medium discharge).

Figure 7.
Daily energy cost saving vs. battery capacity at different discharge currents (light discharge).
Figure 7.
Daily energy cost saving vs. battery capacity at different discharge currents (light discharge).

Figure 8.
The limitation of HESS operation system.

Table 1.
List of all parameters and values used through the paper.
| Parameters | Value |
|---|---|
| UK domestic gas price | 5 pence/kWh |
| Boiler gas to heat efficiency | 88% |
| Rated power of CHP | 3 kW |
| CHP heat efficiency | 66% |
| CHP electricity efficiency | 22% |
| Overall efficiency of the battery | 80% |
| Overall efficiency of the supercapacitor | 98% |
| Overall efficiency of the supercapacitor | 98% |
| Overall efficiency of the water tank | 70% |
| Standby loss of the battery | 2% per month |
| Standby loss of the water tank | 25% per day |
| Standby loss of the supercapacitor | 0 |
Table 2.
Daily electricity control strategy in building.
| Time Period | State of CHP | Possible State of HESS | Electricity Supplier’s Priority List | |
|---|---|---|---|---|
| L1 | ON | Charge/Standby | 1. CHP 2. Grid | |
| H1 | ON | Charge/Discharge/Standby | 1. CHP 2.HESS 3. Grid | |
| L2 | ON | Charge/Standby | 1. CHP 2. Grid | |
| H2 | ON | Charge/Discharge/Standby | 1. CHP 2.HESS 3. Grid | |
| L3 | Start to Last 40 min of L3 | ON | Charge/Discharge/Standby | 1. CHP 2.HESS 3. Grid |
| ELast 40 min of L3 | OFF | Discharge/Standby | 1. HESS 2. Grid | |
Table 3.
Average daily HESS cost for discharge currents (SOC = 70%).
| Discharge Current (A) | Q/10 | Q/5.8 | Q/4 | Q/1.9 | Q/1.2 | Q/0.9 | Q/0.8 |
|---|---|---|---|---|---|---|---|
| Average Daily Energy Saving (£) | 0.8 | 0.8 | 0.8 | 0.8 | 0.8 | 0.8 | 0.8 |
| Effective Battery Capacity (Ah) | 1022 | 624 | 527 | 504 | 504 | 504 | 504 |
| Installation Battery Capacity (Ah) | 1022 | 726 | 703 | 969 | 1229 | 1400 | 1626 |
| Average Daily Cost of Battery System (£) | 9.29 | 6.83 | 6.86 | 9.54 | 12.10 | 13.78 | 16.00 |
| Supercapacitor Capacity (F) | 137 | 144 | 176 | 355 | 562 | 749 | 843 |
| Average Daily Cost of Supercapacitor (£) | 0.05 | 0.06 | 0.07 | 0.14 | 0.23 | 0.30 | 0.34 |
| Average Daily Cost of HESS (£) | 9.34 | 6.89 | 6.93 | 9.68 | 12.33 | 14.08 | 16.34 |
Table 4.
Optimized results of daily cost of HESS at different SOCs.
| SOC (%) | 0 | 50 | 70 |
|---|---|---|---|
| Average Daily Energy Saving (£) | 0.8 | 0.8 | 0.8 |
| Best Discharge Current (A) | Q/1.9 | Q/4 | Q/5.8 |
| Effective Battery Capacity (Ah) | 199 | 416 | 624 |
| Installation Battery Capacity (Ah) | 382.7 | 555 | 726 |
| Average Daily Cost of Battery System (£) | 18.25 | 15.12 | 6.83 |
| Supercapacitor Capacity (F) | 141 | 136 | 144 |
| Average Daily Cost of Supercapacitor (£) | 0.26 | 0.15 | 0.06 |
| Average Daily Cost of HESS (£) | 18.51 | 15.27 | 6.89 |
© 2017 by the authors. Licensee MDPI, Basel, Switzerland. This article is an open access article distributed under the terms and conditions of the Creative Commons Attribution (CC BY) license (http://creativecommons.org/licenses/by/4.0/).
Share and Cite
MDPI and ACS Style
Yu, D.; Liu, H.; Yan, G.; Jiang, J.; Le Blond, S. Optimization of Hybrid Energy Storage Systems at the Building Level with Combined Heat and Power Generation. Energies 2017, 10, 606. https://doi.org/10.3390/en10050606
AMA Style
Yu D, Liu H, Yan G, Jiang J, Le Blond S. Optimization of Hybrid Energy Storage Systems at the Building Level with Combined Heat and Power Generation. Energies. 2017; 10(5):606. https://doi.org/10.3390/en10050606
Chicago/Turabian StyleYu, Dongmin, Huanan Liu, Gangui Yan, Jing Jiang, and Simon Le Blond. 2017. "Optimization of Hybrid Energy Storage Systems at the Building Level with Combined Heat and Power Generation" Energies 10, no. 5: 606. https://doi.org/10.3390/en10050606
Note that from the first issue of 2016, this journal uses article numbers instead of page numbers. See further details here.