Performance Evaluation of a Modular Design of Wind Tower with Wetted Surfaces


1
Department of Building, Civil and Environmental Engineering, Concordia University, Montreal, QC H3G 1M8, Canada
2
School of Mechanical Engineering, Sharif University of Technology, Tehran, Iran
3
Department of Mechanical Engineering, Memorial University of Newfoundland, St. John’s, NL A1B 3X5, Canada
4
Hydraulic Machinery Research Institute, Department of Mechanical Engineering, University of Tehran, Tehran, Iran
*
Author to whom correspondence should be addressed.
Energies 2017, 10(7), 845; https://doi.org/10.3390/en10070845
Submission received: 20 May 2017
/
Revised: 20 June 2017
/
Accepted: 21 June 2017
/
Published: 25 June 2017
Abstract
:Wind towers or wind catchers, as passive cooling systems, can provide natural ventilation in buildings located in hot, arid regions. These natural cooling systems can provide thermal comfort for the building inhabitants throughout the warm months. In this paper, a modular design of a wind tower is introduced. The design, called a modular wind tower with wetted surfaces, was investigated experimentally and analytically. To determine the performance of the wind tower, air temperature, relative humidity (RH) and air velocity were measured at different points. Measurements were carried out when the wind speed was zero. The experimental results were compared with the analytical ones. The results illustrated that the modular wind tower can decrease the air temperature significantly and increase the relative humidity of airflow into the building. The average differences for air temperature and air relative humidity between ambient air and air exiting from the wind tower were approximately 10 °C and 40%, respectively. The main advantage of the proposed wind tower is that it is a modular design that can reduce the cost of wind tower construction.
1. Introduction
For centuries, people living in the Middle East have used various passive cooling systems to provide pleasant cool air [1,2,3,4,5] and cold drinkable water [6,7,8,9,10,11,12,13,14,15] during the hot summer months. One of these systems is the wind tower, or wind catcher, which creates passive ventilation and provides thermal comfort for the building inhabitants. Traditional wind towers are still employed in some countries of the Middle East, such as Iran, Egypt, Pakistan, Afghanistan and the UAE. Figure 1, Figure 2 and Figure 3 show traditional wind towers in the city of Yazd in Iran, Cairo in Egypt and Heydar Abad in Pakistan, respectively. These wind towers naturally ventilate buildings.
More than forty percent of all of the energy in the world is used in buildings, and air conditioning, heating and cooling systems employ over sixty percent of all energy used in buildings [16,17,18]. Thus, passive cooling systems, such as wind towers or wind catchers, can help reduce the energy needed for air conditioning in buildings, especially at peak times. It should be noted that traditional wind towers have some restrictions. Several researchers proposed new designs of wind towers to use in windy and hot, dry zones to improve the performance of conventional wind towers [19,20].
As mentioned, one of the most effective ways to reduce energy consumption in air cooling is to use natural ventilation. This issue was first considered by Bahadori [1,2] and led to the scientific evaluation of wind towers as a viable alternative for passive cooling in hot, arid areas. Bahadori et al. [1,2,23,24,25,26,27,28,29,30,31,32,33,34,35,36] investigated and optimized the performance of wind towers, using analytical, numerical and experimental methods. To improve the performance of wind towers, Bahadori introduced two new models of wind towers, named “wind tower with wetted surfaces” and “wind tower with wetted columns” [3,19]. The improvements made in the structure of these new designs of wind towers have enhanced performance compared to that of the conventional ones [3,19]. Numerical, analytical and experimental studies that were carried out on these two new models of wind towers illustrate provide a better performance than that of the traditional ones [3,19]. The experimental studies also show that in areas with low wind speed, “wind towers with wetted surfaces” work better than “wind towers with wetted columns” [3,29].
- −
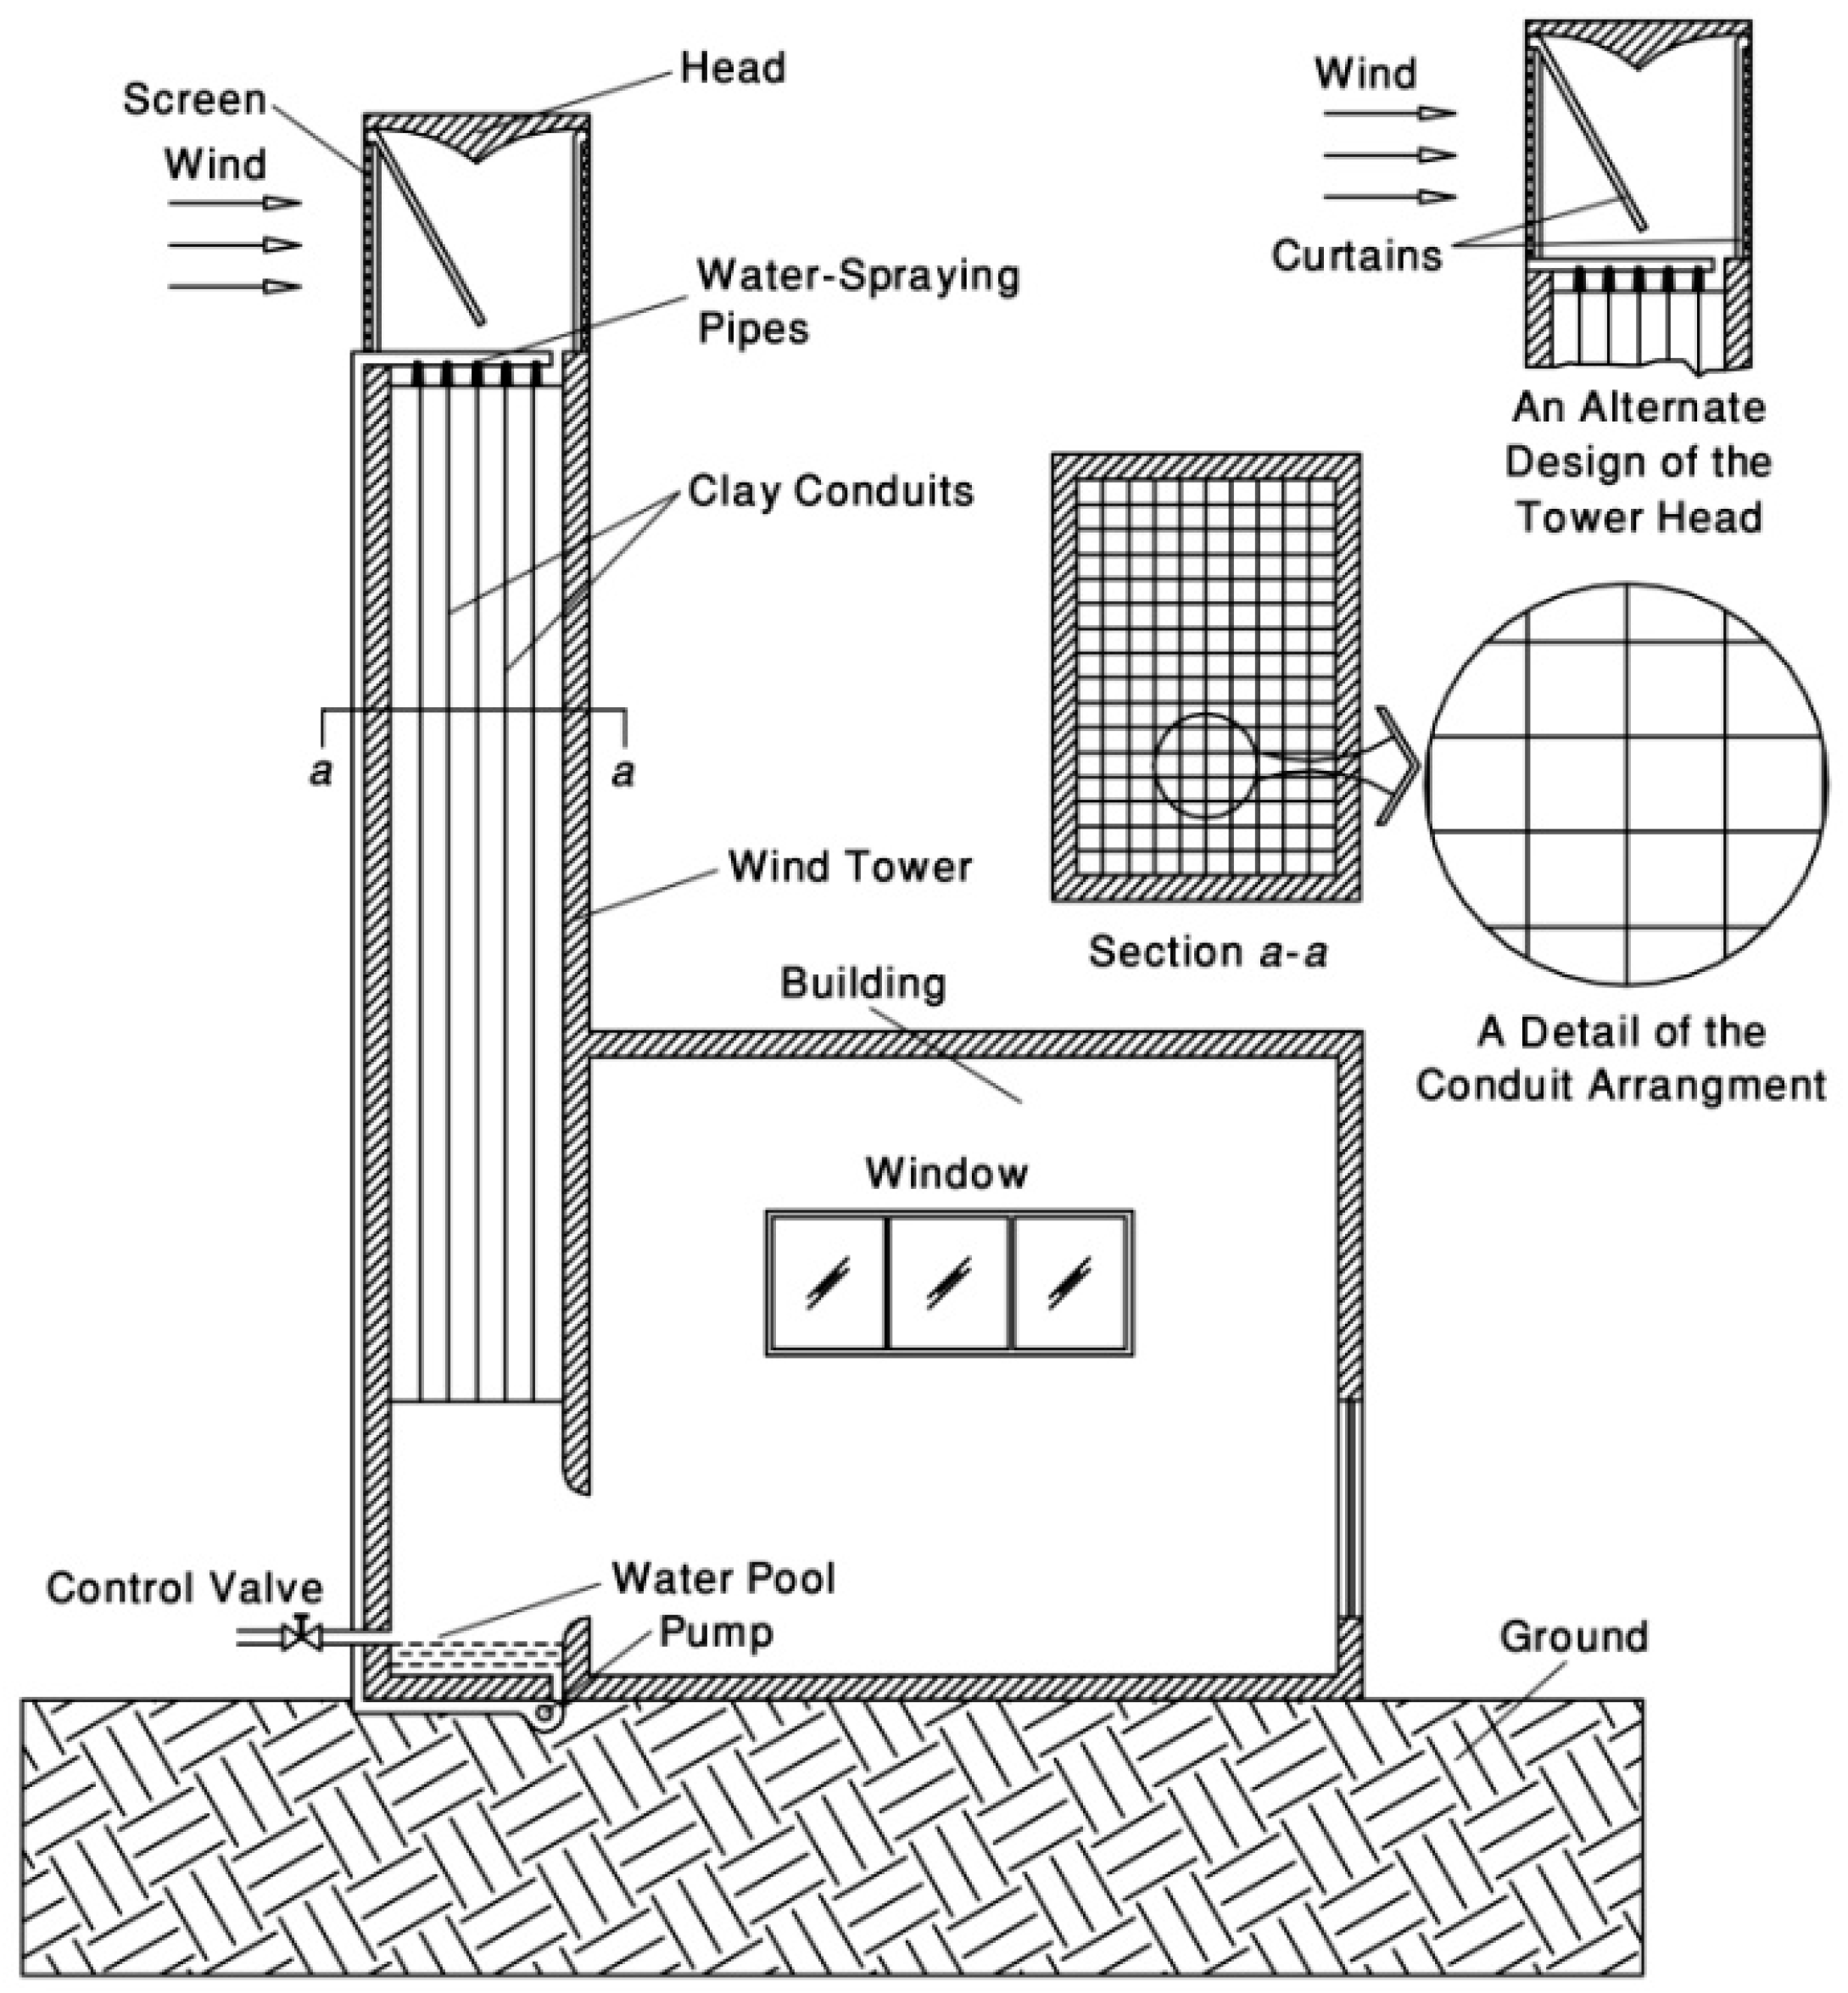
- Wind tower with wetted columns: This type of wind tower has thick curtains or clay conduits, which are installed in the wind tower column [3,19,28,29]. Water is sprayed on the curtains or clay conduits and wets them. Then, the water, which is collected in a pool at the bottom of the wind tower, is recirculated by pumping it up. Therefore, warm and dry air that passes from the wind tower column is evaporatively cooled, and finally, the air that is both high in moisture and low in temperature enters the room from the wind tower outlet [3,19,28,29]. Figure 4 shows a wind tower with wetted columns. The flow density increases along the channel; the air density inside is higher than that of the outside. Accordingly, the downward airflow is enhanced due to buoyancy [3,19,28].
- −
- Wind tower with wetted surfaces: In this type of wind tower, pads or straw are placed at the top of the wind tower column (wind tower head). They are wetted by means of an electric water pump (Figure 5) [3,36]. The water in wetted pads or straw is evaporated by the air at the wind tower head (the highest part of the wind tower column where air inlets are located) and decreases the air temperature (similar to the evaporative cooling process in evaporative coolers) [3,28,36]. Since the contact surface between the air and wetted straw is extremely large, the moisture in the air will increase. The difference of density between ambient air and the air inside the head of the wind tower, as well as the height of the wind tower column, produce a pressure dissimilarity, causing a downward airflow inside the column. The difference of density at the topmost point of the column (wind tower head) and the ambient air increases the buoyancy effect [3,28,36]. Therefore, it is expected that in places where the wind speed is low, or the ambient air is still, this type of wind tower will be more effective.
Dehghani-Sanij et al. [20] introduced two new designs of wind towers to be applied in windy zones. The modern wind towers include a movable head, a fixed column and two windows at the lower end of the column to adjust the airstream. The movable head can be located manually or electrically in the direction of the wind. Moreover, the wind tower head can be placed into an empty internal space of the column when the airstream does not need to enter the building. Further, they suggest that to improve the performance of the proposed wind towers, a solar chimney or another wind tower in a different direction can be combined with them. It should be noted that wind towers are not only considered for indoor ventilation in hot and arid climates. As Aliabadi et al. [37] suggested, wind and turbulence also can be directed/enhanced by passive architectural elements down to street canyons for urban climate control.
The major goal of the present research was to introduce a modular design of the wind tower with wetted surfaces that can create low energy air conditioning in buildings and bring thermal comfort to the inhabitants. The significance of this new design of wind tower is the possibility of industrial manufacture. Moreover, simple assembly and installation with minor changes in a building’s structure can be considered as another positive aspect of the design. The height and cross-section of the modularly-produced wind tower are determined by the building’s cooling needs. In order to obtain the performance of the proposed wind tower, air temperature, relative humidity (RH) and air velocity parameters were investigated at different points. In addition, the experimental results were compared with the analytical ones.
2. The Proposed Wind Tower Design
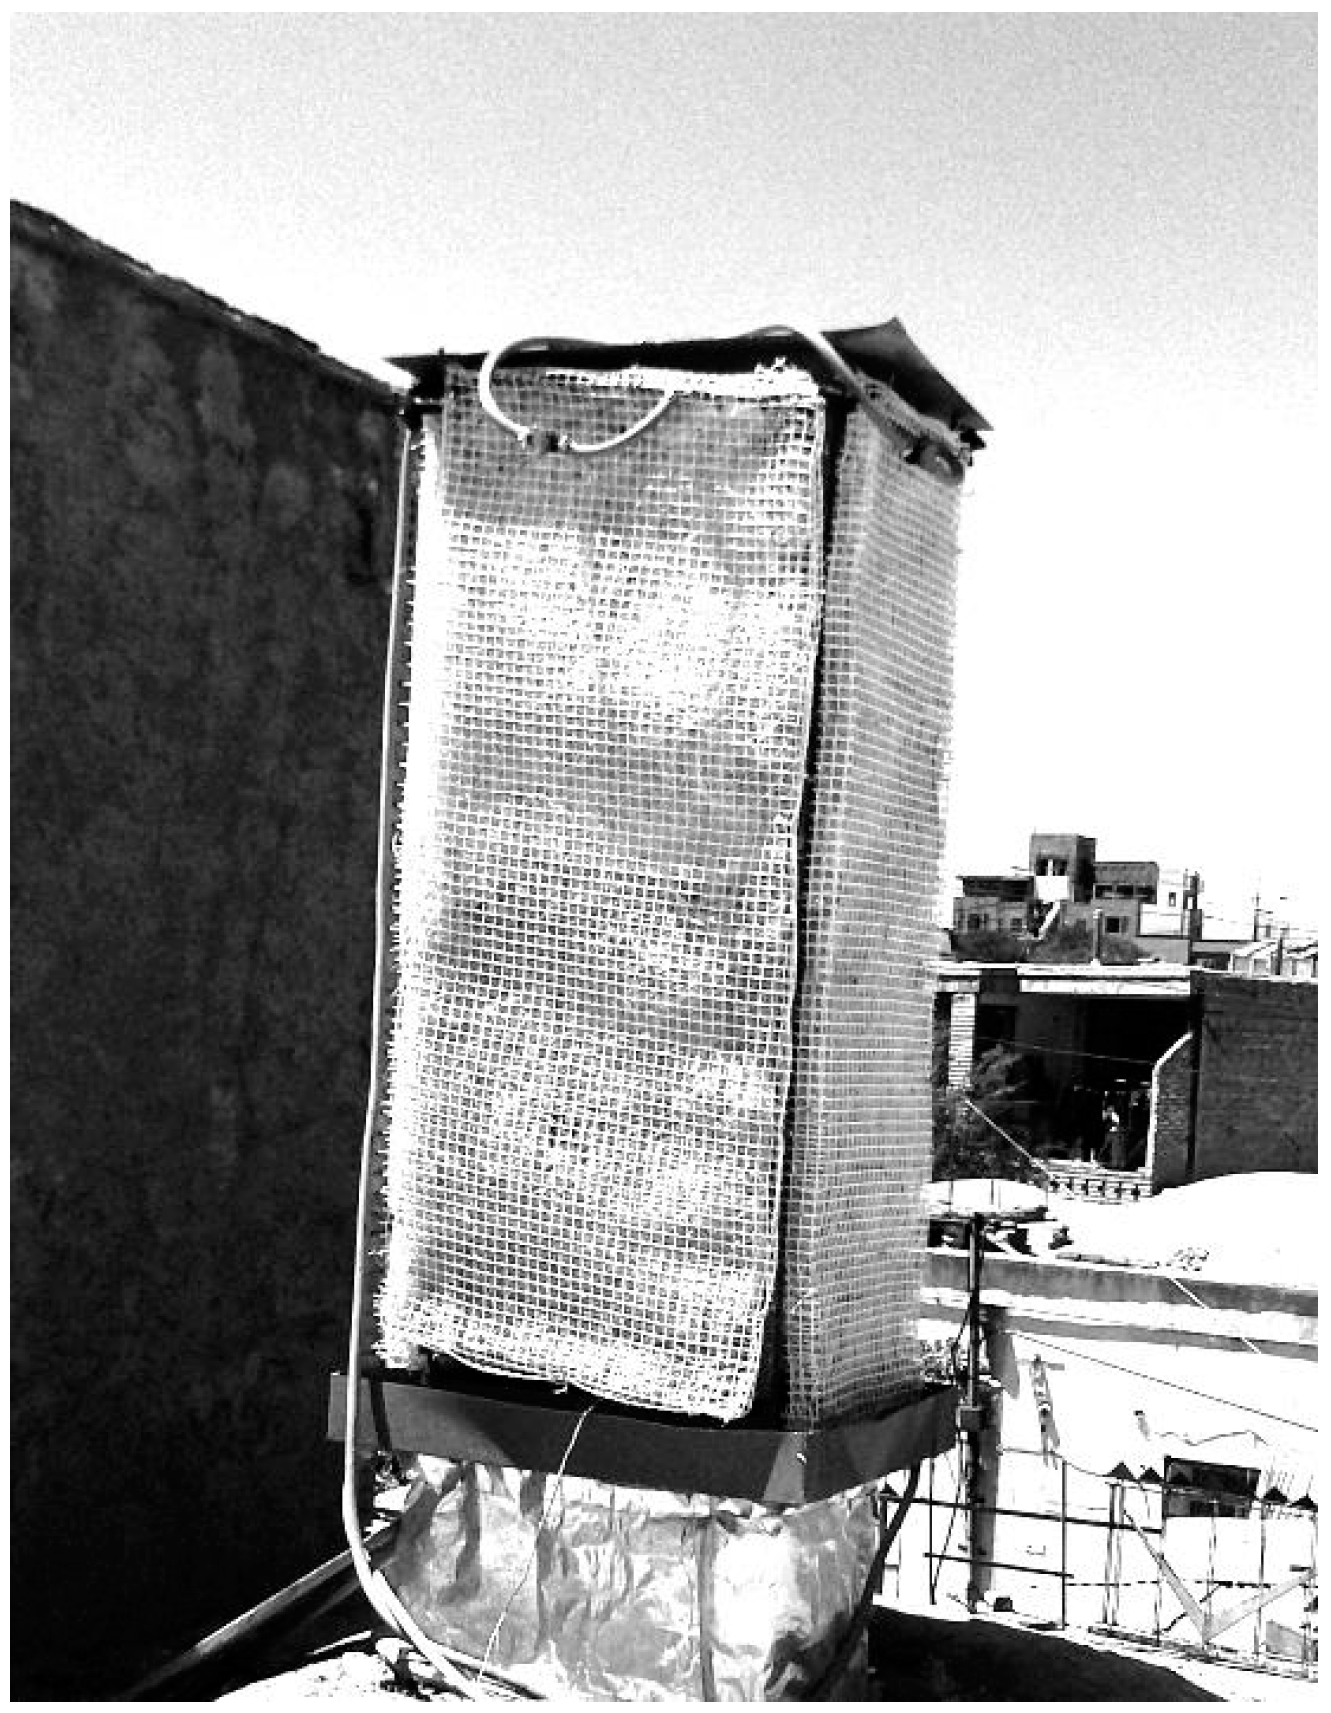
Despite the fact that wind towers with wetted surfaces overcome many shortcomings of the conventional ones, installing them in modern buildings creates some problems. This issue paved the way in designing and constructing a certain type of wind tower with wetted surfaces, which could be installed and used in modern houses. A modular design of the wind tower was built with galvanized steel sheets, installed and tested in Kerman, located in a hot, arid zone in the southeast of Iran. The detailed head of the proposed wind tower is shown in Figure 6. Figure 7 demonstrates the final manufactured wind tower head located on the rooftop of a building. It should be noted that this modular wind tower was also granted a patent by Industrial Property General Office of Iran in August 2014 [38].
The difference between this type of wind tower and a wind tower with wetted surfaces is the materials used in its construction, such as galvanized steel sheets and heat insulation (glass wool), instead of bricks. The main reasons for making this type of wind tower are as follows [36,39]:
- Building materials have changed nowadays, and above all, finding a professional who can build a conventional wind tower is very difficult.
- To revive wind towers as an ancient system of natural cooling, it was necessary to present a product that could be built easily in a factory. On the other hand, the transportation and installation should be as easy as the evaporative coolers used extensively in Iran.
- To install wind towers in existing buildings, there needs to be minor changes in the structure of the buildings. Additional costs and major changes should be avoided or minimized.
- People who live in hot, arid zones pay high costs for air conditioning and cooling. Consequently, this type of wind tower could be an acceptable alternative for natural ventilation and cooling of buildings in these zones.
In the following section, explanations about the methods of testing, measuring instruments and, finally, the experimental results obtained at different time intervals are provided.
3. The Experimental Arrangement
The modular wind tower was installed on the roof of a building located in Kerman. The main reason for choosing Kerman was that it is located in a hot, arid zone, and the potential of evaporative cooling in this city is sufficient. Hence, people of Kerman have used wind towers for centuries. The building where the wind tower was installed and tested was located in a place that was not surrounded by any tall buildings; therefore, evaluating the wind tower’s performance when winds were strong or weak was also possible. In order to create conditions with the least errors, the building was also unoccupied.
3.1. Measuring Instruments
Instruments used in this research were in Table 1:
3.2. Experimental Measurements
To obtain experimental results, five tests were carried out, and data were recorded every day from sunrise to 9:00 p.m. (about one and a half hour after sunset). Every 45 min, all of the following parameters were measured. Moreover, data were taken for one day (24 h) every 45 min to one hour. The measured parameters were as follows:
- (1)
- (2)
- Dry bulb temperature at the head of the wind tower (Point 2 in Figure 8);
- (3)
- Dry bulb temperature and RH in the room where the wind tower outlet was installed;
- (4)
- Dry bulb temperature and RH in another sample room beside the wind tower room.
The hottest days of the year in Kerman were selected for testing. The data recording was made when the wind speed was zero. Note that zero means that ambient air velocity is lower than 0.01 m/s. The wind speed was measured on the building roof, with no surrounding tall buildings at a height of 6 m. The following information is presented in the form of comparative tables and charts. The tests’ information is as follows:
- Test No. 1: Data recording at 10:00 a.m. for ten continuous days, from 21 to 30 August 2013,
- Test No. 2: Data recording at 12:00 p.m. for ten continuous days, from 21 to 30 August 2013,
- Test No. 3: Data recording at 4:00 p.m. for ten continuous days, from 21 to 30 August 2013,
- Test No. 4: A one-day data recording on 24 August 2013, from 6:30 a.m. to 9:00 p.m., and
- Test No. 5: A 24-h data recording from 5:15 p.m. on 22 August 2013.
Table 2 shows the symbols and signs used in the following tables and charts. In the following charts, the units for temperature, air speed and mass flow rate are in degrees centigrade (degrees Celsius), meters per second (m·s−1) and kilograms per second (kg·s−1), respectively.
4. Analytical and Experimental Results
4.1. Analytical Results
To compare and validate the experimental measurements, an analytical method is applied to the modular wind tower with wetted surfaces. The analytical method used is provided by [3]. To determine the air velocity distribution in the wind tower, first the pressure head must be calculated. According to Figure 8, to compute the pressure head, the following equation can be employed:
Furthermore, Equation (1) can be written as follows:
In the equations above, is the atmospheric pressure; is the pressure drop in straw; is the driving potential; is the frictional pressure drop in the vertical column; is the dynamic pressure drop in the elbow; is the frictional pressure drop in the horizontal section; is the outlet pressure drop; and is the total pressure drop. By assuming air as an ideal gas to calculate density (), each part of Equation (2) can be expressed as follows:
Continuity equation:
Driving potential:
Pressure drops:
In the equations above, is the ambient air density (kg·m−3); is the air density in the vertical channel (kg·m−3); is the air density in the horizontal channel (kg·m−3); A is the cross-sectional area (m2); is the velocity of air passing through straw (m·s−1); is the wind velocity (m·s−1); is the air velocity in the vertical channel (m·s−1); and is the air velocity in the horizontal channel (m·s−1). Additionally, is the wind tower height (m); is the length of the vertical part of the channel (m); is the gravity (m·s−2); is the equivalent diameter of the vertical channel (m); is the straw’s thickness (cm); is the length of the horizontal column (m); is the coefficient of friction; is the equivalent diameter of the horizontal channel (m); is the coefficient of pressure drop in the elbow; is the coefficient of the pressure drop at the exit; and to are constants.
By substituting Equations (4) to (9) in Equation (2), the following quadratic equation can be obtained.
As illustrated in Equation (10), the only remaining unknown parameter is V3. By solving Equation (10) and using Equation (3), the conditioned air exit velocity at the outlet of the wind tower channel () was obtained by the analytical method. This method was applied in order to find for all recorded data.
To find the exit temperature from the wind tower () using the analytical method, the rate of heat transfer from the airflow passing throughout the wind tower must be calculated. First, a value for is assumed. Then, the amount of heat transfer is calculated from the internal airflow in the wind tower column using two different approaches, which will be explained in the following section. Finally, the values obtained from these approaches will be compared. The process is an iterative method, repeated for as long as the difference between the heat transfer value reaches less than the reasonable error. These approaches are expressed in the following equations:
where is the mass flow rate (kg·s−1), is the temperature difference between conditioned air inside the channel and room, is the specific heat capacity (J·kg−1·K−1), is the thermal resistance (K·W−1), is the dry bulb temperature at the wind tower head, is the vertical channel cross-section (m2), is the dry bulb temperature of the room, is the dry bulb temperature at the wind tower exit and is the dry bulb temperature of the conditioned airflow inside the wind tower.
To compute the amount of heat transfer from Equation (11a), the parameter of can be obtained by [3,40]:
where:
It should be noted that by assuming , all parameters in Equation (11a) are known, except for Therefore, cp only depends on T6.
In order to determine the value of the heat transfer from Equation (11b), the following equation can be used.
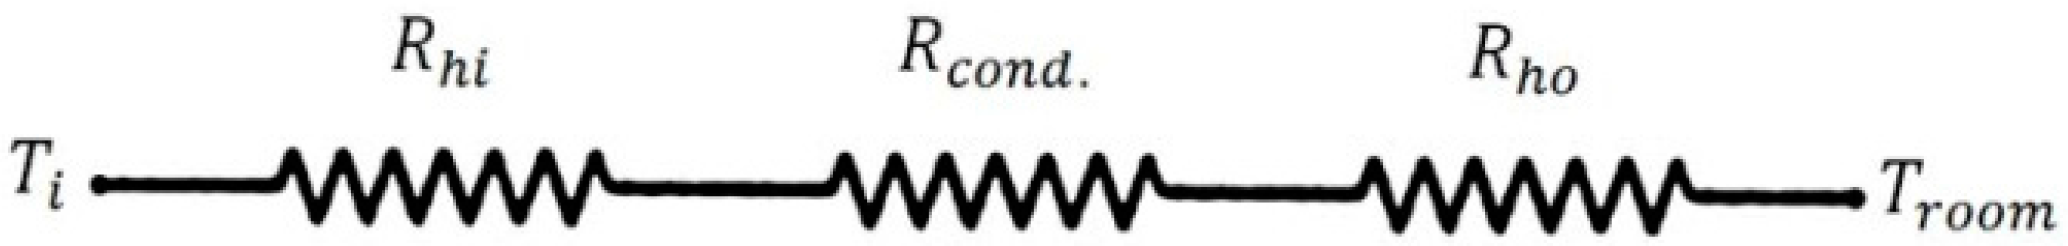
where is the dry bulb temperature of conditioned airflow in the vertical channel, is the dry bulb temperature of conditioned airflow in the horizontal channel, is the thermal resistance related to natural convection heat transfer inside the vertical channel (K·W−1), is the thermal resistance against conduction heat transfer in the wall of the vertical channel (K·W−1), is the thermal resistance due to natural convection heat transfer outside the vertical channel (K/W), is the thermal resistance related to natural convective heat transfer inside the horizontal channel (K·W−1), is the thermal resistance against conductive heat transfer through the wall of horizontal channel (K·W−1) and is the thermal resistance due to natural convective heat transfer outside the horizontal channel (K·W−1). Figure 9 shows the thermal resistances model for heat transfer of the cool air between the inside of the channel and the room. Since a downward flow in the channel is only caused by buoyancy force, there is natural convection inside the channel. The conditioned airflow inside the channel is also turbulent, because the airflow Reynolds number is more than 104. Outside the channel there is no fan or other devices for creating a forced flow; therefore, free convective heat transfer occurs outside the wind tower column, as well.
To obtain thermal resistances, the following equations can be employed [41].
where is the thickness of the galvanized sheets (m), is the lateral surface of the vertical channel (=9 m2), is the thermal conductivity of the galvanized sheets (W·m−1·K−1), is the lateral surface of the horizontal channel (=0.4 m2), is the convective heat transfer coefficient inside the vertical channel (W·m−2·K−1), is the convective heat transfer coefficient inside the horizontal channel (W·m−2·K−1), is the convective heat transfer coefficient just outside the vertical channel (W·m−2·K−1) and is the convective heat transfer coefficient just outside the horizontal channel (W·m−2·K−1). In addition, to calculate the parameters of , , and the following equations are employed.
By assuming and , substituting Equations (18) and (19) into Equations (16) and (17), respectively, and replacing Equations (15)–(17) in Equation (14), Equation (11b) is only a function of .
As mentioned above, by initial approximation of , Equation (11a, b) are solved and the obtained values estimated by these approaches for are compared. If the difference between these values is more than the reasonable error (10−4), by using the iteration method, the value of as is obtained.
4.2. Experimental Results
4.2.1. Test Nos. 1, 2 and 3
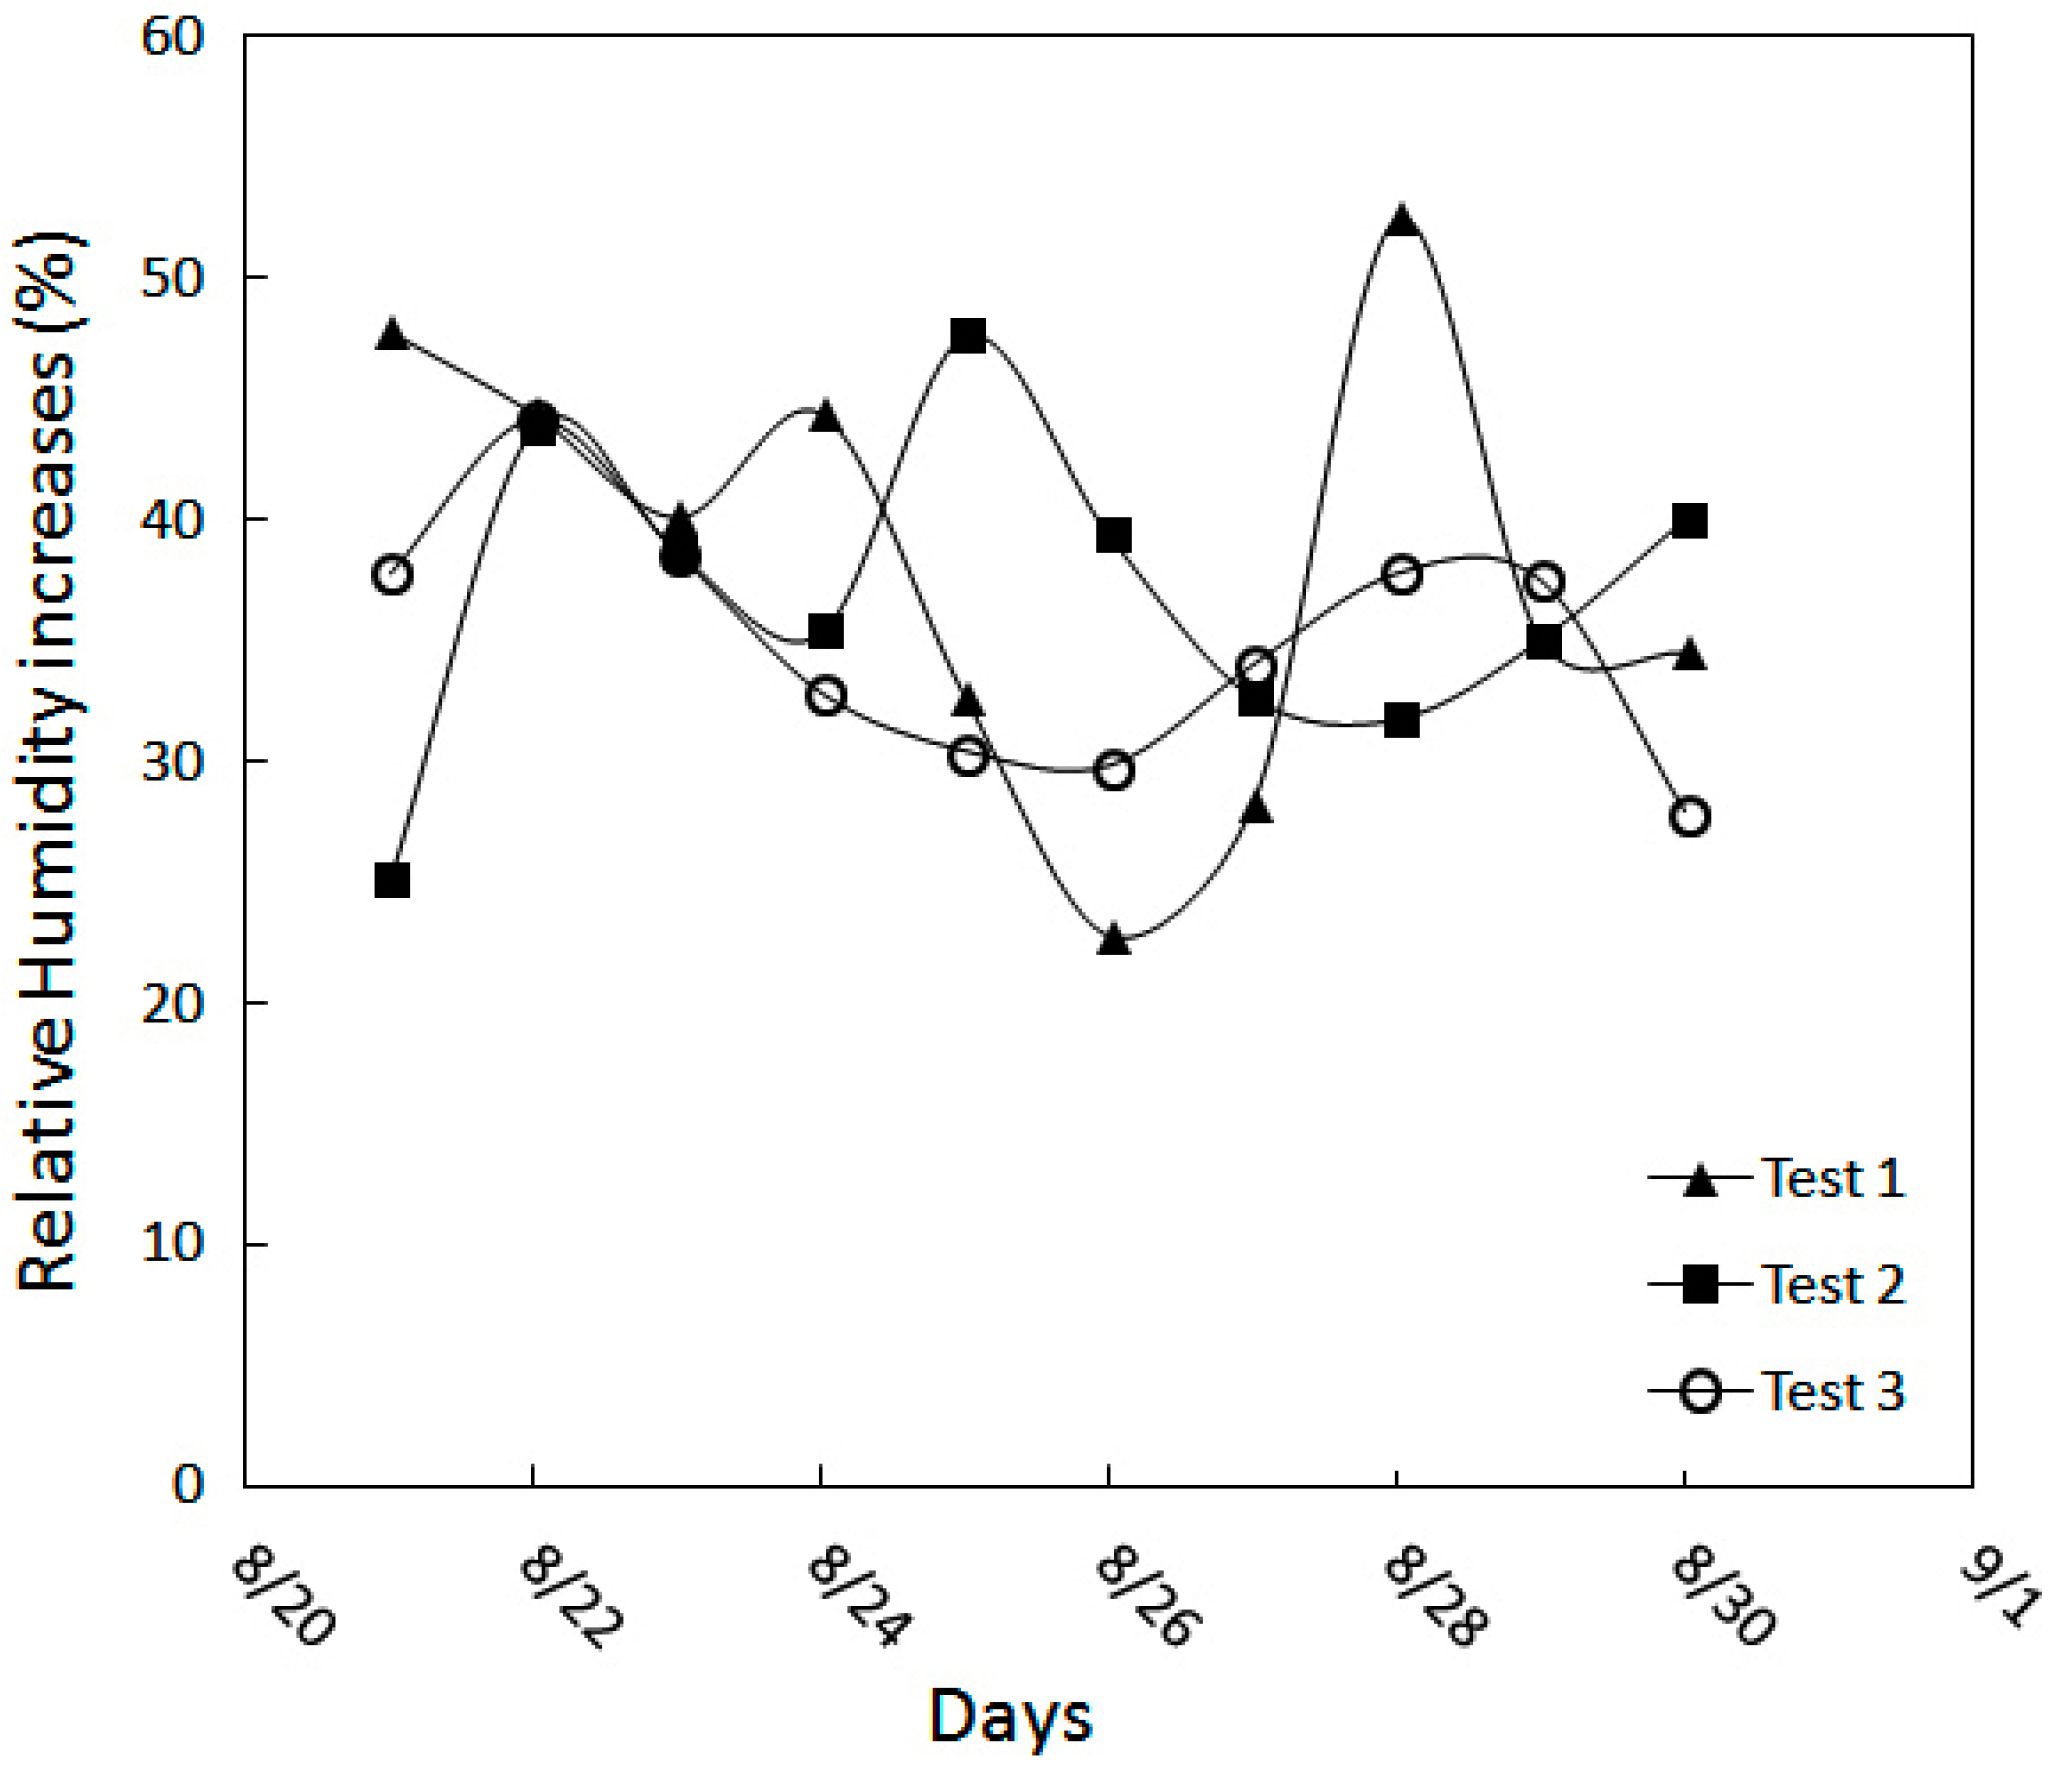
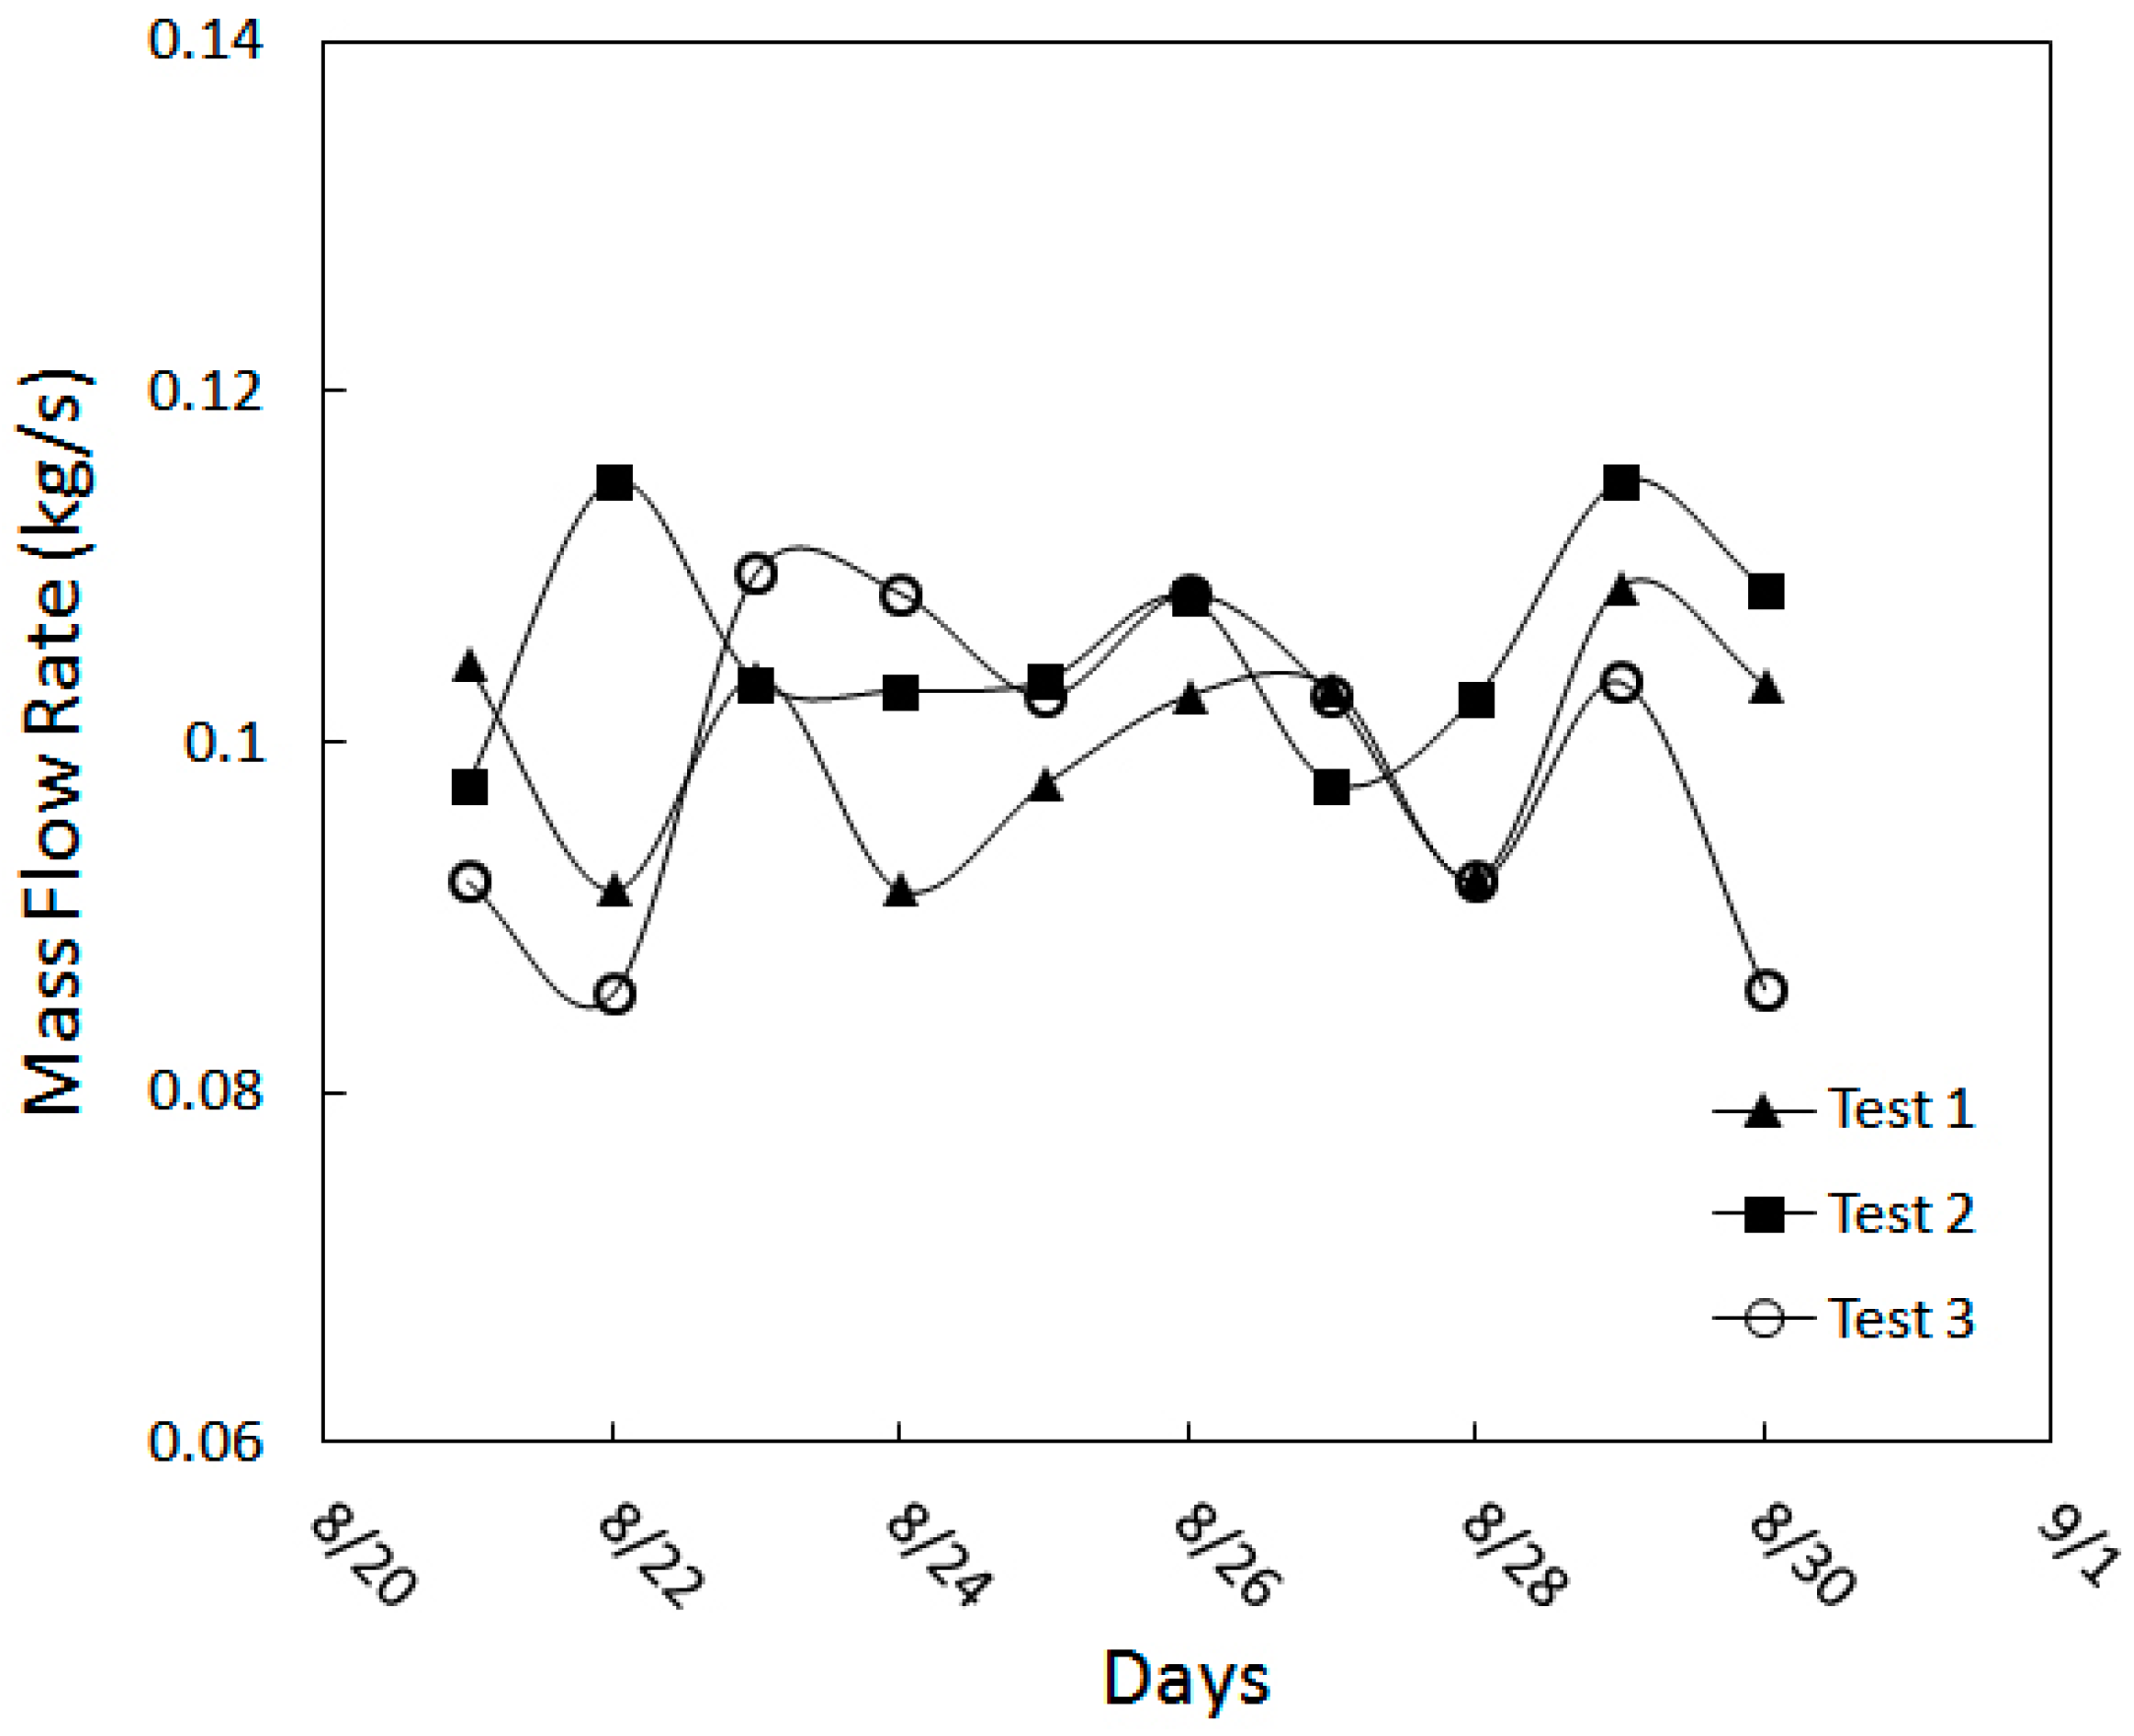
Data for these tests were collected before noon (10:00 a.m.), at noon (12:00 p.m.) and in the afternoon (4:00 p.m.) for ten continuous days from 21 to 30 of August 2013. Table 3 illustrates recorded data for test Nos. 1, 2 and 3. Figure 10 shows the amount of reduction in dry bulb temperature of the air, and Figure 11 shows the rise in RH of the air using the wind tower. Furthermore, Figure 12 shows the amount of mass flow rate of ventilated air entering the room from the wind tower.
4.2.2. Test No. 4
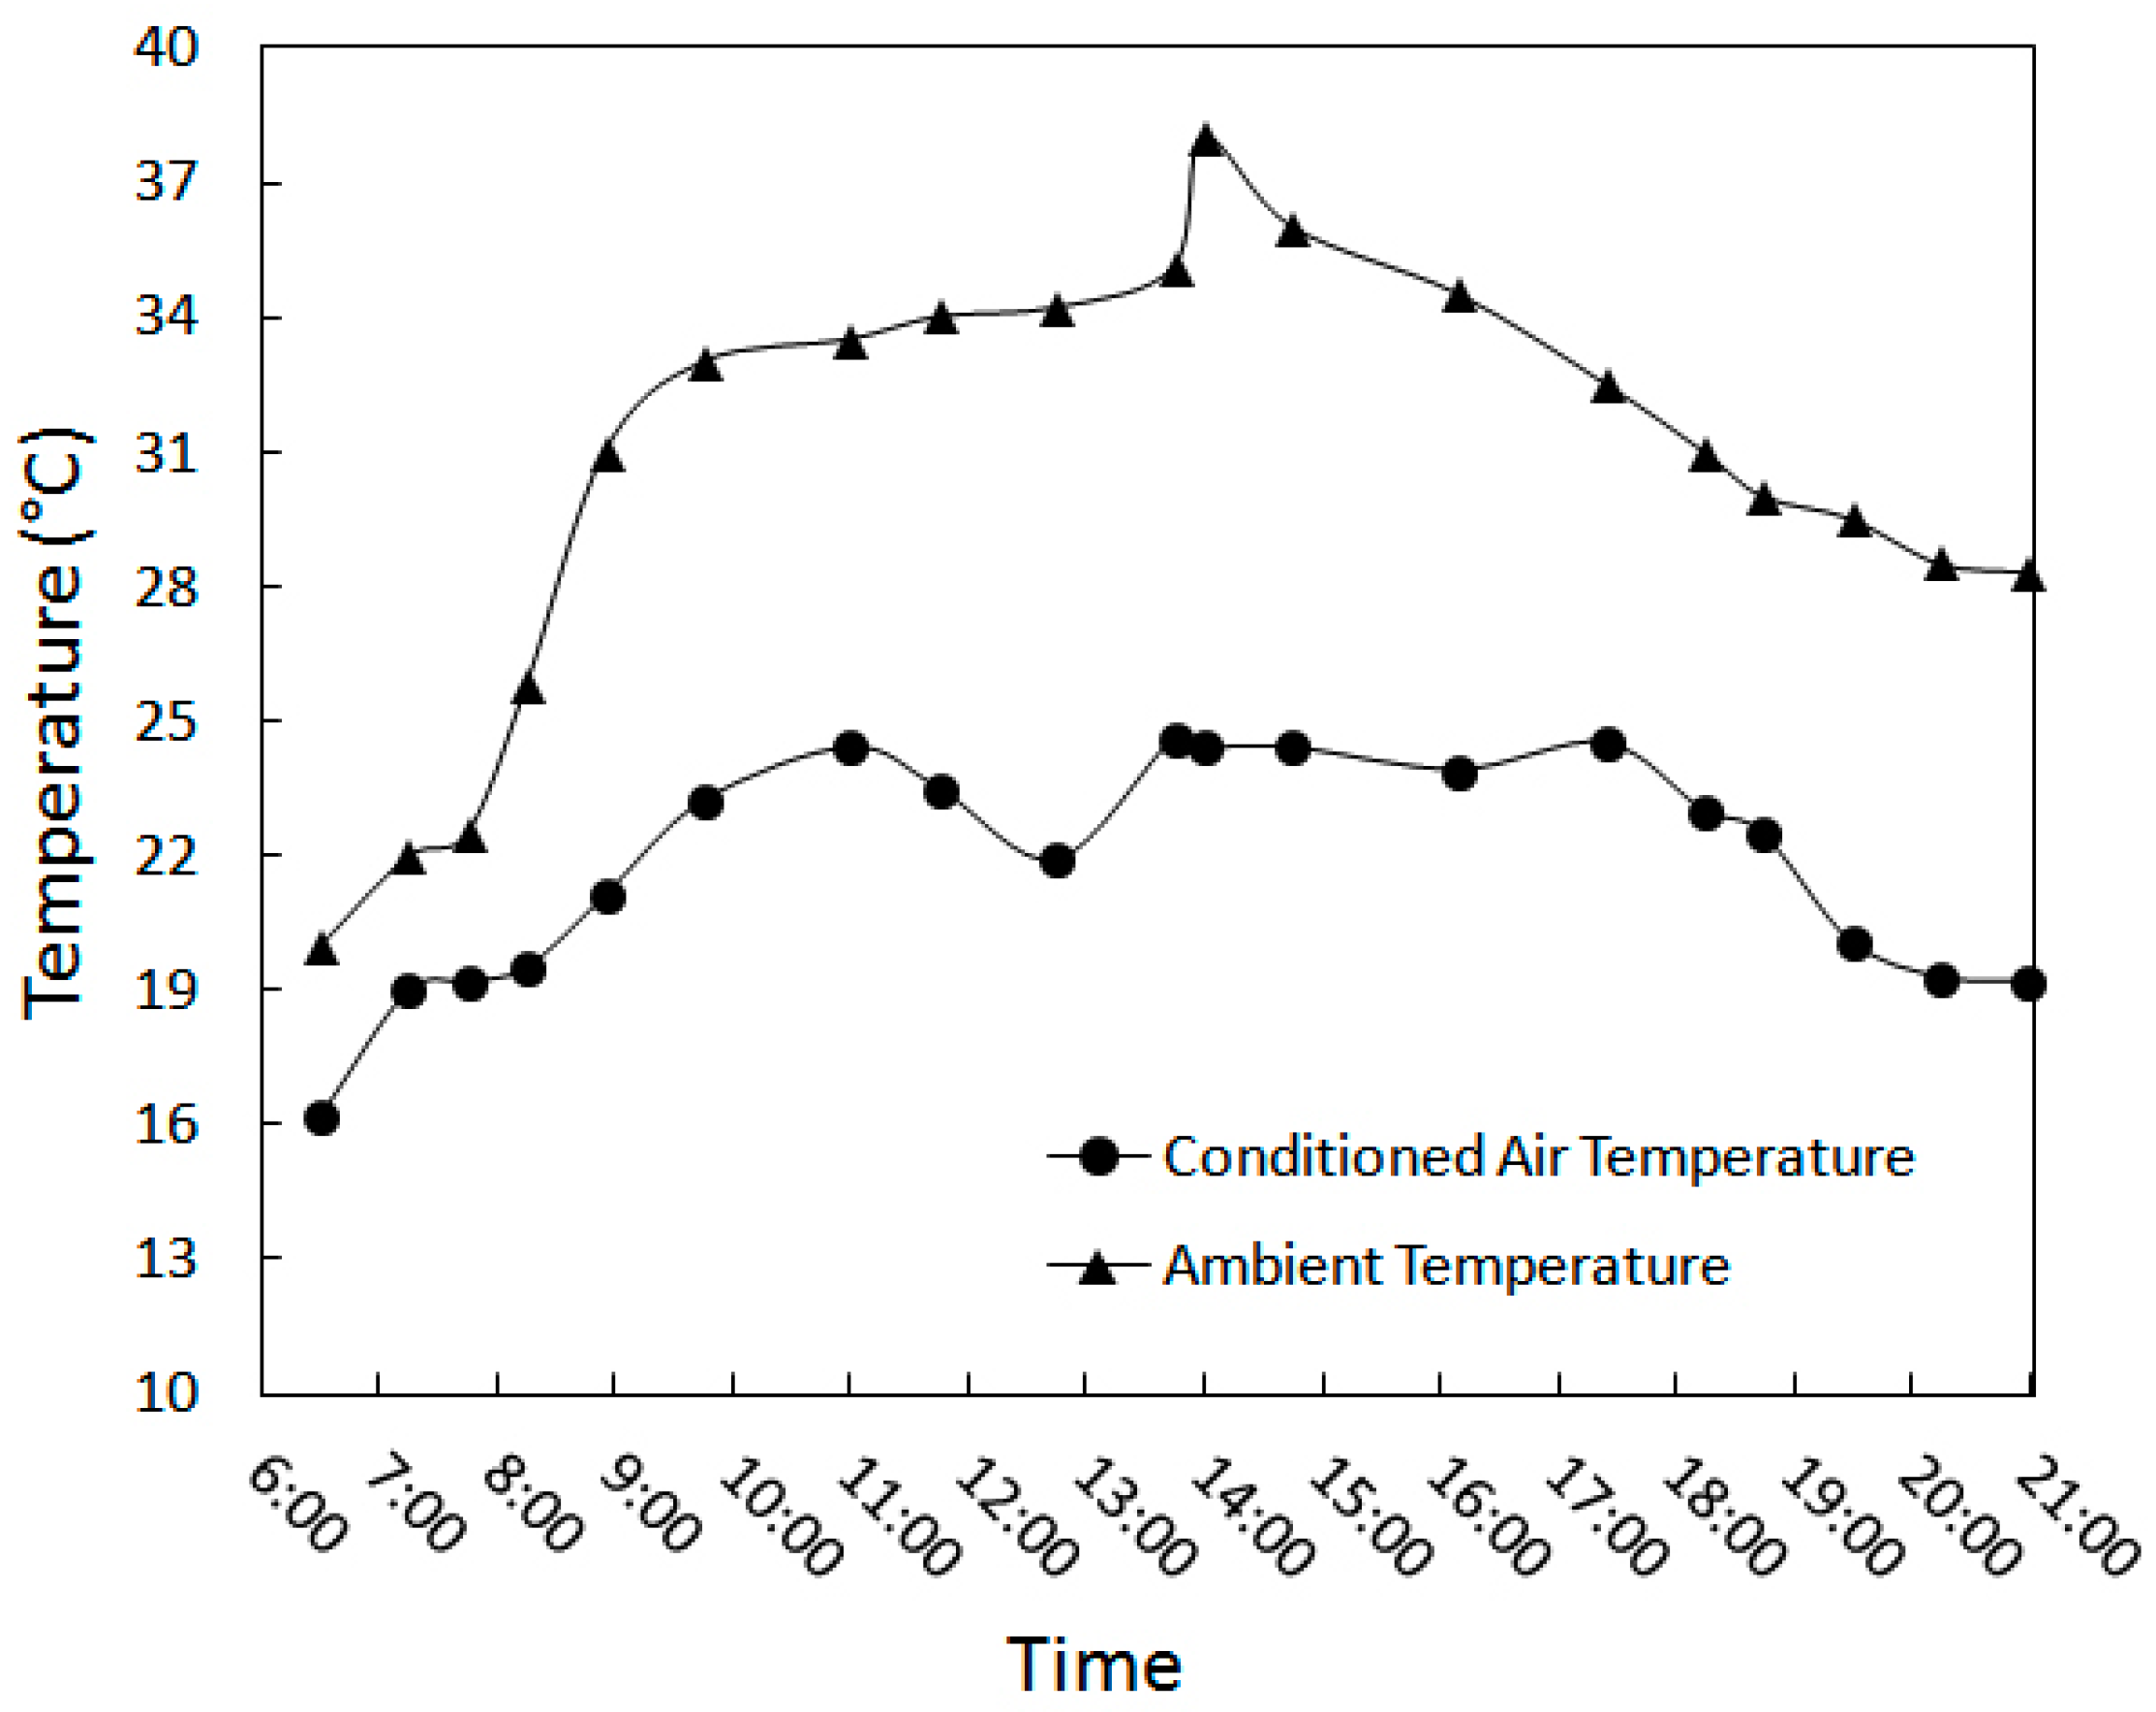
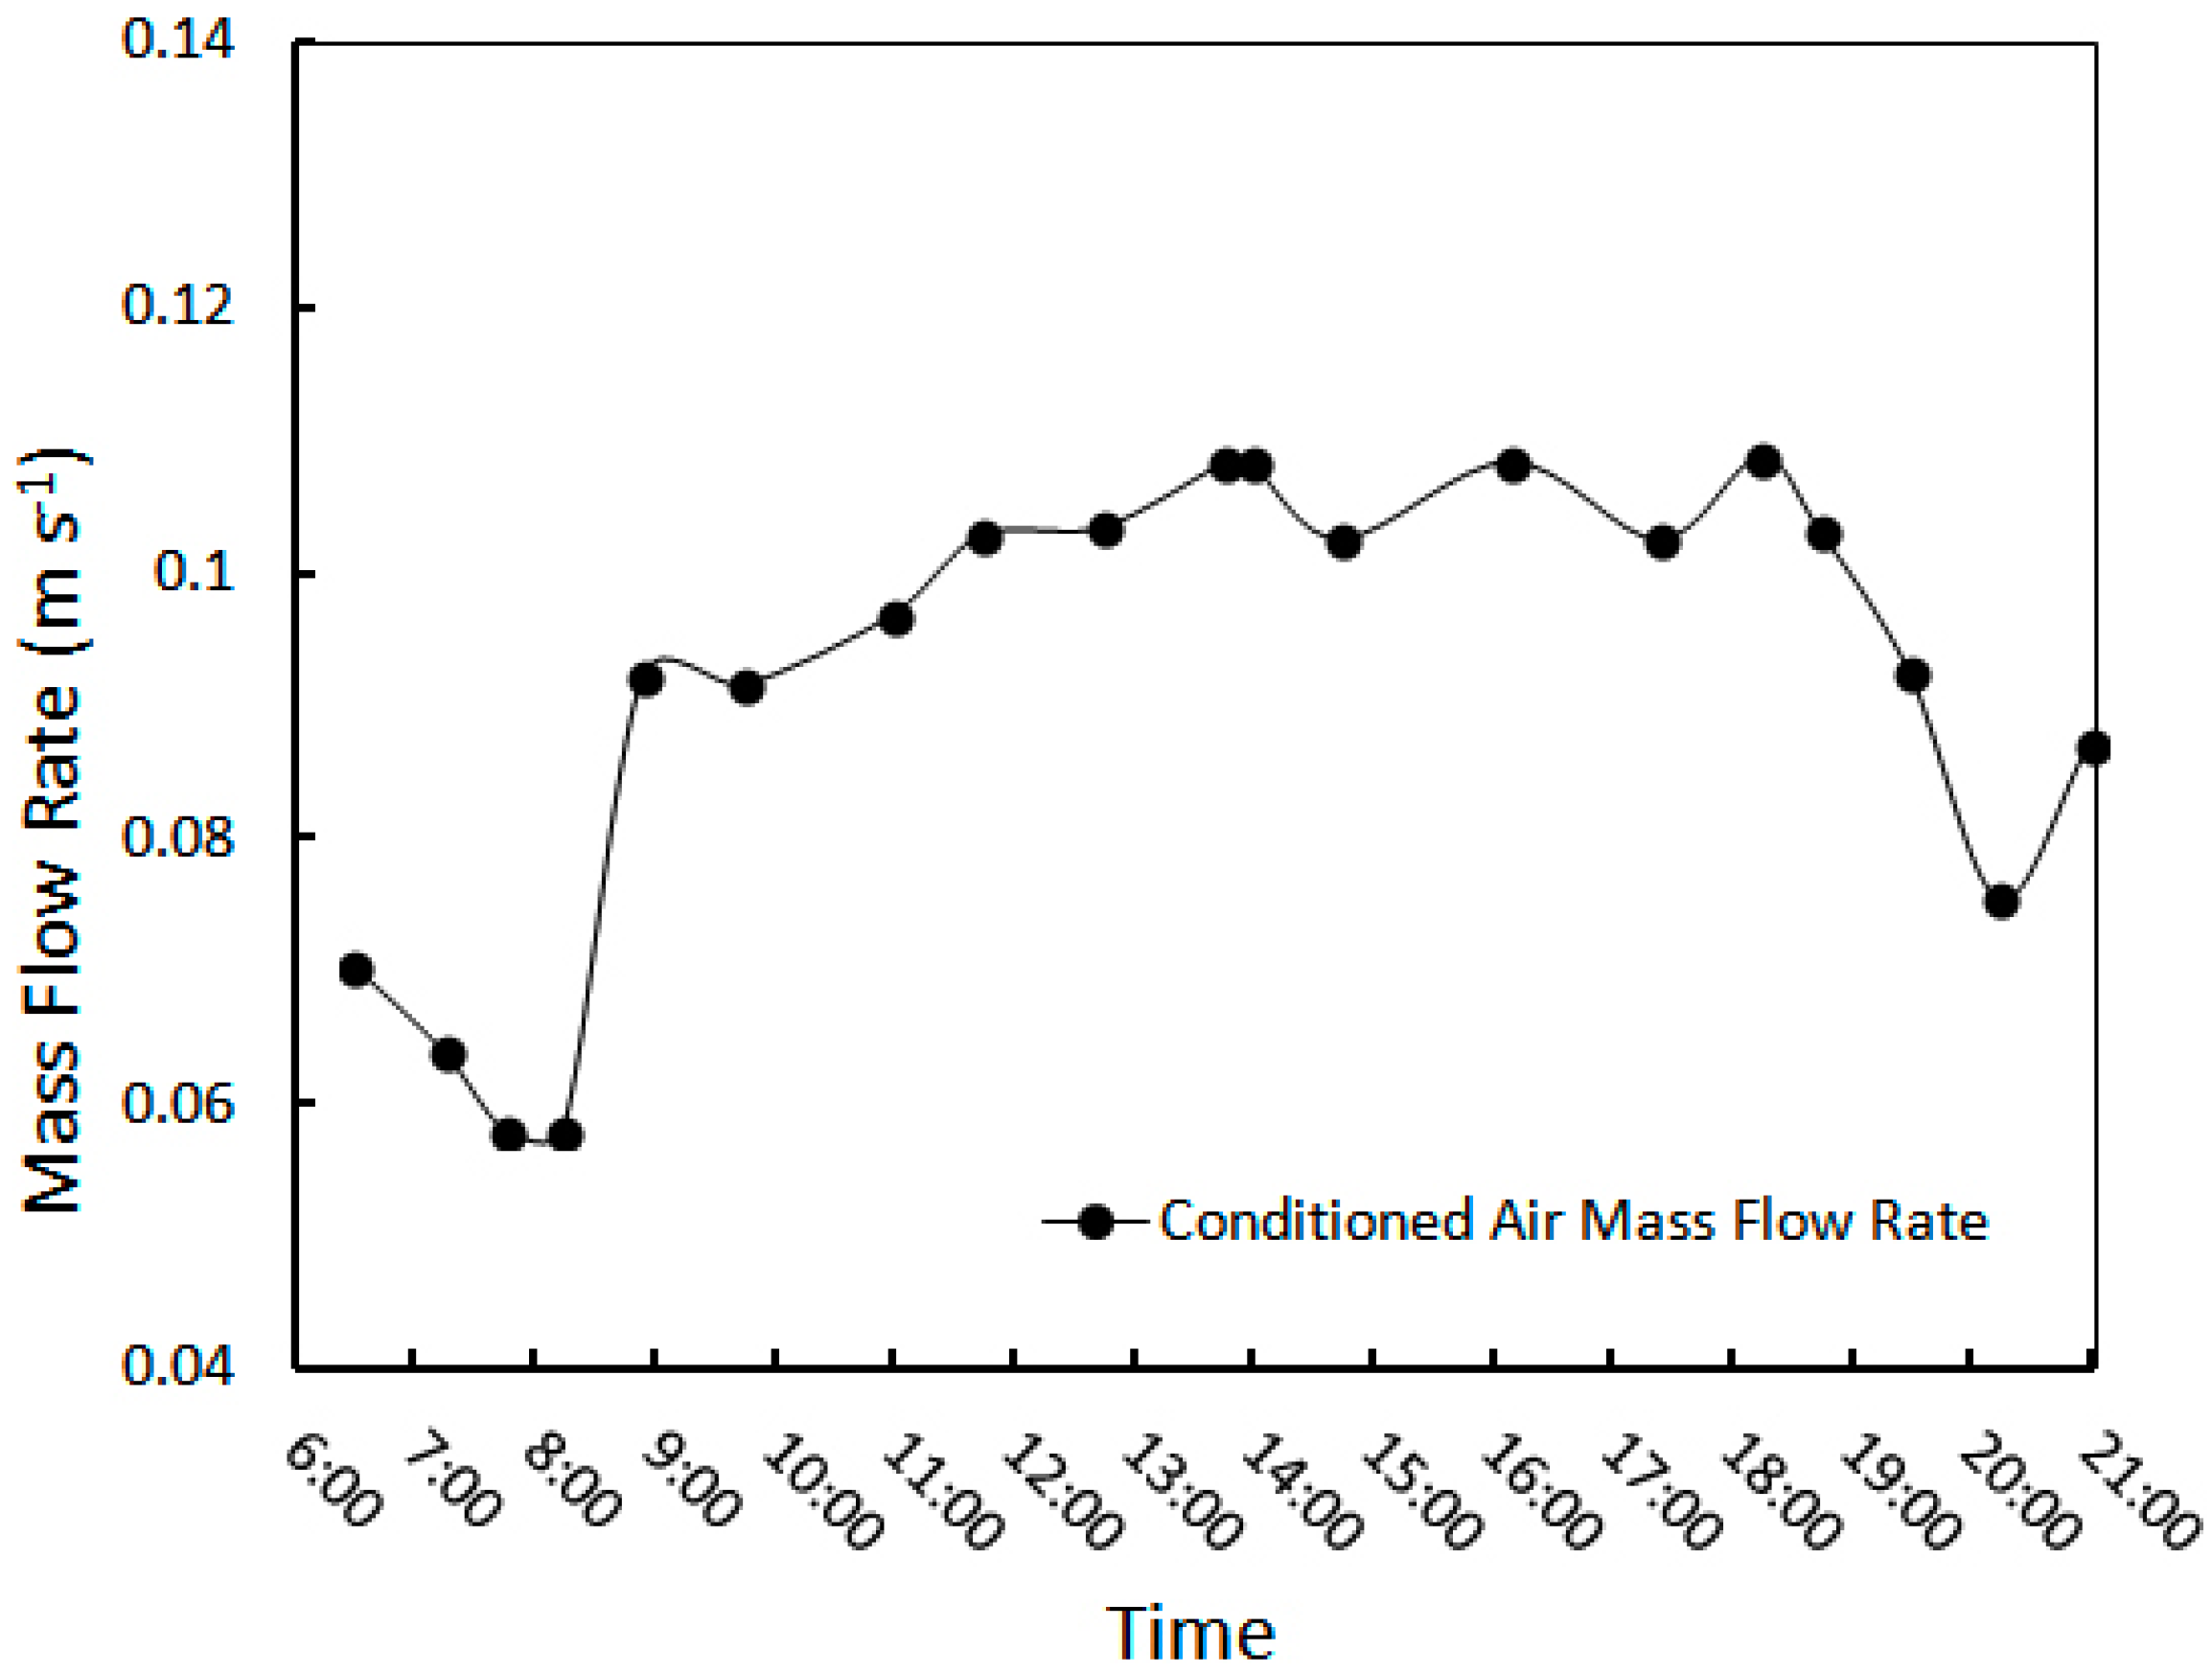
This test was for one day, 24 August 2013, from 6:30 a.m. to 9:00 p.m. Table 4 includes the recorded data for test No. 4. Figure 13 shows the air temperature at the wind tower outlet and of the ambient air. Figure 14 shows the amount of RH of the air at the wind tower outlet and the ambient air temperature. Furthermore, Figure 15 shows the mass flow rate of ventilated air entering the room from the wind tower.
4.2.3. Test No. 5
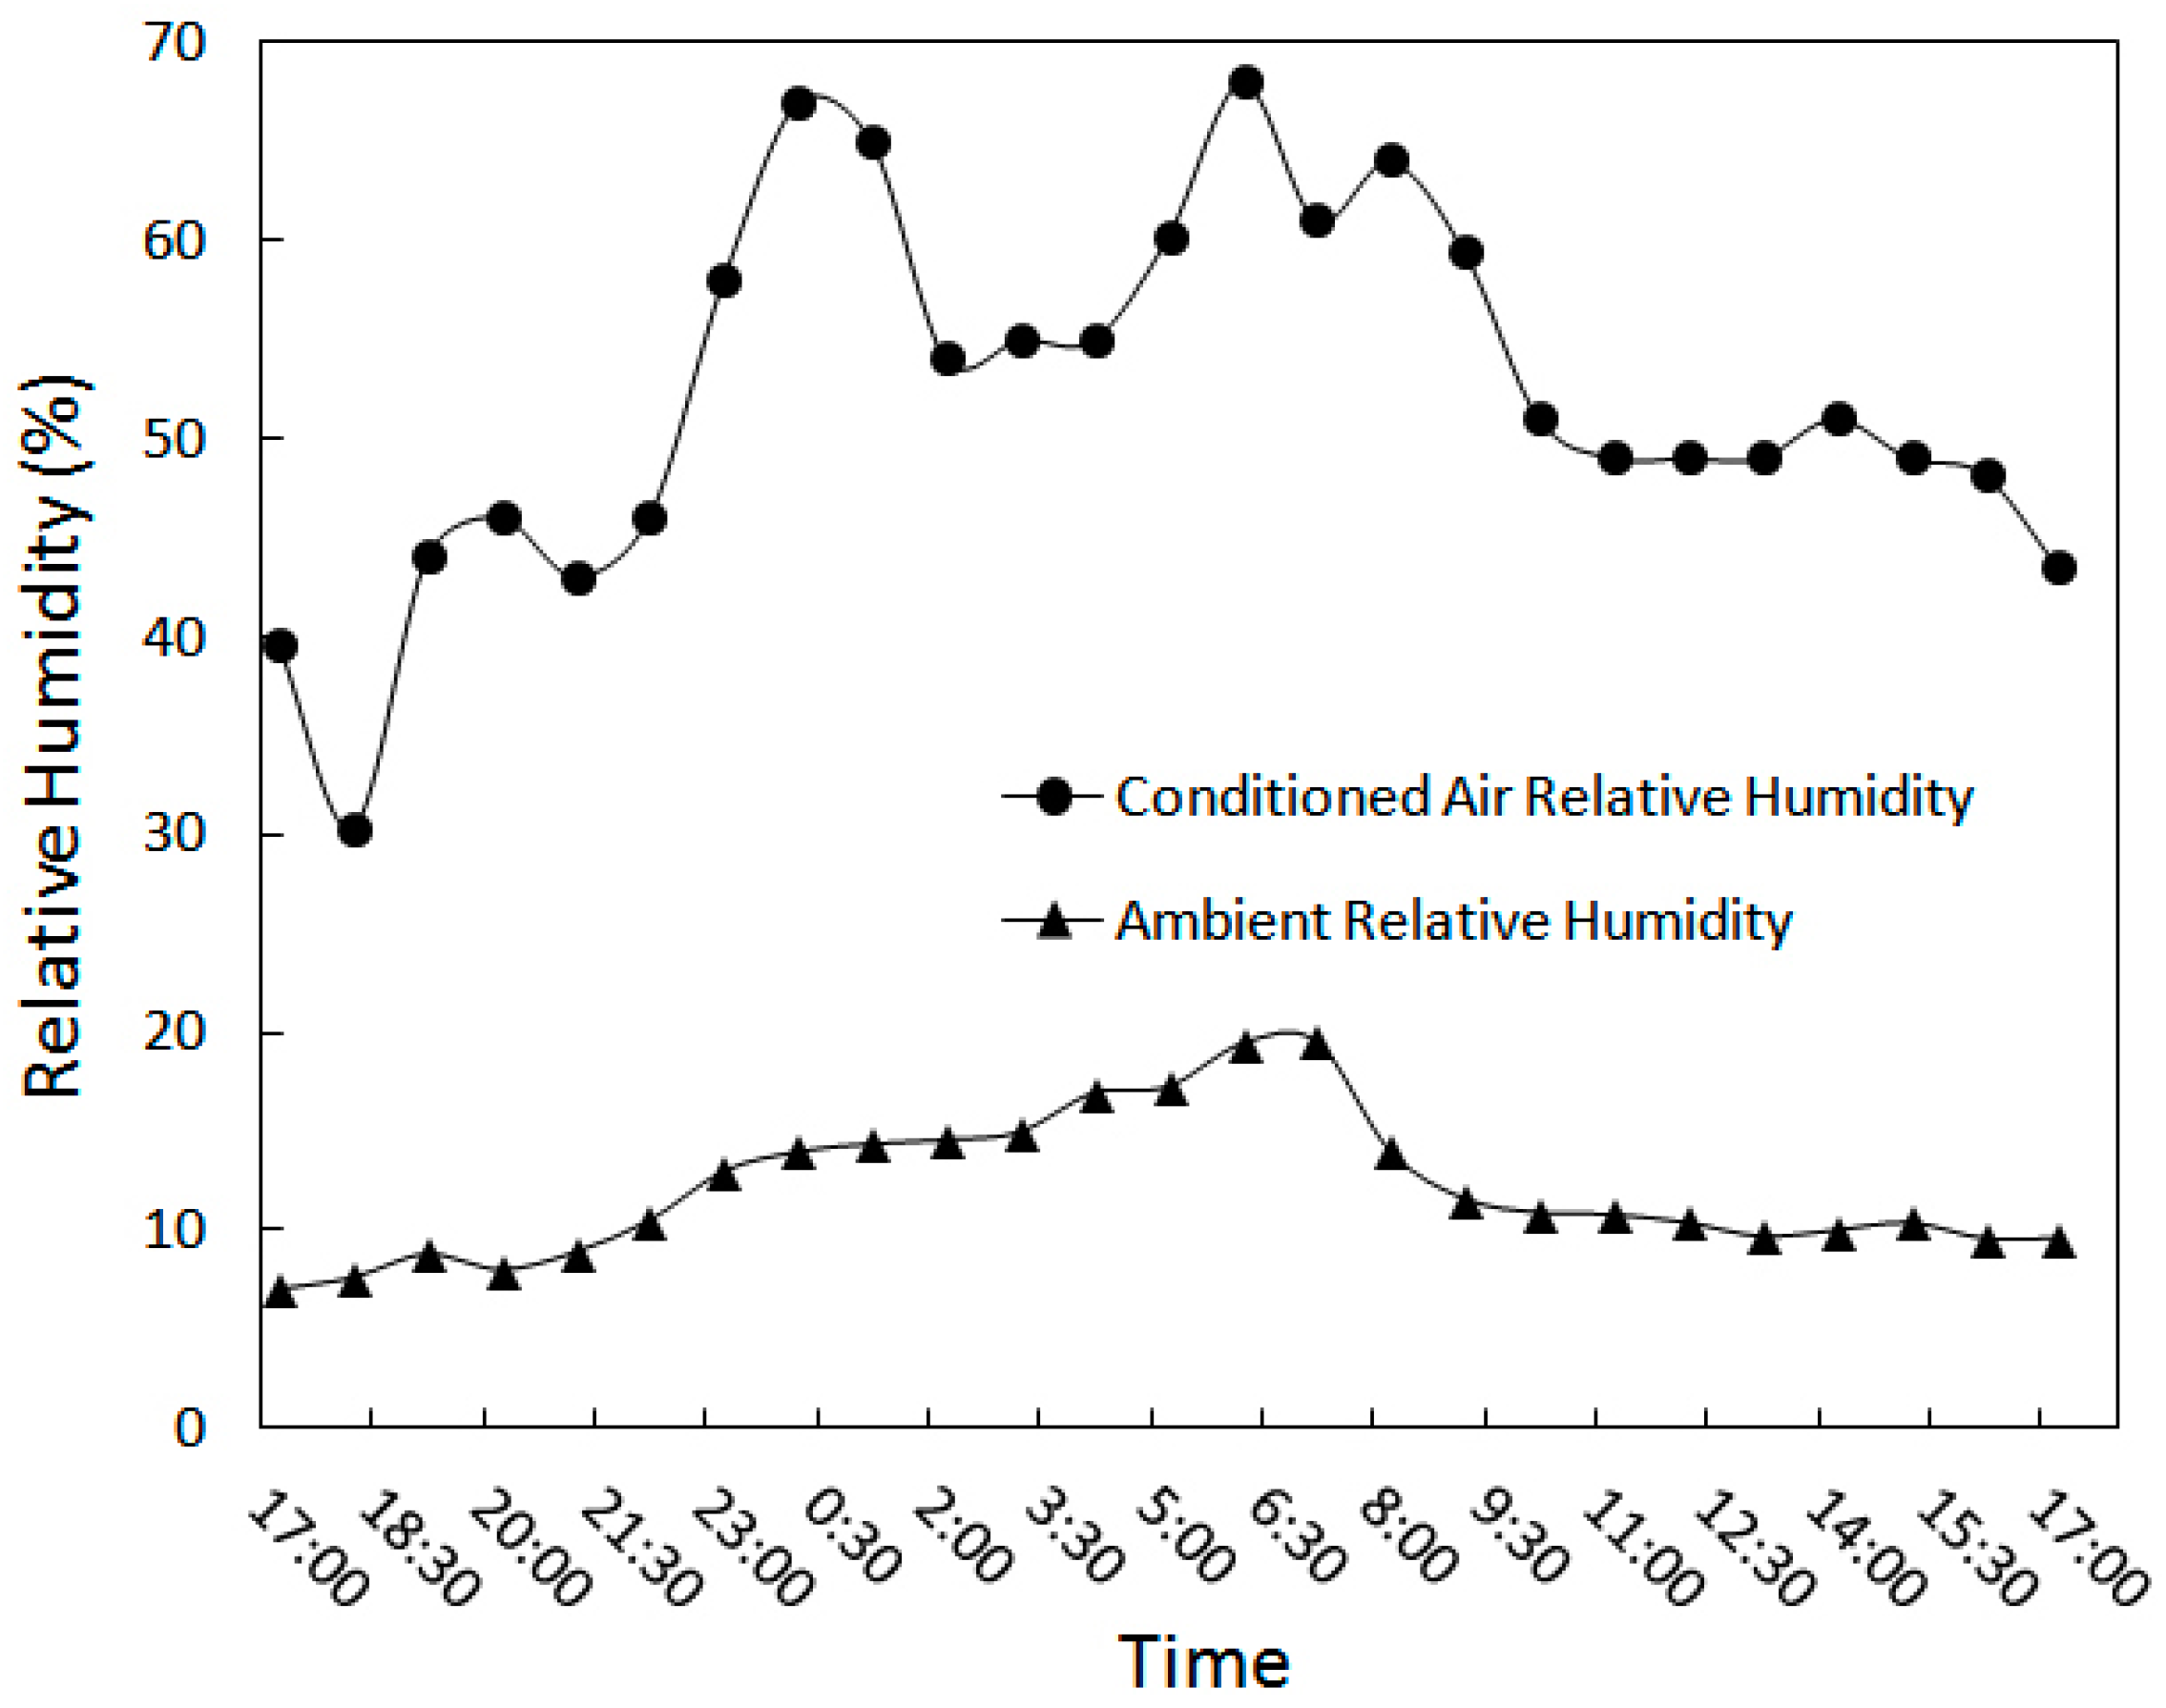
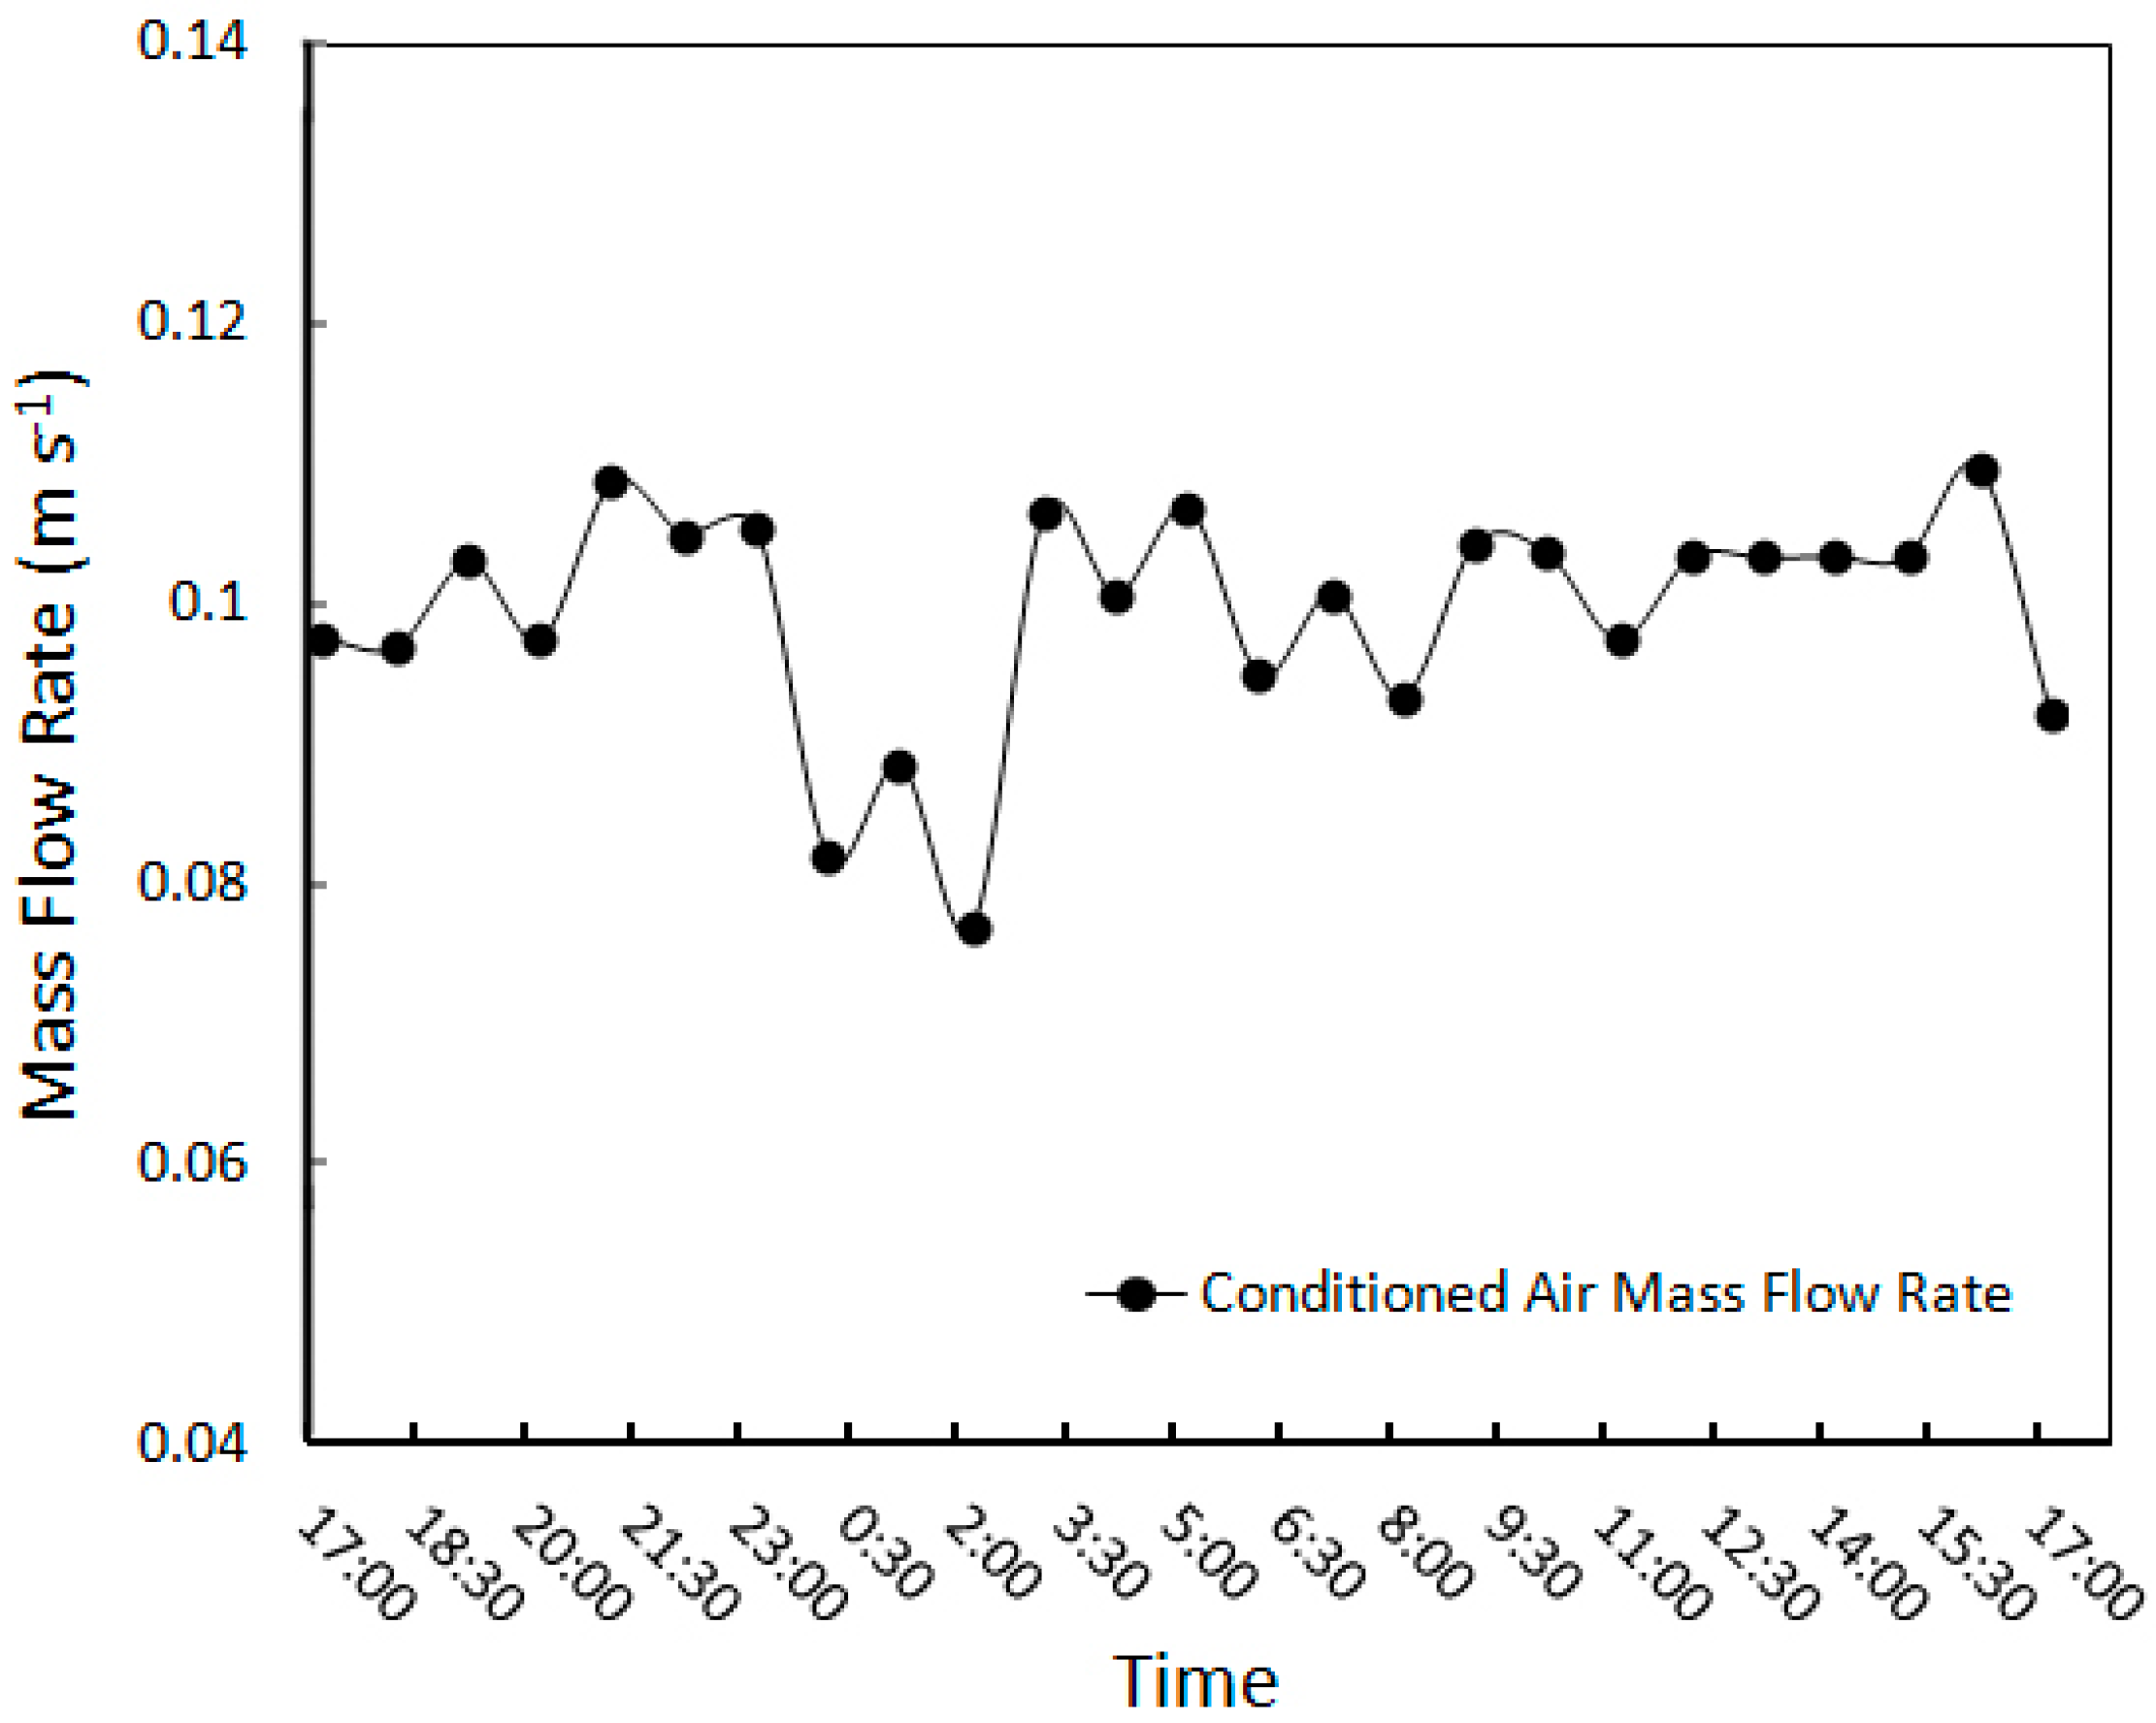
This test is for a 24-h data recording, from 5:15 p.m. on the 22nd to 5:15 p.m. on the 23rd of August 2013. Table 5 illustrates recorded data for test No. 5. Figure 16 shows the air temperature at the wind tower outlet and the ambient air. Figure 17 demonstrates the amount of RH of air at the wind tower outlet and the ambient air. Figure 18 shows the amount of mass flow rate of the conditioned air entering the room from the wind tower.
5. Discussions
5.1. Temperature Reduction
According to the data collected during the five mentioned tests, the highest, lowest and average measured dry bulb temperature of ambient air were as follows:
- Maximum ambient air temperature = T1-max = 38.0 °C
- Minimum ambient air temperature = T1-min = 17.3 °C
- Average ambient air temperature = T1-ave = 30.3 °C
Table 6 illustrates the highest, lowest and average dry bulb temperature of the conditioned air entering the room from the wind tower outlet for both analytical and experimental results. Additionally, the amount of maximum, minimum and average decrease in air temperature is presented in Table 7.
Note that the minimum data were measured at midnight. As a result, the experimental and analytical results illustrate that the average air temperature entering the room was approximately 21 °C when the average ambient air temperature was 30.3 °C. In other words, the modular wind tower can significantly decrease the air temperature entering the room.
5.2. Increase in Relative Humidity
The highest, lowest and average RH of ambient air were equal to:
- Maximum air ambient RH = ϕ1-max = 19.6%
- Minimum air ambient RH = ϕ1-min = 6%
- Average air ambient RH = ϕ1-ave = 10%
Note that the above maximum value of RH (19.6%) was measured in the middle of the night and early morning. If midnight measurements were ignored, the average RH of ambient air was around eight percent. Furthermore, the highest, lowest and average RH of air entering the room from the wind tower outlet were as follows:
- Maximum exit RH = ϕ6-max = 68%
- Minimum exit RH = ϕ6-min = 30%
- Average exit RH = ϕ6-ave = 49%
The highest, lowest and average increase in the amount of RH of air using the wind tower were equal to:
- Maximum increase in RH = ∆ϕmax = 53%
- Minimum increase in RH = ∆ϕmin = 23%
- Average increase in RH = ∆ϕave = 39%
The RH plays an important role in the thermal comfort of building inhabitants in hot, arid zones. Thus, the proposed wind tower can substantially increase the amount of RH of air entering the room.
5.3. Mass Flow Rate
According to the data collected through measurements and the analytical results, the highest, lowest and average air speed measured at the outlet of the wind tower and entering the room are shown in Table 8.
The mass flow rate entering the room was calculated using the following relation:
By considering the air as an ideal gas, the amount of ρ was computed by:
In the equation above, P is the average air pressure in Kerman (Pa), and T is in unit K. Therefore, the highest, lowest and average amount of mass flow rate from the wind tower outlet entering the room were equal to:
- Maximum mass flow rate = = 0.1149 kg·s−1
- Minimum mass flow rate = = 0.0580 kg·s−1
- Average mass flow rate = = 0.0982 kg·s−1
These results display that the wind tower can provide a mass flow rate entering the room when the wind speed is zero because of buoyancy force. As a result, the efficiency of the proposed wind tower will increase significantly when the wind speed is not zero. According to the results obtained, the modular wind tower with wetted surfaces, which was built and tested for the first time, could be a practical and satisfactory alternative for natural cooling of buildings in hot and arid zones. To use this technology, computational modeling should be performed in order to apply the modular wind tower to different types of buildings and weather conditions.
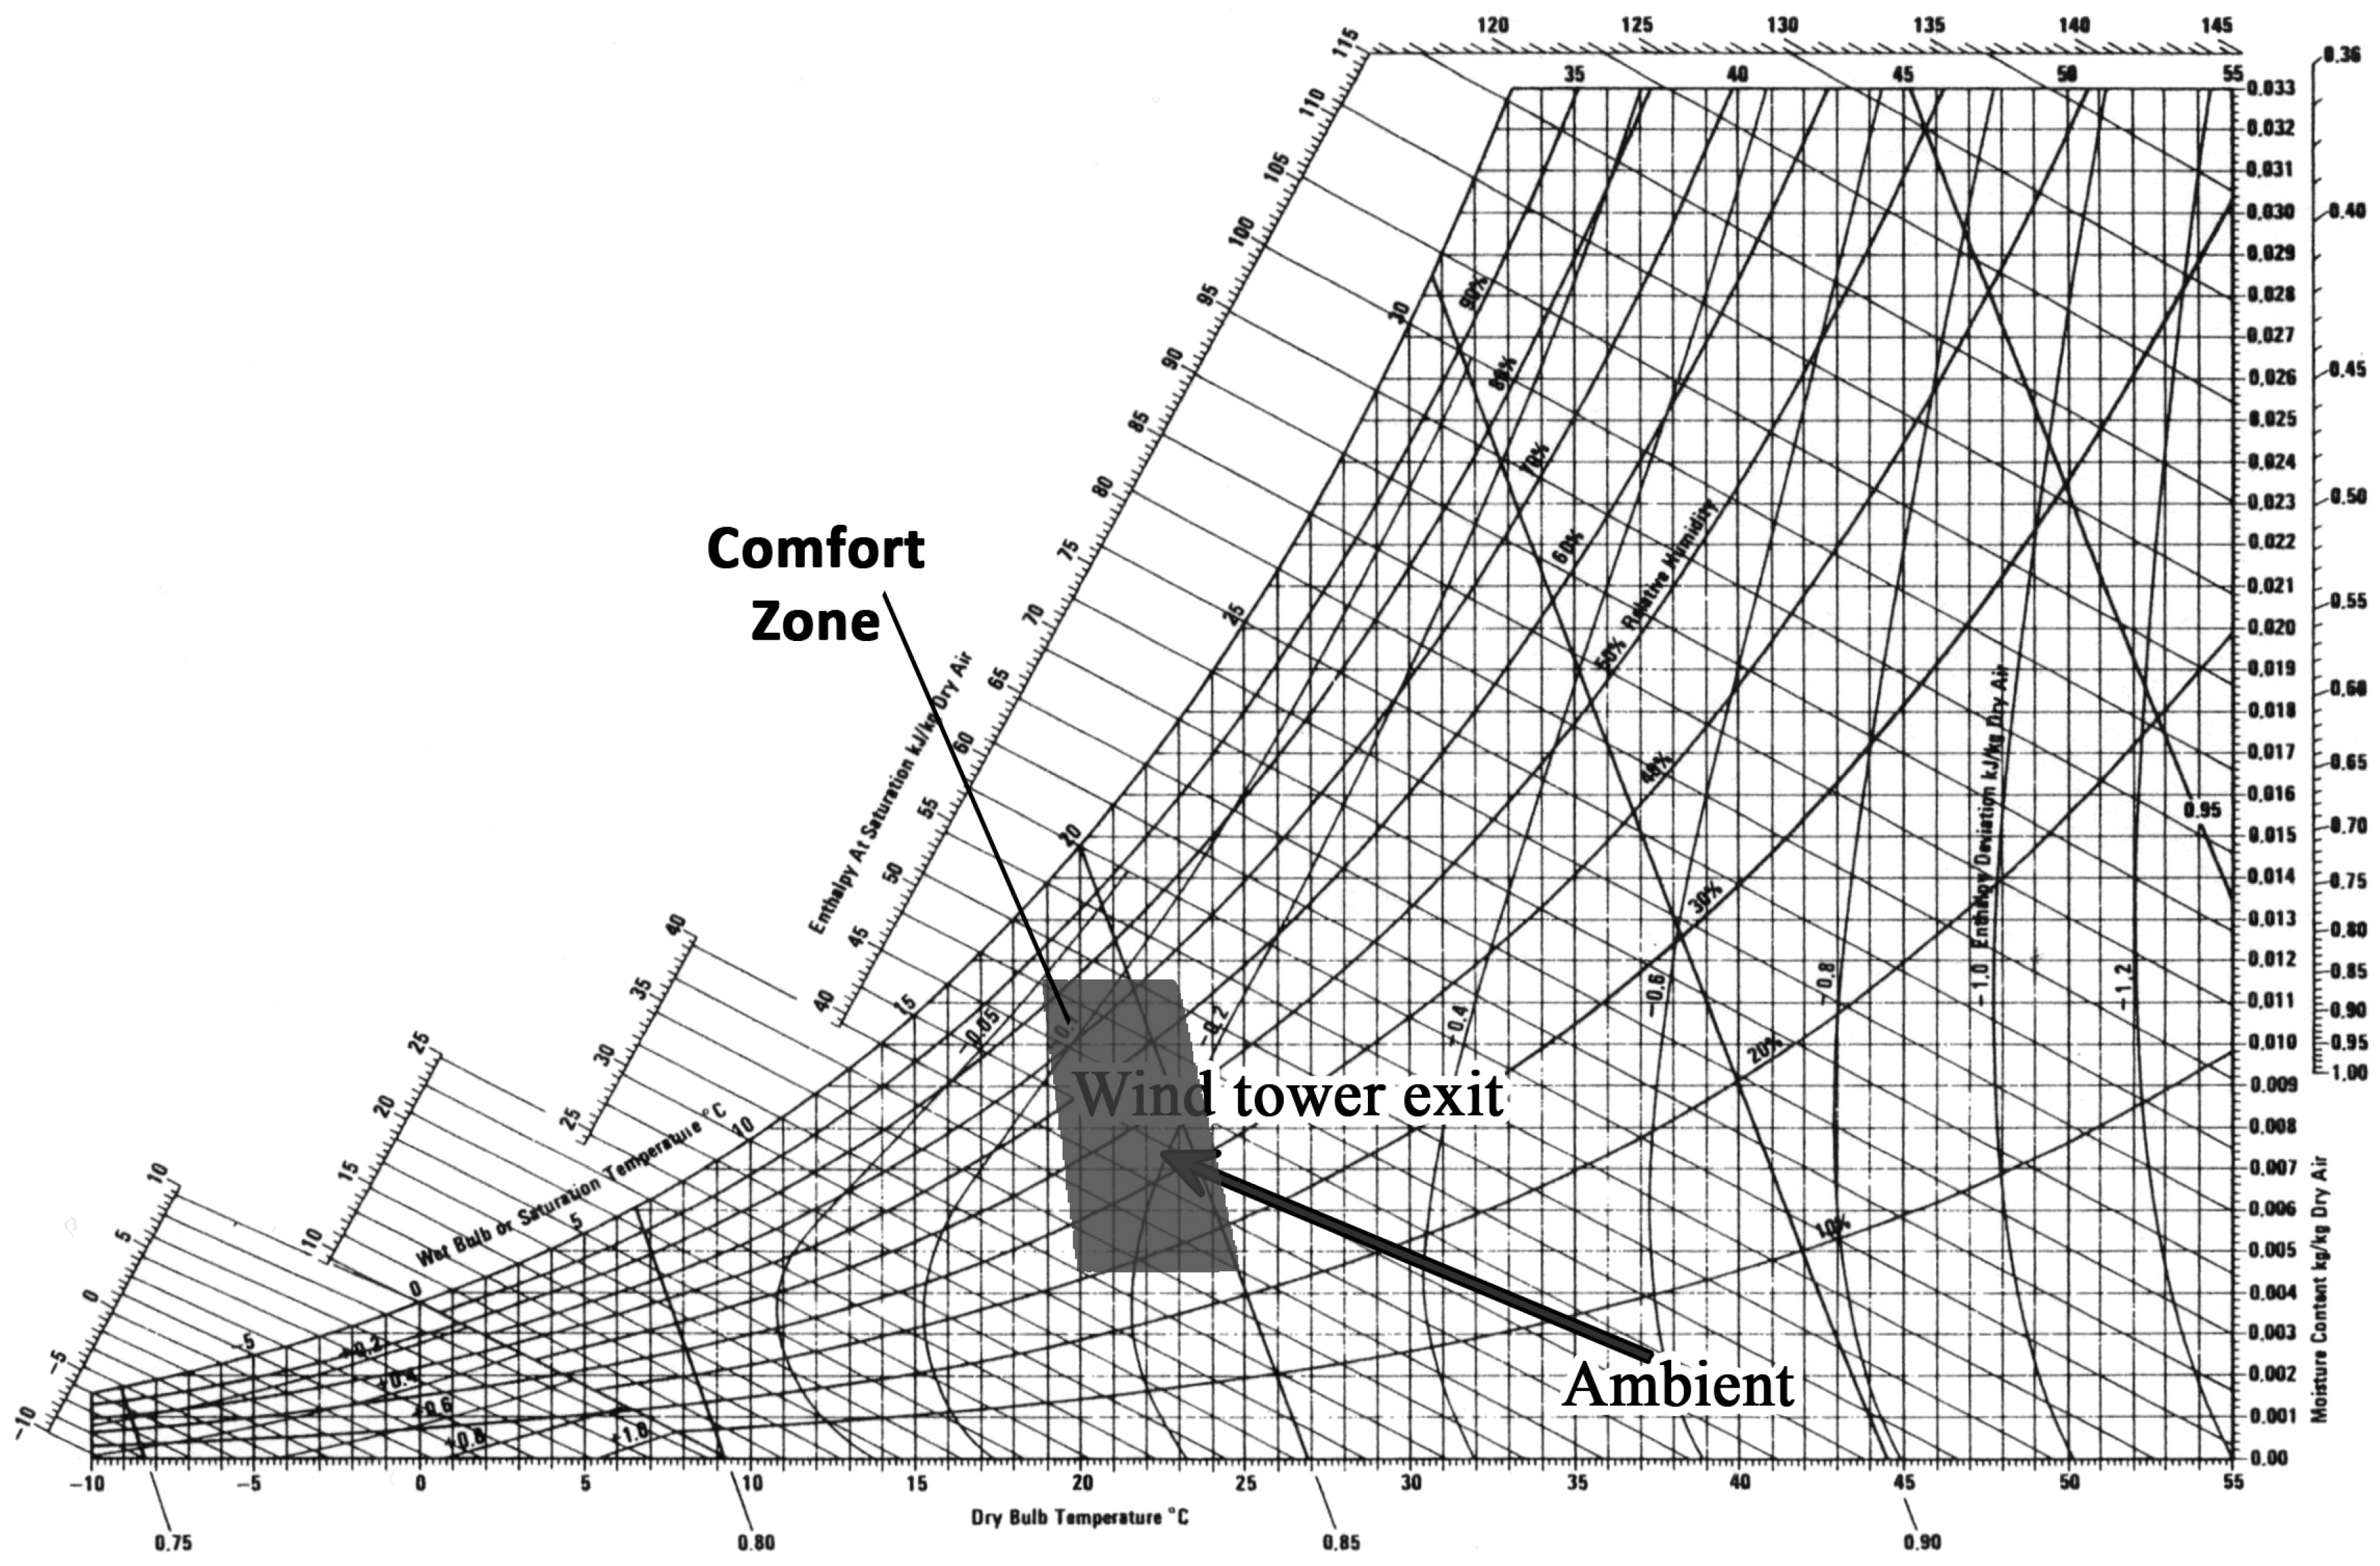
To show a more tangible performance of the proposed wind tower, Figure 19 displays the air property changes at a sample point by using a modular wind tower with wetted surfaces on a psychrometric chart. A psychrometric chart is a graphical illustration of changes in the physical and thermodynamic properties of air. In the psychrometric chart, there is a zone called the comfort zone, which represents thermal comfort conditions, and air conditioning systems designed by engineers must be able to provide indoor air conditions in that zone [42]. Sample data shown in Figure 19 were taken at 13:45 on 26 August 2013. The direction of the arrow in the psychrometric chart indicates ambient air changes by cooling and humidifying processes while passing through the wind tower. As can be observed in Figure 19, RH of ambient air increased from 7% (ambient air) to 44.3% (at the wind tower outlet). Furthermore, ambient air temperature decreased from 37.2°C to 22.5 °C. As a result, the proposed modular wind tower can provide conditions of greatly increased comfort for building inhabitants.
6. Conclusions
The experimental and analytical results presented in this paper clearly illustrate that using this new design of wind tower makes the air inside the building closer to thermal comfort conditions. The results obtained show that a wind tower with wetted surfaces can reduce air temperature and increase air humidity by an average of approximately 10 °C and 40%, respectively. It was observed that when ambient air temperature is more than 35 °C and RH is under 10% without any wind, this wind tower is capable of altering the air properties to less than 23 °C with an RH of around 45%. Note that the modular wind tower with wetted surfaces has a better performance when the wind speed is not zero. The only electricity usage is for the electric water pump, which keeps the straw wet. It should be noted that Kerman (as well as other cities where wind towers are used) is located in a sunny region; therefore, by providing the needed electricity for the water pump using solar cells, this air conditioning system becomes completely passive. Thus, during the warm days of summer, the thermal comfort for the residents of a building can be provided without any use of electrical energy from the grid.
To develop the modular wind tower, more research is required. Future research could consider: (1) simulation and computational fluid dynamic (CFD) modeling to evaluate the performance of the proposed wind tower in different conditions and (2) the development of a code to provide software that can calculate the optimal cross-section and height of a modular wind tower for utilization in different houses.
Acknowledgments
The authors express their deepest gratitude to the following persons who, in one way or another, contributed to making this study possible: Akbar, Tahereh, and Sakineh Ghazvini, for providing the location of the experimental tests and their financial support; Maziar Salmanzadeh and Reza Ghotbaddini for their help in providing measuring instruments.
Author Contributions
Mehdi N. Bahadori gives the idea, Mehdi N. Bahadori, Ahmad Nourbakhsh and Sajad M.R. Khani conceived and designed the experiments; Sajad M.R. Khani performed the experiments; Sajad M.R. Khani and Alireza Dehghani-Sanij analyzed the data; Mehdi N. Bahadori, Sajad M.R. Khani and Alireza Dehghani-Sanij contributed reagents/materials/analysis tools; Alireza Dehghani-Sanij and Sajad M.R. Khani wrote the paper.
Conflicts of Interest
The authors declare no conflict of interest.
References
- Bahadori, M.N. Passive Cooling Systems in Iranian Architecture. Sci. Am. 1978, 238, 144–145. [Google Scholar] [CrossRef]
- Bahadori, M.N. Natural Cooling in Hot Arid Regions. In Solar Energy Application in Buildings; Sayigh, A.A.M., Ed.; Academic Press Inc.: New York, NY, USA, 1977; pp. 195–225. [Google Scholar]
- Bahadori, M.N.; Dehghani-Sanij, A.R. Wind Towers: Architecture, Climate and Sustainability; Sayigh, A.A.M., Ed.; Springer: Basel, Switzerland, 2014. [Google Scholar]
- Mazidi, M.; Dehghani, A.R.; Aghanajafi, C. Wind Towers’ Role in Natural Air Conditioning and Passive Cooling of Buildings in Hot, Arid Regions. WSEAS Trans. Fluid Mech. 2006, 1, 959–966. [Google Scholar]
- Dehghani, A.R.; Aghanajafi, C. Experimental Study of Performance of Two New Wind Tower Designs and Their Comparison with Traditional Wind Towers. Iran. J. Energy 2005, 9, 14–26. [Google Scholar]
- Dehghani-Sanij, A.R. Cisterns: Sustainable Development, Architecture and Energy; Sayigh, A.A.M., Ed.; River Publishers: Aalborg, Denmark, 2016. [Google Scholar]
- Razavi, M.; Dehghani-Sanij, A.R.; Khani, M.R.; Dehghani, M.R. Comparing Meshless Local Petrov- Galerkin and Artificial Neural Networks Methods for Modeling Heat Transfer in Cisterns. Renew. Sustain. Energy Rev. 2015, 43, 521–529. [Google Scholar] [CrossRef]
- Dehghan, A.A.; Dehghani, A.R. Experimental and Theoretical Investigation of Thermal Performance of Underground Cold-water Reservoirs. Int. J. Therm. Sci. 2011, 50, 816–824. [Google Scholar] [CrossRef]
- Siahoui, H.A.; Dehghani, A.R.; Razavi, M.; Khani, M.R. Investigation of Thermal Stratification in Cisterns Using Analytical and Artificial Neural Networks Methods. J. Energy Conver. Manag. 2011, 52, 505–511. [Google Scholar] [CrossRef]
- Arefmanesh, A.; Dehghan, A.A.; Dehghani, A.R. Thermal Characteristics of an Underground Cold Water Reservoir: Analytical and Experimental Studies. Appl. Therm. Eng. 2009, 29, 3261–3265. [Google Scholar] [CrossRef]
- Razavi, M.; Dehghani, A.R.; Khanmohammadi, M. Simulation of Thermal Stratification in Cisterns Using Artificial Neural Networks. J. Energy Heat Mass Transf. 2009, 31, 201–210. [Google Scholar]
- Madoliat, R.; Razavi, M.; Dehghani, A.R. Modeling of Heat Transfer in Cisterns Using Artificial Neural Networks. J. Thermophys. Heat Transf. 2009, 23, 411–416. [Google Scholar] [CrossRef]
- Dehghani-Sanij, A.R.; Khani, M.R.; Zhang, B.; Narimannejad, S.; Mohammadni, M. Water Quality Analysis of Underground Reservoirs in Hot and Arid Regions. J. Appl. Environ. Biol. Sci. 2016, 6, 149–161. [Google Scholar]
- Dehghani-Sanij, A.R.; Khani, M.R.; Jalali, A.; Khani, M.; Narimannejad, S. Evaluation of Water Quality of Cisterns. Int. J. Environ. Resour. 2015, 4, 1–8. [Google Scholar] [CrossRef]
- Khani, M.R.; Yaghmaeian, K.; Dehghani, A.R. An Experimental Study in Passive Cooling Systems and Investigation of Their Role in Diminish Usage Energy and Environmental Pollutants. Int. J. Appl. Eng. Res. 2009, 4, 519–528. [Google Scholar]
- Masoso, O.T.; Grobler, L.J. The Dark Side of Occupants’ Behavior on Building Energy Use. Energy Build. 2010, 42, 173–177. [Google Scholar] [CrossRef]
- Saadatian, O.; Chin, H.L.; Sopian, K.; Sulaiman, M.Y. Review of Wind Catcher Technologies. Renew. Sustain. Energy Rev. 2012, 12, 1477–1495. [Google Scholar] [CrossRef]
- Chan, H.Y.; Riffat, S.B.; Zhu, J. Review of Passive Solar Heating and Cooling Technologies. Renew. Sustain. Energy Rev. 2010, 14, 781–789. [Google Scholar] [CrossRef]
- Bahadori, M.N. An Improved Design of Wind Towers for Natural Ventilation and Passive Cooling. Sol. Energy 1985, 36, 119–129. [Google Scholar] [CrossRef]
- Dehghani-Sanij, A.R.; Soltani, M.; Raahemifar, K. A New Design of Wind Tower for Passive Ventilation in Buildings to Reduce Energy Consumption in Windy Regions. Renew. Sustain. Energy Rev. 2015, 42, 182–195. [Google Scholar] [CrossRef]
- Archnet Website. Available online: http://archnet.org/library/dictionary/entry.jsp?entry_id=DIA0483 (accessed on 23 June 2017).
- The Toynbee Convector. Available online: https://davidderrick.wordpress.com/2007/12/19/hyderabad-sindh/ (accessed on 23 June 2017).
- Bahadori, M.N. Pressure Coefficients to Evaluate Air Flow Patterns in Wind Towers. In Proceedings of the International Passive and Hybrid Cooling Conference, Miami Beach, FL, USA, 6–16 November 1981; American Section of the International Solar Energy Society: Newark, DE, USA, 1981; pp. 206–210. [Google Scholar]
- Karakasanis, C.; Bahadori, M.N.; Vickery, B.J. A Study of the External Wind Pressure Distribution and the Estimation of Internal Ventilation Flows in Buildings Employing Wind Towers; Research Report BLWT-ss; University of Western Ontario: London, ON, Canada, 1984; Volume 25. [Google Scholar]
- Karakasanis, C.; Bahadori, M.N.; Vickery, B.J. Evaluation of Air Flow Rates in Employing Wind Towers. Sol. Energy 1986, 37, 363–374. [Google Scholar] [CrossRef]
- Bahadori, M.N. A Passive Cooling/Heating System for Hot, Arid Regions. In Proceedings of the 13th National Passive Solar Conference, Cambridge, MA, USA, 20–24 June 1988; pp. 364–367. [Google Scholar]
- Bahadori, M.N. Viability of Wind Towers in Achieving Summer Comfort in the Hot, Arid Regions of the Middle East. In Proceedings of the Third World Renewable Energy Congress, Reading, UK, 11–16 September 1994; pp. 879–892. [Google Scholar]
- Bahadori, M.N.; Pakzad, A.R. Performance Evaluation of New Designs of Wind Towers. Paper No. FEDSM 2002–31247. In Proceedings of the ASME FEDSM02, ASME 2002 Fluids Engineering Division Summer Meeting, Montreal, QC, Canada, 14–18 July 2002. [Google Scholar]
- Bahadori, M.N.; Mazidi, M.; Dehghani, A.R. Experimental Investigation of New Designs of Wind Towers. Renew. Energy 2008, 33, 2273–2281. [Google Scholar]
- Amoli, F.J. An Analytic Survey of Two Types of Modern Wind Towers. Bachelor’s Thesis, School of Mechanical Engineering, Sharif University, Tehran, Iran, 1990. [Google Scholar]
- Memarie, G.H. An Analysis of the Performance and Comparison of Two Modern Designs of Wind Towers. Bachelor’s Thesis, School of Mechanical Engineering, Sharif University, Tehran, Iran, 1991. [Google Scholar]
- Pakzad, A.R. Analysis of Two New Designs of Wind Towers. Master’s Thesis, School of Mechanical Engineering, Sharif University of Technology, Tehran, Iran, September 1997. [Google Scholar]
- Dehghani, A.R. An Experimental Evaluation of Two New Designs of Wind Towers and a Comparison with a Conventional Wind Tower. Bachelor’s Thesis, Yazd University, Yazd, Iran, 2001. [Google Scholar]
- Mosavi Davar, S. An Empirical Study and Performance Analysis of Wind Towers and Their Feasibility for Use in the Buildings. Bachelor’s Thesis, Department of Mechanical Engineering, Faculty of Polytechnic, Gillan University, Gillan, Iran, 2002. [Google Scholar]
- Mazidi, M. Assessment of the Efficiency of the Wind Tower of Yazd University Mosque through Analytical and Empirical Methods. Master’s Thesis, Department of Power-Plant, Shahid Abbaspour Water and Electricity University, Tehran, Iran, 2005. [Google Scholar]
- Khani, S.M.R. Industrial Production of Wind Towers to Replace Evaporative Coolers. Master’s Thesis, School of Mechanical Engineering, University of Tehran, Tehran, Iran, 2014. [Google Scholar]
- Aliabadi, A.A.; Krayenhoff, E.S.; Nazarian, N.; Chew, L.-W.; Armstrong, P.R.; Afshari, A.; Norford, L.K. Effects of Roof-Edge Roughness on Air Temperature and Pollutant Concentration in Urban Canyons. Bound. Layer Meteorol. 2017. [Google Scholar] [CrossRef]
- Khani, S.M.R.; Bahadori, M.N.; Nourbakhsh, A. Modular Wind Tower with Wetted Surfaces. Industrial Property General Office of Iran. Patent Registration No. 83,449, 2 August 2014. [Google Scholar]
- Khani, S.M.R.; Bahadori, M.N.; Dehghani-Sanij, A.R. Experimental Investigation of a Modular Wind Tower in Hot and Dry Regions. Energy Sustain. Dev. 2017, 39, 21–28. [Google Scholar] [CrossRef]
- Sonntag, R.; Borgnakke, C.; Van Wylen, J. Fundamentals of Thermodynamics, 6th ed.; John Wiley and Sons: New York, NY, USA, 2002. [Google Scholar]
- ASHRAE Handbook, Fundamentals; American Society of Heating Refrigerating and Air Conditioning Engineers Inc.: Atlanta, GA, USA, 2009.
- ANSI/ASHRAE Standard 55-2013. Thermal Environmental Conditions for Human Occupancy; Approved by ASHRAE on 18 November 2014, and by the American National Standards Institute on 1 December 2014; ASHRAE: Atlanta, GA, USA.
Figure 1.
Two four-sided wind towers in Yazd, Iran [3].
Figure 1.
Two four-sided wind towers in Yazd, Iran [3].
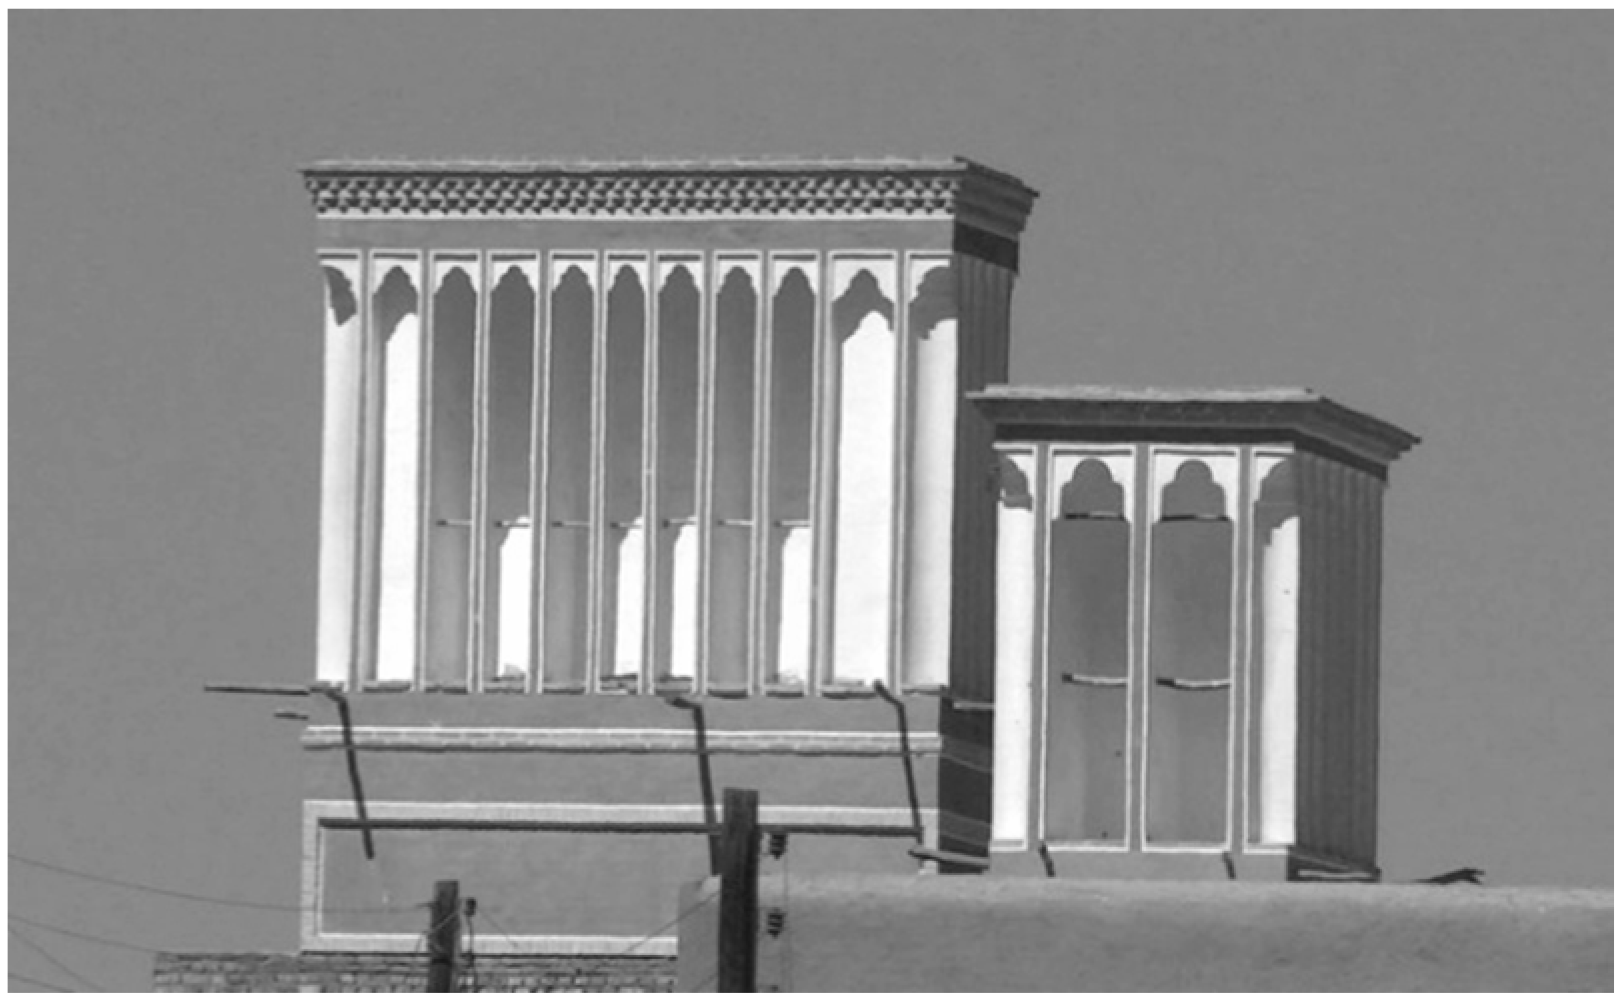
Figure 2.
A traditional wind tower in Cairo, Egypt [21].
Figure 2.
A traditional wind tower in Cairo, Egypt [21].
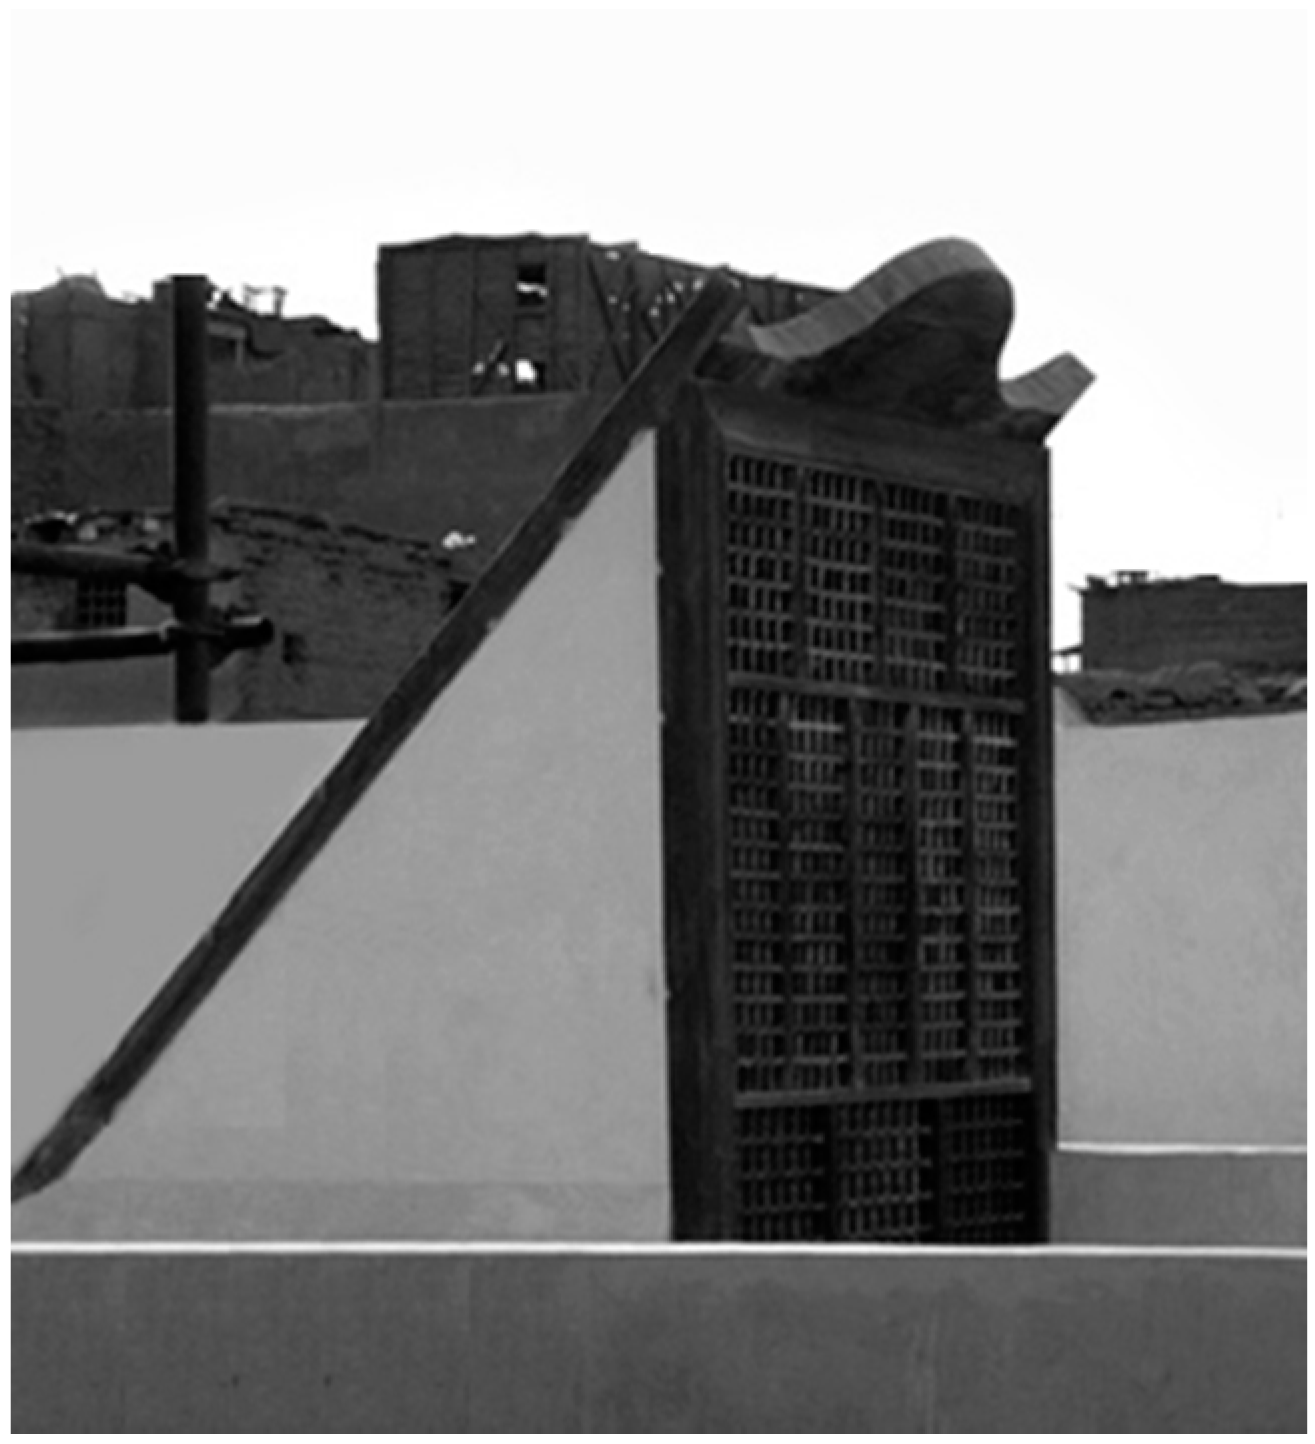
Figure 3.
View of wind towers or wind scoops in Heydar Abad, Pakistan [22].
Figure 3.
View of wind towers or wind scoops in Heydar Abad, Pakistan [22].
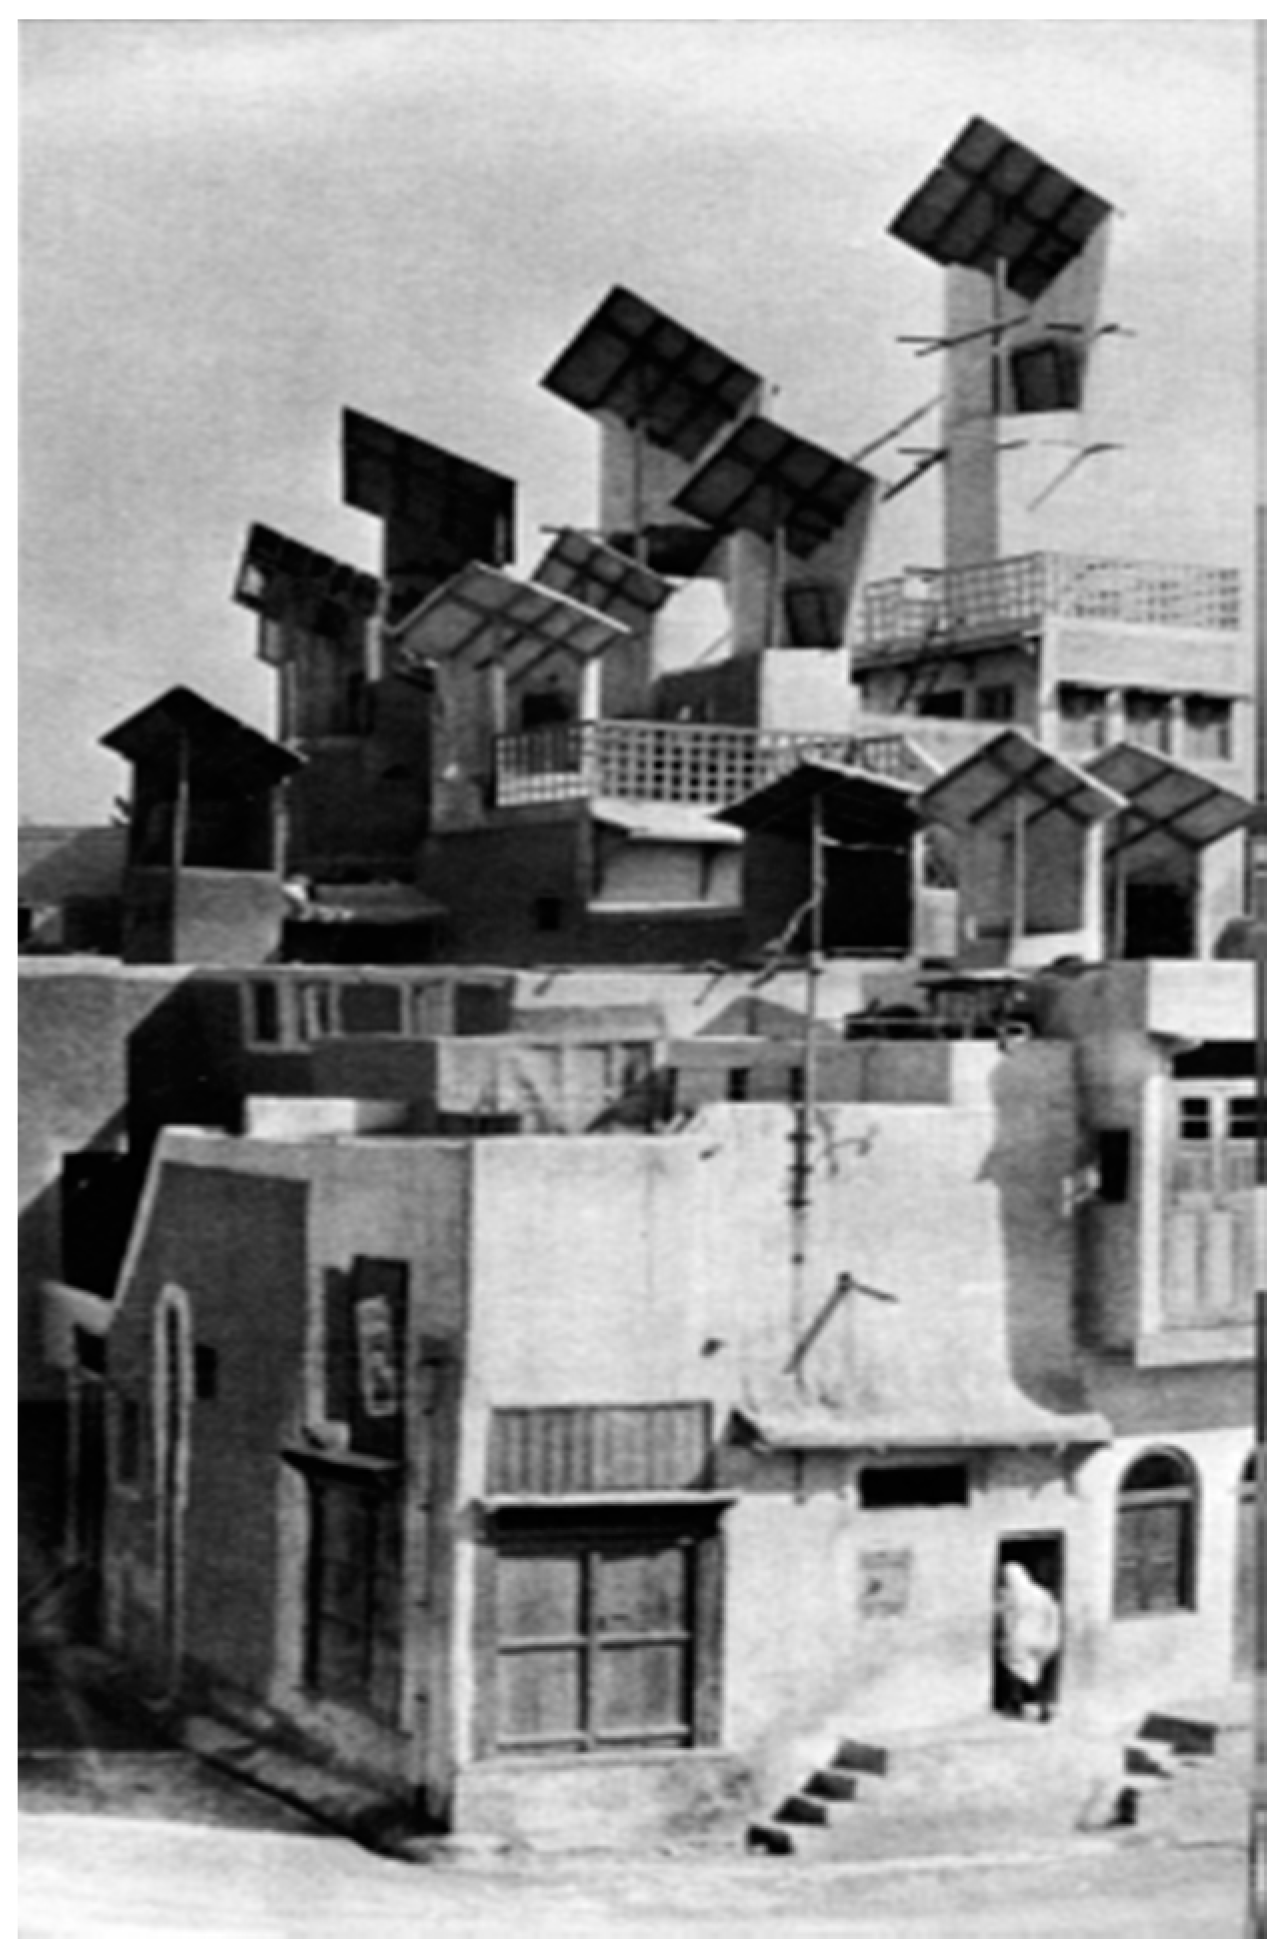
Figure 4.
Cross-sectional view of a wind tower with wetted columns [19].
Figure 4.
Cross-sectional view of a wind tower with wetted columns [19].

Figure 5.
Cross-sectional view of a wind tower with wetted surfaces combined with a solar chimney [26].
Figure 5.
Cross-sectional view of a wind tower with wetted surfaces combined with a solar chimney [26].
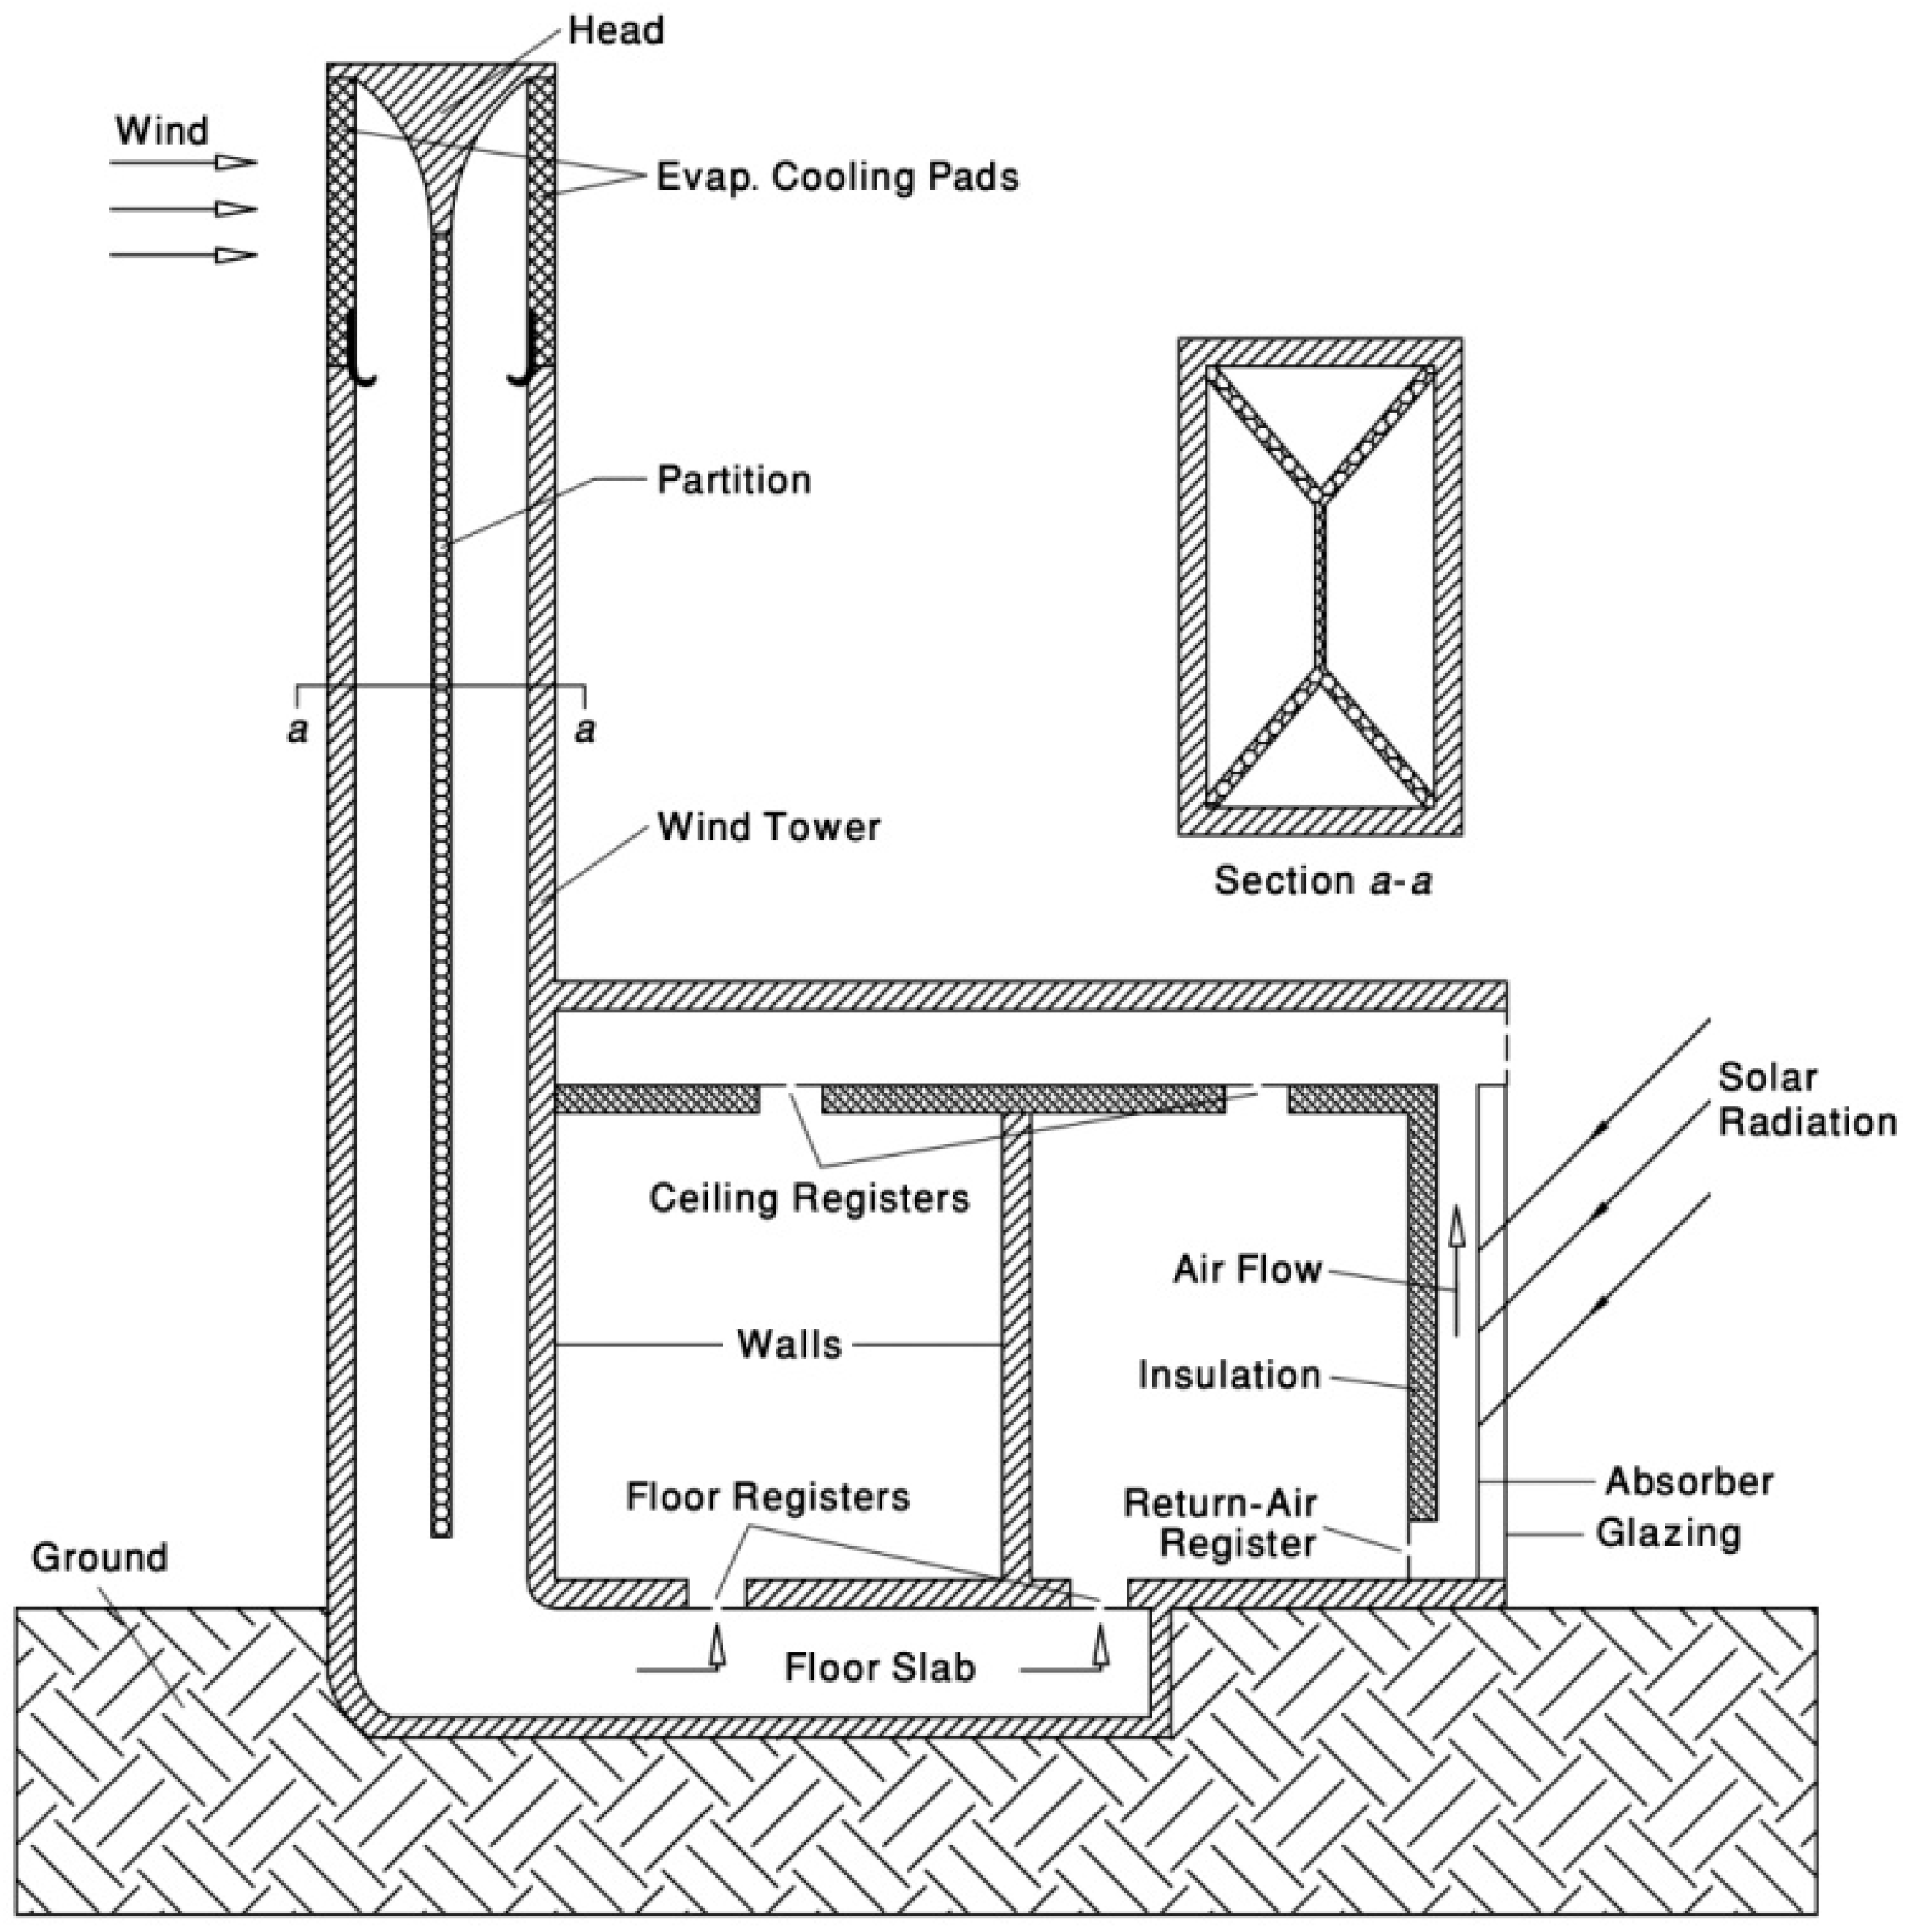
Figure 6.
Schematic illustration of the head of the modular wind tower design with wetted surfaces.
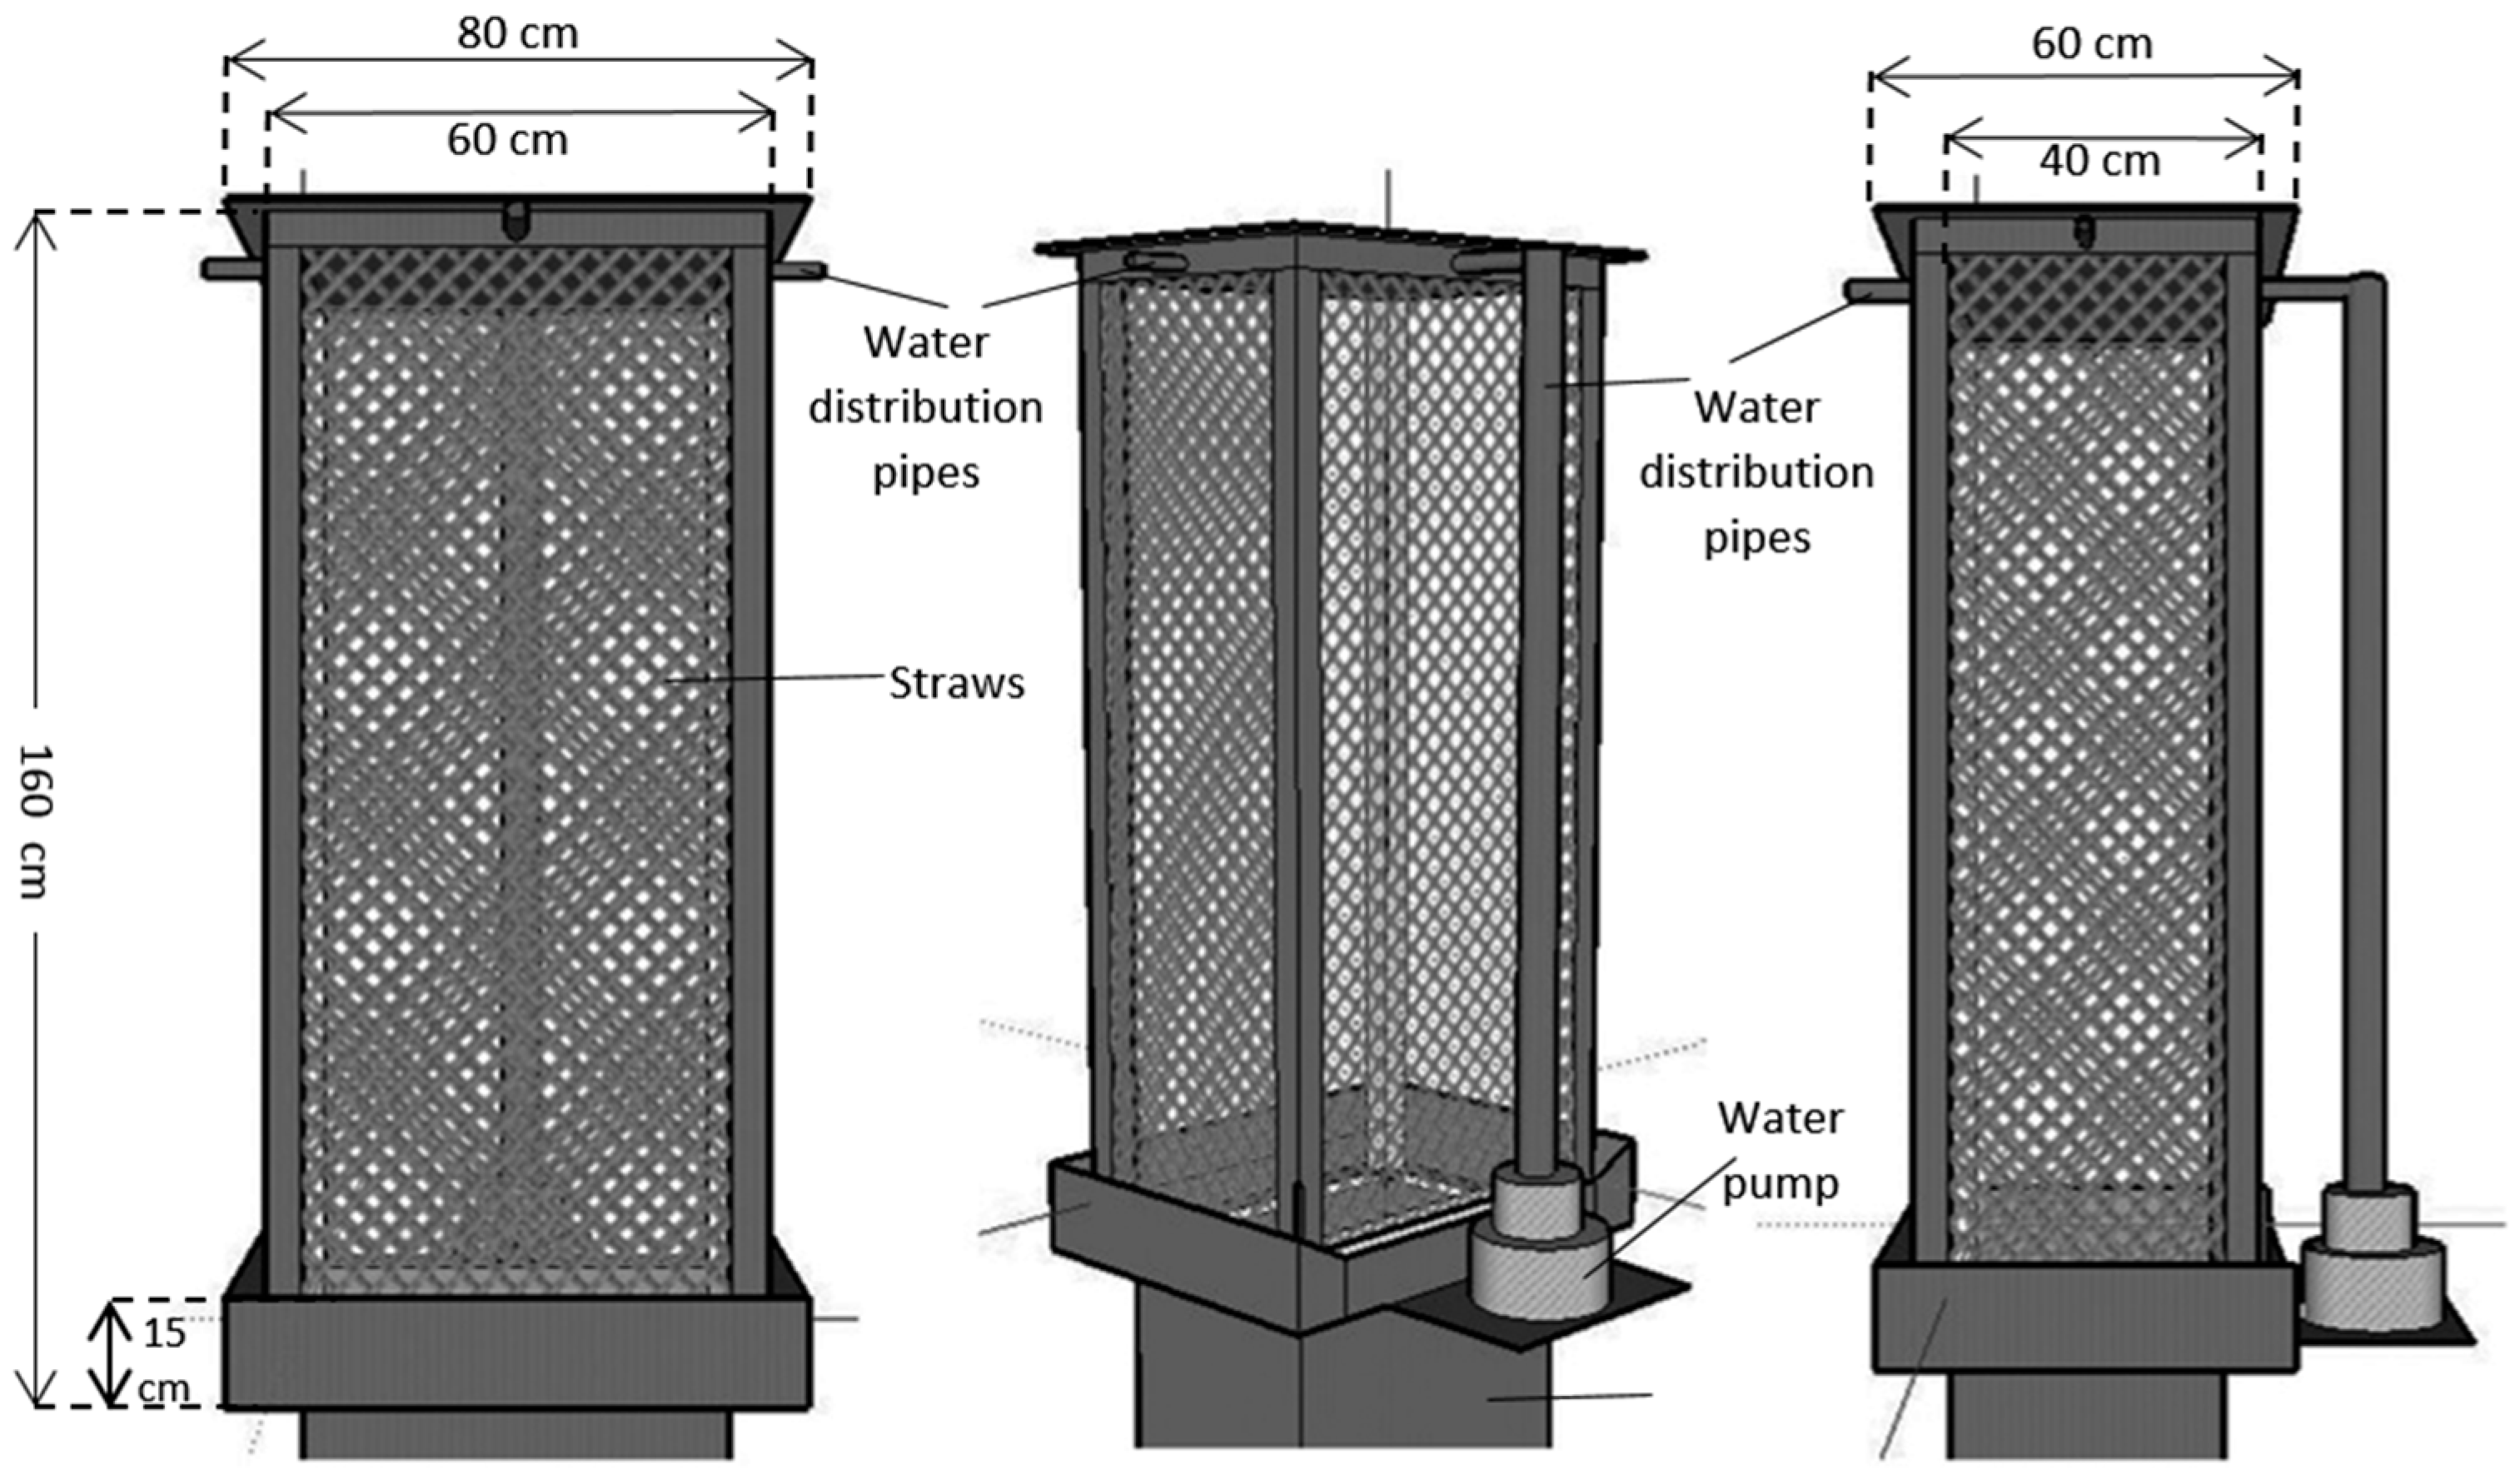
Figure 7.
View of the manufactured wind tower head with wetted surfaces.

Figure 8.
Cross-sectional view of the modular wind tower with wetted surfaces. Numbers in circles (1 to 6) have been used as subscripts hereinafter.
Figure 8.
Cross-sectional view of the modular wind tower with wetted surfaces. Numbers in circles (1 to 6) have been used as subscripts hereinafter.
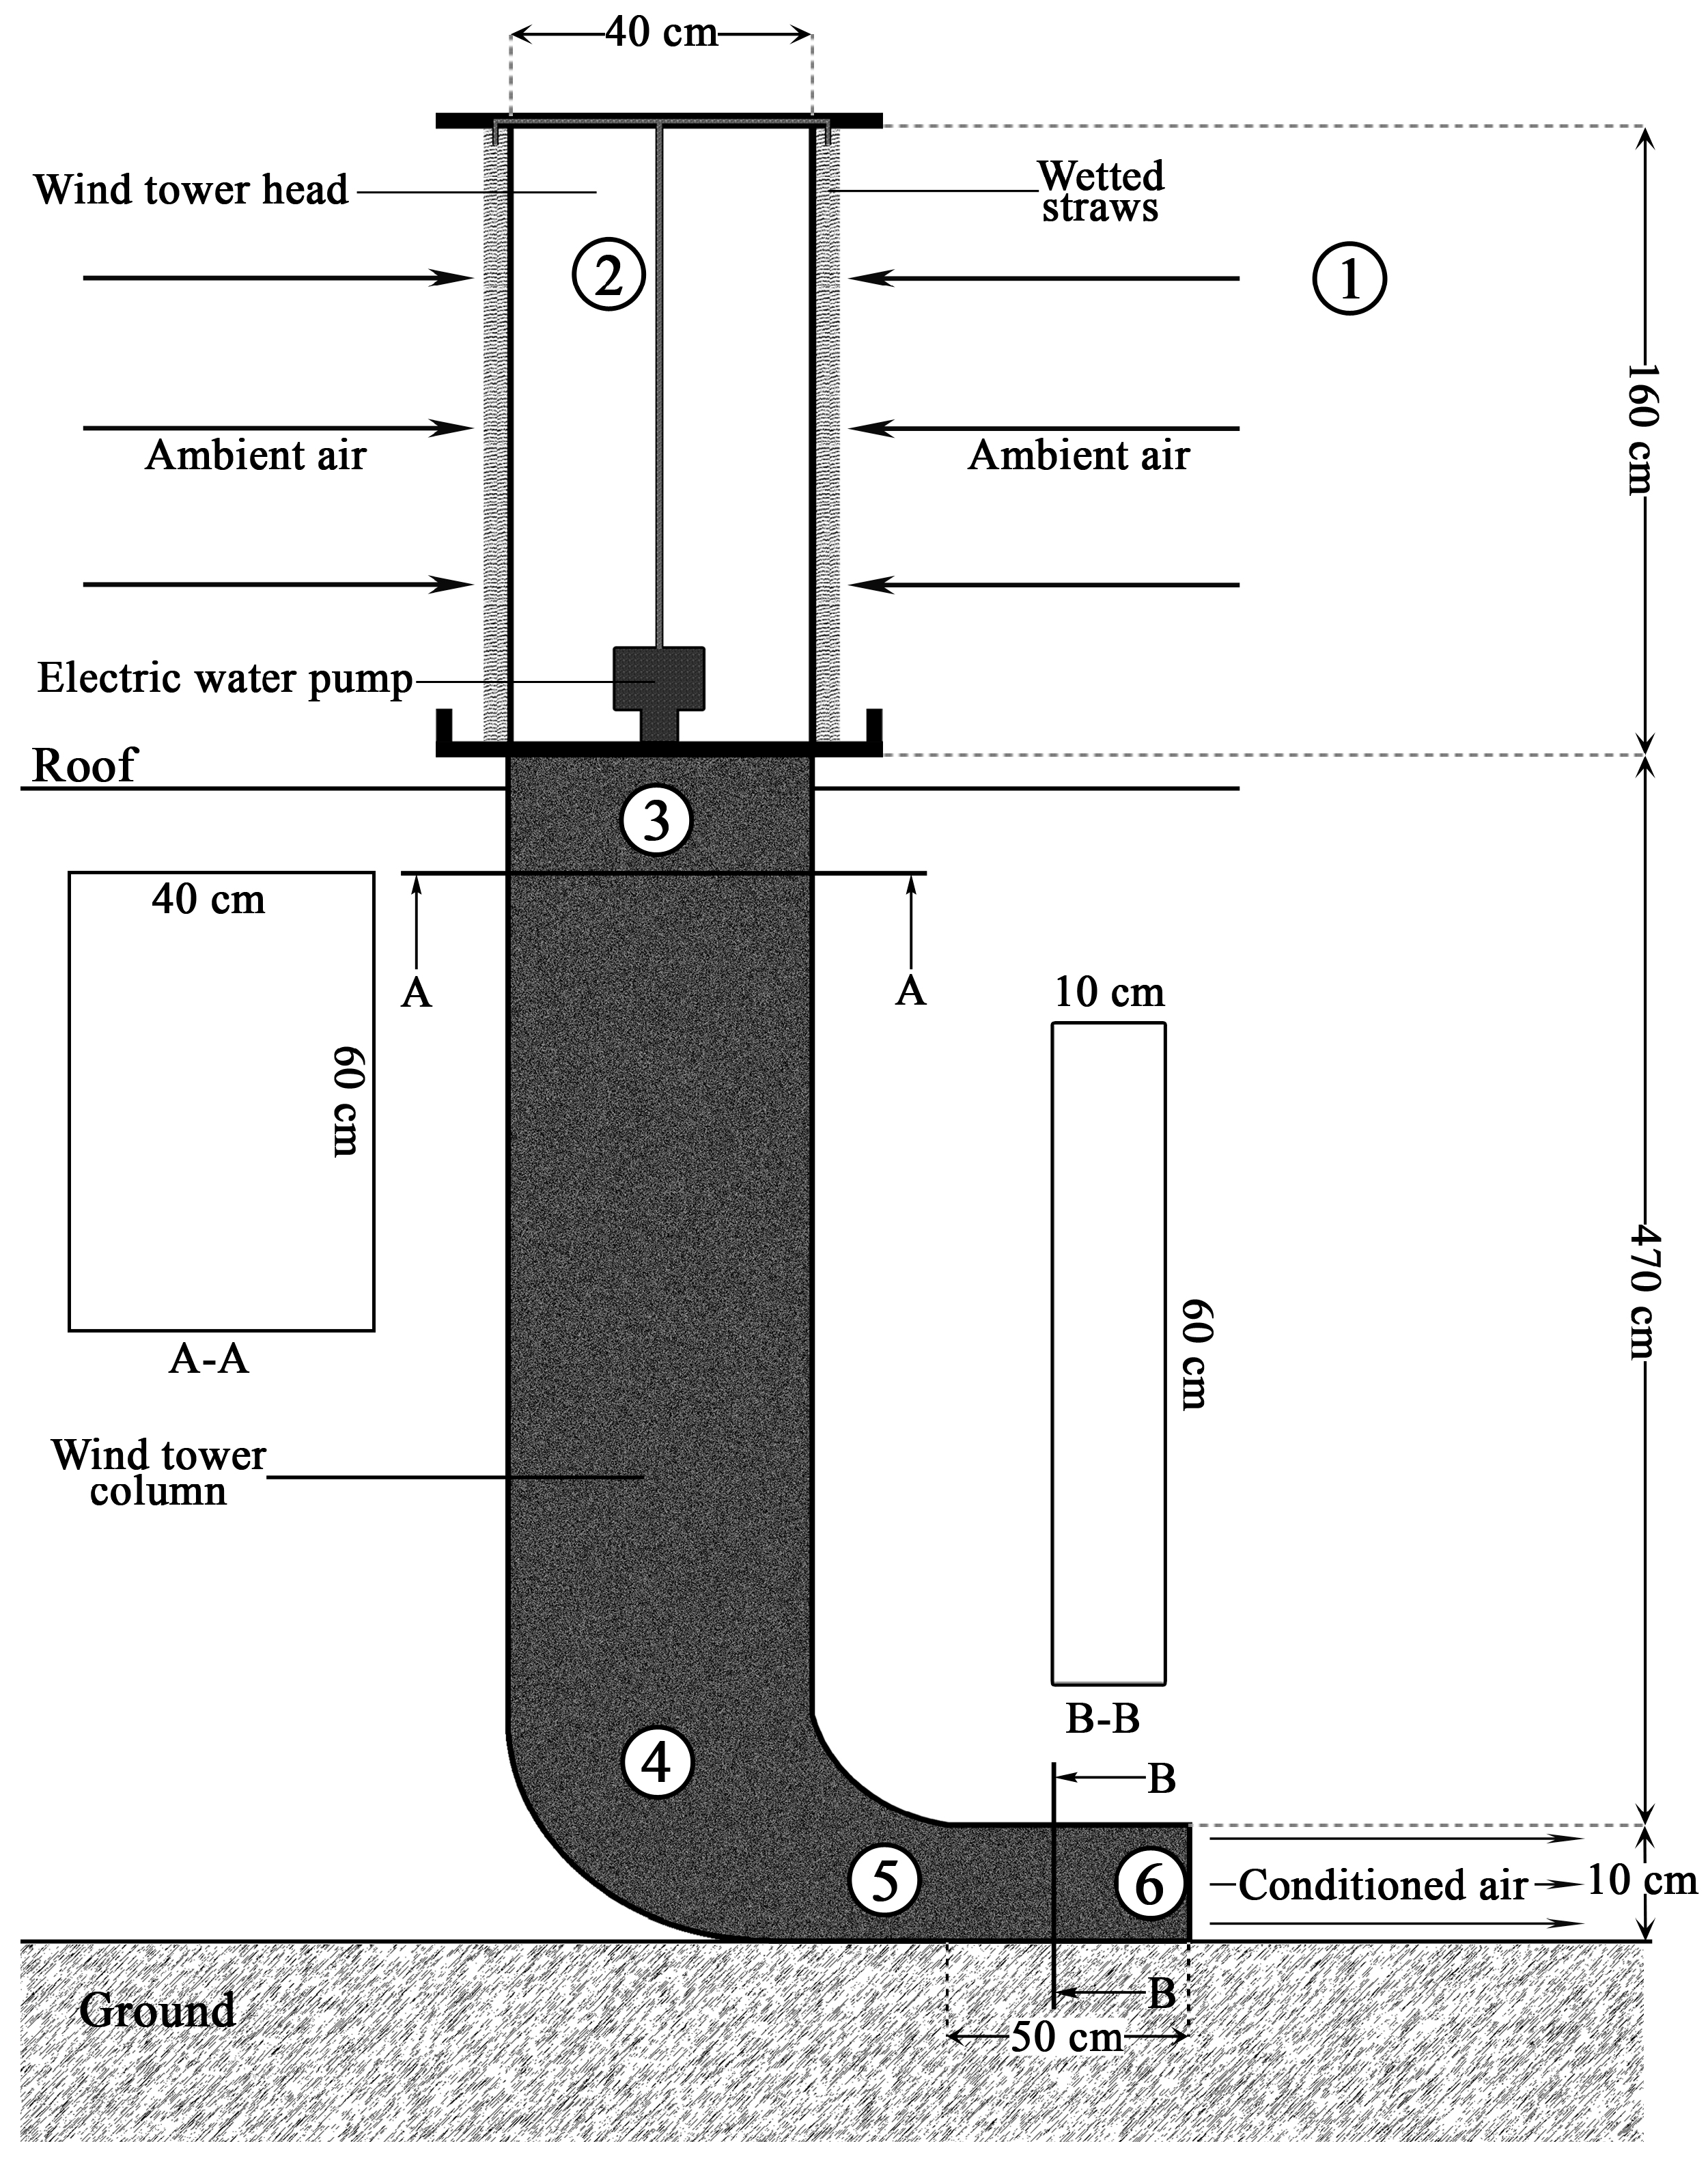
Figure 9.
The thermal resistances between the cool air inside the channels and the room.

Figure 10.
The amount of reduction in temperature for test Nos. 1, 2 and 3 (21 to 30 August 2013, 10:00 a.m., 12:00 p.m. and 4:00 p.m.).
Figure 10.
The amount of reduction in temperature for test Nos. 1, 2 and 3 (21 to 30 August 2013, 10:00 a.m., 12:00 p.m. and 4:00 p.m.).
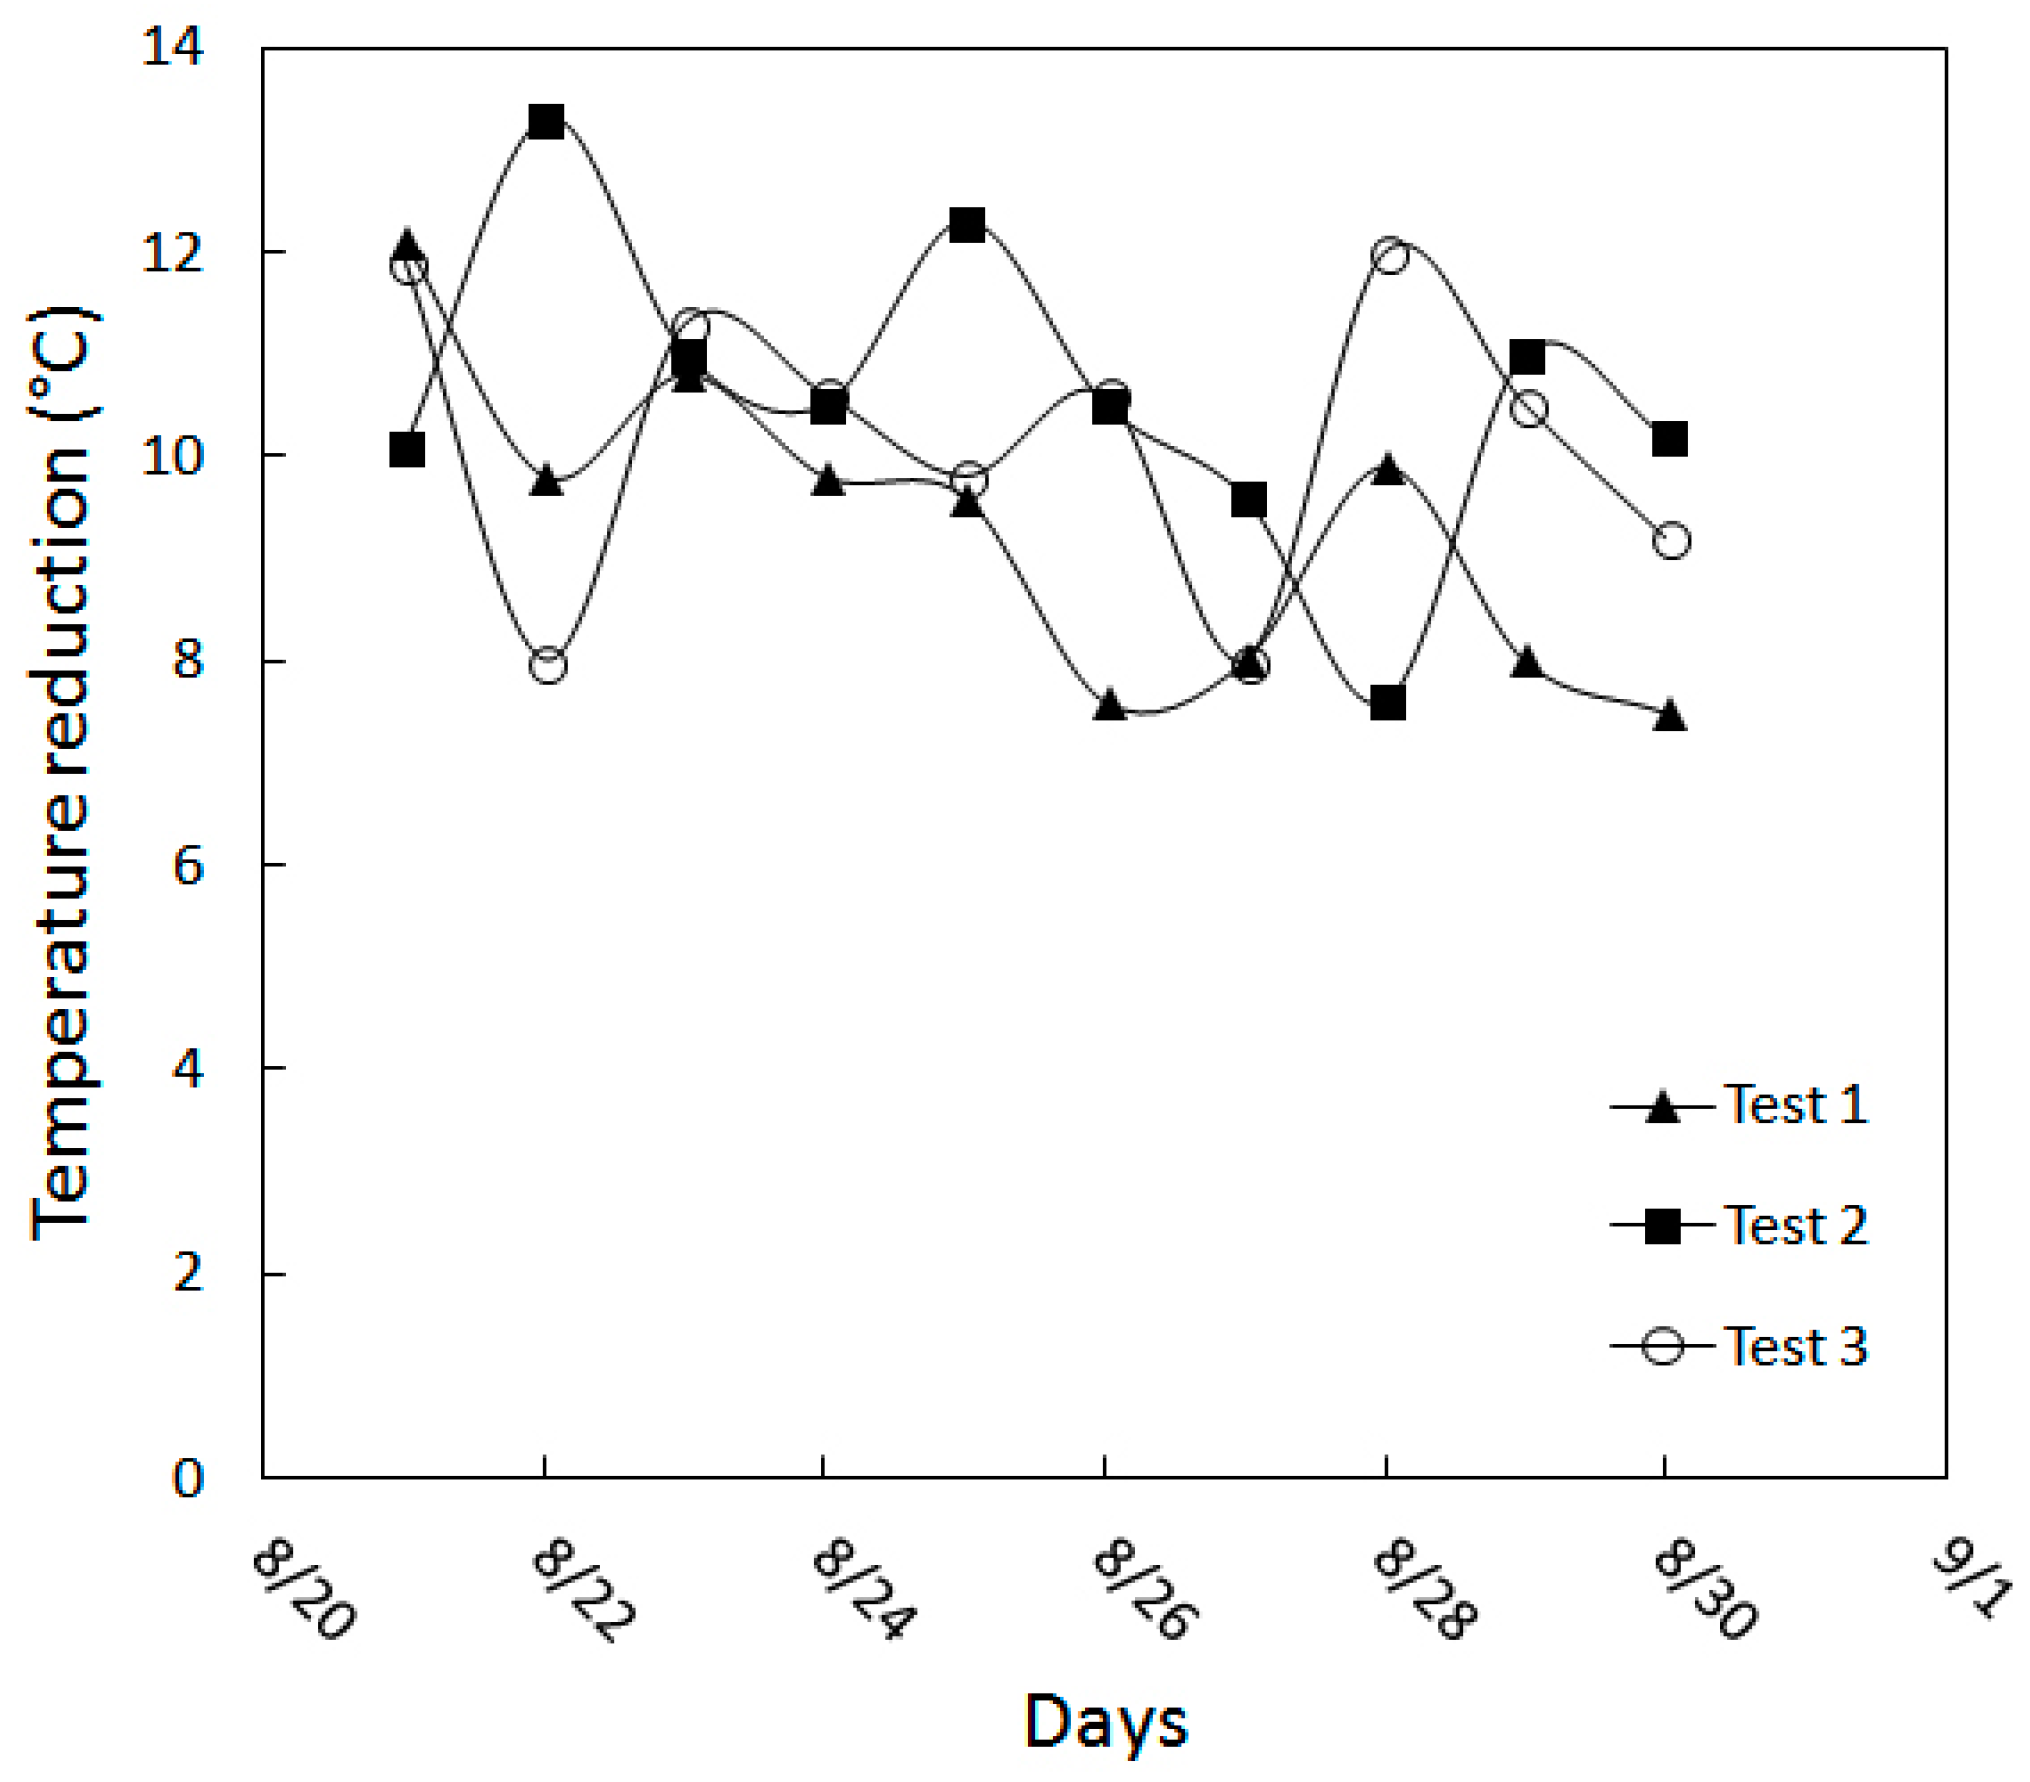
Figure 11.
The amount of increase in RH for test Nos. 1, 2, and 3 (21 to 30 August 2013, 10:00 a.m., 12:00 p.m. and 4:00 p.m.).
Figure 11.
The amount of increase in RH for test Nos. 1, 2, and 3 (21 to 30 August 2013, 10:00 a.m., 12:00 p.m. and 4:00 p.m.).

Figure 12.
The mass flow rate entering the room from wind tower outlet for test Nos. 1, 2 and 3 (21 to 30 August 2013, 10:00 a.m., 12:00 p.m. and 4:00 p.m.).
Figure 12.
The mass flow rate entering the room from wind tower outlet for test Nos. 1, 2 and 3 (21 to 30 August 2013, 10:00 a.m., 12:00 p.m. and 4:00 p.m.).

Figure 13.
The air temperature at wind tower outlet and ambient air for test No. 4 (from 6:30 a.m. to 9:00 p.m., 24 August 2013).
Figure 13.
The air temperature at wind tower outlet and ambient air for test No. 4 (from 6:30 a.m. to 9:00 p.m., 24 August 2013).

Figure 14.
The amount of RH of air at the wind tower outlet and the ambient air for test No. 4 (from 6:30 a.m. to 9:00 p.m., 24 August 2013).
Figure 14.
The amount of RH of air at the wind tower outlet and the ambient air for test No. 4 (from 6:30 a.m. to 9:00 p.m., 24 August 2013).
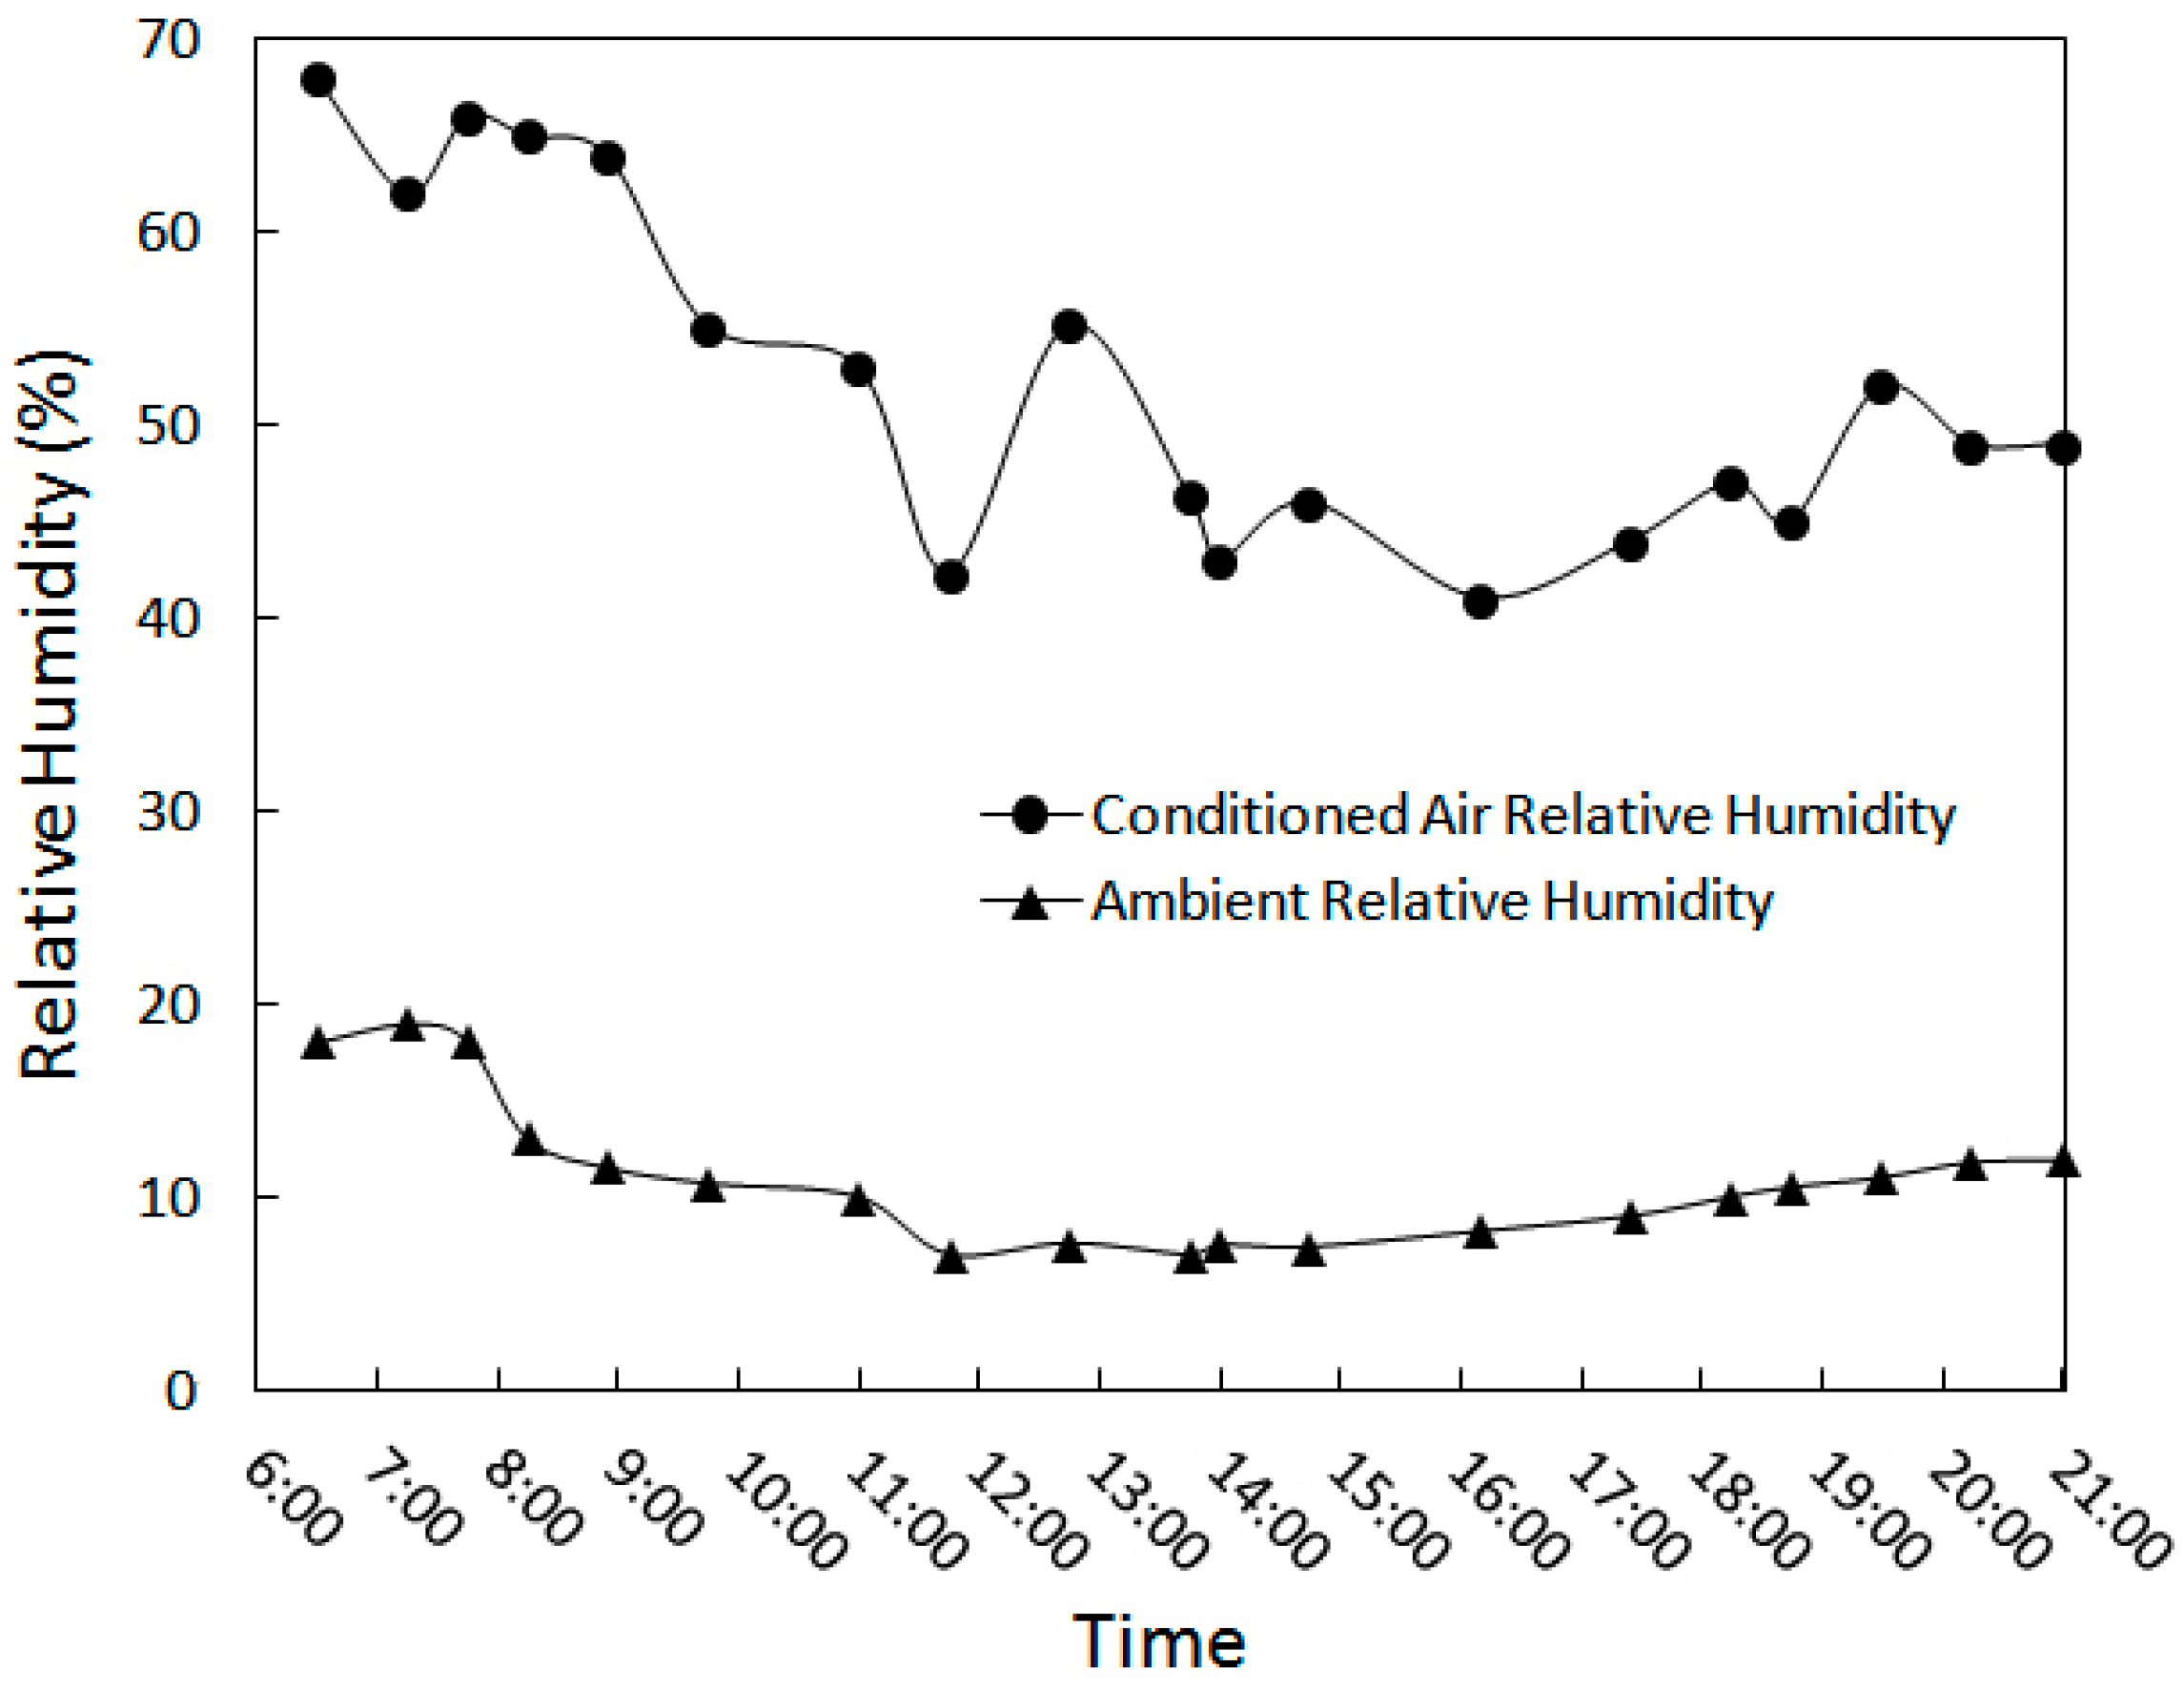
Figure 15.
The conditioned air mass flow rate from the wind tower outlet to room for test No. 4 (from 6:30 a.m. to 9:00 p.m., 24 August 2013).
Figure 15.
The conditioned air mass flow rate from the wind tower outlet to room for test No. 4 (from 6:30 a.m. to 9:00 p.m., 24 August 2013).

Figure 16.
The air temperature at wind tower outlet and the ambient air for test No. 5 (from 5:15 p.m. on the 22nd to 5:15 p.m. on the 23rd of August 2013).
Figure 16.
The air temperature at wind tower outlet and the ambient air for test No. 5 (from 5:15 p.m. on the 22nd to 5:15 p.m. on the 23rd of August 2013).
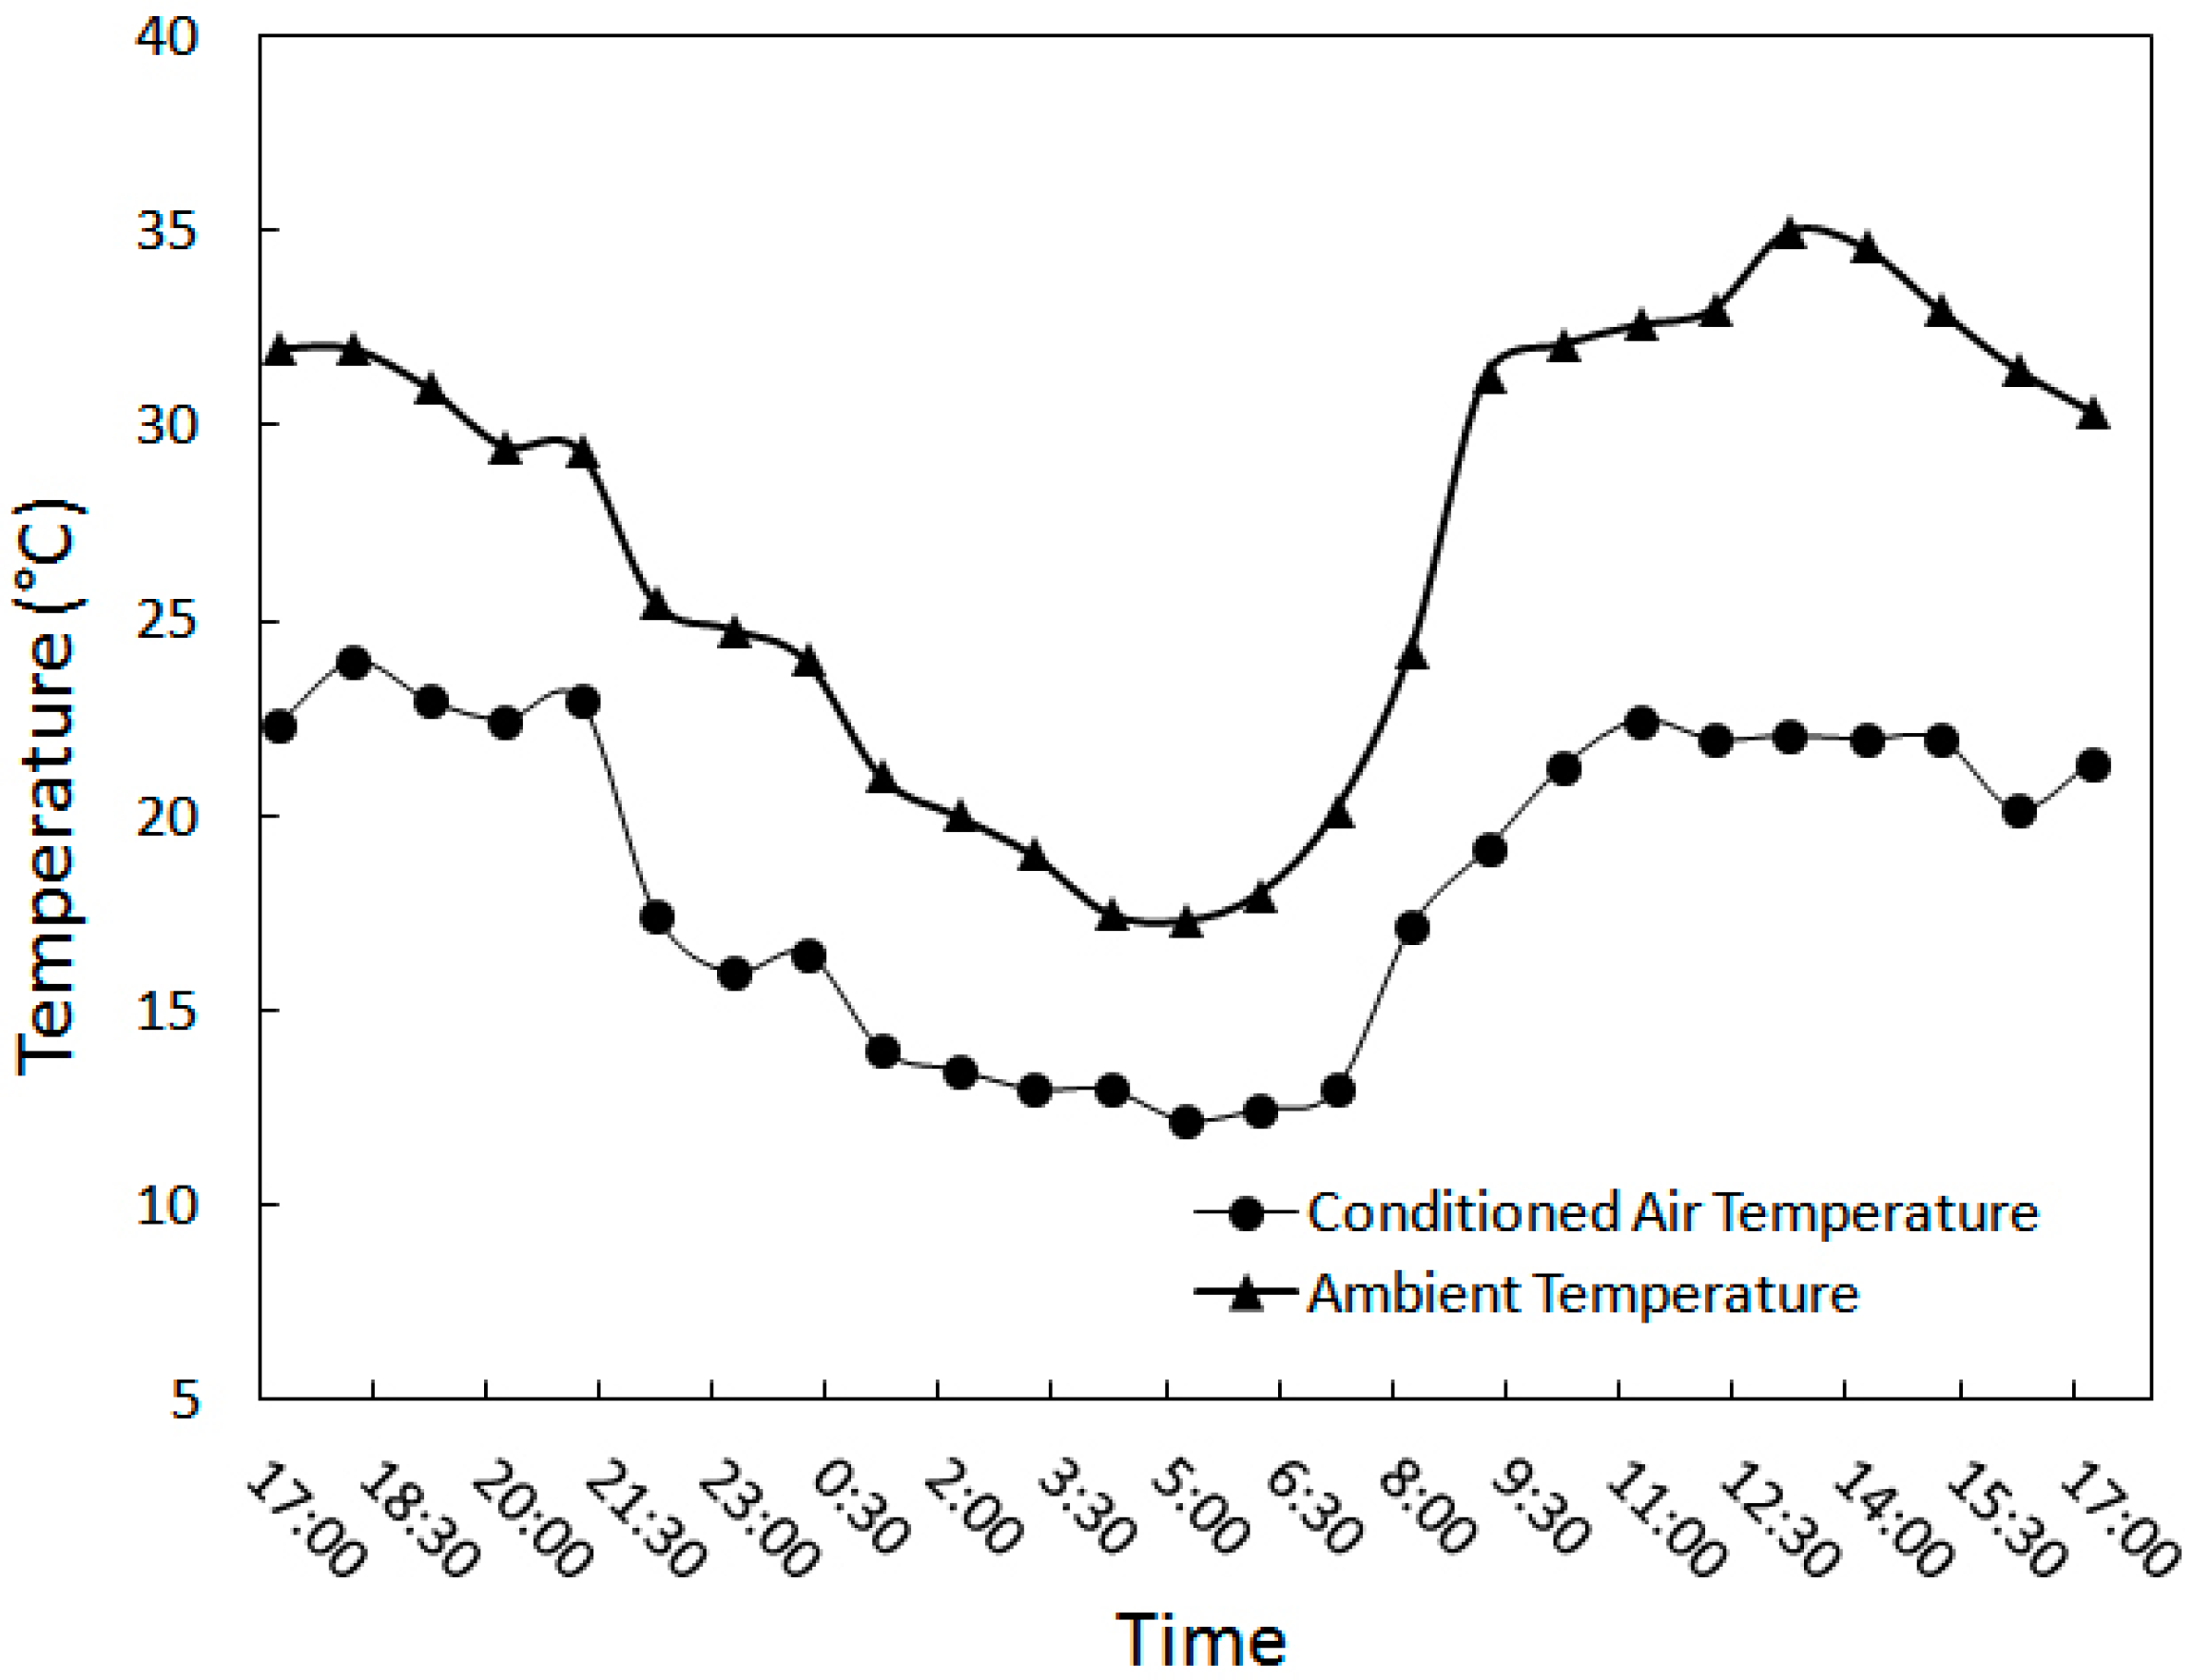
Figure 17.
The amount of RH of air at wind tower outlet and the ambient air for test No. 5 (from 5:15 p.m. on the 22nd to 5:15 p.m. on the 23rd of August 2013).
Figure 17.
The amount of RH of air at wind tower outlet and the ambient air for test No. 5 (from 5:15 p.m. on the 22nd to 5:15 p.m. on the 23rd of August 2013).

Figure 18.
The conditioned air mass flow rate from the wind tower outlet to the room for test No. 5 (from 5:15 p.m. on the 22nd to 5:15 p.m. on the 23rd of August 2013).
Figure 18.
The conditioned air mass flow rate from the wind tower outlet to the room for test No. 5 (from 5:15 p.m. on the 22nd to 5:15 p.m. on the 23rd of August 2013).

Figure 19.
Property changes of the air passing throughout the modular wind tower with wetted surfaces.
Figure 19.
Property changes of the air passing throughout the modular wind tower with wetted surfaces.


Table 1.
Instruments used to measure the velocity, relative humidity and temperature of air.
| Measuring Instrument | Used to Measure | Accuracy |
|---|---|---|
| Testo 452 with high accuracy velocity probe | Velocity of air | ±0.7 m·s−1 |
| Testo 615 | Relative humidity of air Temperature of air | ±3% ±0.7 °C |
| LUTRON TM-947 SD 4 Channels Thermometer data logger | Temperature of air | ±[(4×10⁻⁴)T + 0.5)] °C |
Table 2.
The description of the symbols and signs.
| Location | Sign | Description | Measuring Instrument | |
|---|---|---|---|---|
| Ambient | T1 | Dry bulb temperature of ambient | LUTRON TM-947 | Testo 615 |
| ϕ1 | RH of ambient | Testo 615 | ||
| V1 | Air velocity (wind velocity) | Testo 452 | ||
| Room where wind tower outlet was located | Tr | Dry bulb temperature of room | LUTRON TM-947 | Testo 615 |
| ϕr | RH of room | Testo 615 | ||
| After wetted surfaces (in the head of wind tower) | T2 | Dry bulb temperature at wind tower head | LUTRON TM-947 | |
| Wind tower outlet | T6 | Dry bulb temperature at wind tower outlet | LUTRON TM-947 | Testo 615 |
| ϕ6 | RH of wind tower outlet | Testo 615 | ||
| V6 | Velocity of conditioned air from wind tower to room | Testo 452 | ||
Table 3.
Test Nos. 1, 2 and 3, recorded data before noon, at noon and in the afternoon for 10 continuous days.
Table 3.
Test Nos. 1, 2 and 3, recorded data before noon, at noon and in the afternoon for 10 continuous days.
| Date | Time | T1 (°C) | ϕ1 (%) | V1 (m·s−1) | Tr (°C) | ϕr (%) | T2 (°C) | T6 (°C) | ϕ6 (%) | V6 (m·s−1) |
|---|---|---|---|---|---|---|---|---|---|---|
| 21 August | 10:00 | 31.3 | 11.60 | 0 | 25.0 | 36.70 | 18.5 | 19.2 | 59.40 | 1.8 |
| 12:00 | 32.6 | 10.80 | 0 | 25.5 | 29.00 | 21.1 | 22.5 | 35.90 | 1.7 | |
| 16:00 | 33.5 | 7.30 | 0 | 24.7 | 23.00 | 21.0 | 21.6 | 45.10 | 1.6 | |
| 22 August | 9:45 | 33.0 | 10.70 | 0 | 26.0 | 30.60 | 22.2 | 23.2 | 55.10 | 1.6 |
| 12:15 | 35.3 | 6.20 | 0 | 26.0 | 26.10 | 21.0 | 22.0 | 50.00 | 2.0 | |
| 16:00 | 32.0 | 6.80 | 0 | 27.0 | 20.50 | 23.0 | 24.0 | 51.00 | 1.5 | |
| 23 August | 10:15 | 32.1 | 10.90 | 0 | 25.4 | 34.00 | 20.0 | 21.3 | 51.00 | 1.8 |
| 12:15 | 33.0 | 10.40 | 0 | 26.0 | 32.00 | 21.0 | 22.0 | 49.00 | 1.8 | |
| 16:15 | 32.0 | 9.60 | 0 | 25.9 | 35.00 | 20.0 | 20.7 | 48.20 | 1.9 | |
| 24 August | 9:45 | 33.0 | 10.70 | 0 | 26.0 | 30.60 | 22.2 | 23.2 | 55.10 | 1.6 |
| 11:45 | 34.0 | 7.00 | 0 | 26.4 | 26.90 | 22.8 | 23.5 | 42.30 | 1.8 | |
| 16:10 | 34.5 | 8.20 | 0 | 26.5 | 25.50 | 23.2 | 23.9 | 41.00 | 1.9 | |
| 25 August | 10:15 | 32.0 | 7.00 | 0 | 27.0 | 24.70 | 22.0 | 22.4 | 39.60 | 1.7 |
| 12:15 | 34.2 | 7.60 | 0 | 26.8 | 27.90 | 20.8 | 21.9 | 55.20 | 1.8 | |
| 16:15 | 34.2 | 7.60 | 0 | 26.3 | 22.60 | 23.3 | 24.4 | 38.00 | 1.8 | |
| 26 August | 10:00 | 32.0 | 7.60 | 0 | 26.3 | 22.60 | 23.3 | 24.4 | 30.30 | 1.8 |
| 12:20 | 35.1 | 7.00 | 0 | 25.0 | 35.30 | 23.5 | 24.6 | 46.30 | 1.9 | |
| 15:55 | 34.5 | 8.20 | 0 | 26.5 | 25.50 | 23.2 | 23.9 | 38.00 | 1.9 | |
| 27 August | 9:50 | 31.0 | 8.80 | 0 | 27.5 | 19.00 | 21.6 | 23.0 | 37.00 | 1.8 |
| 12:00 | 32.0 | 7.00 | 0 | 27.0 | 24.70 | 22.0 | 22.4 | 39.60 | 1.7 | |
| 16:10 | 32.5 | 9.00 | 0 | 27.5 | 19.00 | 23.5 | 24.5 | 43.00 | 1.8 | |
| 28 August | 10:00 | 31.0 | 11.50 | 0 | 23.5 | 42.00 | 20.0 | 21.1 | 64.00 | 1.6 |
| 12:10 | 32.0 | 7.60 | 0 | 26.3 | 22.60 | 23.3 | 24.4 | 39.30 | 1.8 | |
| 16:00 | 33.5 | 7.50 | 0 | 24.9 | 23.50 | 21.2 | 21.5 | 45.30 | 1.6 | |
| 29 August | 10:15 | 31.0 | 12.00 | 0 | 26.0 | 29.50 | 22.4 | 23.0 | 47.00 | 1.9 |
| 12:10 | 32.0 | 7.60 | 0 | 26.3 | 22.60 | 23.3 | 24.4 | 39.30 | 1.8 | |
| 16:00 | 32.5 | 6.50 | 0 | 26.5 | 25.70 | 20.7 | 22.0 | 44.00 | 1.8 | |
| 30 August | 9:50 | 30.0 | 10.50 | 0 | 26.5 | 25.50 | 21.7 | 22.5 | 45.00 | 1.8 |
| 12:00 | 33.3 | 7.20 | 0 | 26.5 | 25.60 | 22.1 | 23.1 | 47.20 | 1.9 | |
| 16:10 | 32.0 | 8.00 | 0 | 26.1 | 26.90 | 21.9 | 22.8 | 35.90 | 1.5 |
Note: Tr and ϕr are, respectively, the air temperature and RH of air in the room in which the outlet of the wind tower was placed.
Table 4.
Recorded data for test No. 4, from 6:30 a.m. to 9:00 p.m., 24 August 2013.
| Time | T1 (°C) | ϕ1 (%) | V1 (m·s−1) | Tr (°C) | ϕr (%) | T2 (°C) | T6 (°C) | ϕ6 (%) | V6 (m·s−1) |
|---|---|---|---|---|---|---|---|---|---|
| 6:30 | 20.0 | 18.00 | 0 | 25.0 | 29.00 | 15.8 | 16.2 | 68.00 | 1.2 |
| 7:15 | 22.0 | 19.00 | 0 | 23.0 | 42.00 | 18.5 | 19.0 | 62.00 | 1.1 |
| 7:45 | 22.5 | 18.10 | 0 | 24.5 | 38.60 | 18.4 | 19.2 | 66.00 | 1.0 |
| 8:15 | 25.8 | 13.00 | 0 | 25.0 | 38.00 | 19.0 | 19.5 | 65.00 | 1.0 |
| 8:55 | 31.0 | 11.50 | 0 | 23.5 | 42.00 | 20.0 | 21.1 | 64.00 | 1.6 |
| 9:45 | 33.0 | 10.70 | 0 | 26.0 | 30.60 | 22.2 | 23.2 | 55.10 | 1.6 |
| 11:00 | 33.5 | 10.00 | 0 | 26.1 | 33.00 | 23.0 | 24.4 | 53.00 | 1.7 |
| 11:45 | 34.0 | 7.00 | 0 | 26.4 | 26.90 | 22.8 | 23.5 | 42.30 | 1.8 |
| 12:45 | 34.2 | 7.60 | 0 | 26.8 | 27.90 | 20.8 | 21.9 | 55.20 | 1.8 |
| 13:45 | 35.1 | 7.00 | 0 | 25.0 | 35.30 | 23.5 | 24.6 | 46.30 | 1.9 |
| 14:00 | 38.0 | 7.50 | 0 | 25.0 | 27.00 | 23.3 | 24.4 | 43.00 | 1.9 |
| 14:45 | 36.0 | 7.40 | 0 | 26.5 | 24.00 | 23.5 | 24.4 | 46.00 | 1.8 |
| 16:10 | 34.5 | 8.20 | 0 | 26.5 | 25.50 | 23.2 | 23.9 | 41.00 | 1.9 |
| 17:25 | 32.5 | 9.00 | 0 | 27.5 | 19.00 | 23.5 | 24.5 | 44.00 | 1.8 |
| 18:15 | 31.0 | 10.00 | 0 | 26.0 | 29.50 | 22.4 | 23.0 | 47.00 | 1.9 |
| 18:45 | 30.0 | 10.50 | 0 | 26.5 | 25.50 | 21.7 | 22.5 | 45.00 | 1.8 |
| 19:30 | 29.5 | 11.00 | 0 | 25.3 | 37.00 | 19.8 | 20.1 | 52.00 | 1.6 |
| 20:15 | 28.5 | 11.80 | 0 | 26.5 | 24.00 | 18.5 | 19.3 | 49.00 | 1.3 |
| 21:00 | 28.3 | 11.90 | 0 | 25.1 | 25.30 | 18.7 | 19.2 | 49.00 | 1.5 |
Table 5.
Recorded data for test No. 5, from 5:15 p.m., the 22nd, to 5:15 p.m., the 23rd of August 2013.
Table 5.
Recorded data for test No. 5, from 5:15 p.m., the 22nd, to 5:15 p.m., the 23rd of August 2013.
| Date | Time | T1 (°C) | ϕ1 (%) | V1 (m·s−1) | Tr (°C) | ϕr (%) | T2 (°C) | T6 (°C) | ϕ6 (%) | V6 (m·s−1) |
|---|---|---|---|---|---|---|---|---|---|---|
| 22 August | 17:15 | 32.0 | 7.00 | 0 | 27.0 | 24.70 | 22.0 | 22.4 | 39.60 | 1.7 |
| 22 August | 18:15 | 32.0 | 7.60 | 0 | 26.3 | 22.60 | 23.1 | 24.0 | 30.30 | 1.7 |
| 22 August | 19:15 | 31.0 | 8.80 | 0 | 27.5 | 19.00 | 21.6 | 23.0 | 44.00 | 1.8 |
| 22 August | 20:15 | 29.5 | 8.00 | 0 | 26.5 | 24.00 | 21.5 | 22.5 | 46.00 | 1.7 |
| 22 August | 21:15 | 29.4 | 8.90 | 0 | 25.3 | 28.90 | 21.5 | 23.0 | 43.00 | 1.9 |
| 22 August | 22:15 | 25.5 | 10.50 | 0 | 24.5 | 30.70 | 15.5 | 17.5 | 46.00 | 1.8 |
| 22 August | 23:15 | 24.8 | 13.00 | 0 | 22.0 | 31.50 | 15.0 | 16.0 | 58.00 | 1.8 |
| 23 August | 0:15 | 24.0 | 14.00 | 0 | 23.9 | 33.00 | 16.0 | 16.5 | 67.00 | 1.4 |
| 23 August | 1:15 | 21.0 | 14.40 | 0 | 22.0 | 38.00 | 13.0 | 14.0 | 65.00 | 1.5 |
| 23 August | 2:15 | 20.0 | 14.60 | 0 | 22.5 | 34.00 | 13.0 | 13.5 | 54.00 | 1.3 |
| 23 August | 3:15 | 19.0 | 15.00 | 0 | 22.5 | 24.00 | 12.2 | 13.0 | 55.00 | 1.8 |
| 23 August | 4:15 | 17.5 | 17.00 | 0 | 22.0 | 32.00 | 12.0 | 13.0 | 55.00 | 1.7 |
| 23 August | 5:15 | 17.3 | 17.00 | 0 | 22.5 | 33.00 | 11.5 | 12.2 | 60.00 | 1.8 |
| 23 August | 6:15 | 18.0 | 19.50 | 0 | 22.8 | 38.00 | 11.0 | 12.5 | 68.00 | 1.6 |
| 23 August | 7:15 | 20.1 | 19.60 | 0 | 23.0 | 35.00 | 12.2 | 13.0 | 61.00 | 1.7 |
| 23 August | 8:15 | 24.2 | 14.00 | 0 | 25.0 | 37.00 | 16.0 | 17.2 | 64.00 | 1.6 |
| 23 August | 9:15 | 31.3 | 11.60 | 0 | 25.0 | 36.70 | 18.5 | 19.2 | 59.40 | 1.8 |
| 23 August | 10:15 | 32.1 | 10.90 | 0 | 25.4 | 34.00 | 20.0 | 21.3 | 51.00 | 1.8 |
| 23 August | 11:15 | 32.6 | 10.80 | 0 | 25.5 | 29.00 | 20.1 | 22.5 | 49.00 | 1.7 |
| 23 August | 12:15 | 33.0 | 10.40 | 0 | 26.0 | 32.00 | 21.0 | 22.0 | 49.00 | 1.8 |
| 23 August | 13:15 | 35.0 | 9.70 | 0 | 25.8 | 33.00 | 21.5 | 22.1 | 49.00 | 1.8 |
| 23 August | 14:15 | 34.6 | 10.00 | 0 | 25.8 | 33.00 | 21.6 | 22.0 | 51.00 | 1.8 |
| 23 August | 15:15 | 33.0 | 10.40 | 0 | 26.0 | 32.00 | 21.0 | 22.0 | 49.00 | 1.8 |
| 23 August | 16:15 | 31.5 | 9.60 | 0 | 25.9 | 35.00 | 20.0 | 20.2 | 48.20 | 1.9 |
| 23 August | 17:15 | 30.4 | 9.60 | 0 | 25.8 | 30.40 | 20.0 | 21.4 | 43.50 | 1.6 |
Table 6.
The highest, lowest and average dry bulb temperature of the conditioned air entering the room from wind tower outlet.
Table 6.
The highest, lowest and average dry bulb temperature of the conditioned air entering the room from wind tower outlet.
| Parameter | Experimental Results | Analytical Results |
|---|---|---|
| Maximum air temperature (T6-max) | 24.6 °C | 23.9 °C |
| Minimum air temperature (T6-min) | 12.2 °C | 12.4 °C |
| Average air temperature (T6-ave) | 21.1 °C | 20.7 °C |
Table 7.
The highest, lowest and average reduction in dry bulb temperature of air using the modular wind tower.
Table 7.
The highest, lowest and average reduction in dry bulb temperature of air using the modular wind tower.
| Parameter | Experimental Results | Analytical Results |
|---|---|---|
| Maximum decrease in air temperature (∆Tmax) | 13.6 °C | 14.6 °C |
| Minimum decrease in air temperature (∆Tmin) | 3.0 °C | 2.9 °C |
| Average decrease in air temperature (∆Tave) | 9.2 °C | 10.0 °C |
Table 8.
The highest, lowest and average dry bulb temperature of the conditioned air entering the room from wind tower outlet.
Table 8.
The highest, lowest and average dry bulb temperature of the conditioned air entering the room from wind tower outlet.
| Parameter | Experimental Results | Analytical Results |
|---|---|---|
| Maximum exit velocity (V6-max) | 2.0 m·s−1 | 2.10 m·s−1 |
| Maximum volumetric flow rate | 0.120 m3·s−1 | 0.126 m3·s−1 |
| Minimum exit velocity (V6-min) | 1.0 m·s−1 | 1.02 m·s−1 |
| Minimum volumetric flow rate | 0.060 m3·s−1 | 0.061 m3·s−1 |
| Average exit velocity (V6-ave) | 1.7 m·s−1 | 1.74 m·s−1 |
| Average volumetric flow rate | 0.102 m3·s−1 | 0.104 m3·s−1 |
© 2017 by the authors. Licensee MDPI, Basel, Switzerland. This article is an open access article distributed under the terms and conditions of the Creative Commons Attribution (CC BY) license (http://creativecommons.org/licenses/by/4.0/).
Share and Cite
MDPI and ACS Style
Khani, S.M.R.; Bahadori, M.N.; Dehghani-Sanij, A.; Nourbakhsh, A. Performance Evaluation of a Modular Design of Wind Tower with Wetted Surfaces. Energies 2017, 10, 845. https://doi.org/10.3390/en10070845
AMA Style
Khani SMR, Bahadori MN, Dehghani-Sanij A, Nourbakhsh A. Performance Evaluation of a Modular Design of Wind Tower with Wetted Surfaces. Energies. 2017; 10(7):845. https://doi.org/10.3390/en10070845
Chicago/Turabian StyleKhani, Sajad M.R., Mehdi N. Bahadori, Alireza Dehghani-Sanij, and Ahmad Nourbakhsh. 2017. "Performance Evaluation of a Modular Design of Wind Tower with Wetted Surfaces" Energies 10, no. 7: 845. https://doi.org/10.3390/en10070845
Note that from the first issue of 2016, this journal uses article numbers instead of page numbers. See further details here.