Analysis and Experiment of Hot-Spot Temperature Rise of 110 kV Three-Phase Three-Limb Transformer

School of Electrical Engineering, Wuhan University, No. 8, South Road of Eastern Lake, Wuhan 430072, China
*
Author to whom correspondence should be addressed.
Energies 2017, 10(8), 1079; https://doi.org/10.3390/en10081079
Submission received: 28 June 2017
/
Revised: 15 July 2017
/
Accepted: 18 July 2017
/
Published: 25 July 2017
Abstract
:This paper presents a fluid-thermal coupled analysis method to compute the temperature distribution in a 31.5 MVA/110 kV oil natural air natural (ONAN) three-phase three-limb transformer. The power losses of windings and core are measured by load-loss test and no-load test respectively. The convective heat transfer process, radiation and oil flow inside the transformer are investigated by finite volume method (FVM). In order to validate the feasibility and accuracy of the presented method, the temperature measuring system based on fiber Brag grating (FBG) sensor is constructed for the temperature rise test of the 31.5 MVA/110 kV ONAN transformer. The simulation results deduced from the proposed method agree well with experimental data. This model can be applied to optimizing design and load scheduling.
1. Introduction
Power transformers are the main and one of the most expensive pieces of equipment in power networks. The operating reliability of large power transformers has a close influence on the stability and security of power systems. The end of the life span of transformers is mainly due to the degradation of internal insulation, which is very much dependent upon the highest temperature occurred inside the transformer, namely the hot spot temperature (HST). In addition, HST is also the main factor that limits the load of transformer [1,2]. Therefore, it is significant to obtain the value and location of HST [3,4].
The oil immersed cooling way is mainly adopted by large power transformer, and the oil natural air natural (ONAN) cooling system is more than 80% in order to prevent oil flow electrification [5]. The main motion of flow for a natural oil circulation transformer is the thermal buoyancy lift compared with oil-forced circulation power transformer. The heat exchange process inside the transformer is complicated because the internal oil flow cycle consists of a cooling path of windings and an outside radiator. The HST of a transformer is mainly determined by the losses and internal oil flow.
Lots of research has been done on the measurement and calculation of temperature distribution inside an oil-immersed transformer. A calculation formula of hot-spot temperature calculation is given in the international standards [6]. The finite element method (FEM) is used to calculate the temperature distribution and HST of a transformer in reference [7,8,9]. The oil flow process and velocity distribution inside an oil-immersed transformer are analyzed by finite volume method (FVM) in reference [10,11]. Diagnostic measurements and fault detection of the power transformer are put forward in reference [12,13]. Traditional thermocouple sensors cannot be used inside the transformer because it suffers from electromagnetic noise interference. Compared with thermocouple devices, the Fiber Brag Grating (FBG) sensor has the advantages of being a small volume, implantable structure, anti-interference and so on. For these reasons, FBG has been widely used in temperature measurement of electrical devices [14,15,16].
By taking a 31.5 MVA/110 kV three-phase three-limb ONAN transformer as an example, this paper presents a fluid-thermal coupled analysis model to calculate the temperature and velocity distribution inside a transformer. The rated load losses of windings and core are measured by load loss test and no-load test respectively. For boundary conditions, the surface convective heat transfer coefficients of different parts of the transformer are calculated according to Newton’s law of cooling. Meanwhile, heat radiation phenomena, which is often overlooked, is considered according to Stefan-Boltzmann’s law. The heat transfer process and oil flow inside a transformer are investigated by FVM.
To validate the feasibility and accuracy of the presented method, a rated-power temperature rise test is performed. During the test, the FBG sensing system was placed inside the transformer to monitor the temperature rise of the windings and iron core. It shows that the simulation results are in good agreement with experimental data. This fluid-thermal coupled model offers help to transformer designers and related workers.
2. Theory and Equations
2.1. Solid Model
In solid, heat is transferred through conduction, which is described by equation of heat conduction:
where ρ is the density, T is temperature; c stands for the heat capacity; q represents the heat productivity of unit volume.
2.2. Fluid Model
For an oil-immersed transformer, the oil motion inside the transformer plays an important role in the process of heat convection, since the thermal conductivity of the transformer oil is relatively low. For the sake of simplification, transformer oil is considered to be an ideally incompressible Newtonian fluid and the oil flow inside transformer is assumed as laminar flow.
The heat exchange process inside a transformer can be described by the mass conservation equation, momentum conservation equation and energy conservation equation, which are presented as below [10,11]:
where ρ is the density, V is fluid velocity; F stands for the body force vector; p represents the pressure, μ denotes the dynamic viscosity; k is thermal conductivity, c is the specific heat capacity; T represents the temperature; q indicates heat source per volume inside the transformer.
2.3. Boundary Conditions
The external heat dissipation depends on the heat convection and radiation along the surfaces of transformer. The convective and radiant heat transfer process is governed by the following equations:
where qconv and qrad are the heat transfer rates per unit area at the surface by convection and radiation; h is the convective heat transfer coefficient; S stands for the heat dissipating area of the transformer tank and radiator; Ts represents the temperature of the transformer tank and radiator; Tf stands for ambient temperature; is the Stefan-Boltzmann constant; is the emissivity of the surface, is the absorptivity; G is the irradiation.
Convective heat transfer coefficient is different across all the surfaces of the oil tank and radiator. It is significant to obtain heat transfer coefficients across all the surfaces. According to heat transfer theory [17], h can be calculated by the following:
where Gr is the Grashof number; g is the gravitational acceleration; β is the expansion coefficient; L is the feature size; v is the kinematic viscosity; Pr is the Prandtl number; μ is the viscosity coefficient; c is the specific heat capacity; k is the thermal conductivity; Ra is the Rayleigh number; Nu is the Nusselt number; k is the thermal conductivity; a and b are constants dependent on the system.
2.4. Corrections of Model
The heat dissipation process and load loss of the transformer is closely related to temperature. The thermal and physical parameters of oil, such as viscosity, specific heat, and thermal conductivity change with temperature. The physical parameters of the transformer oil used in this model are presented in Table 1.
On the other hand, as we can see from Equations (5) and (6), the process of convection and radiation are affected by temperature as well. Last but not least, the load loss of windings will fluctuate with temperature because the resistivity of copper changes with temperature. The following equation is used to describe the relationship between windings loss and temperature.
where P0 is the windings losses at temperature T0; T is the windings temperature; α represents temperature coefficient of copper, set to be 0.00393 in this paper.
To sum up, it is necessary to take the temperature corrections into consideration in order to make sure the accuracy of calculation.
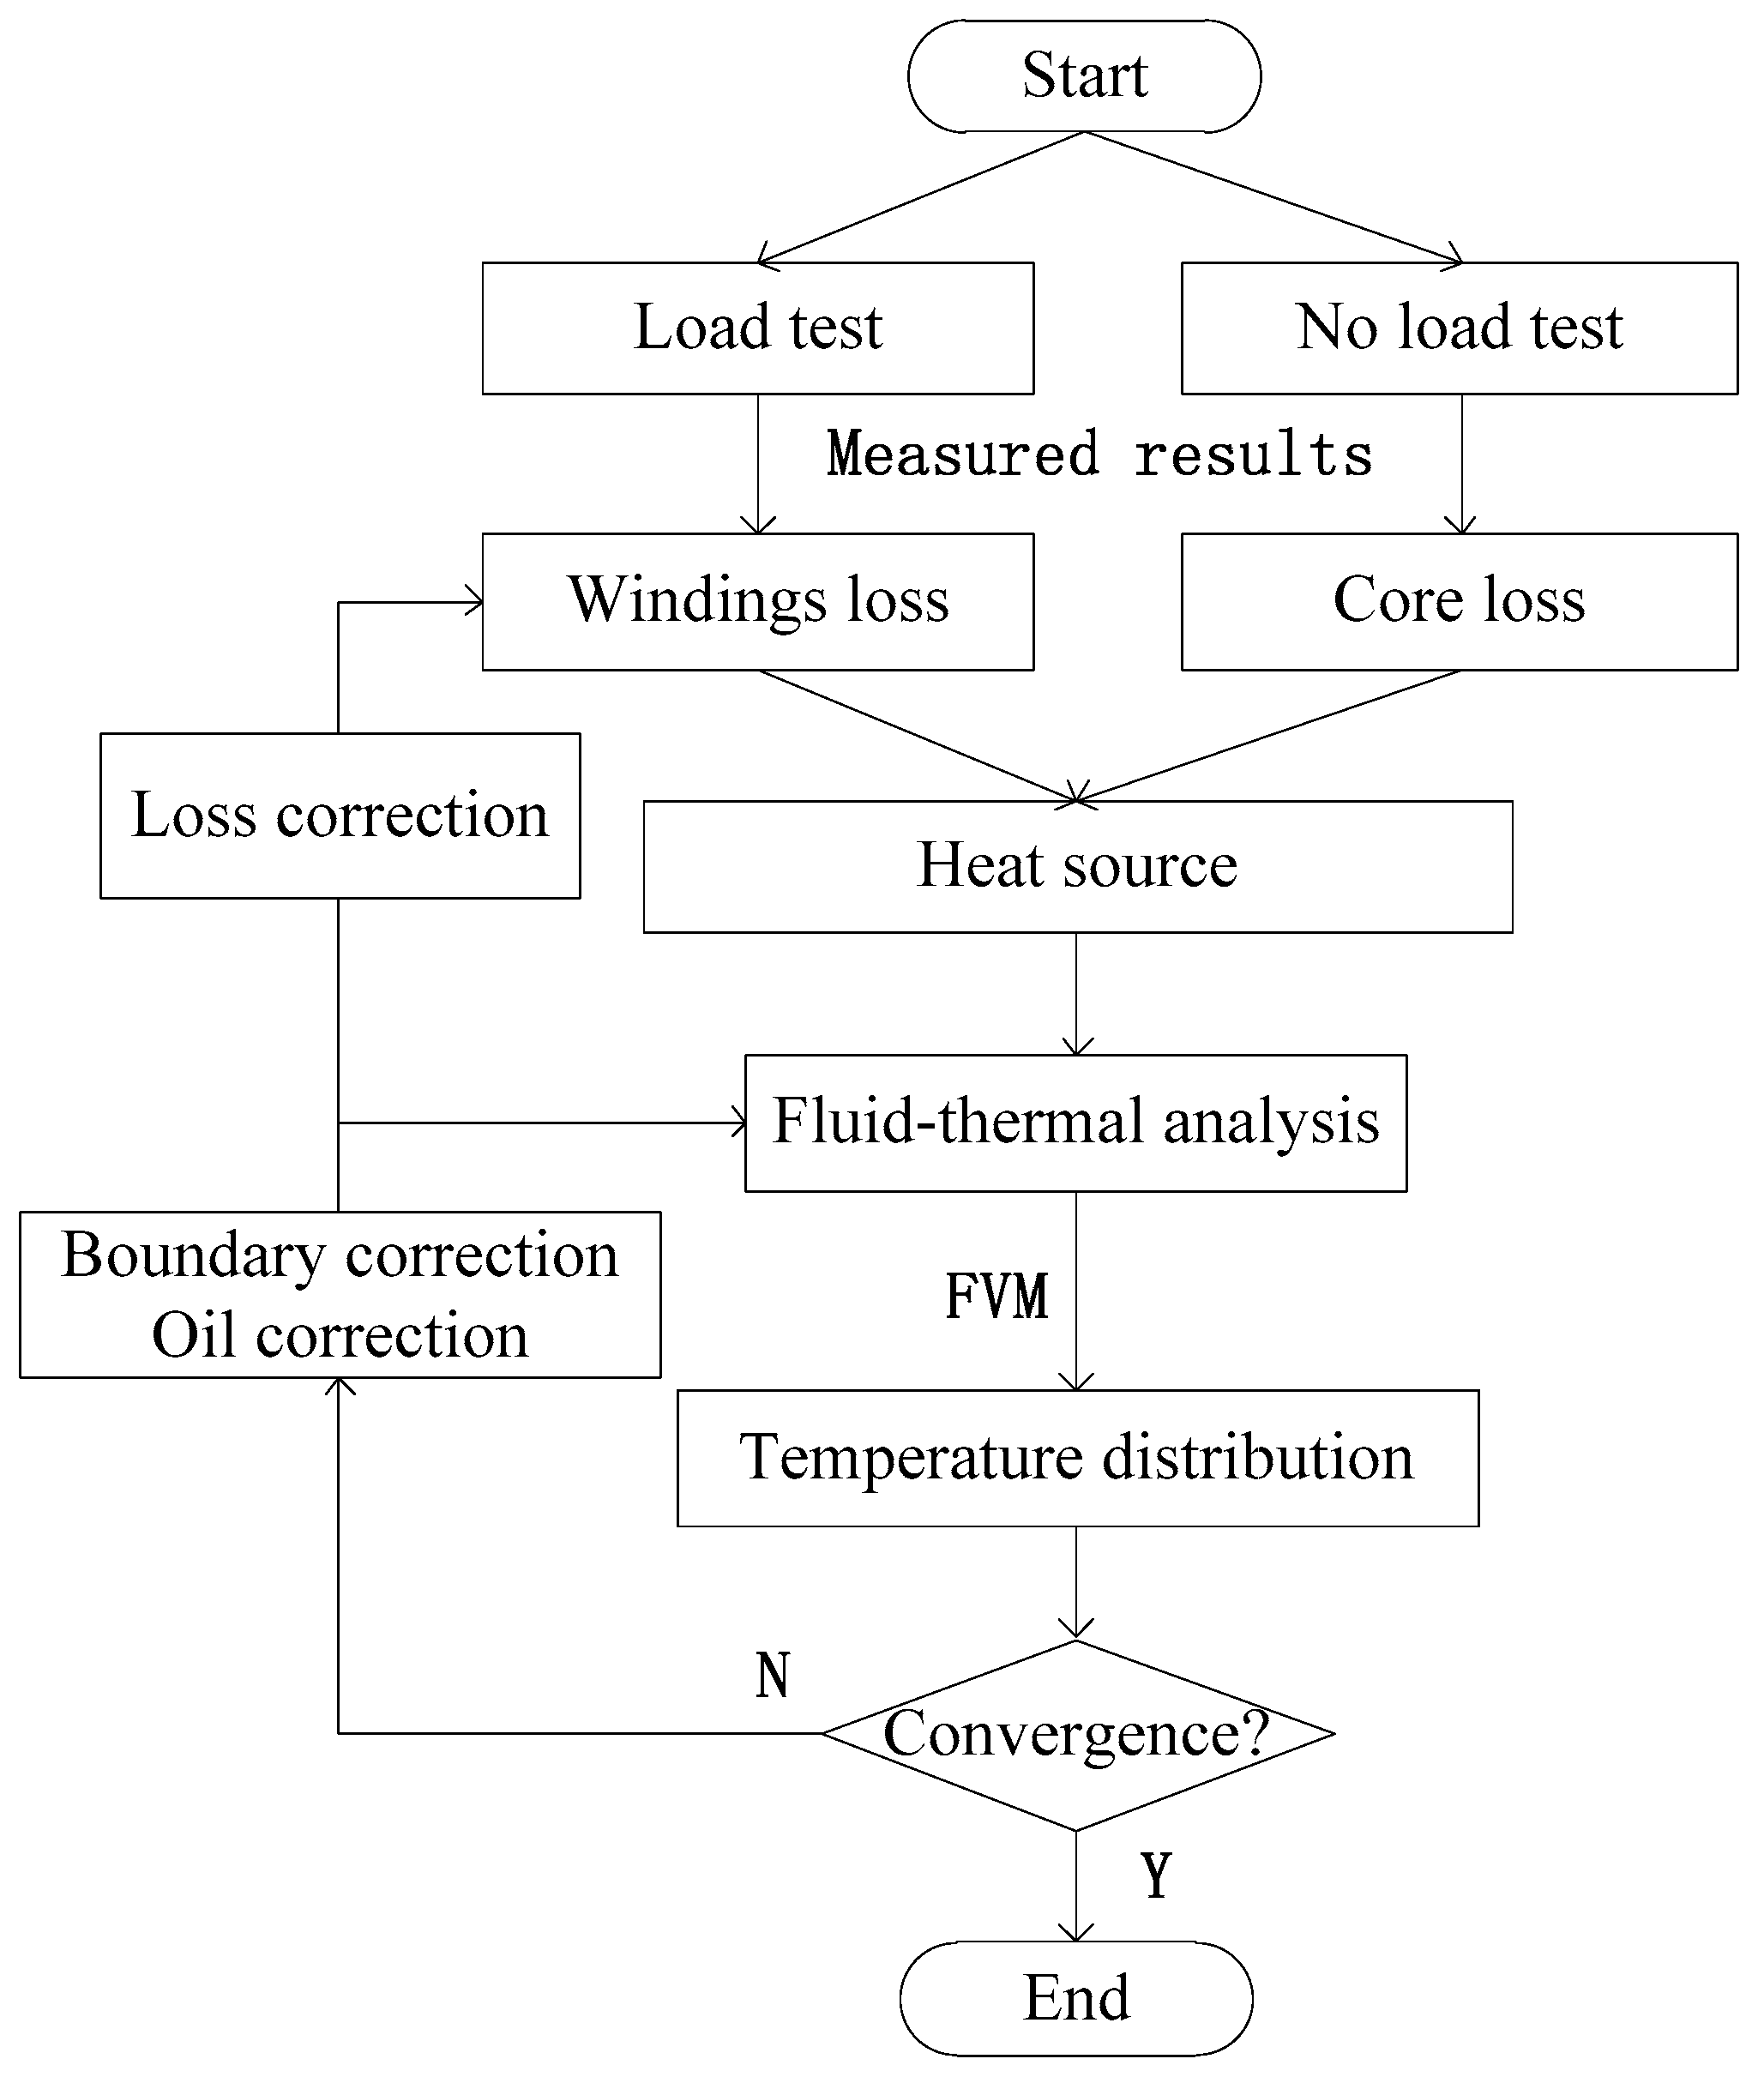
In this model, winding losses, parameters of oil and boundary conditions will be corrected on the basis of the thermal field calculation result till the maximum difference of temperature between two adjacent steps is less than 0.1 K. The flowchart of 3D coupled fluid-thermal coupled analysis is shown in Figure 1.
3. Loss Measurement of Three-Phase Three-Limb Transformer
3.1. 110 kV Three-Phase Three-Limb Transformer
An oil-immersed 110 kV three-phase three-limb ONAN transformer is selected to validate proposed model. The characteristics of the transformer model are shown in Table 2.
The picture of the 110 kV transformer is shown in Figure 2.
As we can see from Figure 2, there are 7 radiators, which consist of 2 pipes and 28 cooling fins on both side of transformer tank. These radiators play an important role in the process of the heat dissipation process: the heat is removed from the windings and core, then transported to the radiators by the oil which flows through oil duct near the windings and core, then via the pipes located at the top of the radiators and into the cooling fin, then to the pipes at the bottom of the radiators and finally back to the windings and core.
3.2. Measurement of Losses
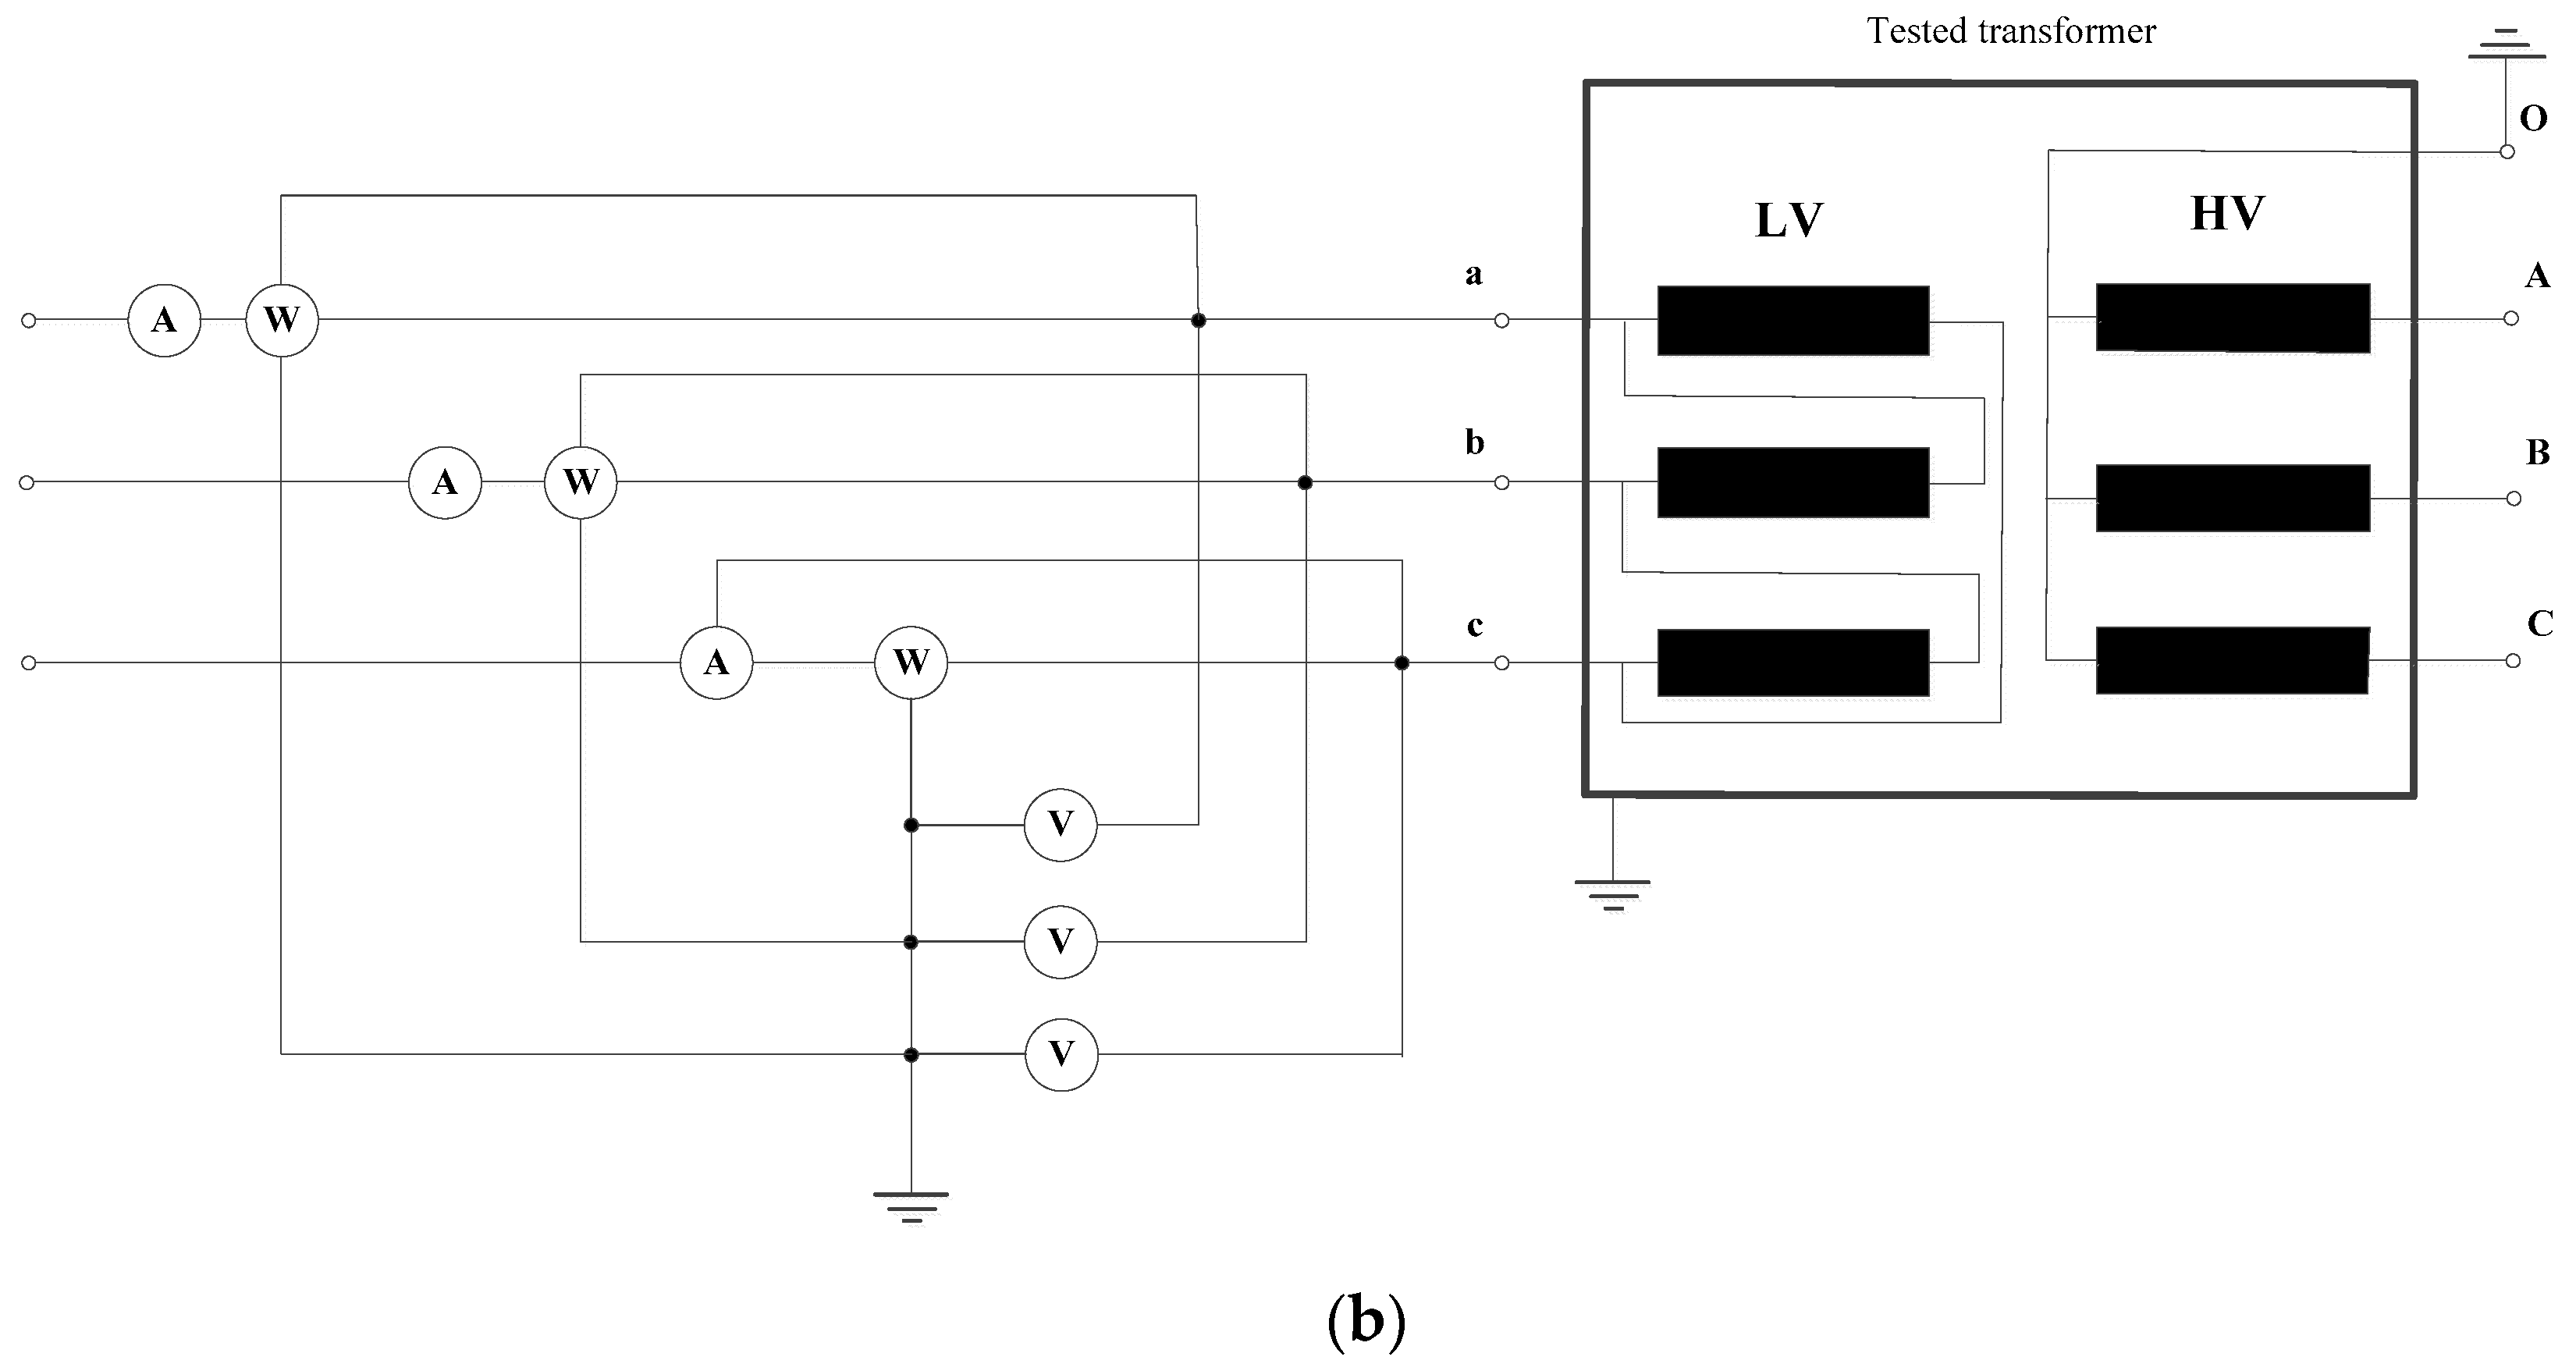
The load loss and no-load loss experiment according to standard IEC 60076-7 were performed to obtain the copper loss and iron loss under rated condition. A schematic diagram of load loss test and no-load test are presented in Figure 3. The losses tests are performed on the principal tapping and at rated frequency (50 Hz).
The load loss of HV-MV short circuit is measured with voltage applied to the HV windings, with the terminals of MV windings short-circuited, and with LV windings open-circuited. The supplied current of HV windings is equal to the rated current. The iron loss is very low because the voltage of HV windings is very low and the magnetic motive force in the iron core is basically balanced, so the measured loss can be identified as winding loss. The windings losses at different temperatures can be corrected by Equation (11). The result of load test is illustrated in Table 3.
The no-load loss of transformer is measured with LV windings load rated voltage, with the terminals of MV and HV windings open-circuited. The supplied voltage of LV windings is equal to the rated voltage. The loss of windings is very low because of the very low value of current in LV current. Hence, the measured loss can be considered as loss of iron core.
The total losses of running transformer can be described by:
where Ptotal are the total losses of transformer; Ur(%) is the voltage percentage; Piron stands for no-load losses; Pcopper represents the load losses; and k is the load factor which is set to be 1.0 in this experiment.
4. Fluid-Thermal Analysis of Three-Phase Three-Limb Transformer
4.1. Fluid-Thermal Analysis Model
The 3D model of a 110 kV ONAN transformer is shown in Figure 5. In order to save computation time, some simplifications were adopted. Since the goal of this study is the temperature distribution and HST inside the windings and iron core, some components that have little influence on the result were suppressed. These components are core clamp, compacted wood such as strip, spacer and angle ring, leads, bushing and so on.
The convective heat transfer coefficients of different surfaces are calculated by Equations (5)–(10). The simulation of the radiator is a huge calculation and requires mass memory due to the complex structure of radiator. For the sake of saving computing time, the radiator is simplified, as shown in Figure 5a. The convective heat transfer coefficient is corrected according the superficial area of radiator.
As illustrated in Figure 5b, the 110 kV three-phase three-limb transformer analyzed in this paper consists of a 19-layer planar laminated core and 9 winding; each phase is made up of 3 concentric windings: LV winding in the inner part, HV winding in the outer part and MV winding located between the two former ones. Windings are radially separated by vertical oil channels and spacers that are reduced in this model. In order to investigate the oil flow and convective heat transfer process inside the transformer, vertical oil ducts between windings are considered and no-slip condition is taken into account in the surfaces of the vertical oil ducts. The horizontal oil-ducts that separate the copper coils are ignored for the sake of saving computational cost.
The simulation of this model shown in Figure 5 was performed using a commercial tool (ANSYS v15.0, ANSYS, Pittsburgh, PA, USA).
4.2. Results with Fluid-Thermal Analysis
The results of fluid-thermal coupled analysis are shown here. The heat power sources of windings and core are obtained from a former load test and no-load test. The winding losses are corrected according to Equation (11). To simulate the short-circuit method temperature rise test situation, the total losses obtained from Equation (12) when voltage percentage is 100% and load factor is 1 are loaded on the windings according to the resistances because the iron loss is very low in the short-circuit temperature rise test.
The heat dissipation process inside the transformer can be investigated by FVM in fluid-thermal field. Because of the high viscosity and relatively low Rayleigh number (Ra ≤ 109) of oil flow, laminar flow will be the main form of convection of transformer oil.
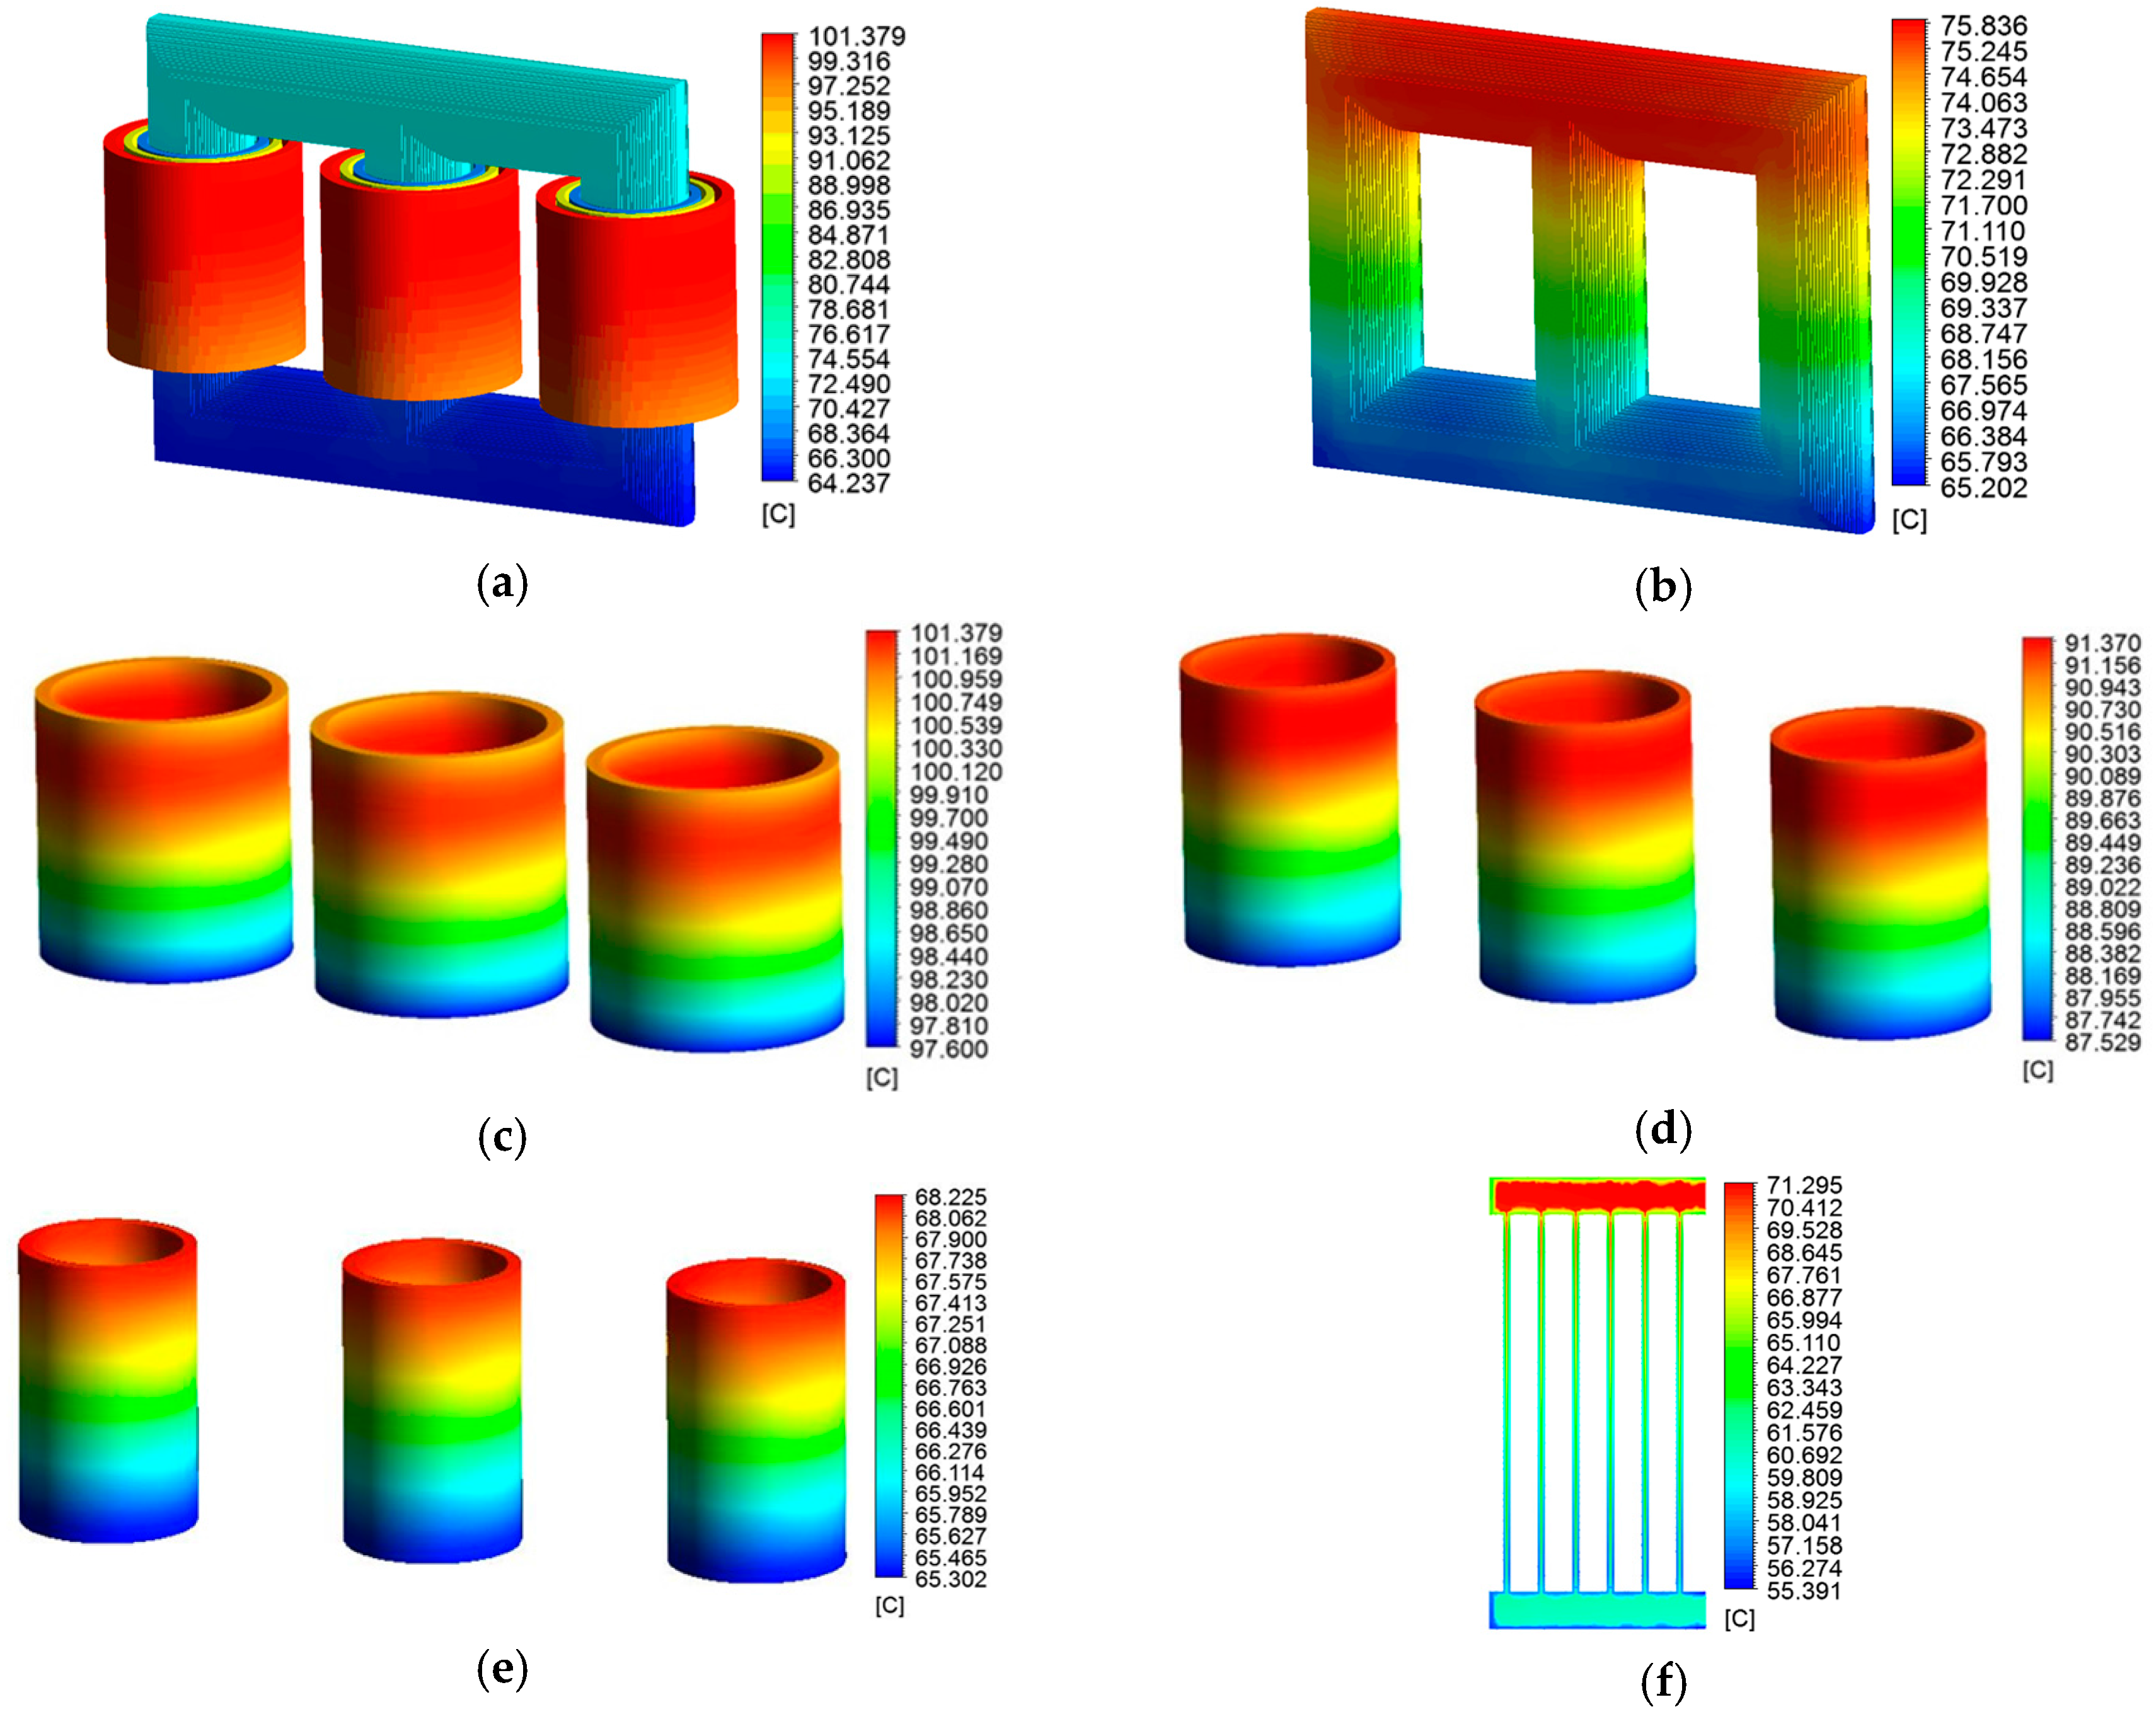
The ambient temperature was set to be 30 °C. Take the oil changes, heat transfer coefficient changes, radiance changes and loss changes with temperature into consideration, the temperature distribution inside transformer is investigated by fluid-thermal analysis. By iterative calculations, the model is updated according to the temperature distribution till the maximum difference of hot spot temperature between two adjacent steps is less than 0.01 °C. The results of fluid-thermal analysis are shown in Figure 6.
The temperature distribution inside the transformer is presented in Figure 6. The transformer hot-spot temperature is 101.379 °C, located at the upper part of HV windings as shown in Figure 6c. As for transformer core, the maximum temperature is 75.836 °C, located at the middle part of upper yoke, as shown in Figure 6b. Maximum temperature of MV windings is 91.370 °C. The temperature rise of LV windings is relatively small because LV windings are open-circuited.
The oil flow velocity distributions inside the three-phase three-limb transformer are demonstrated in Figure 7. As we can see from Figure 7a, the maximum velocity inside the tank is 0.071 m/s, which appears inside the vertical oil channel between the HV windings and MV windings. The oil inside the radiator flows down from the top and the maximum velocity in the radiator is 0.039 m/s, located at the import and export of oil pipe.
5. Temperature Rise Test
To validate the feasibility and accuracy of the proposed fluid-thermal coupled analysis, a temperature rise test of the transformer is performed and the FBG sensor is used to measure the temperature distribution of windings and core. The temperature measurement system based on the FBG sensor is shown in Figure 8. The temperature measurement probe is fixed in a protective case, as shown in Figure 8a. Twelve FBG sensors are applied to measure the temperature of windings and core respectively.
The temperature rise test is conducted according to the JBT 501-2006 and IEC 60076-7. The short circuit method is used to perform the temperature rise test. The schematic diagram of short circuit method is the same with the load test as shown in Figure 3a: supplied to the HV windings, with the terminals of MV windings short-circuited, and LV windings open-circuited, the test is performed considering the transformer total losses obtained from no-load test and load test. Maintain the input power unchanged till the temperature of transformer is stable. The whole temperature test last about 12 h.
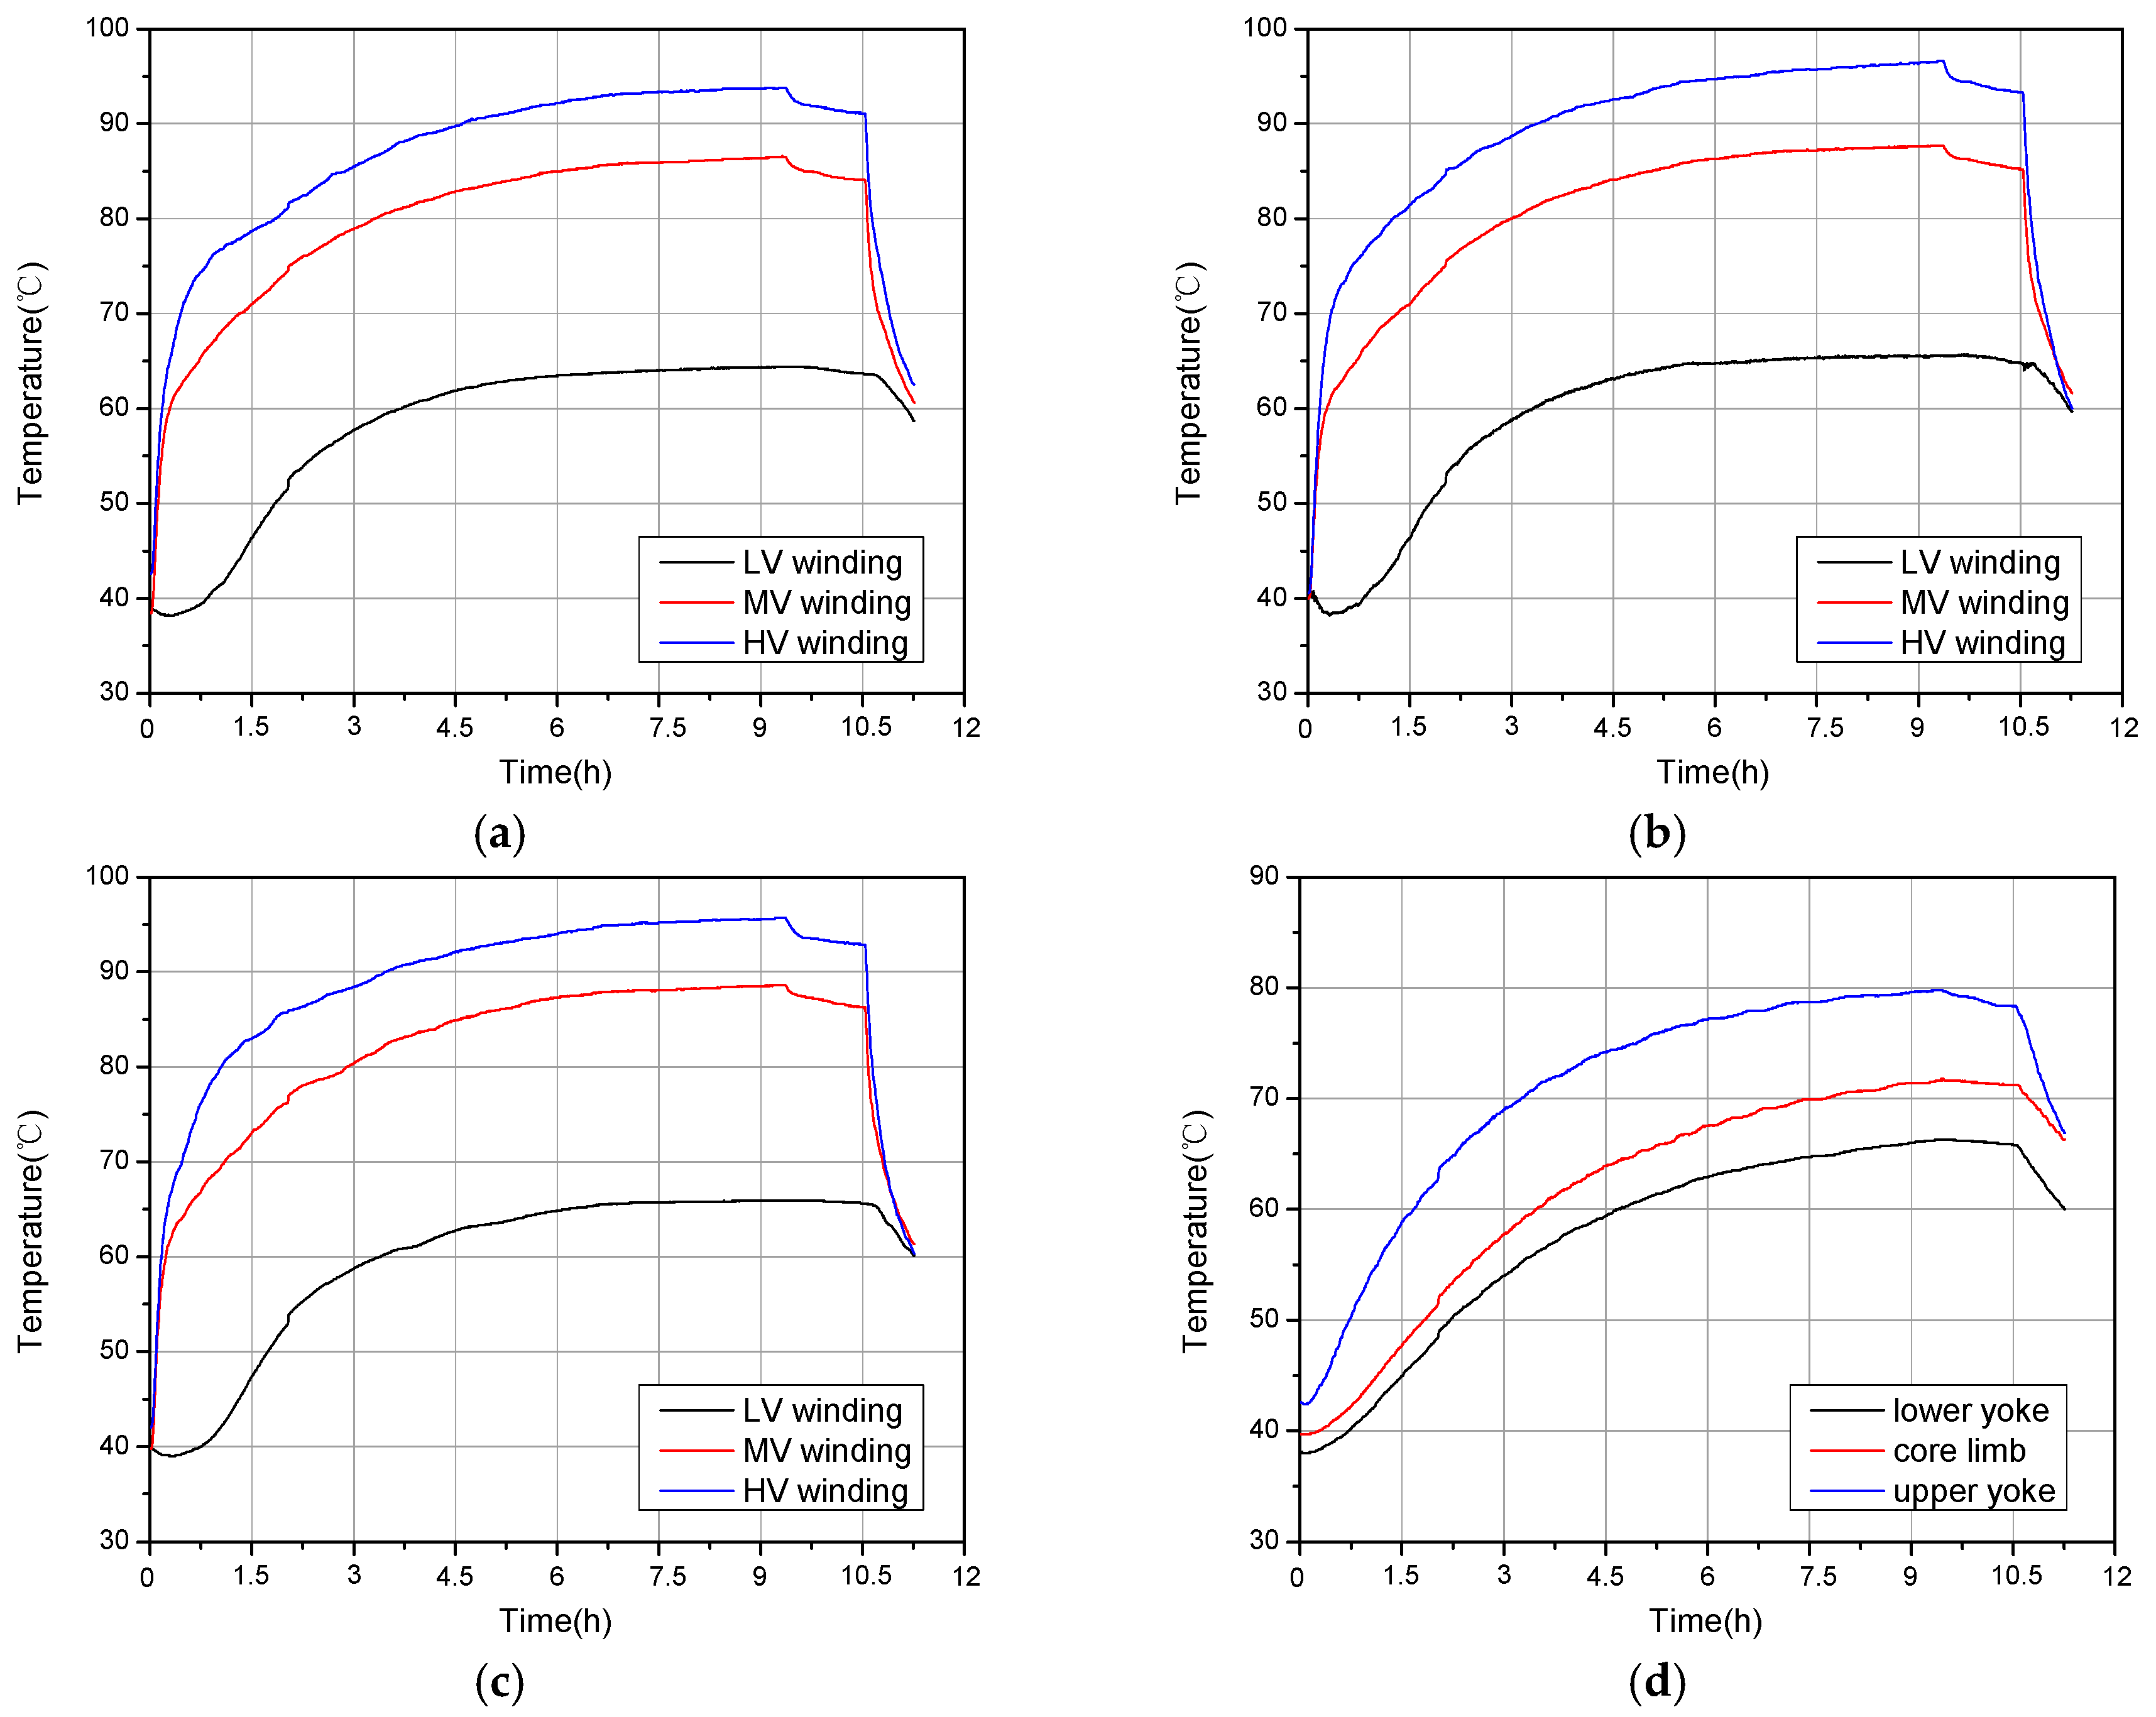
The data of FBG sensor measurements are presented in Figure 9. The hot spot result in the windings is about 96.5 °C and is located at the upper of B phase HV winding, as shown in Figure 9a–c. The hot spot result in iron core is about 79.8 °C and is found at the upper yoke. It is worth mentioning that since there are no current in LV windings, the temperature of LV windings is affected by the ambient temperature fluctuation and heat from HV and MV windings.
Table 5 describes the comparison between the experimental data and simulation results of the windings and iron core temperature. It is shown that the fluid-thermal coupled analysis can approximately come near the real model. The simulation results agree well with experimental data, the maximum error of temperatures between simulation results and experiment data is about 7.4 °C, which is mainly due to the neglect of horizontal oil channel which separate the disc of coils. Because part of the heat can be transferred from coils to oil through the horizontal channel, this leads to the difference between experimental data and calculation results: the simplification of the horizontal channel decreases the heat transfer between the windings and oil so that the simulated temperature of the windings is higher than measured; as for the core, it is heated by the windings because the iron loss is very low; the decrease of the heat transfer leads to a lower simulation temperature.
6. Conclusions
This paper focuses on the hot spot temperature rise of 31.5 MVA/110 kV ONAN three-phase three-limb transformer. A fluid-thermal coupled FVM model is proposed and a relative test is conducted. A FBG sensor system is constructed for the temperature measurement. The presented model has proven effective by a temperature rise test: the maximum relative error between experimental data and simulation results is 7.3%. This model can approximately simulate the heat dissipation process of a transformer, which involved heat conduction, convection and radiation. The design of the oil channel between the windings, coils and radiator is significant to the heat dissipation effect of cooling system. The neglect of horizontal oil channel, which separates the disc of coils, is the main factor that affects the accuracy of this model. In a future improved model, the influence of the horizontal oil channel should be taken into account.
Even so, this model still leads to a better understanding of the thermal performance of an ONAN transformer. The hot spot inside the transformer under rated power is 101.379 °C, located at the upper part of the HV windings; as for core, the hot spot is located at the middle part of upper yoke. This fluid-thermal coupled model offers help to transformer designers and related workers: for ONAN transformers, the heat dissipation capability is mainly determined by oil flow cycle inside the transformer, which consists of oil ducts between windings and oil ducts in the outside cooling fin. For transformer designers, it is necessary to make sure the structure of the oil duct meets the requirements for heat dissipation. On the other hand, this model can be applied to calculate the HST inside the transformer under different loads and evaluate the overload capacity of the transformer. Reasonable load scheduling advice can be put forward according to this model.
Acknowledgments
This article is supported by the National Engineering Laboratory for Ultra High Voltage Engineering Technology (Kunming, Guangzhou, China) (CSGTRC [2015] Q1543B14).
Author Contributions
Ruohan Gong and Jiangjun Ruan conceived and designed the models; Jingzhou Chen and Jian Wang performed the calculations; Ruohan Gong, Jingzhou Chen and Cihan Duan carried out the experiment; Yu Quan analyzed the data; Ruohan Gong wrote the paper.
Conflicts of Interest
The authors declare no conflict of interest.
References
- Godina, R.; Rodrigues, E.M.G.; Matias, J.C.O.; Catalao, J.P.S. Effect of loads and other key factors on oil-transformer ageing: Sustainability benefits and challenges. Energies 2015, 8, 12147–12186. [Google Scholar] [CrossRef]
- Wang, C.; Wu, J.; Wang, J.; Zhao, W. Reliability analysis and overload capability assessment of oil-immersed power transformers. Energies 2016, 9, 43. [Google Scholar] [CrossRef]
- Zhang, Y.J.; Ruan, J.J.; Huang, T.; Yang, X.P.; Zhu, H.Q.; Yang, G. Calculation of temperature rise in air-cooled induction motors through 3-D coupled electromagnetic fluid-dynamic and thermal finite-element analysis. IEEE Trans. Magn. 2012, 48, 1047–1050. [Google Scholar] [CrossRef]
- Jahromi, A.; Piercy, R.; Cress, S.; Service, J.; Fan, W. An approach to power transformer asset management using health index. IEEE Electr. Insul. Mag. 2009, 25, 20–34. [Google Scholar] [CrossRef]
- Amoiralis, E.; Tsili, M.; Kladas, A. Transformer design and optimization: A literature survey. IEEE Trans. Power Deliv. 2009, 24, 1999–2024. [Google Scholar] [CrossRef]
- IEC 60076-7. Power Transformers-Part 7: Loading Guide for Oil-Immersed Power Transformers; IEC Central Office: Geneva, Switzerland, 2005; pp. 53–59. [Google Scholar]
- Garg, V.K.; Weiss, J.; Del Vecchio, R.M.; Raymond, J. Magneto-thermal coupled finite element calculations in multiconductor systems. IEEE Trans. Magn. 1987, 23, 3296–3298. [Google Scholar] [CrossRef]
- Lefevre, A.; Miegeville, L.; Fouladgar, J.; Olivier, G. 3-D computation of transformers overheating under nonlinear loads. IEEE Trans. Magn. 2007, 41, 1564–1567. [Google Scholar] [CrossRef]
- Nelson, D.J.; Jessee, J.P. A coupled thermal magnetic model for high frequency transformers. I. Model formulation and material properties. IEEE Trans. Compon. Hybrids Manuf. Technol. 1992, 15, 730–739. [Google Scholar] [CrossRef]
- Gong, R.; Ruan, J.; Chen, J.; Quan, Y.; Wang, J.; Jin, S. A 3-D coupled magneto-fluid-thermal analysis of a 220 kv three-phase three-limb transformer under DC bias. Energies 2017, 10, 422. [Google Scholar] [CrossRef]
- Liao, C.B.; Ruan, J.J.; Liu, C.; Wen, W.; Du, Z.Y. 3-D coupled electromagnetic-fluid-thermal analysis of oil-immersed triangular wound core transformer. IEEE Trans. Magn. 2014, 50, 8401904. [Google Scholar] [CrossRef]
- Lee, B.E.; Park, J.; Crossley, P.A.; Kang, Y.C. Induced voltages ratio-based algorithm for fault detection, and faulted phase and winding identification of a three-winding power transformer. Energies 2014, 7, 6031–6049. [Google Scholar] [CrossRef]
- Tenbohlen, S.; Coenen, S.; Djamali, M.; Mueller, A.; Samimi, M.H.; Siegel, M. Diagnostic measurements for power transformers. Energies 2016, 9, 347. [Google Scholar] [CrossRef]
- Teunissen, J.; Merte, R.; Peier, D. Stability of fiber Bragg grating sensors for integration into high-voltage transformers for online monitoring. In Proceedings of the 15th Optical Fiber Sensors Conference Technical Digest, Portland, OR, USA, 6–10 May 2002; pp. 541–544. [Google Scholar]
- Hou, P.; Zheng, L.; Wang, L.; Wang, Y. Novel method for improving the space resolution of distributed optical fiber temperature sensing system using decoupling technique. In Proceedings of the Optics and Optoelectronic Inspection and Control: Techniques, Applications, and Instruments, Beijing, China, 8 November 2000; pp. 176–180. [Google Scholar]
- Kim, M.; Lee, J.; Koo, J.; Song, M. A study on internal temperature monitoring system for power transformer using pptical Fiber Bragg Grating sensors. In Proceedings of the International Symposium on Electrical Insulating Materials, Yokkaichi, Japan, 7–11 September 2008; pp. 163–166. [Google Scholar]
- Cengel, Y.A. Heat Transfer; McGraw-Hill: New York, NY, USA, 2006. [Google Scholar]
Figure 1.
The flowchart of coupled Fluid-Thermal field analysis.

Figure 2.
110 kV three-phase three-limb transformer.
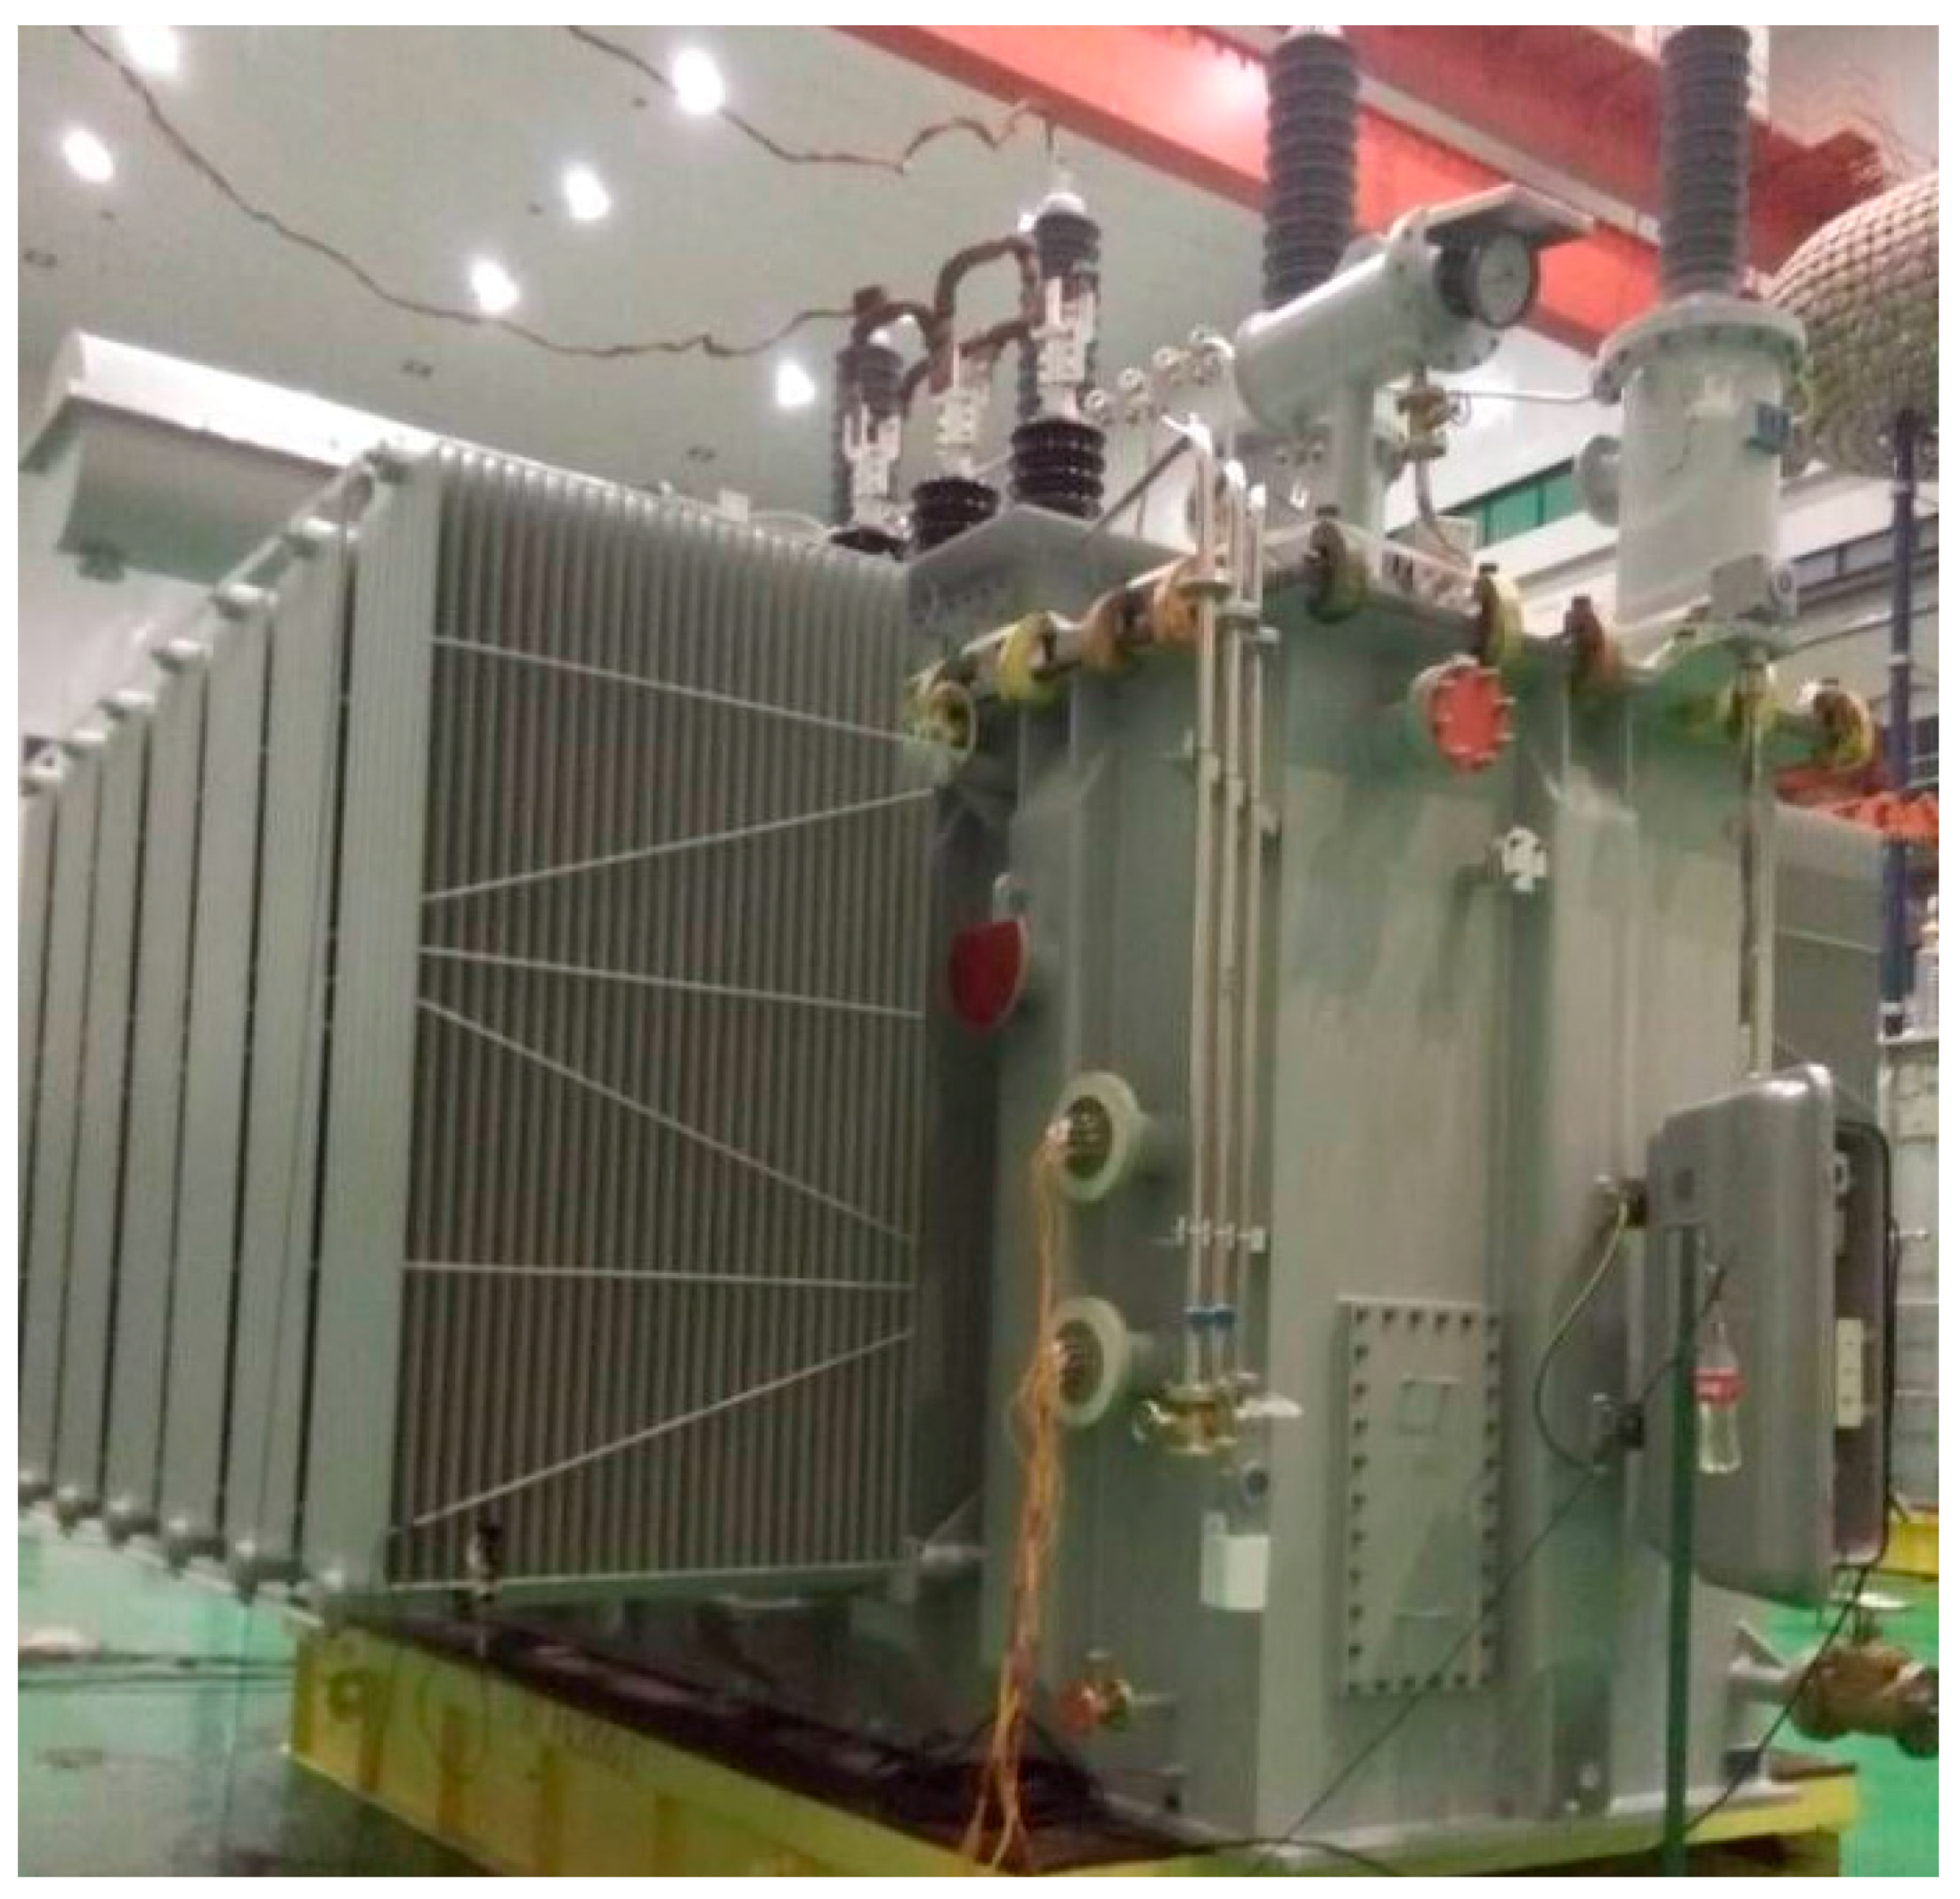
Figure 3.
(a) Schematic diagram of load test and (b) Schematic diagram of no-load test.
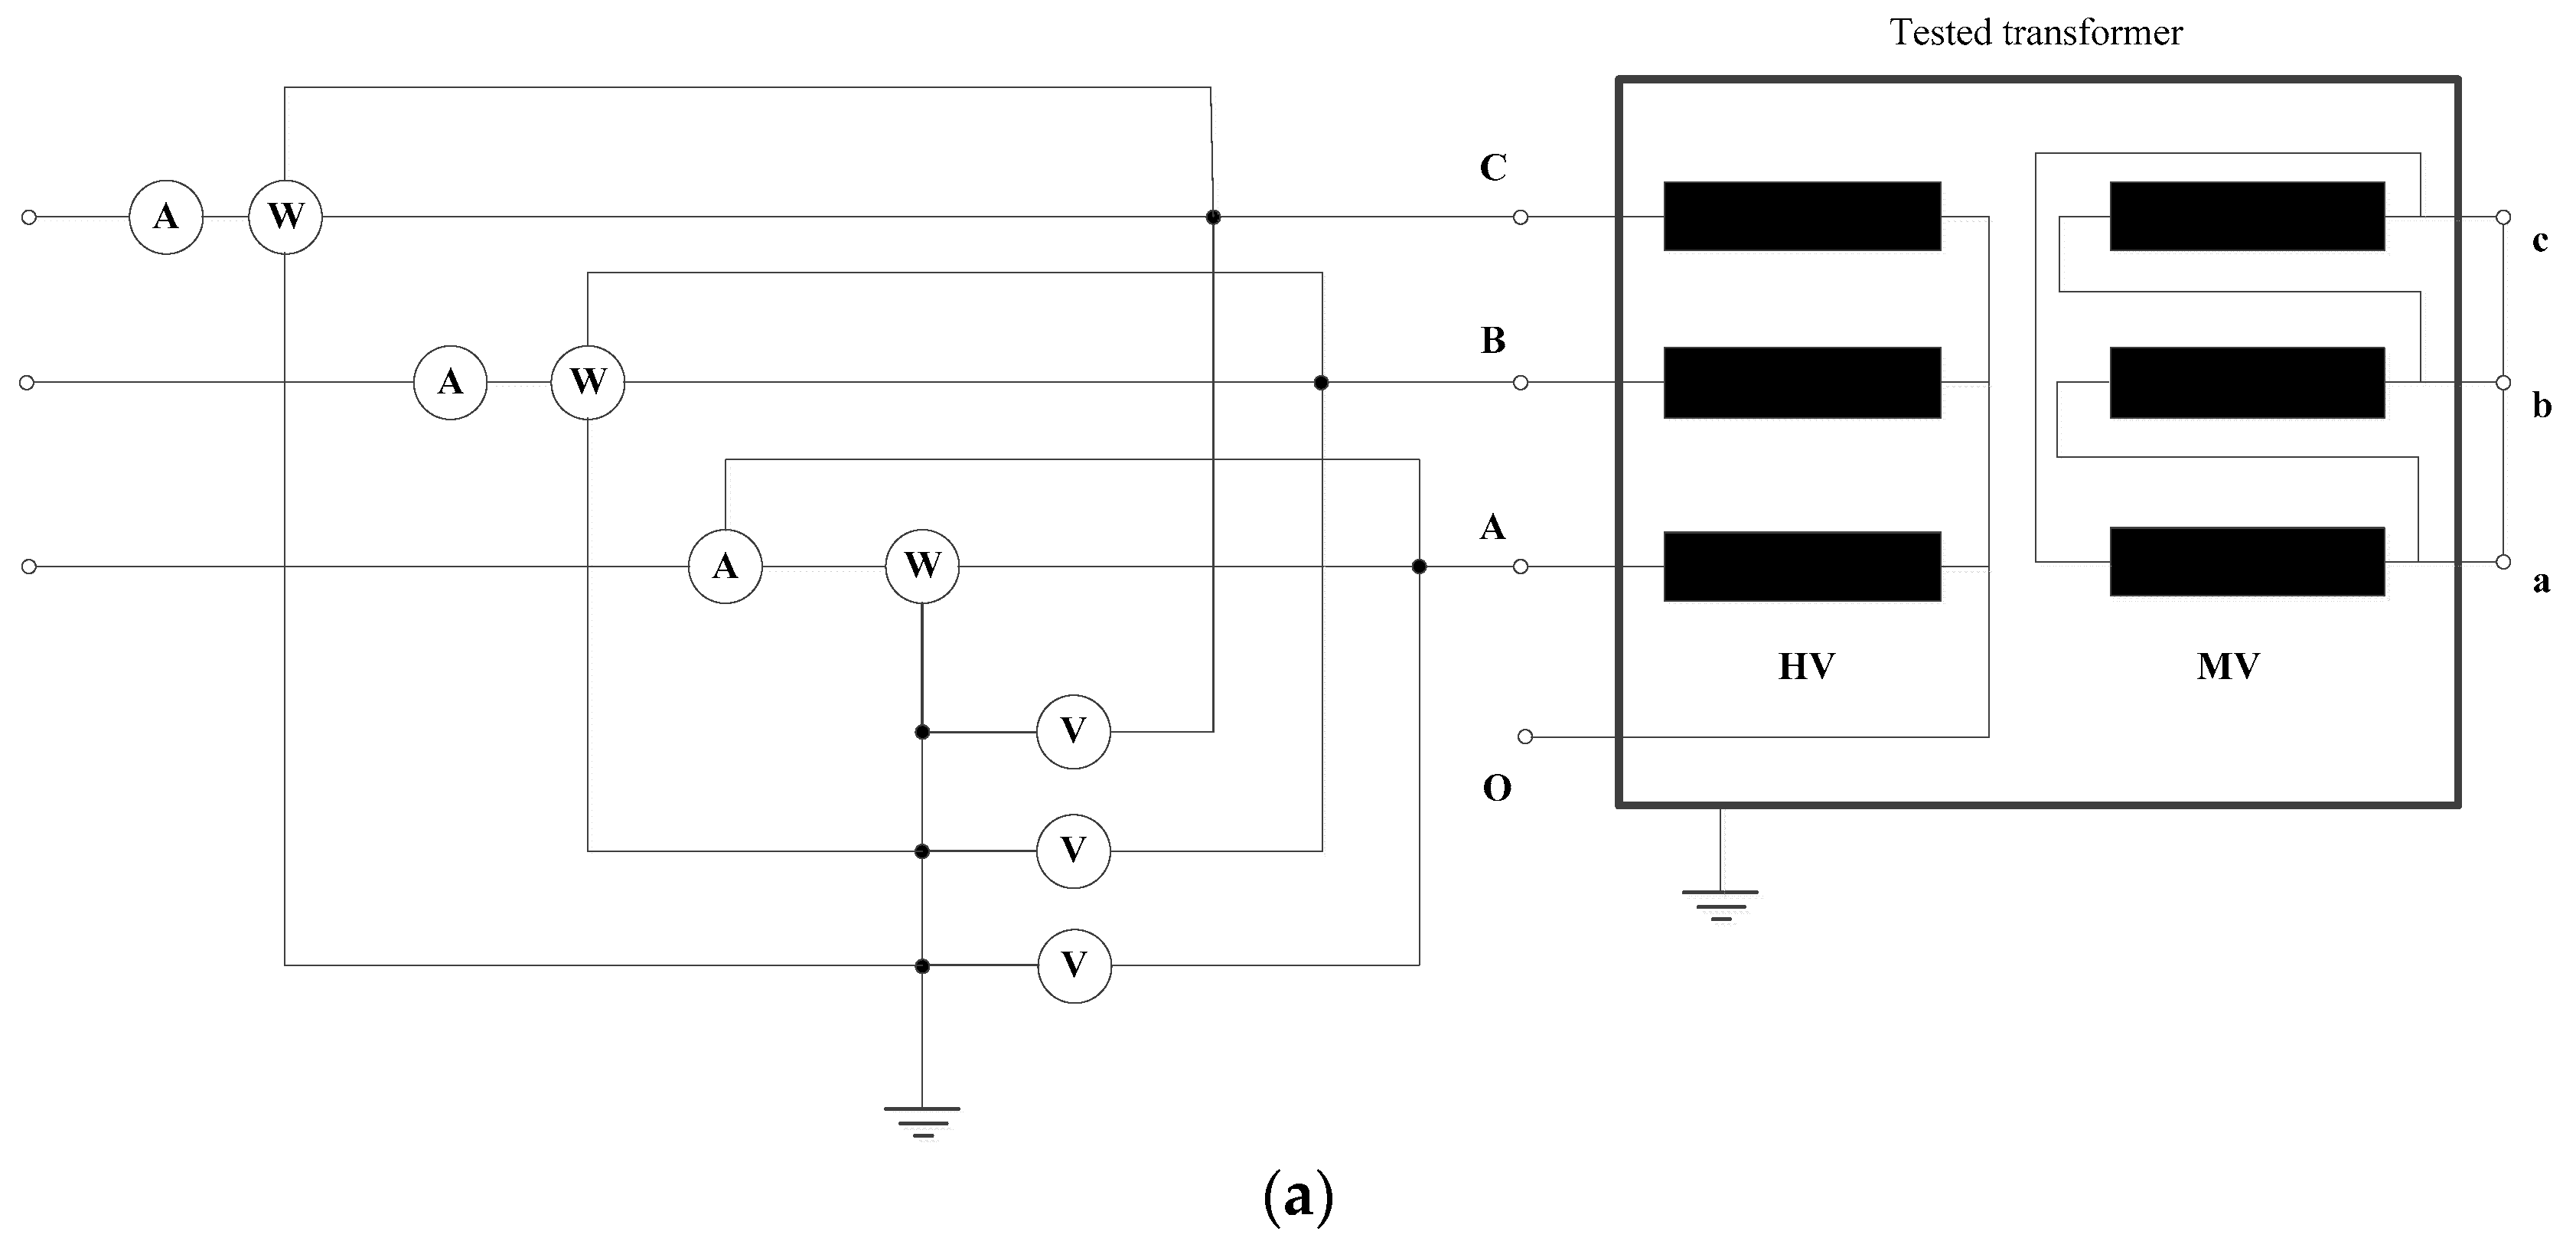

Figure 4.
No-load characteristic curve of core.
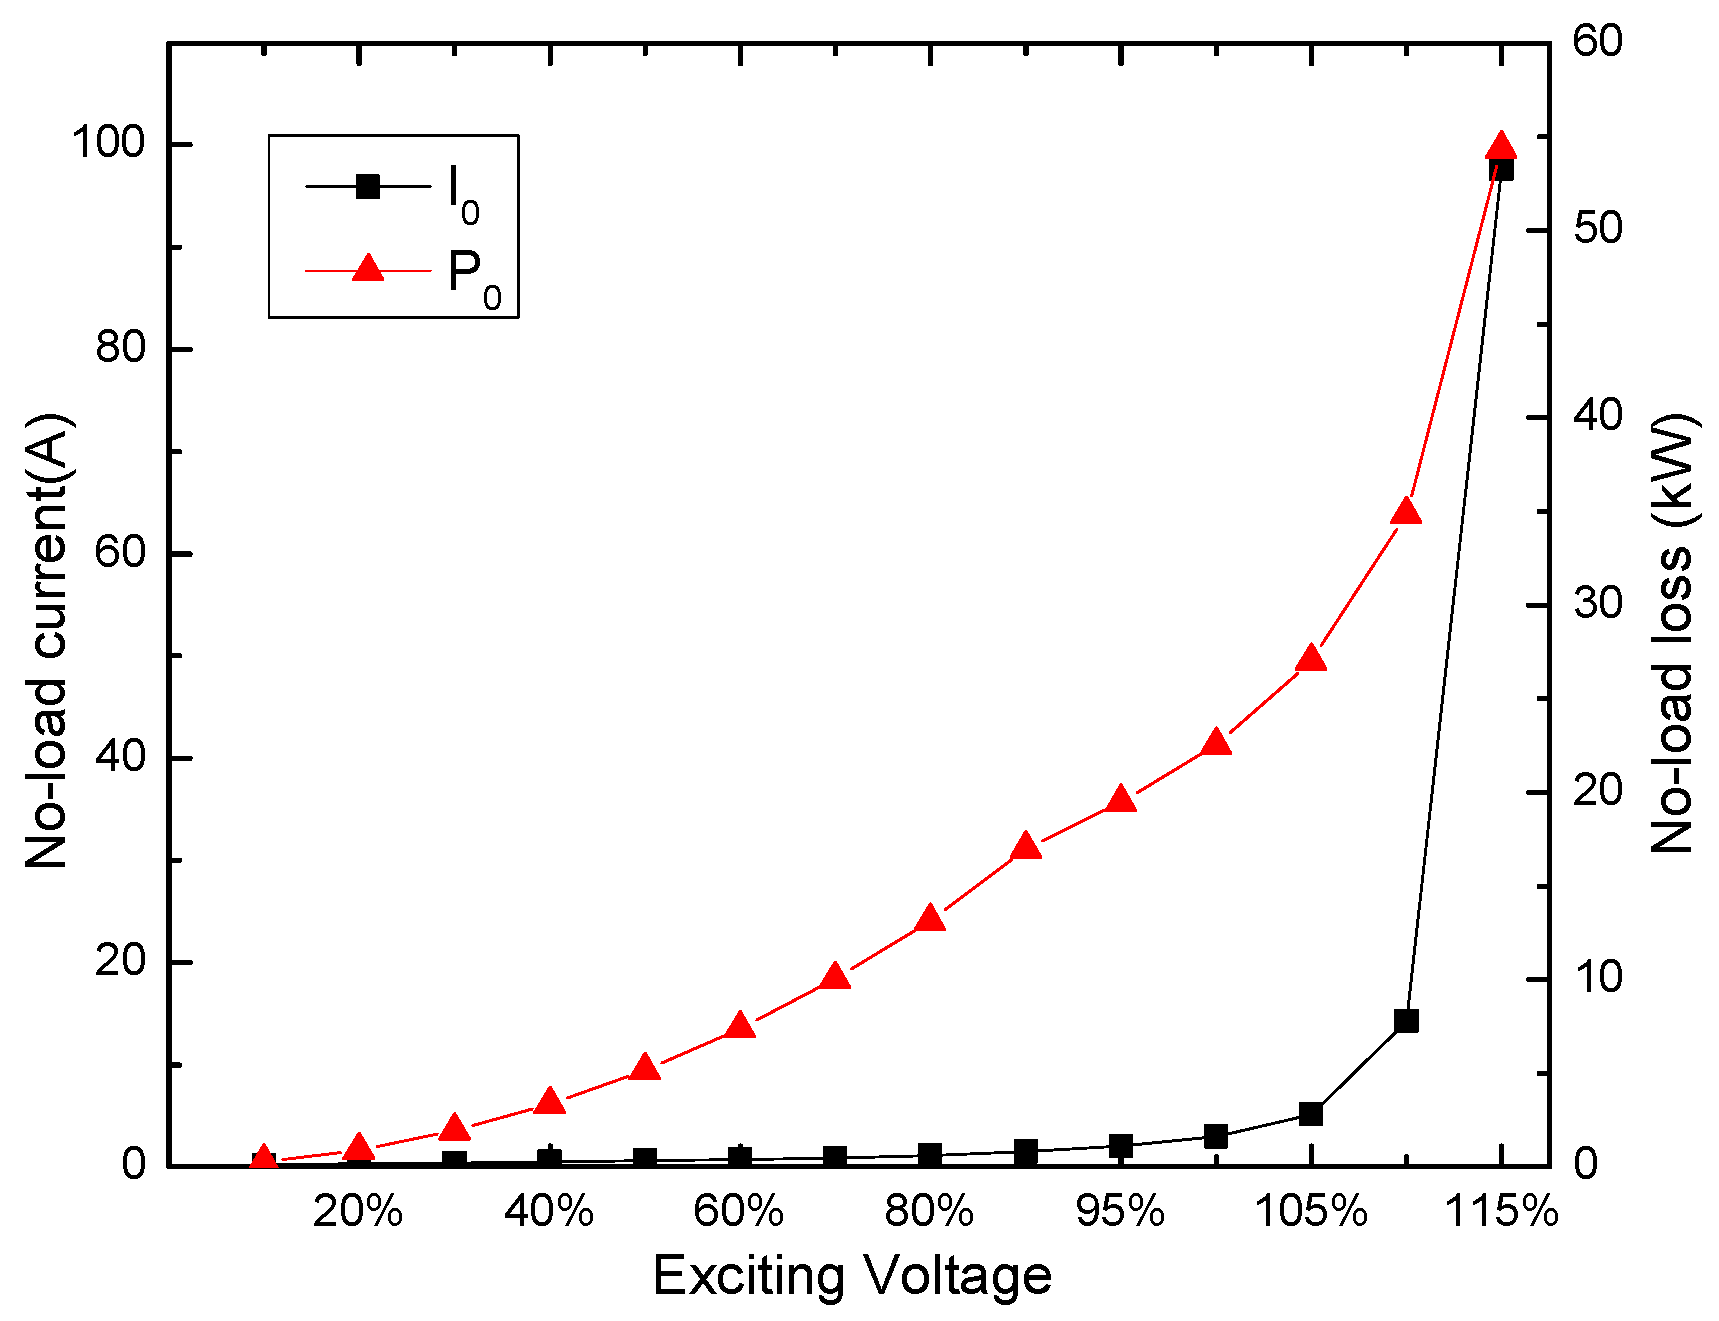
Figure 5.
(a) Three-phase three-limb transformer model (external) and (b) Three-phase three-limb transformer model (internal).
Figure 5.
(a) Three-phase three-limb transformer model (external) and (b) Three-phase three-limb transformer model (internal).
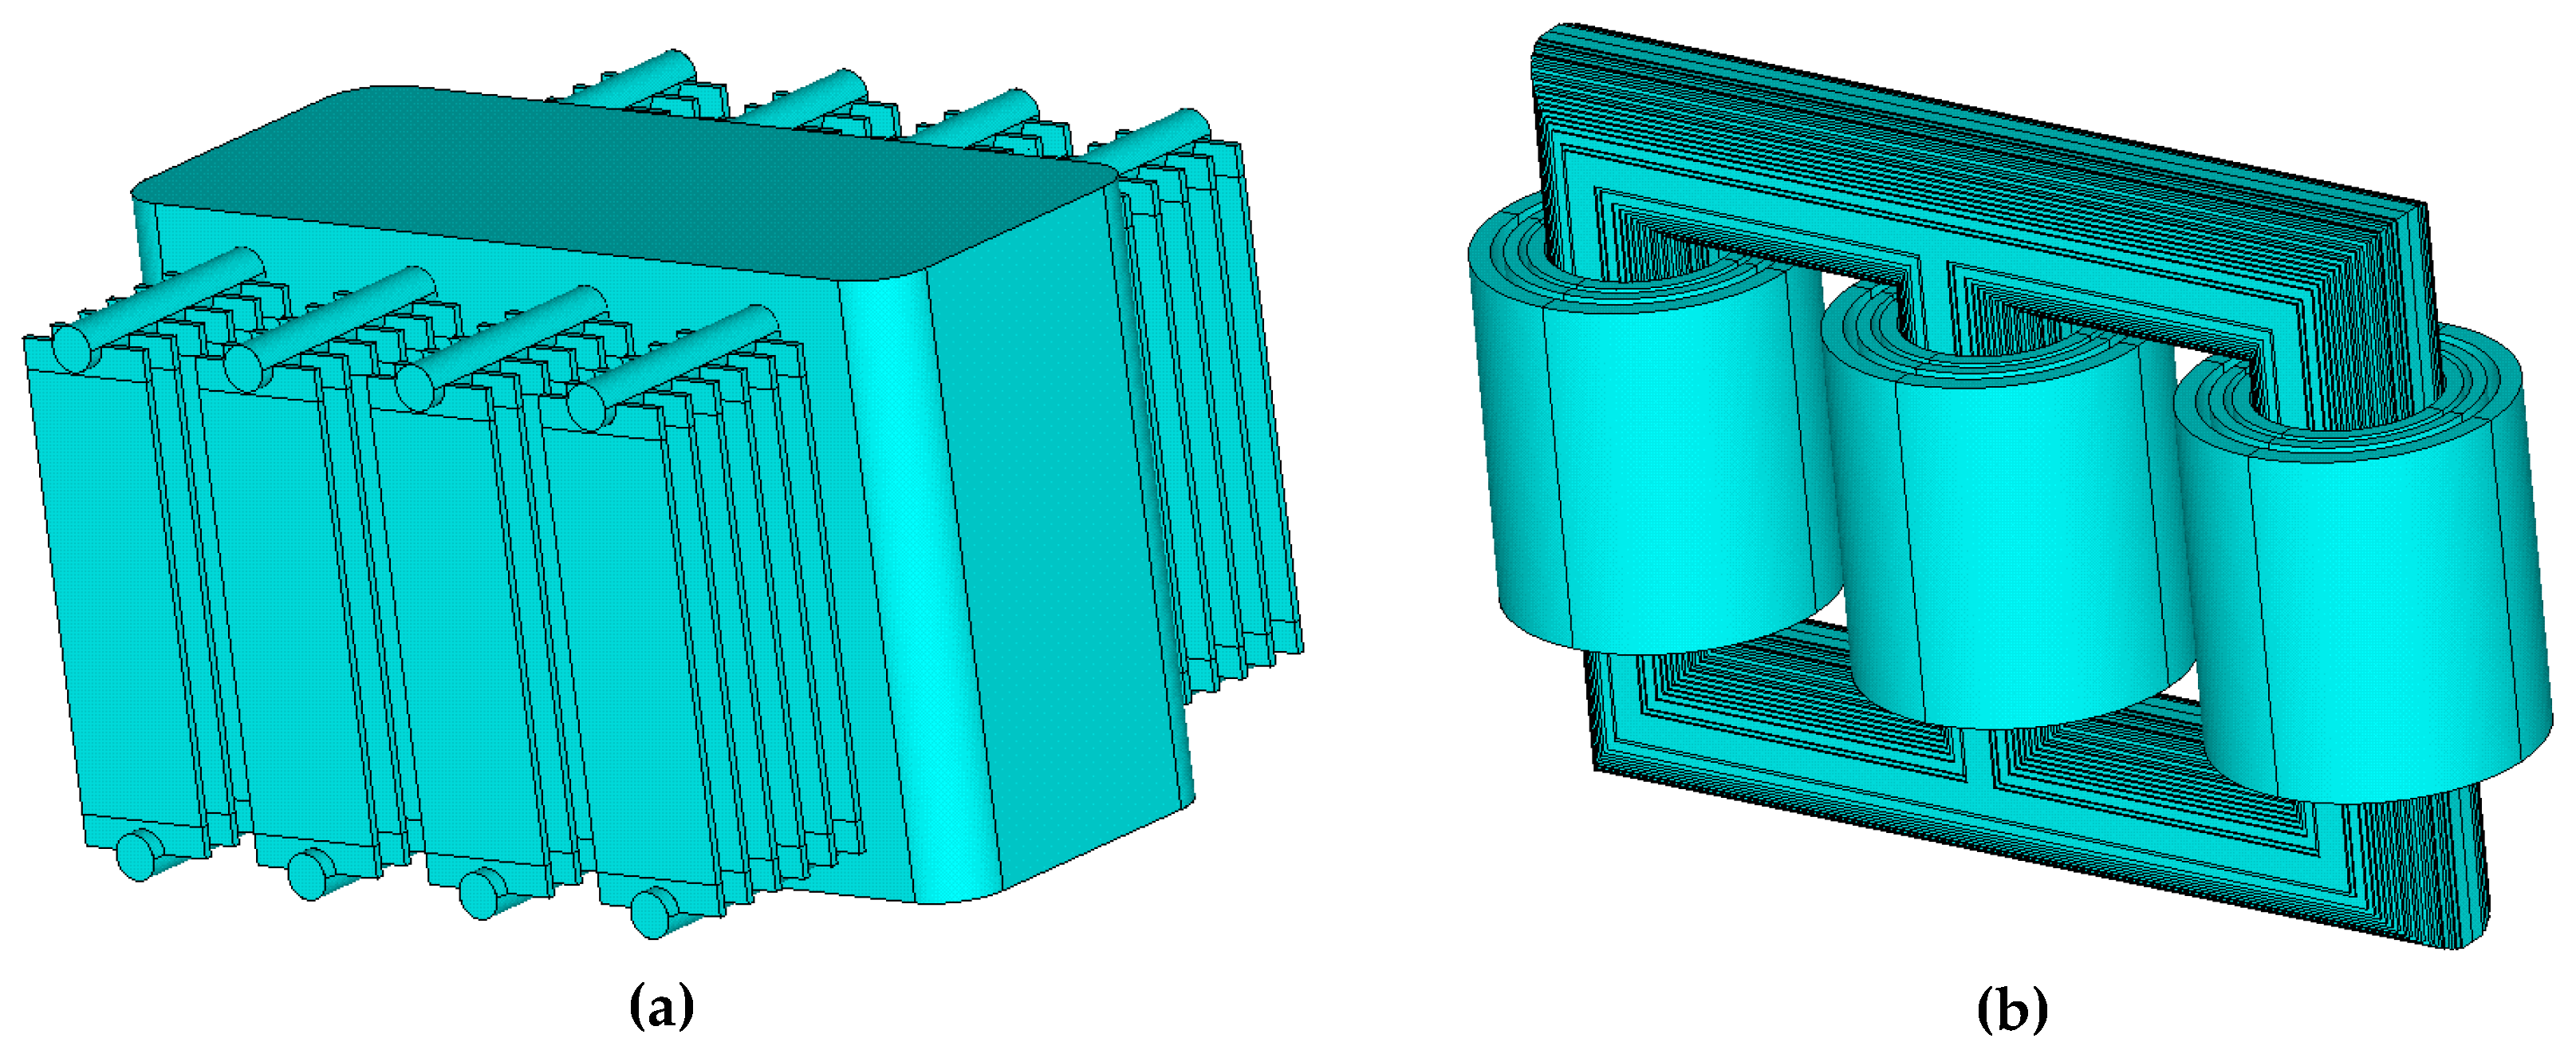
Figure 6.
(a) Temperature distribution inside transformer (total model); (b) Temperature distribution of core; (c) Temperature distribution of HV windings; (d) Temperature distribution of inner MV windings; (e) Temperature distribution of outer LV windings and (f) Temperature distribution inside of radiator (section view).

Figure 7.
(a) Oil flow velocity distribution inside transformer (section view); (b) Oil flow velocity distribution inside radiator (section view).
Figure 7.
(a) Oil flow velocity distribution inside transformer (section view); (b) Oil flow velocity distribution inside radiator (section view).
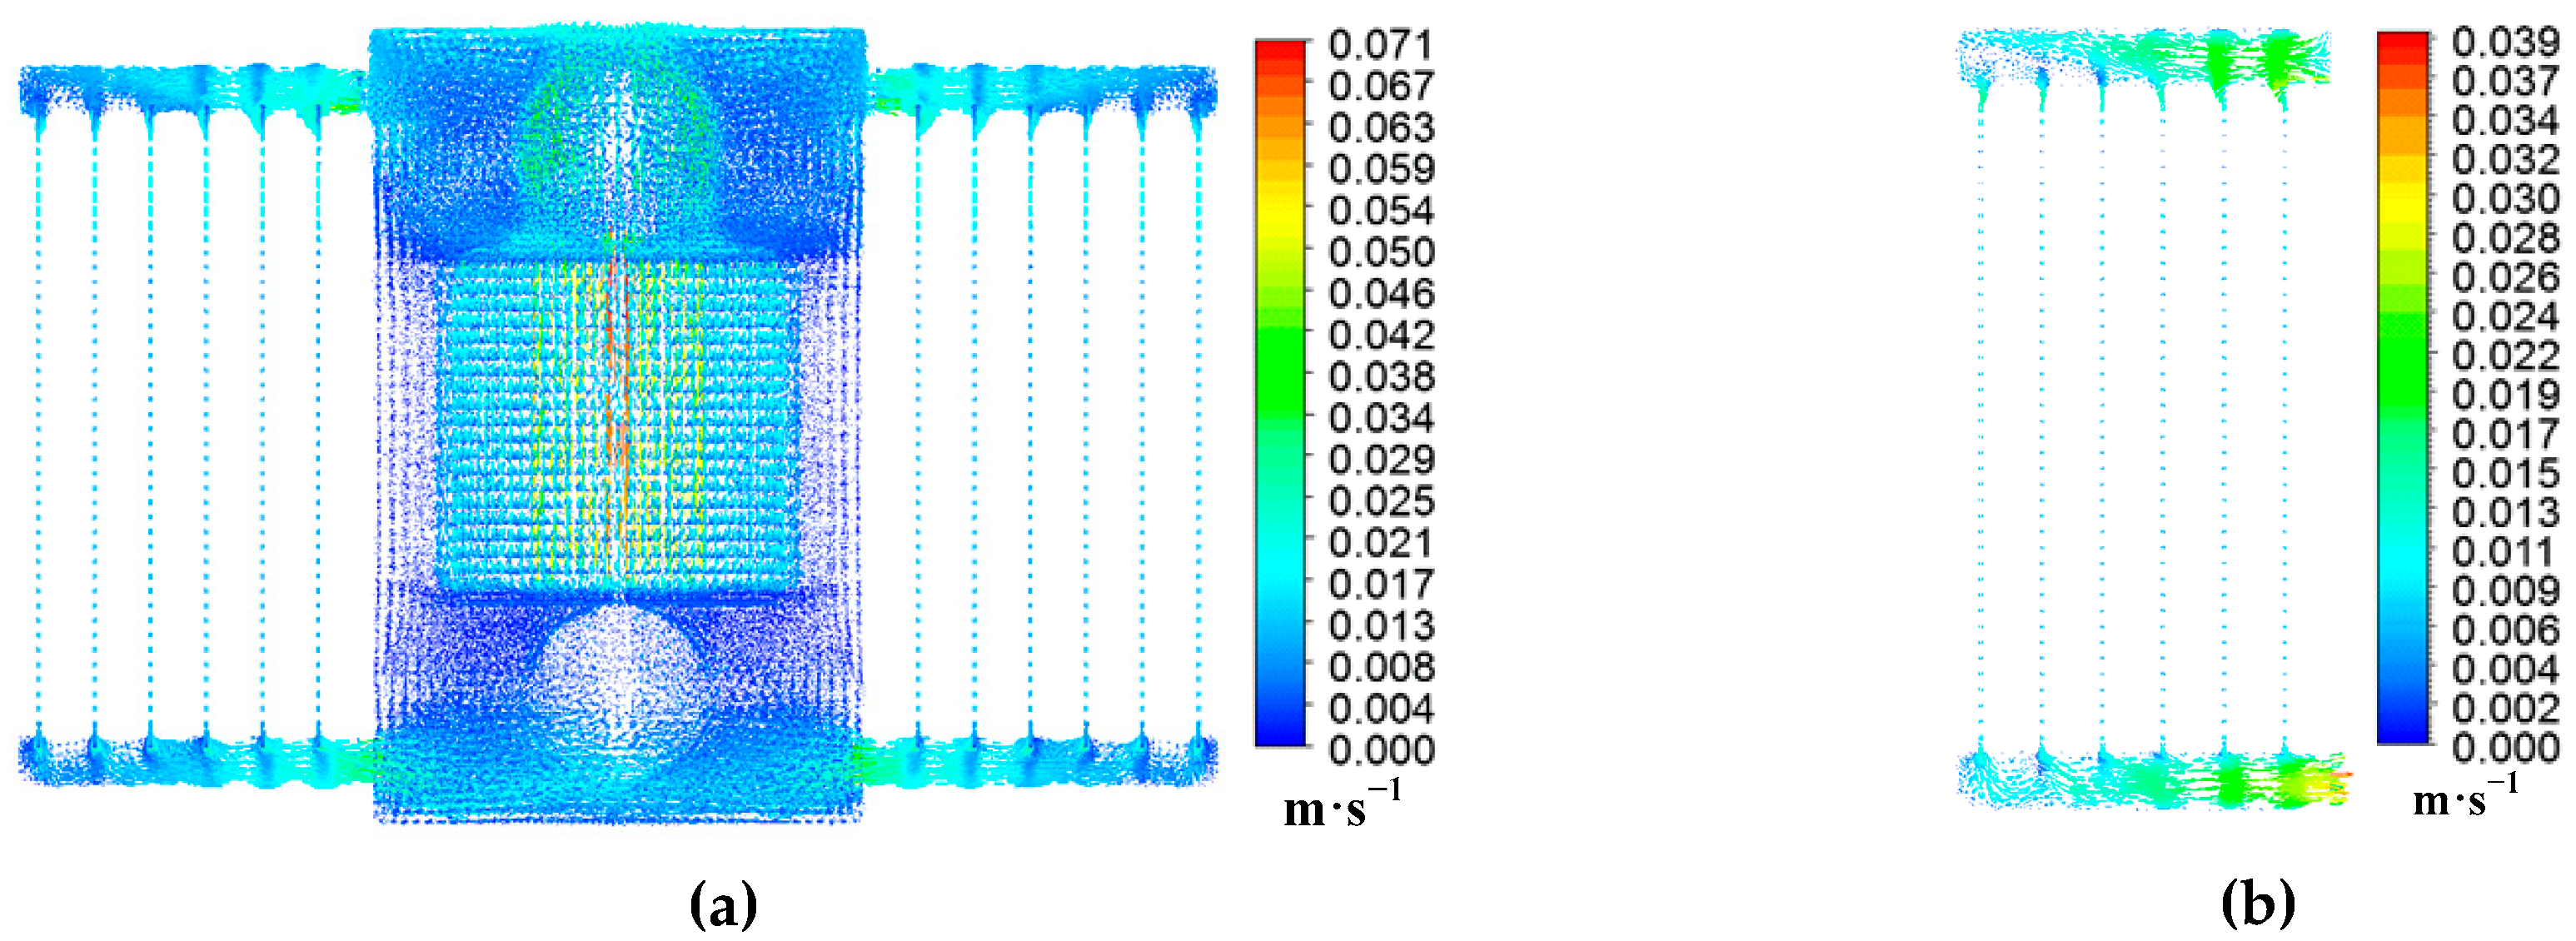
Figure 8.
(a) FBG sensor; (b) Sensors on the windings; (c) Sensors on the core and (d) Arrangement of temperature rise test.
Figure 8.
(a) FBG sensor; (b) Sensors on the windings; (c) Sensors on the core and (d) Arrangement of temperature rise test.
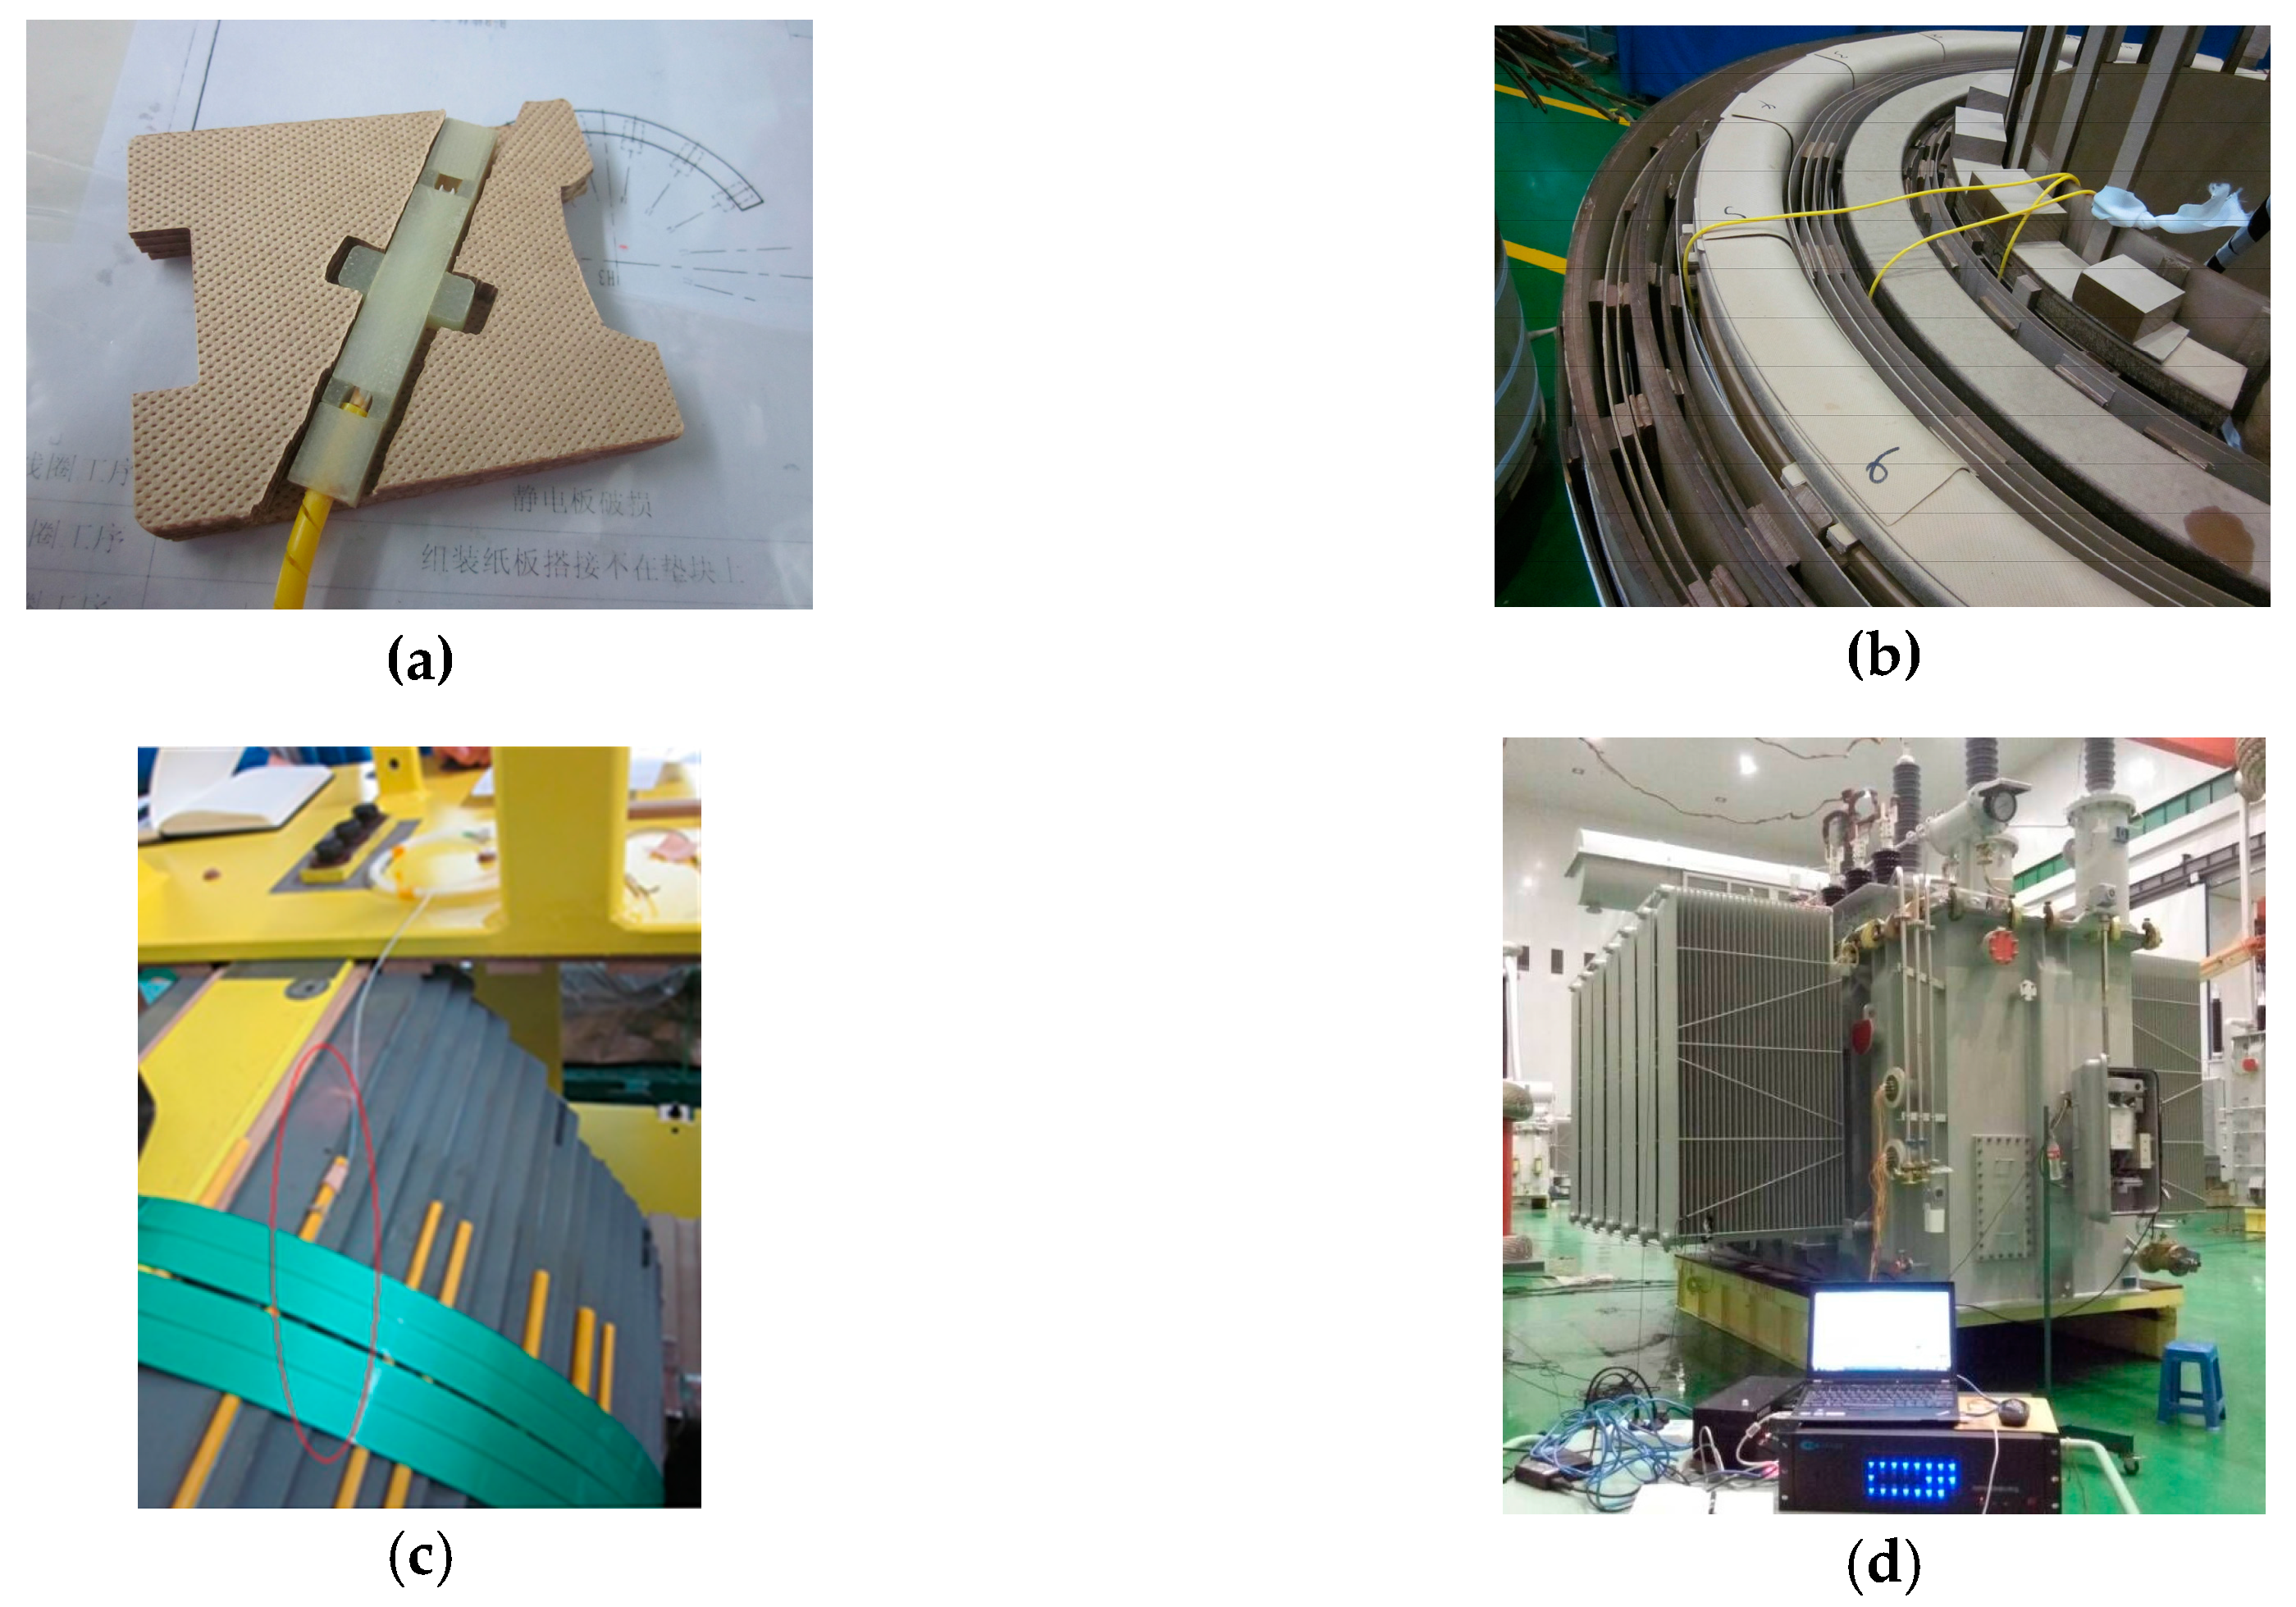
Figure 9.
(a) Temperature of A phase windings; (b) Temperature of B phase windings; (c) Temperature of C phase windings and (d) Temperature of iron core.
Figure 9.
(a) Temperature of A phase windings; (b) Temperature of B phase windings; (c) Temperature of C phase windings and (d) Temperature of iron core.

Table 1.
Physical parameters of transformer oil.
| Parameters of Oil | Function Fitting |
|---|---|
| Density | 1098.72 − 0.712T |
| Specific heat capacity | 807.163 + 3.58T |
| Heat conductivity | 0.1509 − 7.101 × 10 − 5T |
| Viscosity | 0.08467 − 4 × 10 − 4T + 5 × 10 − 7T2 |
Table 2.
Characteristics of 110 kV Oil-immersed three-phase three-limb Transformer.
| Classification | Value |
|---|---|
| Rated Power/MVA | 31.5 |
| Rated Voltage/kV | 110/38.5/10.5 |
| Rated Current/A | 165.3/472.4/1732.1 |
| Frequency/Hz | 50 |
| Connection Group | YNyn0d11 |
| Core Type | Planar laminated core |
| Cooling Type | ONAN |
Table 3.
Experiment results of load test (HV supplied, MV short-circuit, LV open-circuit).
| Measured Current (A) | Measured Voltage (kV) | Measured Load Loss (kW) |
|---|---|---|
| 122.73 | 6.686 | 148.719 |
Table 4.
Experiment results of no-load test (HV and MV open-circuit, LV supplied).
| Exciting Voltage of LV Windings | No-Load Current | No-Load Loss | ||
|---|---|---|---|---|
| Ur (%) | Ia (A) | Ib (A) | Ic (A) | P0 (kW) |
| 10% | 0.160 | 0.142 | 0.222 | 0.25 |
| 20% | 0.276 | 0.237 | 0.375 | 0.90 |
| 30% | 0.385 | 0.319 | 0.512 | 1.92 |
| 40% | 0.489 | 0.402 | 0.645 | 3.34 |
| 50% | 0.593 | 0.499 | 0.790 | 5.14 |
| 60% | 0.705 | 0.621 | 0.959 | 7.37 |
| 70% | 0.850 | 0.789 | 1.184 | 10.03 |
| 80% | 1.071 | 1.040 | 1.509 | 13.13 |
| 90% | 1.526 | 1.519 | 2.120 | 17.00 |
| 95% | 2.019 | 2.032 | 2.760 | 19.47 |
| 100% | 2.922 | 2.948 | 3.903 | 22.54 |
| 105% | 5.084 | 5.123 | 6.570 | 27.02 |
| 110% | 14.270 | 14.372 | 16.998 | 34.84 |
| 115% | 97.660 | 97.610 | 100.590 | 54.37 |
Table 5.
Comparison between experimental data and simulation results.
| Temperature | Experimental Data (°C) | Simulation Results (°C) | Relative Error (%) |
|---|---|---|---|
| A phase LV winding | 64.4 | 68.225 | 5.6 |
| A phase MV winding | 86.4 | 91.370 | 5.4 |
| A phase HV winding | 94.0 | 101.368 | 7.3 |
| B phase LV winding | 65.6 | 68.178 | 3.8 |
| B phase MV winding | 87.6 | 91.342 | 4.1 |
| B phase HV winding | 96.5 | 101.346 | 4.7 |
| C phase LV winding | 65.9 | 68.199 | 3.4 |
| C phase MV winding | 88.5 | 91.367 | 3.1 |
| C phase HV winding | 95.6 | 101.379 | 5.7 |
| Core | 79.8 | 75.836 | 4.9 |
© 2017 by the authors. Licensee MDPI, Basel, Switzerland. This article is an open access article distributed under the terms and conditions of the Creative Commons Attribution (CC BY) license (http://creativecommons.org/licenses/by/4.0/).
Share and Cite
MDPI and ACS Style
Gong, R.; Ruan, J.; Chen, J.; Quan, Y.; Wang, J.; Duan, C. Analysis and Experiment of Hot-Spot Temperature Rise of 110 kV Three-Phase Three-Limb Transformer. Energies 2017, 10, 1079. https://doi.org/10.3390/en10081079
AMA Style
Gong R, Ruan J, Chen J, Quan Y, Wang J, Duan C. Analysis and Experiment of Hot-Spot Temperature Rise of 110 kV Three-Phase Three-Limb Transformer. Energies. 2017; 10(8):1079. https://doi.org/10.3390/en10081079
Chicago/Turabian StyleGong, Ruohan, Jiangjun Ruan, Jingzhou Chen, Yu Quan, Jian Wang, and Cihan Duan. 2017. "Analysis and Experiment of Hot-Spot Temperature Rise of 110 kV Three-Phase Three-Limb Transformer" Energies 10, no. 8: 1079. https://doi.org/10.3390/en10081079
Note that from the first issue of 2016, this journal uses article numbers instead of page numbers. See further details here.