Power System Event Ranking Using a New Linear Parameter-Varying Modeling with a Wide Area Measurement System-Based Approach


1
Electrical Engineering Department, Shahed University, Tehran 3319118651, Iran
2
Iran Grid Management Company (IGMC), Teheran 1996836111, Iran
*
Author to whom correspondence should be addressed.
Energies 2017, 10(8), 1088; https://doi.org/10.3390/en10081088
Submission received: 16 May 2017
/
Revised: 28 June 2017
/
Accepted: 19 July 2017
/
Published: 26 July 2017
(This article belongs to the Section F: Electrical Engineering)
Abstract
:Detecting critical power system events for Dynamic Security Assessment (DSA) is required for reliability improvement. The approach proposed in this paper investigates the effects of events on dynamic behavior during nonlinear system response while common approaches use steady-state conditions after events. This paper presents some new and enhanced indices for event ranking based on time-domain simulation and polytopic linear parameter-varying (LPV) modeling of a power system. In the proposed approach, a polytopic LPV representation is generated via linearization about some points of the nonlinear dynamic behavior of power system using wide-area measurement system (WAMS) concepts and then event ranking is done based on the frequency response of the system models on the vertices. Therefore, the nonlinear behaviors of the system in the time of fault occurrence are considered for events ranking. The proposed algorithm is applied to a power system using nonlinear simulation. The comparison of the results especially in different fault conditions shows the advantages of the proposed approach and indices.
1. Introduction
Event and contingency analysis has been used for reliability and security assessment and improvement of power systems in recent years [1,2,3,4,5,6,7]. Usual approaches for importance tracking and ranking are based on the steady-state effects of the events on the power grid such as loading, voltage violations, etc. Recently, the inter-area oscillations have become an important concern for operators. Although standard Power System Stabilizers (PSSs) have been traditional tools used to improve the damping of system modes, they may not be quite effective for damping of all oscillations, especially after various event occurrences [8]. Hence, the oscillatory modes might have undesirable damping or cause instability under some conditions. The uncertainties in the response to disturbances have some noticeable effects on Dynamic Security Assessment (DSA) which requires Time-Domain Simulation (TDS) [9]. Too much time is required to analyze so many events in a complicated power system using TDS. Hence, sorting and detection of critical events are the essential issues in DSA and for design or tuning the control schemes. Consequently, event ranking can be used to create a priority list for more actions to reduce the probable undesirable performance [10].
Not many studies about screening and ranking for DSA have been reported [11]. In many references such as [12,13,14,15] the modes of the small signal conditions at post-event and steady-state conditions are analyzed for event assessment. For example, the eigenvalues of critical modes for post-outage conditions are estimated using just the nominal condition of eigenvalues and post-outage system state matrices in [11]. Also, steady-state displacement of modes of power system with contingency is used for ranking in [12], while the dynamical behaviors of the system are not considered. However, as a novel method in the present paper, not only the steady-state situation but also the dynamical behaviors of the system are investigated for event ranking by polytopic LPV modeling of the system based on transient responses of the system.
On the other hand, the traditional approach to evaluate the system reliability with (N−1) contingencies is no longer sufficient [16] and recently, (N−k) contingency studies have acquired a very important role in the operation and expansion planning of power systems [17]. Although the conventional single contingency (N−1) criterion is useful to reduce risks in power systems, the insufficiency of this criterion has been known by analysis of recent blackout events. This fact shows that it is necessary to use better criteria to ensure robust power system operation. Some reliability standards such as North American Electric Reliability Corporation (NERC) Standard PRC-023 have been improved to require utilities to consider not only single outages, but also (N−k) events which could start some cascading events [18], and there are some issues like terrorism or potential attacks that make utilities study several events [19]. The problem is that an event may cause a condition in the nonlinear dynamic power system to start cascading outages. In response to these issues this paper presents a new approach to investigate the effects of events on power system performance during nonlinear dynamic responses while common approaches use steady-state conditions after events.
Recently, consideration of the nonlinear dynamical systems by some combination of linear sub-systems has received significant attention. The efficiency of linear systems for developing control concepts in a simple fashion may be the main reason for this interest. This matter has caused a growing tendency to shape hybrid, LPV, and polytopic linear models [20,21,22,23,24]. The main perturbation in a nonlinear system, coming from the nonlinearity effects due to operating point variations, can be studied by constructing the polytopic linear model based on LPV modeling [25]. The method represents system dynamical equations as a linear state-space model with time-varying parameter-dependent matrices. The dynamics are linear but non-stationary [26]. In fact, the nonlinearity of the system is described by the parameter variation of LPV model. As a novelty of this paper, the LPV-modeling method is used to cover the nonlinearity of power system in event ranking whereas it is not utilized in other ranking methods.
In recent years, wide-area measurement systems (WAMS) have become well-known in analysis and operations, especially for event, fault and control studies such as described in [27,28,29]. In this paper, the proposed LPV modeling uses a new approach based on WAMS and remote signals for studying the system nonlinearity as a complex property. Event and contingency ranking are done by computing some proposed and enhanced indices to show the effects caused by each event on the system dynamic behavior. A nonlinear simulation of a 9-bus power system is done for illustrating the method, and the power flow of a transmission line is considered as a monitoring variable (remote signal) through WAMS in the presented approach for ranking. The results show the effectiveness of the proposed method and indices. Briefly, there are some novelties, highlights and advantages of this paper for the purpose of power system event ranking such as:
- Considering not only steady-state response but also the dynamical behavior of the system after event occurrence.
- Using polytopic LPV modeling for covering the nonlinearity of the system in transient responses.
- Proposing some new and enhanced indices and comparing them using nonlinear simulations.
2. LPV Model for Power System Event Condition
Before representing the proposed approach for modeling, some concepts of the problem should be reviewed and a set of models for transient operating points of power system would be introduced in order to cover the nonlinearity effects and uncertainties.
The dynamic behavior of a power system is affected by its complex components (generators, exciters, transformers, etc.), which are coupled with the network model. However, the nonlinearity of the system is obvious, specifically in transient behavior, whenever a fault or a disturbance occurs. The mathematical model of the power system can be represented by two sets of equations: one set of differential equations and one set of algebraic equations as:
where (with n as the number of the states) is the vector of state variables, is the vector of (non-state) network variables such as load flow variables (q is the number of these variables) and (with p as the number of the inputs) is the vector of control inputs such as reference signal of Automatic Voltage Regulator (AVR) called .
It is assumed that the function and to be continuously differentiable a sufficient number of times. The solution of (1) for specific control input is presented by a vector of and , and define in below as power system transient trajectory:
If the consideration is:
then the function can be approximated by a linear Taylor expansion with respect to its components. In fact, the power system dynamics in the immediate proximity of the transient trajectory are approximated by the first terms of the Taylor series, so the following LPV model can be introduced for the power system about the transient trajectory:
where
The output variable about its transient trajectory is defined as (m is the number of output variables), which is a selected WAMS signal to support general overview of the system nonlinearity and dynamic effects. In general, it has the following form:
where in the power system, without loss of generality, it can be assumed that . However, this assumption is not implausible in power systems. The matrix can be computed when the desired output variables are defined.
In fact, the power system transient trajectory may be interpreted as a time-varying scheduling signal vector for the mappings and . The compact set is considered as a polytopic defined by the convex hull:
where, N is the number of vertices. It follows that the system can be represented by a linear combination of LTI models at the vertices; this is called a polytopic LPV system:
where and are the convex coordinates. The ith vertex of this convex polytope is defined by for , where each of this matrices is constant.
The convex polytope can be used as the model of power system exposed to an event. Each model is computed at an operating point which is considered at a sampling instant in system transient trajectory during the response of the system after the event. The models are obtained through linearization of the power system during Time-Domain Simulation (TDS) of each event.
3. The Proposed Indices for Event Ranking
The system response after each event can be used for representing the event and it can be considered as a measure for event ranking compared to normal or pre-fault conditions. For this purpose, some ways are available: TDS, Frequency Response (FR) and modal analysis. Some indices related to each way would be described in this section. Although their computational methods and theoretical basis are conventional, their final structure are novel because one index has new factors and the others are involved with the polytopic LPV modeling concepts. As a result, the proposed indices will contain a novel event ranking process capability.
3.1. Non-Linear TDS Based Ranking Index
It is obvious that if an event causes instability, it is an important event with high risk but the risk is not clear in stable conditions. By nonlinear simulation of power system events and considering the resulted oscillations, it is feasible to compute an index to present the event effects and rank them based on the probable instability conditions.
Some references such as [30,31,32,33,34,35] utilized an index called Integral of Time multiplied Absolute Error (ITAE) as a performance index for some optimal tuning and noise effect minimizing problems especially for control design. Although ITAE is known in other literatures, it is adapted for event ranking purpose in this paper by normalizing and called as Non-linear TDS based ITAE (NTDSITAE) index for the ith event:
where, is time in s, is starting time, is end time of simulation (i.e., the time that oscillations are damped and the value of the index is not changed), is the monitored variable as the system output (such as active power of a transmission line), and is the steady-state value of the output variable. The last term () is proposed in this paper for normalizing and increasing the contrast of ranking index.
Time multiplying helps to weight and signify the oscillation with slower damping. This proposed modified index is suggested for ranking the events with undesirable dynamic effects. As a novelty, this enhanced index can describe the traditional conception of events ranking in which the oscillations show the event importance.
3.2. Modal Based Event Ranking Index
Nonlinearity can change or shift the modes of the power system during its dynamic behavior. This issue is especially significant in event conditions. Therefore, the modes locations as a criterion for stability assessment may be used for ranking the events. Polytopic LPV modeling helps us to apply this approach with more accuracy and generality. Considering modes of a simple second order system as complex numbers:
The number of system modes with undesirable damping ratio in the behavior trajectory after each event may be selected as an index for ranking. Therefore, by polytopic LPV modeling of the system, Modal based Probabilistic ranking index (MP) for the ith event is defined as:
where is the number of modes of all vertices for the ith event with a damping ratio less than desired damping ratio and is the number of all modes of all vertices for the ith event. As a new index, it helps to recognize an approximate probability of undesirable oscillation damping or system instability after each event.
3.3. FR Based Event Ranking Index
This index as a novel tool for event ranking is based on comparing the transfer functions of the polytopic LPV models of the events with the nominal transfer function (before each event). The ranking results present the strength of each event to change the system dynamic behavior. Frequency Response Error for kth vertex of polytopic LPV model in ith event condition is defined by:
where and are respectively the minimum and maximum frequency in rad/s, is 2-Norm operator, is the system transfer function in normal condition, and is the transfer function of kth vertex of the polytopic LPV model in ith event condition. Using 2-norm definition, it can be summarized to (in dB):
where is the number of frequency samples. Using infinite norm of FRE for all vertices of the polytopic LPV model at each event condition, Frequency Response Error After Event (FREAE) as an overall index for ith event can be proposed by:
In other words, FREAE is a new index for representing the maximum effect of ith event on the system frequency response. It is useful for power systems because low-frequency oscillations are typically in the range of 0.2–2.5 Hz [32]. Increasing results in more accuracy of the index.
4. Simulation Results and Evaluation
4.1. Power System Representation
In this section, a 9-bus power system model [37] is used for analysis by applying the data used in [38]. It represents a small transmission system which consists of nine buses, three generators, three loads, six lines and three transformers; its single line diagram is shown in Figure 1.
In this study, generator G2 is considered as a synchronous machine using a detailed model with an AVR model IEEE type1 Mag-A-Stat and a PSS model as specified in [38] is added to control the oscillations. Modeling, nonlinear simulation, and linearization are done using the DIgSILENT PowerFactory software (DIgSILENT GmbH, Gomaringen, Germany).
Transmission lines are unprotected from various risks associated with variations in design characteristics and climatic variants that may result in outages [39]. According to the analysis of the most typical sequence of events (especially for blackouts), it was determined that transmission line trips are a group of the most frequent events [40]. Therefore, line outages are considered as the system events in this paper.
On the other hand, NERC has some studies which showed that many important disturbances involved protection systems, as the initiating event [41]. Hence, protection failures are noticed as an important concern in security assessment [42]. Therefore, the line outages due to 3-phase short-circuit (SHC) faults or because of hidden failures such as protection malfunctions are considered in this study. Consequently, an outage of Line 5–7 as Event 1 without any short-circuits is considered.
Table 1 presents the list of the events. The steady-state condition of all events is an outage of the affected line.
4.2. Nonlinear Simulation of Event Conditions
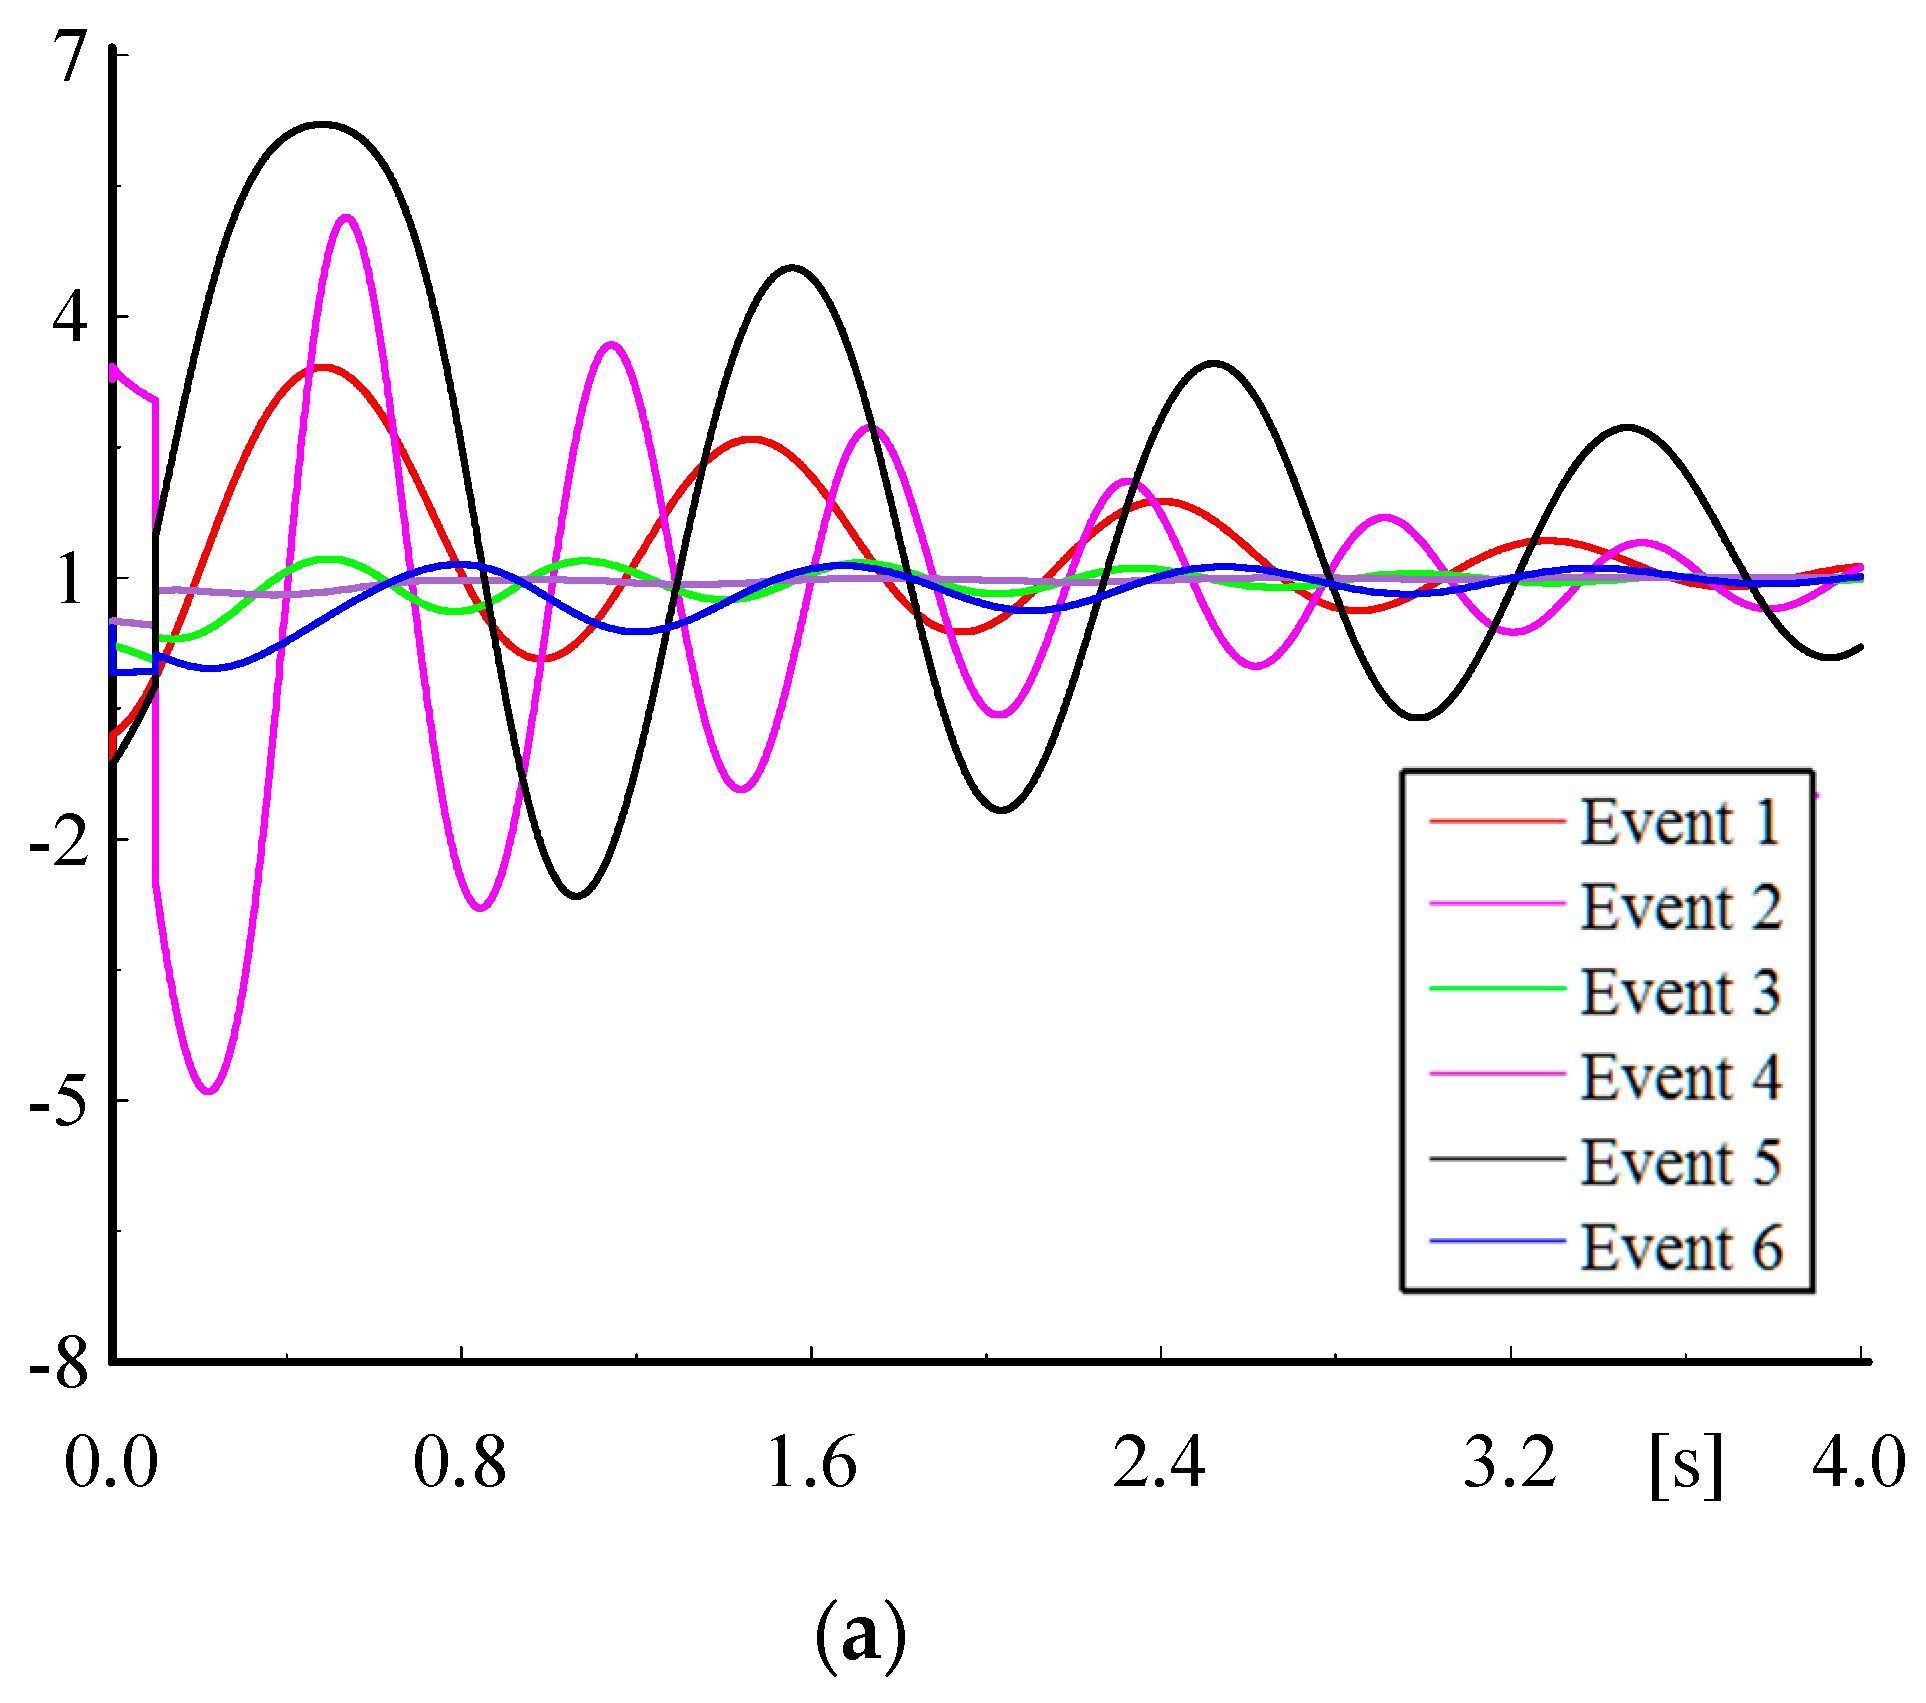
For investigation of the system events, the normalized nonlinear TDS results are illustrated in Figure 2. The active power of Line 4–6 as the system output is normalized based on its steady-state value for each event. Note that the short-circuit fault (if any) are occurred at t = 0 s in 50% of related line length and the switching time is t = 0.1 s. Although the system responses are normalized, the amplitudes and oscillation frequencies are different from an event to another. To obtain the polytopic models for the event conditions, linear models at some points of dynamic behavior are necessary.
4.3. Linear Models of Power System for Event Conditions
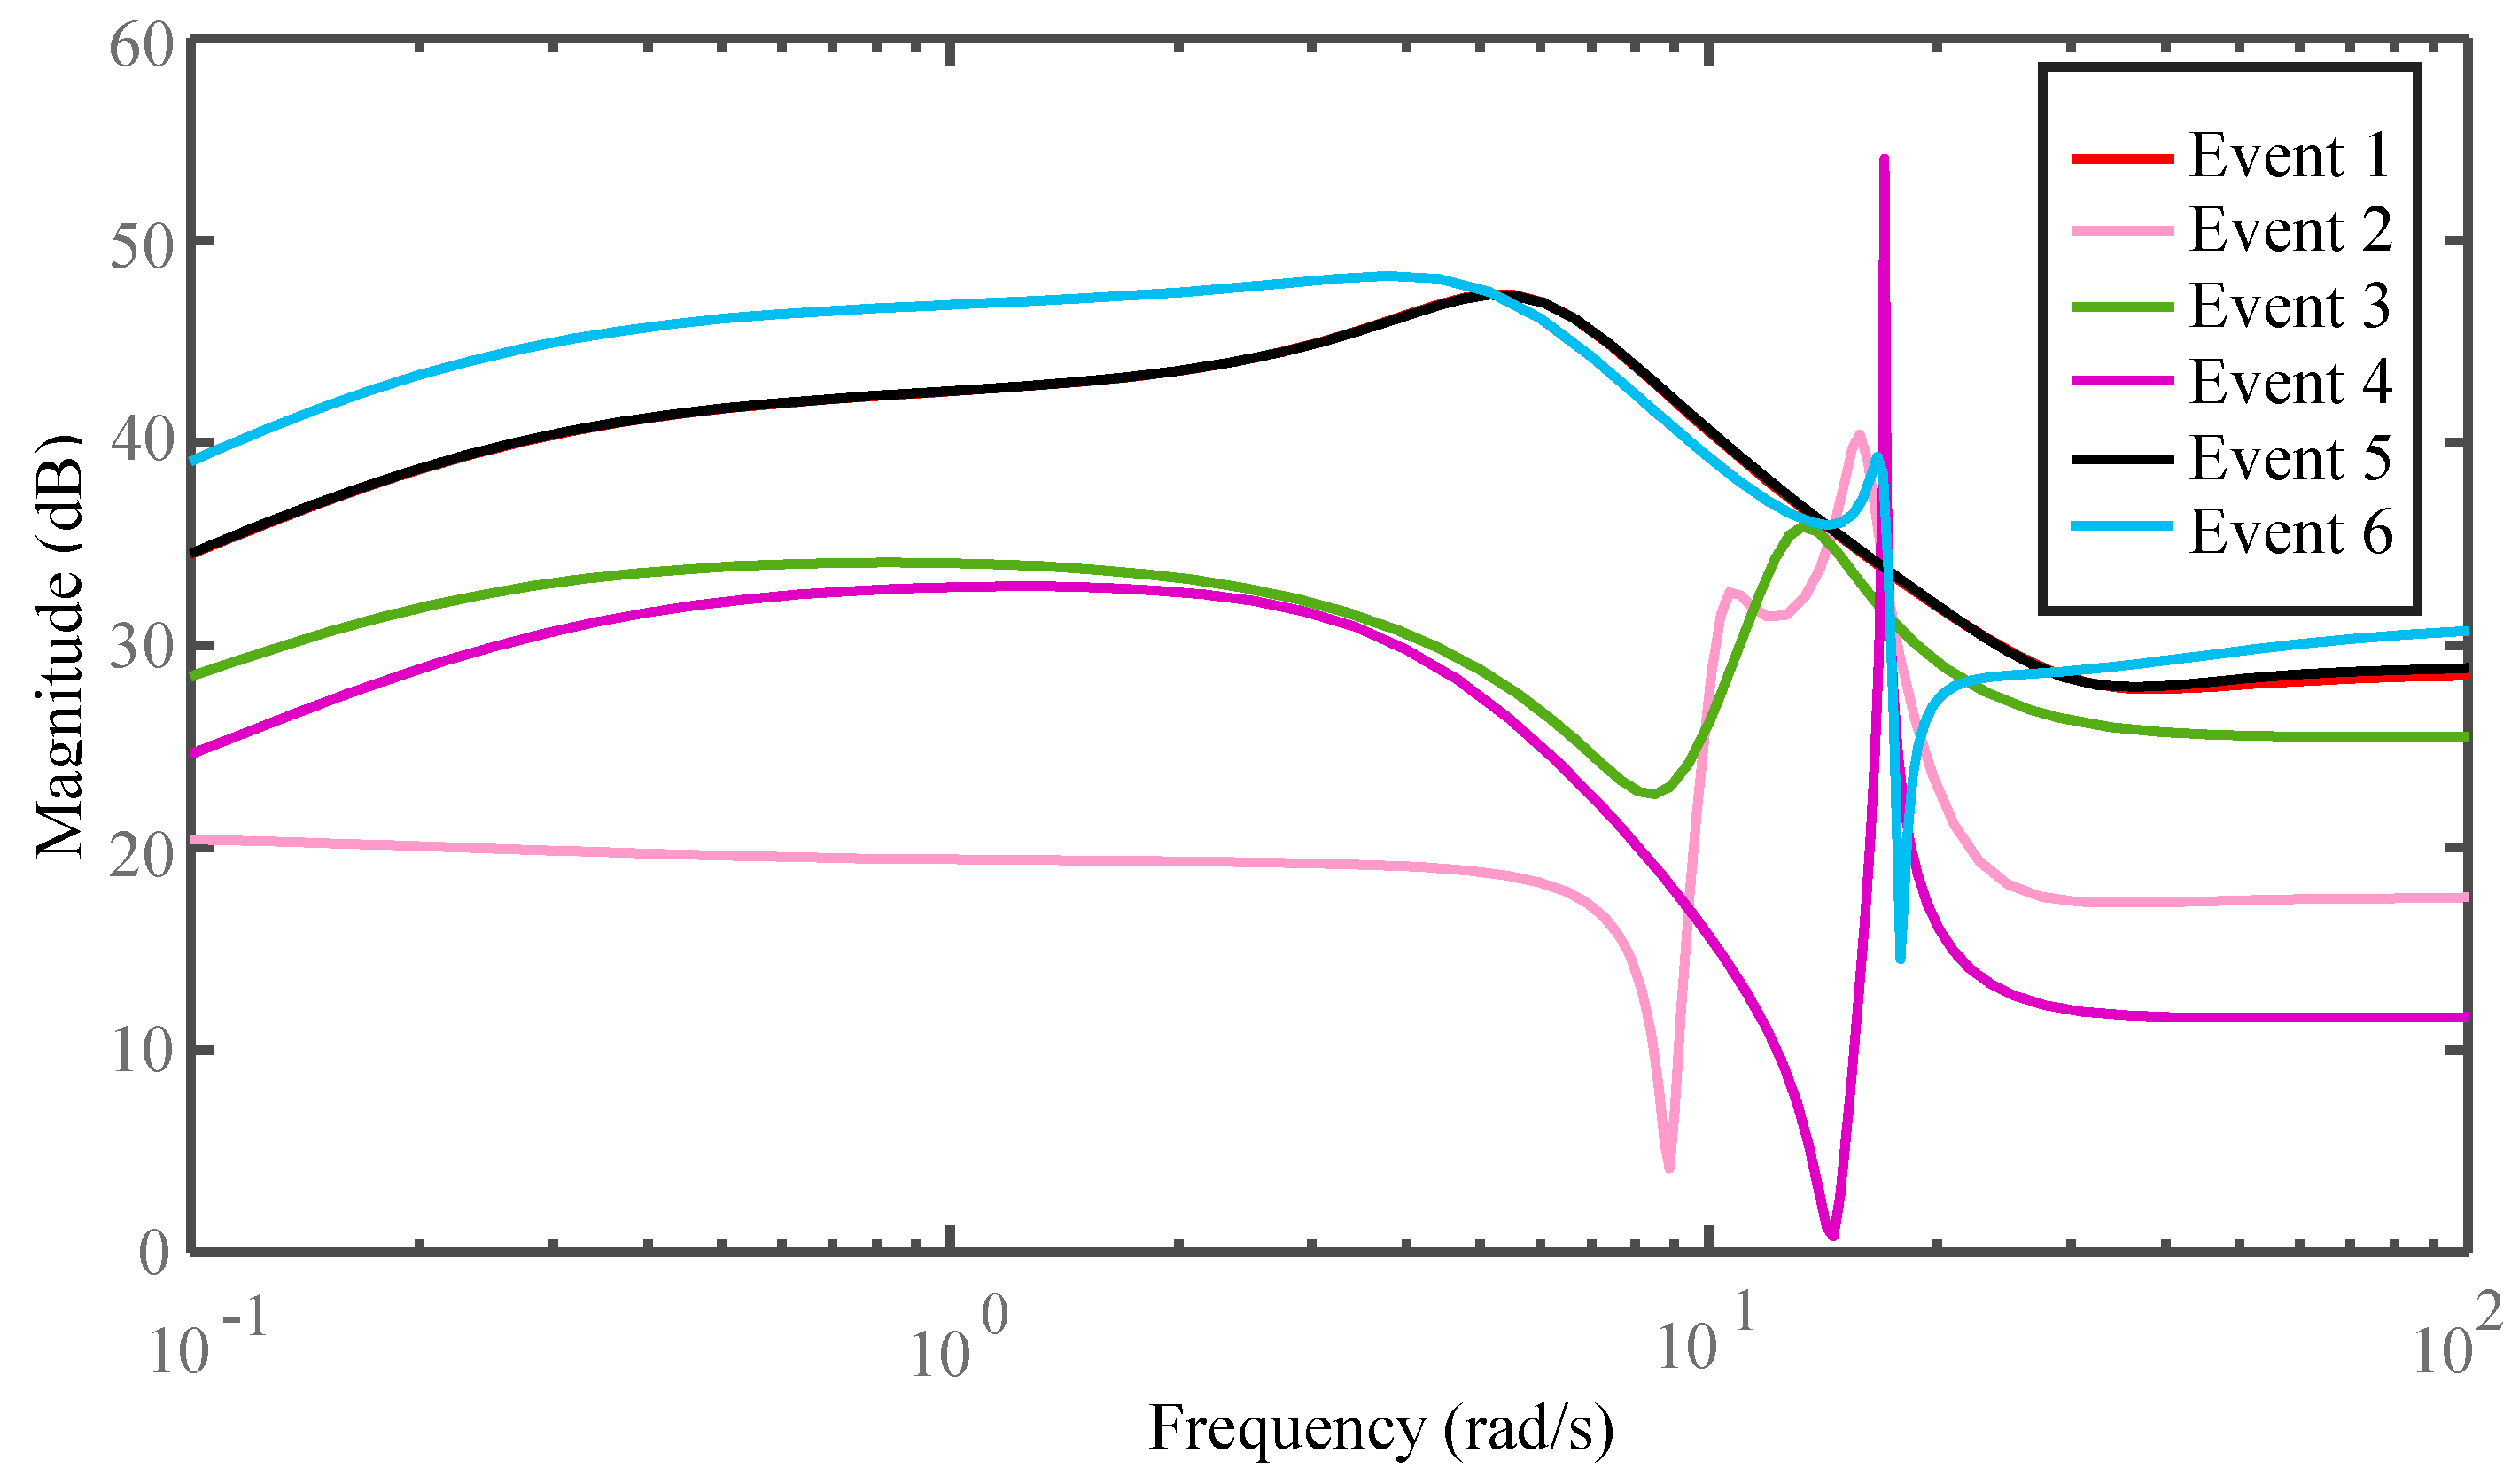
Using the concept of the wide-area measurement system (WAMS), the power system models are obtained considering the AVR input of G2 as the system input and the active power of Line 4–6 as the system output. The order of each obtained linear model is 28. For simplification in this part, each model is reduced to a 6-state linear model by balanced truncation model reduction technique. Note that the ranking assessment will be executed by using the full-order models. Conventional approaches study the effects of events by modal analysis at steady-state points, so we firstly investigate the system in t = 7.5 s at the end of responses. Figure 3 and Figure 4 show the frequency responses and modes locations of the reduced-order models of the power system at t = 7.5 s during nonlinear simulation of each event. It is clear that linear models are various but it is not obvious in the nonlinear simulation results because the oscillations are damped at the moment in Figure 2 hence the events have apparently the same effects on the dynamic behavior of the system.
To implement the proposed approach, linearization is done at 30 sample points during TDS and a set of models is obtained as the polytopic LPV model for each event. To show the result of this approach, displacement of system modes during TDS events is shown in Figure 5 using reduced order models. It is clear that the events can change the modes not only at the steady-state situation but also during dynamic behavior.
As an example to show the contribution of the approach of this paper, Event 1 and Event 5 are studied. According to the conventional approach, Figure 3 and Figure 4 show that Event 1 and Event 5 have approximately similar models at t = 7.5 s as it was expected because both events have similar steady state conditions (outage of Line 5–7), and there isn’t any unstable pole while the proposed approach gives us a different result. According to the proposed approach, as we can see in Figure 5, there are many unstable poles that detected by polytopic LPV modeling during TDS, and the overall system even may be destabilized when these poles are excited.
Considering the propagation specifications of modes locations, it may be too complicated to grade the events, therefore, the proposed indices are used in the next section.
4.4. Ranking Results
To use the ranking indices proposed in Section 3, events represented in Table 1 are assessed. The non-linear TDSs of power system, FR and modal analysis of LPV Models are used for calculations. NTDSITAE is calculated by (10) using TDS results shown in Figure 2 considering t0 = 0 s and t1 = 8 s. MP and FREAE which are defined in (13) and (16) respectively, are calculated using full-order polytopic LPV models.
Table 2 summarizes the results for all events and presents the ranking list. The results show that the sorts of the events according to indices are different from each other.
4.5. Discussion of Results
The proposed indices have some advantages. According to conventional indices like loading, Event 1 and Event 5 have same final steady-state effects on the network while they have the different values of the proposed indices in Table 2. This illustrates that the proposed approach can distinguish between the different events with the same steady-state conditions. This is expected because the proposed approach covers the system transient behavior, not only by TDS but also by FR. On the other hand, the simulation results show that the events have not enough clear ranking with MP. For example, there is no clear difference between Event 2 and Event 3 or between Event 1 and Event 4 by using MP criterion. This index can be useful for control synthesis based on pole placement approach and the performance evaluation but not much useful for events ranking. In contrast, the first rank according to NTDSITAE and MP is Event 2 but the first rank of FREAE is Event 5. At first glance, ranks of FREAE is not expected because Event 5 leads to better damping in the oscillations shown in Figure 2. System response to Event 2 shown in Figure 2 has the worst damping ratio and approves the first rank of NTDSITAE and MP. On the other hand, Figure 5 shows that the modes of Event 5 are closer to instability area so this event as the first rank of FREAE may be more important.
However, Figure 2 is the result of simulation at a special operation case as initial condition but it is essential to consider the variable performance and nonlinearity of power system that may change the ranking list in other conditions. Therefore, it is critical to know which index is more useful for DSA and control synthesis. To check the beneficial consequence of the proposed approach and test the robustness of ranking indices, the results can be evaluated by simulation of other scenarios and conditions.
4.6. Ranking Evaluation in Different Conditions
To evaluate if the ranking results are valid in variant and dynamic behavior of power system, some simulations are done with different conditions. Table 3 represents the system operation scenarios (system generation and loads) as the pre-fault conditions of the events. Note that pre-fault condition described for Scenario 4 is the same as the base case of the previous sections according to [38] but the fault location is different from the previous sections. In this section, fault locations are considered in 1% of the line length (a point near the sending end of the line) but the other considerations about fault durations and types of events are not changed.
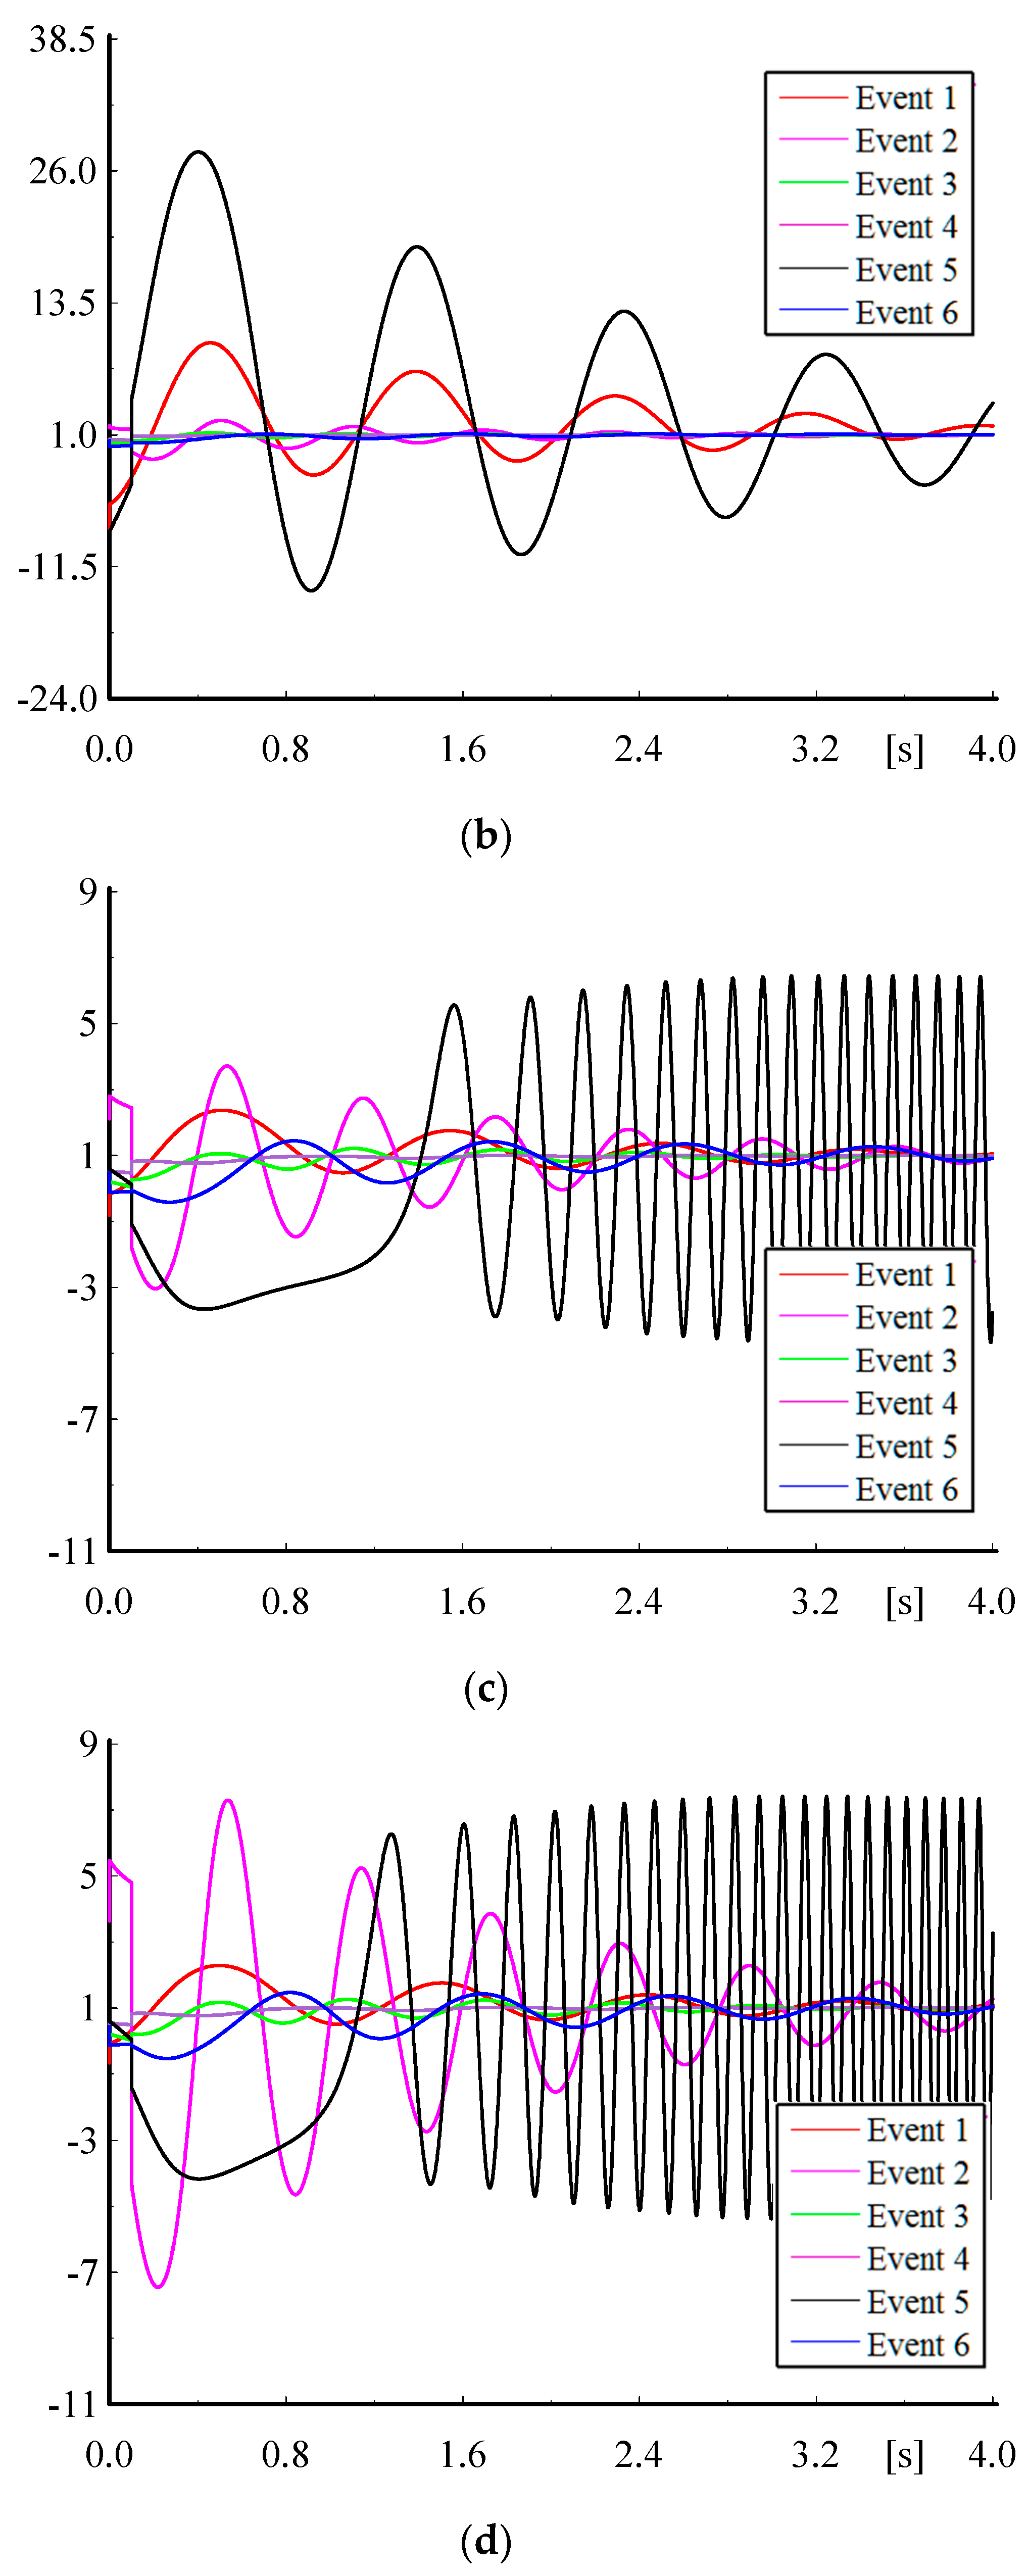
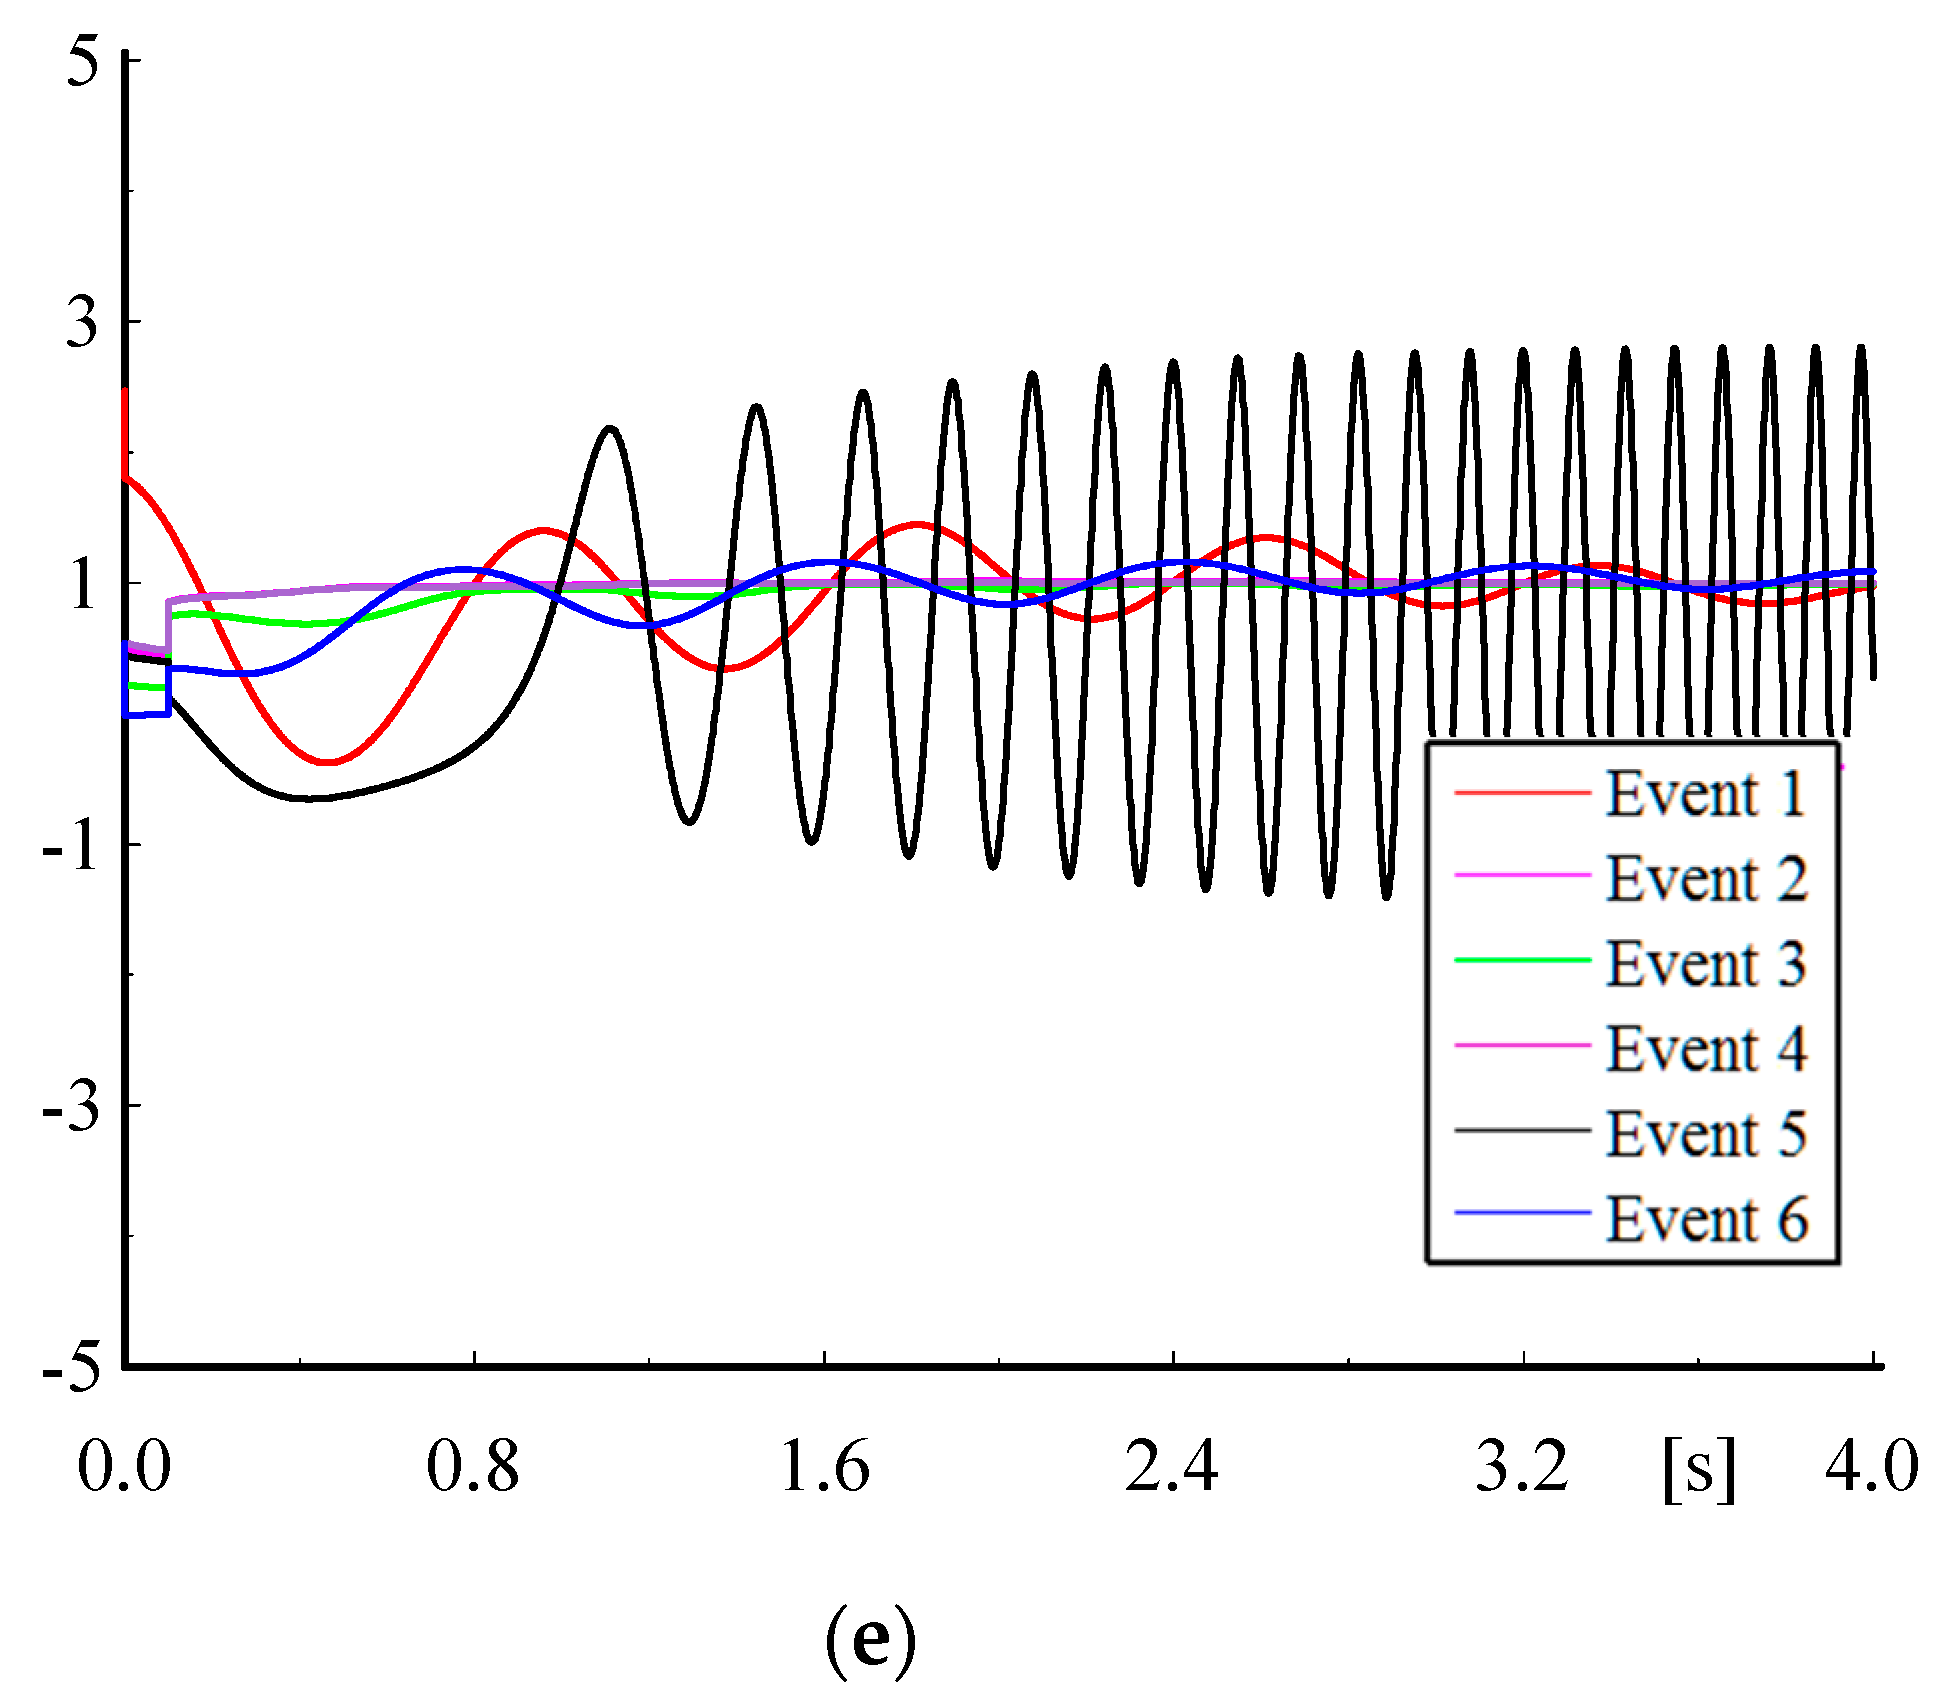
Figure 6 shows the normalized simulation results for all five scenarios. It is obvious that Event 5 is the most important event because of considerable undesirable damping (Figure 6a,b)) or system instability (Figure 6c–e). These results agree with the tendency of modes in Event 5 shown in Figure 5. The simulation results of different scenarios illustrate that FREAE based on polytopic LPV modeling is more powerful for ranking because other indices could not detect the importance of Event 5 by using the stable behavior of power system.
5. Conclusions
Power systems may have so many events and their nonlinear behavior may cause complicated conditions. Hence, this paper was arranged to study not only steady-state, but also dynamic behavior in event conditions as a novel approach for the purpose of ranking. Ranking of the events according to their effects on the system modes and frequency responses could be a way of improving dynamic security assessment, operation analysis, and controller design. This paper proposed a new approach for polytopic LPV modeling of the power systems during event occurrences based on transient operating points using WAMS concepts and presented new and enhanced time-domain and frequency-domain indices for event ranking purposes.
Simulations of base case conditions illustrated that the proposed approach can help to distinguish between two events with the same steady-state effect on the power system while the traditional steady-state indices such as loading could not provide this benefit. This fact showed that the proposed approach is more useful for security assessment with respect to the conventional methods. On the other hand, simulation results of various operation scenarios showed that FREAE as a proposed novel index is useful and powerful for detecting and predicting the worst event among some events by using a stable response in base case condition while other proposed or traditional indices (such as NTDSITAE, MP and loading) could not achieve the mentioned purpose. The simulation results verified that an event with a low priority by conventional indices may have a high priority using the proposed indices in this paper and even destabilizes the overall system.
Acknowledgments
The authors would like to thank Shahed University and Iran Grid Management Company (IGMC).
Author Contributions
All the authors have worked on all the subjects (methodology, modeling, simulation, results discussion and paper writing).
Conflicts of Interest
The authors declare no conflict of interest.
References
- Pandiarajan, K.; Babulal, C.K. Static security enhancement using fuzzy particle swarm optimization. COMPEL Int. J. Comput. Math. Electr. Electron. Eng. 2016, 35, 172–186. [Google Scholar] [CrossRef]
- El-Kady, M.A.; Alaskar, B.A.; Shaalan, A.M.; Al-Shammri, B.M. Composite Reliability and Quality Assessment of Interconnected Power Systems Interconnected Power Systems. COMPEL Int. J. Comput. Math. Electr. Electron. Eng. 2007, 26, 7–21. [Google Scholar] [CrossRef]
- Matos, M.A. Formal requirements for utility and value functions for security related decisions. COMPEL Int. J. Comput. Math. Electr. Electron. Eng. 2004, 23, 225–236. [Google Scholar] [CrossRef]
- EKWUE, A.O. A Voltage-Based Automatic Contingency Selection Algorithm Via A Linearization Method. COMPEL Int. J. Comput. Math. Electr. Electron. Eng. 1990, 9, 99–107. [Google Scholar] [CrossRef]
- Bharata Reddy, M.J.; Rajesh, D.V.; Mohanta, D.K. Robust transmission line fault classification using wavelet multi-resolution analysis q. Comput. Electr. Eng. 2013, 39, 1219–1247. [Google Scholar] [CrossRef]
- Ataei, M.; Hooshmand, R.-A.; Parastegari, M. A Wide Range Robust PSS Design Based on Power System Pole-Placement Using Linear Matrix Inequality. J. Electr. Eng. 2012, 63, 233–241. [Google Scholar] [CrossRef]
- Da Silva, E.F.; Rahmani, M.; Rider, M.J. A Search Space Reduction Strategy and a Mathematical Model for Multistage Transmission Expansion Planning with N-1 Security Constrains. J. Control. Autom. Electr. Syst. 2014, 26, 57–67. [Google Scholar] [CrossRef]
- Ritonja, J.; Dolinar, D.; Polajžer, B. Adaptive and robust controls for static excitation systems. COMPEL Int. J. Comput. Math. Electr. Electron. Eng. 2015, 34, 864–881. [Google Scholar] [CrossRef]
- Ciapessoni, E.; Cirio, D.; Massucco, S.; Morini, A.; Pitto, A.; Silvestro, F. Risk-Based Dynamic Security Assessment for Power System Operation and Operational Planning. Energies 2017, 10, 475. [Google Scholar] [CrossRef]
- Tang, L. Dynamic Security Assessment Processing System. Ph.D. Thesis, Iowa State University, Ames, IA, USA, 2014. [Google Scholar]
- Baone, C.A.; Acharya, N.; Veda, S.; Chaudhuri, N.R. Fast contingency screening and ranking for small signal stability assessment. In Proceedings of the 2014 IEEE PES General Meeting|Conference & Exposition, National Harbor, MD, USA, 27–31 July 2014; pp. 1–5. [Google Scholar]
- Arrieta, R.; Rios, M.A.; Torres, A. Contingency Analysis and Risk Assessment of Small Signal Instability. In Proceedings of the 2007 IEEE Lausanne Power Tech, Lausanne, Switzerland, 1–5 July 2007; pp. 1741–1746. [Google Scholar]
- Sevilla, F.R.S.; Vanfretti, L. A small-signal stability index for power system dynamic impact assessment using time-domain simulations. In Proceedings of the 2014 IEEE PES General Meeting|Conference & Exposition, National Harbor, MD, USA, 27–31 July 2014; pp. 1–5. [Google Scholar]
- Yeu, R.H. Small Signal Analysis of Power Systems: Eigenvalue Tracking Method and Eigenvalueestimation Contingency for DSA; Illinois at Urbana-Champaign: Urbana, IL, USA, 2010. [Google Scholar]
- Rueda, L.; Cepeda, J.C.; Korai, A.W.; Gonzalez-longatt, F.M. PowerFactory Applications for Power System Analysis; Springer: Berlin/Heidelberg, Germany, 2014; pp. 249–266. [Google Scholar]
- Ashok, A.; Hahn, A.; Govindarasu, M. Cyber-physical security of Wide-Area Monitoring, Protection and Control in a smart grid environment. J. Adv. Res. 2014, 5, 481–489. [Google Scholar] [CrossRef] [PubMed]
- Hong, S.; Cheng, H.; Zeng, P. An N-k Analytic Method of Composite Generation and Transmission with Interval Load. Energies 2017, 10, 168. [Google Scholar] [CrossRef]
- Jia, Y.; Meng, K.; Xu, Z. N-k Induced Cascading Contingency Screening. IEEE Trans. Power Syst. 2015, 30, 2824–2825. [Google Scholar] [CrossRef]
- Patterson, S.A.; Apostolakis, G.E. Identification of critical locations across multiple infrastructures for terrorist actions. Reliab. Eng. Syst. Saf. 2007, 92, 1183–1203. [Google Scholar] [CrossRef]
- Sandy Diaz, R.; Domingos, A.C.J.; Vazquez Silva, E. An algorithm to verify asymptotic stability conditions of a certain family of systems of differential equations. Appl. Math. Sci. 2014, 8, 1509–1520. [Google Scholar]
- Xiang, W.; Xiao, J. Finite-time stability and stabilisation for switched linear systems. Int. J. Syst. Sci. 2013, 44, 384–400. [Google Scholar] [CrossRef]
- Xiong, J.; Lam, J.; Shu, Z.; Mao, X. Stability Analysis of Continuous-Time Switched Systems with a Random Switching Signal. IEEE Trans. Autom. Contr. 2014, 59, 180–186. [Google Scholar] [CrossRef] [Green Version]
- She, Z.; Xue, B. Discovering multiple Lyapunov functions for switched hybrid systems. SIAM J. Control Optim. 2014, 52, 3312–3340. [Google Scholar] [CrossRef]
- De Souza, W.A.; Teixeira, M.C.M.; Santim, M.P.A.; Cardim, R.; Assuncao, E. On switched control design of linear time-invariant systems with polytopic uncertainties. Math. Probl. Eng. 2013, 2013, 595029. [Google Scholar] [CrossRef]
- Jabali, M.B.A.; Kazemi, M.H. A new LPV modeling approach using PCA-based parameter set mapping to design a PSS. J. Adv. Res. 2017, 8, 23–32. [Google Scholar] [CrossRef] [PubMed]
- Shamma, J.S. An overview of LPV systems. In Control of Linear Parameter Varying Systems with Applications; Mohammadpour, J., Scherer, C.W., Eds.; Springer: New York, NY, USA, 2012; pp. 3–26. [Google Scholar]
- Ma, J.; Wang, T.; Thorp, J.S.; Wang, Z.; Yang, Q.; Phadke, A.G. WAMS based damping control of inter-area oscillations employing energy storage system. Adv. Electr. Comput. Eng. 2012, 12, 33–40. [Google Scholar] [CrossRef]
- Khaji, M.; Aghamohammadi, M.R. Online emergency damping controller to suppress power system inter-area oscillation using load-generation tripping. Electr. Power Syst. Res. 2016, 140, 806–820. [Google Scholar] [CrossRef]
- Wang, C.; Zhang, Y. Fault Correspondence Analysis in Complex Electric Power Systems. Adv. Electr. Comput. Eng. 2015, 15, 11–16. [Google Scholar] [CrossRef]
- Zhao, Y.M.; Xie, W.F.; Tu, X.W. Performance-based parameter tuning method of model-driven PID control systems. ISA Trans. 2012, 51, 393–399. [Google Scholar] [CrossRef] [PubMed]
- Panda, S.; Padhy, N.P. Thyristor Controlled Series Compensator-based Controller Design Employing Genetic Algorithm: A Comparative Study. Int. J. Electron. Circuits Syst. 2007, 1, 38–47. [Google Scholar]
- Banaei, M.R.; Toloue, H.; Kazemi, F.M.; Oskuee, M.R.J. Damping of power system oscillations using imperialist competition algorithm in power system equipped by HVDC. Ain Shams Eng. J. 2015, 6, 75–84. [Google Scholar] [CrossRef]
- Agnihotri, S.P.; Waghmare, L.M. Regression model for tuning the PID controller with fractional order time delay system. Ain Shams Eng. J. 2014, 5, 1071–1081. [Google Scholar] [CrossRef]
- Safari, A.; Soulat, B.; Ajami, A. Modeling and unified tuning of distributed power flow controller for damping of power system oscillations. Ain Shams Eng. J. 2013, 4, 775–782. [Google Scholar] [CrossRef]
- Sahu, R.K.; Chandra Sekhar, G.T.; Panda, S. DE optimized fuzzy PID controller with derivative filter for LFC of multi source power system in deregulated environment. Ain Shams Eng. J. 2015, 6, 511–530. [Google Scholar] [CrossRef]
- Kundur, P. Power System Stability and Control; McGraw-Hill: New York, NY, USA, 1994. [Google Scholar]
- DIgSILENT GmbH. Nine-Bus System Documentation 2014. Available online: http://digsilent.de/index.php/downloads.html (accessed on 26 July 2017).
- Anderson, P.M.; Fouad, A.A. Power System Control and Stability; The Iowa State University Press: Ames, IA, USA, 1977. [Google Scholar]
- Wazen, R.N.; Fernandes, T.S.P.; Aoki, A.R.; De Souza, W.E. Evaluation of the susceptibility of failures in steel structures of transmission lines. J. Control. Autom. Electr. Syst. 2013, 24, 174–186. [Google Scholar] [CrossRef]
- Huang, T.; Voronca, S.L.; Purcarea, A.A.; Estebsari, A.; Bompard, E. Analysis of chain of events in major historic power outages. Adv. Electr. Comput. Eng. 2014, 14, 63–70. [Google Scholar] [CrossRef]
- Chen, J.; Thorp, J.S.; Dobson, I. Cascading dynamics and mitigation assessment in power system disturbances via a hidden failure model. Int. J. Electr. Power Energy Syst. 2005, 27, 318–326. [Google Scholar] [CrossRef]
- Yu, X.; Singh, C. Probabilistic power system security analysis considering protection failures. COMPEL Int. J. Comput. Math. Electr. Electron. Eng. 2004, 23, 35–47. [Google Scholar] [CrossRef]
Figure 1.
Power system under study with 9-bus [37]. Reproduced with permission from publishing company, 2014.
Figure 1.
Power system under study with 9-bus [37]. Reproduced with permission from publishing company, 2014.
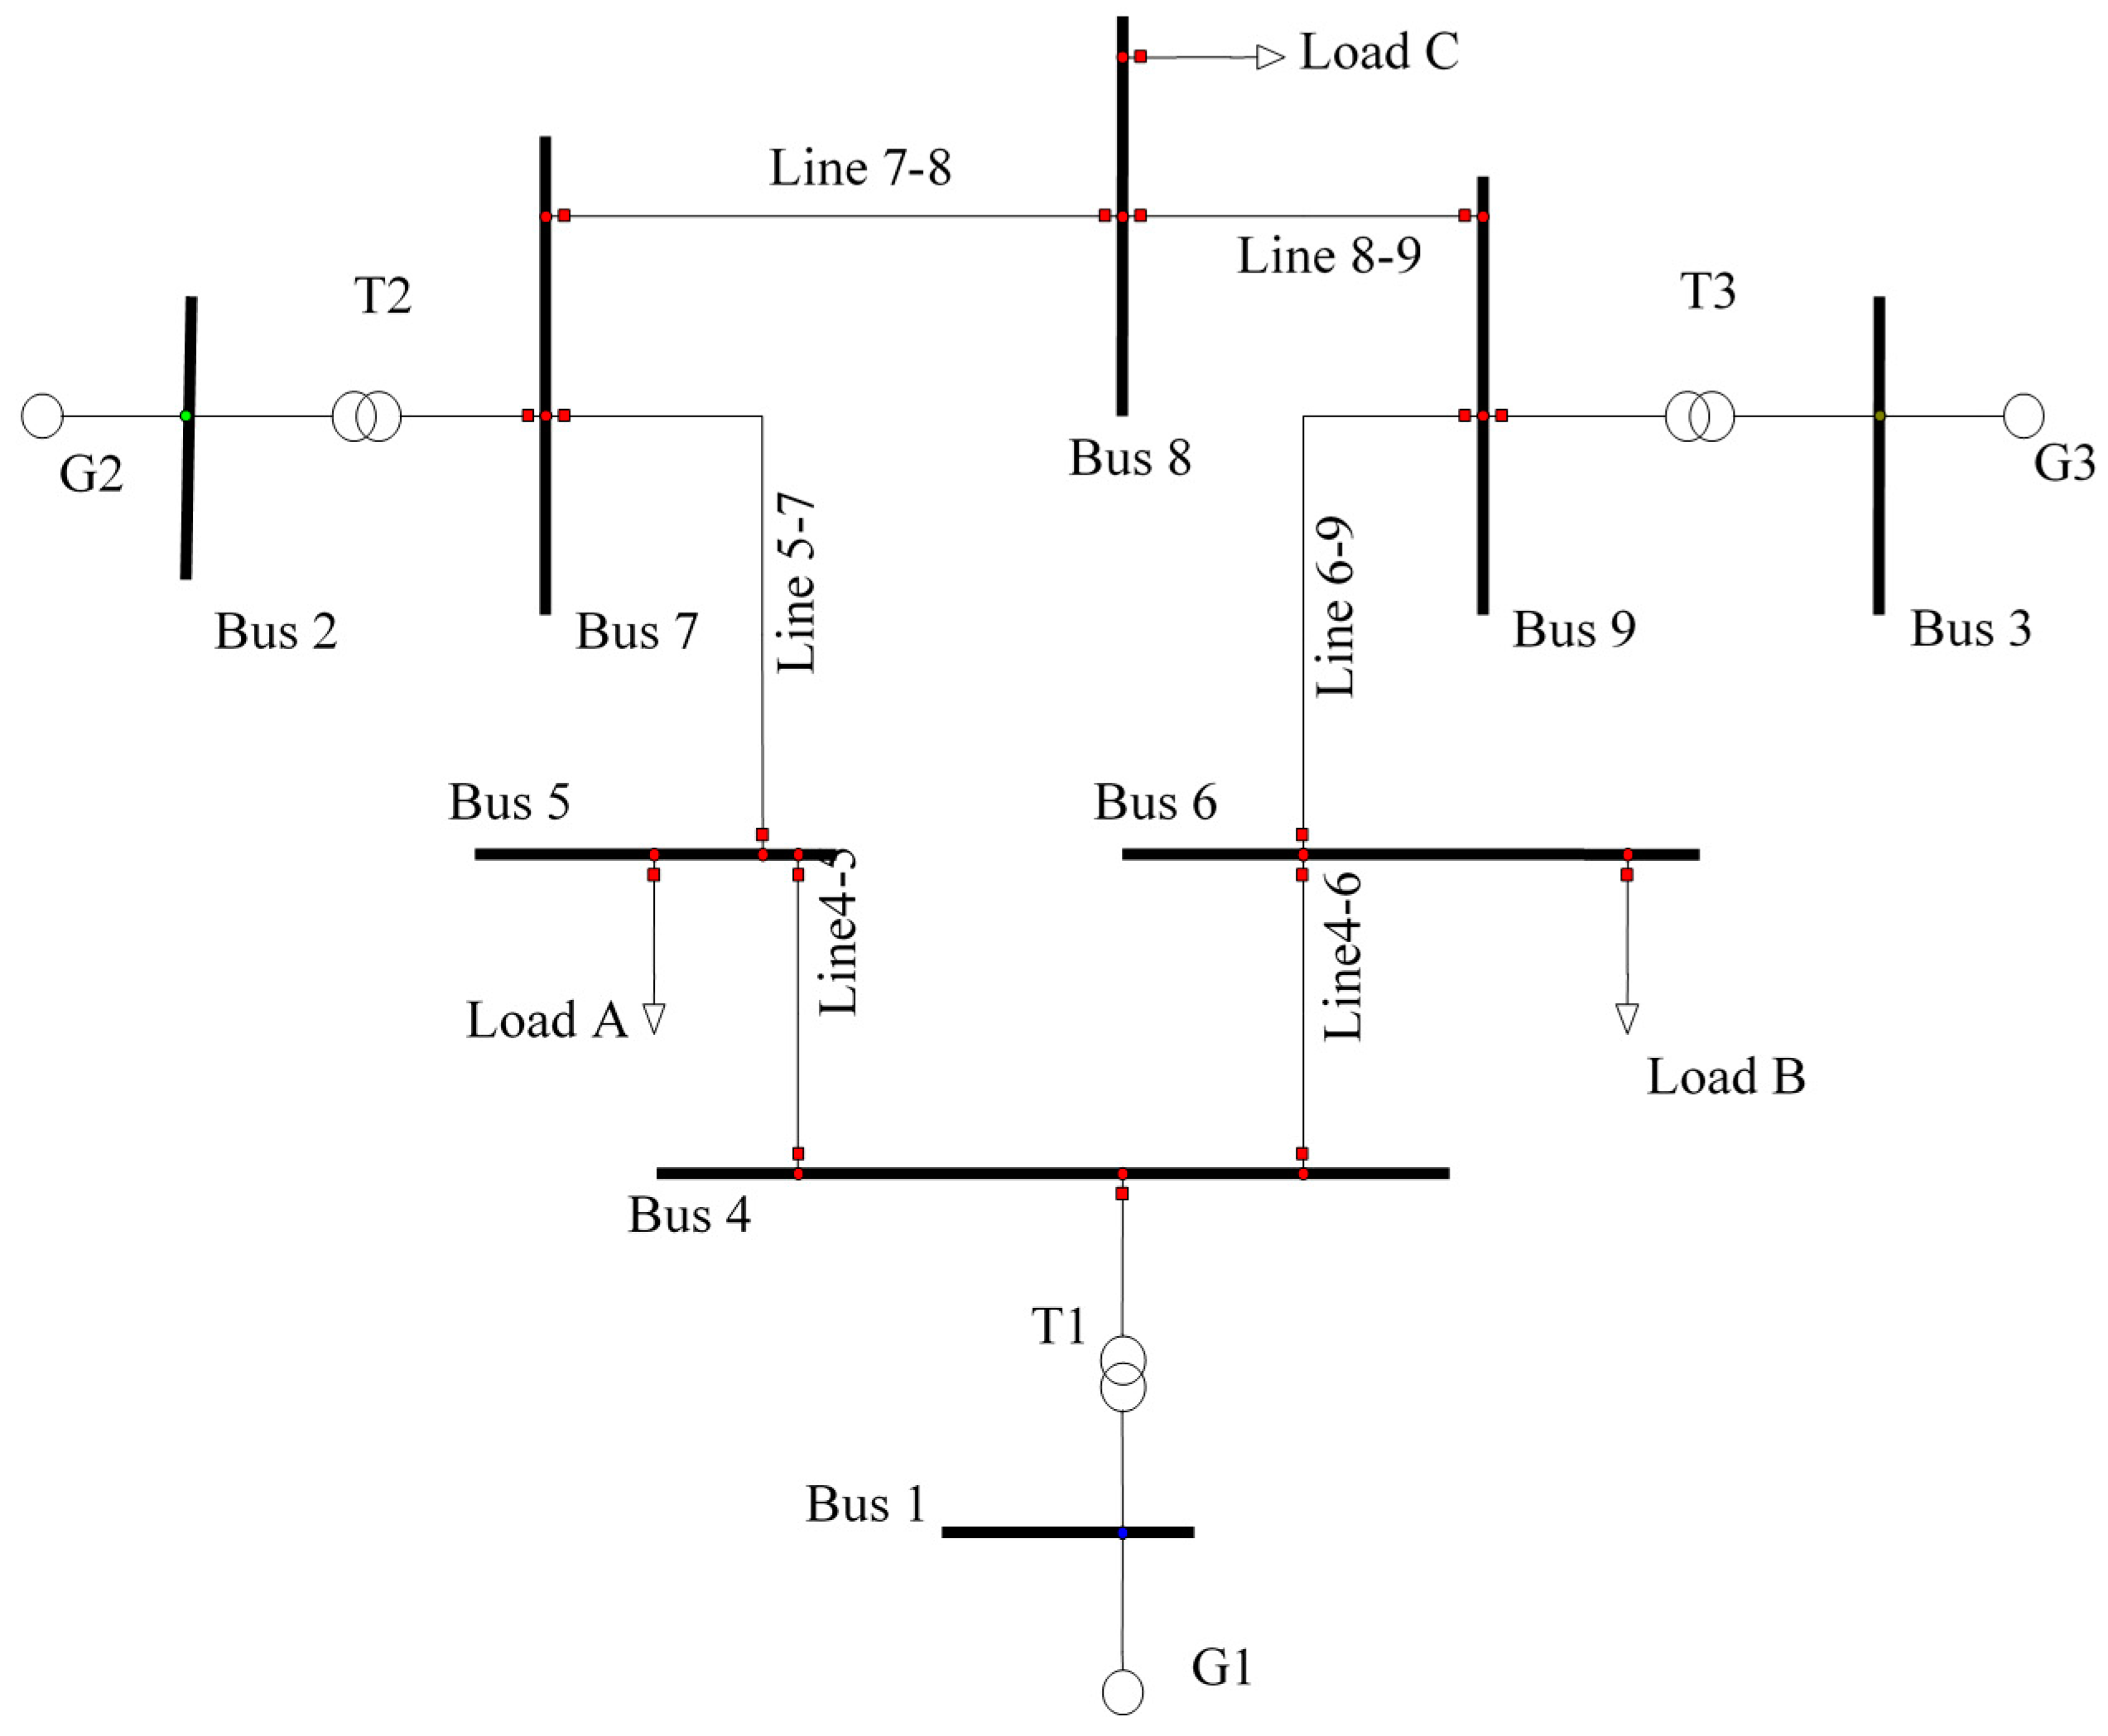
Figure 2.
Normalized active power of Line 4–6 per steady-state value after each event.
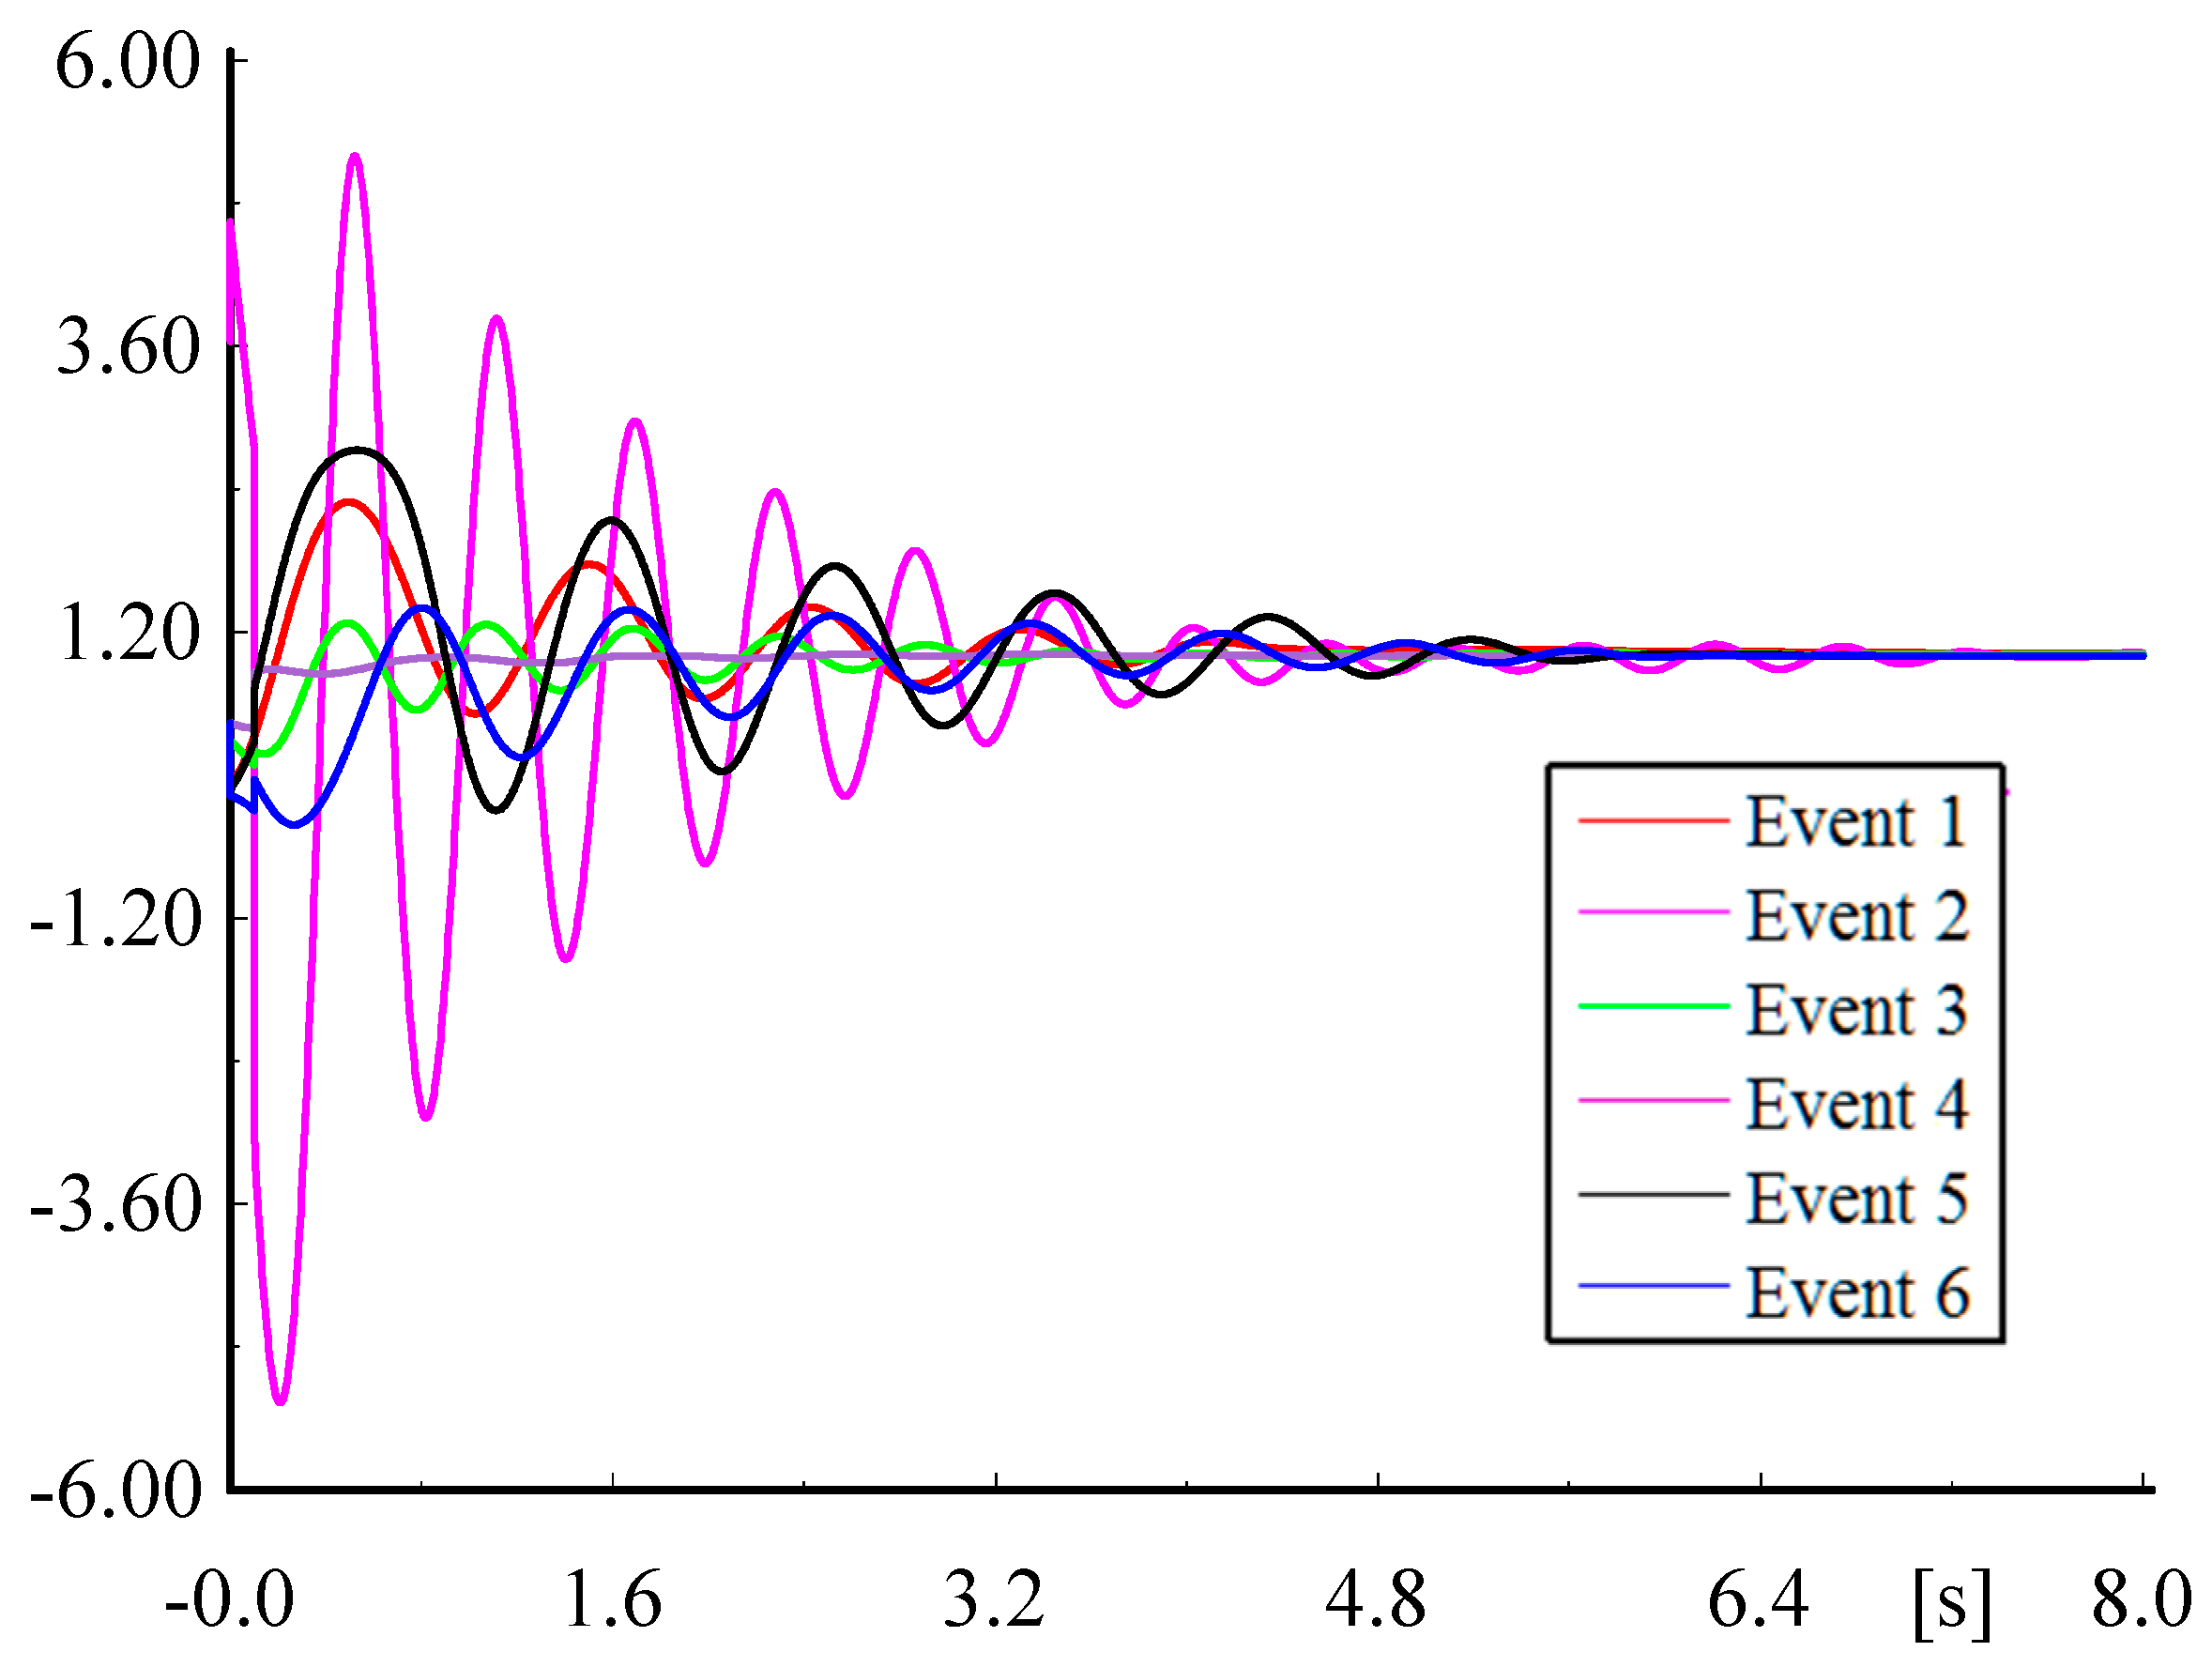
Figure 3.
Bode diagram of models after events (linearization at t = 7.5 s).

Figure 4.
Modes of reduced order models (linearization at t = 7.5 s).
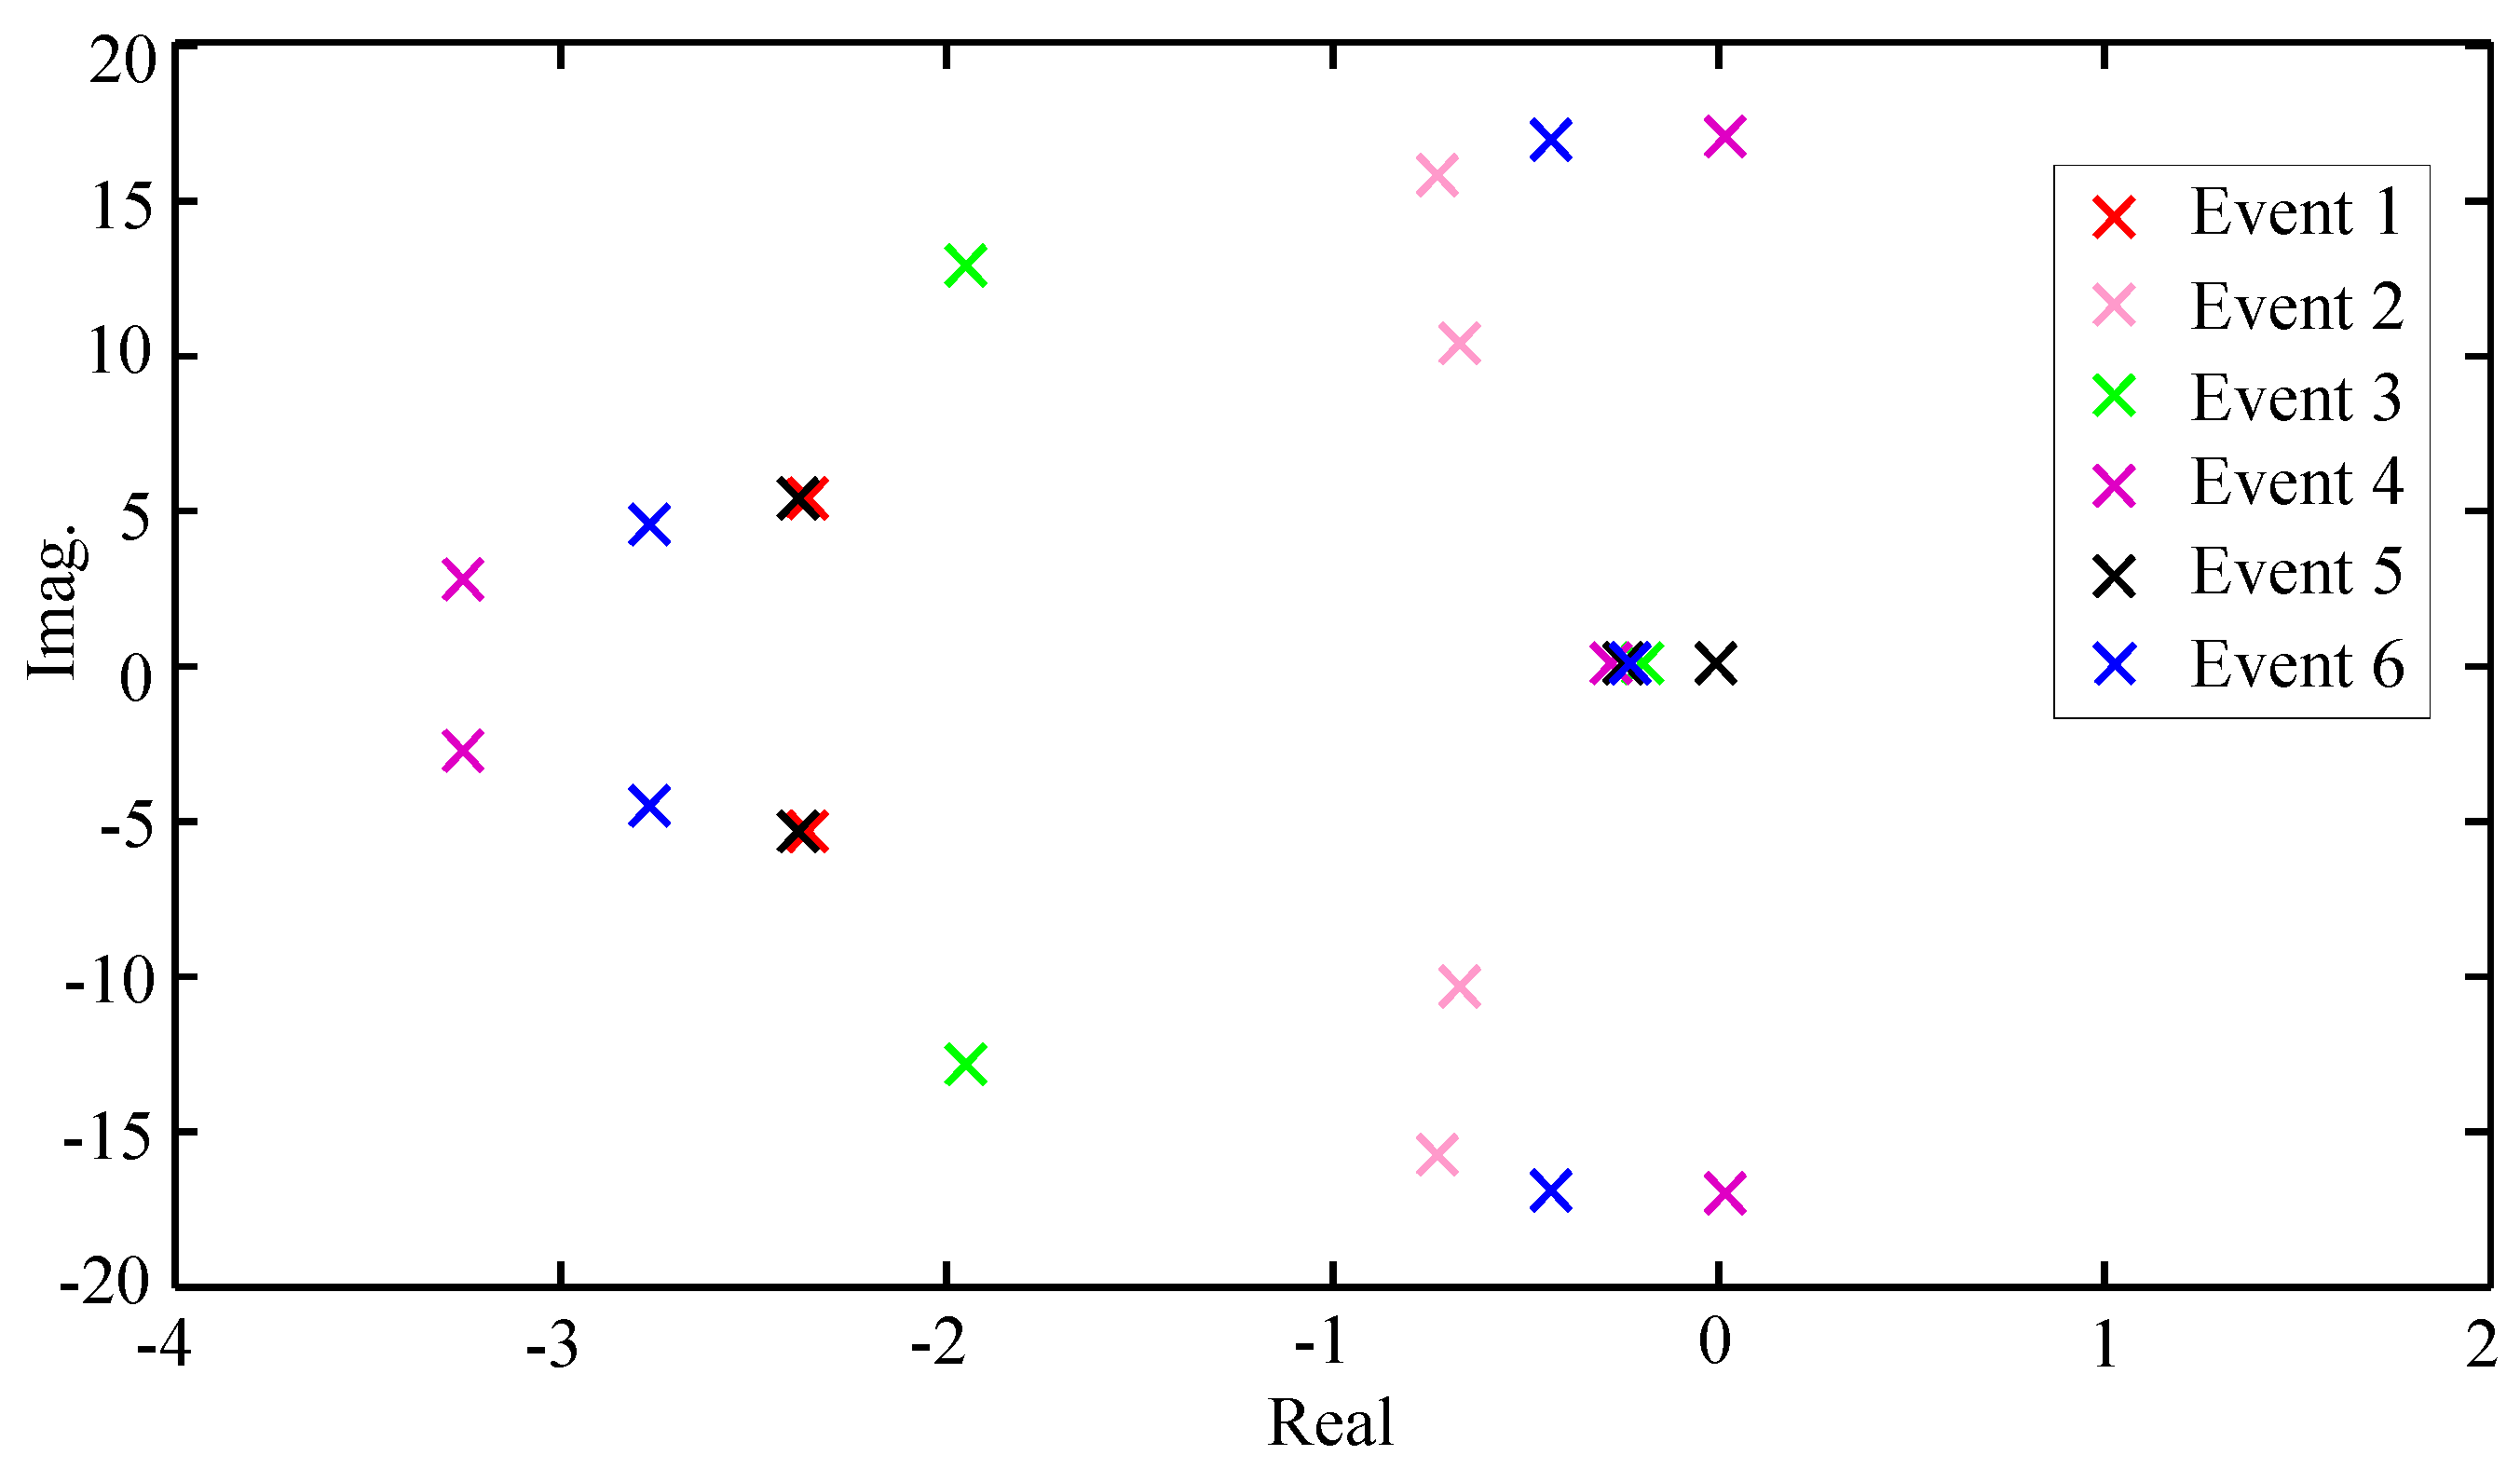
Figure 5.
Modes deviations of reduced polytopic LPV models during TDS.
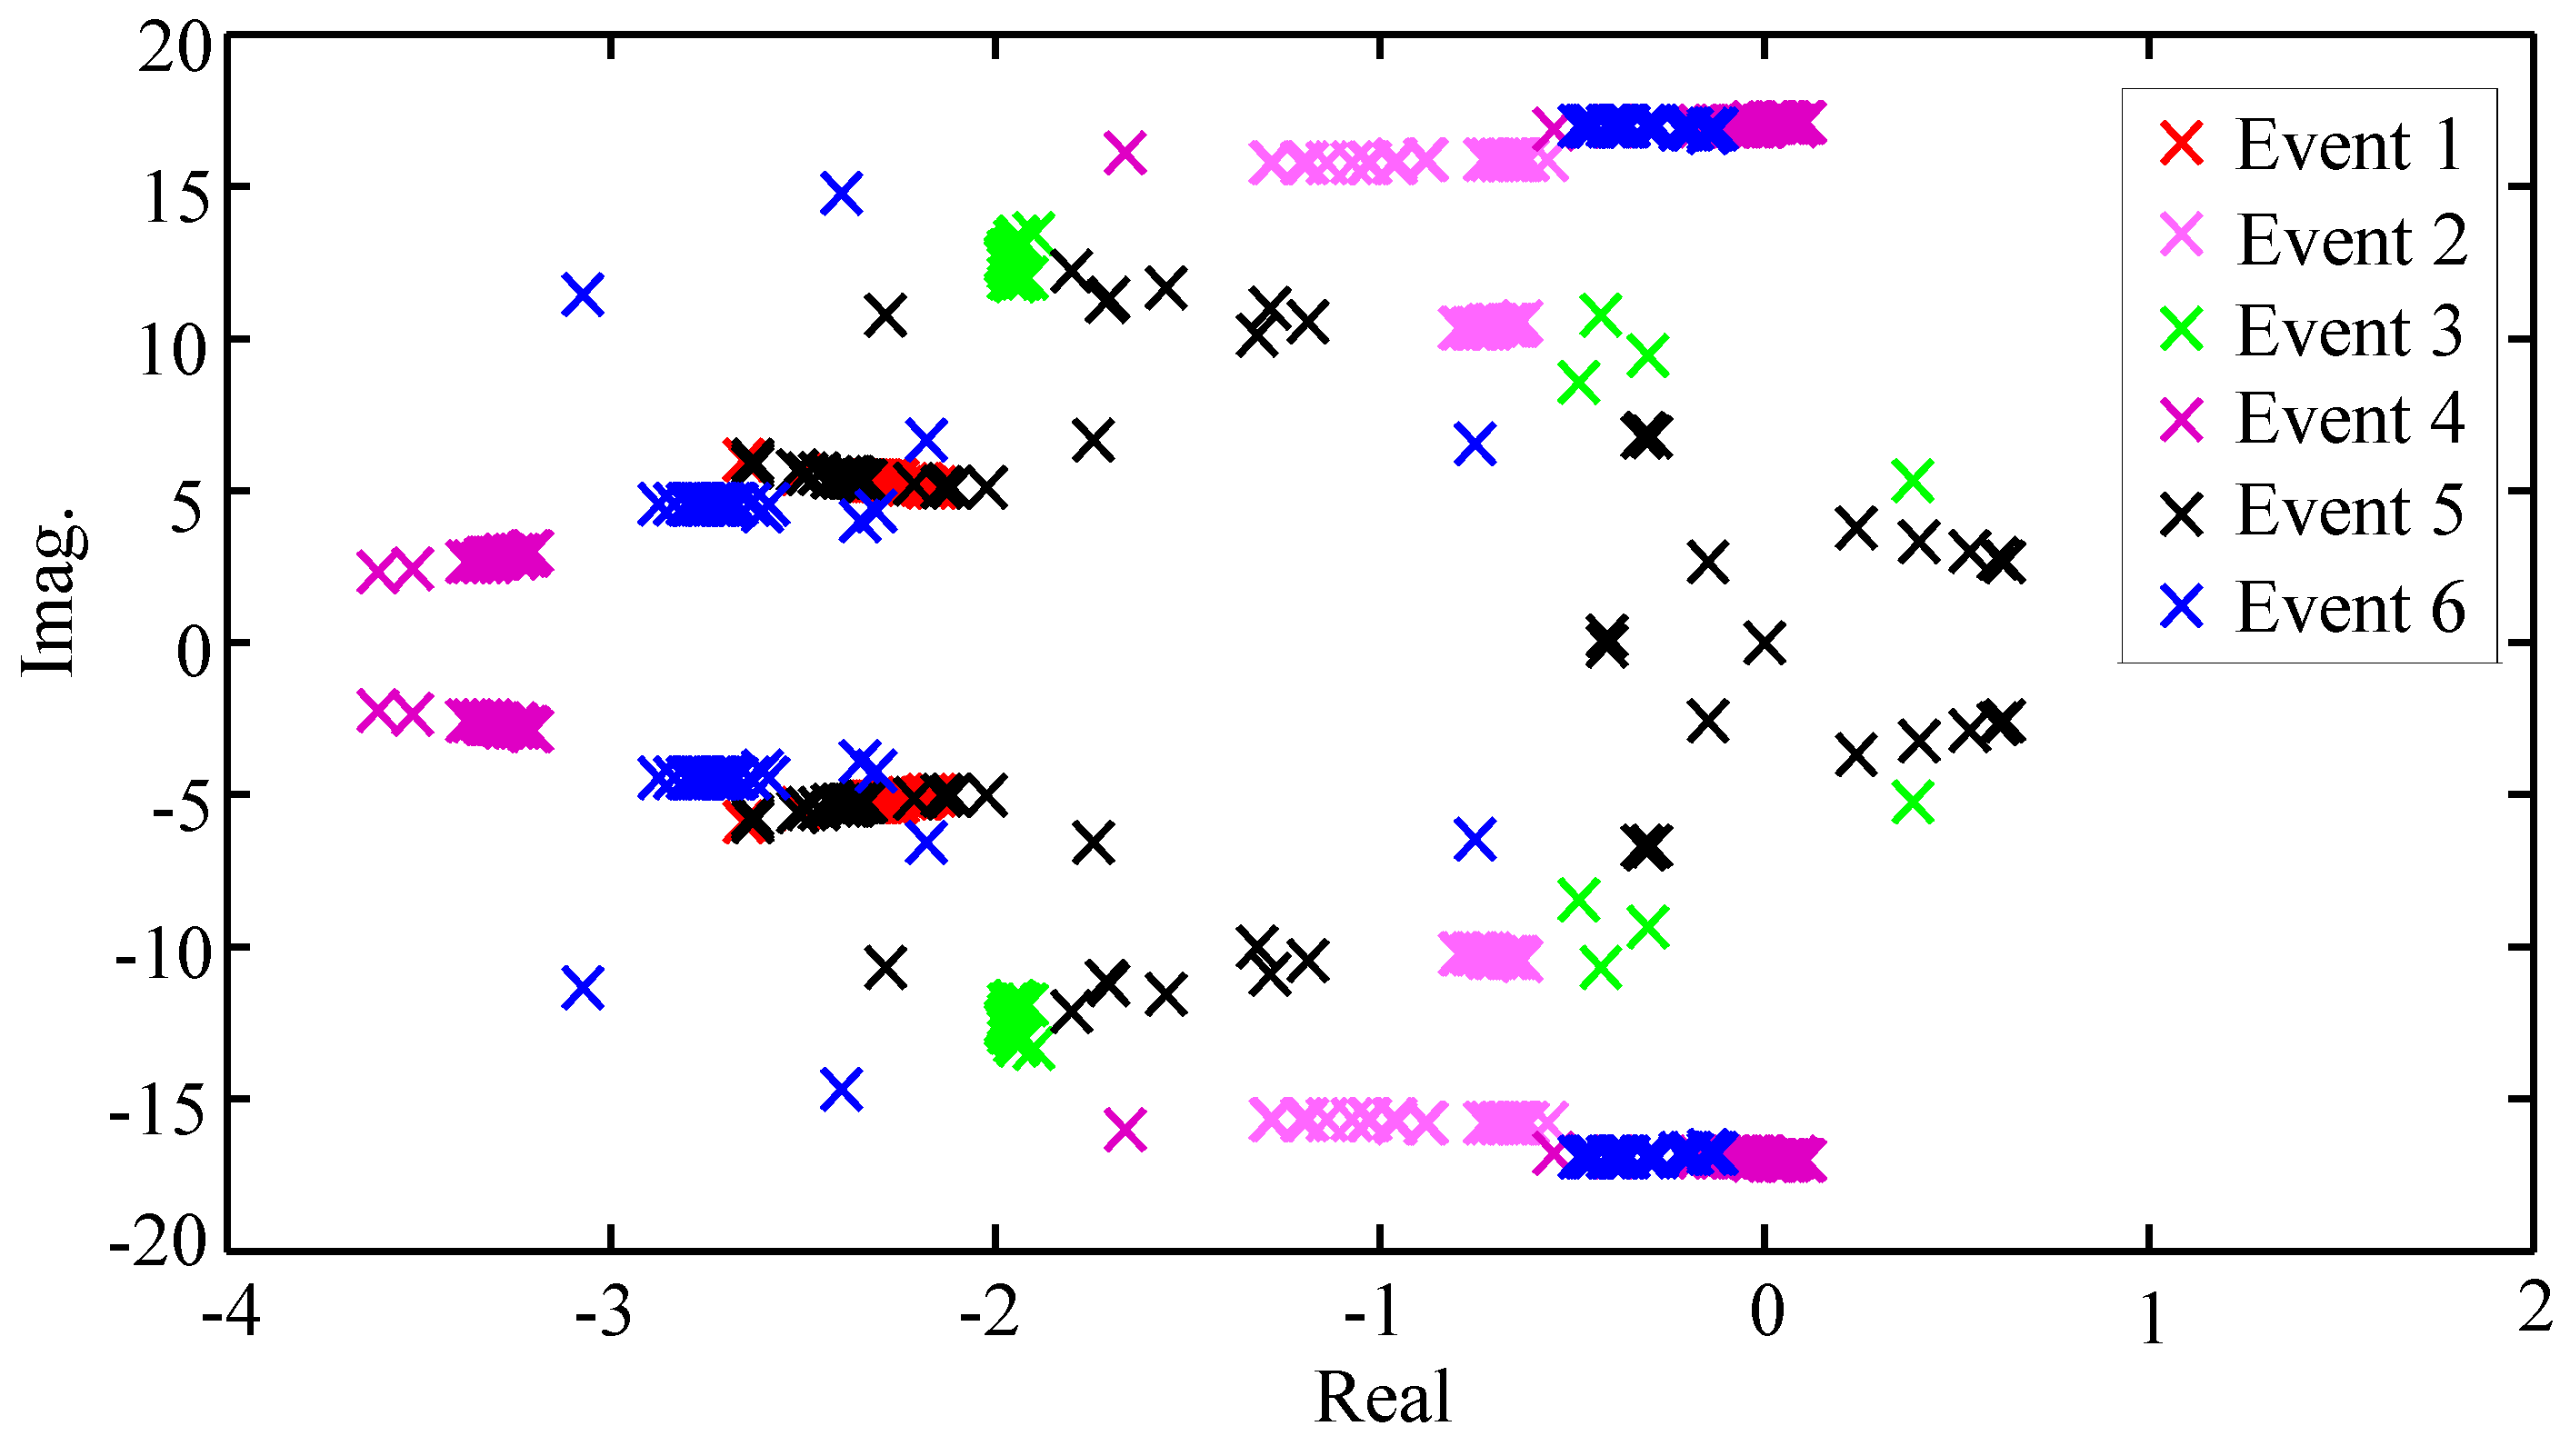
Figure 6.
Normalized active power of Line 4–6 per steady-state value for events with a new fault location in various operation scenarios: (a) Scenario 1; (b) Scenario 2; (c) Scenario 3; (d) Scenario 4; (e) Scenario 5.
Figure 6.
Normalized active power of Line 4–6 per steady-state value for events with a new fault location in various operation scenarios: (a) Scenario 1; (b) Scenario 2; (c) Scenario 3; (d) Scenario 4; (e) Scenario 5.

Table 1.
Events list.
| Event Number | Description | |
|---|---|---|
| Affected Line | Fault | |
| 1 | Line 5–7 | - |
| 2 | Line 8–9 | 3ph-SHC |
| 3 | Line 7–8 | 3ph-SHC |
| 4 | Line 6–9 | 3ph-SHC |
| 5 | Line 5–7 | 3ph-SHC |
| 6 | Line 4–5 | 3ph-SHC |
Table 2.
Ranking results.
| Rank | Event No. | NTDSITAE | Event No. | MP | Event No. | FREAE |
|---|---|---|---|---|---|---|
| 1 | 2 | 7.89 | 2 | 21.43 | 5 | 88.11 |
| 2 | 5 | 5.03 | 3 | 21.19 | 6 | 74.06 |
| 3 | 6 | 2.49 | 5 | 15.48 | 1 | 72.73 |
| 4 | 1 | 2.27 | 1 | 14.29 | 3 | 72.49 |
| 5 | 3 | 0.88 | 4 | 14.29 | 2 | 72.41 |
| 6 | 4 | 0.14 | 6 | 14.05 | 4 | 70.69 |
Table 3.
Operation scenarios, loads and generation of power system: P(MW) + j Q(Mvar).
| Scenario Number | System Generation | System Loads | ||||
|---|---|---|---|---|---|---|
| G1 | G2 | G3 | LoadA | LoadB | LoadC | |
| 1 | 99 + j34 | 159 + j34 | 93 + j24 | 131 + j64 | 99 + j48 | 115 + j56 |
| 2 | 110 + j33 | 139 + j38 | 70 + j22 | 125 + j68 | 90 + j51 | 100 + j59 |
| 3 | 70 + j19 | 161 + j11 | 74 − j6 | 116 + j47 | 86 + j29 | 97 + j34 |
| 4 | 71 + j27 | 163 + j7 | 85 − j11 | 125 + j50 | 90 + j30 | 100 + j35 |
| 5 | 155 + j20 | 163 − j15 | 0 | 125 + j36 | 90 + j26 | 100 + j29 |
© 2017 by the authors. Licensee MDPI, Basel, Switzerland. This article is an open access article distributed under the terms and conditions of the Creative Commons Attribution (CC BY) license (http://creativecommons.org/licenses/by/4.0/).
Share and Cite
MDPI and ACS Style
Abolhasani Jabali, M.B.; Kazemi, M.H. Power System Event Ranking Using a New Linear Parameter-Varying Modeling with a Wide Area Measurement System-Based Approach. Energies 2017, 10, 1088. https://doi.org/10.3390/en10081088
AMA Style
Abolhasani Jabali MB, Kazemi MH. Power System Event Ranking Using a New Linear Parameter-Varying Modeling with a Wide Area Measurement System-Based Approach. Energies. 2017; 10(8):1088. https://doi.org/10.3390/en10081088
Chicago/Turabian StyleAbolhasani Jabali, Mohammad Bagher, and Mohammad Hosein Kazemi. 2017. "Power System Event Ranking Using a New Linear Parameter-Varying Modeling with a Wide Area Measurement System-Based Approach" Energies 10, no. 8: 1088. https://doi.org/10.3390/en10081088
Note that from the first issue of 2016, this journal uses article numbers instead of page numbers. See further details here.