General Design Procedures for Airport-Based Solar Photovoltaic Systems


1
Department of Electrical & Computer Engineering, Michigan Technological University, Houghton, MI 49931, USA
2
Department of Materials Science & Engineering, Michigan Technological University, Houghton, MI 49931, USA
3
Department of Applied Physics, National University of Science & Technology, P.O. Box AC 939, Ascot, Bulawayo 939, Zimbabwe
*
Author to whom correspondence should be addressed.
Energies 2017, 10(8), 1194; https://doi.org/10.3390/en10081194
Submission received: 15 June 2017
/
Revised: 15 July 2017
/
Accepted: 26 July 2017
/
Published: 12 August 2017
(This article belongs to the Section F: Electrical Engineering)
Abstract
:A source of large surface areas for solar photovoltaic (PV) farms that has been largely overlooked in the 13,000 United States of America (U.S.) airports. This paper hopes to enable PV deployments in most airports by providing an approach to overcome the three primary challenges identified by the Federal Aviation Administration (FAA): (1) reflectivity and glare; (2) radar interference; and (3) physical penetration of airspace. First, these challenges and precautions that must be adhered to for safe PV projects deployment at airports are reviewed and summarized. Since one of the core concerns for PV and airport symbiosis is solar panel reflectivity, and because this data is largely estimated, a controlled experiment is conducted to determine worst-case values of front panel surface reflectivity and compare them to theoretical calculations. Then a general approach to implement solar PV systems in an airport is outlined and this approach is applied to a case study airport. The available land was found to be over 570 acres, which would generate more than 39,000% of the actual annual power demand of the existing airport. The results are discussed while considering the scaling potential of airport-based PV systems throughout the U.S.
1. Introduction
Solar photovoltaic (PV) technology is now well known as a widely accessible, sustainable, and clean source of energy that can be scaled to meet humanity’s energy needs [1,2,3]. After years of steady growth, the PV industry is beginning to meet this potential with approximately 6000 TWh of PV electricity estimated to be generated by 2050, which is roughly 16% of the total global electricity demand [4]. This much solar PV-generated electricity will necessitate substantial surface areas dedicated to PV deployment because of the diffuse nature of solar energy. Much of this need can be met via rooftop PV or the relatively immature building-integrated PV (BIPV) market [5,6,7,8,9,10]. The remainder will need to be met by large-area solar PV farms on either land-based solar PV farms [11,12,13,14] or even water-based floating solar PV farms [15,16,17,18,19,20,21,22]. However, as the global population increases 1.15% per year [23], attractive land and even waterways will become more valuable, especially in densely populated areas. This has the adverse consequence of creating competition for limited land resources between food and energy demand [24,25,26], which will exacerbate the current problem of 870 million people who are chronically malnourished [27]. This means practically that all available non-food producing surface areas should be used before energy production impacts food production.
One source of large surface areas that has been largely overlooked for PV deployments and is not suitable for food production is the surface areas surrounding airports [28]. Airports have large electric load demand, and are generally located near population centers with even higher demands, and also have large unused land areas due to existing design protocols. By 2013, the total number of airports in United States of America (U.S.) was over 13,000 (paved and unpaved) [29], out of which the Federal Aviation Administration (FAA) currently includes over 4500 as public, general aviation use airports [30], which makes airports even more of a potential market for solar PV systems.
One of the factors that influences economic viability of large solar farms are the investments pertaining to acquiring and maintaining suitable land. Thus, airport property has the potential to substantially decrease the land cost as the property under airport authorities has no value for any other use. Another advantage comes in terms of maintenance, as the land under consideration is maintained by the airport authorities from any physical obstruction above ground, thus making it an ideal location for solar PV. There are 30 airports in U.S. [31] and many more across the globe that already have solar power partially supporting their load demands, including Kempegowda International Airport and Cochin International Airport in India [32], and Indianapolis International Airport [33], Tucson International Airport [34], Chattanooga Airport [35], San Francisco International Airport [36] and Denver International Airport in the U.S. [37]. However, the economically viable application of PV [38] in airports is far from saturated, as there are lingering safety concerns from reflectivity and radar interference among airport operators for installation of large-scale PV systems within their land areas [39]. In addition, there is no generalized approach to apply solar PV systems to airports.
This paper rectifies these impediments to further PV deployments at airports by reviewing existing work on PV and airports and providing a new generalized approach to overcome the three primary challenges identified by the F.A.A. [39]: (1) reflectivity and glare; (2) radar interference; and (3) physical penetration of airspace. First, these challenges and precautions that must be adhered to for safe PV projects deployment at airports are reviewed and described. Since one of the core concerns for PV and airport symbiosis is solar panel reflectivity, and because this data is largely unavailable, a controlled experiment is conducted here to determine worst-case values of front panel surface reflectivity. Then a general approach to implement solar PV systems in an airport is outlined and this approach is applied to a case study airport: Houghton County Memorial Airport (CMX) in Hancock, Michigan. The results are provided and discussed while considering the scaling potential of airport-based PV systems.
2. Background on Three Primary Road Blocks to Photovoltaic Systems at Airports
The paper reviews methods to overcome the three primary roadblocks identified by the F.A.A. to deployment of solar PV systems at airports [39]: (1) reflectivity and glare; (2) radar interference; and (3) physical penetration of airspace.
2.1. Reflectivity and Glare
Reflectivity in this context denotes the ability of the PV module surface to reflect light, which may interfere as glare with pilot or airport staff visibility. The possible impacts of PV module reflectivity may lead to either glint or glare, or both. This can cause a brief loss of vision (also called flash blindness), which is a safety concern for the pilots. Flash blindness for a period of 4–12 s (i.e., time to recovery of vision) occurs when 7–11 W/m2 (or 650–1100 lumens/m2) reaches the eye [39]. It is recommended when designing any solar installation for an airport to carefully consider the final approach of pilots and guarantee that no placed installation section will give any face glare that is straight ahead of them or within 25° of straight ahead during final approach [40]. Often the maximum solar irradiation of 1000 W/m2 is used in calculations as an estimate of the solar energy interacting with a module when no other information is available [39]. However, this may be a poor assumption as PV modules have been optically engineered to minimize optical reflection in both conventional [41,42] and thin film PV devices [43,44]. Most PV are using anti-reflection coating (ARC) [45,46] and future PV are expected to integrate metamaterial perfect absorbers into solar modules [47,48], which would be expected to reduce reflection even further [49,50]. The exact percentage of light that is reflected from PV panels is currently best estimated using the Solar Glare Hazard Analysis Tool (SGHAT) [51]. This was a free online tool developed with U.S. tax dollars by the Sandia National Lab in the U.S. Unfortunately, it was disabled in 2016 and is currently available for licensing from Sandia only to commercial ventures. The impact of denying access to publicly funded research in this area will be discussed below. In addition, the reflectivity is not absolutely known for all PV modules. However, the vast majority of PV modules on the market contain some form of anti-reflection coating, and this loss (due to reflection) is generally considered to be only a few percent [52]. In addition, outside of very unusual circumstances, flash blindness can only occur from specular reflections.
A study and report published by Federal Aviation Administration in 2015 [40] gives further insight on how glare actually affects aircraft aviation and compares PV glare to other common sources of glare. On performing a thorough study with pilots, it was found that majority of pilots had encountered glare with durations between 1 and 10 s with longer durations being encountered for objects other than direct sunlight or solar panels. This study concluded that for most pilots, glare emanated primarily from bodies of water. One of the solutions to the glare problem is avoid angles of glare between approaching planes and solar PV modules using SGHAT as a guide and the other potential solution is to eventually achieve lower reflectivity from PV surfaces compared to typical source of glare from other real-world objects like water, buildings/glass windows, other aircraft and even snow. It should be noted that the real location considered in this paper has snow in 5 of the 12 months of the year and hence it will be safe to assume that glare off snow here will be one of the highest compared to other locations. To counter this problem, which is primarily that of an unknown, a reliable method to calculate the percentage of specular reflection off a particular PV module shall be measured and compared to a theoretical model. Experimentally determined reflection values will be addressed below.
2.2. Radar Interference
PV systems could cause negative impacts on radar, NAVAIDS (navigation aids) and infrared instruments called communication, navigation, and surveillance (CNS) by causing interference [39]. Interference of radar and NAVAIDS (despite passive components) occurs when objects are placed too close to a radar sail or antenna and obstruct the transmission of signals between the radar antenna and the receiver, which can be a plane or a remote monitoring location. Metal components on the PV racking may also cause reflected signals. However, due to PV systems having a low profile these risks are low. For example, most large-scale solar farms are of low height profiles like the Topaz Solar PV Farm in California, which is approximately 1.7 m (5.5 ft.) above ground at its top edge, minimize visual impact [53]. If solar PV systems do not represent any level of risk of interfering with surrounding CNS facilities, solar PV project sponsors do not need to conduct studies on their own to determine impacts on CNS facilities when siting a solar energy system at an airport [54]. Due to their low profiles, solar PV systems typically represent little risk of interfering with radar transmissions. In addition, solar modules do not emit electromagnetic waves over distances that could interfere with radar signal transmissions, and any electrical facilities that do carry concentrated current are buried beneath the ground and away from any signal transmission [39]. The one area of potential problem of interference might occur due to the use of metal parts for the racking of the modules. This has not been found it practice, but there are also already alternative materials that can be used for PV racking including plastic tension-based systems [55,56], fiber glass [57], plastic [58] and concrete [59]. These alternative material systems may be considered for airports with metal racking concerns. Lastly, solar energy not converted into electricity by the PV device is converted into heat, raising the temperature of the PV modules in operation normally to about 50 °C in full sun. Thus, impacts on infrared communications can also occur because the solar PV continue to retain heat into the first part of dusk, and the heat they release can be picked up by infrared communications in aircraft [39]. Although this risk is also low, a certain safe radial distance of 150 ft. must be maintained between communication instruments, the control tower and PV modules to avoid all mechanism of interference. It should be noted that some past solar fields have required greater setbacks up to 500 ft. [39].
2.3. Physical Penetration of Airspace and Land
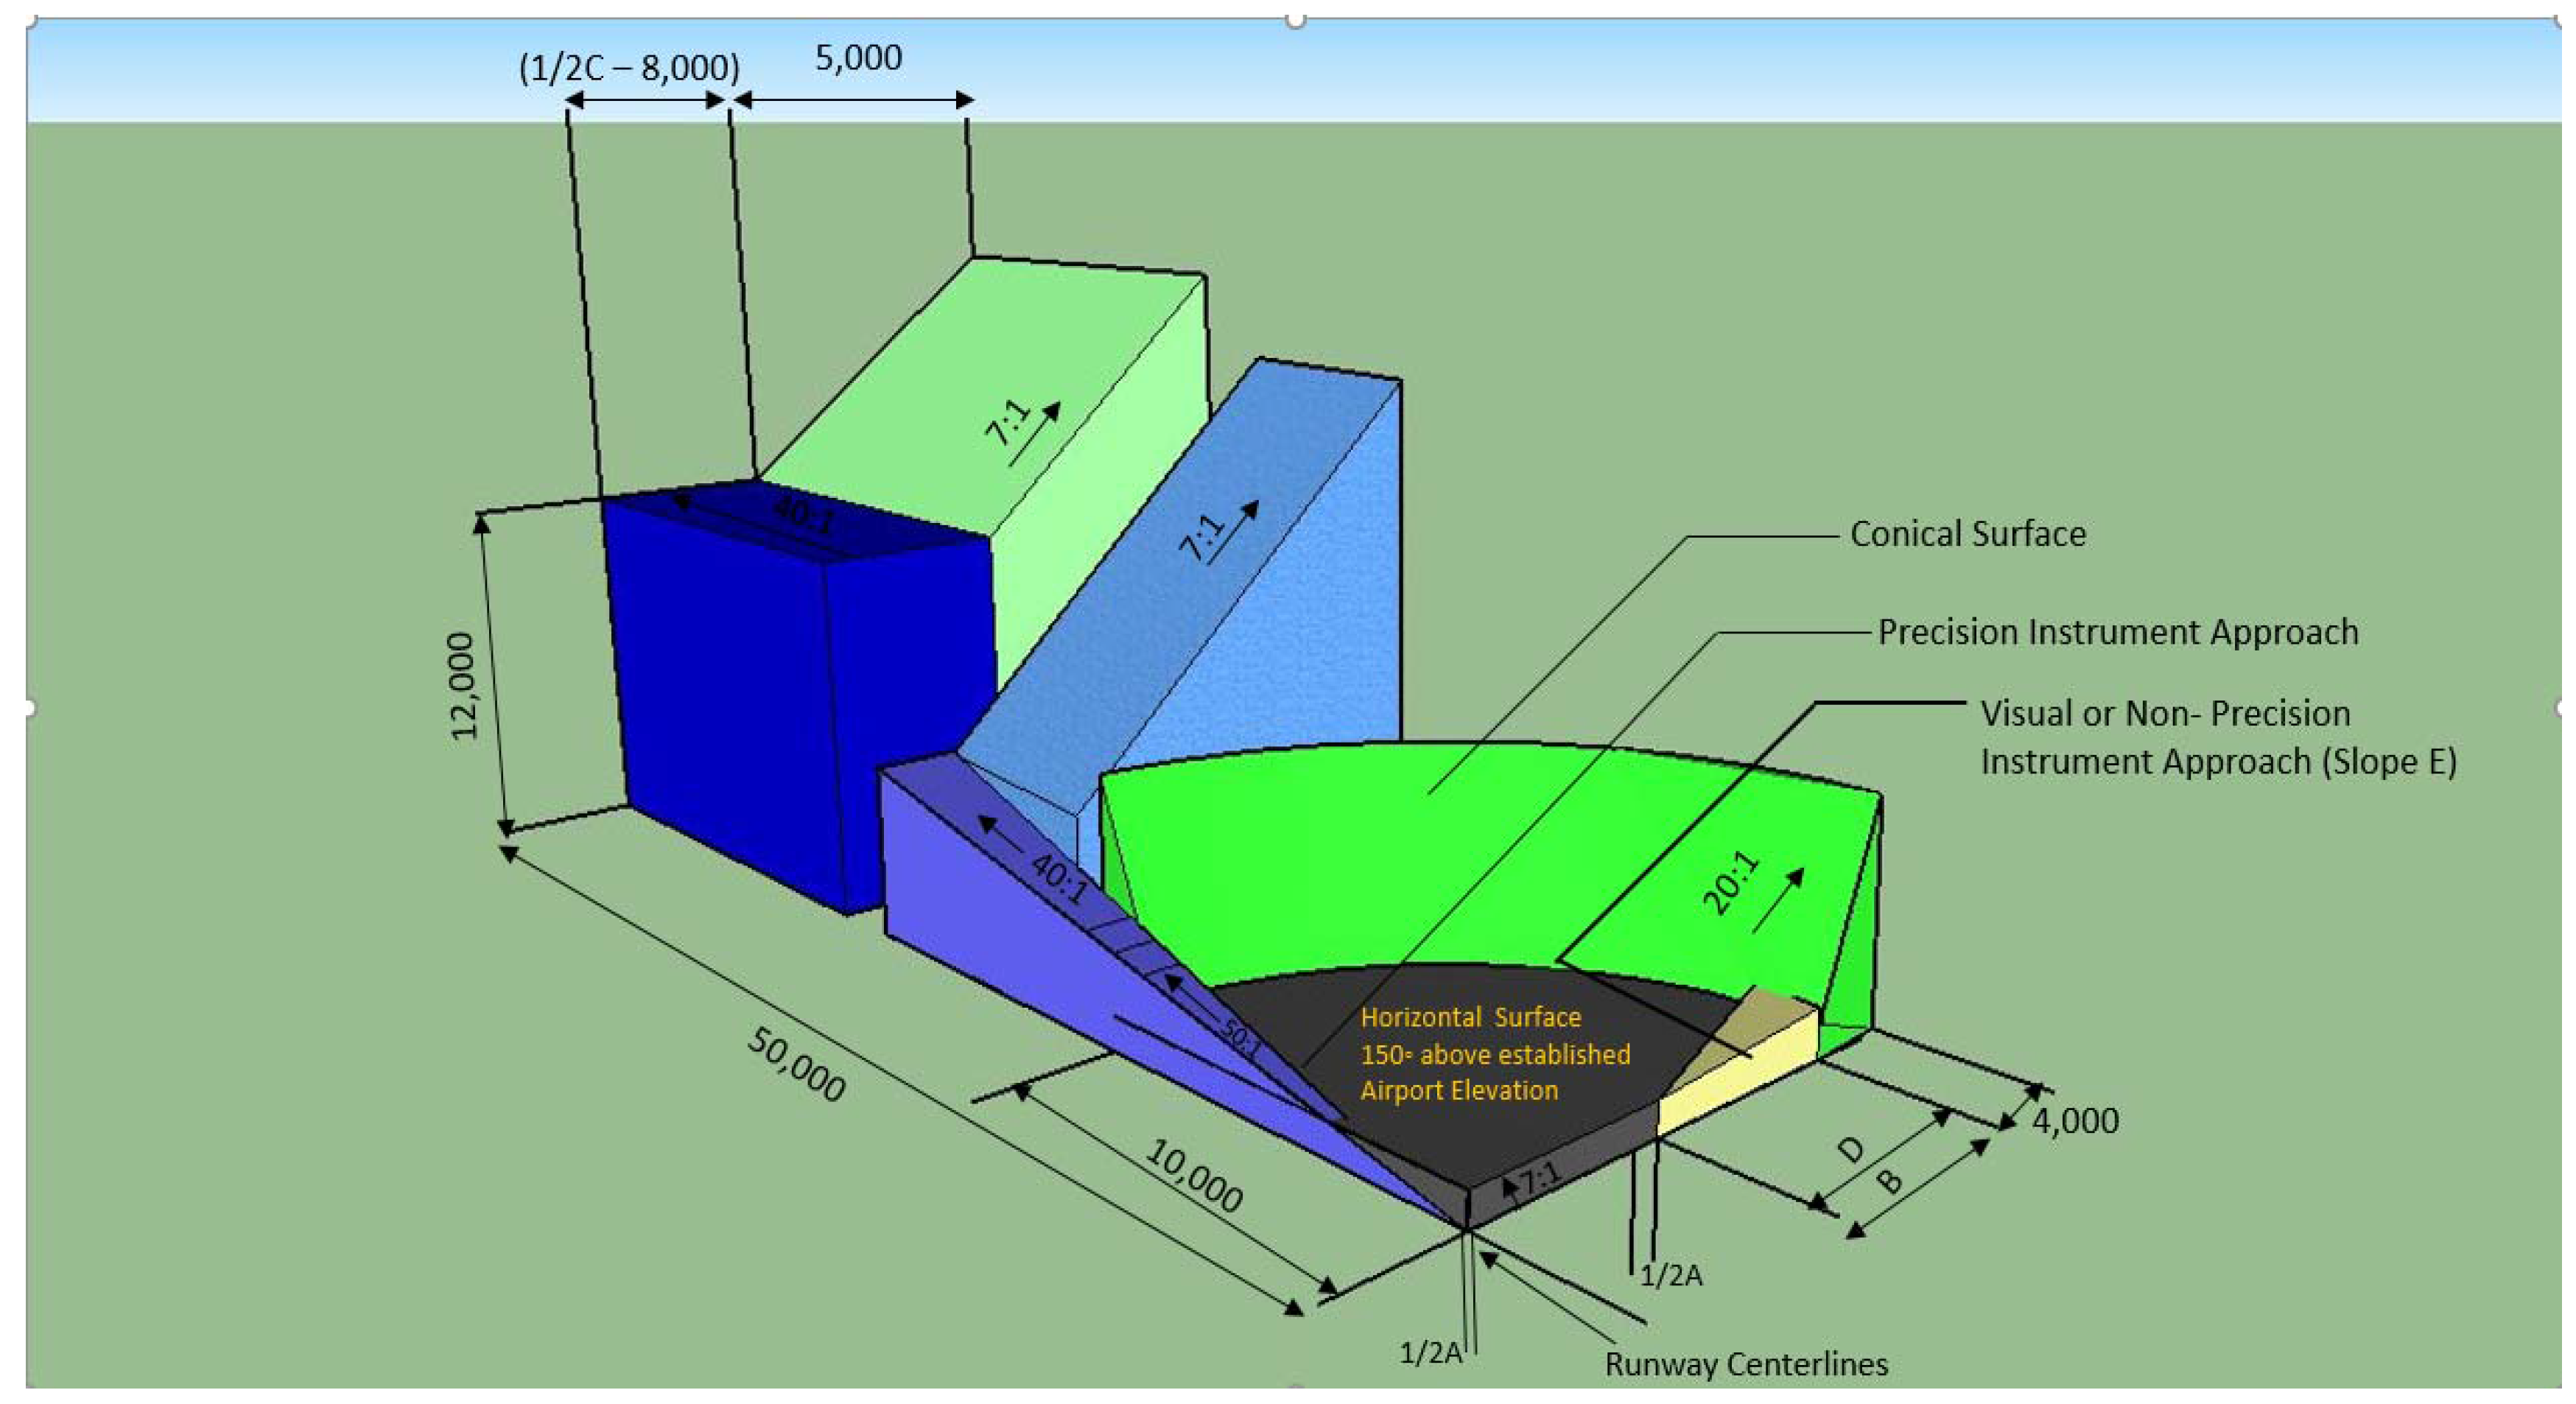
No physical structure is allowed to intervene in spaces that may lead to any safety issues at airports. Hence airspace inside and around any airport is pre-defined where no physical body of any kind is allowed to stand, as shown in Figure 1 [60]. The important volumes in Figure 1 from a PV system installation perspective are in the lower right. The primary surface is a surface longitudinally centered on a runway shown in blue. Next, a horizontal plane 150 ft. above the established airport elevation is shown in dark grey. The approach surface of the aircraft area in blue and transition surface in purple along with other aerial zones concerned with flying aircraft only. All these zones are aerial (150 ft. and above the runway) and will not represent an interference hazard with any of the typical surface solar PV racking designs [61]. The only point of concern will be the restricted zones defined on the actual surface around the runway. This will be discussed in detail in Section 4.3.
3. Experimental Determination of Reflection from a Photovoltaic Module Surface
As noted in Section 2.1, despite glare being considered one of the biggest challenges for an airport solar PV system deployment, there is little available worst-case data on how much of the incident light is due to specular reflection from a standard solar module. Experiments are conducted here to provide background data on the effect of PV array tilt angle on the amount of glared produced from the face of a module in non-glancing angle approaches. The results are also used to validate/correlate part of the data provided by the FAA for PV systems located near airports.
Experimental data was obtained using the following protocol. A small area solar simulator (PV Measurements model SASS, class-BBA) was used as a light source. A calibrated photovoltaic reference cell was used to calibrate the solar simulator to 1 sun (1000 W/m2) using an AM 1.5 spectrum prior to performing the reflection measurements. A 255 W Sharp (model make Sharp #ND-255QCSBX) crystalline silicon-based solar module was used as a reflecting surface (solar PV panel surface). This type of module was chosen as the majority of PV modules on the market are silicon crystalline or polycrystalline silicon absorber material, and this module has standard optics (e.g., anti-reflective coating on Si but not on glass). This module is typical for large commercial applications, with maximum power (Pmax) 250 W (under standard conditions), tolerance of Pmax of +5%/−0%, and the temperature coefficient is −0.485%/°C. A mounted photodiode was used to measure irradiance from both the incident and reflected beam (glare) as a direct function of current generated. The photodiode sensors deliver a current that depends on the optical power and wavelength of the incident beam. Here it is used to measure the reflected glare noted in percentage of the incident irradiation on the panel. The tilt angle was measured using an inclinometer (±0.5°). The distances between the light source, detector and the panel surface, as well as the relative positions, were kept constant throughout the entire experiment. First, measurements were made to determine the irradiance on the panel surface for normal incidence angle (90°) and zero reflection. Then subsequent measurements were made to determine the reflected irradiance for a range of panel tilt angles from 10° to 70° (limited by setup geometries) in 10° incremental steps. Three measurements at the peak location of reflectivity were obtained and averaged for each tilt angle in order to improve the accuracy of the measured results and minimize random error.
4. General Approach to Design Solar System for Airports
4.1. Airport Type and Surface Selection
There are several variables to consider when applying a solar PV system to an airport. First, the location of airport. If the airport is located in the city, like Ronald Reagan Washington National Airport (DCA), it does not have much land available per unit size as compared to more rural airports. These cases where there is limited ground area available should first consider the installation of solar PV on rooftops of buildings and then look at any potential ground area for ground-based systems. On the other hand, if the airport is located in a rural or remote location, like Washington Dulles International Airport (IAD) or CMX in Hancock, Michigan, there is a relatively larger land area available per unit load within the airport. This situation favors a large uniform designed ground-mounted system with roof-mounted or BIPV playing a relatively minor role.
Second, the annual weather conditions for the airport is also a factor for airport PV system design. Although the location of airport is already selected for better weather conditions for airplane landing and taking off, weather still plays a major role in PV system performance. For example, the rural CMX has the largest number of delayed and canceled flights in the U.S. due primarily to weather conditions [62]. In addition, the region it is located in is the upper peninsula of Michigan, which records some of the largest snow events in the U.S. [63], and snow has an impact for annual PV output [64,65,66,67,68]. Thus, in such cases the adverse (snow losses [63,64,65,66,67,68]) and positive effects of weather (i.e., surface albedo [69]) effects need to be taken into consideration in simulation and designs.
Third, the energy consumption of the airport is a factor for sizing an airport-based solar PV system if solar energy is not to be exported to the grid. Based on how busy and how large the airport is the energy consumption varies for different cases and can be substantial. For example, San Francisco International Airport (SFO) reported 322,927 MWh of electricity used by itself and its tenants in Fiscal Year 2010 [36]. This is enough electricity to meet the annual electricity needs of over 48,000 California residents [36]. When considering airport PV systems the variability of the airport load itself should be modeled carefully as the variability can be substantial. For example, in a 2015 report on the Los Angeles International Airport (LAX) electric consumption was 184,416 MWh (14.51% more that its consumption in 2010), which was actually an increase in electricity consumption by approximately 32% until 2014. It was only because of the change in their policies and power management that power demand was reduced in the following year [70].
If the land area for solar PV is large enough and the airport size is relatively small, there is possibility of achieving a grid neutral airport. If more land area is available for PV solar system, then the generation capacity is enough to even feed back into the grid. However, if the land area around a busy airport is small, only partial energy demands will may be fulfilled by solar PV system.
4.2. Solar Photovoltaic System Design Parameters
There are several PV systems designing/modelling software including: proprietary (e.g., PVSyst, SolarGIS, INSEL, Solar Design Tool, etc.); free government supported methods (e.g., NREL’s System Advisor Model (SAM) [71], Solar Prospector [72], PVWatts Calculator [73] and Canada’s RETScreen [74]); and open-source methods (e.g., r.sun/GRASS [75,76,77]) available for predicting; weather, solar flux and basic PV systems performance and modeling. This paper uses SAM for the performance and financial model designed to facilitate decision-making for the project considered. Using SAM performance predictions and cost of energy estimates can be made for grid-connected/independent power projects based on installation and operating costs and system design parameters that are specified as inputs to the model. The solar resource will affect the design along with the type of balance of systems (BOS) and racking configuration. As all airports constitute long and mandatory boundaries, non-traditional PV system designs may be the best option for the most restricted surface areas. For example, with large spacing between boundaries and airport properties (i.e., towers, roads, etc.), bi-facial solar PV could be another way to increase the overall solar power profile of any airport system. Though low on efficiency compared to conventional PV systems, bifacial PV can provide power and cost benefits by being a protection boundary as well as noise barrier to some extend apart from providing power alone [78]. Based on the sun location during different hours of the day and seasons of the year, the tilt angles of the solar modules will be determined normally to provide the largest annual output [79,80]. The optimized angle for solar modules will also need to take into account weather (e.g., snow conditions [63]).
4.3. Available Surface Area for Photovoltaic System
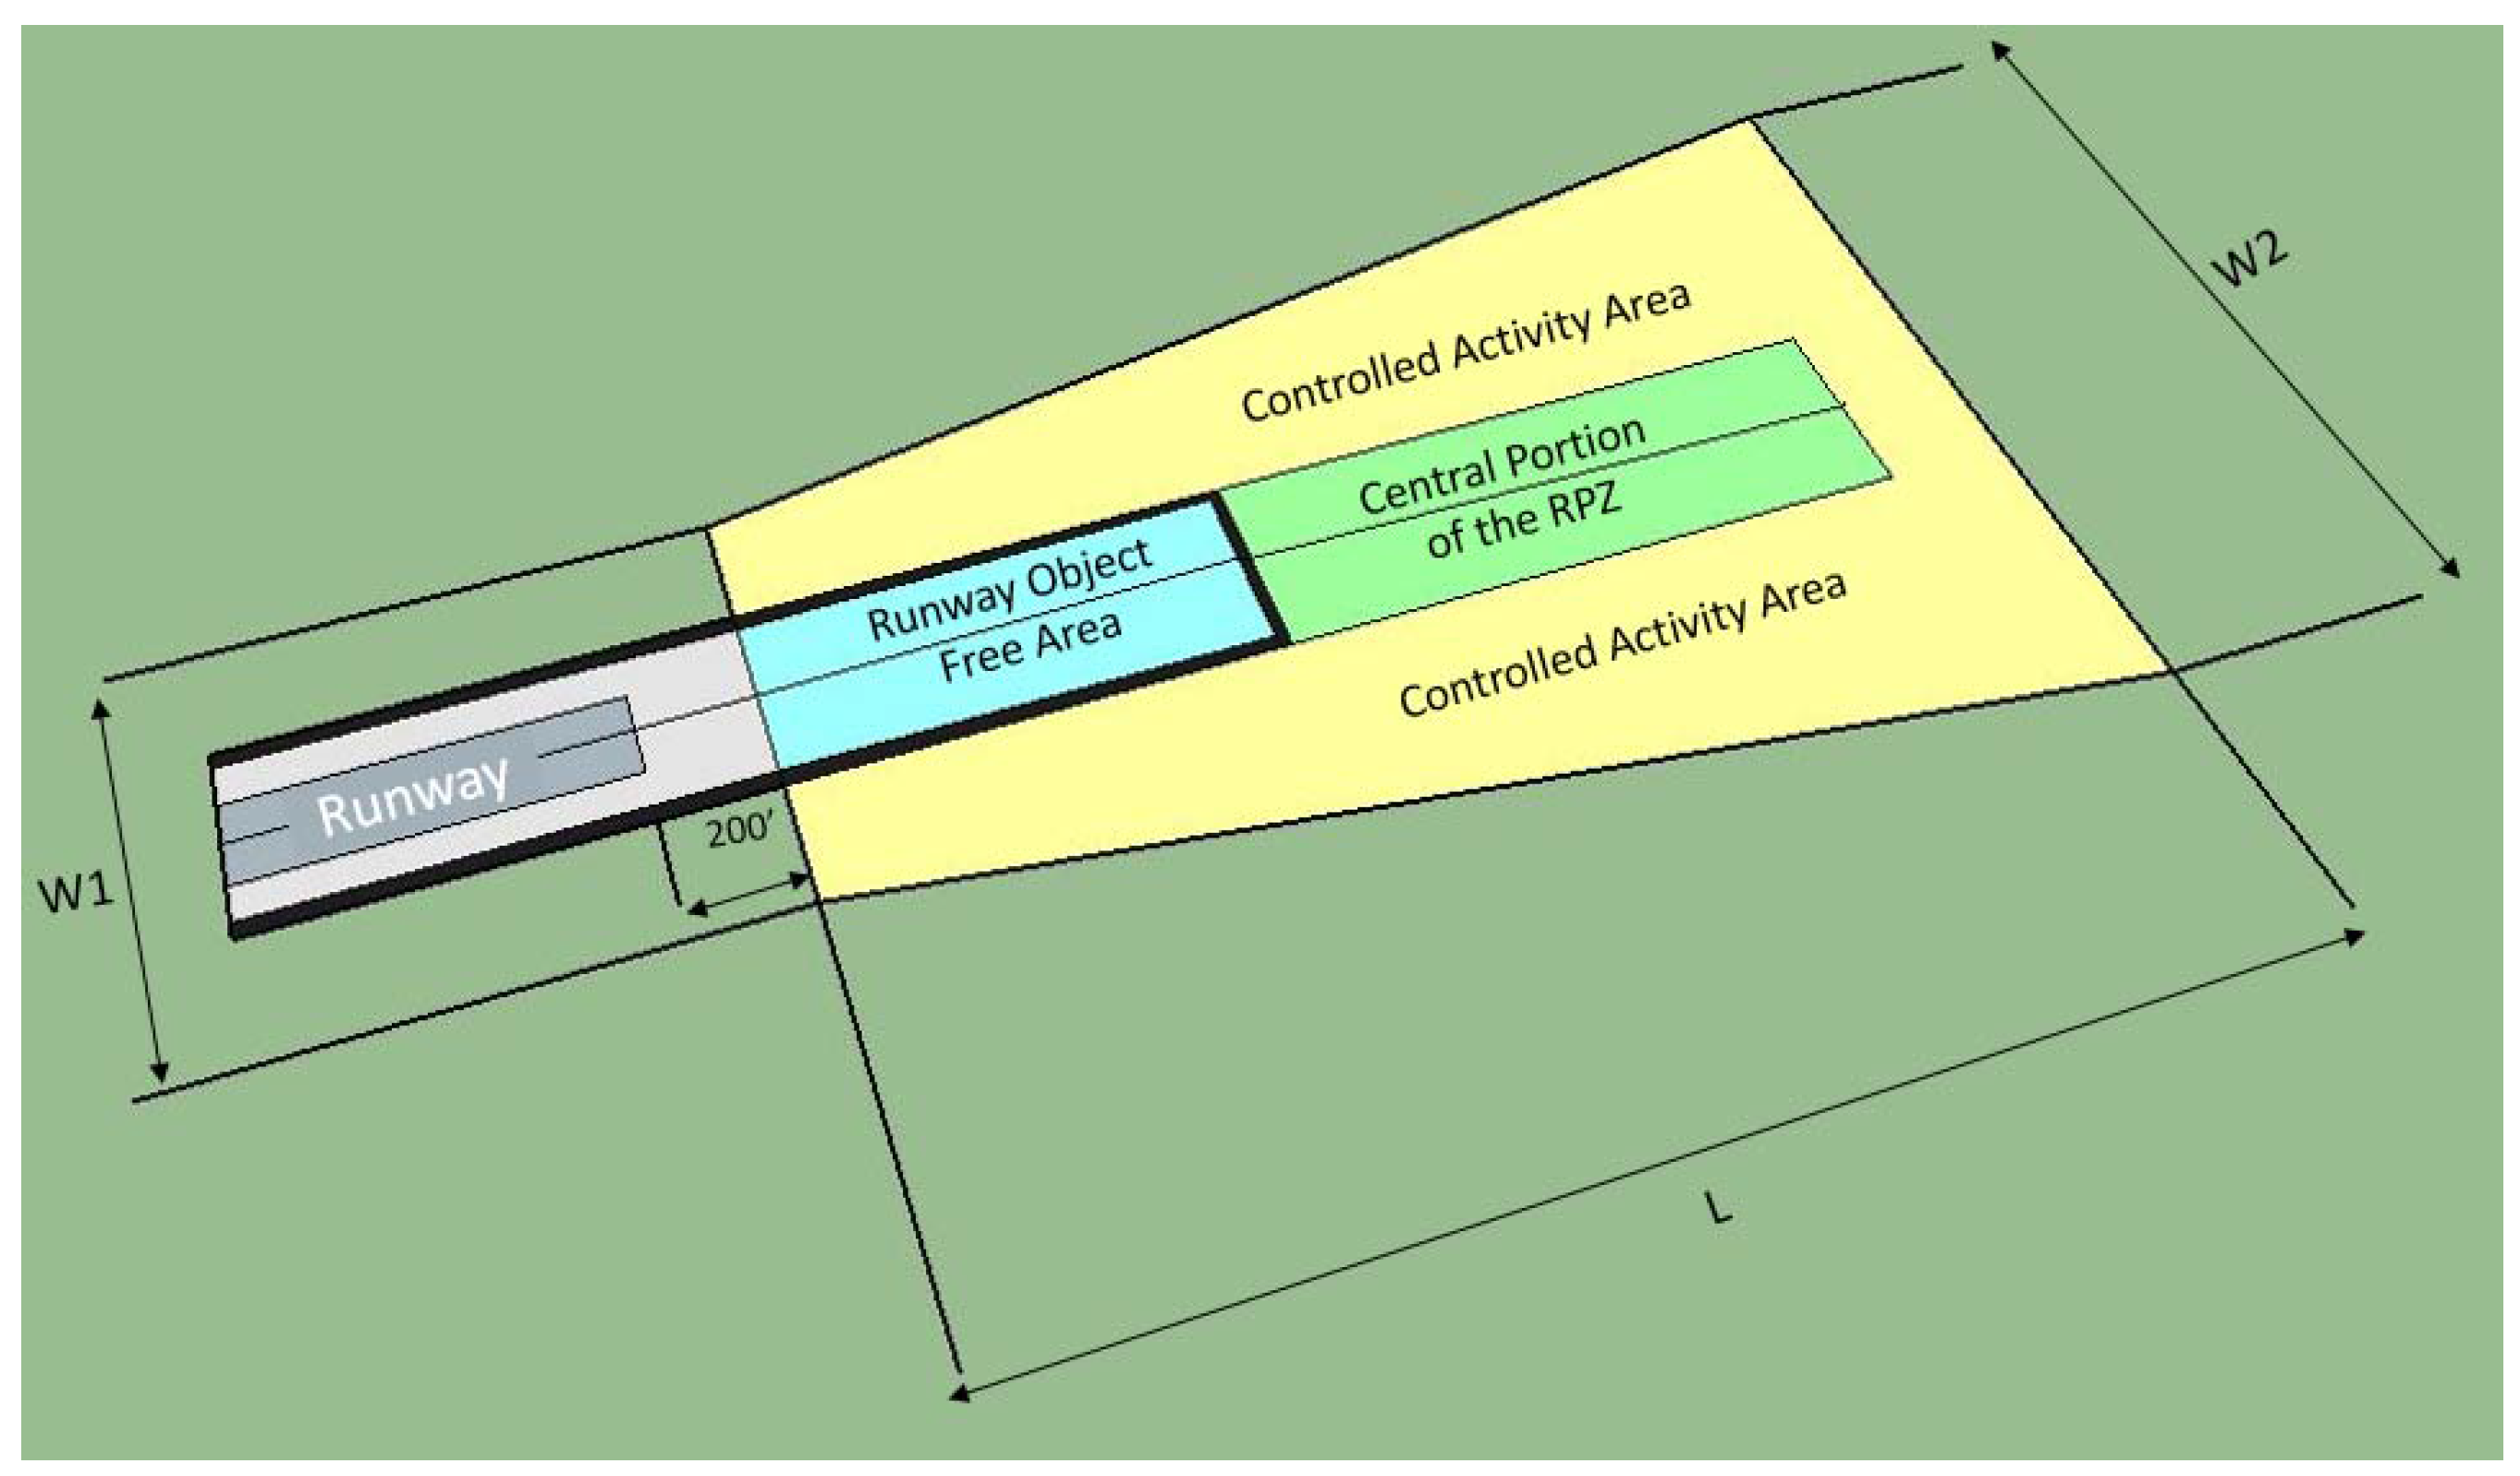
Based on airspace restrictions detailed in Figure 1, the FAA restricts the use of the surface areas in airports. This is detailed in Figure 2. The runway (grey), runway object free area (blue), runway protection zone (RPZ) (light green) and controlled activity (yellow) areas all prohibit PV deployment. Figure 2 shows the areas available for PV deployment in green.
Using the map of the airport, the land area that is not in conflict with the restricted area and other land reserved for any other purposes should be identified as the area in which solar PV systems can possibly be deployed. For this, tools like ArcGIS can be used. By using the Area Solar Radiation Tool in the ArcGIS Spatial Analyst extension, a solar map can be generated from the georeferenced image specifying target locations, latitude and a yearly solar interval. This solar map takes into consideration the changes in the elevation (azimuth) and position of the sun, as well as any possible shading effect caused by buildings or other objects in the input raster. Such GIS software also derives raster representations of a hemispherical view shed, sun map, and sky map, which are used in the calculation of direct, diffuse, and global solar radiation [81]. A similar approach can be used for free with r.sun and GRASS [76,77,82]. Because of the direction of runways, the planes land and take off in both direction the runways. Thus, the different locations of solar PV system panels can have different glare effects on a plane navigating around the airport. After determining the orientation and angle for a solar PV system for an airport, it is advisable to set the solar modules in the land area which is facing off the runways. Details of the approach will be presented in Section 5 for the case study airport.
In addition, land proposed for PV deployment at airports should not only be available for power production now, but also be free from any future expansion plans (e.g., proposed future runway extensions or new buildings). However, it should be noted that even if a certain section of land is proposed for use after 20 years, a PV system can be proposed for this land on lease for some time to not only make the project economically profitable, but also as a better use of the land for the time being (it is expected that solar PV technology will continue to improve [61] fast enough to compensate for the generation loss by increasing efficiency in permanent PV systems).
4.4. Airport Baseload Power to Photovoltaic Generation Potential Comparison
After determining the available land for a solar PV system, energy production potential by the solar PV system can be calculated for any time of the year. The resultant solar energy produced in calculations can be compared to the actual electric demand based on historical data and projections of the airport from an annual to daily basis, which will further help determine if the airport can be fully supported by solar power or not, and in case of excess power being generated, how much can be fed back to the grid for net metered systems.
During winter periods, energy production potential must to take into account snow losses that can be evaluated using experimental data from Heidari et al. [63] study, which used the same site as this study to perform actual snow loss calculations for solar PV systems at various tilt angles. The power for each snow-exposed module placed at airport site was determined using Equation (1), while Equation (2) was used to evaluate the power from modules without snow cover.
where:
- α
- Temperature coefficient of current, module (1/°C)
- β
- Temperature coefficient, pyranometer (1/°C)
- C
- Temperature coefficient of power, module (1/°C)
- Eloss
- Energy loss (kWh)
- It
- Short-circuit current measured at time t (A)
- ISTC
- Short-circuit current at Standard Test Conditions (STCs), (A)
- PC, t
- Power that can be extracted from each virtual clean module (without snow) at time t (Watts)
- Pm, t
- Calculated output power of snow-exposed module (at various angles and heights) at time t (W)
- Gt
- Global irradiance obtained by pyranometer (at various angles) at time t (W/m−2)
Thus, the snow loss due to snow was calculated as the difference in energy without snow PC versus the energy obtained from snow-covered modules Pm [63] using Equation (3).
5. Case Study
To clarify the methodology a case study is provided using the Houghton County Memorial Airport (CMX) in Hancock, in Michigan’s Upper Peninsula (UP). The UP is situated between Lake Superior (along its northern border) and Wisconsin, Lake Michigan, and Lake Huron to the south. It provides an extreme rural case as the UP encompasses 29% of Michigan’s land area, but has only ~3% of the total population [83]. The region experiences long, cold and dark winters with some of the heaviest snowfalls in the United States, which make annual off-grid PV system design particularly challenging [84]. However, short, relatively cool summers with average-high August temperatures of only 22 °C reduce the negative temperature effects on PV performance [85]. In addition, because of the northern latitude of the UP, daylight hours are short during winter and long in the summer, which heavily skews PV production towards summer. At the same time the business case for PV systems in this region is relatively easy to make as the levelized cost of electricity (LCOE) [38] is far less than the effective rates for a consumer per kilowatt hour (kWh) which is comparable across all utilities by incorporating energy changes, service charges, state-mandated charges, and power supply cost recovery factors, which ranges up to over $0.24/kWh (more than double the U.S. average) [86].
5.1. Airport Land Zones and Photovoltaic System Sites Identification
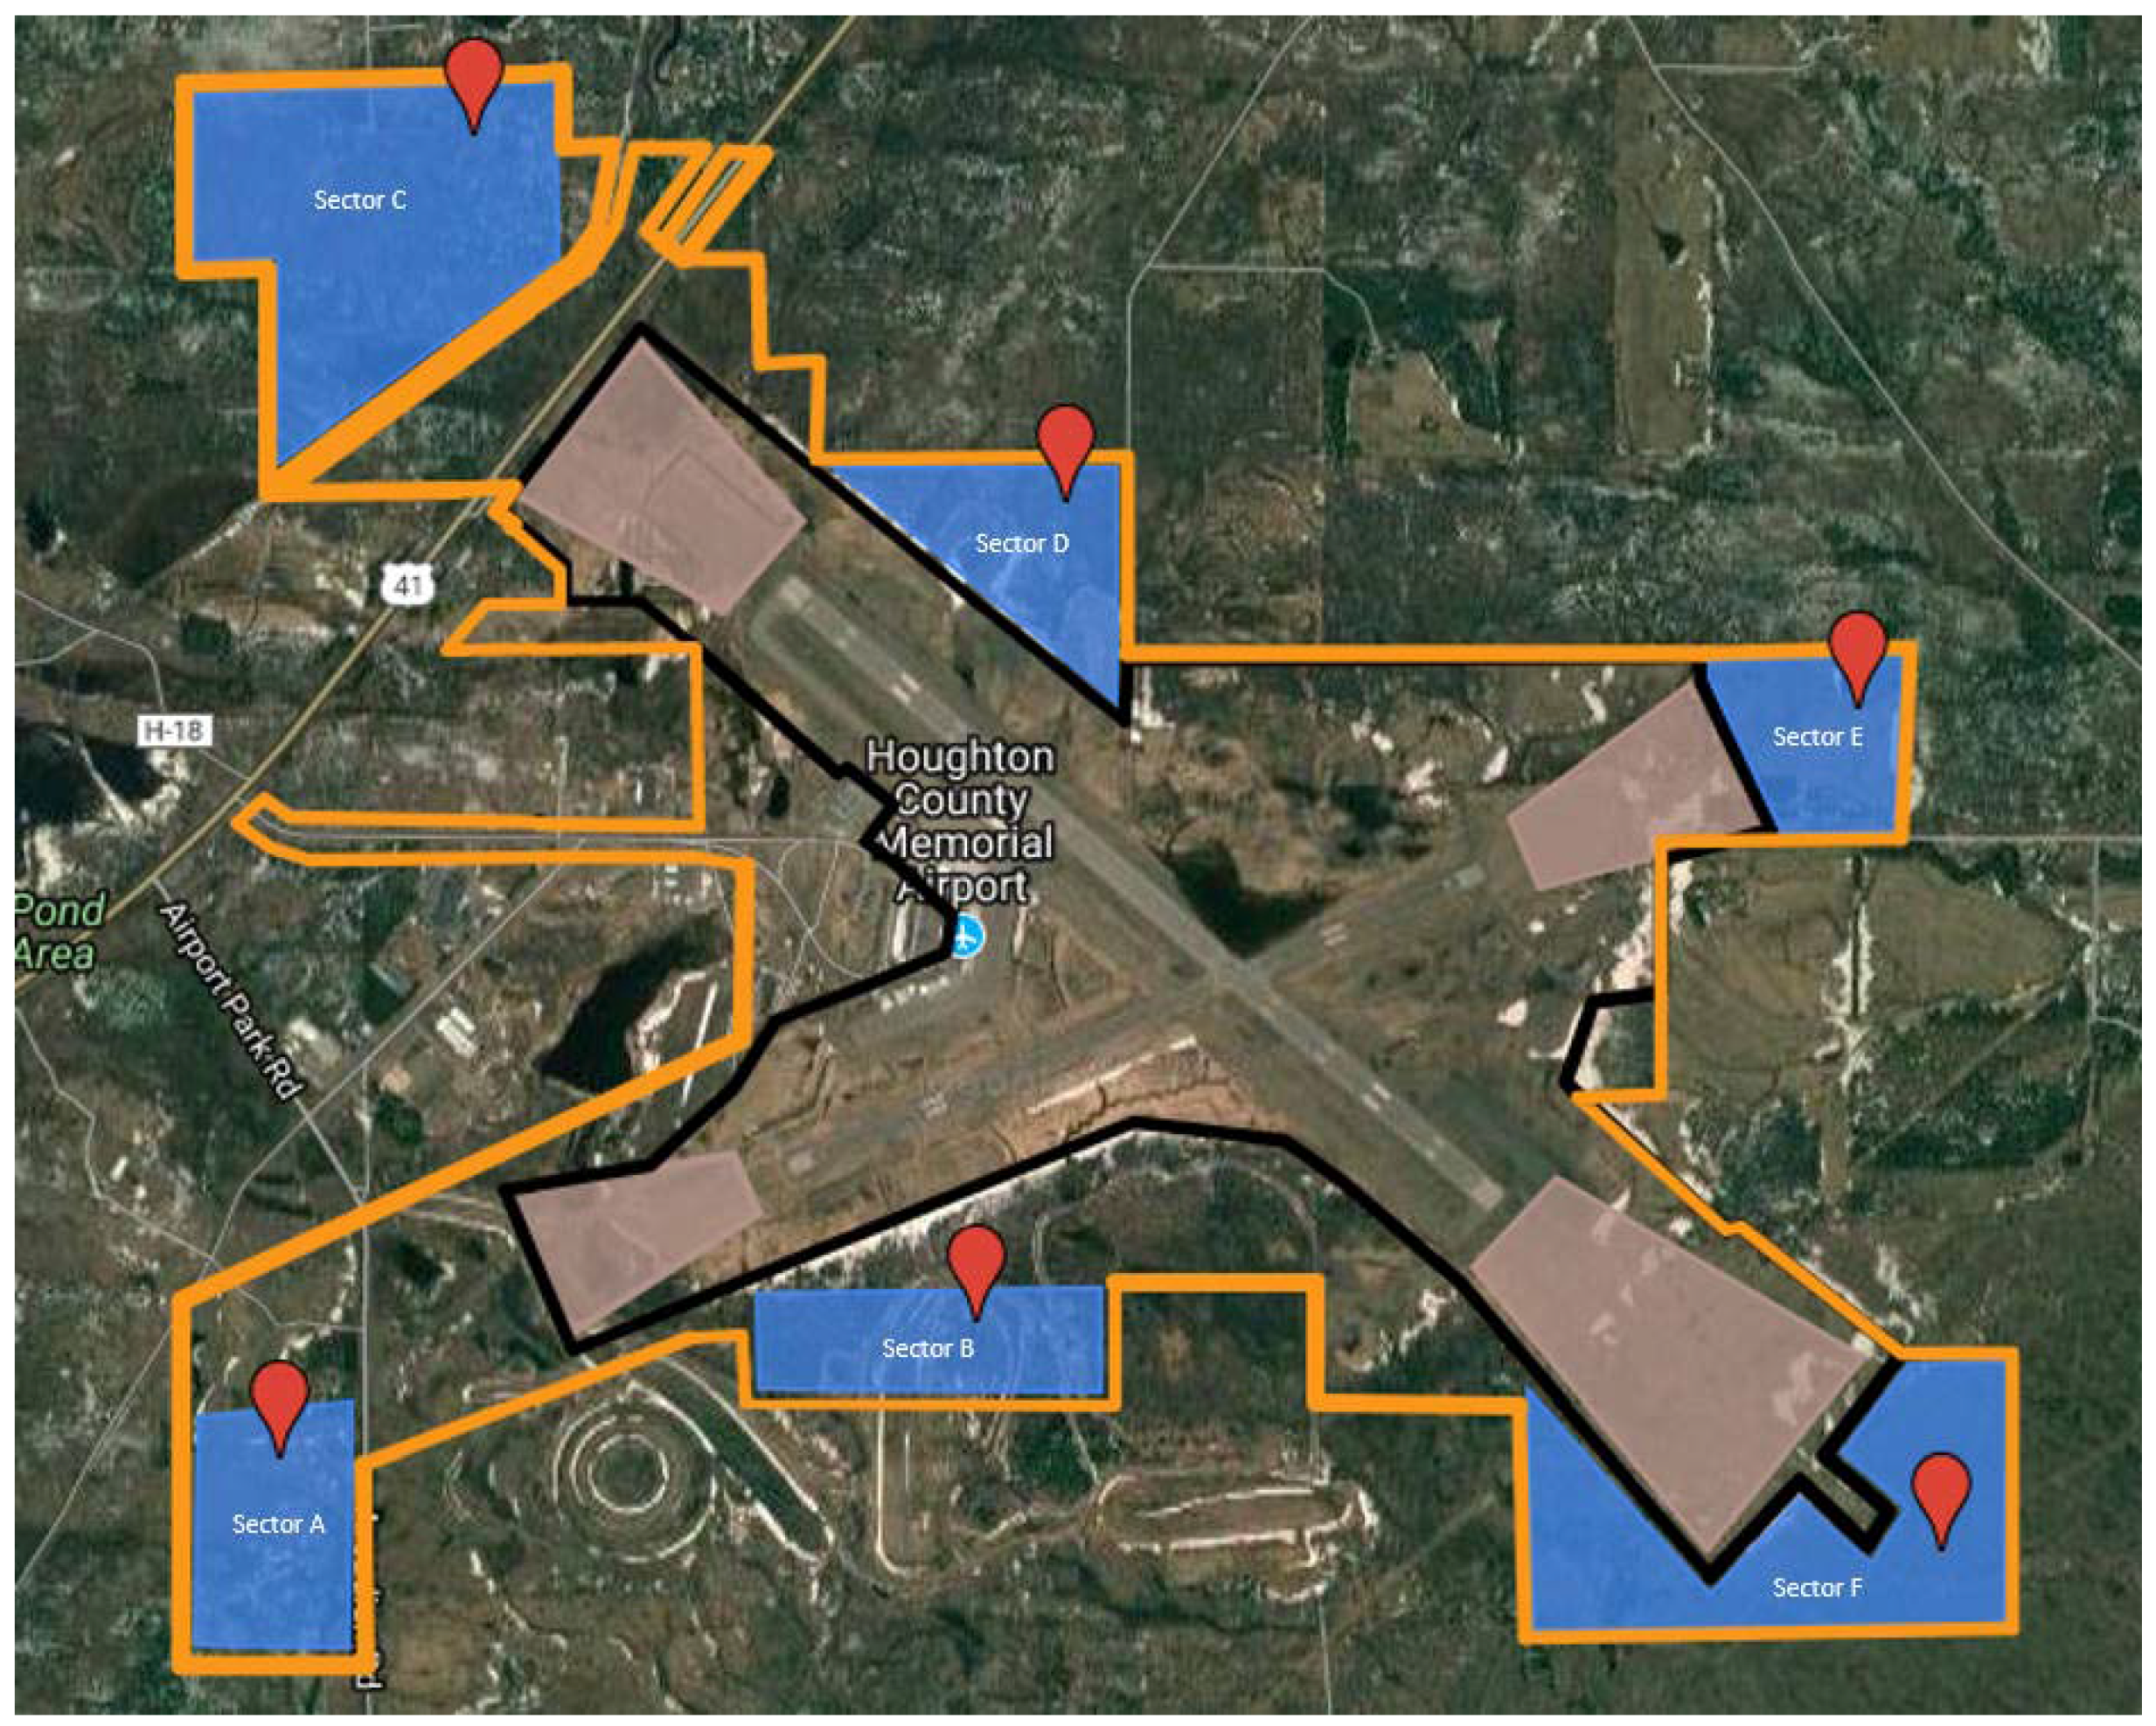
CMX airport was chosen due to access to real time testing and data collection for the validation of the proposed methodology [87]. Furthermore, CMX is currently planning to expand its infrastructure in the near future and considering integrating PV solar power, in addition to other methods of becoming a more environmental friendly and economically viable airport by cutting purchased electricity, which is the highest in the region. Due to the availability of large vacant lands (over 200 acres, as seen in Figure 3, and the low electricity demand, it is possible to design a PV system for better than net zero and thus substantial excess generated solar electricity could be exported to the grid. Figure 3 shows the outer physical boundary (in green) with clear zones (in blue) and the runway protection zones at the ends of the runways (in pink).
The spatial data to consider includes different building location details, boundaries of different sections across the airport, data regarding any object free zone, runways, marking of future buildings and extension work for existing runways, and boundary fencing details.
5.2. Photovoltaic System Modeling/Simulation
For simulating the PV system for the airport, System Advisor Model [71], developed by the National Renewable Energy Laboratory (NREL) is used. First, in the “Location and Resource” section of the model, actual data for CMX airport in Hancock for 2016 was used in the simulation. In the “resource data” section, SunPower SPR-445J-WHT-D (power at standard testing conditions (STC) is 445W) solar modules were selected. Suitable configurations for the sub-arrays were then made. Since the location of CMX airport is in the northern hemisphere, the azimuth is selected to be 180° so that the system faces south. Using freely available and industry accepted software (SAM), the solar flux available in Houghton County, Michigan (located in the west-central part of the UP) and class 2 TMY3 (typical meteorological year) solar data averaged from 1991 to 2005 [88], the optimal design was found to be a 30° tilt with south facing arrays receiving global horizontal of 3.41 kWh/m2/day. Although based on [66,67], 60 degrees is optimized for minimizing snow-related losses, as it makes it easier for snow to slide off the modules, the tilt angle was set as 45. After calculation, for 80 acres of land, without snow losses the unobstructed system on SAM produces 2.33% more power for 30° tilt compared to 45°. However, after taking snow losses for both angles into consideration [66,67], power produced at 45° tile is 2.8% more than power from 30°. Thus 45° tile angle was chosen. For this study, first 80 acres (case 1) of land is evaluated out of the approximately 570.4 acres (case 2), all the blue sections in Figure 3, that is, Section A to F, of potential land available for solar PV system. For both case studies a packing factor (ratio of module area to unused area) of 0.4286 was used. The sub-PV array configuration for case 1 is shown in Table 1 below. Thus, for case 2 the solar PV farm was 2,308,000 m2 and the total module area was 692,530 m2.
The loss settings are as follows: module mismatch is 1%; diodes and connections is 0.5%; DC (direct current) wiring is 1%; nameplate is 1%; and AC (alternating current) wiring is 1%. For the study, actual load data with each unit cost for each energy meter at the airport was acquired and the total demand and total bill payment of each month in 2015 were collected, and are shown in Table 2 [89]. In winter (November to February), the demands are high due to the heating systems loads compared to no such demand for May and June. The demand in July is slightly higher compared to June and August since there is one additional electricity demand from recreational vehicles (RVs), which consumes a little more electricity compared to other months.
6. Results and Discussion
The reflection off a solar PV panel from most near normal angles is less than 3% and represents no risk to air traffic, as can be seen in Figure 4. Figure 4 shows the percentage of reflected light as a fraction of the total incident radiation from the surface of a PV module as a function of the incident angle, θ. This percent of reflected light is measured at the location of peak intensity as a function of the current generated by a photodiode. The results show that the reflection from solar module surface with incident radiation of 1 sun from angles of 10 to 70° varied from the range of 2.08% to 7.15% of the incident radiation. Overall, the reflections off of the PV panel surface were found to be pretty stable until the tilt reached glancing angles, from where it started to increase substantially. This is akin to the behavior of light reflecting from a still source of water such as a pond. The refractive index of still water is 1.33 [90] and the front glass of solar PV modules are made of standard soda lime glass, which has a refractive index of 1.50–1.52. It would thus be expected that for a given angle reflection from a PV front glass surface without any antireflecting (AR) coating is less intense than that of water. Now, with the current progress in solar module technology and development in anti-reflection materials such as materials with an index of refraction of 1.05 [91,92], it is safe to assume that solar PV module will have reflection off their surface dropped further with future technologies [93,94,95,96]. However, even today with the refractive index off PV with AR coating dropping below 1.33 to 1.20–1.30 [97], PV poses no (or presents tolerable/safe) hazards from reflection for airport solar PV projects. By comparing the results of the experiments described here (Figure 1) with estimates from [97], it is clear that modern PV have less intense reflectivity than still surface water. Although PV are mounted at a tilt angle with regards to the surface, the risk of flash blindness is only present for the higher angles (e.g., glancing angles). It should be noted, however, that typical AR coatings are generally optimized for overall reflectance loss, which does not necessarily minimize glancing angle reflectivity or specific polarizations. By changing the cover glass of solar PV, these glare properties can be optimized for airports. For example, glass with strong structured surfaces have proven to be most favorable as its diffusing effect is more effective than antireflective coatings, and initial tests on PV modules showed no performance loss will be induced if strong structured glass is used as a cover [98]. Minimizing this already small risk can be accomplished by selective placement and orientation for plane traffic approaches.
In addition, the use of low-tilt angle arrays would also reduce this risk. The disadvantage of such low-tilt angle arrays is the reduced energy yield per installed unit power of the PV system. However, as the cost of PV modules themselves have dropped a low-tilt angle system enables closer packing of modules (e.g., higher power per unit area) and can increase the solar electricity generated per unit area at an airport. In addition, for airports with surface water, floating solar PV farms [15,16,17,18,19,20,21] and even aquavoltaics [22] would enable an increased area for PV, as well as possibly reducing water surface glare.
The most straightforward method to eliminate glare problems is with the selective placement and orientation of PV for the plane traffic approaches is best accomplished with SGHAT [99], using data from this paper and recent bidirectional reflectance distribution function work on different materials on solar installation glare [98], and following careful siting strategies [100,101,102]. As noted earlier, this best approach was free as the software was funded by the U.S. government and then, for reasons not known to the current licensing executives at Sandia National Laboratories, the software became available only for commercial licensing; currently the use of the software is only available from one vendor, Forge Solar, with subscription plans running from a free trialup to US$156/month [103]. If it is assumed that each airport in the U.S. would want access to the Enterprise version to enable the full optimization of PV arrays, as well as enhanced flight paths over a year of planning, the cost would be US$156/month × 12 months × 13,000 airports the cost would be over US$24.3 million. This cost could in part explain why such a small percentage of airports in the U.S. have moved to PV despite the overwhelming economic advantages seen by large-scale PV systems. This thus illustrates the need for government-funded research to ascribe to open source principles in both software [104,105], research [106] and hardware [107,108] so that the value created from publicly funded research is not locked behind paywalls, which both limits access, but also (as in this case) the deployment of superior technologies.
Further, it is found that potential solar PV projects of substantial size do not possess a risk to aviation from an airspace penetration point of view. Under no conditions would a typical solar PV farm penetrate the approach surface for flights based on the height of PV racks (and low tilt angle racks are even shorter). To further secure the areas near to runways and control tower buildings, proper clearance can be taken from airport authorities themselves, which should result no compromise on the potential land for solar PV farm usage, as seen in Figure 3.
The CMX airport has more than 570 acres of land (all the blue sections in Figure 3, i.e., Section A to F) available and it must be kept clear of trees and vegetation by the airport authorities. Therefore, there is great potential for solar PV system since, in addition to producing solar electricity, solar PV deployment could reduce direct labor costs or shift them to a solar energy provider (e.g., if a standard power purchase agreement (PPA) is used). In the case of CMX, to be extremely conservative case 1 simulation results are first based on using only 80 acres of available land. Some of the available areas from Figure 3 are sized as zones sized for perspective. This case 1 system would have a much smaller capital investment than a full potential system of 570 acres (case 2). In addition, not only would it ensure that under no circumstances would the system interfere with the airport’s existing functionality (the same as the 570 acres), but it would also enable all future expansion plans. To underscore how conservative (low estimation of available PV area) this case 2 estimate is, consider that there are existing cases where approval was given to place part of a PV farm in runway protection zones, which were excluded from the estimates here [39].
The three rectangles (sections A,B,C) highlighted on the left in Figure 3 are better for deploying solar panels compared to other three core potential array locations. The reason is the three-land area are either on the south part of airport (which have least effect glare on airplane) or far away from runways (which has least effect when plane is landing or taking off). In the case 1 simulation, 80 acres of land for deploying solar panels is assumed. In Figure 3, Section A and B is chosen for deploying solar panels.
After simulation in SAM, the monthly energy production is as shown in Figure 5. The data is the energy production before accounting for the snow losses. The next step is the need to measure the snow loss, which could be calculated using Equations (1)–(3) [63].
Results based on Equation (1)–(3), along with simulations studies, showed that with the increasing tilt angles from 0° to 45° for the unobstructed panels, energy loss decreased from 34% to just 5% annually. With the obstructed modules, the losses varied in the range of 29–34% of the total energy produced annually [63]. It was not surprising to find the losses for obstructed and unobstructed panels to be similar as both have the same snow covering in winters due to low or no tilt in the panels. The difference is substantial at higher tilt angles. The results showed that the optimum tilt angle for the system without snow is 30 degrees, producing 25.4 million kWh, but this angle has annual snow losses of 10% of the annual production, giving only 22.8 million kWh. However, for a tilt angle of 45 degrees, the annual power generated by the system is 24.8 million kWh lower with no snow, which is a drop of 2.3% from what is produced from a 30° tilt. On incorporating the power loss after considering snow losses of 5.2% for a 45° tilt, the resultant annual power generated is actually 2.8% more than from a system with a 30° tilt with snow losses.
The other prominent AC and DC losses in the PV system are typical and default losses in SAM are used for selecting particular inverter types and other system components. As such, the highest loss apart from snow is DC module modeled loss, which is only 3.88%. DC inverter maximum power point tracking, MPPT clipping leads to losses of 0.0403%, while DC mismatch is 1%. DC diode and connections is 0.5%, DC wiring is 1%, DC nameplate loss is 1%, AC inverter power clipping is 0.32%, AC inverter power consumption is 0.27%, AC inverter night tare is 0.04%, AC inverter efficiency loss of 1.59% is used, and AC wiring loss is 1%. Plane of array (POA) shading and soiling is 1.54% and 1%, respectively. As the proposed system is fixed type, DC tracking loss is 0% along with AC step-up transformer and AC performance adjustment losses, which are also 0%. It is assumed that the PV system will be used in next 25 years, but for each year there will be 0.5% annual energy production loss, so the case 1 system will produce about 553 million kWh over its lifetime. This includes 23,487,128 kWh energy produced for the first year and subsequently dropping to 20,824,944 kWh by the 25th year in production.
To give a reasonable picture of monthly snow losses, 5.2% of annual loss of the total produced energy is divided with respect to average snow days in each month for one year. This method gives a fairly good representation as losses in January and December came out to be 25% and 21% alone, as shown in Figure 6. This method can be used for PV systems at airports with less detailed environmental based studies using approximations of losses for the area.
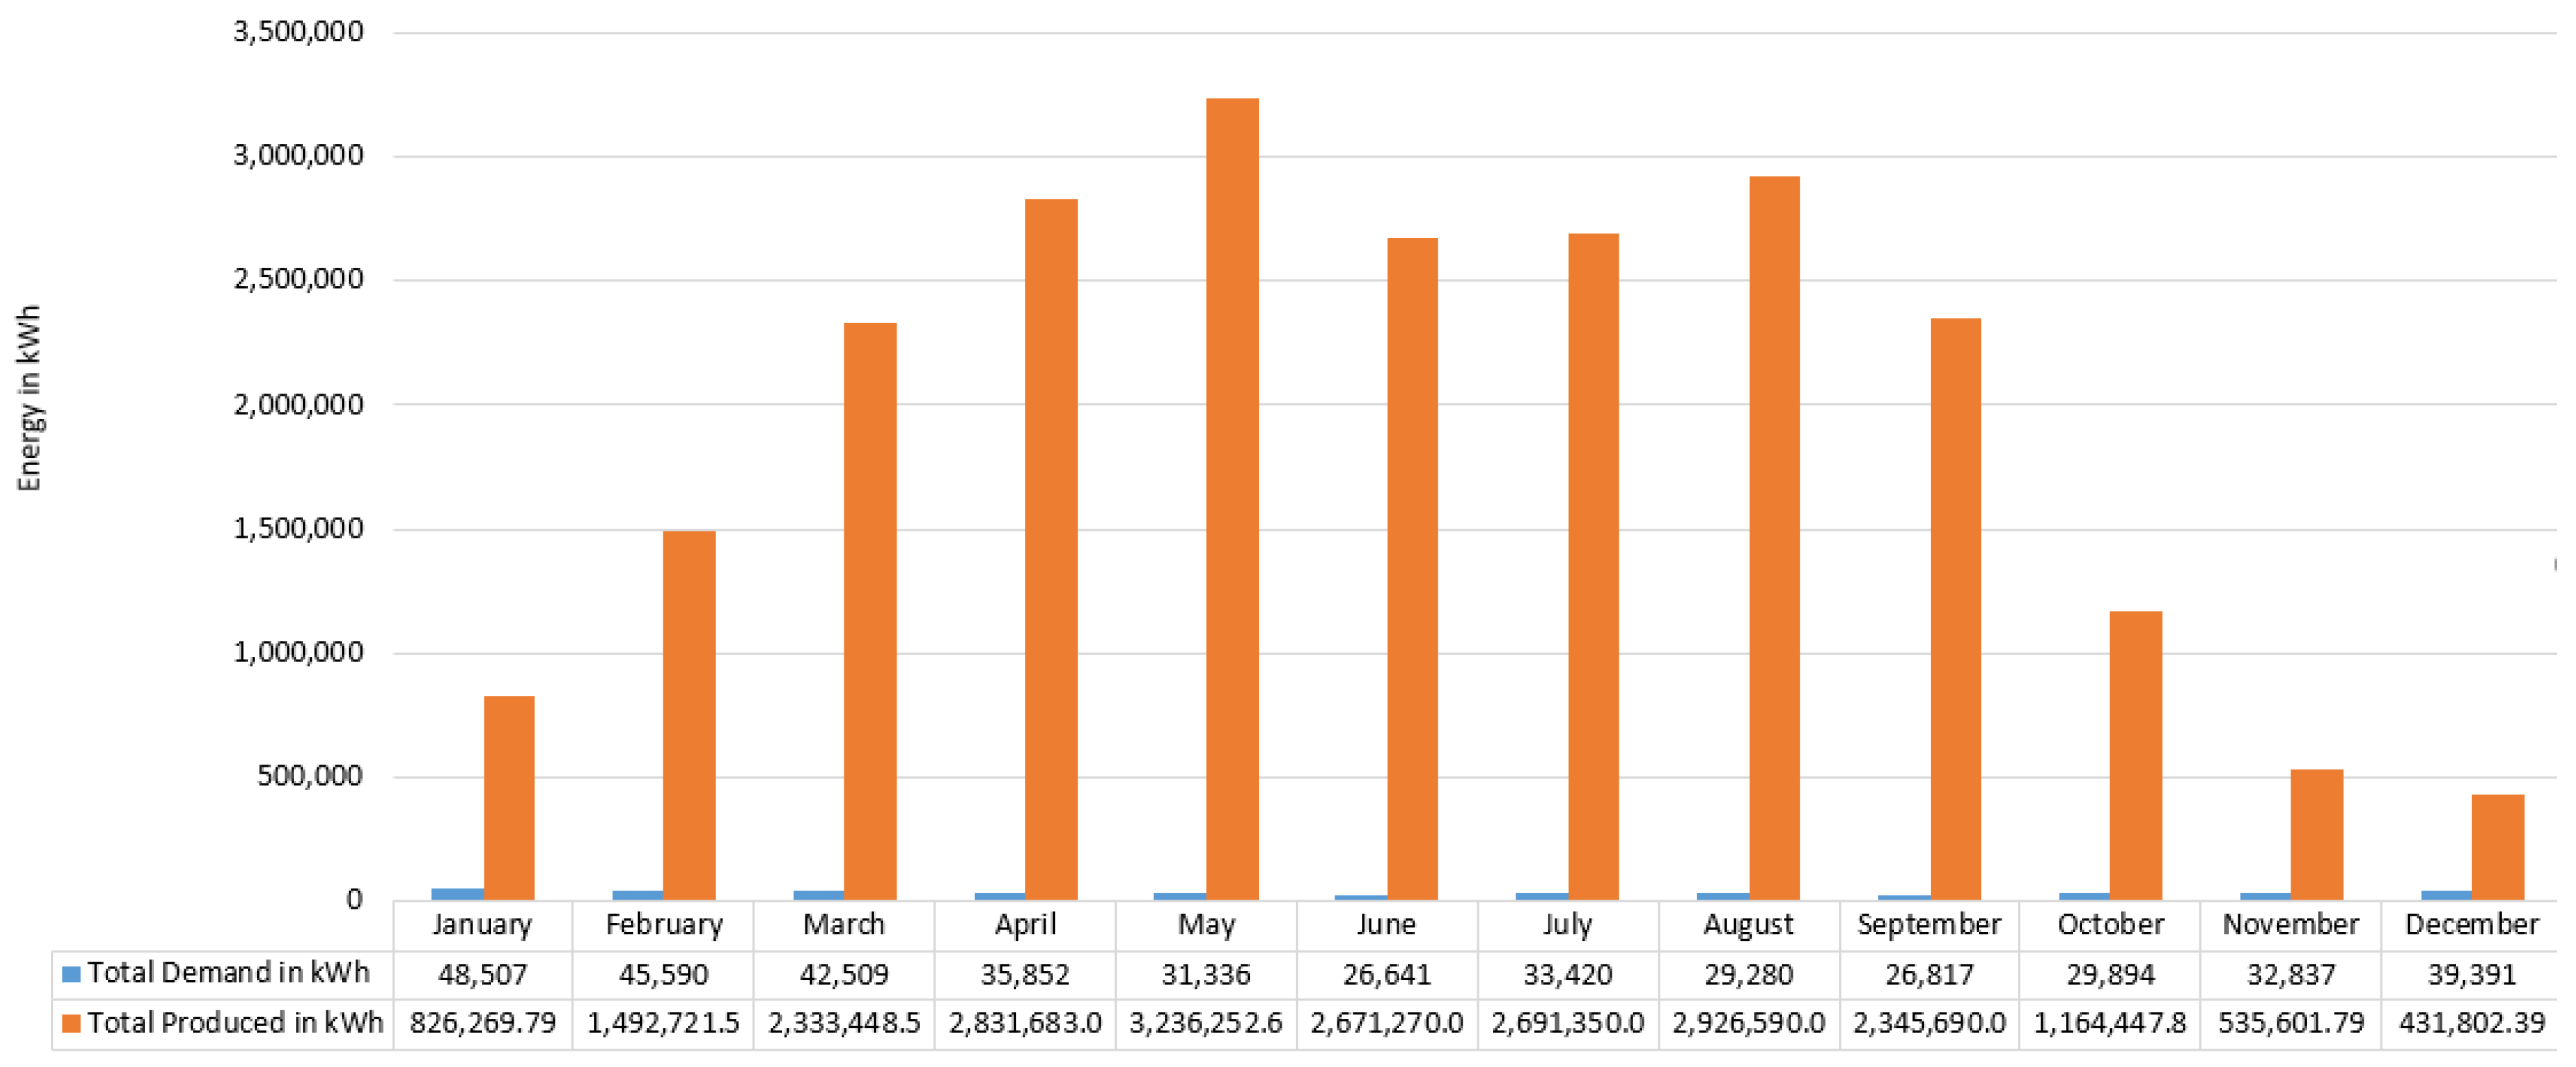
The comparison between energy production and electric load is shown in Figure 6.
As shown in Figure 6, the energy produced by the relatively small solar PV system for case 1 is substantially higher than the amount of electricity load for each month. The case 1 simulated system produced 23,487,128 kWh in one year compared to the 422,074 kWh demand of the airport, which is more than 5560% of the annual demand. To explain the perspective further, if the actual available land is used which is over 570 acres (case 2), approximately 167,352,321 kWh of power can be yielded, which is more than 396 times the actual annual electrical demand of the existing airport. An important point to note here is that the supply with solar is more than the demand even during the winter days when the demand is highest for the year, and it is also the time when the panels will have maximum losses due to snow and low solar flux. The remainder of the solar generated electricity can be fed to the grid, thus making the net metering credit high as well, along with helping to improve system power quality. An average American household consumes approximately 10,812 kWh of energy [109]. If 570 acres of land is utilized; more than 15,400 households can be benefited directly from it by having 100% of the aggregate electrical use covered by the airport PV system. This is a substantial fraction of the population as it represents roughly half of the county’s (Houghton) population.
In addition to the abovementioned examples, solar PV power systems in or around an airport may in fact provide additional advantages. DeVault et al. point out that PV systems do not pose any threat to local biodiversity and, in fact, it is suggested that having solar PV arrays in an airport’s vicinity may act as a repellent to birds and thus helping to improve the safety of the airspace [110].
Many of the rural domestic airports are similar to CMX, with huge areas under airport administration and less air traffic. Based on the results achieved here, similar approaches can be applied to other similar airports. This study has shown that it is technically viable to produce significant solar electricity on currently under-utilized airport surface areas. In general PV systems are found to be profitable in much of the U.S., and thus this technical potential provides a substantial business opportunity. In this particular case, residential electric rates are often over US$0.20/kWh in the CMX region. This indicates that case 2 (all safe and acceptable land at CMX) could produce over US$33 million per year in green electricity. As solar PV installations have now dropped below US$1/W costs [111] solar electricity is now widely cost competitive with other forms of electricity generation. Future work is necessary to further analyze the business and legal case for solar PV systems deployed at such airports. Finally, future work is needed to quantify the total potential area for PV system deployment in all the airports in the U.S. and the entire world in terms of PV power, solar electrical production per year, reduced greenhouse gas emissions per year and economic value.
7. Conclusions
This study showed how the technical barriers could be overcome for the large-scale deployment of solar PV in the over 13,000 airports in the U.S. Experimentally measured reflectivity from modern modules is found to agree with theory and is low enough that basic precautions can allow PV safe integration with airports. In addition, this paper summarized how radar interference and the physical penetration of airspace are not major impediments to PV applications at airports. A general approach to implementation of solar PV systems in an airport is provided. The case studies reviewed for a small rural airport show that available land area could not only provide more than 39,000% of the actual annual power demand of the existing airport, but also a significant fraction of the region’s electric demand with currently dormant surface areas. Such systems can be of great socioeconomic advantage to the local community given the current costs of grid electricity and the price of PV. Based on the results achieved here, large-scale deployment of PV at airports shows enormous promise.
Acknowledgments
The authors would like to thank CMX airport staff Dennis Hext and Rose Keranen for providing airport information.
Author Contributions
Joshua M. Pearce conceived and designed the study; Anurag Anurag., Jiemin Zhang and Jephias Gwamuri performed the experiments; all authors analyzed the data, wrote and edited the paper.
Conflicts of Interest
The authors declare no conflict of interest.
References
- Pearce, J.M. Photovoltaics—A Path to Sustainable Futures. Futures 2002, 34, 663–674. [Google Scholar] [CrossRef]
- Fthenakis, V. Sustainability of photovoltaics: The case for thin-film solar cells. Renew. Sustain. Energy Rev. 2009, 13, 2746–2750. [Google Scholar] [CrossRef]
- Khan, J.; Arsalan, M.H. Solar power technologies for sustainable electricity generation—A review. Renew. Sustain. Energy Rev. 2016, 55, 414–425. [Google Scholar] [CrossRef]
- International Energy Agency (IEA). Technology Roadmap: Solar Photovoltaic Energy; IEA: Paris, France, 2014. [Google Scholar]
- Alsema, E.A.; Nieuwlaar, E. Energy viability of photovoltaic systems. Energy Policy 2000, 28, 999–1010. [Google Scholar] [CrossRef]
- Hofierka, J.; Kaňuk, J. Assessment of photovoltaic potential in urban areas using open-source solar radiation tools. Renew. Energy 2009, 34, 2206–2214. [Google Scholar] [CrossRef]
- Wiginton, L.K.; Nguyen, H.T.; Pearce, J.M. Quantifying rooftop solar photovoltaic potential for regional renewable energy policy. Comput. Environ. Urban Syst. 2010, 34, 345–357. [Google Scholar] [CrossRef]
- Nguyen, H.T.; Pearce, J.M.; Harrap, R.; Barber, G. The Application of LiDAR to Assessment of Rooftop Solar Photovoltaic Deployment Potential on a Municipal District Unit. Sensors 2012, 12, 4534–4558. [Google Scholar] [CrossRef] [PubMed]
- Nguyen, H.T.; Pearce, J.M. Automated Quantification of Solar Photovoltaic Potential in Cities. Int. Rev. Spat. Plan. Sustain. Dev. 2013, 1, 57–70. [Google Scholar] [CrossRef]
- De Wild-Scholten, M.J.; Alasema, E.A.; Ter Horst, E.W.; Bachler, M.; Fthenakis, V.M. A Cost and Environmental Impact Comparison of Grid-Connected of Rooftop and Ground Based PV Systems. In Proceedings of the 21st European Photovoltaic Solar Energy Conference, Dresden, Germany, 4–8 September 2006; pp. 3167–3173. [Google Scholar]
- Nguyen, H.T.; Pearce, J.M. Estimating Potential Photovoltaic Yield with r.sun and the Open Source Geographical Resources Analysis Support System. Sol. Energy 2010, 84, 831–843. [Google Scholar] [CrossRef]
- Bolinger, M. Utility-Scale Solar 2012: An Empirical Analysis of Project Cost, Performance, and Pricing Trends in the United States; U.S. Department of Energy’s Solar Energy Technologies Office: Washington, DC, USA, 2014.
- Fairley, P. Big solar’s big surge. Spectr. IEEE 2015, 52, 41–44. [Google Scholar] [CrossRef]
- Izquierdo, S.; Rodrigues, M.; Fueyo, N. A method for estimating the geographical distribution of the available roof surface area for large-scale photovoltaic energy-potential evaluations. Sol. Energy 2008, 82, 929–939. [Google Scholar] [CrossRef]
- Ferrer-Gisbert, C.; Ferrán-Gozálvez, J.J.; Redón-Santafé, M.; Ferrer-Gisbert, P.; Sánchez-Romero, F.J.; Torregrosa-Soler, J.B. A new photovoltaic floating cover system for water reservoirs. Renew. Energy 2013, 60, 63–70. [Google Scholar] [CrossRef]
- Santafé, M.R.; Ferrer Gisbert, P.S.; Sánchez Romero, F.J.; Torregrosa Soler, J.B.; Ferrán Gozálvez, J.J.; Ferrer-Gisbert, C.M. Implementation of a photovoltaic floating cover for irrigation reservoirs. J. Clean. Prod. 2014, 66, 568–570. [Google Scholar] [CrossRef]
- Sacramento, E.M.D.; Carvalho, P.C.M.; Araújo, J.C.; de Riffel, D.B.; Corrêa, R.M.D.C.; Neto, J.S.P. Scenarios for use of floating photovoltaic plants in Brazilian reservoirs. IET Renew. Power Gener. 2015, 9, 1019–1024. [Google Scholar] [CrossRef]
- Trapani, K. Flexible Floating Thin Film Photovoltaic Array Concept for Marine and Lacustrine Environments. Ph.D. Thesis, Laurentian University of Sudbury, Sudbury, ON, Canada, 2014. [Google Scholar]
- Majid, Z.A.A.; Ruslan, M.H.; Sopian, K.; Othman, M.Y.; Azmi, M.S.M. Study on Performance of 80 Watt Floating Photovoltaic Panel. J. Mech. Eng. Sci. 2014, 7, 1150–1156. [Google Scholar] [CrossRef]
- Trapani, K.; Redón Santafé, M. A review of floating photovoltaic installations: 2007–2013: A review of floating photovoltaic installations. Prog. Photovolt. Res. Appl. 2015, 23, 524–532. [Google Scholar] [CrossRef]
- Rosa-Clot, M.; Rosa-Clot, P.; Tina, G.M.; Scandura, P.F. Submerged photovoltaic solar panel: SP2. Renew. Energy 2009, 35, 1862–1865. [Google Scholar] [CrossRef]
- Pringle, A.M.; Handler, R.M.; Pearce, J.M. Aquavoltaics: Synergies for Dual Use of Water Area for Solar Photovoltaic Electricity Generation and Aquaculture. Renew. Sustain. Energy Rev. 2017, 80, 572–584. [Google Scholar] [CrossRef]
- United Nations Dept. of Economic and Social Affairs. 2014. Available online: http://www.un.org/en/development/desa/population/publications/pdf/trends/Concise%20Report%20on%20the%20World%20Population%20Situation%202014/en.pdf (accessed on 10 April 2015).
- Nonhebel, S. Renewable Energy and Food Supply: Will There Be Enough Land? Renew. Sustain. Energy Rev. 2005, 9, 191–201. [Google Scholar] [CrossRef]
- Calvert, K.; Pearce, J.M.; Mabee, W.E. Toward renewable energy geo-information infrastructures: Applications of GIScience and remote sensing that can build institutional capacity. Renew. Sustain. Energy Rev. 2013, 18, 416–429. [Google Scholar] [CrossRef]
- Calvert, K.; Mabee, W. More Solar Farms or More Bioenergy Crops? Mapping and Assessing Potential Land-Use Conflicts among Renewable Energy Technologies in Eastern Ontario, Canada. Appl. Geogr. 2015, 56, 209–221. [Google Scholar] [CrossRef]
- Food and Agricultural Organization of the United States of America, “Globally almost 870 million Chronically Undernourished—New Hunger Report”. 9 October 2012. Available online: www.fao.org/news/story/en/item/161819/icode/ (accessed on 27 March 2016).
- Kandt, A.; Romero, R. Implementing Solar Technologies at Airports. NREL Report. Available online: http://www.nrel.gov/docs/fy14osti/62349.pdf (accessed on 30 May 2017).
- Central Intelligence Agency US, “The World Factbook”. Available online: www.cia.gov/library/publications/the-world-factbook/geos/us.html (accessed on 10 September 2016).
- Airports Master Records and Reports. Available online: http://www.gcr1.com/5010WEB/advancedsearch.cfm (accessed on 28 March 2016).
- Barrett, S. Glare Factor: Solar Installations and Airports. Sol. Ind. 2013, 6, 1–4. Available online: http://solarindustrymag.com/online/issues/SI1306/FEAT_02_Glare_Factor.html. (accessed on 10 August 2017).
- Krishnan, D.S. Bangalore’s Airport to Become a Leader in Solar Energy Production. Renewable Energy World. Available online: http://www.renewableenergyworld.com/articles/2016/09/bangalore-s-airport-to-become-a-leader-in-solar-energy-production.html (accessed on 4 October 2016).
- IND Solar Farm. Available online: www.indsolarfarm.com/the-solar-farm/ (accessed on 30 September 2016).
- Tuscan Airport Authority. Available online: http://www.flytucson.com/articles/ (accessed on 30 September 2016).
- CHA solar farm. Available online: http://www.chattairport.com/155.1395/chattanooga-airport-solar-farm / (accessed on 10 August 2017).
- Vanasse Hangen Brustlin, Inc., for the San Francisco International Airport Commission, “San Francisco International Airport Environmental Sustainability Report”. December 2011. Available online: http://flysfo.proofic.net.s3.amazonaws.com/default/download/about/reports/pdf/SFO_2011_Environmental_Sustainability_Report.pdf (accessed on 30 September 2016).
- City & County of Denver Department of Aviation. Available online: http://www.flydenver.com/about/administration/ (accessed on 30 September 2016).
- Branker, K.; Pathak, M.M.; Pearce, J.M. A review of solar photovoltaic levelized cost of electricity. Renew. Sustain. Energy Rev. 2011, 15, 4470–4482. [Google Scholar] [CrossRef]
- Federal Aviation Administration (FAA), “Technical Guidance for Evaluating Selected Solar Technologies on Airports”. November 2010; Federal Aviation Administration. Available online: https://www.faa.gov/airports/environmental/policy_guidance/media/airport-solar-guide.pdf (accessed on 30 September 2016).
- Rogers, J.A.; Ho, C.K.; Mead, A.; Millan, A.; Beben, M.; Drechsler, G. Evaluation of Glare as a Hazard for General Aviation Pilots on Final Approach. Federal Aviation Administration; Office of Aerspace Medicine: Washington, DC, USA, 2015. [Google Scholar]
- Yu, E.T.; Van De Lagemaat, J. Photon management for photovoltaics. MRS Bull. 2011, 36, 424–428. [Google Scholar] [CrossRef]
- Lee, S.H.; Kim, D.H.; Kim, J.H.; Lee, G.S.; Park, J.G. Effect of metal-reflection and surface-roughness properties on power-conversion efficiency for polymer photovoltaic cells. J. Phys. Chem. C 2009, 113, 21915–21920. [Google Scholar] [CrossRef]
- Müller, J.; Rech, B.; Springer, J.; Vanecek, M. TCO and light trapping in silicon thin film solar cells. Sol. Energy 2004, 77, 917–930. [Google Scholar] [CrossRef]
- Berginski, M.; Hüpkes, J.; Schulte, M.; Schöpe, G.; Stiebig, H.; Rech, B.; Wuttig, M. The effect of front ZnO: Al surface texture and optical transparency on efficient light trapping in silicon thin-film solar cells. J. Appl. Phys. 2007, 101, 074903. [Google Scholar] [CrossRef]
- Chen, D. Anti-reflection (AR) coatings made by sol-gel processes: A review. Sol. Energy Mater. Sol. Cells 2001, 68, 313–336. [Google Scholar] [CrossRef]
- Raut, H.K.; Ganesh, V.A.; Nair, A.S.; Ramakrishna, S. Anti-reflective coatings: A critical, in-depth review. Energy Environ. Sci. 2011, 4, 3779. [Google Scholar] [CrossRef]
- Landy, N.I.; Sajuyigbe, S.; Mock, J.J.; Smith, D.R.; Padilla, W.J. Perfect Metamaterial Absorber. Phys. Rev. Lett. 2008, 100, 207402. [Google Scholar] [CrossRef] [PubMed]
- Chen, H.-T. Interference theory of metamaterial perfect absorbers. Opt. Express 2012, 20, 7165. [Google Scholar] [CrossRef] [PubMed]
- Gwamuri, J.; Güney, D.Ö.; Pearce, J.M. Advances in Plasmonic Light Trapping in Thin-Film Solar Photovoltaic Devices. In Solar Cell. Nanotechnology; Tiwari, A., Boukherroub, R., Maheshwar Sharon, M., Eds.; Wiley: Hoboken, NJ, USA, 2013; pp. 241–269. [Google Scholar]
- Atwater, H.A.; Polman, A. Plasmonics for improved photovoltaic devices. Nat. Mater. 2010, 9, 205–213. [Google Scholar] [CrossRef] [PubMed]
- Ho, C.; Sims, C. Solar Glare Hazard Analysis Tool (SGHAT) User’s Manual v2.0; Sandia National Laboratories: Albuquerque, NM, USA, 23 August 2013. [Google Scholar]
- Green, M.A. Third Generation Photovoltaics; Springer: New York, NY, USA, 2006. [Google Scholar]
- First Solar, Topaz Solar Farm Project Data. Available online: http://www.firstsolar.com/Resources/Projects/Topaz-Solar-Farm (accessed on 10 August 2017).
- Federal Register, Interim Policy, FAA Review of Solar Energy System Projects on Federally Obligated Airports, A Notice by the Federal Aviation Administration, October 2013. Available online: https://www.federalregister.gov/documents/2013/10/23/2013-24729/interim-policy-faa-review-of-solar-energy-system-projects-on-federally-obligated-airports (accessed on 8 October 2016).
- Wittbrodt, B.T.; Pearce, J.M. Total US cost evaluation of low-weight tension-based photovoltaic flat-roof mounted racking. Sol. Energy 2015, 117, 89–98. [Google Scholar] [CrossRef]
- Wittbrodt, B.; Pearce, J.M. 3-D printing solar photovoltaic racking in developing world. Energy Sustain. Dev. 2017, 36, 1–5. [Google Scholar] [CrossRef]
- Dynoraxx, “DynoRaxx Evolution FR Fiberglass Overview”. Available online: http://dynoraxx.com/flat-roof-system/evolution-fr/ (accessed on 8 October 2016).
- Kanzo Inc., KANZO K1250-Polycarbonate PV Rack Structure. Available online: http://www.kanzorack.com/product.html (accessed on 8 October 2016).
- Schletter.us, “Professional Solar Mounting Systems-Ground Mount Systems”. Available online: www.schletter.us (accessed on 8 October 2016).
- National Geodetic Survey (NGS). Obstruction Identification Surfaces Federal Aviation Regulations Part 77. Available online: www.ngs.noaa.gov/AERO/oisspec (accessed on 8 October 2016).
- National Renewable Energy Laboratory. Available online: http://www.nrel.gov/ncpv/images/efficiency_chart.jpg (accessed on 8 October 2016).
- Air Travel Consumer Report 2015; US Department of Transportation, Office of Aviation Enforcement and Proceedings: Washington, DC, USA, 2015.
- Heidari, N.; Gwamuri, J.; Townsend, T.; Pearce, J.M. Impact of Snow and ground interference on photovoltaic electric system performance. IEEE J. Photovolt. 2015, 5, 1680–1685. [Google Scholar] [CrossRef]
- Powers, L.; Newmiller, J.; Townsend, T. Measuring and modeling the effect of snow on photovoltaic system performance. In Proceedings of the 2010 35th IEEE Photovoltaic Specialists Conference (PVSC), Honolulu, HI, USA, 20–25 June 2010; pp. 000973–000978. [Google Scholar]
- Townsend, T.; Powers, L. Photovoltaics and snow: An update from two winters of measurements in the sierra. In Proceedings of the 2011 37th IEEE Photovoltaic Specialists Conference (PVSC), Seattle, WA, USA, 19–24 June 2011; pp. 003231–003236. [Google Scholar]
- Andrews, R.W.; Pearce, J.M. Prediction of energy effects on photovoltaic systems due to snowfall events. In Proceedings of the 2012 38th IEEE Photovoltaic Specialists Conference (PVSC), Austin, TX, USA, 3–8 June 2012; pp. 003386–003391. [Google Scholar]
- Andrews, R.W.; Pollard, A.; Pearce, J.M. The effects of snowfall on solar photovoltaic performance. Sol. Energy 2013, 92, 84–97. [Google Scholar] [CrossRef]
- Andrews, R.W.; Pollard, A.; Pearce, J.M. A new method to determine the effects of hydrodynamic surface coatings on the snow shedding effectiveness of solar photovoltaic modules. Sol. Energy Mater. Sol. Cells 2013, 113, 71–78. [Google Scholar] [CrossRef]
- Andrews, R.W.; Pearce, J.M. The effect of spectral albedo on amorphous silicon and crystalline silicon solar photovoltaic device performance. Sol. Energy 2013, 91, 233–241. [Google Scholar] [CrossRef]
- Los Angeles World Airports, “LAWA Sustainability Report”. 2015. Available online: http://www.laxsustainability.org/documents/Sustainability_Report_2015.pdf (accessed on 10 June 2017).
- National Renewable Energy Lab. System Advisor Model Software (SAM). Available online: https://sam.nrel.gov/ (accessed on 10 June 2017).
- National Renewable Energy Lab. Solar Prospector. Available online: https://mapsbeta.nrel.gov/nsrdb-viewer/ (accessed on 10 June 2017).
- National Renewable Energy Lab. Available online: http://pvwatts.nrel.gov/ (accessed on 10 June 2017).
- Natural Resources Canada. RETScreen. Available online: http://www.nrcan.gc.ca/energy/software-tools/7465 (accessed on 10 June 2017).
- GRASS GIS. r.sun. Available online: https://grass.osgeo.org/grass73/manuals/r.sun.html (accessed on 10 June 2017).
- Solarius PV, Solar PV System Design Software. Available online: http://www.accasoftware.com/en/solar-pv-system-design-software/ (accessed 10 August 2017).
- Teves, J.; Sola, E.F.; Pintor, B.H.; Ang, M.R.C. Assessing the urban solar energy resource potential of Davao City, Philippines, using LiDAR digital surface model (DSM) and GRASS GIS. In Proceedings of the SPIE Remote Sensing, Edinburgh, UK, 26 September 2016; p. 1000809. [Google Scholar]
- Araki, I.; Tatsunokuchi, M.; Nakahara, H.; Tomita, T. Bifacial PV system in Aichi Airport-site demonstrative research plant for new energy power generation. Sol. Energy Mater. Sol. Cells 2009, 93, 911–916. [Google Scholar] [CrossRef]
- Messenger, R.; Abtahi, A. Photovoltaic Systems Engineering; CRC Press: Boca Raton, FL, USA, 2010. [Google Scholar]
- Mukund, R.P. Wind and Solar Power Systems: Design, Analysis, and Operation, 2nd ed.; CRC Press: Boca Raton, FL, USA, 2006. [Google Scholar]
- ArcGIS Pro for Desktop, “An overview of the Solar Radiation tools”, 2016. Available online: http://desktop.arcgis.com/en/arcmap/10.3/tools/spatial-analyst-toolbox/area-solar-radiation.htm (accessed on 10 August 2017).
- Šúri, M.; Hofierka, J. A new GIS-based solar radiation model and its application to photovoltaic assessments. Trans. GIS 2004, 8, 8175–8190. [Google Scholar] [CrossRef]
- U.S. Census. U.S. Census 2010 Data. Available online: http://www.census.gov/2010census/data/ (accessed on 10 June 2017).
- Shah, K.K.; Mundada, A.; Pearce, J.M. Performance of US hybrid distributed energy systems: Solar photovoltaic, battery and combined heat and power. Energy Convers. Manag. 2015, 105, 71–80. [Google Scholar] [CrossRef]
- Dubey, S.; Sarvaiya, J.N.; Seshadri, B. Temperature dependent photovoltaic (PV) efficiency and its effect on PV production in the world—A review. Energy Procedia 2013, 33, 311–321. [Google Scholar] [CrossRef]
- Kantamneni, A.; Winkler, R.; Gauchia, L.; Pearce, J.M. Emerging economic viability of grid defection in a northern climate using solar hybrid systems. Energy Policy 2016, 95, 378–389. [Google Scholar] [CrossRef]
- Keweenaw Research Center. Available online: http://www.appropedia.org/KRC_data:MOST (accessed on 10 June 2017).
- Wilcox, S. National Solar Radiation Database 1991–2005 Update: User’s Manual; No. NREL/TP-581-41364; National Renewable Energy Laboratory (NREL): Golden, CO, USA, 2007. [Google Scholar]
- Hext, D.M. Via Personal Communication and Data Sharing Regarding Electric Bills and Airport Land Property. Houghton County Memorial Airport: Houghton County, MI, USA, 2015. [Google Scholar]
- Hecht, E.; Zajac, A. Optics 4th (International) Edition; Addison Wesley Publishing Company: Boston, MA, USA, 2002; ISBN 0-321-18878-0. [Google Scholar]
- Xi, J.Q.; Kim, J.K.; Schubert, E.F. Silica nanorod-array films with very low refractive indices. Nano Lett. 2005, 5, 1385–1387. [Google Scholar] [CrossRef] [PubMed]
- Xi, J.Q.; Schubert, M.F.; Kim, J.K.; Schubert, E.F.; Chen, M.; Lin, S.Y.; Liu, W.; Smart, J.A. Optical thin-film materials with low refractive index for broadband elimination of Fresnel reflection. Nat. Photonics 2007, 1, 176–179. [Google Scholar]
- Yan, X.; Poxson, D.J.; Cho, J.; Welser, R.E.; Sood, A.K.; Kim, J.K.; Schubert, E.F. Enhanced Omnidirectional Photovoltaic Performance of Solar Cells Using Multiple-Discrete-Layer Tailored-and Low-Refractive Index Anti-Reflection Coatings. Adv. Funct. Mater. 2013, 23, 583–590. [Google Scholar] [CrossRef]
- Kuo, M.L.; Poxson, D.J.; Kim, Y.S.; Mont, F.W.; Kim, J.K.; Schubert, E.F.; Lin, S.Y. Realization of a near-perfect antireflection coating for silicon solar energy utilization. Opt. Lett. 2008, 33, 2527–2529. [Google Scholar] [CrossRef] [PubMed]
- Chang, C.H.; Yu, P.; Yang, C.S. Broadband and omnidirectional antireflection from conductive indium-tin-oxide nanocolumns prepared by glancing-angle deposition with nitrogen. Appl. Phys. Lett. 2009, 94, 051114. [Google Scholar] [CrossRef]
- Yu, P.; Chang, C.H.; Chiu, C.H.; Yang, C.S.; Yu, J.C.; Kuo, H.C.; Hsu, S.H.; Chang, Y.C. Efficiency enhancement of GaAs photovoltaics employing antireflective indium tin oxide nanocolumns. Adv. Mater. 2009, 21, 1618–1621. [Google Scholar] [CrossRef]
- Shea, S.P. Evaluation of Glare Potential for Photovoltaic Installations, 2012. Available online: http://www.suniva.com/documents/Suniva%20Reflection%20and%20Glare%20Report%20-%20Marketing%20-%20August%202012.pdf (accessed on 8 October 2016).
- Ho, C.K.; Sims, C.A.; Yellowhair, J.; Bush, E. Solar Glare Hazard Analysis Tool (SGHAT) Technical Reference Manual. 2015. Available online: https://share.sandia.gov/phlux/static/references/glint-glare/SGHAT_Technical_Reference-v5.pdf (accessed on 10 June 2017).
- Ruesch, F.; Bohren, A.; Battaglia, M.; Brunold, S. Quantification of Glare from Reflected Sunlight of Solar Installations. Energy Procedia 2016, 91, 997–1004. [Google Scholar] [CrossRef]
- Barrett, S.; Devita, P.; Ho, C.; Miller, B. Energy technologies’ compatibility with airports and airspace: Guidance for aviation and energy planners. J. Airpt. Manag. 2014, 8, 318–326. [Google Scholar]
- Nguyen, T.V.; Ariza, A.F.; Miller, N.W.; Cremer, I. A Framework for the Development of Technical Requirements for Renewable Energy Systems at a Small-Scale Airport Facility. Proceedings of ASME 2015 9th International Conference on Energy Sustainability Collocated with the ASME 2015 Power Conference, the ASME 2015 13th International Conference on Fuel Cell Science, Engineering and Technology, and the ASME 2015 Nuclear Forum, San Diego, CA, USA, 28 June–2 July 2015; American Society of Mechanical Engineers: New York, NY, USA, 2015; Volume 2, p. V002T16A004. [Google Scholar]
- Mostafa, M.F.; Aleem, S.H.A.; Zobaa, A.F. December. Risk assessment and possible mitigation solutions for using solar photovoltaic at airports. In Power Systems Conference (MEPCON), 2016 Eighteenth International Middle East; IEEE: New Jersey, NJ, USA, 2016; pp. 81–88. [Google Scholar]
- Forge Solar Subscription Plans. Available online: https://www.forgesolar.com/pricing/ (accessed on 13 June 2017).
- Balter, B. Why Isn’t All Government Software Open Source? 2014. Available online: https://opensource.com/government/14/8/why-isnt-all-government-software-open-source (accessed on 13 June 2017).
- Finlyey, K. OPEN SOURCE WON. SO, NOW WHAT? Wired. 2015. Available online: https://www.wired.com/2016/08/open-source-won-now/ (accessed on 13 June 2017).
- Pearce, J.M. Physics: Make nanotechnology research open-source. Nature 2012, 491, 519–521. [Google Scholar] [PubMed]
- Pearce, J.M. Quantifying the Value of Open Source Hardware Development. Mod. Econ. 2015, 6, 1–11. [Google Scholar] [CrossRef]
- Pearce, J.M. Return on Investment for Open Source Hardware Development. Sci. Public Policy 2016, 43, 192–195. [Google Scholar] [CrossRef]
- U.S Energy Information Administration, October 2016. Available online: https://www.eia.gov/tools/faqs (accessed on 13 June 2017).
- DeVault, T.L.; Seamans, T.W.; Schmidt, J.A.; Belant, J.L.; Blackwell, B.F.; Mooers, N.; Tyson, L.A.; Pelt, L.V. Bird use of solar photovoltaic installations at US airports: Implications for aviation safety. Landsc. Urban Plan. 2014, 122, 122–128. [Google Scholar] [CrossRef]
- Roselund, C. Utility-Scale Solar Falls Below $1 Per Watt (w/charts). PV Magazine 2017. Available online: https://pv-magazine-usa.com/2017/06/12/utility-scale-solar-falls-below-1-per-watt/ (accessed on 13 June 2017).
Figure 1.
Defining aerial zones defined for airports, which are adapted from [60]. The lower right is the region of relevance for photovoltaics (PV) systems. The primary surface is a surface longitudinally centered on a runway shown in blue, a horizontal plane 150 ft. above the established airport elevation is shown in dark grey, and the conical surface is shown in green.

Figure 2.
Surface areas with and near the end of a runway [39], which cannot be used for PV deployment. Only surface areas coated in green can be used for PV.
Figure 2.
Surface areas with and near the end of a runway [39], which cannot be used for PV deployment. Only surface areas coated in green can be used for PV.

Figure 3.
Ariel view of Houghton County Memorial Airport (CMX) airport, with the PV deployment zones marked. Note: The four pink trapezoid zones are the restricted areas showed in Figure 1; black lines enclosed clean area, and no objects other than necessary terminal buildings are allowed in this zone; the orange line enclosed the area which is total airport land property, and; the six red pins are suggested land/sites for the deployment of solar PV systems.

Figure 4.
Percentage of reflection light from the surface of a PV module as a functional angle at the location of peak intensity. Inset: experimental setup for measurements.
Figure 4.
Percentage of reflection light from the surface of a PV module as a functional angle at the location of peak intensity. Inset: experimental setup for measurements.
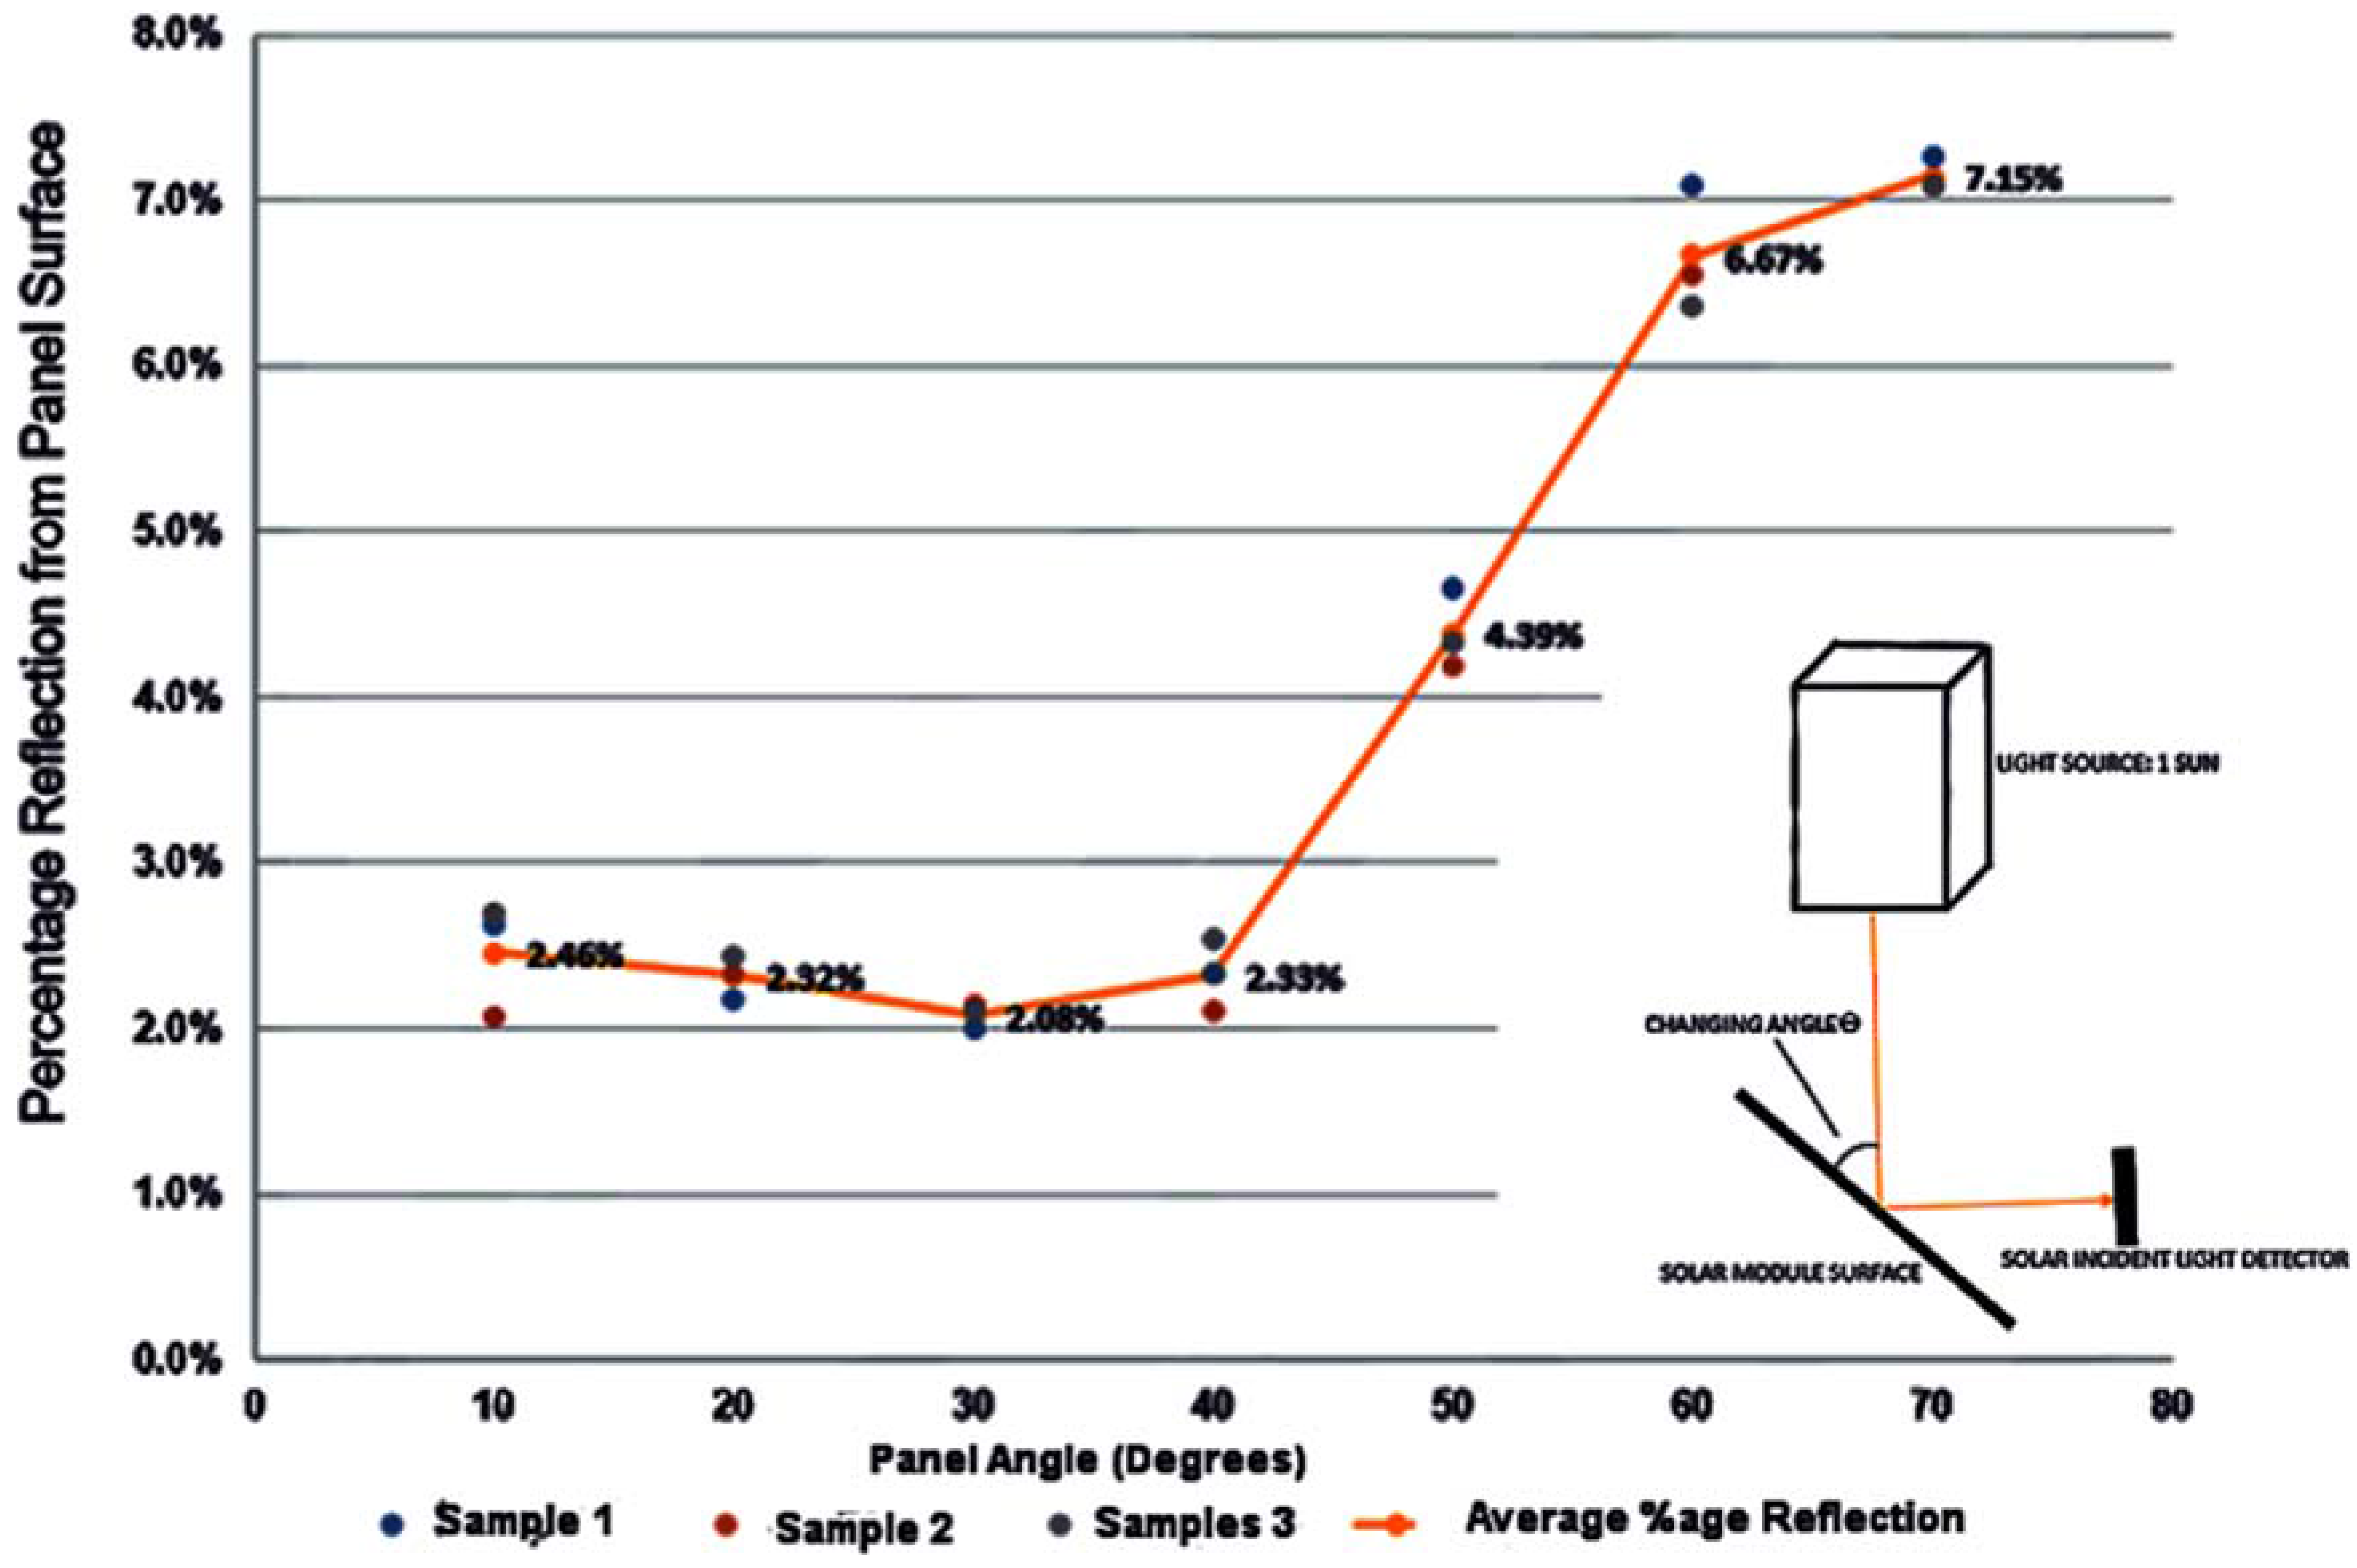
Figure 5.
Monthly energy production with production with snow losses based on the configuration of solar system.
Figure 5.
Monthly energy production with production with snow losses based on the configuration of solar system.
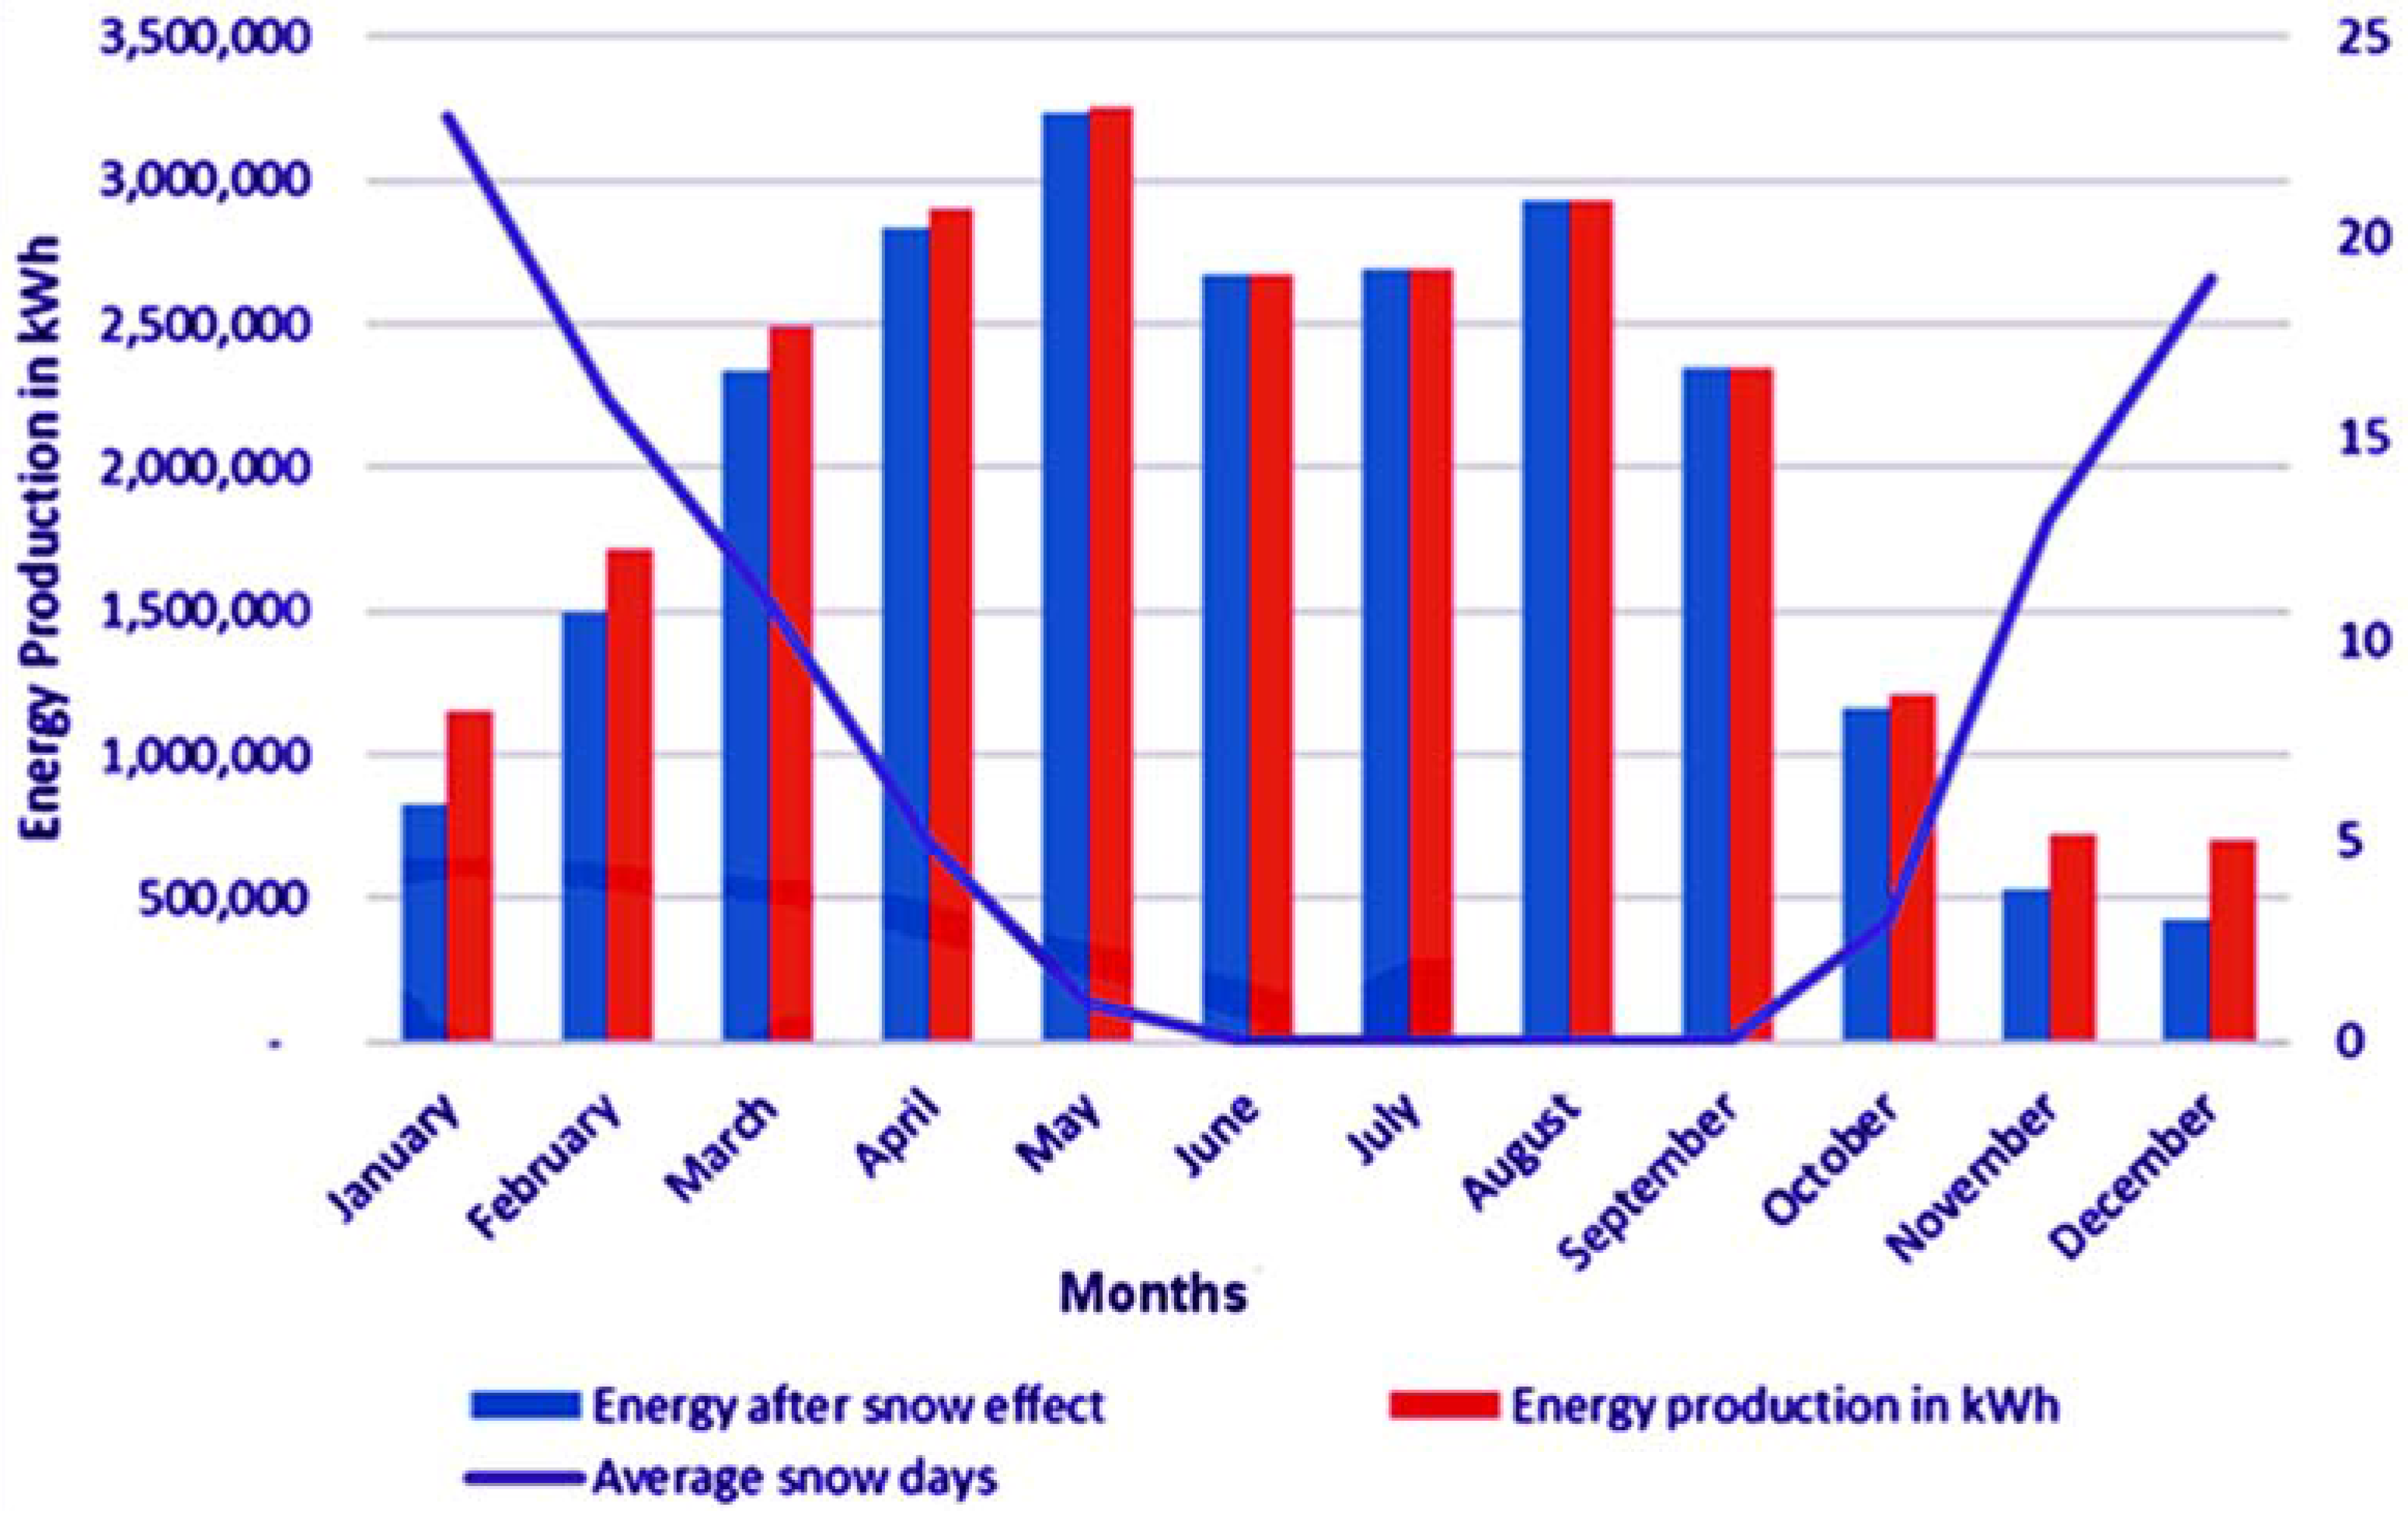
Figure 6.
CMX electrical demand for each month vs. solar electrical production (after snow losses) for case study 1 [90].
Figure 6.
CMX electrical demand for each month vs. solar electrical production (after snow losses) for case study 1 [90].


Table 1.
The sub-PV array configuration for case 1. Note: Azimuth indicates the horizontal direction of the solar array and tilt is the tilt angle of the modules with respect to the ground.
Table 1.
The sub-PV array configuration for case 1. Note: Azimuth indicates the horizontal direction of the solar array and tilt is the tilt angle of the modules with respect to the ground.
| String No. | Configuration | Description | Unit of Measurement | Details |
|---|---|---|---|---|
| 1 | String Configuration | Strings in Array | No. | 5619 |
| 2 | Tracking & Orientation | System | - | Fixed |
| 3 | - | Tilt | Degree | 45 |
| 4 | - | Azimuth Angle | Degree | 180 |
| 5 | - | Ground Coverage Ration | 0.3 | |
| 6 | Estimate of Land Area and Usage | Total Module Area | Meter square | 97,186 |
| 7 | - | Total Land Area | Acres | 80 |
Table 2.
Total demand and total bill payment of each month in 2015.
| Months | Total Demand (kWh) | Total Bill Payment (US$) |
|---|---|---|
| January | 48,507.00 | 8612.93 |
| February | 45,590.00 | 8513.88 |
| March | 42,509.00 | 8049.09 |
| April | 35,852.00 | 7149.05 |
| May | 31,336.00 | 6568.81 |
| June | 26,641.00 | 5853.03 |
| July | 33,420.00 | 6663.00 |
| August | 29,280.00 | 6138.03 |
| September | 26,817.00 | 5871.14 |
| October | 29,894.00 | 6167.57 |
| November | 32,837.00 | 6783.91 |
| December | 39,391.00 | 7549.51 |
| Total Annual Demand | 422,074.00 | - |
| Total Amount Paid | - | 83,919.95 |
© 2017 by the authors. Licensee MDPI, Basel, Switzerland. This article is an open access article distributed under the terms and conditions of the Creative Commons Attribution (CC BY) license (http://creativecommons.org/licenses/by/4.0/).
Share and Cite
MDPI and ACS Style
Anurag, A.; Zhang, J.; Gwamuri, J.; Pearce, J.M. General Design Procedures for Airport-Based Solar Photovoltaic Systems. Energies 2017, 10, 1194. https://doi.org/10.3390/en10081194
AMA Style
Anurag A, Zhang J, Gwamuri J, Pearce JM. General Design Procedures for Airport-Based Solar Photovoltaic Systems. Energies. 2017; 10(8):1194. https://doi.org/10.3390/en10081194
Chicago/Turabian StyleAnurag, Anurag, Jiemin Zhang, Jephias Gwamuri, and Joshua M. Pearce. 2017. "General Design Procedures for Airport-Based Solar Photovoltaic Systems" Energies 10, no. 8: 1194. https://doi.org/10.3390/en10081194
Note that from the first issue of 2016, this journal uses article numbers instead of page numbers. See further details here.