Status Quo of the Air-Conditioning Market in Europe: Assessment of the Building Stock


1
Institute for Renewable Energy, European Academy of Bozen/Bolzano (Eurac Research), Viale Druso 1, 39100 Bolzano, Italy
2
Climate Impacts & Modelling laboratory, ENEA, Via Martiri di Monte Sole 4, 40129 Bologna, Italy
3
Faculty of Life and Environmental Sciences, University of Iceland, Sæmundargata 2, 101 Reykjavík, Iceland
4
Energy Economics Group, Institute of Energy Systems and Electric Drives, Vienna University of Technology, Gusshausstrasse 25-29/370-3, 1040 Vienna, Austria
*
Author to whom correspondence should be addressed.
Energies 2017, 10(9), 1253; https://doi.org/10.3390/en10091253
Submission received: 29 June 2017
/
Revised: 11 August 2017
/
Accepted: 21 August 2017
/
Published: 23 August 2017
Abstract
:This study fills in knowledge gaps for the European air-conditioning (AC) market, which is fundamentally important to raising awareness about primary energy utilization. In contrast to space heating (SH) and domestic hot water (DHW) preparation, the European Union (EU) AC market is barely explored in scientific literature. While the focus of previous research has been on the residential sector, a shortfall of data for the services (wholesale and retail, offices, education, health, hotels and bars) exists. In this paper, data describing the actual space cooling (SC) market in Europe (quantity of SC units, equivalent full-load hours, installed capacities, seasonal energy efficiency values as well as cooled floor area per AC type and/or sector) is collected and explored using a bottom-up approach. Results indicate that SC is responsible for a significant portion of EU electricity consumption in households (nearly 5%) and even more in the service sector (~13%). Energy consumption for SC in the EU28 appears to be more than 140 TWh/y. The quantification of the European AC consumption shows a significant difference between the service and residential sectors: about 115 versus 25 TWh/y respectively. The SC market in Europe is characterized by a high potential for growth, especially in households.
1. Introduction
The European Union (EU) member states (MS) have committed that by 2020, they will decrease greenhouse gas (GHG) emissions by 20% from 1990 levels as well as increase the energy use produced by renewable sources (RES) to 20%. A third goal is to achieve a 20% drop in primary energy consumption through improving energy efficiency [1].
By 2030, the EU intends to further decrease domestic emissions of GHG by 40%, relative to 1990 levels. Through an integrated policy framework, EU countries will direct a coordinated approach to provide investors with sound regulatory frameworks. National policies have been designed to permanently improve energy efficiency and increase the energy produced by RES to 27% [2].
Furthermore, by 2050 the EU MS have declared the goal of decreasing GHG emissions in Europe by 80–95%, relative to 1990 levels. The fulfillment of the Paris COP21 agreement will require even higher reduction of GHG emissions, or at least at the upper boundary of this range. Industrialized countries are expected to decrease GHG emissions before developing countries; therefore, the EU MS must reassess their climate and energy policy targets [3].
Primary energy utilization at the EU level amounted to around 1600 Mtoe/y in 2014. The main source of energy consumption is through different types of heating and cooling applications: buildings´ space heating (SH), space cooling (SC) and domestic hot water (DHW) as well as industrial heat account for almost 800 Mtoe/y. Transportation and electricity usage is responsible for the remaining 800 Mtoe/y, contributing 490 and 310 Mtoe/y respectively [4,5,6,7,8].
In recent years, the EU countries have invested heavily in quantifying the energy uses of the different sectors [9,10,11]. However, in contrast to energy utilization for SH and DHW, there is almost no data available for the SC consumption portion [12].
The main sources of data collection for this study have concentrated on preceding investigations. In particular, the “Armines—Mines de Paris/Mines Paristech Graduate School” was involved in a number of projects and publications to analyze the present topic, including: (i) the Intelligent Energy Europe (IEE) projects AUDITAC (field benchmarking and market development for Audit methods in Air Conditioning) and HARMONAC (harmonizing air-conditioning (AC) inspection and audit procedures in the tertiary building sectors); (ii) the ERAC (energy efficiency of room air-conditioners) and EECCAC (Energy Efficiency and Certification of Central Air Conditioners) reports; as well as (iii) a number of relevant publications in this field—e.g., [13,14,15,16,17,18].
An additional important information repository is given by CIRCABC (Communication and Information Resource Centre for Administration, Businesses and Citizens) of which especially Lot 6—AC and ventilation as well as Lot 10—air-conditioners, comfort fans, residential ventilation are of relevance for the present investigation [19].
Other important information sources were also used. They are: the IEE projects SOLAIR (Solar AC) and Stratego (Multi-level actions for enhanced Heating and Cooling plans), the Sixth Framework Programme Project POLYSMART (polygeneration with advanced small and medium scale thermally driven AC and refrigeration technology), the Seventh Framework Programme project iNSPiRe (Development of Systematic packages for Deep Energy Renovation of Residential and Tertiary Buildings including Envelope and Systems), the International Energy Agency project ANNEX 34 (Thermally Driven Heat Pumps for Heating and Cooling) as well as the Horizon 2020 project HRE4 (Heat Roadmap Europe 4) [20,21,22,23,24,25].
While the previously noted data sources provide information on employed technologies for SC purposes, related energy consumption values and market figures within Europe, until now a clear picture of the SC market in the EU has been missing.
2. Materials and Methods
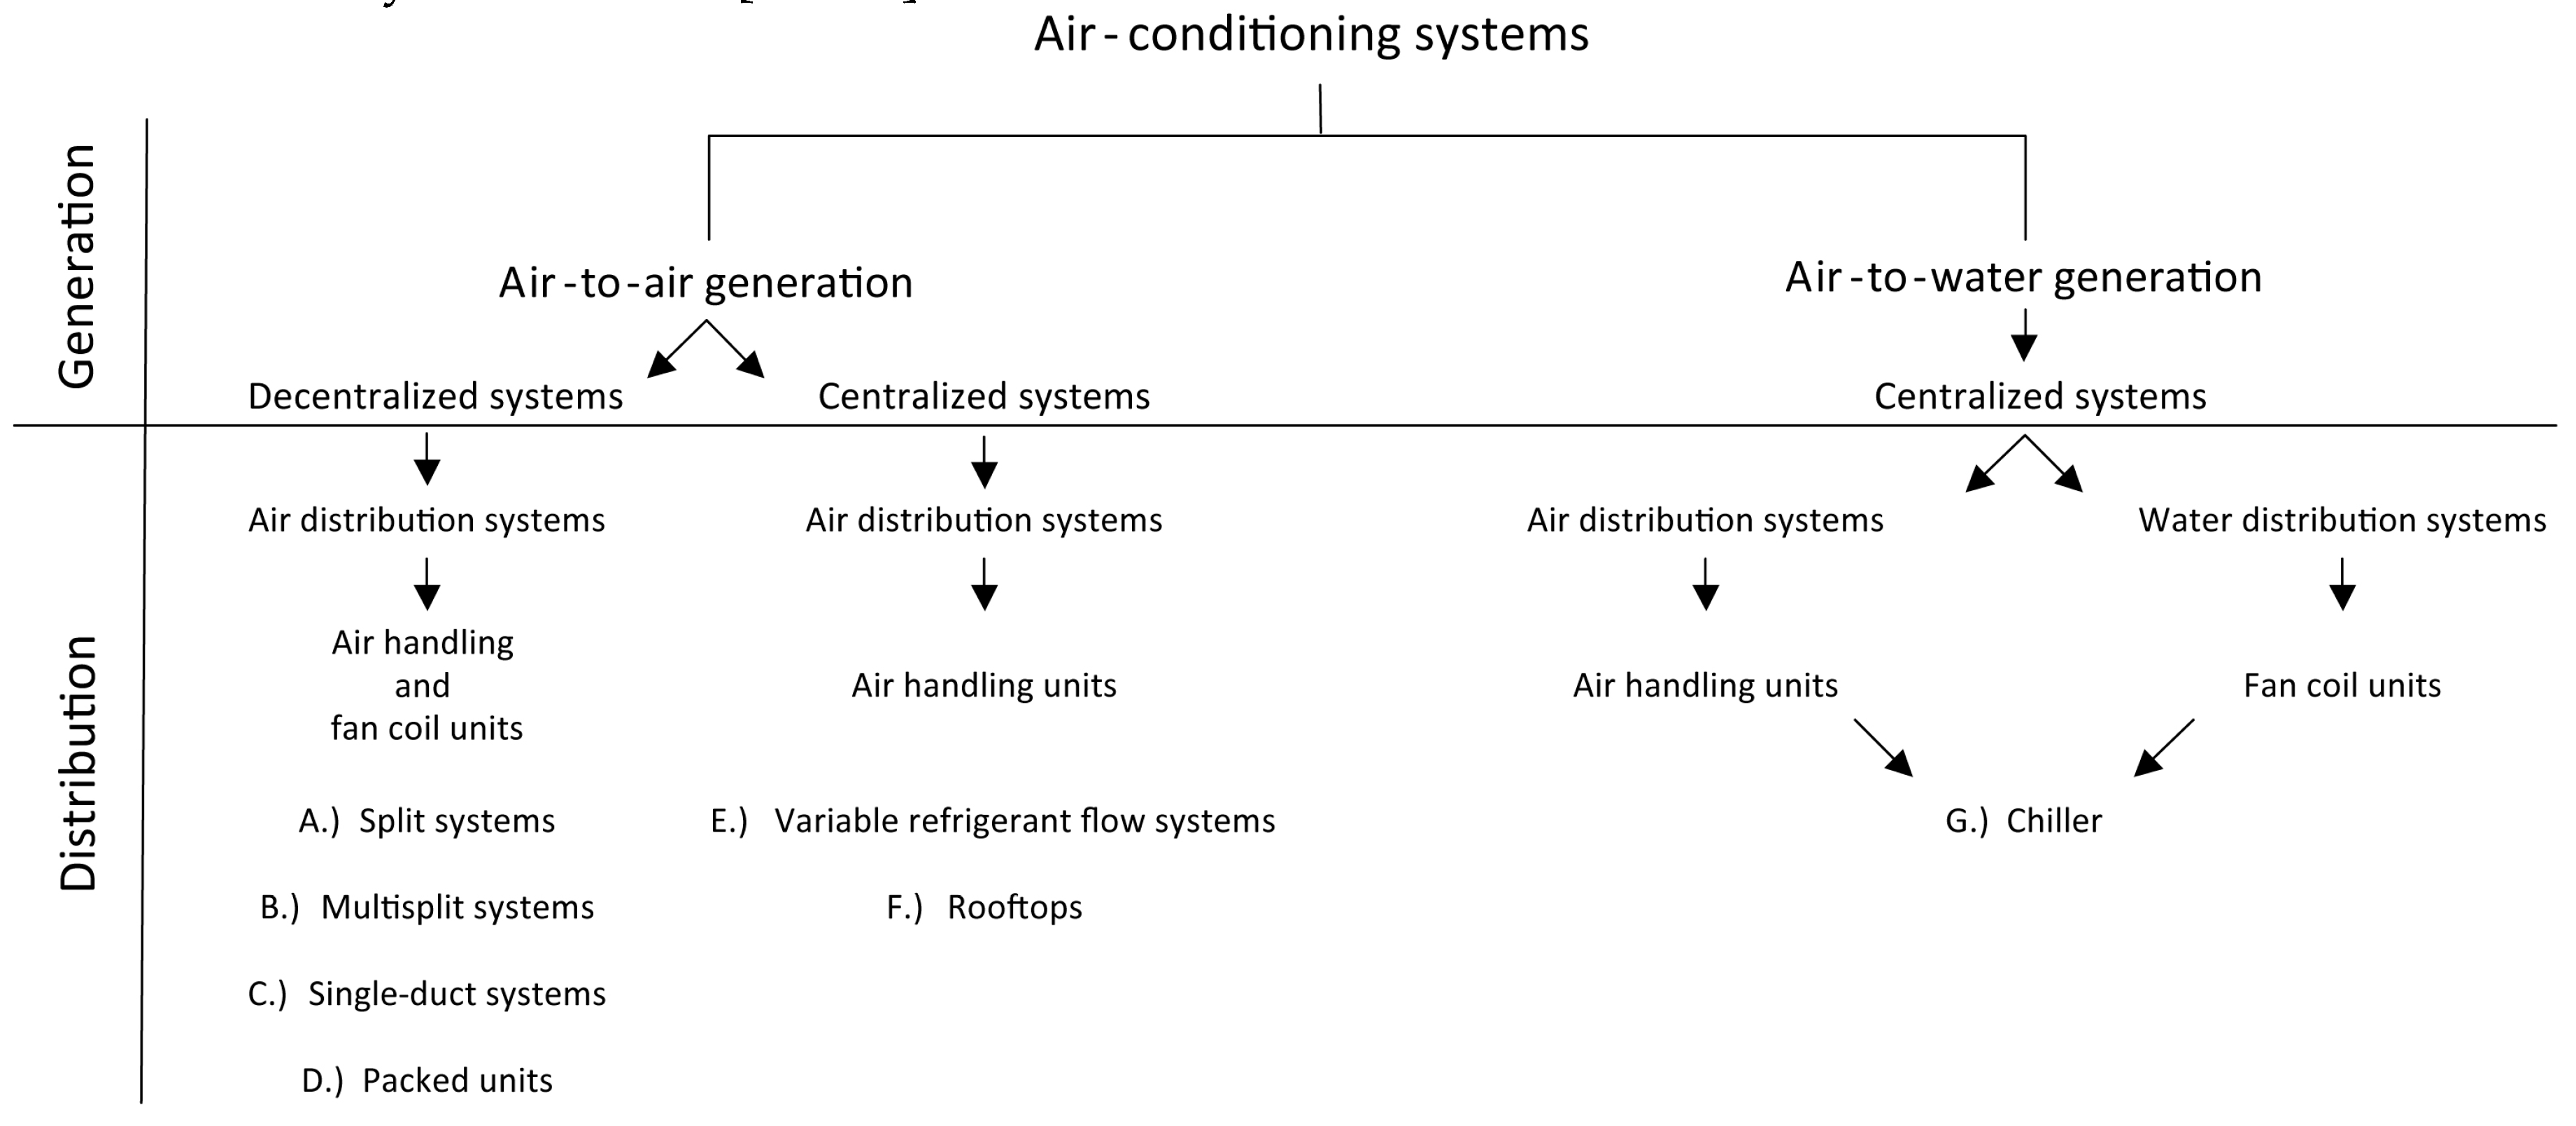
First, different AC technologies installed in Europe have been analyzed. Due to finding a number of literature sources indicating a significantly different classification of AC types, a breakdown following diverse SC generation (air-to-air or air-to-water) and distribution systems (decentralized or centralized) has been carried out. Figure 1 summarizes the breakdown structure for different AC application. Letters A–G have been assigned to denote the various AC technologies within the scheme. (Ventilators as well as natural cooling/passive cooling/natural ventilation technologies, and thermally driven heat pumps (TDHPs), have not been taken into consideration. The reason for this is that there is the perception of a cooling effect during ventilation as air moves across the skin and dries sweat. However, in contrast to room air-conditioners (RACs) and centralized air-conditioners (CACs), ventilation alone cannot lower the indoor temperature below the ambient temperature [32]. With regard to TDHPs, the current market penetration is negligible compared to electrically driven heat pump systems [33,34,35].) Figure 1 shows the utilization of air handling units (AHUs) and fan coil units (FCUs) for the various AC equipment. AHUs condition the outdoor/recirculating air, supply the conditioned air to the conditioned space and extract the return air from the space through ductwork and space diffusion devices. In contrast, FCUs are factory made assemblies, which provide the function of SC air by using chilled water or refrigerant with air flowing to spaces, ensured by local electrically driven fans [12,13,14,15,16,17,18].
As is visible in Figure 1, given technology mix analysis for SC purposes in Europe indicates four different types of RACs:
- Split systems (A);
- Multisplit systems (B);
- Single-duct systems (C);
- Packed units (D);
As well as three diverse kinds of CACs:
- Variable refrigerant flow systems (E);
- Rooftops (F);
- Chiller (G).
So-called portable units relate to (C) single-duct systems. Single-duct system are appliances in which the condenser rejects hot air to the outside by a duct. Generally, these are movable AC systems, but in order to operate they must be close to an envelope hole (e.g., door or window) through which the hot air is directed by a duct [12,15,16].
Beginning from the given AC technologies breakdown, an analysis of the SC market has been performed. With regard to the various AC technologies, different sectors (residential, and various service sectors: offices, wholesale and retail, education, health and hotels and bars) have been taken into consideration. It is important to clearly define the different sectors [39]:
- Residential sector: includes occupied or unoccupied dwellings (single-family houses, multi-family houses and apartment blocks) and mobile homes. Institutional housing such as school dormitories, hostels, hotels, health, military barracks, and night shelters are excluded;
- Offices: composed of private company and public sector offices;
- Wholesale and retail: consists of detached shops, department stores, shopping centers, retail, food shops, car sales and maintenance, bakeries, hairdresser, service stations, laundries, congress and fair buildings, and other wholesale and retail infrastructures;
- Education: contains primary, secondary and high schools. Furthermore, also universities, infrastructure for professional training activities, and research centers/laboratories are part of this sector;
- Health: comprises private and public health, homes for handicapped, medical care and nursery;
- Hotels and bars: include hotels, cafés, pubs, restaurants, canteens, and catering in business.
How the different AC technologies, equivalent full-load hours, cooled floor area and number of AC units installed are distributed between the sectors named above was analyzed. Further classification identified which kind of SC units these are, their installed capacity, their seasonal energy efficiency ratio (SEER) values and yearly hours of operation per sector. In order to retrieve reliable values, within the indicated bottom-up approach, an extensive literature analysis has been performed.
Only scientific literature sources have been utilized for data collection (see Appendix A, Table A1, Table A2, Table A3, Table A4 and Table A5 and respective sources). All collected information have been filtered and evaluated statistically. As far as the number of sources allowed, data which lie outside a range of plus or minus one standard deviation around the average of the respective data pool have been discarded. The filtered values have then been used to compute a more robust average. Respective calculations are shown in the Appendix A (Table A1, Table A2, Table A3, Table A4 and Table A5)—the outcome of the statistical elaboration can be found in the “Results” column.
Moreover, the work input (electricity) per AC type has been calculated. To obtain these values, the average capacities per AC type have been divided through their respective SEER means. While the energy efficiency ratio (EER) is measured under rated load conditions, the SEER has been selected, because it reflects the real usage conditions of the AC equipment for the SC season over a year [16,40,41].
The SEER indicates the whole heat amount removed from the conditioned space during the entire annual AC season (Qcold, season), divided by the total work input (electricity) of the SC machinery during the same period (Welectricity, season) [40]. See Equation (1):
SEER = Qcold, season/Welectricity, season
Finally, the electricity consumption by AC type and sector has been calculated. To obtain the yearly energy consumption for SC purposes and sector, the quantity of SC units per sector has been multiplied by their average equivalent full-load hours (T: time) within a year and its work input (electricity). See Equation (2):
Energy consumptionSpace cooling = Nr. AC units * Tequivalent full-load hours * Welectricity
Due to input data for Equation (2) only being available for the EU15, initially values concerning these MS have been collected. Then the obtained results have been projected for the entire EU28. Approximately 90% of the EU28 SC consumption is caused by EU15 states [41]. Thus, to obtain Figure 2 and Figure 3 for the entire EU28, results for the EU15 have been multiplied by 1.1. In this regard, it has to be underlined that the EU15 countries account for around 80% of all EU inhabitants [42].
Looking at the data published within the past two decades, the most significant contribution comes from the “Armines—Mines de Paris/Mines Paristech Graduate School” investigations concerning the distribution of diverse AC application across Europe´s building stock [13,43,44]. Thus, Figure 4 has been adapted from the latter mentioned source.
The service sector related columns in Figure 3, Figure 5 and Figure 6 have been calculated as a simple mean of the different corresponding service sectors, while the service part column in Figure 7 has been obtained by weighting the SC equivalent full-load hours of the different service sectors with the related cooled floor area.
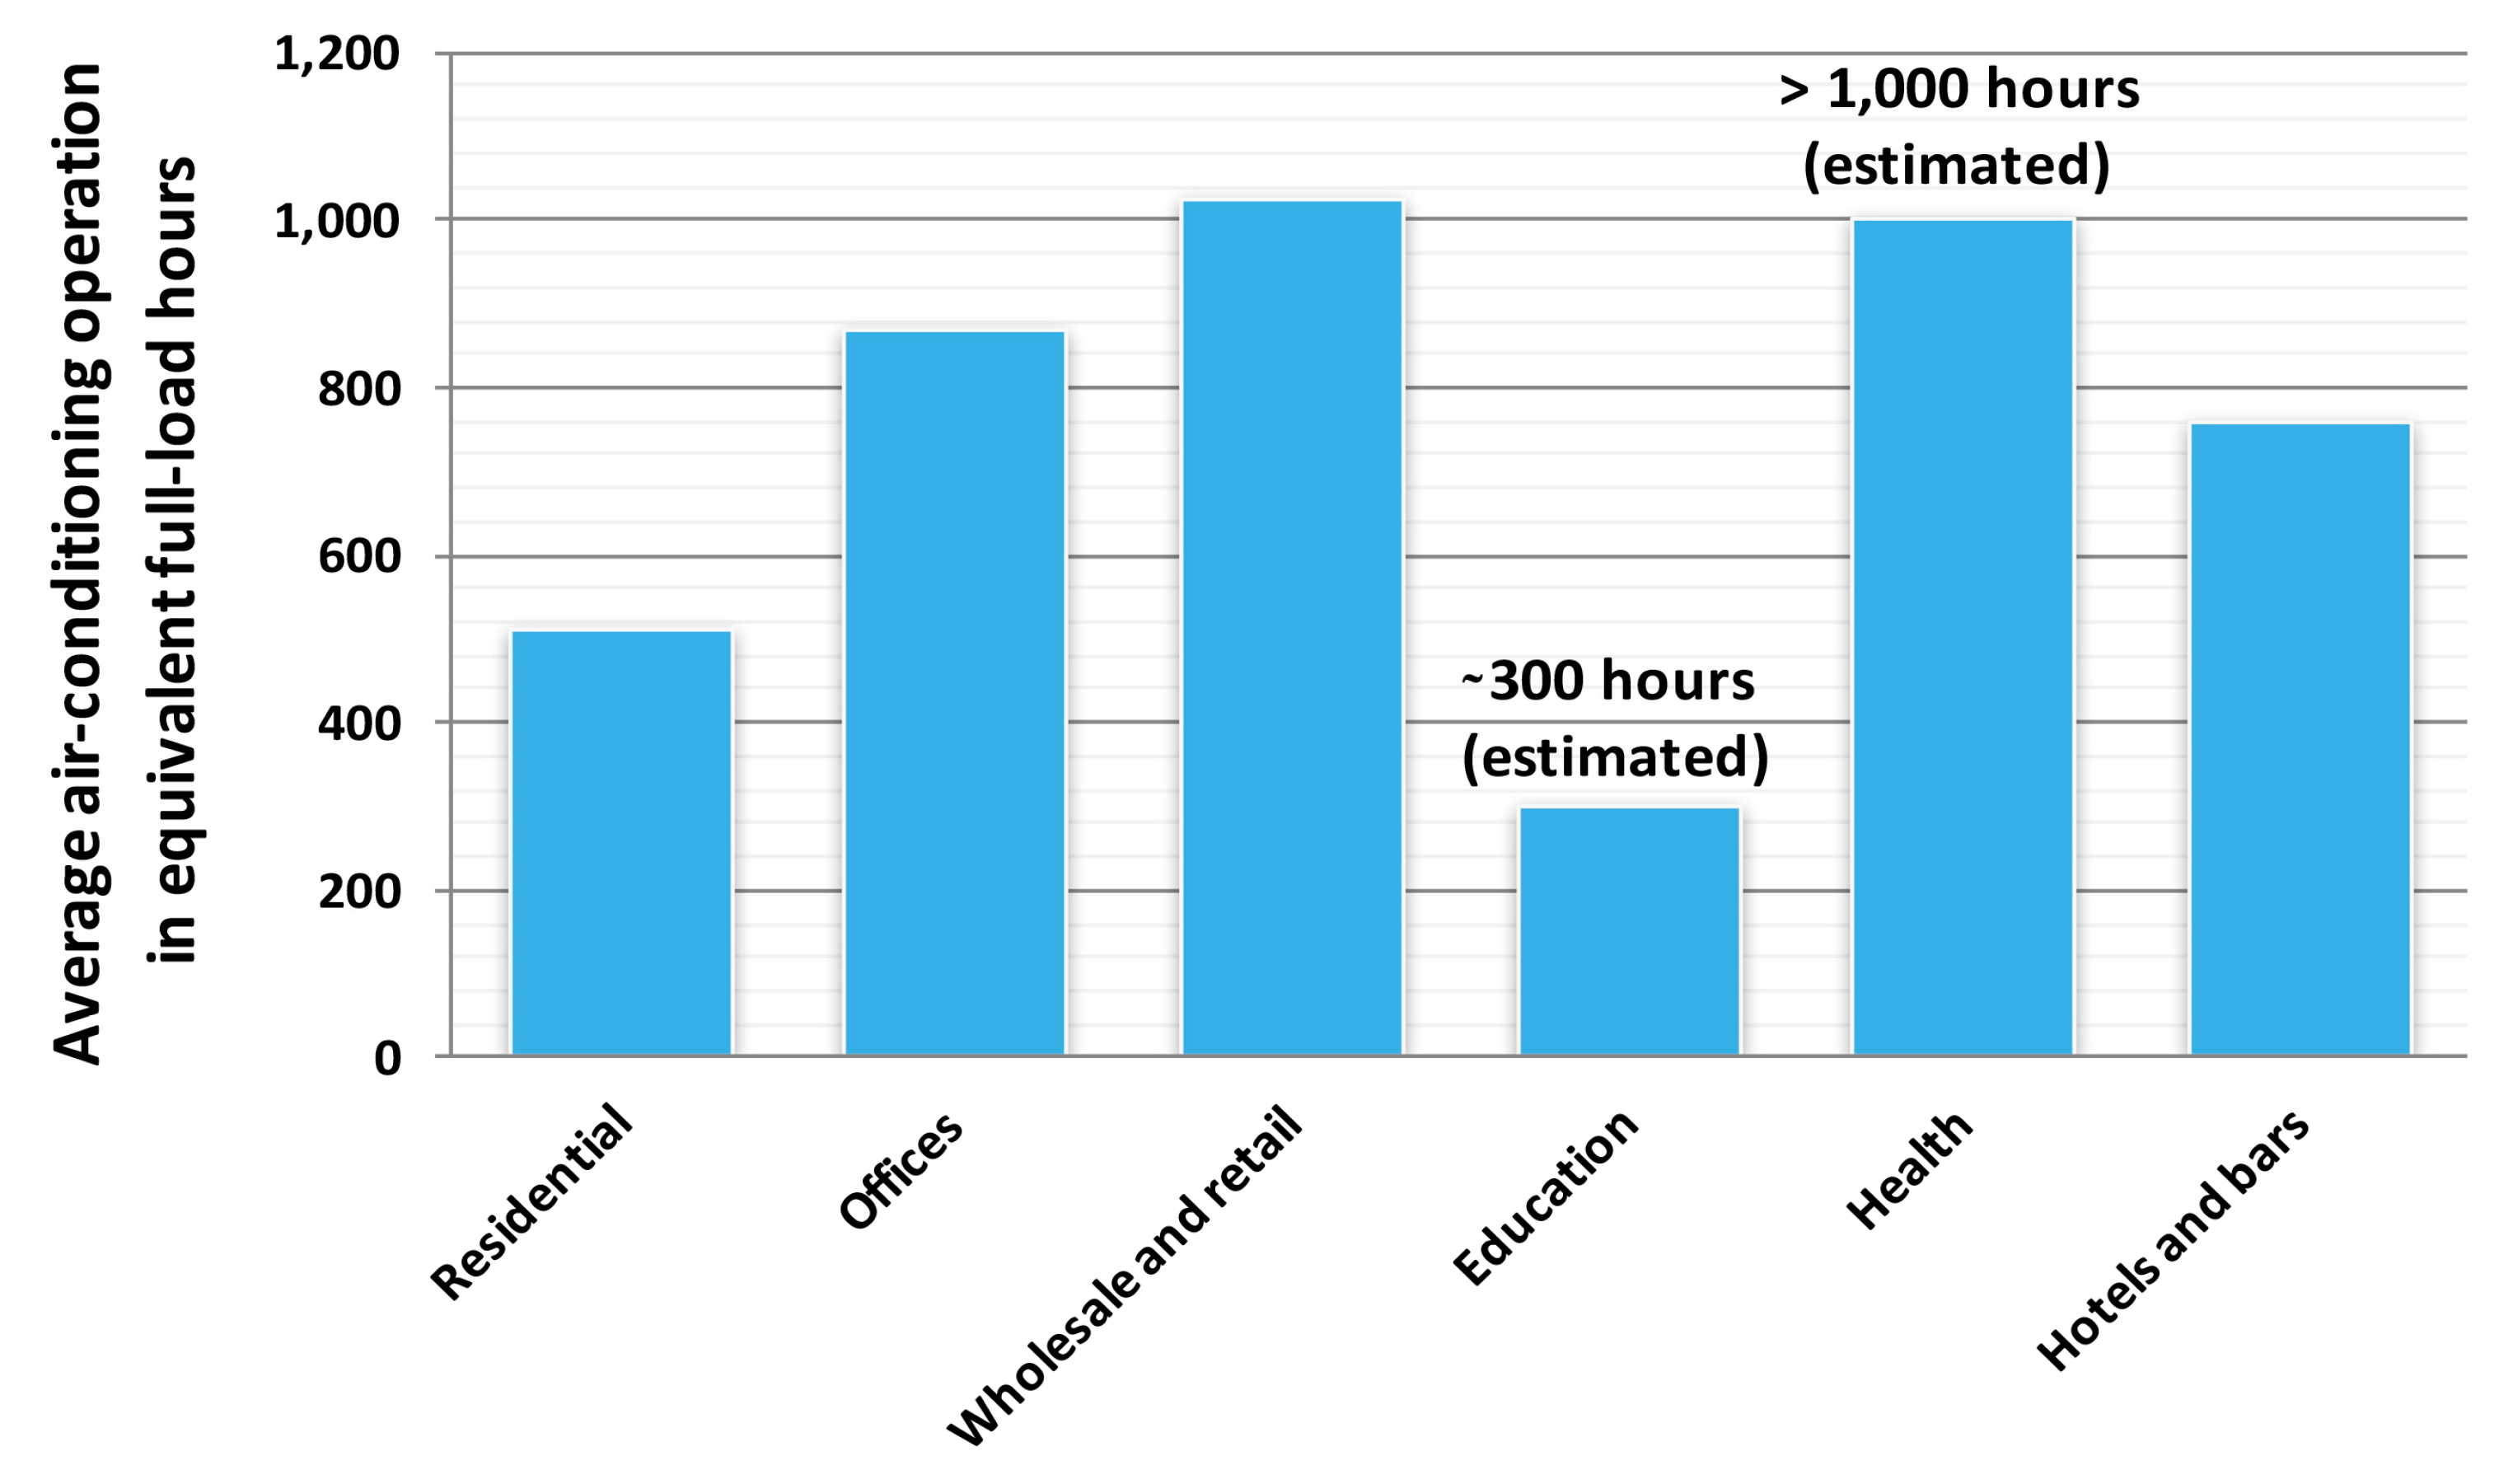
With regard to Figure 8, it was not possible to find any source with indications concerning the average AC equivalent full-load hours for the education and health sectors. However, for the health sector a number of case studies have been found studying AC application in Austria and Italy [45,46,47]. Taking into consideration these cases, the health sector has been estimated to require more than 1000 equivalent full-load hours of SC a year.
The total amount of energy consumption from two separate sources was used to estimate the average amount of AC used in the educational sector [16,36]. Both sources indicate a total AC energy consumption value for this sector of about 6 TWh/y. This available data makes it possible to use Equation 2 to identify the average equivalent full-load hours in the education sector. The result is equal to approximately 300 equivalent full-load hours.
In order to obtain the final energy consumption of different room air-conditioning (RAC) technologies in Figure 2 and Figure 3, the RACs distribution given in Figure 4 and Figure 5 have been equally allocated among sectors based on previous studies’ indications [13,16,44]: 62% split systems, 5% multisplit systems, 16% single-duct systems, and 17% packed units.
3. Results
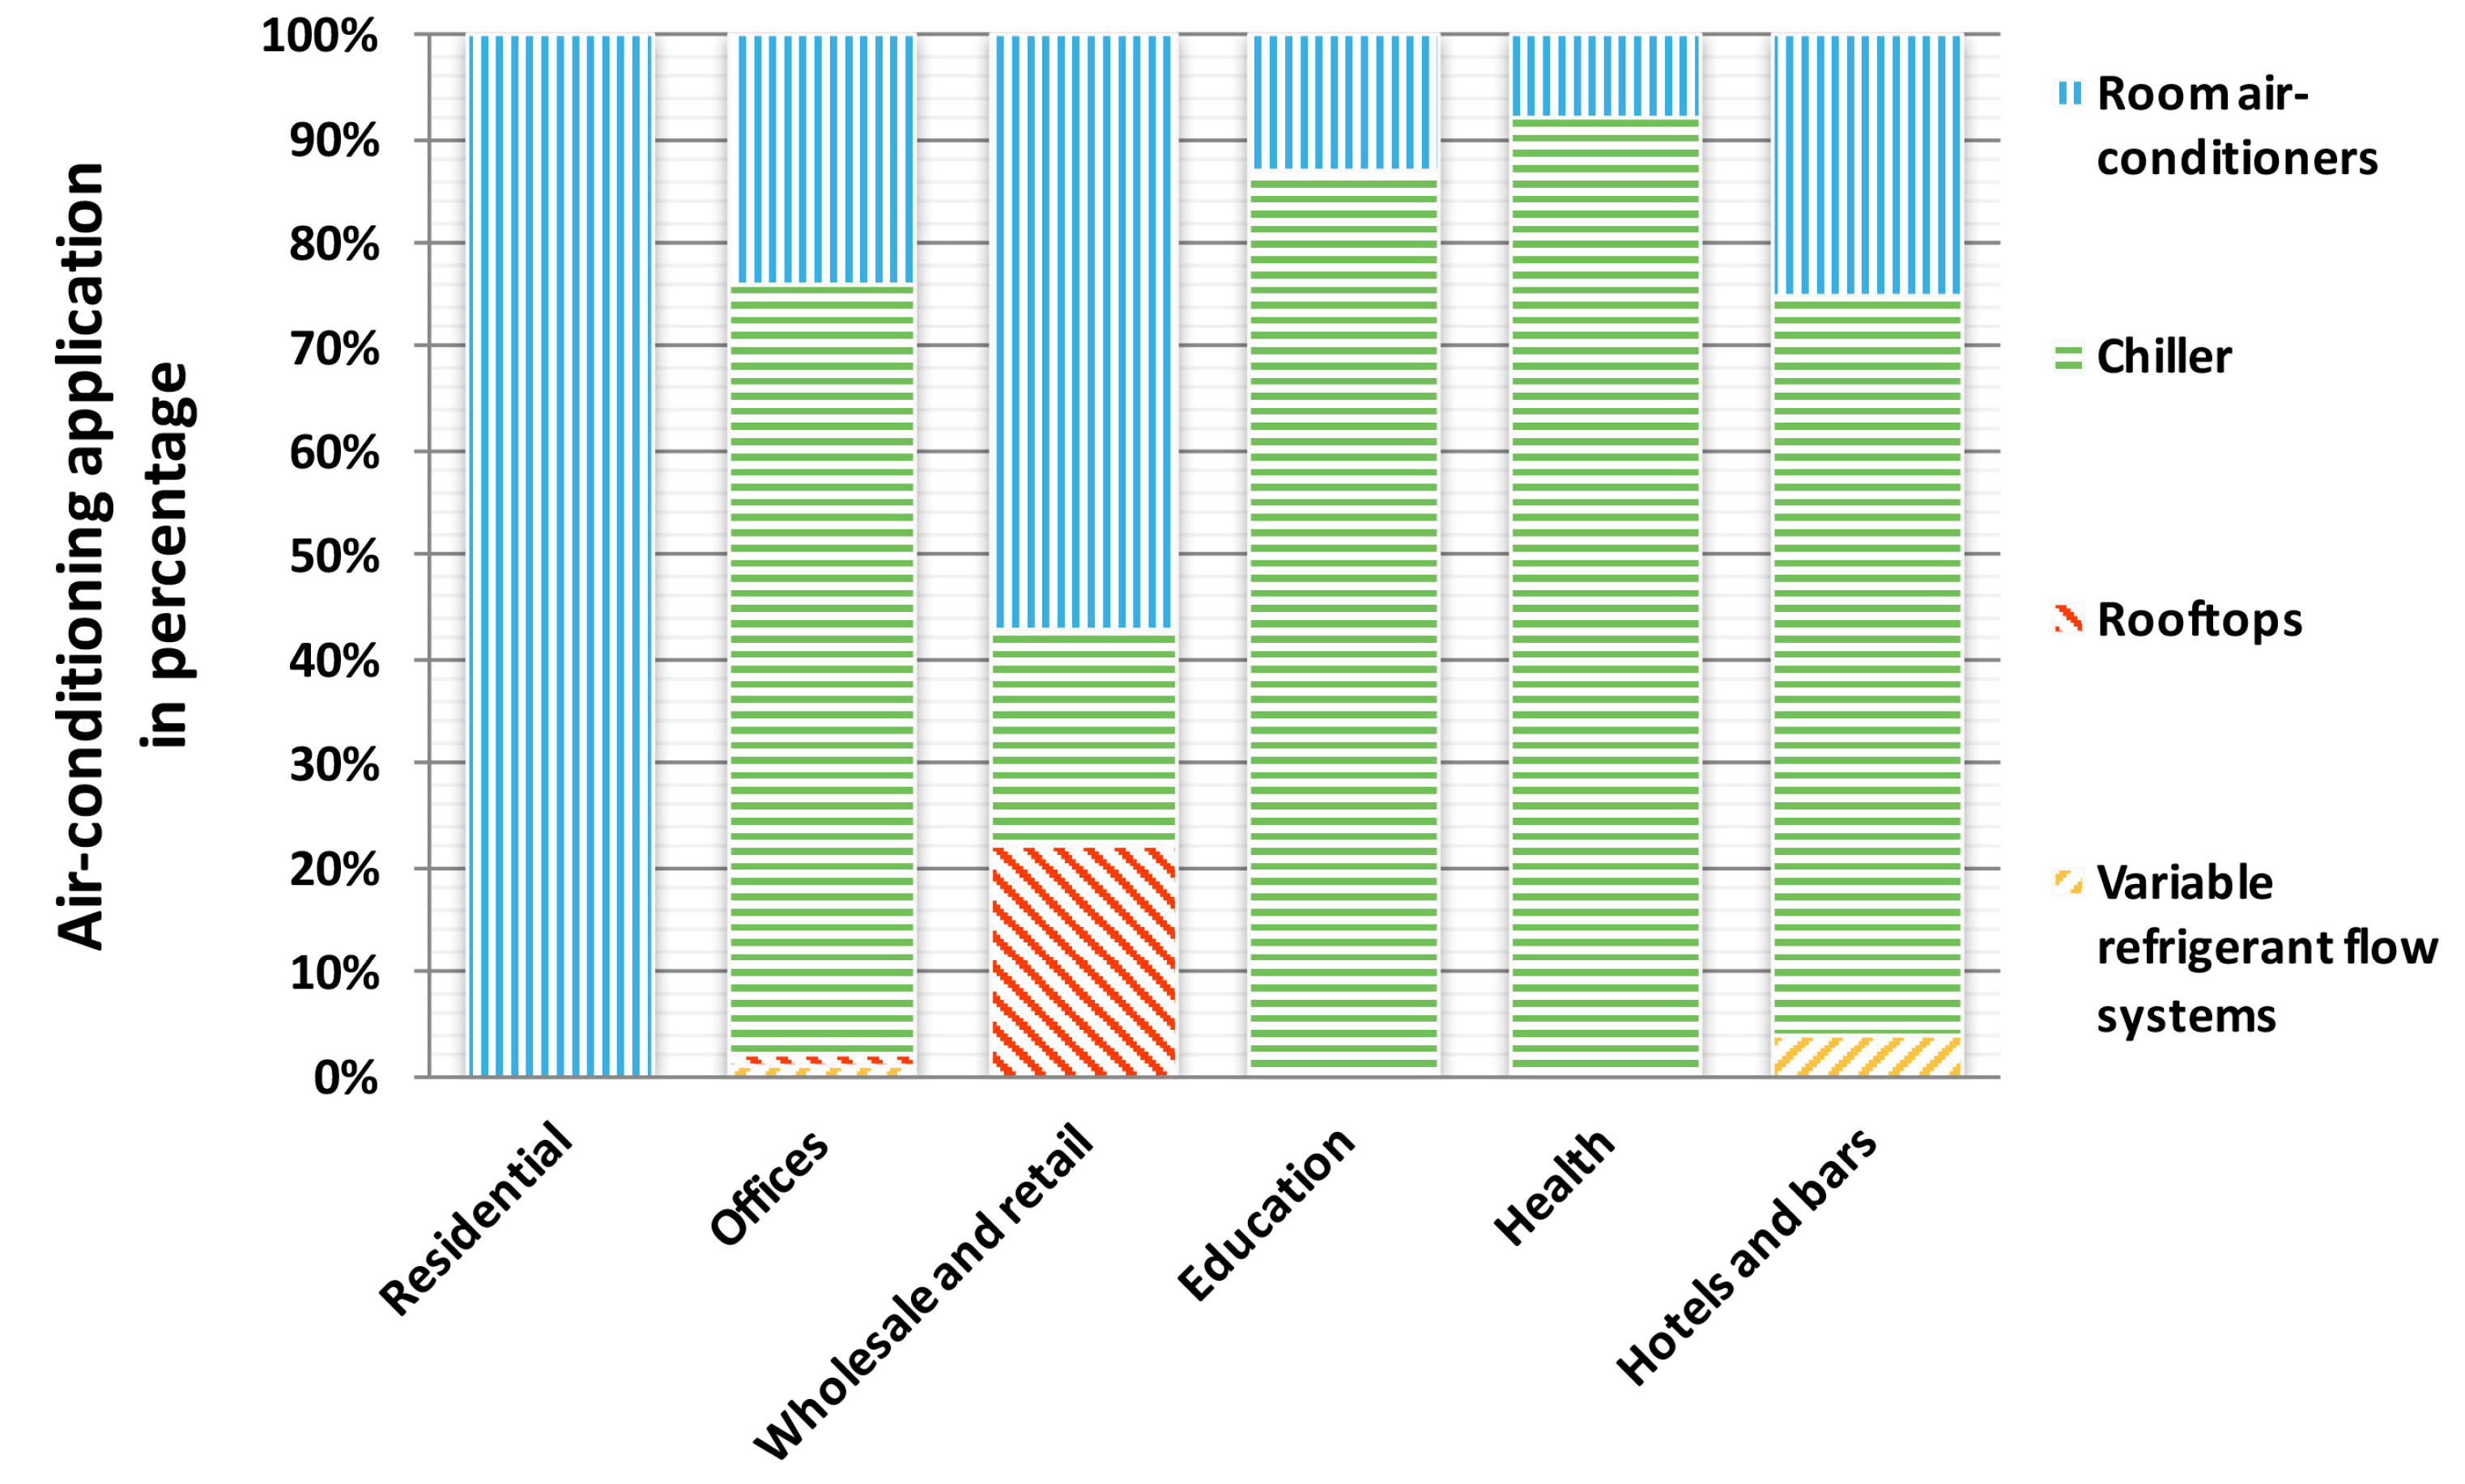
Figure 4 visualizes the distribution of SC equipment within different sectors in percentage.
In Figure 4 it is particularly striking, that the residential sector is dominated exclusively by RAC application. A possible reason for this could be that within dwellings only certain rooms are air-conditioned rather than providing the whole dwelling with SC.
The office sector is the only one including all four types of AC equipment. RAC units are present in all sectors, while chiller appear only within the service sectors. Chiller systems dominate almost all service sectors—wholesale and retail is the exception, where RAC application show the majority of units installed.
The highest percentage of AC application is provided by chiller, followed by RACs with around 1/3 less share. Rooftops come next, characterized by a value of about 1/10 that of RACs. Variable refrigerant flow (VRF) systems are found in the last position with a relative significantly low presence of less than 1/5 compared to rooftops.
Figure 4 also displays the distribution of centralized air-conditioning (CAC) systems in large mono-use buildings (e.g., entire office buildings, hospitals—health and hotels) and RAC units in infrastructures, where single room application are requested (e.g., small shops).
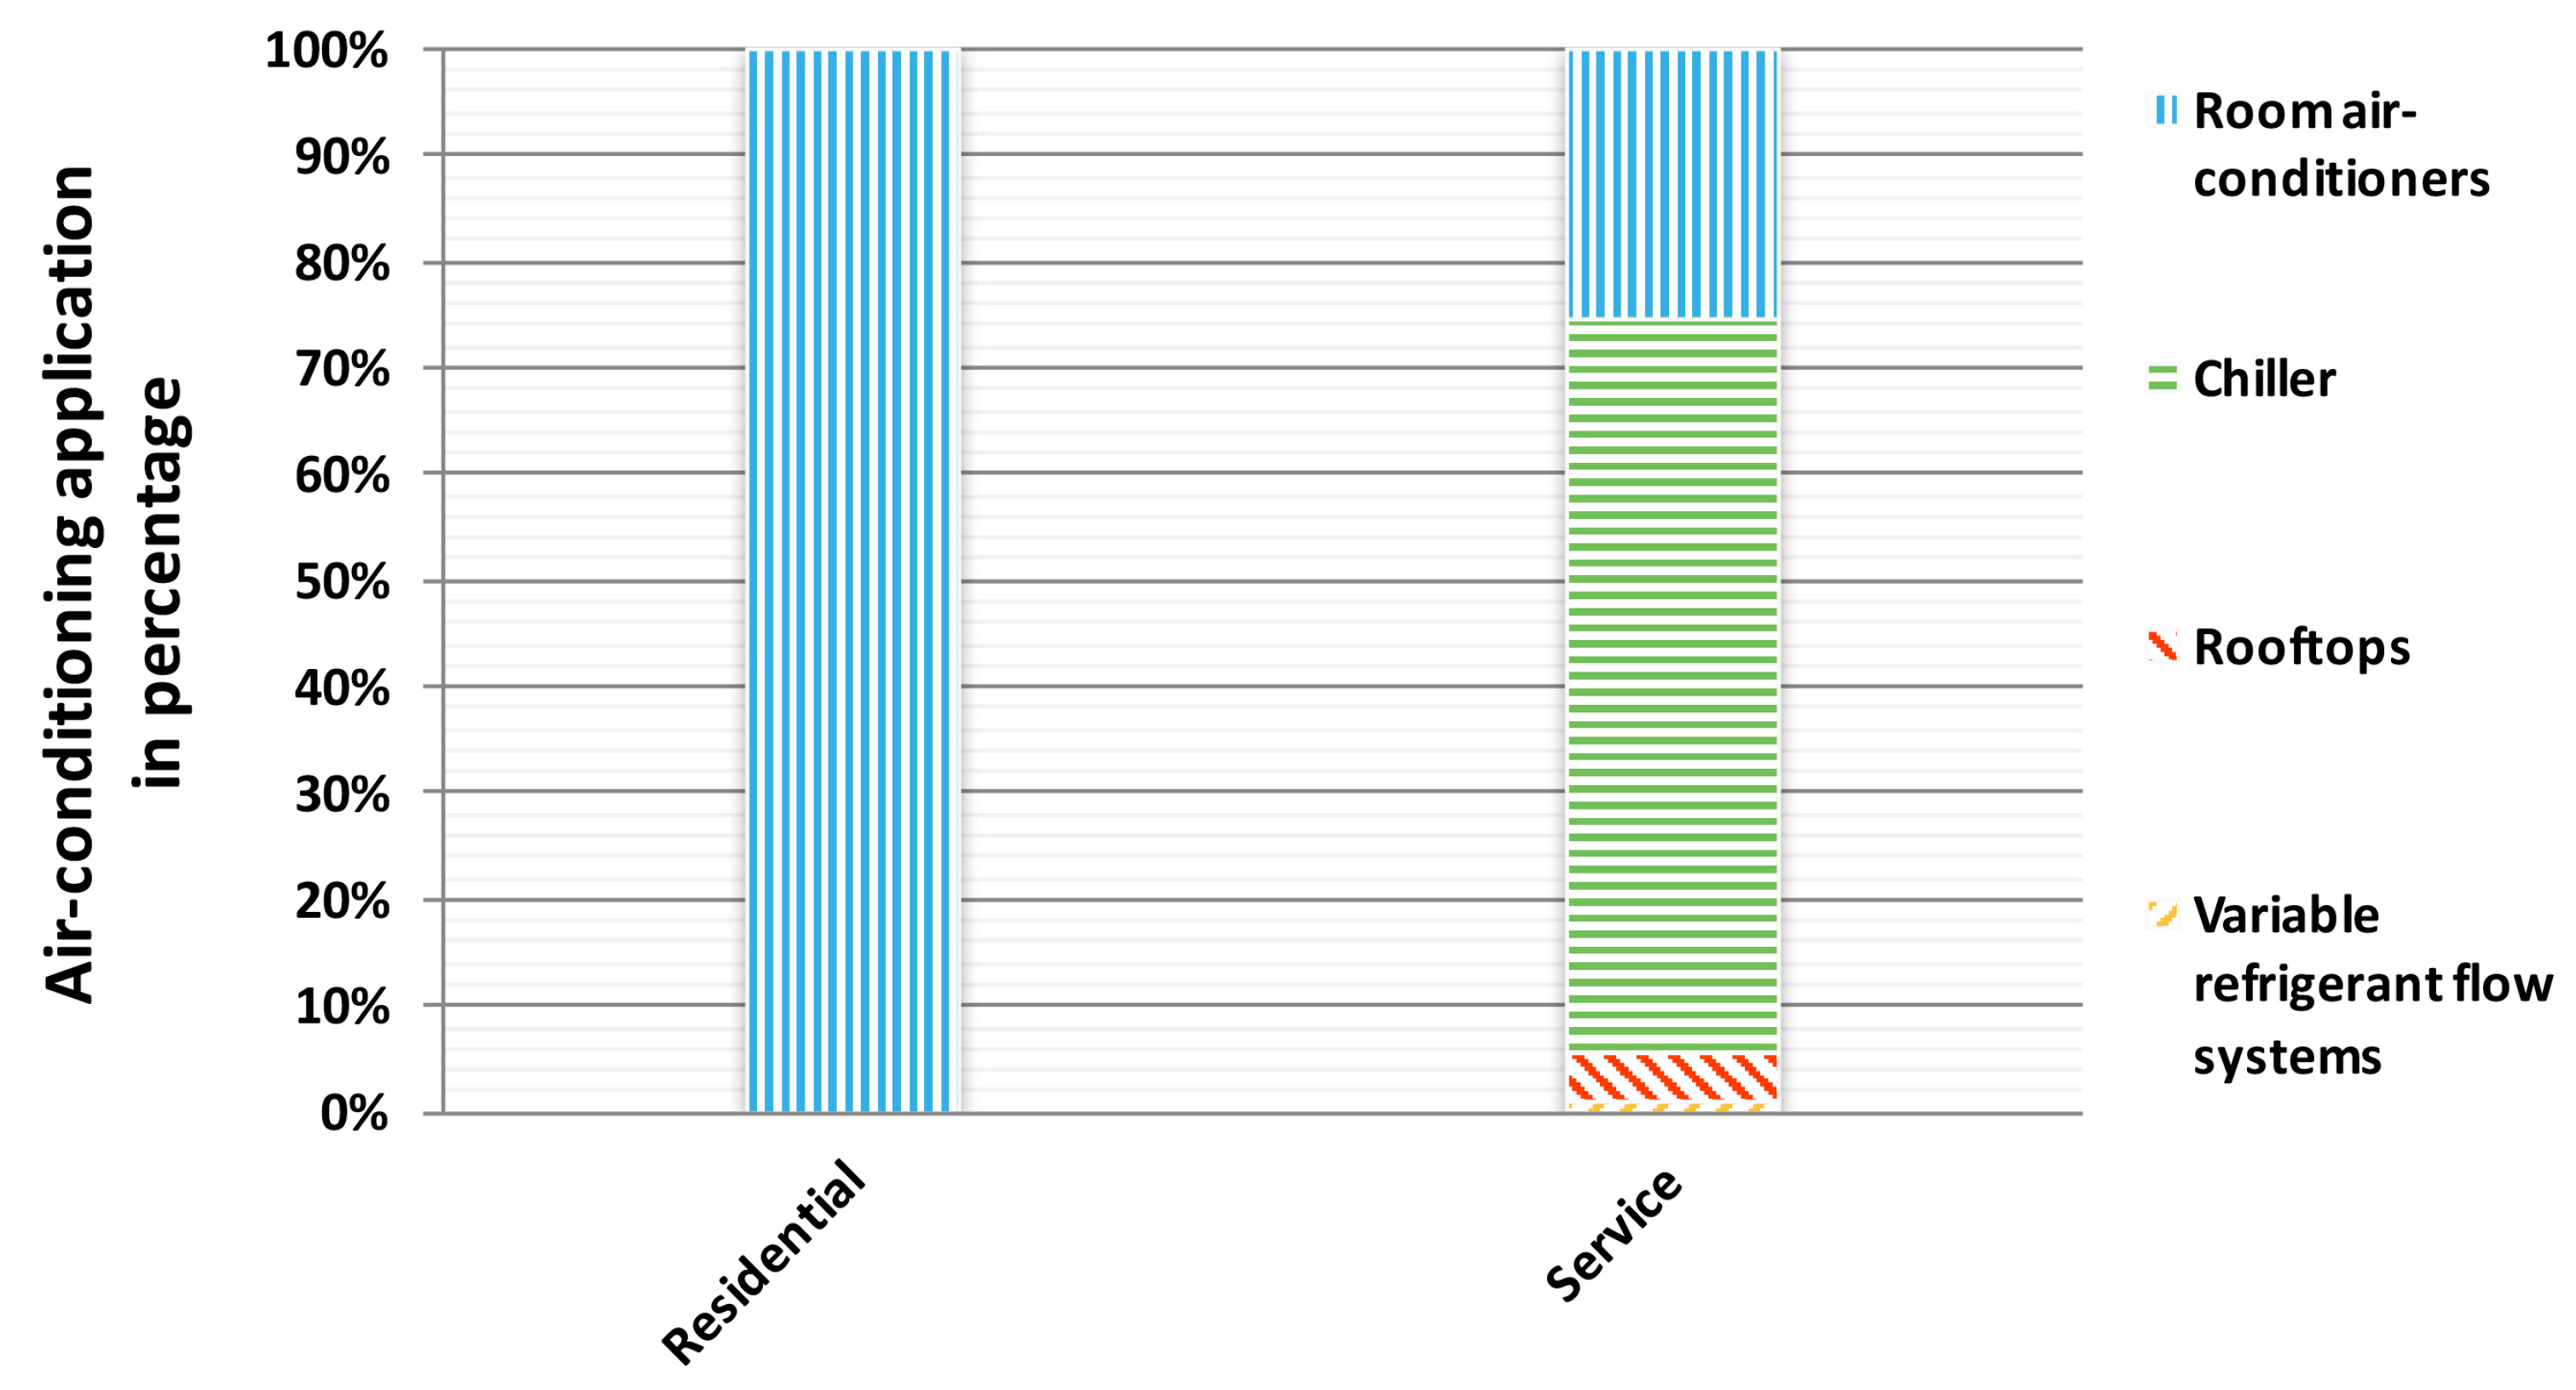
If the distribution of installed AC application by sector and type in percentage is reduced to the residential and service sectors only, the dominance of chiller in the service sector appears clearly. They represent ~70% of AC units installed (Figure 5).
RAC units are the second most utilized within the service sector with approximately 1/3 as many applications as chiller. Rooftops and VRF systems are the least utilized, showing values around 5% and 1% respectively.
As previously mentioned, the distribution of the cooled floor area per sector and AC type has also been retrieved. Figure 9 visualizes the amount of cooled floor area per sector and AC type in million square meters (Mm2).
The residential sector has the highest amount of cooled floor area, followed by wholesale and retail and offices with approximately 50% fewer cooled square meters. The education, health, and hotels and bars sectors come next with about one fourth of the cooled floor area given for households.
Concerning the AC typologies which cover most air-conditioned floor area, first the RAC units have to be mentioned—with more than 2200 Mm2. These are about half of the total cooled square meters within the considered sectors: almost 4400 Mm2. Chiller are in second place, providing SC for more than 1000 Mm2. Rooftops and VRF systems follow, covering about 600 Mm2 each.
Figure 6 shows the distribution of cooled floor area per type within the residential and service sectors.
As is visible in Figure 6, the cooled floor area of all service sectors together exceeds significantly that of the residential sector: by almost two times. In this regards, it has to be stressed that out of the total residential floor area only 4% is cooled while in the service sector 30% of the floor area is cooled [45,46,47,48,49,50].
As shown in Figure 6, chiller are responsible for nearly 35% of the air-conditioned floor area in the service section. Rooftops are responsible for 25% of cooled floor area, while VRF systems and RACs account for 20% each.
Comparing Figure 5 and Figure 6, the percentage of CACs in the service sector based on typology of units installed is higher than the one based on the cooled floor area. A possible reason for that could be that CACs are able to cover a larger number of cooled square meters per unit installed than RACs.
Figure 8 shows the mean equivalent full-load hours per sector of the various SC systems.
The wholesale and retail and health sectors have the highest average AC equivalent full-load hours, followed by offices and hotels and bars with about 20% less operation time. The residential sector is placed at the fifth position with an operation time 50% lower than that of wholesale and retail. The education sector is last with approximately 70% fewer equivalent full-load hours than wholesale and retail and health. A possible reason for the latter value could be that the considered EU15 countries are characterized by vacations for students during the hottest period of the year, which vary from more than one to over three month [51,52,53].
If the average AC equivalent full-load hours get compared between residential and service, the service results to have around 350 equivalent full-load hours more than the residential (Figure 7).
Figure 10 provides information concerning the number of installed AC units per type.
Split systems account for the majority of AC units per type with more than 30 million (Mil.) installed applications. Packed and single-duct systems follow with approximately 9 and 8 Mil. systems respectively. The least represented RAC type are multisplit systems, with less than 3 Mil. units.
The amount of installed CAC systems is in order: 1.15 Mil. chiller, 0.5 Mil. VRF systems and finally 0.2 Mil. rooftops. Summing up, there are almost 60 Mil. installed AC units within the EU15.
Figure 11 indicates the average installed capacity per AC type and sector in kW.
Centralized AC systems are characterized by a larger mean installed capacity than RAC units, because as previously mentioned, CACs are applied to provide SC for entire buildings, while RACs are used to cover SC necessities in single rooms.
Average values for chiller, rooftops and VRF systems are around 140, 40 and 20 kW each. Multisplit systems have the largest average installed capacity within RACs, representing approximately 16 kW, followed by single-duct systems with about 11 kW. The penultimate and last positions are packed and split systems with ~5 and 4 kW respectively. Hence, split systems are at the same time the most widely diffused and smallest capacity AC systems.
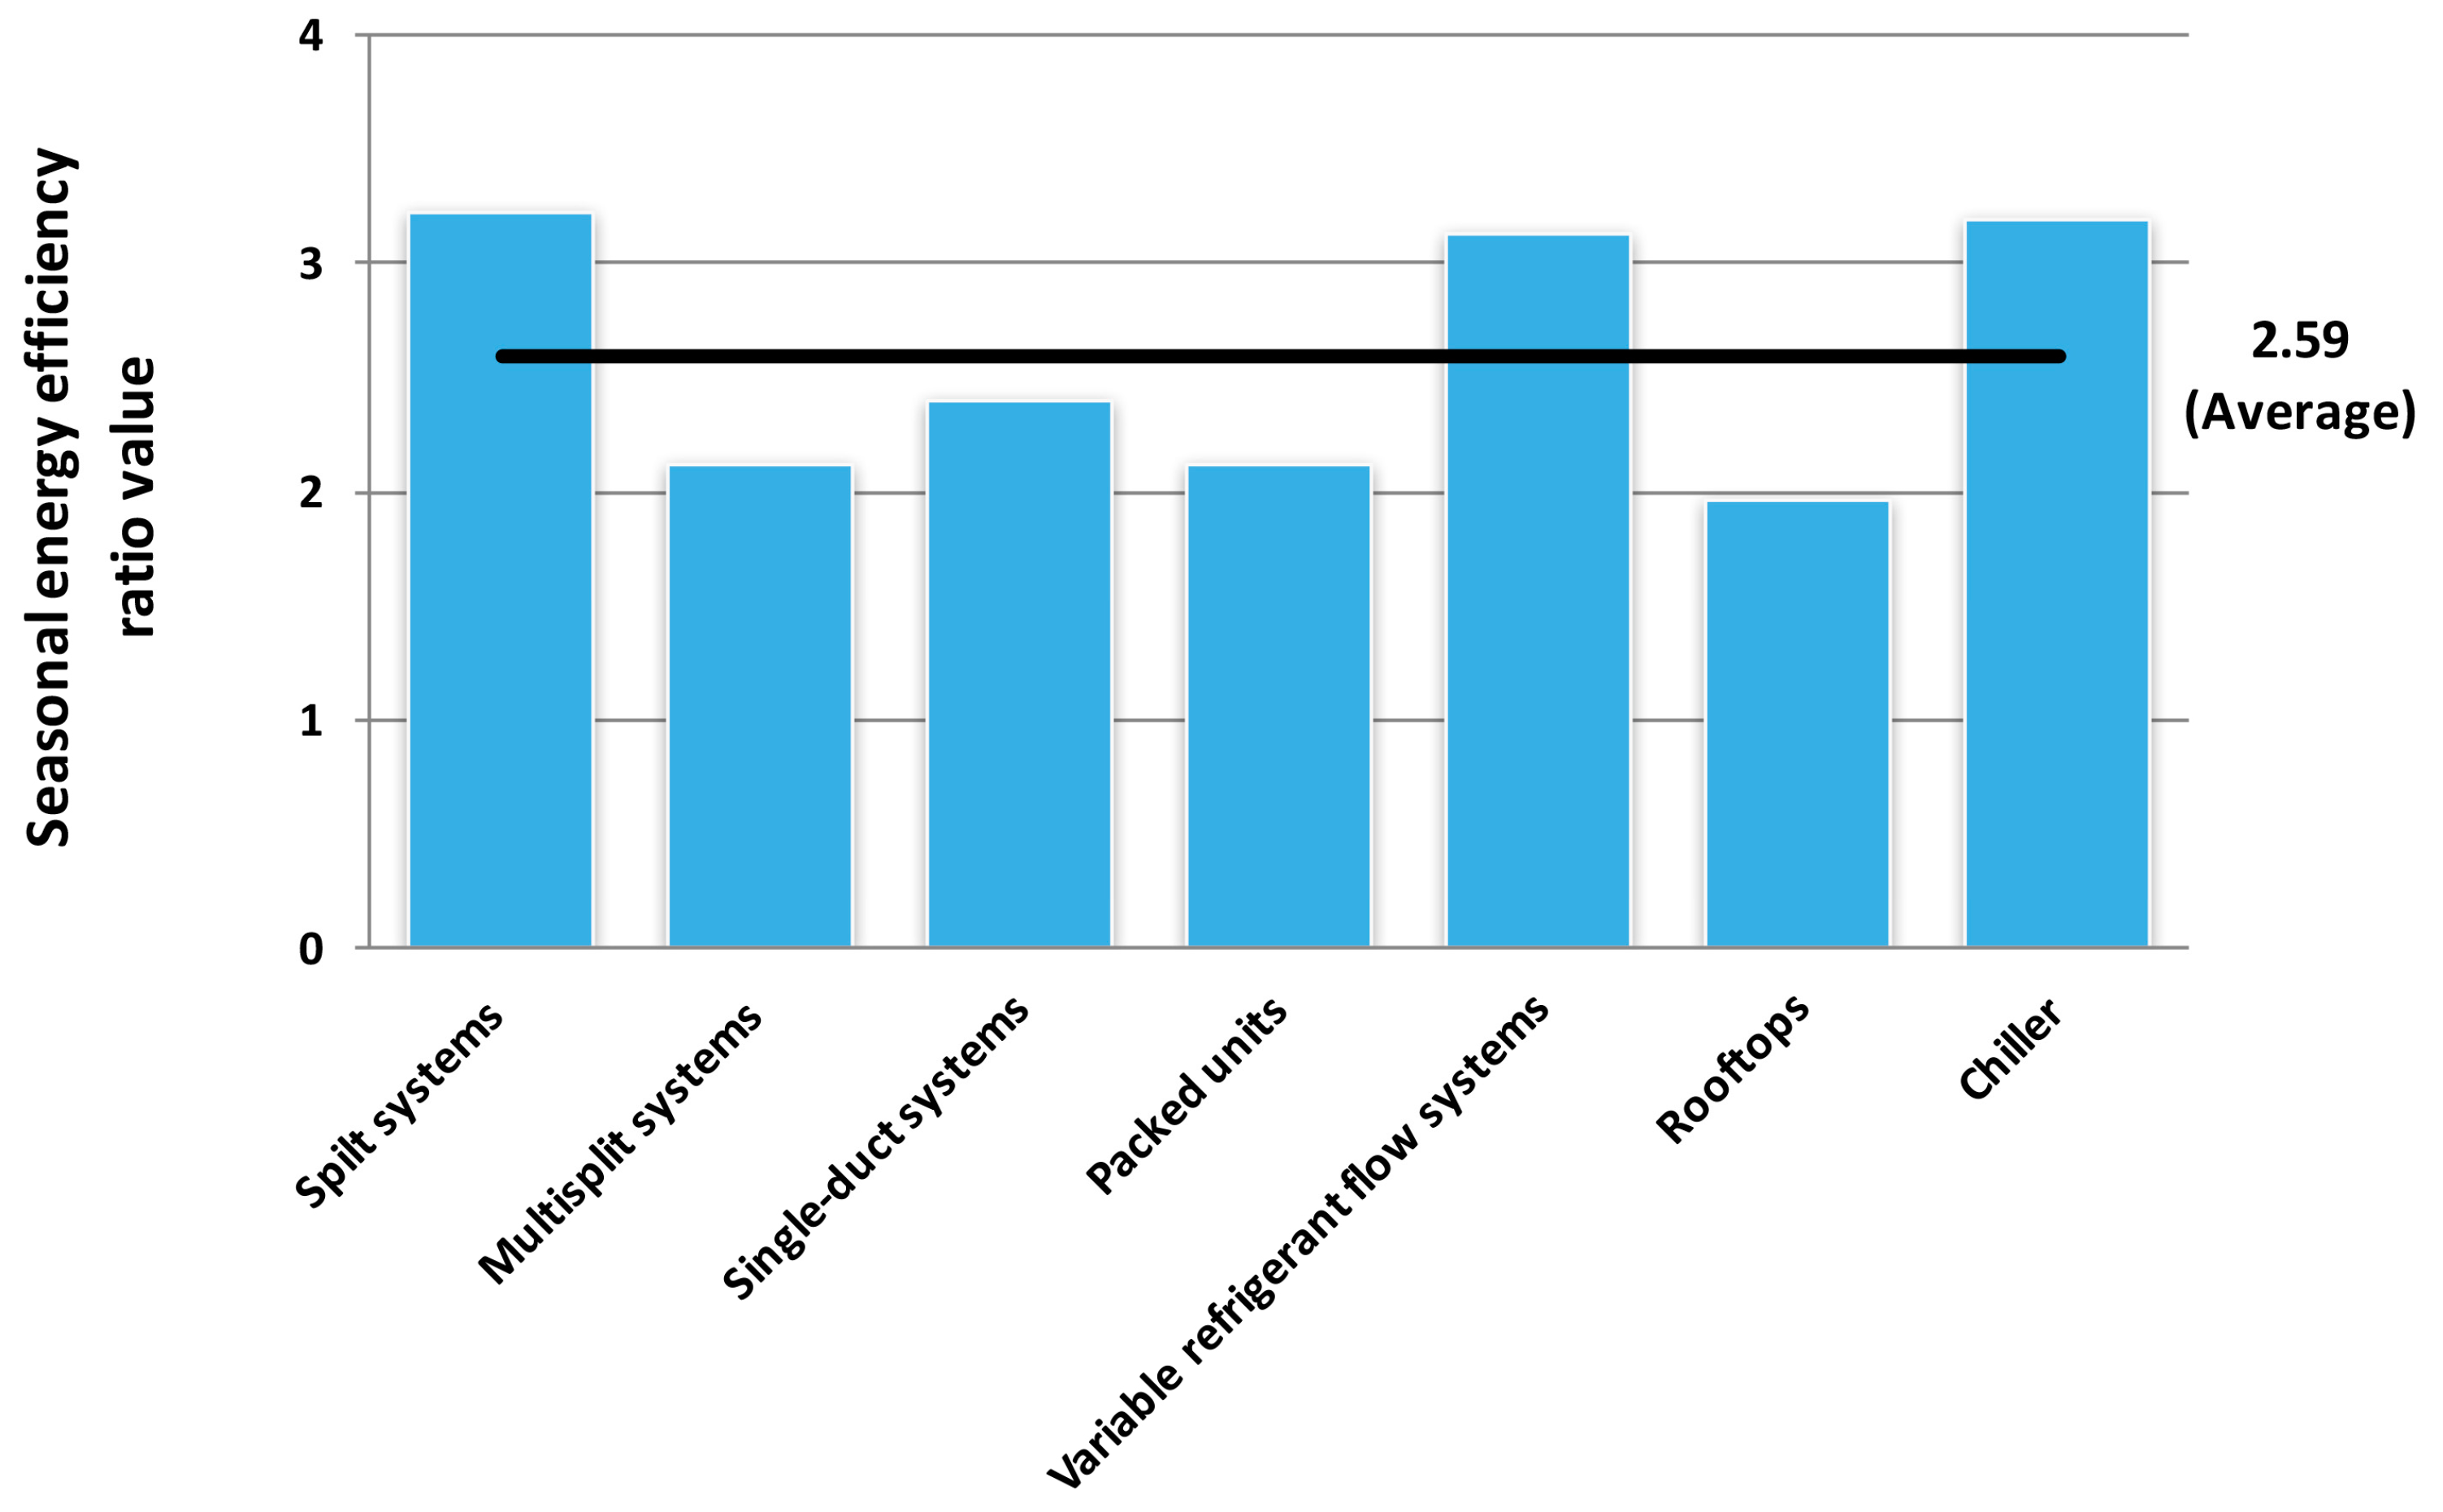
Figure 12 provides information concerning the SEER.
According to Figure 12, the CAC systems on average are slightly more efficient than RAC units (for about SEER = 0.3). The most efficient AC type emerges to be split systems, chiller and VRF units with a SEER value of >3. Single-duct systems follow with a SEER of around 2.4. Packed units, multisplit systems and rooftops show the lowest SEER numbers with values around 2.
As shown in Table A5 (Appendix A), the collected SEER values vary significantly per AC technology going from less than 2 for multisplit systems to almost 4 for chiller.
As it can be seen in Figure 12, the simple average of SEER values per AC technology is 2.59. The SEER values per AC equipment presented in the figure above are lower than those claimed by a number of manufacturers [12].
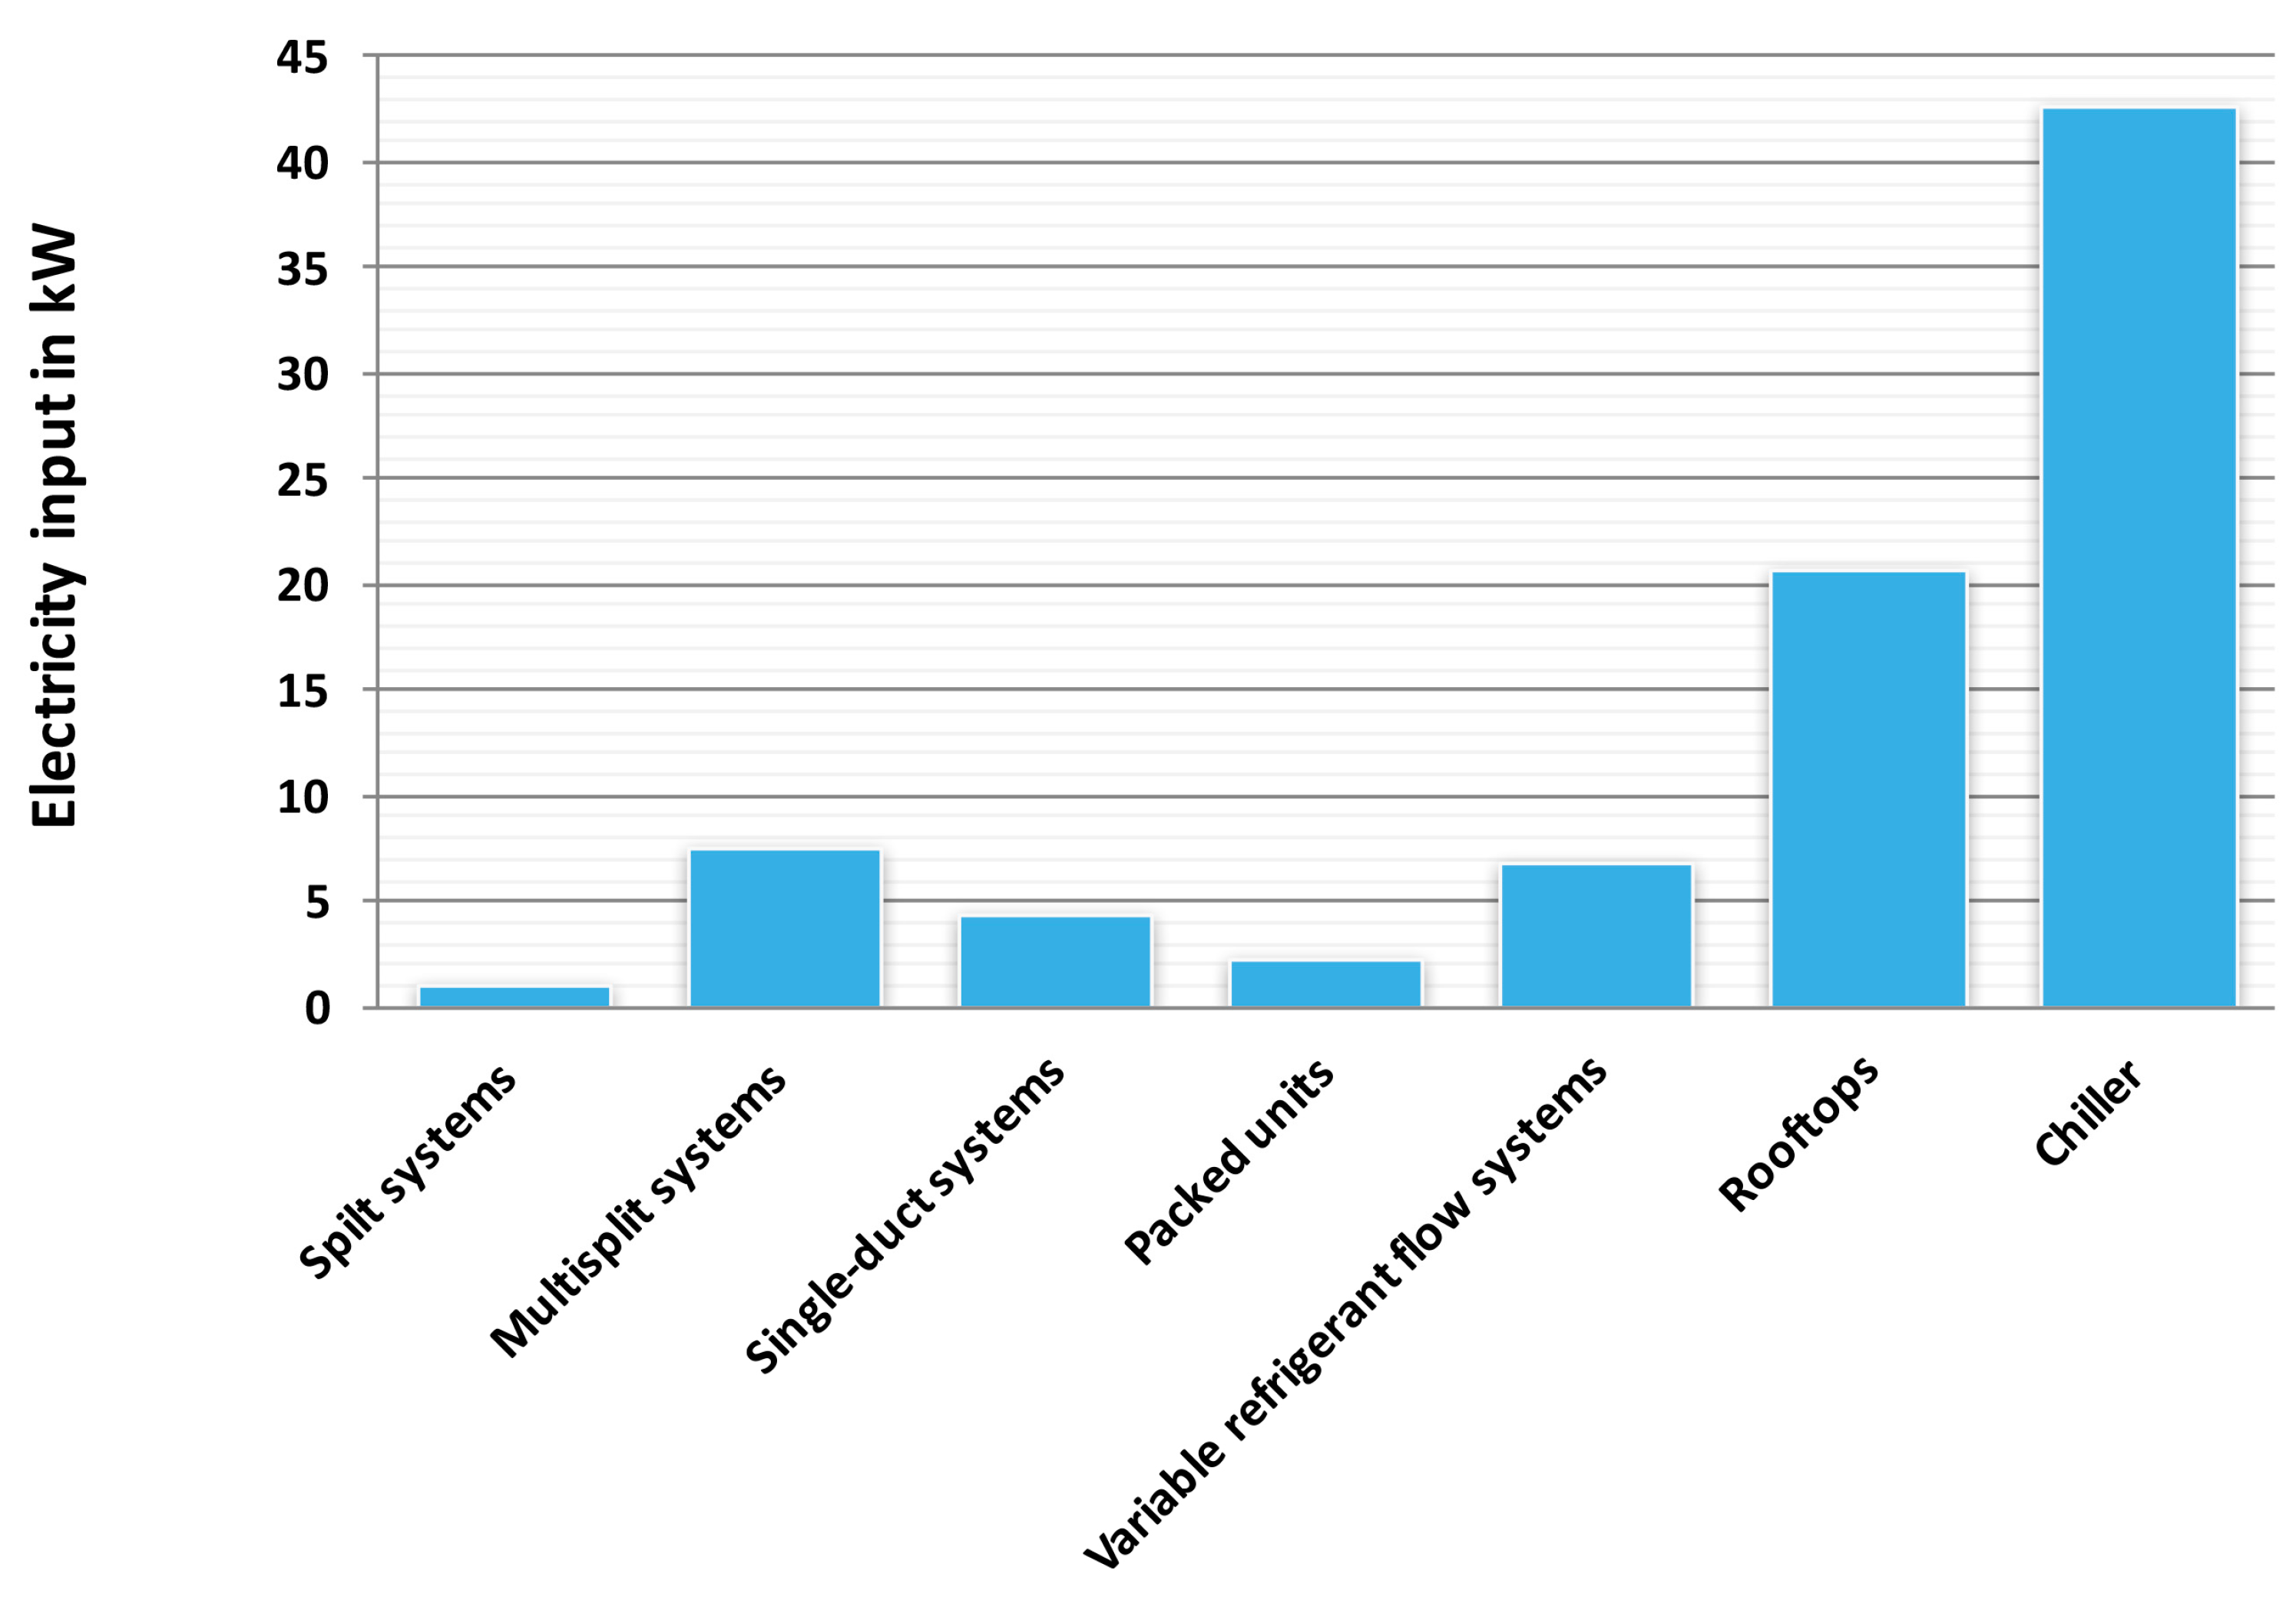
Through the collected average capacity and SEER values per AC type the corresponding electricity input in kW has been calculated. Figure 13 relates to this point.
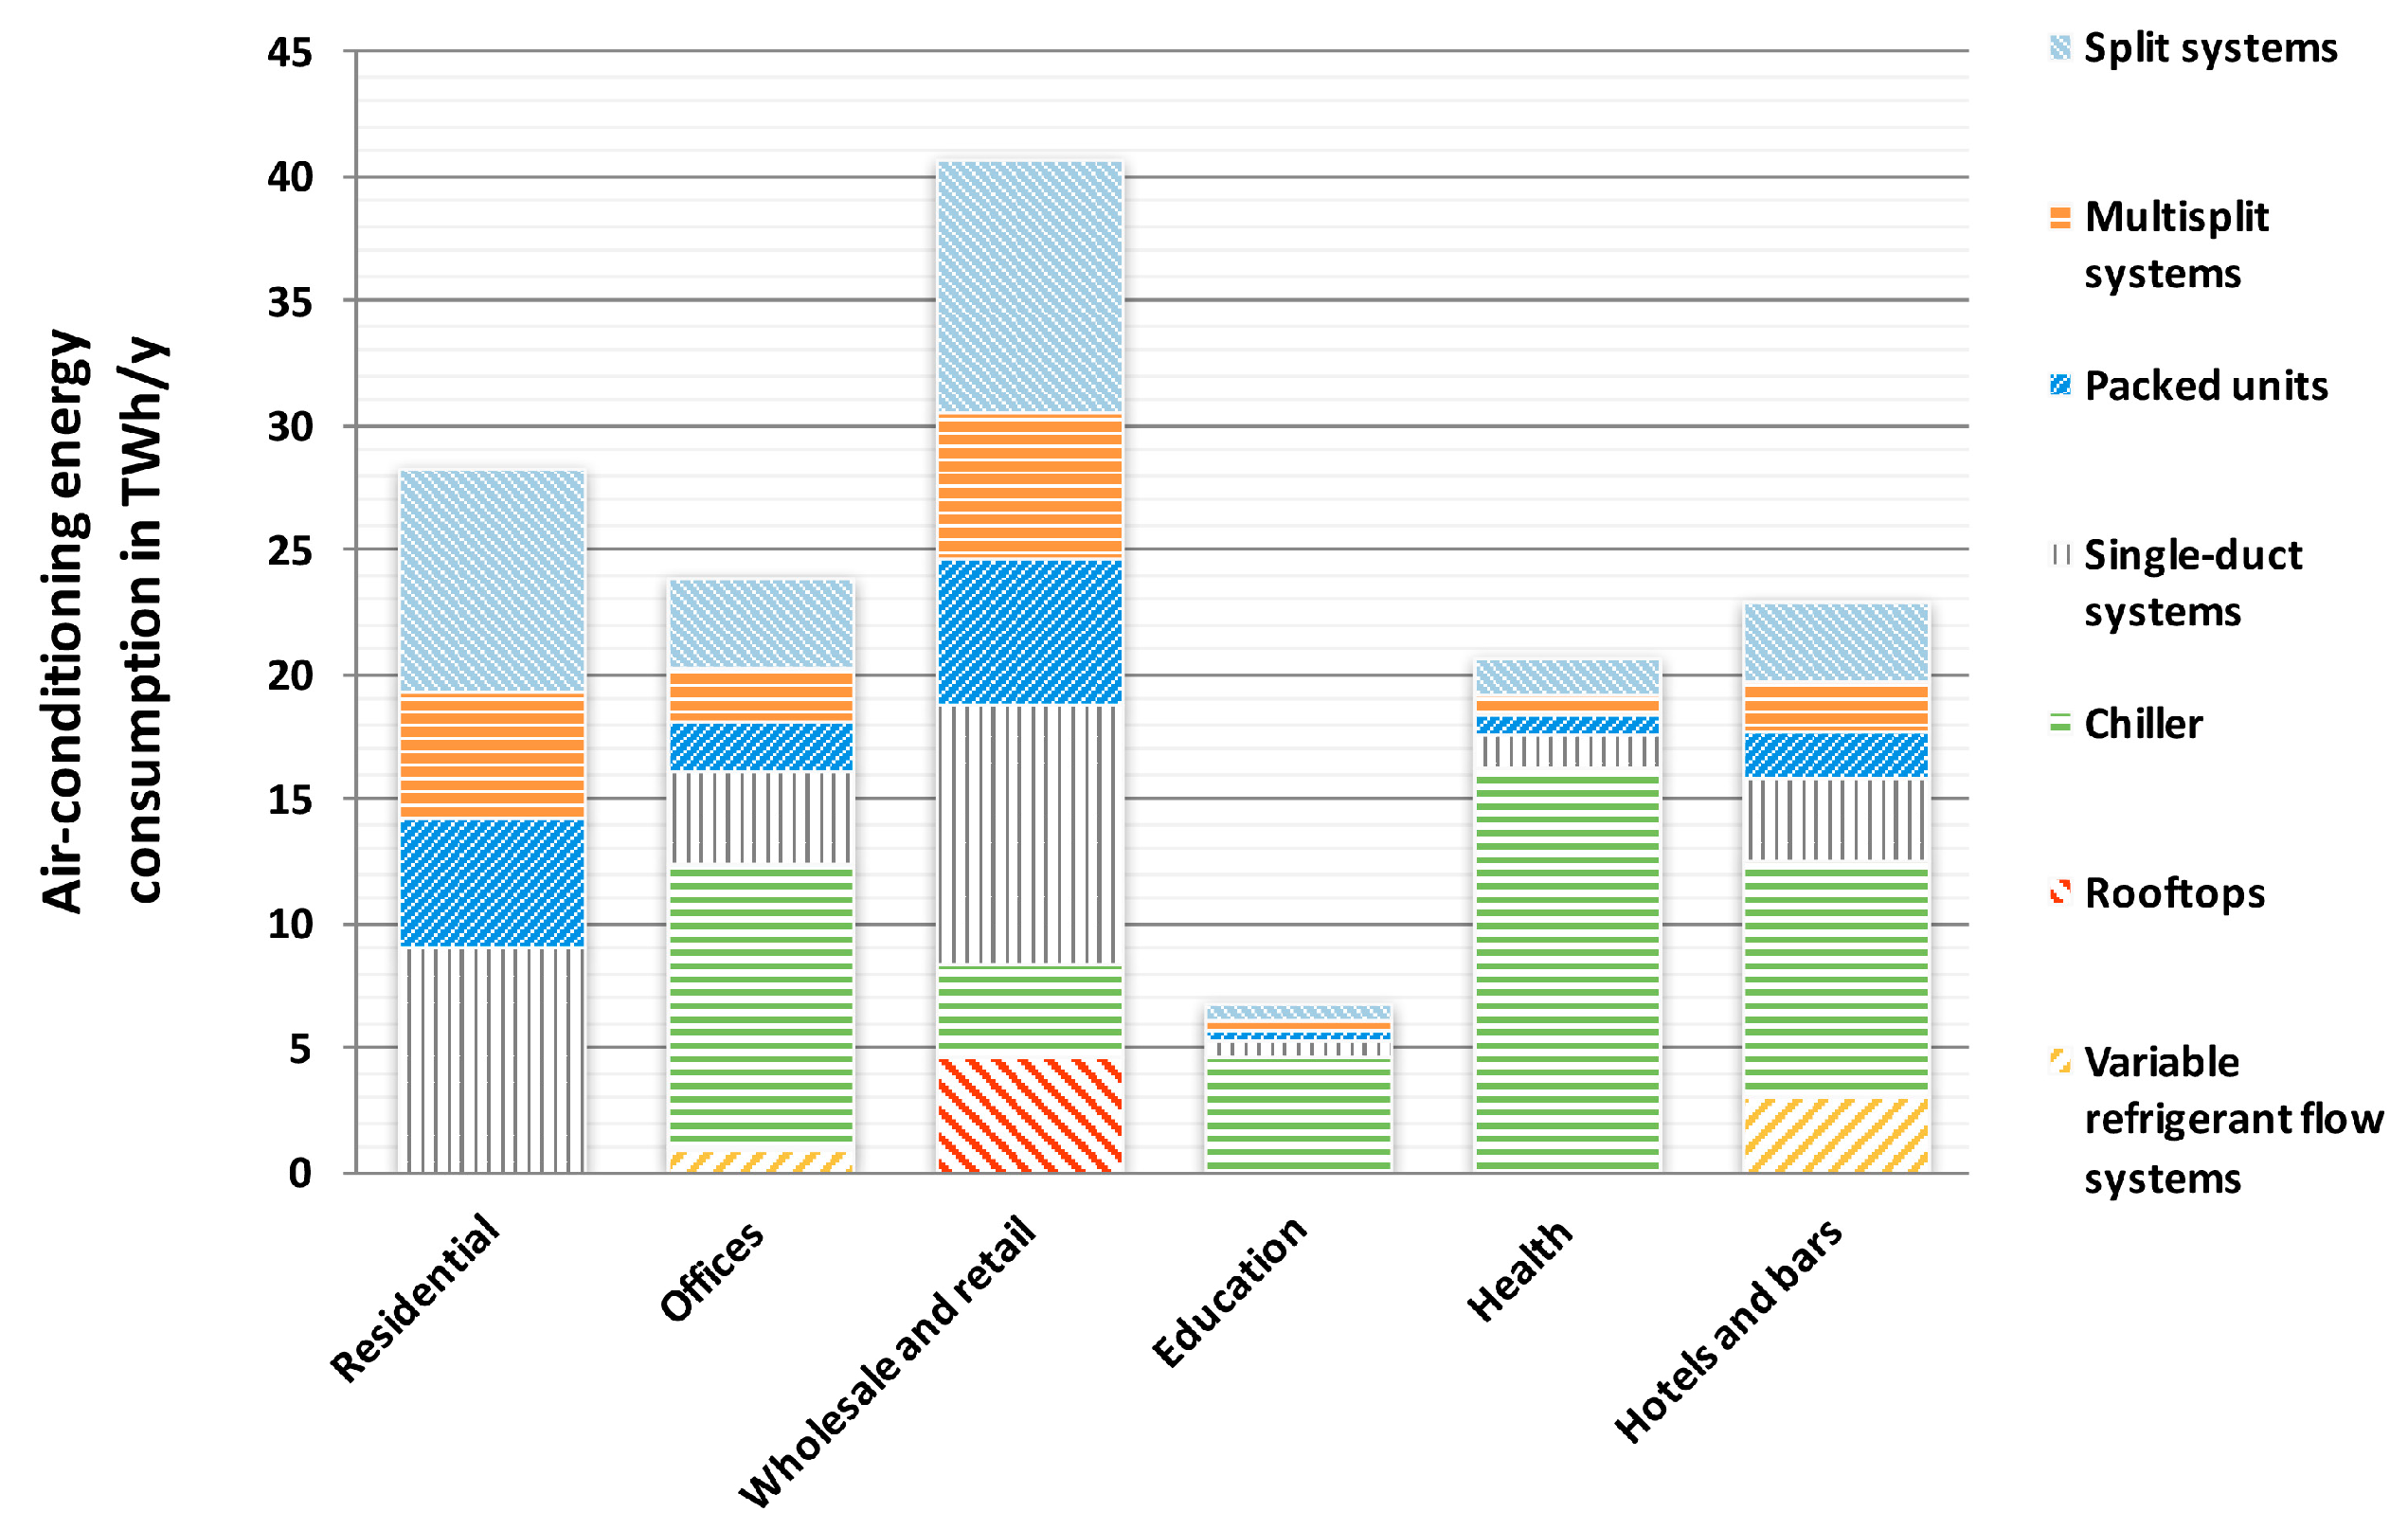
The AC energy consumption per type and sector in TWh/y was obtained from data in Figure 4, Figure 5, Figure 6, Figure 7, Figure 8, Figure 9, Figure 10, Figure 11, Figure 12 and Figure 13, as reported in Figure 2.
As is visible in Figure 2, wholesale and retail is the most energy consuming sector for AC purposes with approximately 40 TWh/y. In this regard, it must be stressed, that this is the most largely defined sector considered in the present investigation, containing a huge amount of different commercial activities. This sector entails a wide range of building types as described in Section 2 Materials and Methods.
Furthermore, a number of scientific literature sources indicate the wholesale and retail sector as the most or one of the most energy consuming sectors concerning AC application [32,54,55,56,57].
As shown in Figure 2, the residential sector is the second largest regarding SC purposes within the considered sections with about 30 TWh/y. A possible reason is that dwellings have the highest cooled floor area with respect to the considered sectors (Figure 9: Distribution of cooled floor area per sector and AC type, EU15).
Offices, hotels and bars and health are found at the third, fourth and fifth position with more than 20 TWh/y energy consumption for AC application each. The education sector is last, representing about 5 TWh/y. Summing up, the total energy consumption for AC purposes within the considered sectors is nearly 140 TWh/y.
The most energy consuming AC type is the chiller with approximately 30% of the total SC energy use registered. Single-duct and split systems follow, emerging to be responsible for around 20% of the AC energy use respectively. Packed and multisplit systems come next with about 10% of the AC energy need each. Finally, there are rooftops and VRF systems, consuming ~5% of the AC application per SC typology.
As shown in Figure 2 and anticipated before in Figure 4 and Figure 5, households use solely RAC units (split systems, multisplit systems, packed units and single-duct systems). However, that might not be fully correct as a limited presence of other AC technologies in the residential sector is given by e.g., district heating and cooling systems as well as CACs like rooftops [12,27].
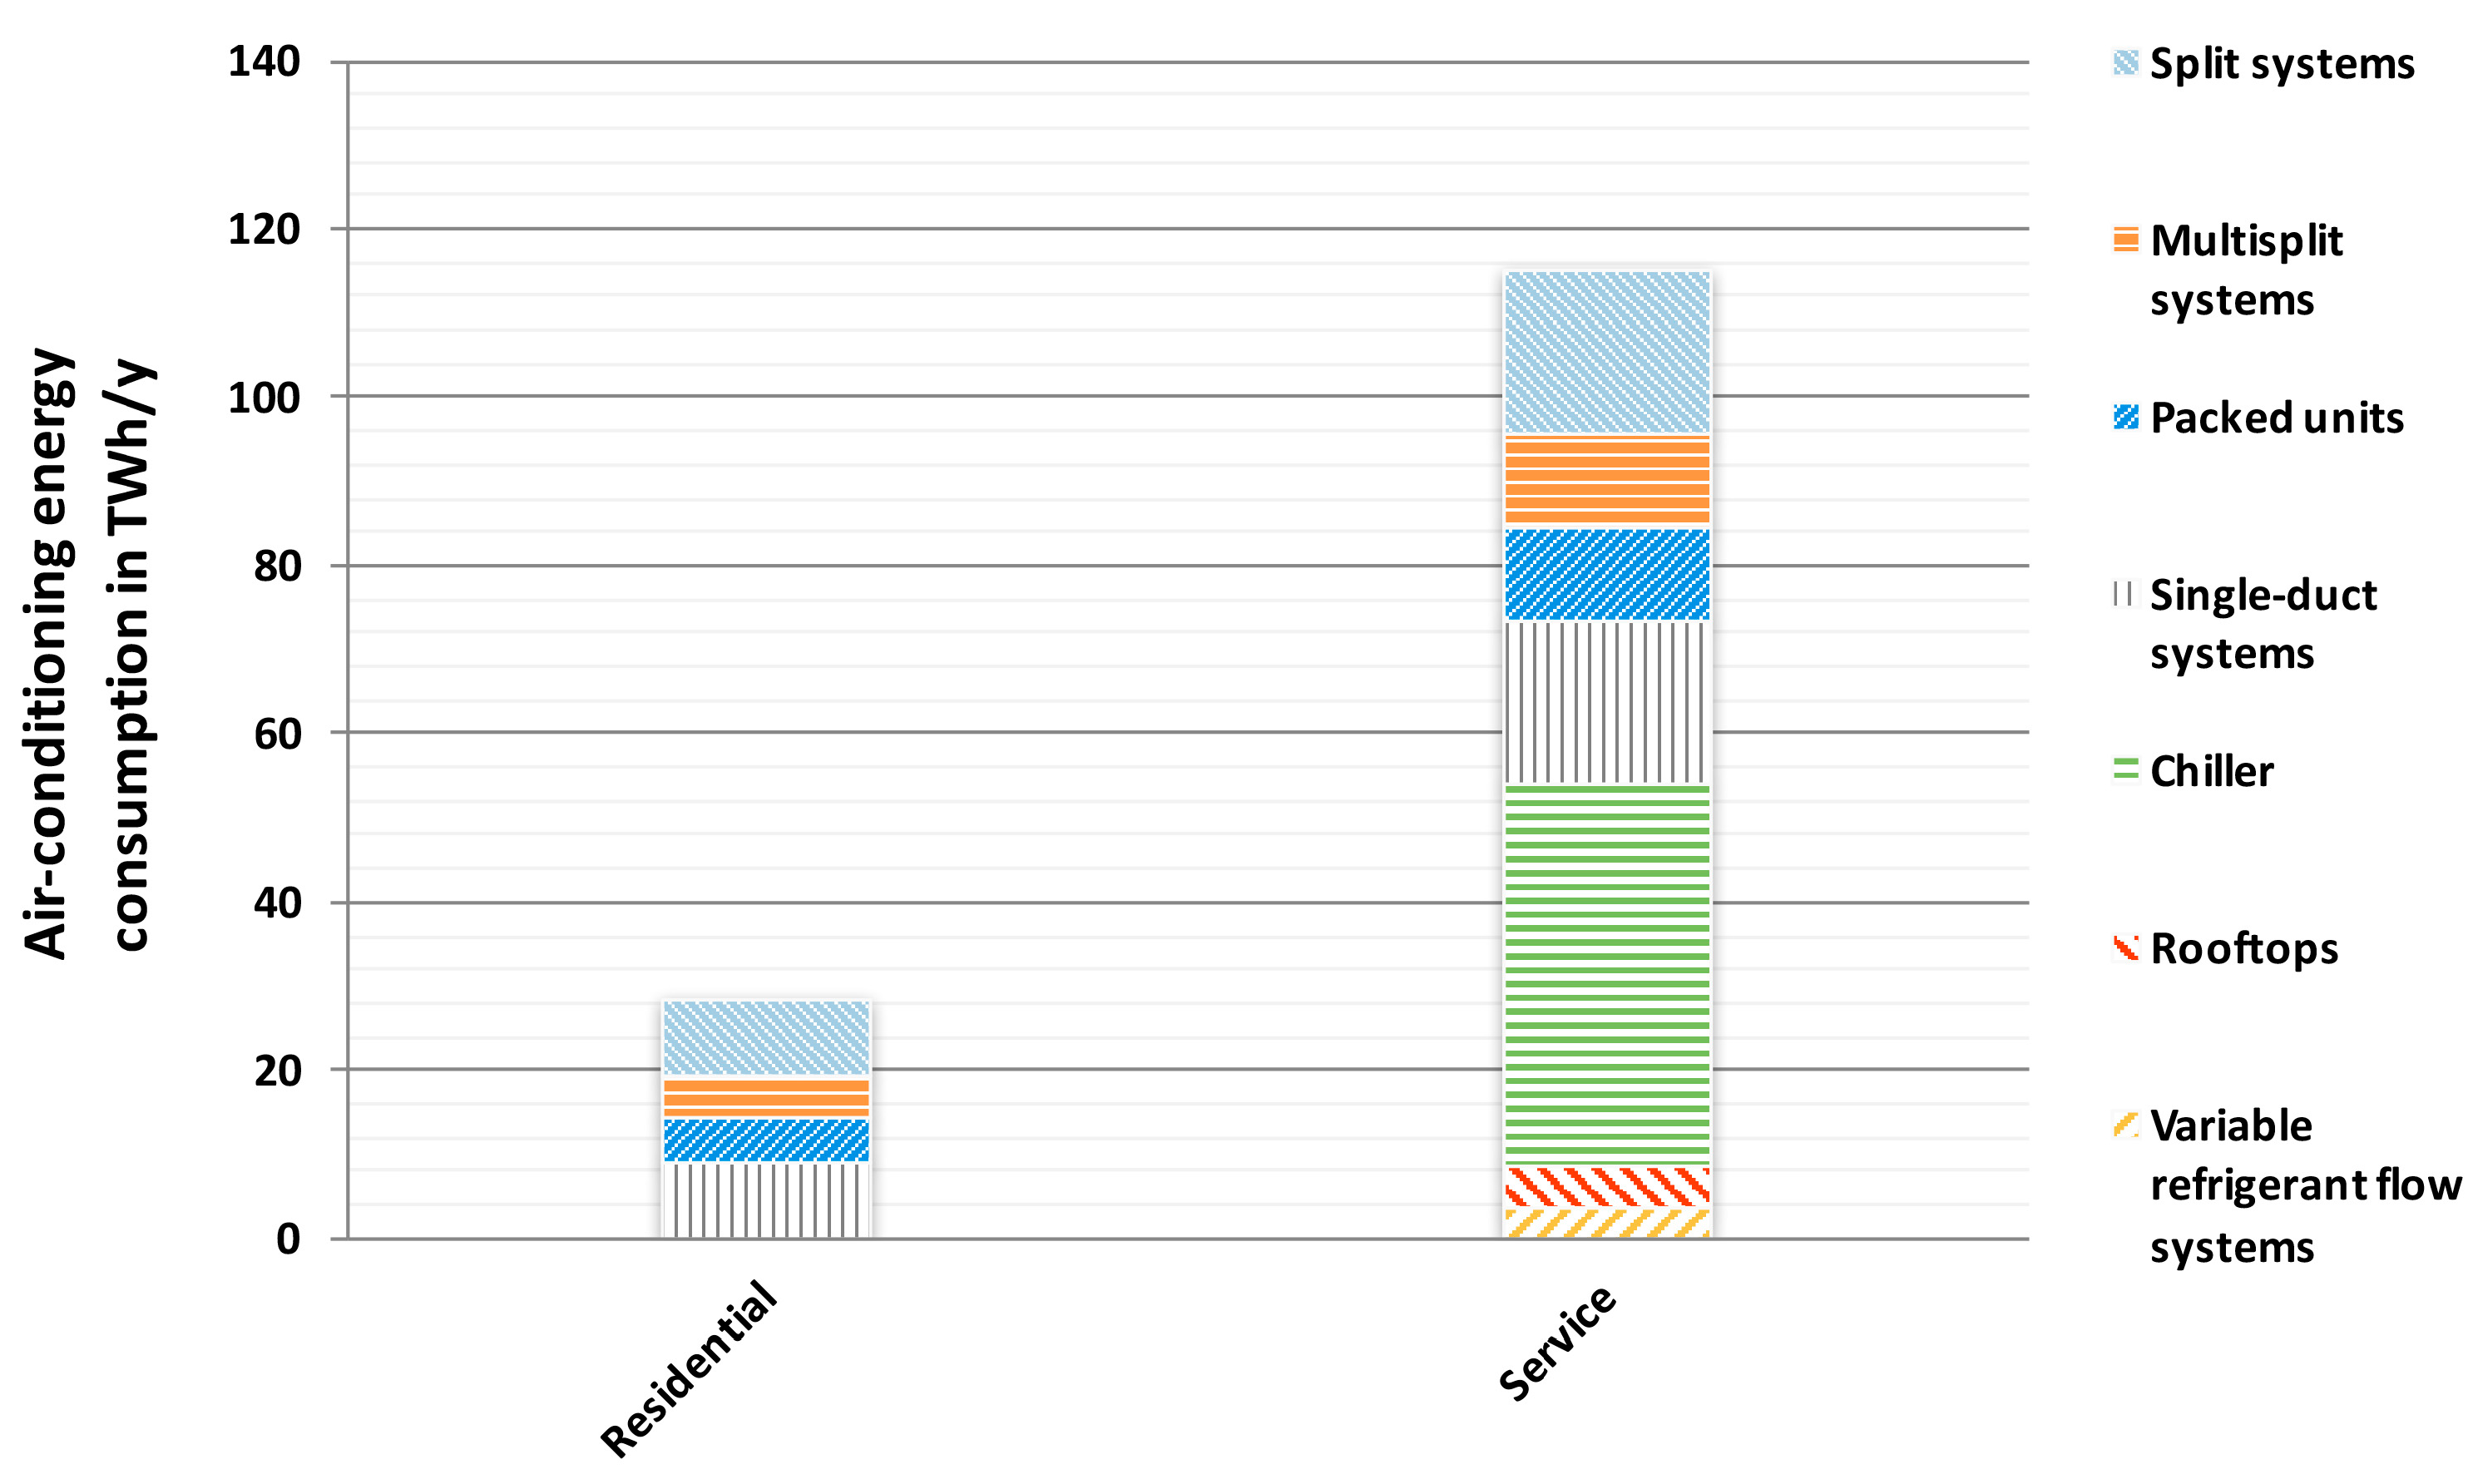
If the AC energy consumption per type and sector is reduced to solely the residential and service sectors, the dominance of SC energy consumption in the service part becomes visible. See Figure 3.
The energy consumption for AC purposes within the service section is almost four times higher than that given in the residential part: 115 versus 25 TWh/y respectively. It has to be underlined that the energy consumption portions indicated in Figure 2 and Figure 3 include energy utilized by AHUs and FCUs.
4. Discussion and Conclusions
SC accounts for an important part of the European Union’s household energy consumption (about 5%) and is particularly meaningful for the service sector (approximately 13%) [58,59]. The European AC consumption quantification, following a bottom-up approach, shows a significant disparity between the service and residential part: about 115 TWh/y for service and 25 TWh/y for residential. The main reason for this mismatch is the percentage of total cooled floor area is much higher in the service sector: less than 40% for households and greater than 60% for the service section.
The European Union SC market is characterized by a huge potential for growth, especially for households. The percentage of the whole cooled floor area in the service sector is almost ten times higher (30%) than in the residential (4%) [48,49,50]. Due to an expressed desire by the European population for increased comfort standards, SC application are expected to increase, in particular within the residential sector [26]. Further possible reasons for the future rise of SC application in Europe are global warming and modern building architecture with larger glazing areas [60].
The SC estimates calculated in this study significantly exceed data from the European Commission (2009 and 2012) on the European SC market. It estimates between nearly 20 and 40 TWh/y [61,62,63]. Also Kranzl et al. [64] approximates the European Union AC consumption to reach a value of around 30 TWh/y. A number of further investigations indicate the SC branch in Europe to be about 50 and 90 TWh/y: e.g., Marinhas et al. [65,66,67].
Other estimates closely match the SC consumption value found by the present study. For example, Boermans et al. [68] indicates the SC consumption in Europe to be approximately 130 TWh/y. Kalz and Pfafferott [69] quantify the AC consumption in the European Union to be almost the same size.
Further research shows the European Union AC market to be significantly larger. For example, Sanner et al. [29] estimate the AC consumption in Europe to be more than 170 TWh/y. Dalin [55] indicates a number of almost 250 TWh/y.
There is a major lack of information for the SC sector. The retrieved data was only laboriously obtained. Not all collected information appear to be credible—even if the mentioned data has been retrieved from reliable sources solely. In particular, the reliability of values collected for the cooled floor area has to be further investigated (as is visible in the Appendix A—Table A1—collected values for each sector can vary significantly).
Thus, it is recommended to analyze the European SC consumption and related cooled floor area in more detail, with a major focus on service buildings.
Another open point refers to the past and possible future development of SEER. SEER ratings are affected by several aspects, e.g., the efficiency of compressors and chiller units but also outdoor climate and building specific characteristics and installations. While the former ones (SEER of equipment as such) could be covered with some reliability, the latter ones are highly speculative [12,16,19,36,68]. Hence, it would require an assessment of all these different factors in the past—and possible future developments. Such an analysis is far beyond the scope of the present investigation.
Further research could also →focus on quantifying the energy consumption for SC applications for other fields of operation, such as transportation and industry.
Acknowledgments
We would like to convey our deepest appreciation to the Horizon 2020 Hotmaps Project (Grant Agreement No. 723677), which provided the funding to carry out the present investigation. We are thankful to Pierre Iachetti (Eurac Research), who edited the entire text of the present investigation. Finally, our gratitude goes to Amy Segata (Eurac Research) for designing the graphs of this study.
Author Contributions
Simon Pezzutto collected the data, carried out the calculations, and was involved in the writing phase of the entire paper. Matteo De Felice, Reza Fazeli, Lukas Kranzl, and Stefano Zambotti reviewed the manuscript and added various specifications. Lukas Kranzl also corrected the calculations carried out.
Conflicts of Interest
The authors declare no conflict of interest.
Appendix A

Table A1.
Statistical calculations regarding the cooled floor area per sector, EU15, (Mm2) [15,16,17,20,21,22,23,24,25,36,38,45,48,49,55].
| Sector | Cooled Floor Area | Standard Deviation | Average | Result | ||
|---|---|---|---|---|---|---|
| Residential | 1696 | 1073 | 1932 | 444 | 1567 | 1814 |
| Offices | 985 | 645 | 756 | 174 | 795 | 700 |
| Wholesale and retail | 864 | 869 | 840 | 15 | 858 | 866 |
| Education | 369 | 411 | 352 | 30 | 377 | 360 |
| Health | 350 | - | - | - | 350 | 350 |
| Hotels and bars | 278 | 350 | 347 | 40 | 325 | 348 |
Table A2.
Statistical calculations regarding the air-conditioning (AC) equivalent full-load hours per sector, EU15, (equivalent full load hours) [9,15,16,19,20,45,46,47,48,54,69,70,71,72,73].
| Sector | Equivalent Full-Load Hours | Standard Deviation | Average | Result | ||
|---|---|---|---|---|---|---|
| Residential | 519 | 610 | 500 | 59 | 543 | 510 |
| Offices | 803 | 874 | 866 | 39 | 848 | 870 |
| Wholesale and retail | 1019 | 1026 | 1200 | 103 | 1082 | 1023 |
| Education | 300 | - | - | - | 300 | 300 |
| Health | 1000 | - | - | - | 1000 | 1000 |
| Hotels and bars | 751 | 768 | 711 | 29 | 743 | 760 |
Table A3.
Statistical calculations regarding the amount of air-conditioners installed per type, EU15, (Mil. units) [15,16,20,21,22,23,24,25,36,71,72,73,74,75].
| AC Type | Installed Air-Conditioners | Standard Deviation | Average | Result | |||
|---|---|---|---|---|---|---|---|
| Split systems | 23.96 | 39.17 | 36.60 | - | 8.14 | 33.24 | 37.89 |
| Multisplit systems | 1.74 | 2.84 | 3.60 | - | 0.94 | 2.73 | 3.22 |
| Single-duct systems | 5.92 | 9.68 | 9.60 | - | 2.15 | 8.40 | 9.64 |
| Packed | 6.64 | 10.86 | 10.20 | - | 2.27 | 9.23 | 10.53 |
| VRF | 0.52 | 0.85 | 0.59 | - | 0.17 | 0.65 | 0.55 |
| Rooftops | 0.16 | 0.26 | 0.21 | 0.20 | 0.04 | 0.21 | 0.21 |
| Chiller | 1.06 | 1.73 | 1.30 | 1.09 | 0.31 | 1.30 | 1.15 |
Table A4.
Statistical calculations regarding the capacity per AC type, EU15, (kW), [15,16,33,68,69,70,71,72].
| AC Type | Capacity | Standard Deviation | Average | Result | |||
|---|---|---|---|---|---|---|---|
| Split systems | 4.00 | 3.00 | 3.50 | - | 0.50 | 3.50 | 3.50 |
| Multisplit systems | 19.80 | 15.75 | 16.30 | - | 2.20 | 17.28 | 16.03 |
| Single-duct systems | 10.58 | 10.38 | 12.67 | - | 1.27 | 11.21 | 10.48 |
| Packed | 5.00 | 5.40 | 4.65 | 4.60 | 0.37 | 4.91 | 4.75 |
| VRF | 20.40 | 22.20 | 29.00 | - | 4.54 | 23.87 | 21.30 |
| Rooftops | 42.30 | 51.00 | 39.00 | - | 6.20 | 44.10 | 40.65 |
| Chiller | 136.40 | 187.00 | 135.00 | - | 29.63 | 152.80 | 135.70 |
Table A5.
Statistical calculations regarding the seasonal energy efficiency ratio per AC type, EU15, (-) [12,16,19,36,68,69,70,76,77].
| AC Type | Seasonal Energy Efficiency Ratio | Standard Deviation | Average | Result | ||||
|---|---|---|---|---|---|---|---|---|
| Split systems | 3.00 | 3.24 | 2.43 | 3.25 | 3.40 | 0.38 | 3.1 | 3.22 |
| Multisplit systems | 1.98 | 2.25 | - | - | - | 0.19 | 2.1 | 2.12 |
| Single-duct systems | 1.68 | 2.60 | 2.20 | - | - | 0.46 | 2.2 | 2.40 |
| Packed | 1.98 | 2.25 | 2.88 | - | - | 0.46 | 2.4 | 2.12 |
| VRF | 3.45 | 2.80 | - | - | - | 0.46 | 3.1 | 3.13 |
| Rooftops | 1.97 | 2.25 | 1.95 | - | - | 0.17 | 2.1 | 1.96 |
| Chiller | 3.93 | 3.25 | 3.27 | 3.10 | 3.14 | 0.34 | 3.3 | 3.19 |
References
- 2020 Climate & Energy Package. Available online: http://ec.europa.eu/clima/policies/strategies/2020/index_en.htm (accessed on 17 June 2017).
- 2030 Climate & Energy Framework. Available online: http://ec.europa.eu/clima/policies/strategies/2030/index_en.htm (accessed on 17 June 2017).
- European Europe 2020 Indicators—Climate Change and Energy. Available online: http://ec.europa.eu/eurostat/statistics-explained/index.php/Europe_2020_indicators_-_climate_change_and_energy (accessed on 17 June 2017).
- Benejam, G.M.; Mata, É.; Kalagasidis, A.S.; Johnsson, F. Bottom-up characterization of the Spanish building stock for energy assessment and model validation. In Proceedings of the Retrofit 2012 Conference, Manchester, UK, 24–26 January 2012. [Google Scholar]
- Consumption of Energy. Available online: http://ec.europa.eu/eurostat/statistics-explained/index.php/Consumption_of_energy (accessed on 17 June 2017).
- Economidou, M. Energy performance requirements for buildings in Europe. REHVA J. 2012, 92, 16–21. [Google Scholar]
- Energy Efficiency Trends in Buildings in the EU. Available online: https://energiatalgud.ee/img_auth.php/6/68/Enerdata._Energy_Efficiency_Trends_in_Buildings_in_the_EU._2012.pdf (accessed on 17 June 2017).
- Aebischer, B.; Catenazzi, G.; Jakob, M. Impact of climate change on thermal comfort, heating and cooling energy demand in Europe. Energy Effic. Build. 2007, 92, 859–870. [Google Scholar]
- Data Service. Available online: http://wds.iea.org/WDS/Common/Login/login.aspx (accessed on 17 June 2017).
- Research and Innovation. Available online: https://ec.europa.eu/research/energy/eu/index_en.cfm?pg=projects&fp7page=10 (accessed on 17 June 2017).
- Vinnova. H2020 Visualization. Available online: http://h2020viz.vinnova.se/#/ (accessed on 21 June 2017).
- Pezzutto, S. Analysis of the space heating and cooling market in Europe. Ph.D. Thesis, University of Natural Resources and Life Sciences, Vienna, Austria, 22 May 2014. [Google Scholar]
- Field Benchmarking and Market Development for Audit Methods in Air Conditioning. Available online: https://ec.europa.eu/energy/intelligent/projects/en/projects/auditac (accessed on 21 June 2017).
- Harmonizing Air-Conditioning Inspection and Audit Procedures in the Tertiary Building Sector. Available online: https://ec.europa.eu/energy/intelligent/projects/en/projects /harmonic (accessed on 21 June 2017).
- Energy Efficiency of Room Air-Conditioners. Available online: http://s3.amazonaws.com/zanran_storage/www.coolregion.fr/ContentPages/46076446.pdf (accessed on 21 June 2017).
- Energy Efficiency and Certification of Central Air Conditioners. Available online: http://lms.i-know.com/pluginfile.php/28688/mod_resource/content/57/Energy Efficiency and Certification of Central Air Conditioners.pdf (accessed on 21 June 2017).
- Limiting the Impact of Increasing Cooling Demand in the European Union: Results from a Study on Room Air-Conditioner Energy Efficiency RAC Types and Technology. Available online: http://aceee.org/files/proceedings/2000/data/papers/SS00_Panel10_Paper01.pdf (accessed on 21 June 2017).
- National and EU Wide Efforts to Increase Energy Efficiency of Installed Air Conditioners. Available online: http://www.cardiff.ac.uk/archi/research/auditac/pdf/auditac_national_eu.pdf (accessed on 21 June 2017).
- CIRCABC (Communication and Information Resource Centre for Administration, Businesses and Citizens). Available online: https://circabc.europa.eu/faces/jsp/extension/wai/navigation/container.jsp (accessed on 25 July 2017).
- Solar Air-Conditioning: It’s About Time. Available online: http://www.solair-project.eu/ (accessed on 21 June 2017).
- Multi-Level Actions for Enhanced Heating and Cooling Plans. Available online: http://stratego-project.eu/project-brief/ (accessed on 24 July 2017).
- The Market Potential of Micro-CHCP. Available online: http://www.solarthermalworld.org/sites/gstec/files/WP2_Market_Study_Final_Report_v10_Final.pdf (accessed on 18 June 2017).
- Development of Systematic Packages for Deep Energy Renovation of Residential and Tertiary Buildings Including Envelope and Systems. Available online: http://inspirefp7.eu/ (accessed on 24 July 2017).
- Melograno, P.N.; Pezzutto, S. IEA ANNEX 34 Italian Country Report; EURAC Research: Bolzano, Italy, 2010. [Google Scholar]
- Heat Roadmap Europe. Available online: http://www.heatroadmap.eu/heat-roadmap-europe-4.php (accessed on 24 July 2017).
- Pezzutto, S.; Fazeli, R.; De Felice, M.; Sparber, W. Future development of the air-conditioning market in Europe: An outlook until 2020. Wiley Interdisciplin. Rev. Energy Environ. 2016, 5, 649–669. [Google Scholar] [CrossRef]
- Renewable Smart Cooling for Urban Europe. Available online: http://www.rescue-project.eu/fileadmin/user_files/WP2_Reports/RESCUE_WP_2.3_EU_COOLING_MARKET.pdf (accessed on 18 June 2017).
- World Air Conditioning Market Grows Thanks to Hot Spots. Available online: https://www.bsria.com/news/article/world-air-conditioning-market-grows-thanks-to-hot-spots/ (accessed on 18 June 2017).
- Common Vision for the Renewable Heating & Cooling sector in Europe. Available online: http://www.rhc-platform.org/fileadmin/Publications/RHC_BROCHURE_140311_web.pdf (accessed on 18 June 2017).
- Europe HVAC Market by Product Type, By End Use Sector, By Country Competition Forecast & Opportunities. Available online: http://www.prnewswire.com/news-releases/europe-hvac-market-by-product-type-by-end-use-sector-by-country-competition-forecast--opportunities-2012-2022-300403859.html (accessed on 18 June 2017).
- Research and Markets: Air Conditioning Systems. Available online: http://www.businesswire.com/news/home/20120220005473/en/Research-Markets-Air-Conditioning-Systems-Global (accessed on 18 June 2017).
- Tobin, M.J. Principles and Practice of Mechanical Ventilation, 3rd ed.; McGraw-Hill Education: Chicago, IL, USA, 2012; pp. 242–243. ISBN 978-0071736268. [Google Scholar]
- Potential of Solar Thermal in Europe. Available online: http://eeg.tuwien.ac.at/eeg.tuwien.ac.at_pages/publications/pdf/WER1.pdf (accessed on 20 June 2017).
- Task 38 Solar Air-Conditioning and Refrigeration State of the Art on Existing Solar Heating and Cooling Systems A Technical Report of Subtask B. Available online: http://archive.iea-shc.org/publications/downloads/Report_B1_final.pdf (accessed on 21 June 2017).
- Thermally Driven Heat Pumps. Available online: https://hub.globalccsinstitute.com/publications/strategic-research-priorities-cross-cutting-technology/43-thermally-driven-heat-pumps (accessed on 21 June 2017).
- Energy Consumption in the Services Sector Surveys of EU Member States. Available online: http://ec.europa.eu/eurostat/documents/3217494/5634673/KS-43-02-042-EN.PDF/32e10ad4-43a3-4635-97f3-01b28ed6ba18 (accessed on 20 June 2017).
- American Society of Heating, Refrigeration, and Air Conditioning Engineers. Heating, Ventilating, and Air-conditioning Systems and Equipment; ASHRAE: New York, NY, USA, 2012; pp. 124–136. ISBN 9781936504268. [Google Scholar]
- ASHRAE. HVAC Systems and Equipment; ASHRAE: New York, NY, USA, 2016; pp. 87–92. ISBN 9781939200273. [Google Scholar]
- Europe’s Buildings under the Microscope. Available online: http://bpie.eu/wp-content/uploads/2015/10/HR_EU_B_under_microscope_study.pdf (accessed on 20 June 2017).
- Performance Rating of Unitary Air-Conditioning & Air-Source Heat Pump Equipment. Available online: http://www.ahrinet.org/App_Content/ahri/files/standards%20pdfs/ANSI%20standards%20pdfs/ANSI.AHRI%20Standard%20210.240%20with%20Addenda%201%20and%202.pdf (accessed on 18 June 2017).
- Pezzutto, S. Analysis of the Space Heating and Cooling Market in Europe. Int. J. Contemp. Energy 2016, 2. [Google Scholar] [CrossRef]
- European Demography. Available online: http://ec.europa.eu/eurostat/documents/2995521/ 5037986/3-28072011-AP-EN.PDF/2d0d6e39-1e13-46a5-abb2-4a52c650ee81 (accessed on 21 June 2017).
- Inspection and Audit of Air Conditioning Facilities. Available online: https://ec.europa.eu/energy/intelligent/projects/sites/iee-projects/files/projects/documents/auditac_training_package.pdf (accessed on 21 June 2017).
- Adnot, J.; Giraud, D.; Colomines, F.; Rivière, P.; Becirspahic, S.; Benke, G. Central (commercial) airconditioning systems in Europe. Proceedings 2002, 5, 143–149. [Google Scholar]
- Analyse des Energieverbrauchs von Wiener Krankenanstalten. Available online: https://www.energyagency.at/fileadmin/dam/pdf/projekte/gebaeude/HEALTH-Analyse-Energieverbrauch.pdf (accessed on 20 June 2017). (In Language).
- Valutazione dei Consumi Nell’Edilizia Esistente e Benchmark Mediante Codici Semplificati: Analisi di Edifici Ospedalieri. Available online: http://www.enea.it/it/Ricerca_sviluppo/documenti/ricerca-di-sistema-elettrico/governance/rse117.pdf (accessed on 20 June 2017). (In Language).
- De Luca, A. Performance evaluation of Thermally Driven Heat Pumps integrated in Innovative Energy Systems for Buildings air-Conditioning. Master’s Thesis, Free University of Bolzano-Bozen, Faculty of Science and Technology, Bolzano-Bozen, Italy, 2012. [Google Scholar]
- Energy Efficiency Trends for Households in the EU. Available online: http://www.odyssee-mure.eu/publications/efficiency-by-sector/household/household-eu.pdf (accessed on 21 June 2017).
- Quantifying the Heating and Cooling Demand in Europe. Available online: http://stratego-project.eu/wp-content/uploads/2014/09/STRATEGO-WP2-Background-Report-4-Heat-Cold-Demands.pdf (accessed on 21 June 2017).
- Werner, S. European space cooling demands. Energy 2016, 110, 148–156. [Google Scholar] [CrossRef]
- School Year and Summer Vacation—History. Available online: https://www.infoplease.com/history-summer-vacation (accessed on 21 June 2017).
- A Brief History of: Summer Vacation. Available online: http://content.time.com/time/magazine/article/0,9171,1816501,00.html (accessed on 22 June 2017).
- School Holiday Dates in Europe: UK, England, France, Netherlands, Germany and Much More. Available online: https://www.schoolholidayseurope.eu/ (accessed on 22 June 2017).
- Market Report for Small and Medium-Sized Solar Air-Conditioning Appliances Analysis of Market Potential. Available online: http://www.ee.fs.uni-lj.si/solair/Market_analysis_EN.pdf (accessed on 22 June 2017).
- Intelligent Energy Europe. The European Cold Market Final Report; Euroheat & Power: Brussels, Belgium, 2006. [Google Scholar]
- Best Environmental Management Practice in the Retail Wholesale and Retail Sector. Available online: http://susproc.jrc.ec.europa.eu/activities/emas/documents/RetailWholesale and retail Sector.pdf (accessed on 22 June 2017).
- Efficiency Trends in Tertiary in the EU. Available online: http://www.odyssee-mure.eu/publications/efficiency-by-sector/services/Services-profile.pdf (accessed on 22 June 2017).
- Electricity Production, Consumption and Market Overview. Available online: http://ec.europa.eu/eurostat/statistics-explained/index.php/Electricity_production,_consumption_and_market_overview (accessed on 22 June 2017).
- Electricity and Heat Statistics. Available online: http://ec.europa.eu/eurostat/statistics-explained/index.php/Electricity_and_heat_statistics (accessed on 22 June 2017).
- Shanks, K.; Nezamifar, E. Impacts of climate change on building cooling demands in the UAE. In Proceedings of the SB13 Dubai: Advancing the Green Agenda Technology, Practices and Policies, Dubai, UAE, 8–10 December 2013. [Google Scholar]
- EU Energy Efficiency Measures Contribute to Stabilize Electricity Consumption—Drop in Domestic Consumption. Available online: https://ec.europa.eu/jrc/sites/jrcsh/files/jrc_091130_newsrelease _electricity_en.pdf (accessed on 22 June 2017).
- Energy Efficiency Status Report 2012. Available online: https://setis.ec.europa.eu/sites/default/files/reports/energy-efficiency-status-report-2012.pdf (accessed on 22 June 2017).
- COMMISSION REGULATION (EU) No 206/2012 of 6 March 2012 Implementing Directive 2009/125/EC of the European Parliament and of the Council with Regard to Ecodesign Requirements for Air Conditioners and Comfort Fans. Available online: http://eur-lex.europa.eu/legal-content/EN/TXT/PDF/?uri=CELEX:32012R0206&from=EN (accessed on 22 June 2017).
- Policy Pathways for Reducing Energy Demand and Carbon Emissions of the EU Building Stock until 2030. Available online: http://www.entranze.eu/files/downloads/D4_4/ENTRANZE_D4_4_scenarios_v8.pdf (accessed on 22 June 2017).
- Air-Conditioning, Air Handling and Refrigeration Equipment: European-Wide Certification, Standards and European Directives on Energy Efficiency. Available online: http://www.eurovent-certification.com/fic_bdd/en/1282348955_REHVA_july_2010_english.pdf (accessed on 22 June 2017).
- Reducing Europe’s Consumption of Fossil Fuels for Heating and Cooling. Available online: http://s3.amazonaws.com/zanran_storage/www.euroheat.org/ContentPages/116171575.pdf (accessed on 22 June 2017).
- The Solar Thermal Potential in Europe. Available online: http://www.estif.org/fileadmin/estif/content/events/downloads/Potential%2520Solar%2520Thermal_Webinar.pdf (accessed on 23 June 2017).
- A Heating & Cooling Strategy for the European Building Sector until 2050. Available online: http://www.ecofys.com/files/files/ecofys-2015-position-paper-european-heating-cooling-2050.pdf (accessed on 23 June 2017).
- Kalz, D.; Pfafferott, J. Thermal Comfort and Energy-Efficient Cooling of Nonresidential Buildings, 1st ed.; Springer International Publishing: Cham, Germany, 2014; pp. 2–8. ISBN 978-3-319-04582-5. [Google Scholar]
- Preparatory Study on the Environmental Performance of Residential Room Conditioning Appliances (Airco and Ventilation). Available online: http://online.agoria.be/AO1.wsc/webextra/prg/nwAttach?v WebSessionID=400705&vUserID=999999&appl=ENewsv4&enewsdetid=161019&attach=170.136602001383670906.pdf&BodyPreview=no (accessed on 23 June 2017).
- Pout, C.; Hitchin, E.R. Future environmental impacts of room air-conditioners in Europe. Build. Res. Inf. 2009, 37, 358–368. [Google Scholar] [CrossRef]
- Best Products of Europe Room Air Conditioners: Recommendations for Policy Design. Available online: http://www.topten.eu/uploads/File/Room air conditioners Recommendations_May 2012.pdf (accessed on 23 June 2017).
- Sustainable Industrial Policy—Building on the Ecodesign Directive—Energy-Using Product Group Analysis/2. Lot 6: Air-Conditioning Systems. Available online: http://www.eup-network.de/fileadmin/user_upload/Produktgruppen/Lots/Working_Documents/Task_2_Lot_6_Air_Conditioning_Final_report_July_2012.pdf (accessed on 23 June 2017).
- Solarcombi + WP2: Market Analysis Phase 1 Task 1 D2.1: Report on Market Situation & Trends about Small Scale Chillers. Available online: http://www.solarcombiplus.eu/docs/D2_1_CRES_final_updated122008.pdf (accessed on 23 June 2017).
- Cooling Benchmarking Study. Available online: http://clasp.ngo/Resources/Resources/Publication Library/2012/Cooling-Benchmarking-Study (accessed on 23 June 2017).
- Preparatory Studies for Ecodesign Requirements of EuPs (III) ENER Lot 21—Central Heating Products that Use Hot Air to Distribute Heat Task 6: Technical Analysis BAT. Available online: http://www.eup-network.de/fileadmin/user_upload/Produktgruppen/Lots/Final_Documents/BIO_EuP_Lot21_Task_6_09072012.pdf (accessed on 23 June 2017).
- Klimaschutz durch Reduzierung des Energiebedarfs für Gebäudekühlung. Available online: http://www.umweltbundesamt.de/en/publikationen/klimaschutz-durch-reduzierung-des-energiebedarfs (accessed on 23 June 2017). (In Language).
Figure 1.
Breakdown of different air-conditioning (AC) typologies [12,13,14,15,16,17,18,33,34,35,36,37,38].

Figure 2.
AC energy consumption per type and sector, EU28 (see references in the Appendix A, Table A1, Table A2, Table A3, Table A4 and Table A5).

Figure 3.
AC energy consumption per type, residential and service sectors, EU28 (see references in the Appendix A, Table A1, Table A2, Table A3, Table A4 and Table A5).

Figure 5.
Distribution of installed AC application per type, residential and service sectors, EU15 [13,43,44].

Figure 6.
Distribution of cooled floor area per type, residential and service sectors, EU15 (see references in the Appendix A, Table A1).
Figure 6.
Distribution of cooled floor area per type, residential and service sectors, EU15 (see references in the Appendix A, Table A1).
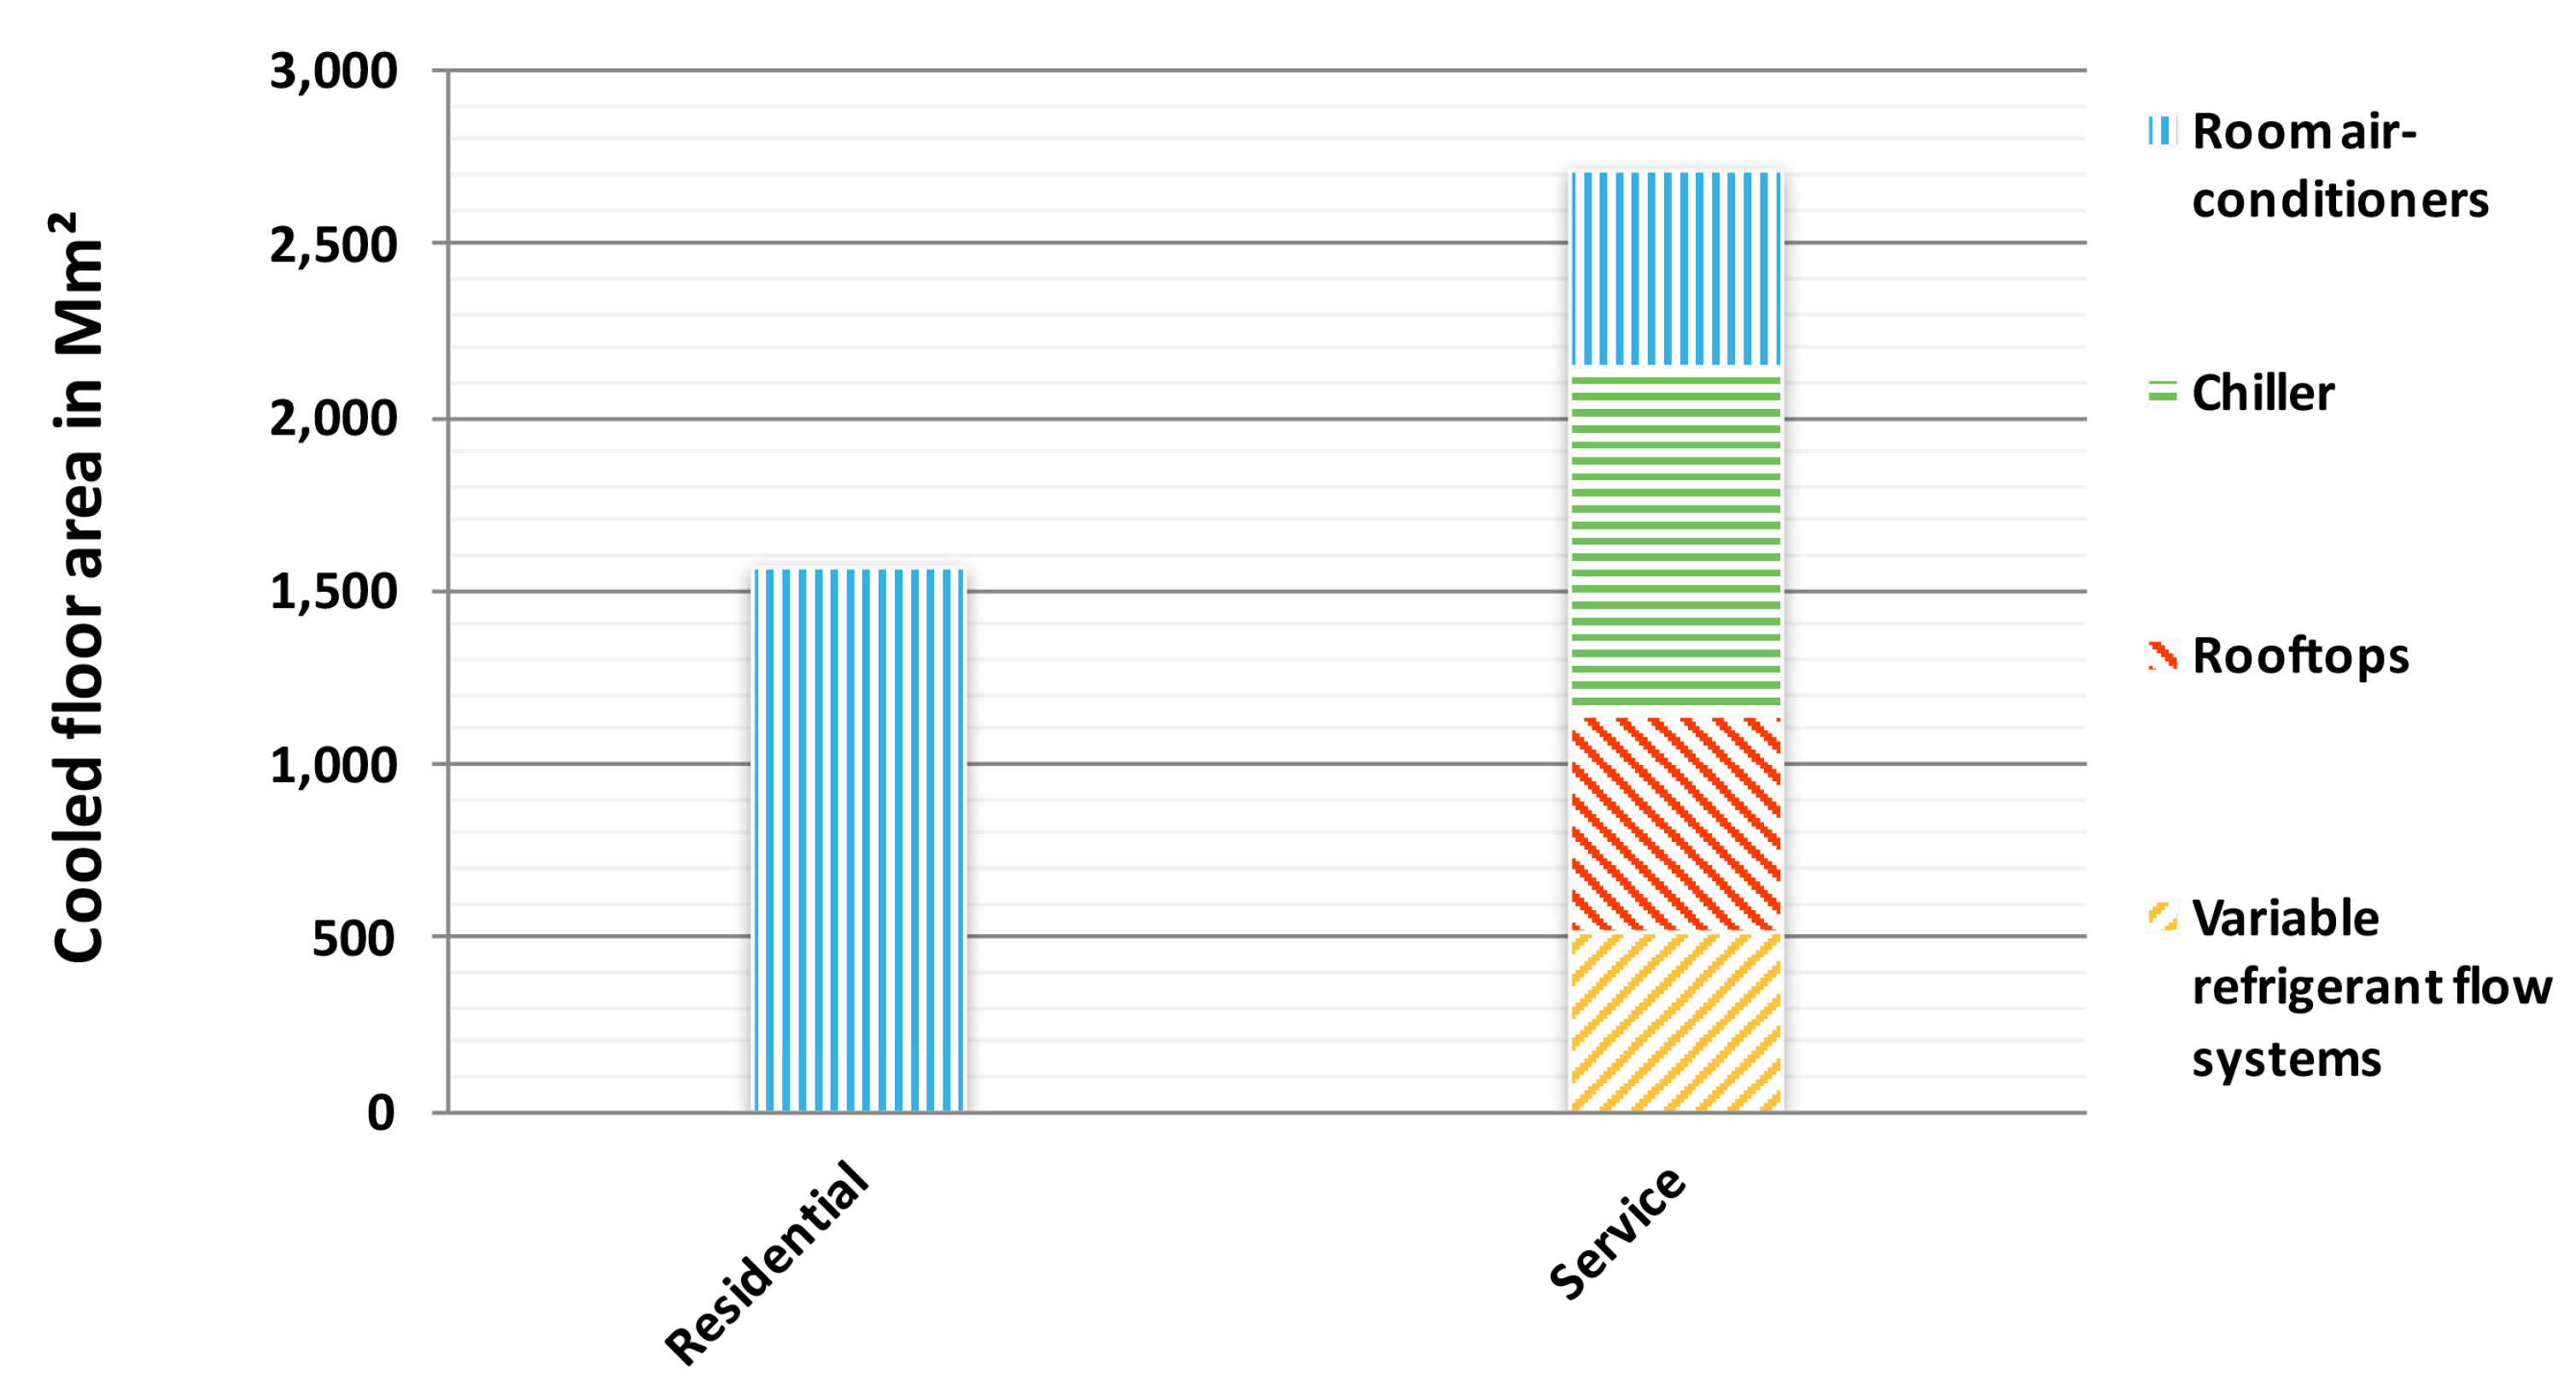
Figure 7.
Distribution of average AC equivalent full-load hours, residential and service sectors, EU15 (see references in the Appendix A, Table A2).
Figure 7.
Distribution of average AC equivalent full-load hours, residential and service sectors, EU15 (see references in the Appendix A, Table A2).
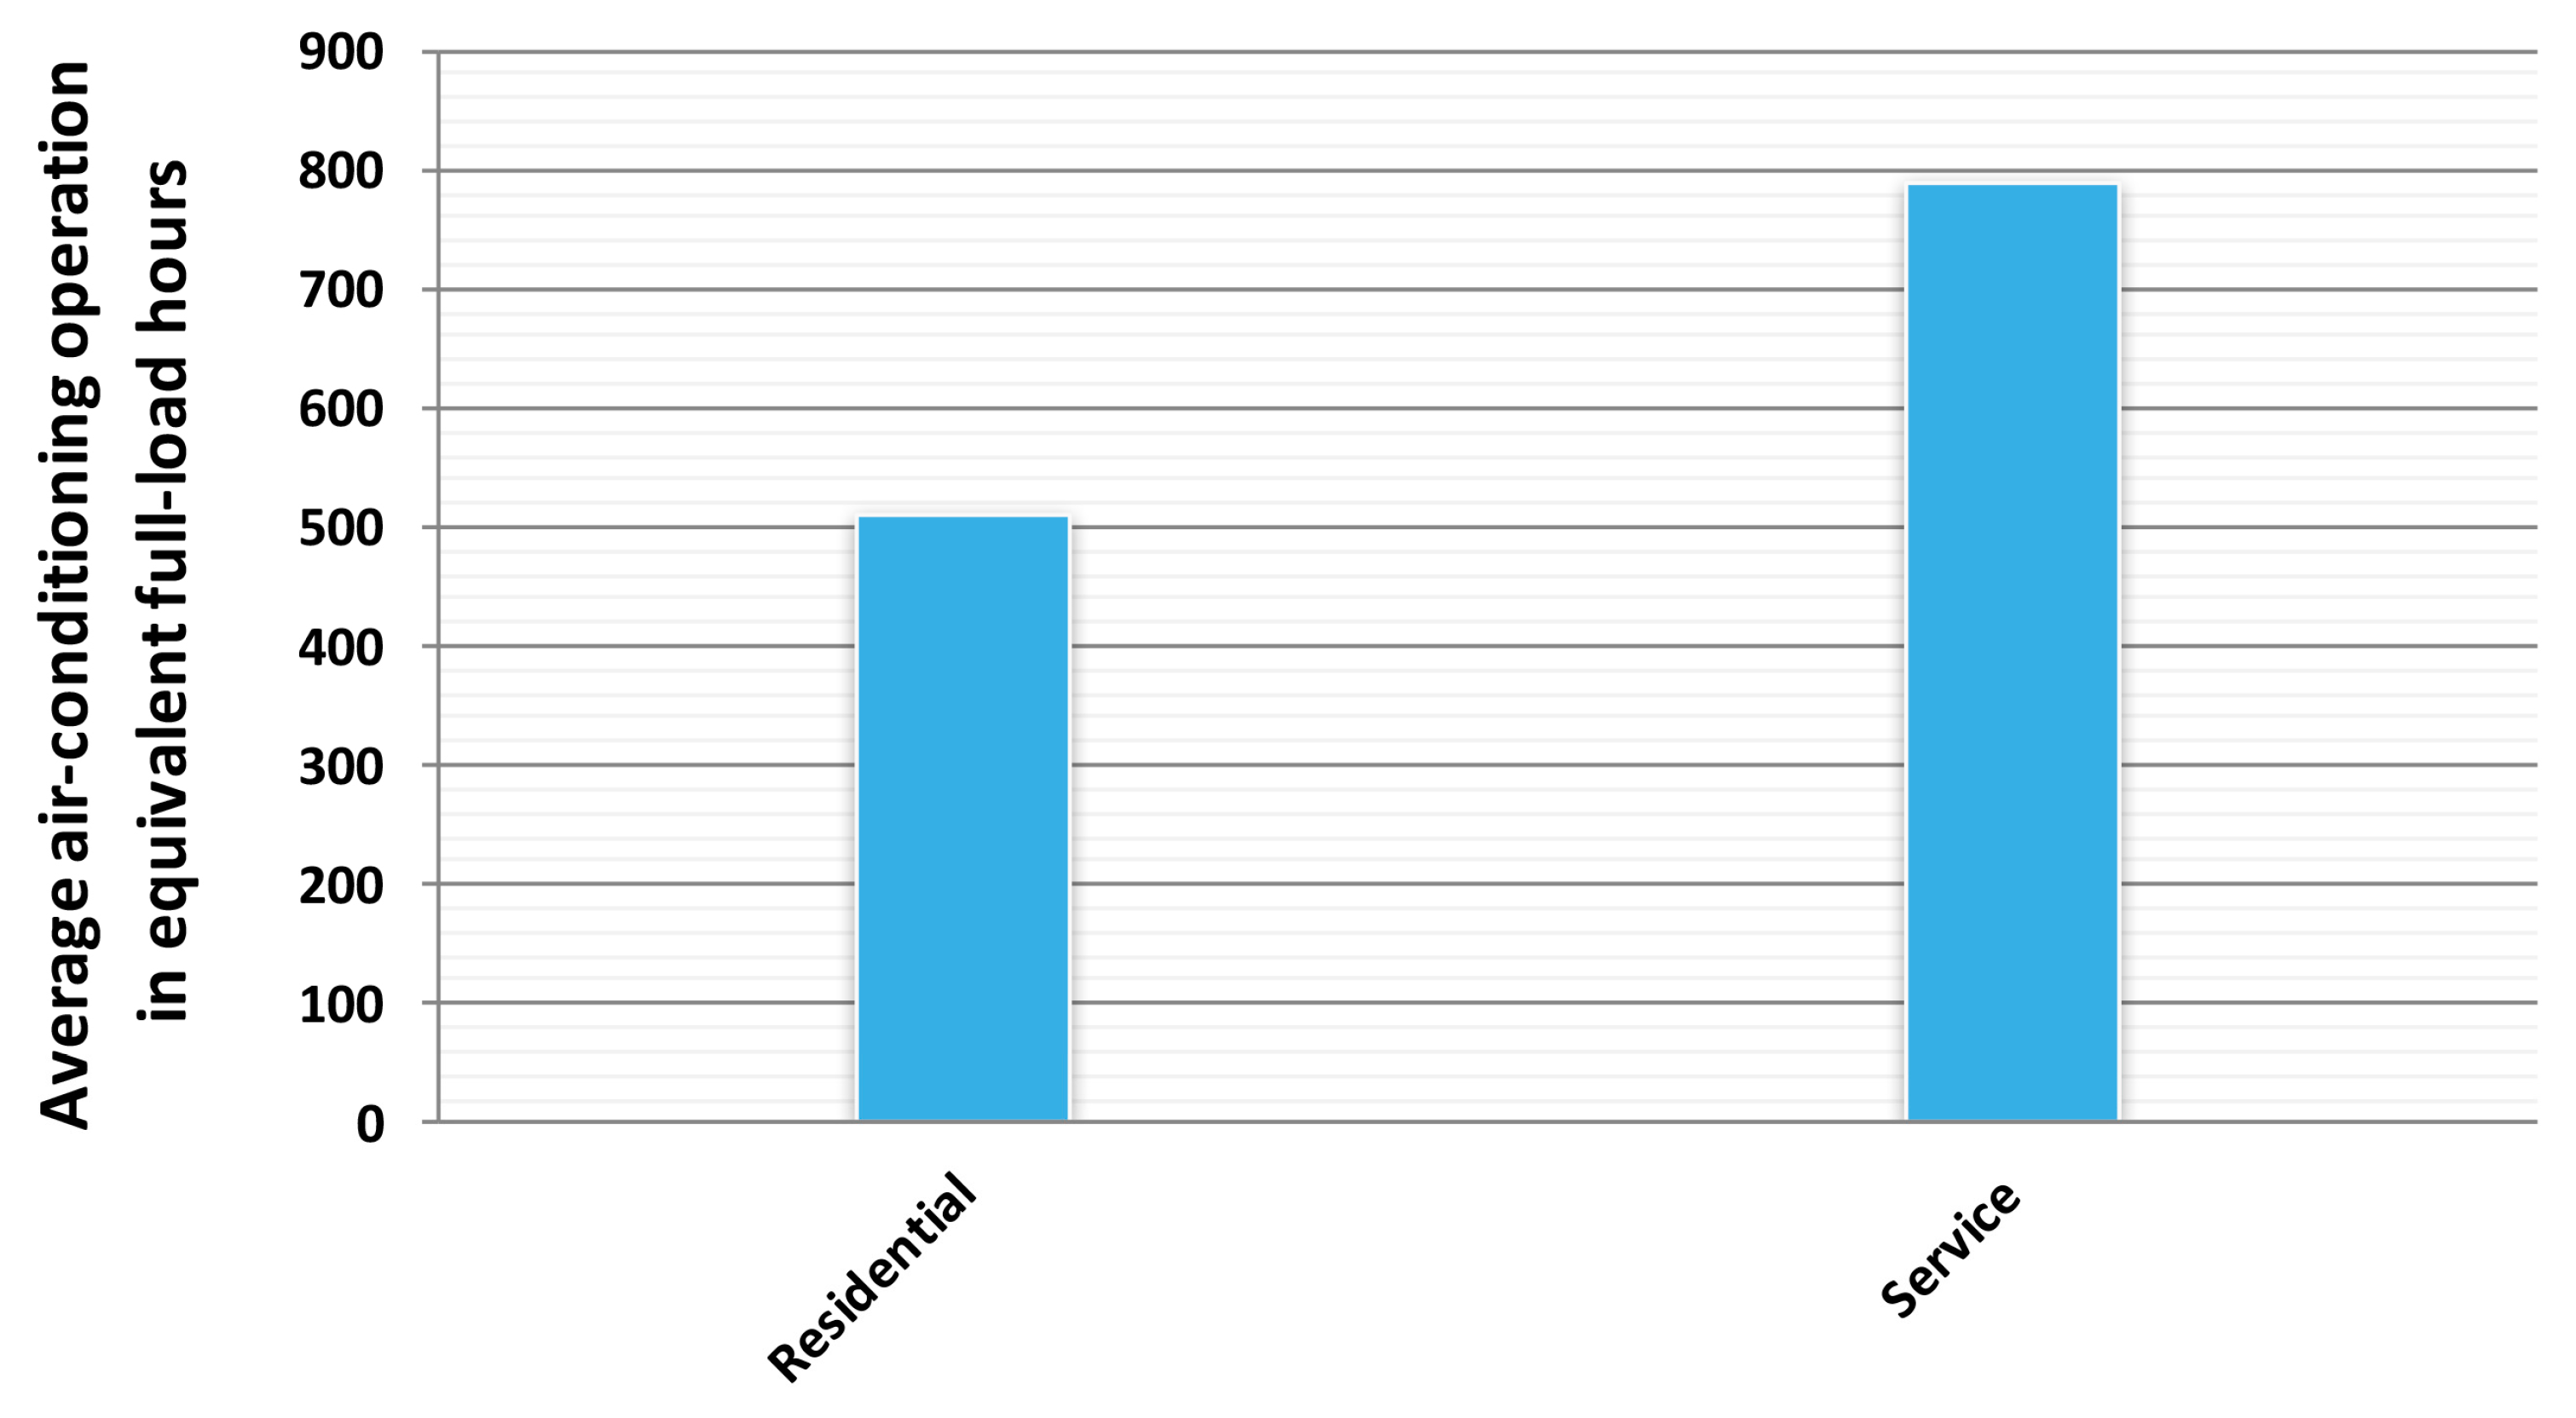
Figure 8.
Distribution of average AC equivalent full-load hours per sector, EU15 (see references in the Appendix A, Table A2).
Figure 8.
Distribution of average AC equivalent full-load hours per sector, EU15 (see references in the Appendix A, Table A2).

Figure 9.
Distribution of cooled floor area per sector and AC type, EU15 (see references in the Appendix A, Table A1).
Figure 9.
Distribution of cooled floor area per sector and AC type, EU15 (see references in the Appendix A, Table A1).
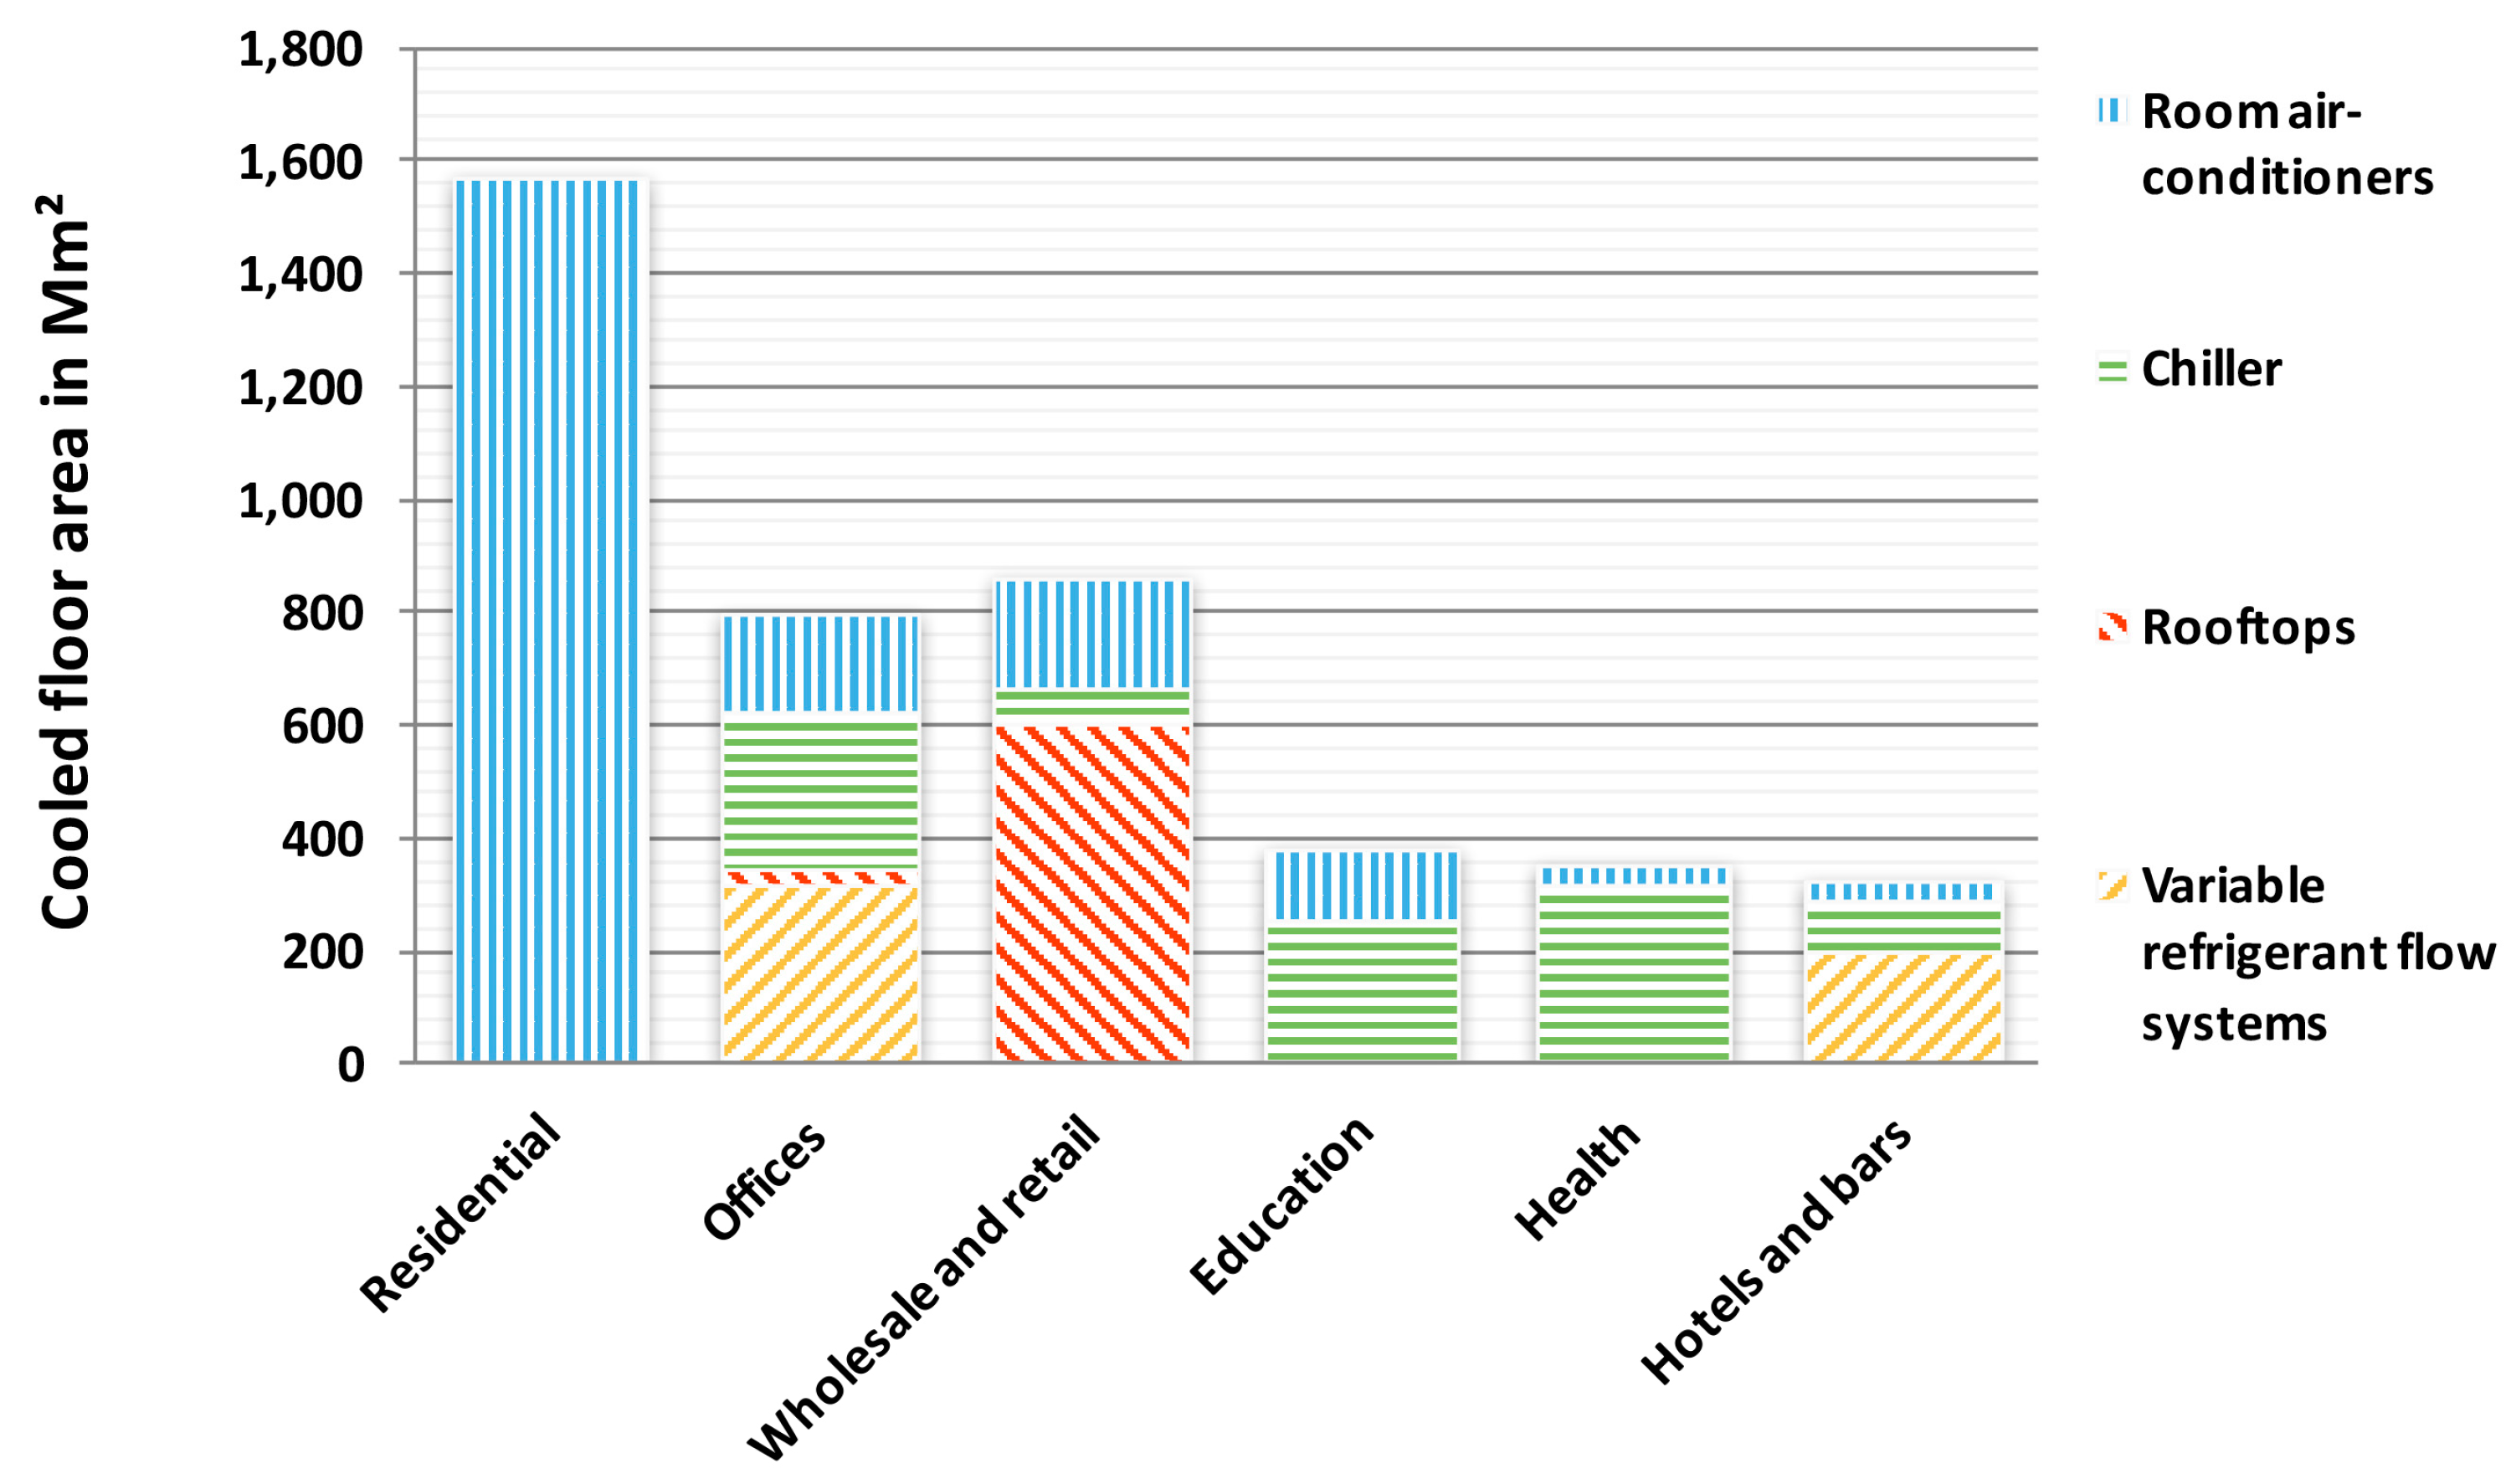
Figure 10.
Number of operative units per AC type, EU15 (see references in the Appendix A, Table A3).
Figure 10.
Number of operative units per AC type, EU15 (see references in the Appendix A, Table A3).
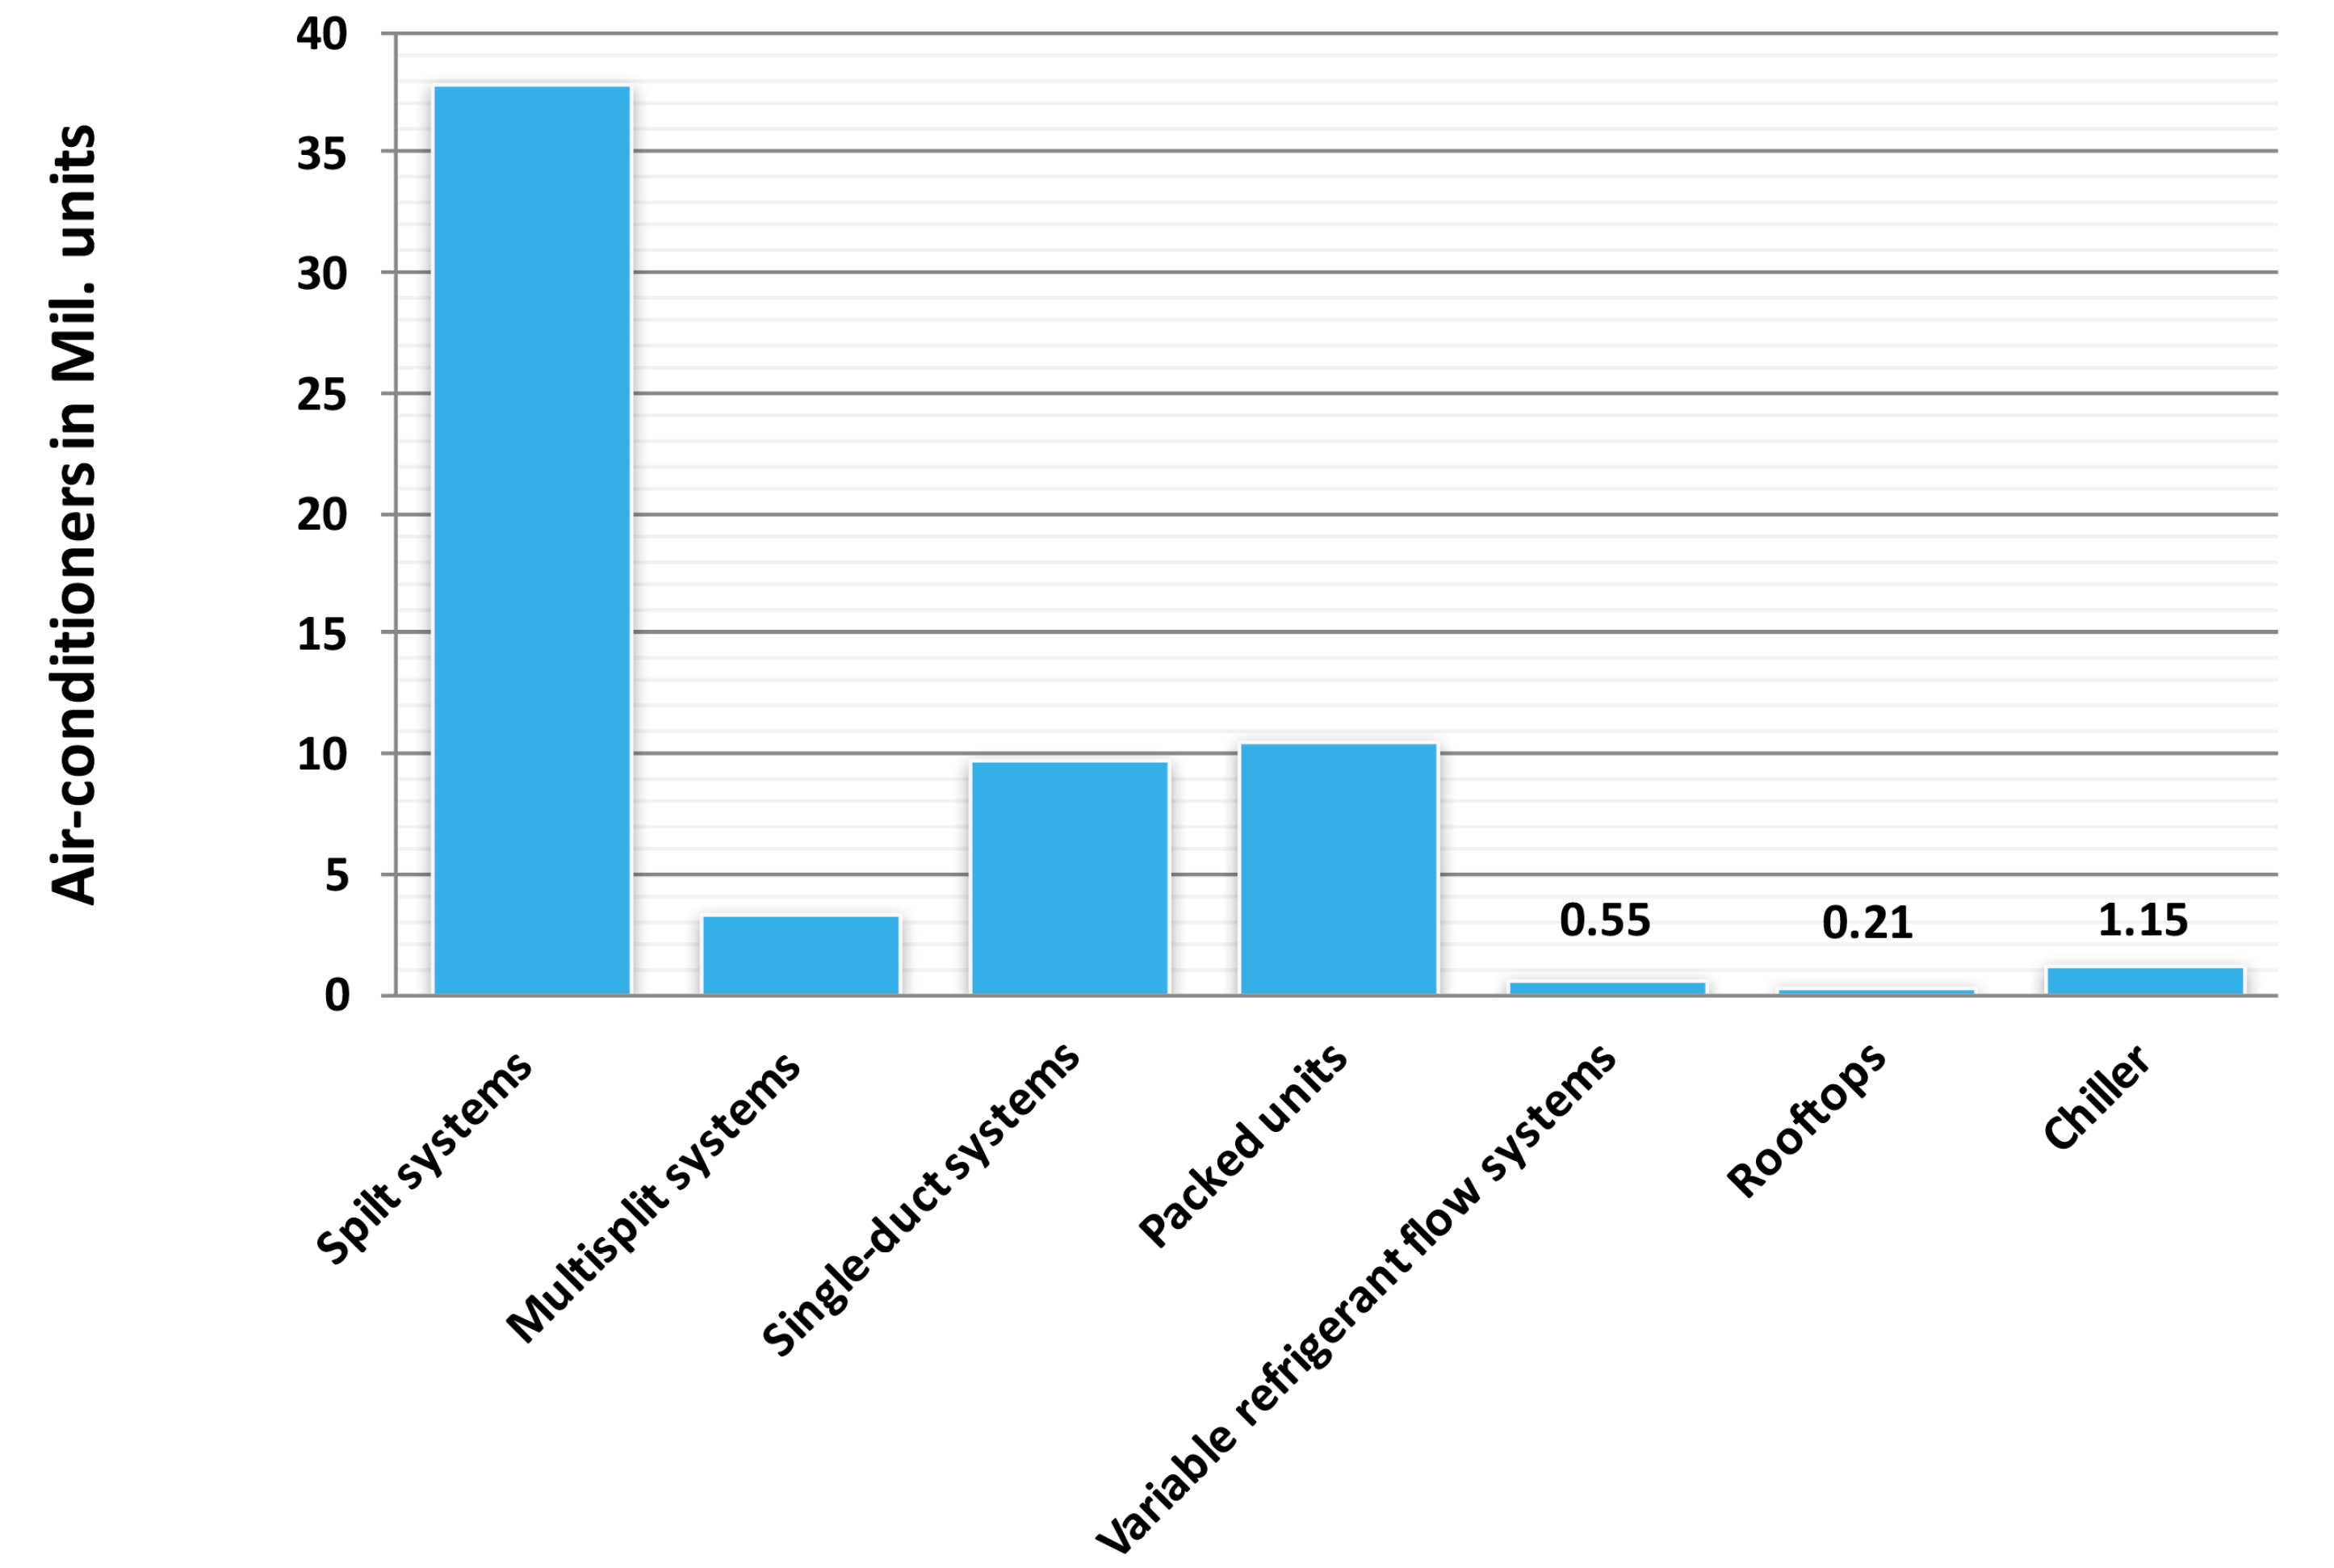
Figure 11.
Average installed capacity per AC type and sector, EU15 (see references in the Appendix A, Table A4).
Figure 11.
Average installed capacity per AC type and sector, EU15 (see references in the Appendix A, Table A4).
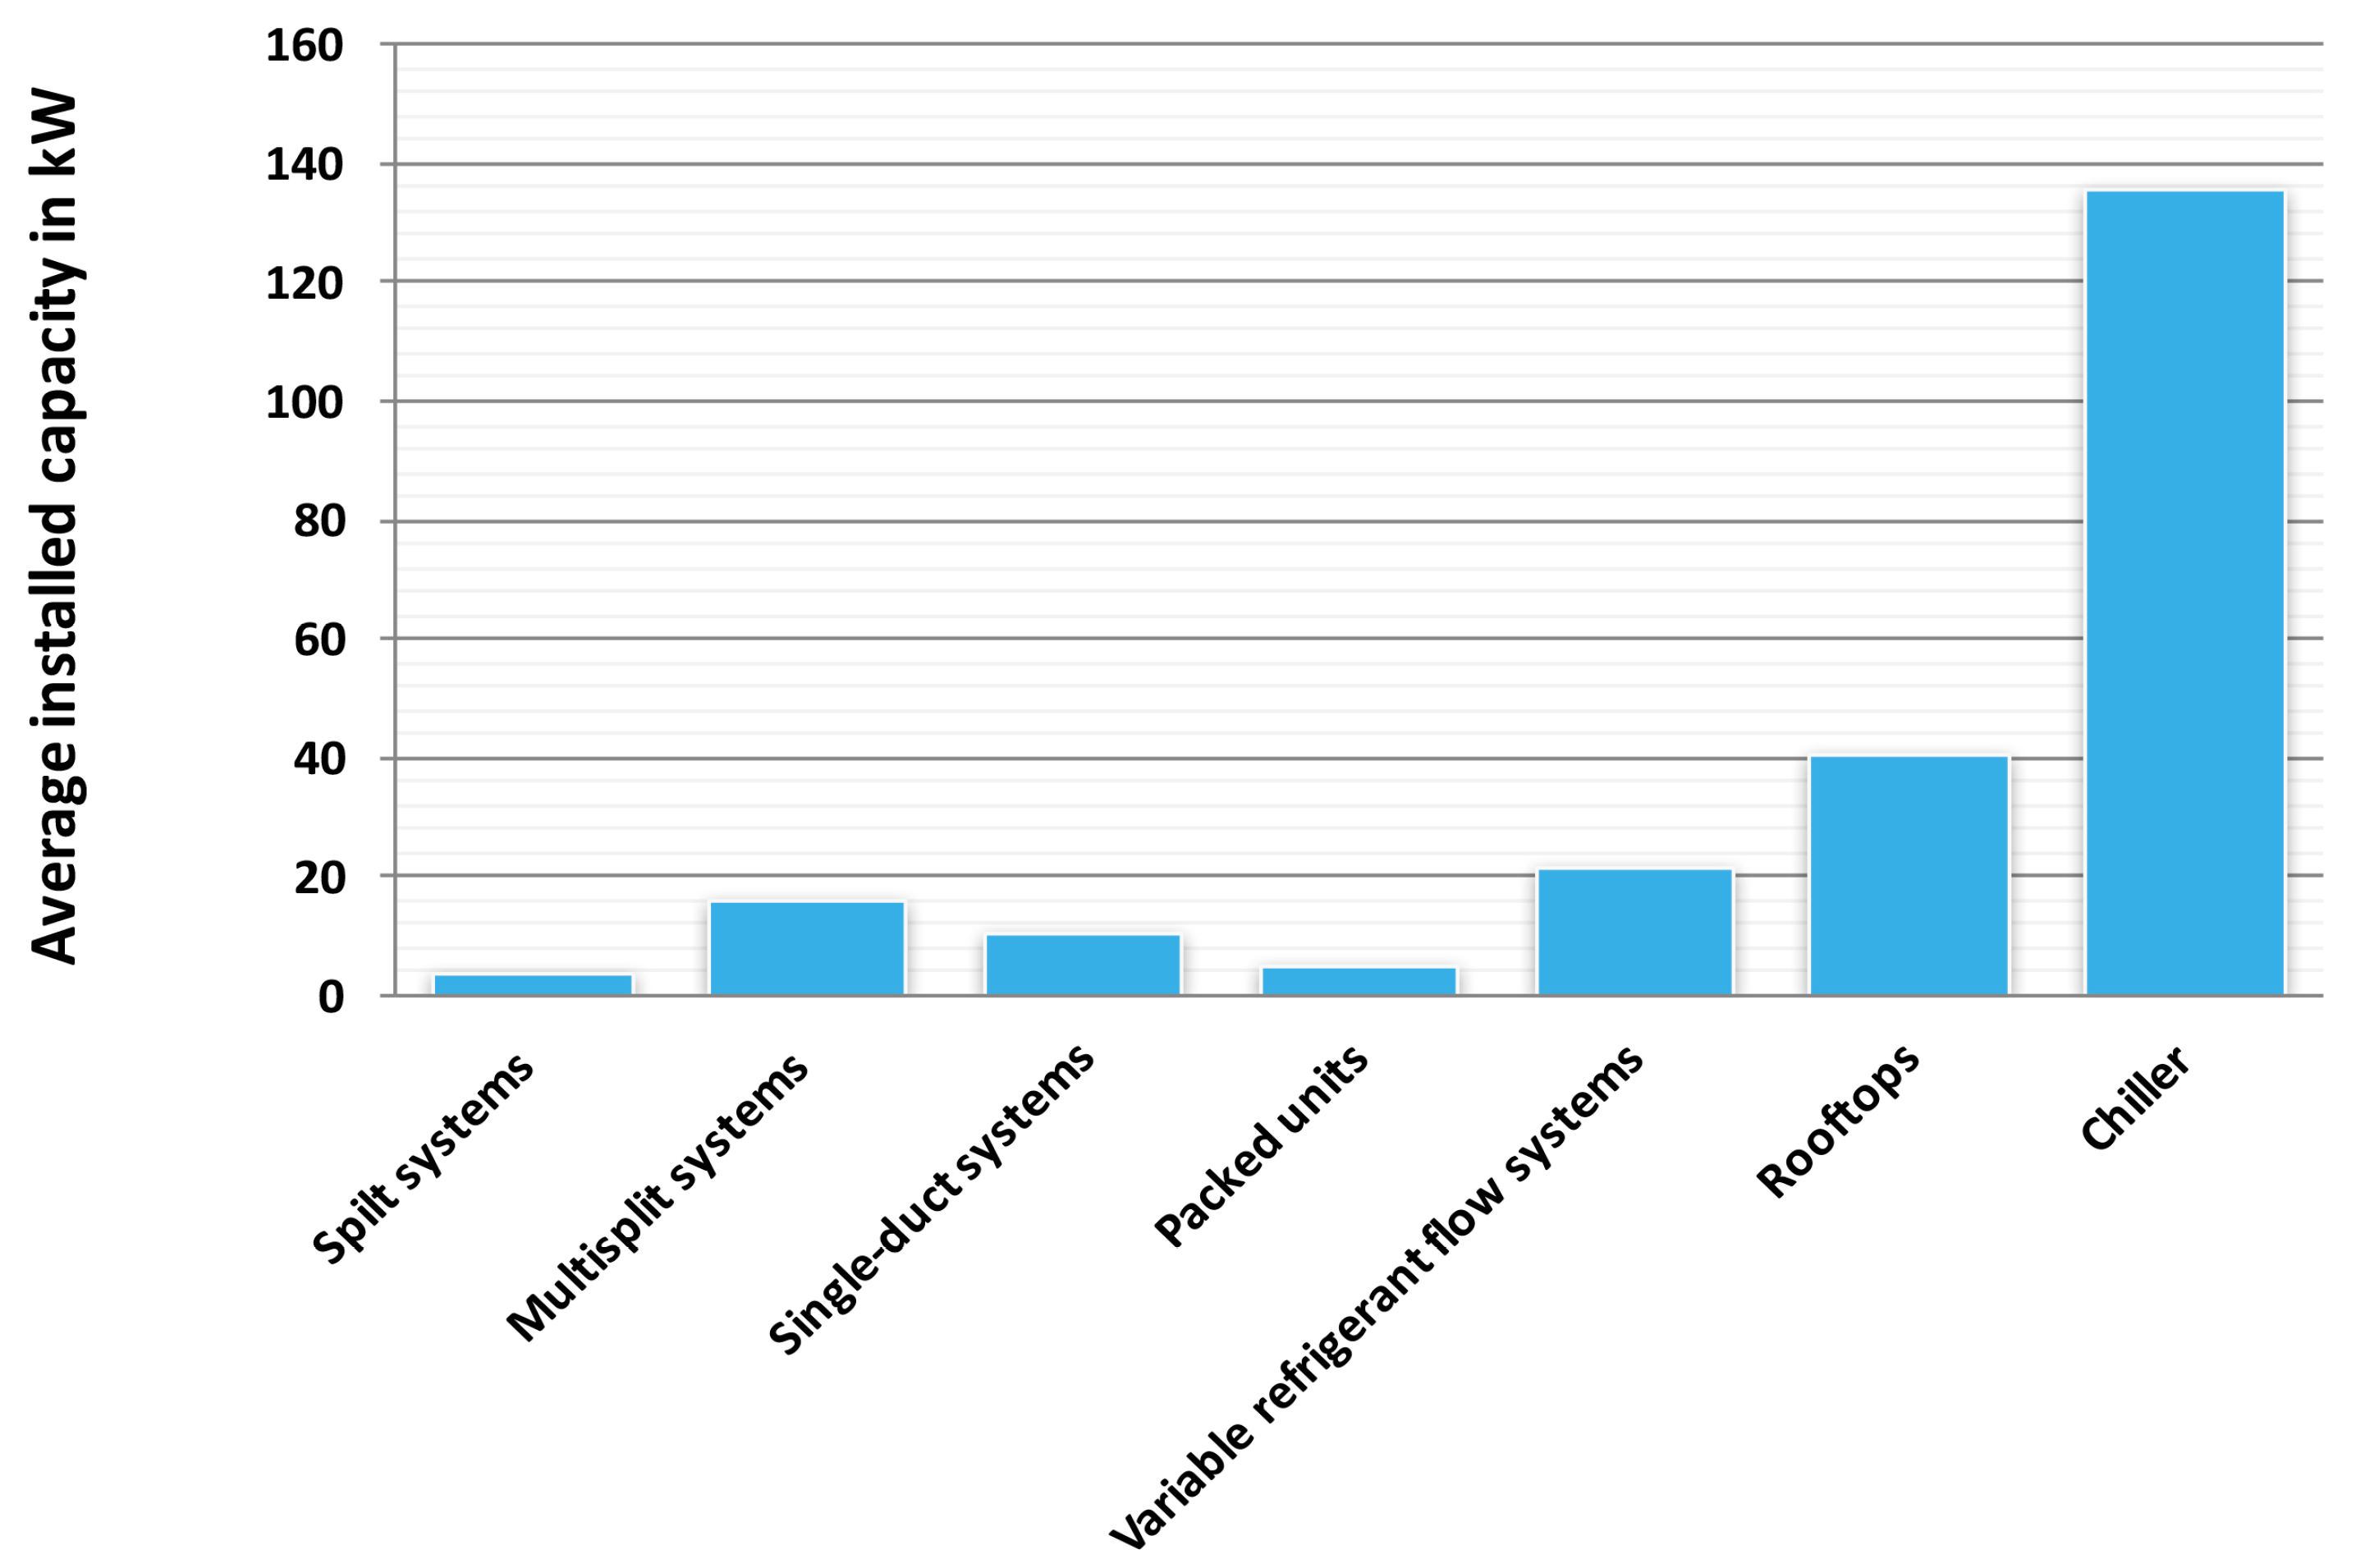
Figure 12.
Seasonal energy efficiency ratio (SEER) per AC type, EU15 (see references in the Appendix A, Table A5).
Figure 12.
Seasonal energy efficiency ratio (SEER) per AC type, EU15 (see references in the Appendix A, Table A5).

Figure 13.
Electricity input per AC type, EU15 (see references in the Appendix A, Table A4 and Table A5).
Figure 13.
Electricity input per AC type, EU15 (see references in the Appendix A, Table A4 and Table A5).
© 2017 by the authors. Licensee MDPI, Basel, Switzerland. This article is an open access article distributed under the terms and conditions of the Creative Commons Attribution (CC BY) license (http://creativecommons.org/licenses/by/4.0/).
Share and Cite
MDPI and ACS Style
Pezzutto, S.; De Felice, M.; Fazeli, R.; Kranzl, L.; Zambotti, S. Status Quo of the Air-Conditioning Market in Europe: Assessment of the Building Stock. Energies 2017, 10, 1253. https://doi.org/10.3390/en10091253
AMA Style
Pezzutto S, De Felice M, Fazeli R, Kranzl L, Zambotti S. Status Quo of the Air-Conditioning Market in Europe: Assessment of the Building Stock. Energies. 2017; 10(9):1253. https://doi.org/10.3390/en10091253
Chicago/Turabian StylePezzutto, Simon, Matteo De Felice, Reza Fazeli, Lukas Kranzl, and Stefano Zambotti. 2017. "Status Quo of the Air-Conditioning Market in Europe: Assessment of the Building Stock" Energies 10, no. 9: 1253. https://doi.org/10.3390/en10091253
Note that from the first issue of 2016, this journal uses article numbers instead of page numbers. See further details here.