Development of a Transmission and Distribution Integrated Monitoring and Analysis System for High Distributed Generation Penetration


1
School of Electrical Engineering, Korea University, Anam-ro, Sungbuk-gu, Seoul 02841, Korea
2
R&D Evaluation Center, Korea Institute of S&T Evaluation and Planning, 68 Mabang-ro, Seocho-gu, Seoul 06775, Korea
*
Author to whom correspondence should be addressed.
†
The research reported in this study was conducted while Jaewan Suh was affiliated with Korea University
Energies 2017, 10(9), 1282; https://doi.org/10.3390/en10091282
Submission received: 9 August 2017
/
Revised: 22 August 2017
/
Accepted: 26 August 2017
/
Published: 28 August 2017
(This article belongs to the Section F: Electrical Engineering)
Abstract
:To date, power system analysis has been performed separately for transmission and distribution systems. Due to the small influence of distribution systems on transmission systems, separate analyses have had no accuracy problems in existing power systems. However, as the amount of distributed generation (DG) in distribution systems increases, neighboring distribution systems and even transmission systems can be affected by the distributed generation. Therefore, a power system operator needs a new system to analyze the power system, one that considers the mutual interactions between the transmission and distribution systems. This paper presents with applications and case studies a transmission and distribution integrated monitoring and analysis system for high DG penetration. The integrated system analyzes the mutual interaction between the transmission and distribution systems due to DG. The preliminary evaluation of the DG connections is automated in this system, using real time online data. Case studies with practical data show the need and effectiveness of transmission and distribution integrated monitoring and analysis for real power systems with high DG penetration.
1. Introduction
Recently distributed generation (DG) penetration has increased, and distributed power generation has increasingly affected power systems [1,2]. Many DG use renewable resources such as wind power, solar power, hydro. Energy storage systems (ESSs) in distribution systems are also counted as DG. In Korea, the government aims to generate 12.5% of the total electricity from DG and 5.3% of the total electricity from renewable DG by 2029 [3]. However, renewable DG has already caused some problems in power systems in southwestern Korea, including reverse power flows and voltage violations during low electricity demand periods with a high penetration of DG. Large-scale DG in distribution systems can affect transmission as well as neighboring distribution systems. For example, photovoltaic distributed generators (PVDGs) connected to radial distribution feeders can cause a reverse power flow (RPF). The function of the protection and regulation devices placed in the radial distribution feeders can be disturbed by the RPF, because the devices consider power flow in one direction [4]. DG can also have an impact on the feeder voltage profile. DG output will reduce the load current seen from the transformer by supply loads in the feeders, and can even cause RPF. This results in under- or overcompensation of the load tap changer (LTC) [5]. Vita et al. have analyzed the impacts of DG on voltage profiles, power losses or lighting protection for distribution networks [6,7]. DG systems have also been developed into hybrid renewable energy source (HRES) systems such as microgrids. The HRES system has multiple renewable resources and the control of the resources is getting more complicate [8,9,10,11,12]. The complicated DG system can have problems which have not seen before such as fault currents and imbalance issues [13,14,15]. Research on development of the planning and analyzing platform based on geographic information system (GIS) for DG system was conducted [16].
Monitoring, analysis, and evaluation associated with DG has been performed for individual distribution systems, assuming that in practice the power flow is unidirectional in a distribution system [17,18,19]. Conventional radial distribution systems have been able to operate using separate methods, but as the DG connection increases, there is a need to accurately monitor and analyze such systems. In separate analysis and monitoring, DG could be connected and operated in a distribution system without considering the actual effects on other distribution feeders and transmission systems [20]. Therefore as the installed DG has increased, the necessity to transmit and distribute integrated analysis has occurred [21,22,23].
This paper presents a new transmission and distribution integrated monitoring and analysis system and methodology to evaluate the effects of DG in integrated system, and it recommends a method for the optimal operation of DG. The proposed system is new concept of grid operating for practical DG penetrated power systems. In previous grid operating systems, transmission and distribution systems are managed separately and the effect of DG cannot be analyzed properly. To analyze the effects of DG in real power system operations, the transmission and distribution integrated monitoring and analysis system is connected to a distribution automation system (DAS) and supervisory control and data acquisition (SCADA). When transmission and distribution integrated systems analyze DG connected power systems, both the SCADA and DAS system data are automatically combined. A new methodology and automated process for preliminary evaluation of DG connection also proposed in the paper. Case studies performed using practical data from Jeollanam-do Province in South Korea show the effectiveness and differences of the integrated system.
2. Architecture of the Transmission and Distribution Integrated Monitoring and Analysis System
Figure 1 shows the architecture of the integrated monitoring and analysis system. In Korean power systems, the transmission system is monitored in real-time using SCADA. The Substation Operating Management System (SOMAS) records of the Korea Electric Power Corporation’s (KEPCO) real-time data (main transformer, transmission line, breaker, etc.) from SCADA every 30 s. The DAS monitors and provides the operating conditions of the distribution system in real-time [24,25]. Feeder remote terminal units installed in the distribution system send the state data of the equipment to the main server via a communication device. Although DAS can acquire data in several seconds depending on the communication type, in order to synchronize with the SOMAS, the integrated system produces integrated data every 30 s. Unlike SCADA, DAS also receives data of each phase from distribution lines and this enables one to analyze the unsymmetrical faults and power flow theoretically. However in practical power system operation, there are issues with single phase data reliability due to the numerous transposition events in distribution lines. Therefore, an arithmetic mean of the phase data is obtained and converted into three-phase balanced data. If the DAS monitored voltage value of a connection node does not match with the SCADA data, data of the next two distribution nodes are used for data validation.
There are two types of transmission and distribution integrated system-network and stand-alone. Figure 2a,b show the main menu from each version. In the stand-alone version, an operator installs the transmission and distribution integrated analysis program on a stand-alone computer for monitoring and analysis.
This version uses a power system data file extracted from DAS and SOMAS. In the network version, an integrated server acquires and stores power system data from SOMAS and DAS automatically, and every PC connected to the KEPCO network can run transmission and distribution integrated monitoring and analysis functions without installing any software. By using this network version, system operators in regional headquarters can easily use the transmission and distribution integrated monitoring and analysis systems.
3. Functions of the Transmission and Distribution Integrated Monitoring and Analysis System
3.1. Integrated Data Acquisition and Convergence
Within the transmission and distribution integrated monitoring and analysis system, the transmission data is acquired from the SCADA system and the distribution data through DAS. The DAS system monitors power facilities installed on distribution systems and their operational status in real time [26,27], swiftly identifies any functional failure, shortens the time of failure through remote control, and reduces malfunctioning parts to support and ensure a stable power supply. Figure 3 shows the algorithm of the distribution system’s data acquisition in DAS. The data acquired by DAS and SCADA converge in the transmission and distribution integrated analysis and monitoring system, and are combined at the connection point between the distribution and transmission systems. The data conversion program selects a power system subjected to the integrated analysis to perform data merging of the selected distribution systems.
3.2. Power System Analysis
The transmission and distribution integrated monitoring and analysis system compares the results of the analysis automatically with the Korean power system regulations and provides a violation warning to users. The following analyses, which are difficult to perform with a conventional system that analyzes transmission and distribution separately, can be performed in an integrated system. Those analysis functions are essential for high DG penetrated power system operation.
- Power flow, fault current calculation
- Automated preliminary evaluation of DG connection
- DG connection impact on neighboring distribution or transmission systems
- Transmission system fault current contribution of DG in distribution system
- Phase angle information for connection switch operation between different distribution systems
For power flow analysis, power system operator can choose between Gauss-Seidel and Newton-Raphson methods. In all fault analyses, the fault type is assumed to be a 3-phase fault, which yields the maximum short-circuit current values. In addition, every power flow and fault current analysis in this paper is performed in an assumed 3-phase balanced condition in practical operation. The transmission system fault current contribution from DG in distribution system also can be analyzed for reference in the transmission system protection plan. Phase angle information for connection switch operation is provided to the distribution system operator. This information can be analyzed in conventional DAS systems which assume the substation as a slack bus. By using phase angle differences at both ends of switch, the distribution operator can determine the switch operation.
3.3. Preliminary Evaluation of DG Connection
The main purpose of the transmission and distribution integrated monitoring and analysis system is to analyze the DG connection impact. Before DG installation, the system operator would need to consider the effect of DG on a power system. In a conventional system, the operator evaluates the effects of the DG manually, before it is connected [28]. Additionally, the operator only considers the effect of DG on the distribution line that is connected to a DG, and ignores the effects of the DG on the transmission and other distribution systems. However, in real operation, DG affects the power quality of other distribution or transmission systems. As DG penetration increases, these effects become a considerable problem in the Korean power system. When the system operator receives a request for a new DG installation from electricity suppliers, transmission and distribution integrated monitoring and analysis systems evaluate the impact of a new DG connection and display a warning to the operator when a regulatory violation is predicted. The input screen of a preliminary evaluation of a DG connection is shown in Figure 4.
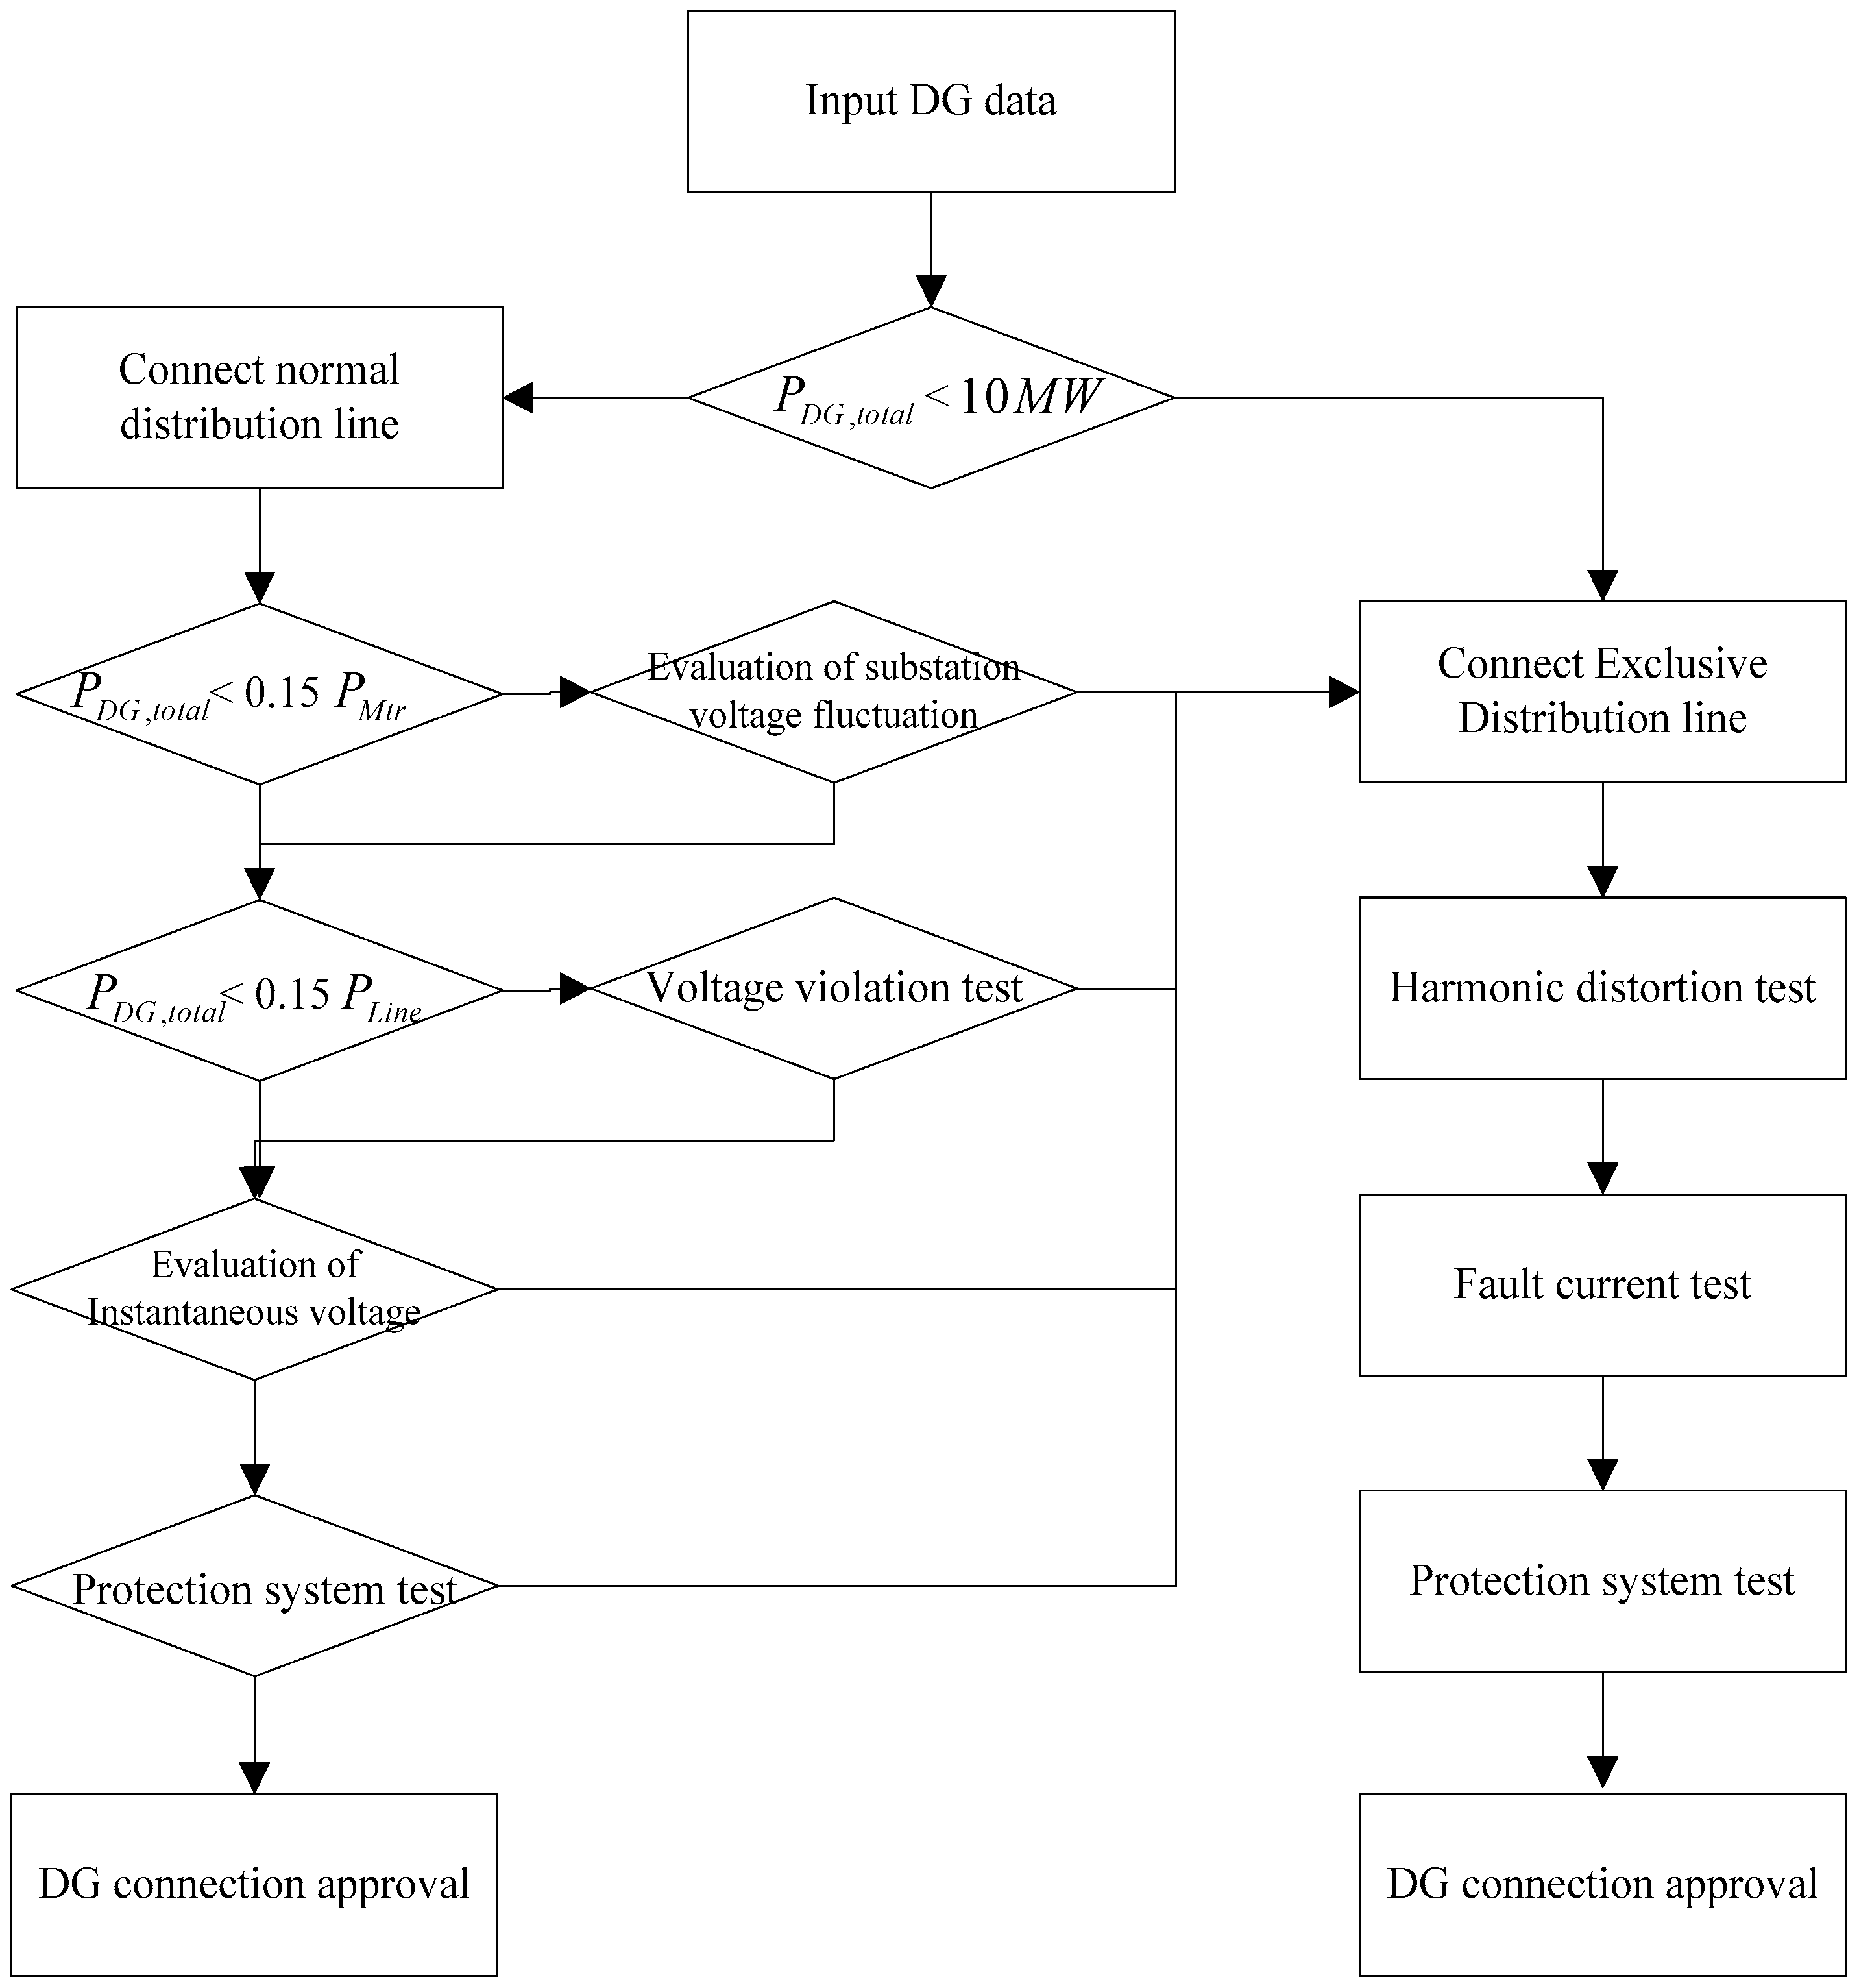
In this preliminary evaluation, a transmission and distribution integrated analysis provides a more accurate evaluation by covering the entire power system and the previously installed DG, thereby preventing problematic DG installations. This automated preliminary evaluation process considers a voltage fluctuation, short-circuit capacity, and the possibility of a violation of voltage or capacity regulations, as shown in Figure 5.
For preliminary evaluation, the operator has to input DG and transformer data such as location, capacity, transformer wiring and impedance. If the total capacity of the DG in the distribution system exceeds more than 15% of the main transformer (Mtr) capacity, the system automatically evaluates the substation voltage fluctuation. In a practical system, the on load tap changer (OLTC) and line drop compensation (LDC) methods are used for substation voltage control [29,30]. For LDC, the voltage of the regulating point in the distribution system can be calculated using [29,31,32]:
where is the voltage deviation of the distribution line, which can be expressed as:
From (4), the voltage deviation due to DG can be calculated as:
To prevent the frequent operation of OLTC and voltage fluctuation in the substation, should be restricted in a dead band of OLTC [29]:
If the DG failed to comply with (6), it cannot be connected to a normal distribution line. The integrated system tests a voltage violation when the total capacity of the DG in a distribution system exceeds more than 15% of the distribution line capacity. For the voltage violation test, the system calculates the power flow for the maximum and minimum output of the DG, and compares it to KEPCO’s voltage regulation (±2%). Unlike photovoltaic (PV) or synchronous generator type DGs, an induction generator type DG can cause an instantaneous voltage dip in the distribution line. Therefore, a dynamic simulation is conducted to confirm the instantaneous voltage violation for the DG connecting and disconnecting, which is shown as:
Nominal and fault currents due to DG can cause the false operation of protection relays on distribution line. In protection system tests, the integrated system detects false operations of the relay by comparing the nominal current and fault current to the relay setting. If the DG fails those tests and evaluation, the DG must be connected through an exclusive distribution line, which only connects to the DG. In this case, harmonic distortion and fault current tests are performed as additional steps. The total harmonic distortion (THD) must not exceed 5% of the fundamental frequency voltage in Korean power system regulation. The voltage matrix for each harmonic can be calculated as:
The THD for each bus can be represented as:
The integrated system examines the THD and bus voltages for each order harmonic in KEPCO regulation and IEEE standard 1547 [33]. After the harmonic distortion test, the maximum fault current is calculated to check whether the maximum fault current exceeds the limit of the relay. Then, the protection system is tested for an exclusive distribution line in the same way as a normal distribution line.
3.4. Determination of Area of Vulnerability
Voltage sag is one of the most significant problems within a power system, as it can cause damage to sensitive equipment [34]. Transmission and distribution integrated monitoring and analysis systems can determine the area of vulnerability for a voltage sag in the entire power system. In a separate analysis, the distribution system fault could not be considered for the area of vulnerability in transmission systems. However, those faults, especially in high DG-connected systems, can cause a voltage sag in the transmission or other distribution systems. Integrated monitoring and analysis systems use a fast method to determine the area of vulnerability [35]. The integrated system calculates the pre-fault voltage and voltage sag at every bus and centers of each distribution line. From the calculated voltage sag at every bus and centers of each distribution line, Lagrange second order interpolation is defined. Secant method is used to find the critical points in the entire transmission and distribution system.
3.5. Applications
A transmission and distribution integrated monitoring and analysis system is used for a distribution system optimization platform. By extending the range of the optimization target from distribution to transmission, a better optimal value can be obtained. The following applications based on integrated analysis are included in the system:
- Optimal placement of ESS/flexible alternating current transmission system (FACTS)
- OLTC Control
- Distribution system reconfiguration
Most of problems due to DG connection can compensated by ESS and FACTS devices. Optimal placement application enables the power system operator to maximize the utilization of ESS, FACTS, and DG. In this application, the optimal location of new ESS and FACTS devices is provided to the operator, taking into account the voltage violation and total line loss. In OLTC control applications, the dead band range and operation point are decided to minimize the number of OLTC operations with consideration of substation voltage fluctuation. Distribution system reconfiguration aims to equalize power flow in the distribution lines. By using power flow analysis results, the system recommends an optimal change of the distribution network. More applications will be developed and applied to the transmission and distribution integrated monitoring and analysis system through further study.
4. Case Studies
In the case studies, actual distribution network data from the Jeollanam-do Province and transmission network data from KEPCO are used. There are about 70 substations in Jeollanam-do. Distribution systems under seven major substations are the subjects for the case study simulations. Fault current, power flow, voltage fluctuation, and preliminary evaluation of DG were simulated. The simulations focus on the problems that had not been observed through previous methodologies. At first, power flow simulation was performed to compare the integrated system to the conventional systems. Power flow results show the difference between the accurate analysis of the integrated system and the incomplete analysis of the existing systems. Case studies 4.2–4.4 show the effects of DG on transmission systems and other distribution systems which were impossible to analyze in the existing separate system. Case study 4.5 compares the preliminary evaluation results of the proposed system with that of the existing system for the DG, which caused the problems in the practical distribution system, and verify the accuracy of the integrated analysis.
4.1. Comparison of Power Flow Analysis Result
A simulation was performed with the same transmission system data to ascertain the difference between the conventional method and the integrated method. In conventional transmission monitoring and analysis systems, the effect of the DG in distribution systems cannot reflect the results of the transmission analysis. Table 1 and Table 2 show the differences in the results between the two analyses. In conventional distribution analysis, a substation that connects between a distribution system and a transmission system is assumed to be a slack bus. Usually, the slack bus voltage is assumed to be 1 < 0°, which neglects the effects of a transmission system or other distribution systems. The voltage angle difference is large because the voltage angle is a relative value. In this case study, a 3-phase current injection method for distribution systems is used as a comparison [36], and the conventional Newton-Raphson method is used for transmission analysis.
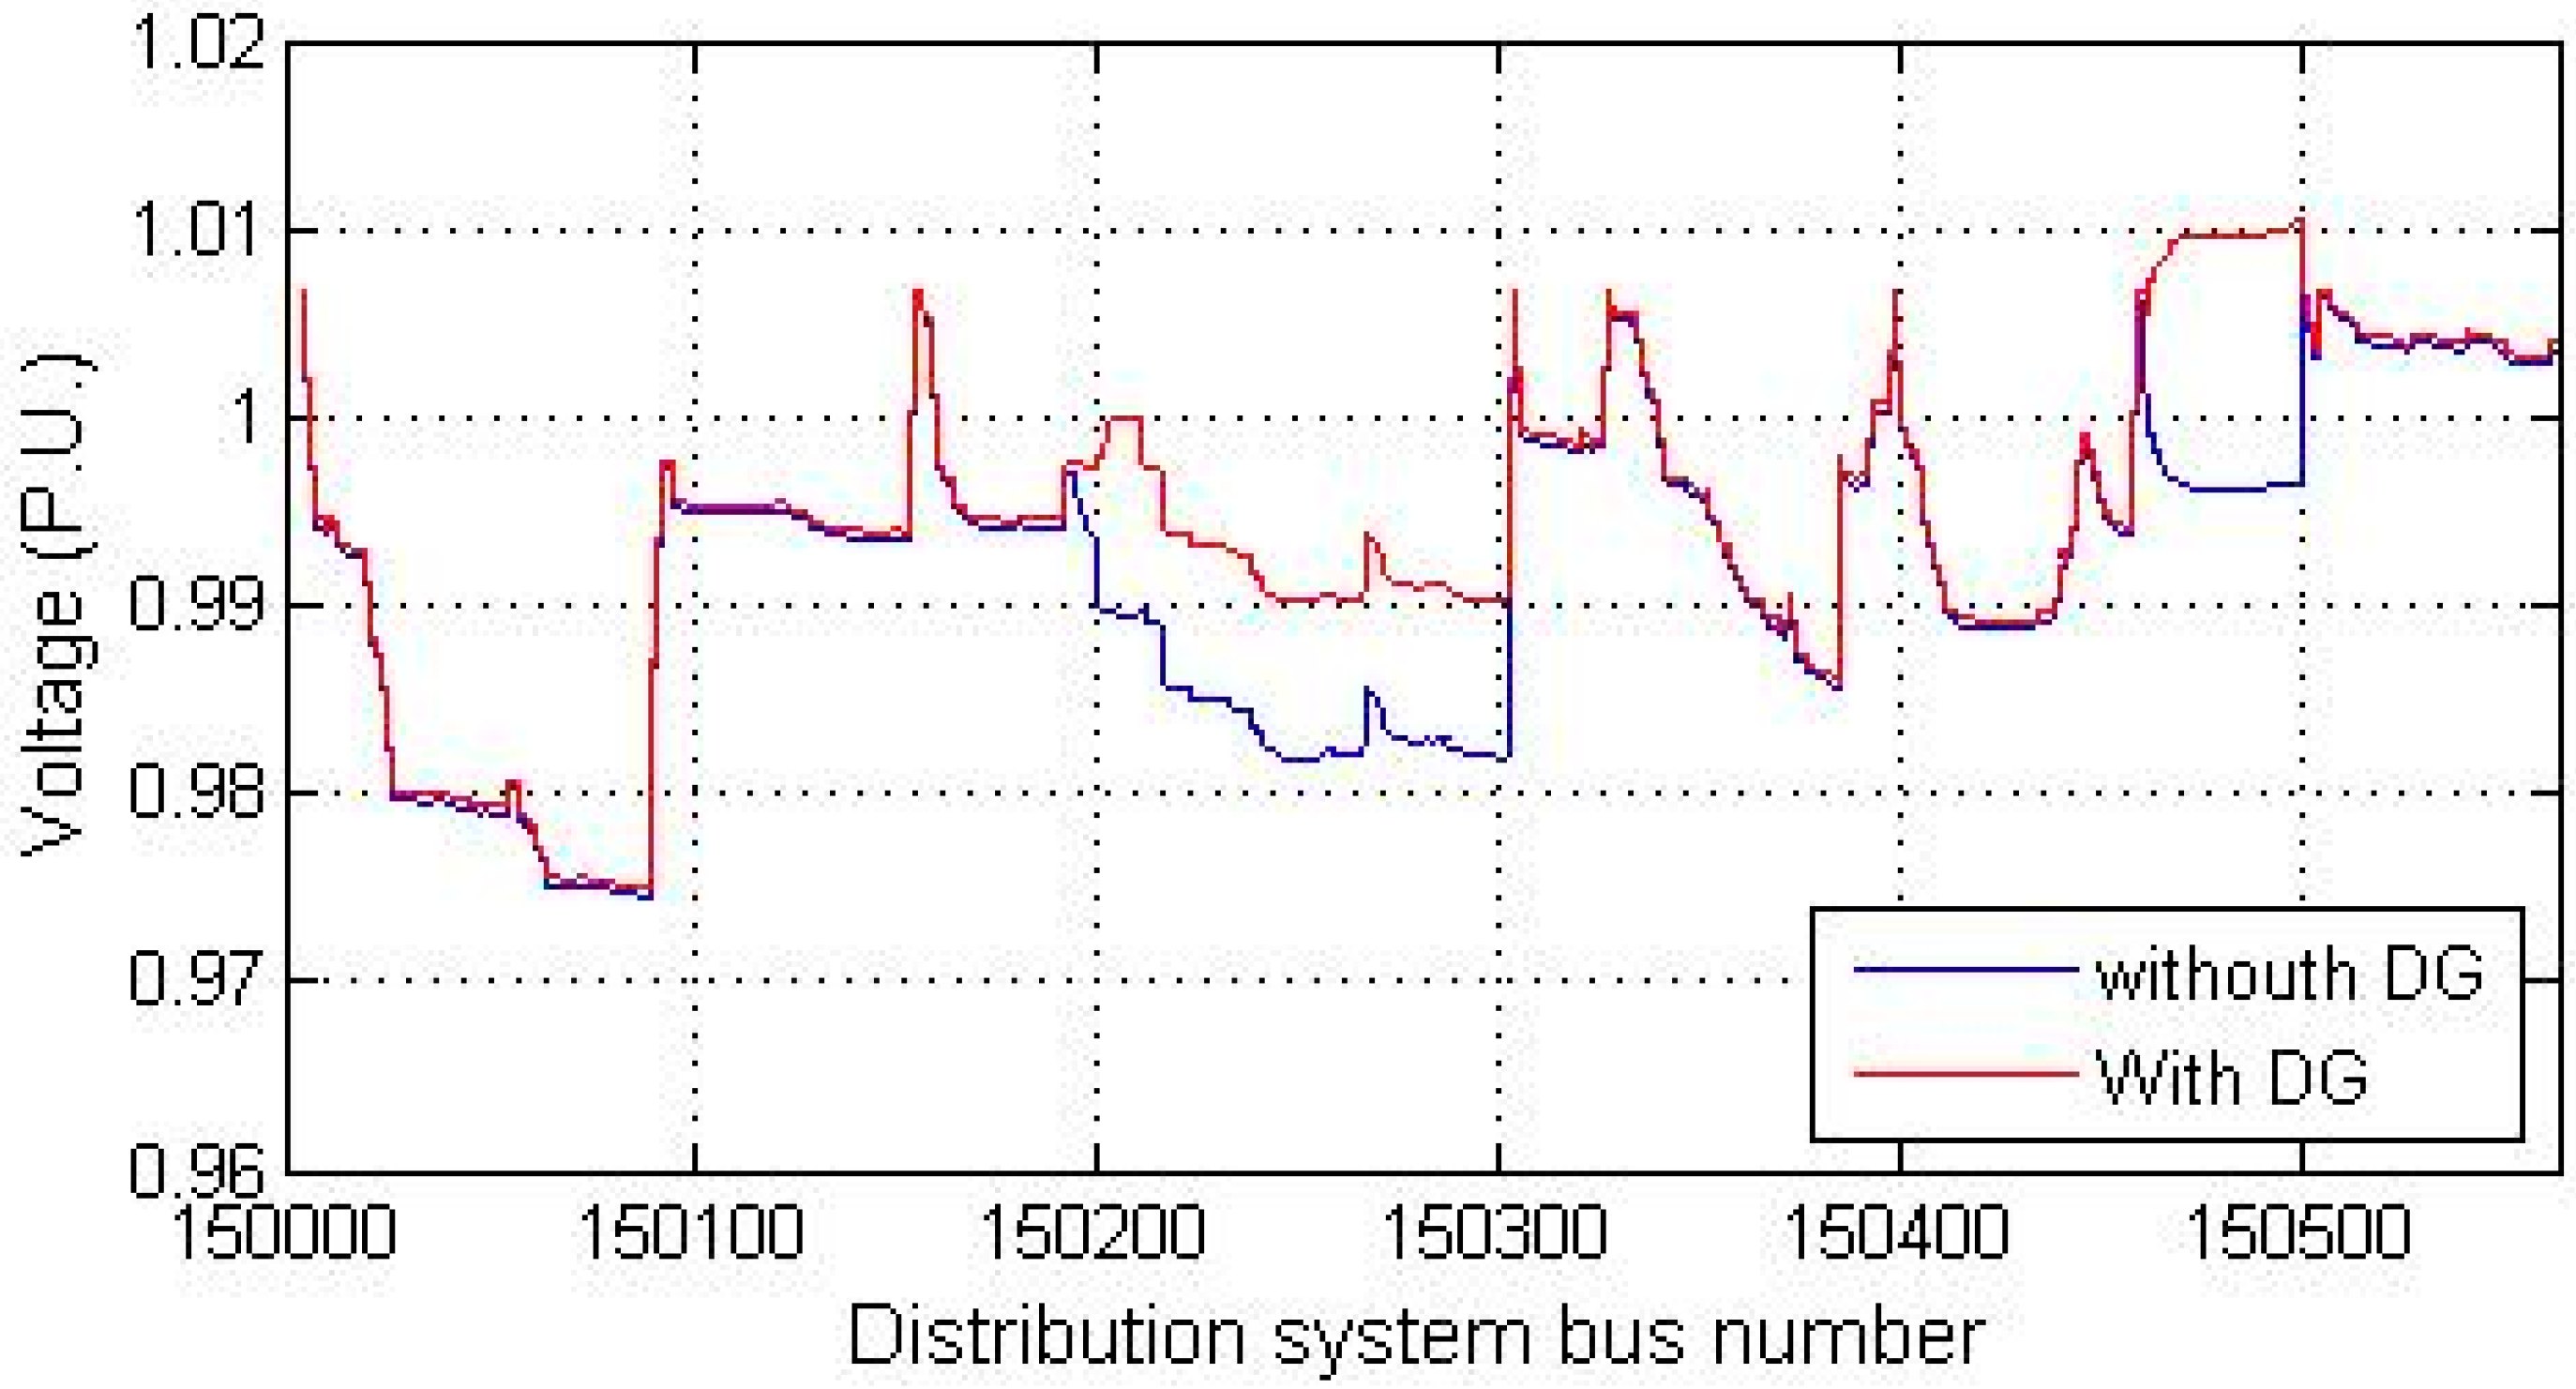
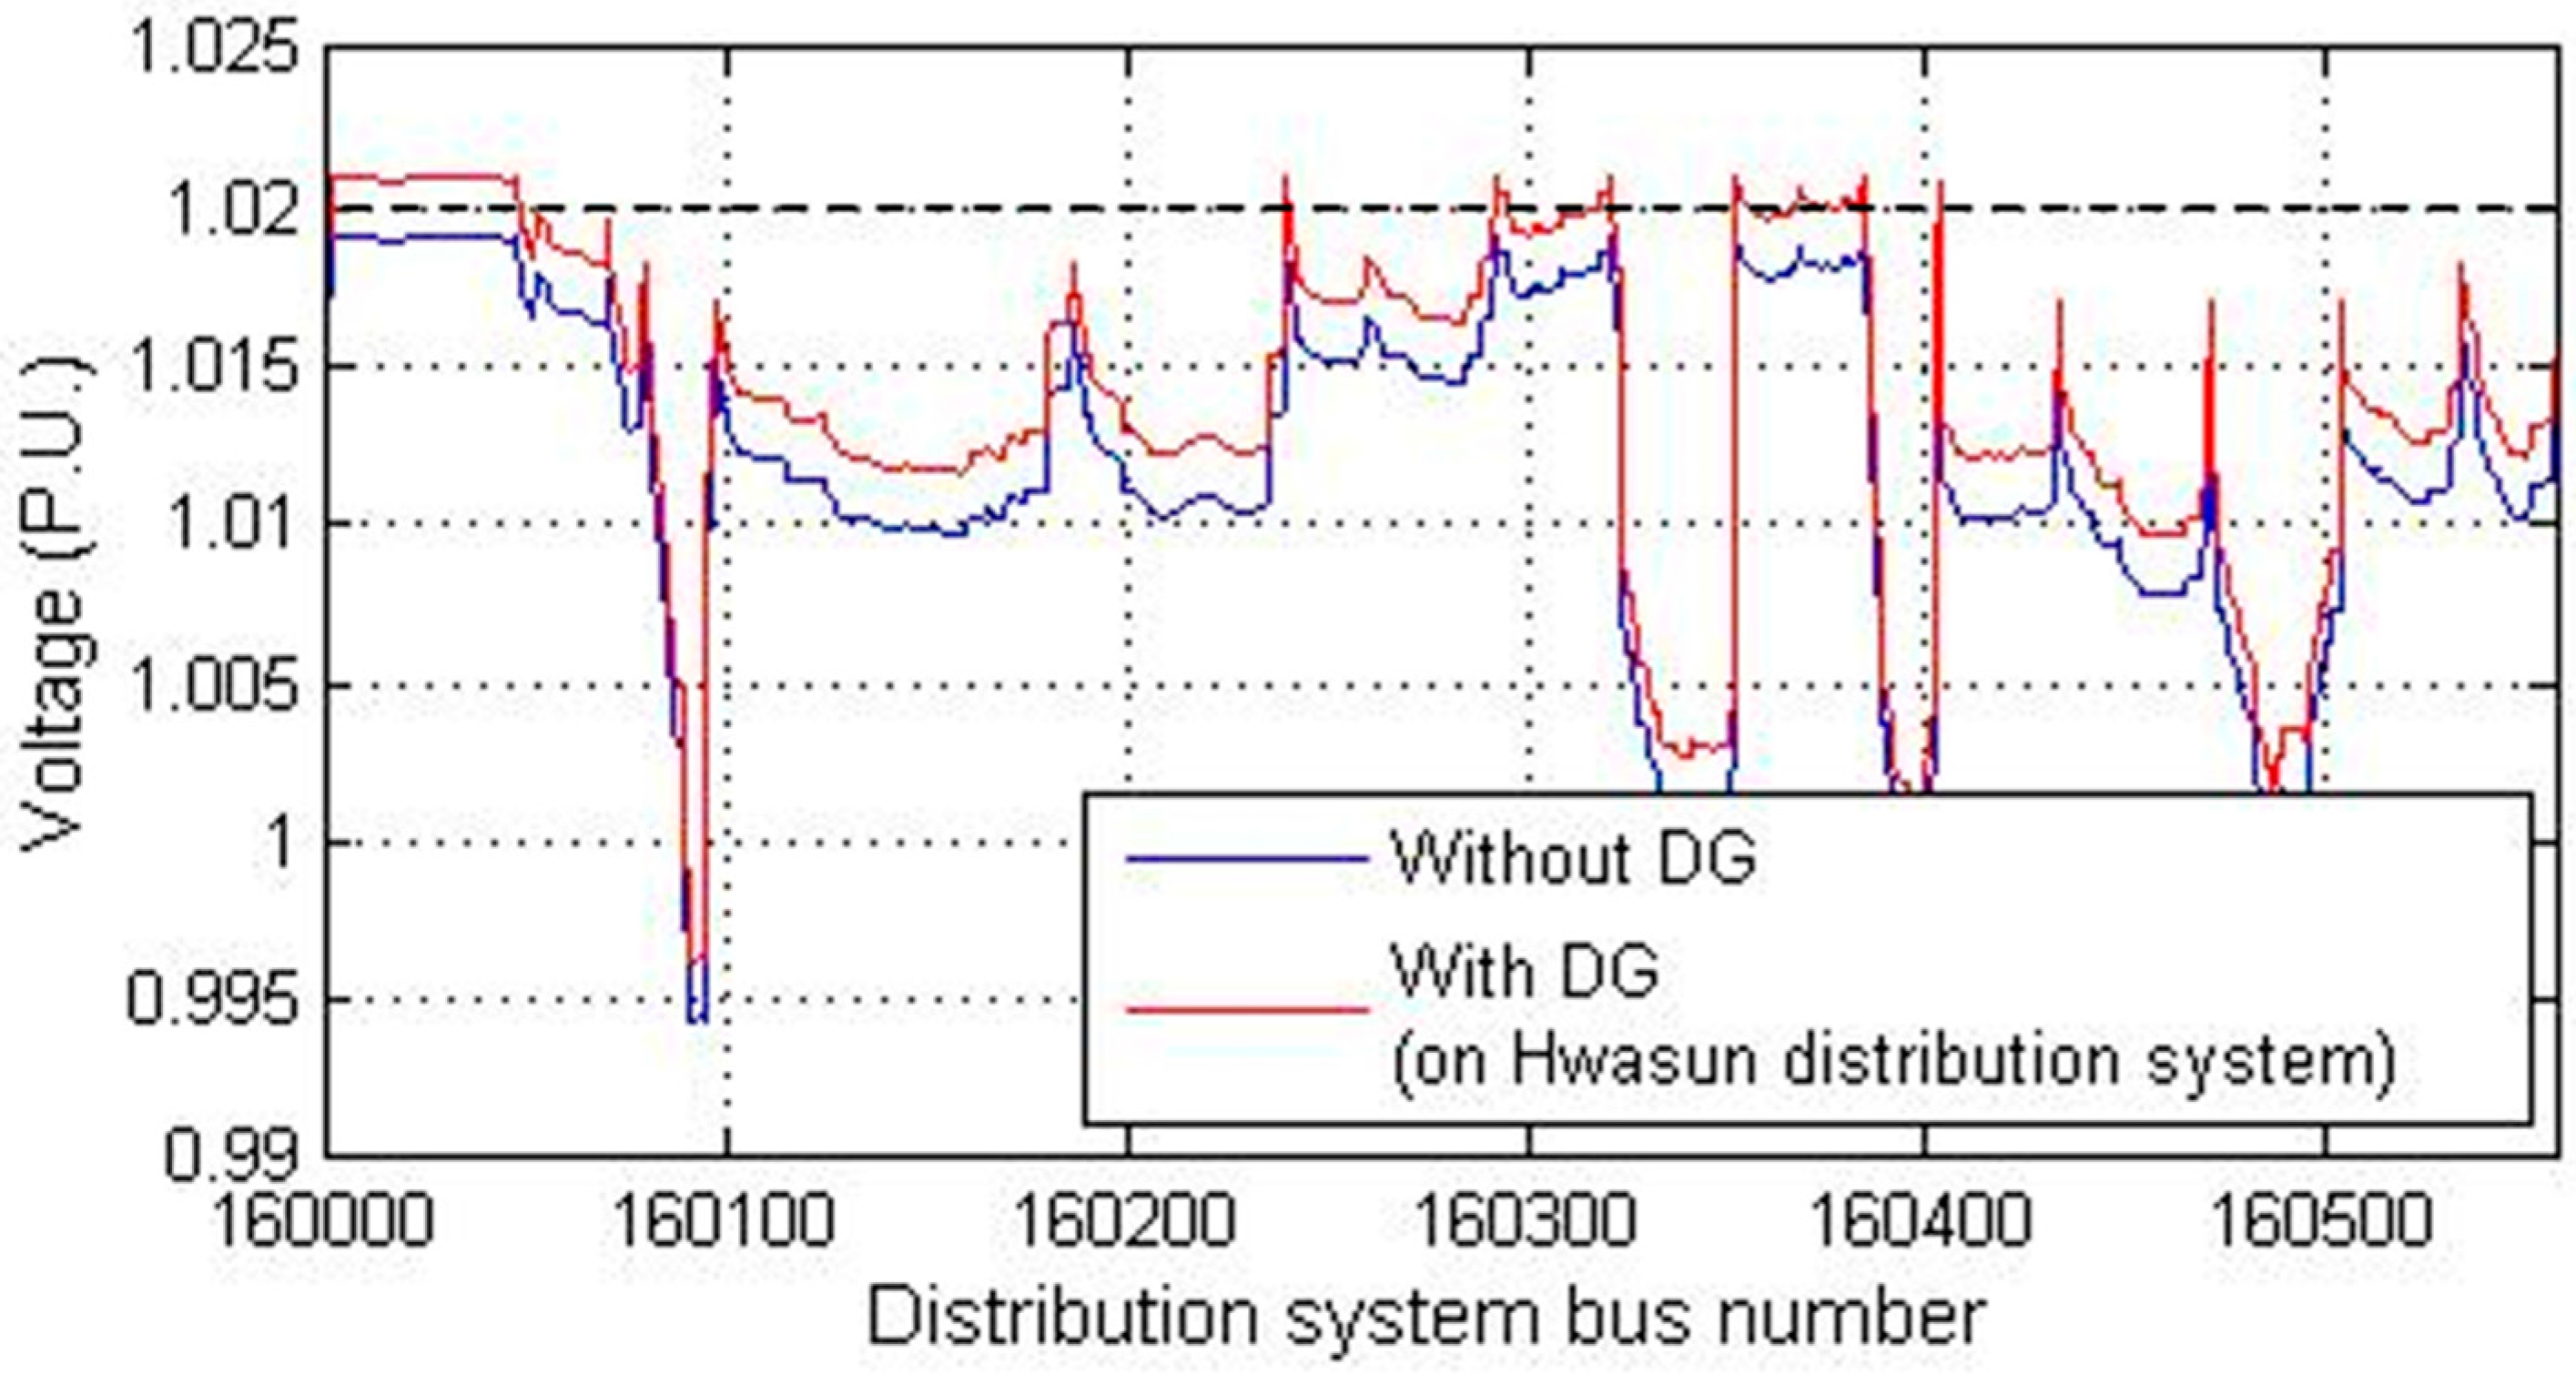
4.2. DG Impact on Neighboring Distribution System and Transmission System
KEPCO performed an assessment of the influence only for each feeder, to determine the DG connection. However, if large-scale DG is connected in a distribution system, other neighboring distribution systems or transmission systems would have a higher risk of voltage problems. Previously, the distribution system was separately analyzed, and such a problem had never been considered. In this case study, the occurrence of a voltage problem in neighboring distribution or transmission systems due to a distribution system DG connection was simulated. Figure 6 and Figure 7 show the voltage profile of the Hwasun and South Gwangju distribution systems with DG on the Hwasun distribution system. The result of the simulation shows that if the DG was supplied to the feeders below the Hwasun substation, then the feeders below the Hwasun substation do not experience a voltage problem, while the feeders below the South Gwangju substation could have a voltage problem due to the DG on the Hwasun distribution system. Such a possibility has not been noticed in previous analyses, demonstrating the need for distribution and transmission integrated monitoring and analysis systems for DG supply consideration.
4.3. Phase Angle Difference at Both Ends of the Normally Open Switch
Currently, KEPCO’s distribution system is structured in connection with other feeders in the same substation or other substations via normally open switches on the end of the distribution line. By controlling such a switch, the distribution systems can operate more efficiently, or can supply power during system failures or maintenance. However, in closing the normally open switches, the difference in the phase angles for both overhead transfer buses is important. If the phase angle difference becomes larger than a certain level, the switches then become impossible to connect. Conventional distribution analyses are performed by each substation individually, and it is possible to compute both phase angles above the switches in the same substation, but impossible to measure both phase angles above the switches between different substations. In transmission and distribution integrated analysis, such switch phase angles can be measured, and phase angle changes according to different DG supplies can also be identified. A case study was performed by using real data from distribution systems below the South Gwangju and Hwajeong substation. Table 3 shows information of the distribution system and a normally open switch.
The Baekun distribution feeder belongs to South Gwangju, and the Daemyung distribution feeder belongs to the Hwajeong substation. These two distribution feeders are connected with a normally open switch to supply electric power in abnormal conditions. Table 4 shows the voltages and phase angles of both switch sides when the DG output and location change. Before the DG has been connected, there is only a slight difference between both ends of the switch. However, DG output and locations increase the phase difference, which interrupts the closing of a normally open switch. As the DG penetration increases, the distribution system operator must consider the phase difference between both ends of the normally open switch before it closes, and this case study shows the effectiveness of verifying the changes in the phase difference due to DG output and location.
4.4. Contribution of DG to Transmission System Fault Current
In previous SCADA systems, it was impossible to determine the fault current contribution of DG to a transmission system when the DG is connected to a distribution system. However, the transmission and distribution integrated monitoring and analysis system makes it possible to identify such fault current contributions. Table 5 shows the result of comparing the sizes of a transmission system’s fault current while total 27 MW DGs were connected to the South Gwangju substation systems. In the result of this case study, not all substations showed a huge increase in fault current, but the fault current largely increased in the substations that have a large amount of DG in the distribution line, such as the South Gwangju substation and the Hwasun substation.
4.5. Preliminary Evaluation of DG Connection
In KEPCO power systems, DG is connected after a preliminary evaluation process that covers voltage fluctuation, harmonics, fault current, etc. However, though they pass the conventional evaluation process, problems arise in real KEPCO systems due to DG connection because of the effect of other DGs in other distribution lines, which were not considered in the conventional process. In this case study, the results of a preliminary evaluation of a DG connection were compared to those obtained from realistic operation. The targeted DG of the preliminary evaluation simulation is a 1.5-MW PV connected to the Imsil distribution system. This DG is connected to the Imsil distribution line after passing a conventional preliminary evaluation. However, a voltage violation occurs due to DG connection on the Imsil distribution system. A comparison of the preliminary evaluation results is simulated to validate the accuracy of the transmission and distribution integrated preliminary evaluation.
Table 6 shows the results of a preliminary evaluation of the conventional process and transmission and distribution integrated system. It also shows real operating results after the DG connection. In actual operation, the voltage violations on the distribution line and voltage fluctuation on substation occur during midday. The conventional process of preliminary evaluation does not predict the voltage problem on the distribution system due to a chain reaction between the targeted DG and previously installed DG on the neighboring distribution system. However, the transmission and distribution integrated monitoring and analysis system considered not only the target DG but also the previously installed DGs on the neighboring distribution system. The results of the simulation show that the integrated analysis could predict voltage problems in a real distribution system.
5. Conclusions
In this paper, the development of transmission and distribution integrated monitoring and analysis system and a novel preliminary evaluation methodology for DG are presented with case studies. The proposed system conducts an integrated analyses by acquiring actual data from both transmission and distribution system. The results of the case studies show the necessity and effectiveness of integrated transmission and distribution analysis. A power flow case study confirms the differences between the integrated system and the conventional system, and preliminary evaluation of the DG connection case study confirms the accuracy of the proposed system. DG impact on neighboring distribution systems and transmission systems, phase angle differences at both ends of the normally open switch and contribution of DG to transmission system fault currents are increasingly important, but it is impossible to analyze them in a separated system.
The current version of proposed system can acquire data of each phase in the distribution system, but there is a limit to the unbalanced distribution analysis because of the transposition in distribution lines in practice. Determination of areas of vulnerability is not possible for more than 10 substations at once due to the limited computing power, therefore unbalanced analysis function, computational capability improvement and more optimization function will be developed in further research.
Acknowledgments
This work was supported by the “Human Resources program in Energy Technology” of the Korea Institute of Energy Technology Evaluation and Planning (KETEP), with a grant from the Ministry of Trade, Industry & Energy, Republic of Korea (No. 20154030200610). This work was supported under the framework of international cooperation program managed by National Research Foundation of Korea (No. 2017K1A4A3013579).
Author Contributions
Jaewan Suh and Gilsoo Jang conceived and designed the experiments; Jaewan Suh performed the experiments; Jaewan Suh and Sungchul Hwang analyzed the data; Jaewan Suh and Sungchul Hwang wrote the paper.
Conflicts of Interest
The authors declare no conflicts of interest.
Nomenclature
| Vreg | voltage of the regulating point in the distribution system |
| VS | substation voltage |
| ΔV | voltage deviation of the distribution line |
| IMtr | current of Mtr |
| Zeq | equivalent impedance |
| IMtr,0 | current of Mtr without DG |
| IDG | current due to DG |
| ΔVDG | voltage deviation of the DG |
| dbOLTC | dead band of OLTC |
| maximum limit of the instantaneous voltage dip | |
| instantaneous voltage dip due to DG. | |
| impedance between bus i and j for the hth order harmonic | |
| current injection for the hth order harmonic | |
| bus voltage for the hth order harmonic | |
| THD | Total harmonic distorsion |
References
- Pepermans, G.; Driesen, J.; Haeseldonckx, D.; Belmans, R.; D’haeseleer, W. Distributed generation: Definition, benefits and issues. Energy Policy 2005, 33, 787–798. [Google Scholar] [CrossRef]
- Barker, P.P.; De Mello, R.W. Determining the impact of distributed generation on power systems. I. Radial distribution systems. In Proceedings of the IEEE Power Engineering Society Summer Meeting, Seattle, WA, USA, 16–20 July 2000. [Google Scholar]
- The Government of the Republic of Korea. The 7th Basic Plan for Long-Term Electricity Supply and Demand; Ministry of Trade, Industry & Energy: Seoul, Korea, 2015.
- Al-Sabounchi, A.; Gow, J.; Al-Akaidi, M.; Al-Thani, H. Minimizing line energy loss of radial distribution feeder with a PV Distributed Generation unit avoiding reverse power flow. In Proceedings of the 2011 2nd International Conference on Electric Power and Energy Conversion Systems (EPECS), Sharjah, UAE, 15–17 November 2011; pp. 1–6. [Google Scholar]
- Aldrich, D.; McFetridge, B. Distributed generation voltage control issues and solutions. In Proceedings of the 2014 IEEE Rural Electric Power Conference (REPC), Fort Worth, TX, USA, 18–21 May 2014; p. A3-1. [Google Scholar]
- Vita, V.; Alimardan, T.; Ekonomou, L. The impact of distributed generation in the distribution networks’ voltage profile and energy losses. In Proceedings of the 2015 IEEE European Modelling Symposium (EMS), Madrid, Spain, 6–8 October 2015; pp. 260–265. [Google Scholar]
- Vita, V.; Ekonomou, L.; Christodoulou, C.A. The impact of distributed generation to the lightning protection of modern distribution lines. Energy Syst. 2016, 7, 357–364. [Google Scholar] [CrossRef]
- Ou, T.C.; Hong, C.M. Dynamic operation and control of microgrid hybrid power systems. Energy 2014, 66, 314–323. [Google Scholar] [CrossRef]
- Ou, T.C.; Lu, K.H.; Huang, C.J. Improvement of transient stability in a hybrid power multi-system using a designed NIDC (Novel Intelligent Damping Controller). Energies 2017, 10, 488. [Google Scholar] [CrossRef]
- Hong, C.M.; Ou, T.C.; Lu, K.H. Development of intelligent MPPT (maximum power point tracking) control for a grid-connected hybrid power generation system. Energy 2013, 50, 270–279. [Google Scholar] [CrossRef]
- Ou, T.C.; Su, W.F.; Liu, X.Z.; Huang, S.J.; Tai, T.Y. A modified bird-mating optimization with hill-climbing for connection decisions of transformers. Energies 2016, 9, 671. [Google Scholar] [CrossRef]
- Ou, T.C. Ground fault current analysis with a direct building algorithm for microgrid distribution. Int. J. Electr. Power Energy Syst. 2013, 53, 867–875. [Google Scholar] [CrossRef]
- Lin, W.M.; Ou, T.C. Unbalanced distribution network fault analysis with hybrid compensation. IET Gener. Transm. Distrib. 2011, 5, 92–100. [Google Scholar] [CrossRef]
- Ou, T.C. A novel unsymmetrical faults analysis for microgrid distribution systems. Int. J. Electr. Power Energy Syst. 2012, 43, 1017–1024. [Google Scholar] [CrossRef]
- Granizo, R.; Blánquez, F.R.; Rebollo, E.; Platero, C.A. A novel ground fault non-directional selective protection method for ungrounded distribution networks. Energies 2015, 8, 1291–1316. [Google Scholar] [CrossRef] [Green Version]
- Lazarou, S.; Vita, V.; Karampelas, P.; Ekonomou, L. A power system simulation platform for planning and evaluating distributed generation systems based on GIS. Energy Syst. 2013, 4, 379–391. [Google Scholar] [CrossRef]
- Chen, T.; Chen, M.; Hwang, K.; Kotas, P.; Chebli, E.A. Distribution system power flow analysis—A rigid approach. IEEE Trans. Power Deliv. 1991, 6, 1146–1152. [Google Scholar] [CrossRef]
- Roytelman, I.; Landenberger, V. Real-time distribution system analysis-integral part of DMS. In Proceedings of the 2009 IEEE/PES Power Systems Conference and Exposition, Seattle, WA, USA, 15–18 March 2009; pp. 1–6. [Google Scholar]
- Cassel, W. Distribution management systems: Functions and payback. IEEE Trans. Power Deliv. 1993, 8, 796–801. [Google Scholar] [CrossRef]
- Sun, H.; Guo, Q.; Zhang, B.; Guo, Y.; Li, Z.; Wang, J. Master-slave-splitting based distributed global power flow method for integrated transmission and distribution analysis. IEEE Trans. Smart Grid 2015, 6, 1484–1492. [Google Scholar] [CrossRef]
- Song, C.; Suh, J.; Jang, G.; Jang, M.J. Development of a transmission/distribution integrated analysis hybrid algorithm for system operation platform including distributed generation. J. Korean Inst. Illum. Electr. Install. Eng. 2013, 27, 35–45. [Google Scholar] [CrossRef]
- Sun, H.; Zhang, B. Global state estimation for whole transmission and distribution networks. Electr. Power Syst. Res. 2005, 74, 187–195. [Google Scholar] [CrossRef]
- Kim, S.; Shin, J.; Kim, J. Transmission network expansion planning for the penetration of renewable energy sources-determining an optimal installed capacity of renewable energy sources. J. Electr. Eng. Technol. 2014, 9, 1163–1170. [Google Scholar] [CrossRef]
- Korea Electric Power Corporation. The Development of Optimal Operating System in Distribution Networks Based on Distribution Automation; Final Report; Korea Electric Power Corporation: Daejeon, Korea, 2012. [Google Scholar]
- Institute of Electrical and Electronics Engineers (IEEE). IEEE Guide for Design, Operation, and Integration of Distributed Resource Island Systems with Electric Power Systems; IEEE Press: New York, NY, USA, 2011. [Google Scholar]
- Yun, S.; Chu, C.; Kwan, S.; Song, I.K.; Lim, S.I. Development of section load estimation program for smart distribution management system. Trans. Korean Inst. Electr. Eng. 2012, 61, 1083–1090. [Google Scholar] [CrossRef]
- Kang, M.; Lee, H. Power quality monitoring system using DWB on distribution automation system. J. Korean Inst. Illum. Electr. Install. Eng. 2011, 25, 86–93. [Google Scholar] [CrossRef]
- Corporation, Research Center of the Korea Electric Power. A Study on the New Technical Guidelines for Interconnection Capacity of Distributed Generations in Distribution System; Korea Tech.: Daejeon, Korea, 2012. [Google Scholar]
- Song, I.K.; Jung, W.W.; Chu, C.M.; Cho, S.S.; Kang, H.K.; Choi, J.H. General and simple decision method for DG penetration level in view of voltage regulation at distribution substation transformers. Energies 2013, 6, 4786–4798. [Google Scholar] [CrossRef]
- Calovic, M.S. Modeling and analysis of under-load tap-changing transformer control systems. IEEE Trans. Power Appar. Syst. 1984, PAS-103, 1909–1915. [Google Scholar] [CrossRef]
- Choi, J.; Kim, J. Advanced voltage regulation method of power distribution systems interconnected with dispersed storage and generation systems. IEEE Trans. Power Deliv. 2001, 16, 329–334. [Google Scholar] [CrossRef]
- Choi, J. Operation and Integration Strategies of Dispersed Generations in Power Distribution System. Ph.D. Thesis, Soongsil University, Seoul, Korea, 2001. [Google Scholar]
- Institute of Electrical and Electronics Engineers. 1547–2003—IEEE Standard for Interconnecting Distributed Resources with Electric Power Systems; IEEE Press: New York, NY, USA, 2003. [Google Scholar]
- Goswami, A.; Gupta, C.; Singh, G. Area of vulnerability for prediction of voltage sags by an analytical method in indian distribution systems. In Proceedings of the 2008 Annual IEEE India Conference, Kanpur, India, 11–13 December 2008. [Google Scholar]
- Park, C.; Jang, G. Fast method to determine an area of vulnerability for stochastic prediction of voltage sags. IEEE Proc. 2005, 152, 819–827. [Google Scholar] [CrossRef]
- Garcia, P.A.; Pereira, J.L.R.; Carneiro, S.; da Costa, V.M.; Martins, N. Three-phase power flow calculations using the current injection method. IEEE Trans. Power Syst. 2000, 15, 508–514. [Google Scholar] [CrossRef]
Figure 1.
System diagram of transmission and distribution integrated system.
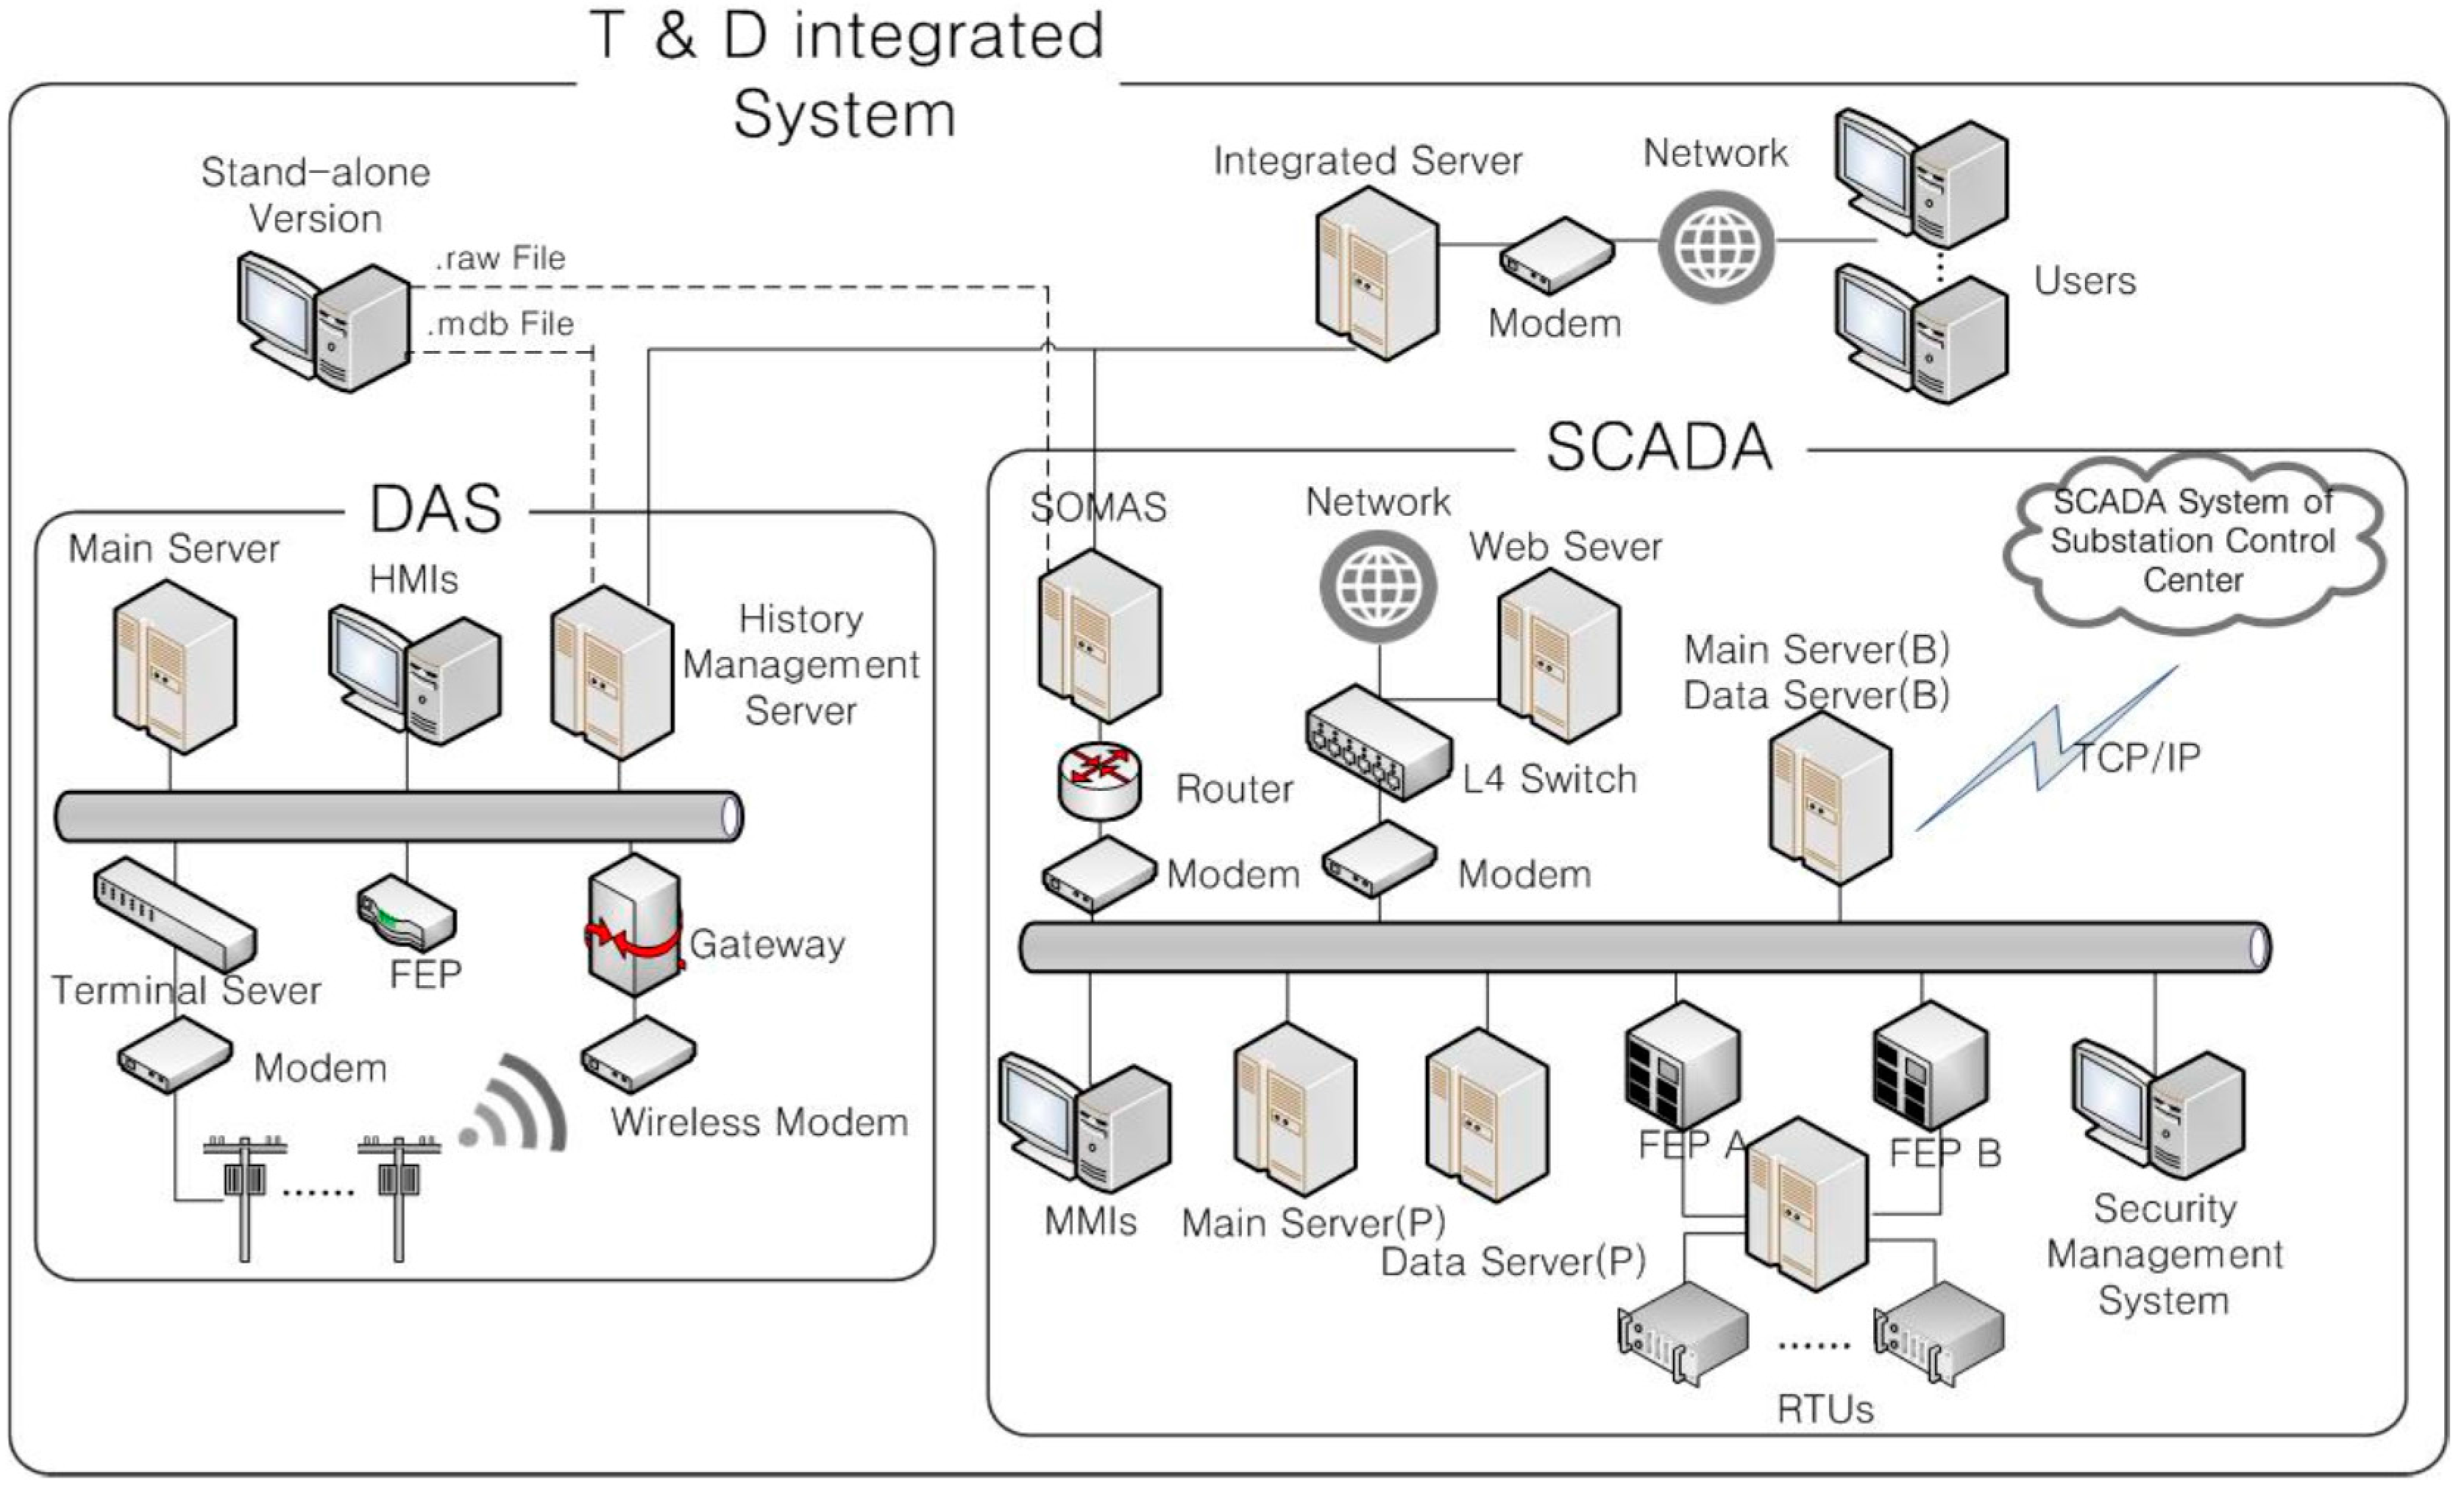
Figure 2.
Main menu of the transmission and distribution integrated monitoring and analysis system; (a) stand-alone version; (b) network version.
Figure 2.
Main menu of the transmission and distribution integrated monitoring and analysis system; (a) stand-alone version; (b) network version.
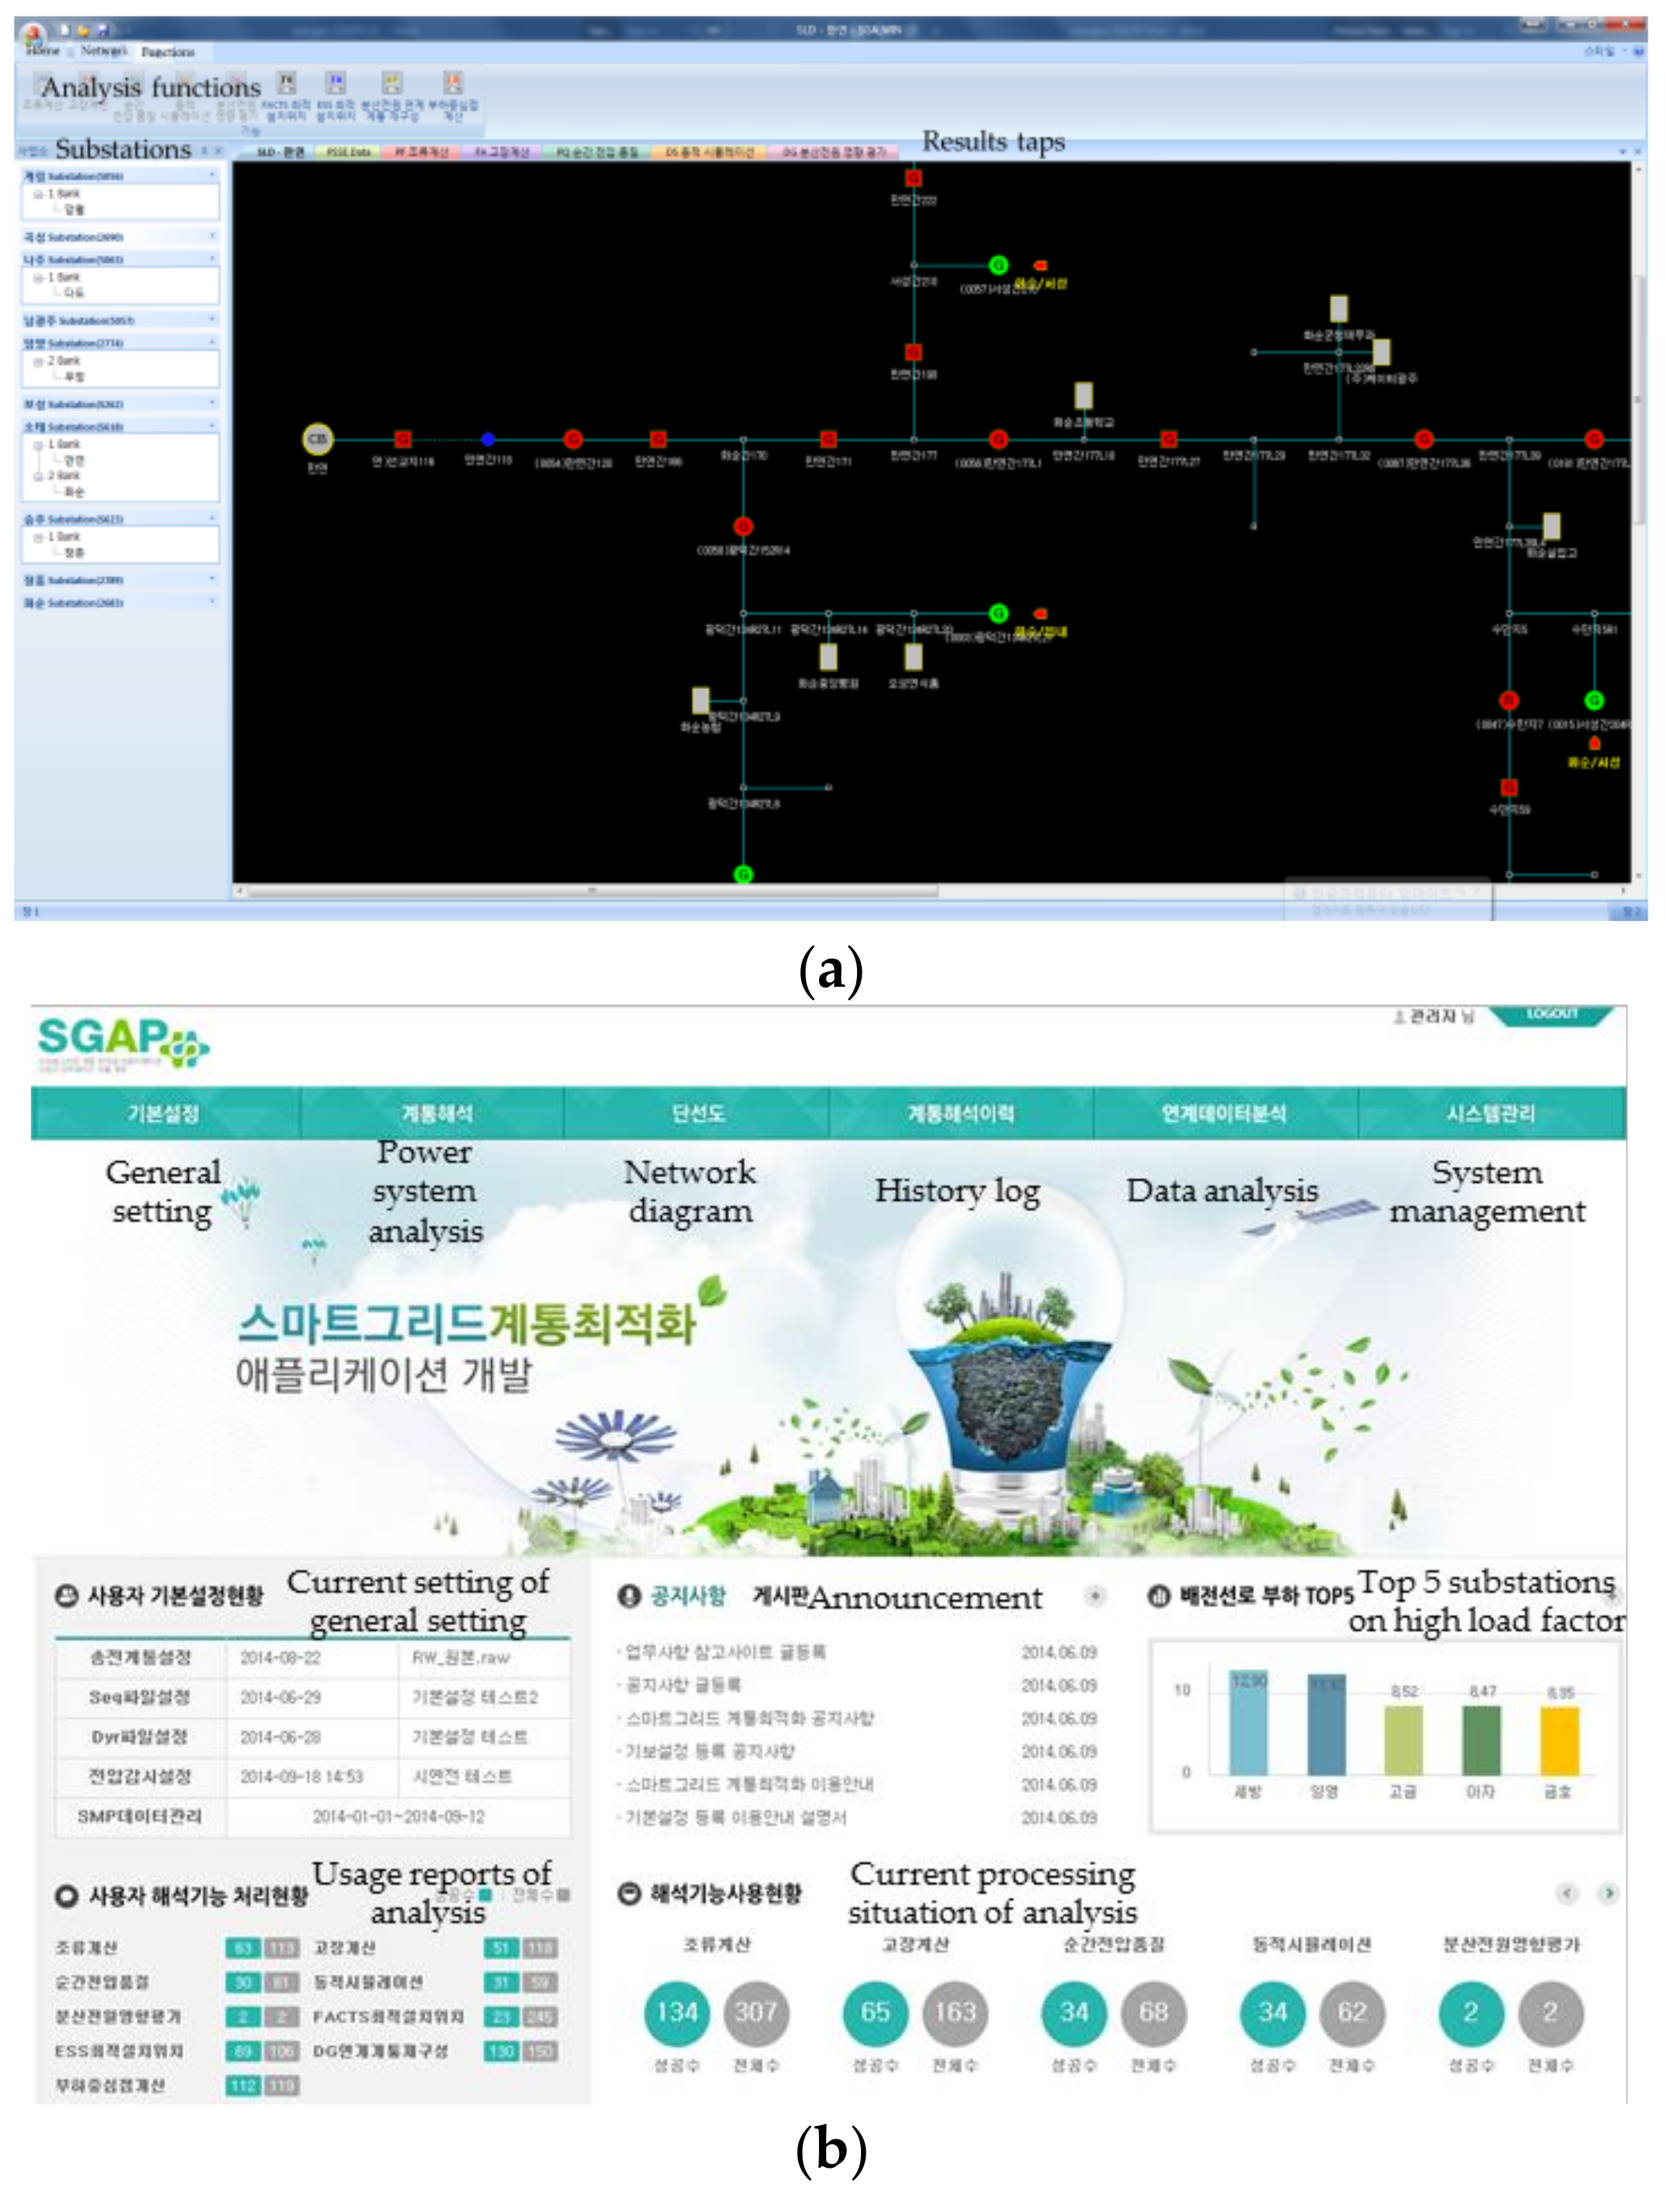
Figure 3.
Algorithm of the distribution system data acquisition.
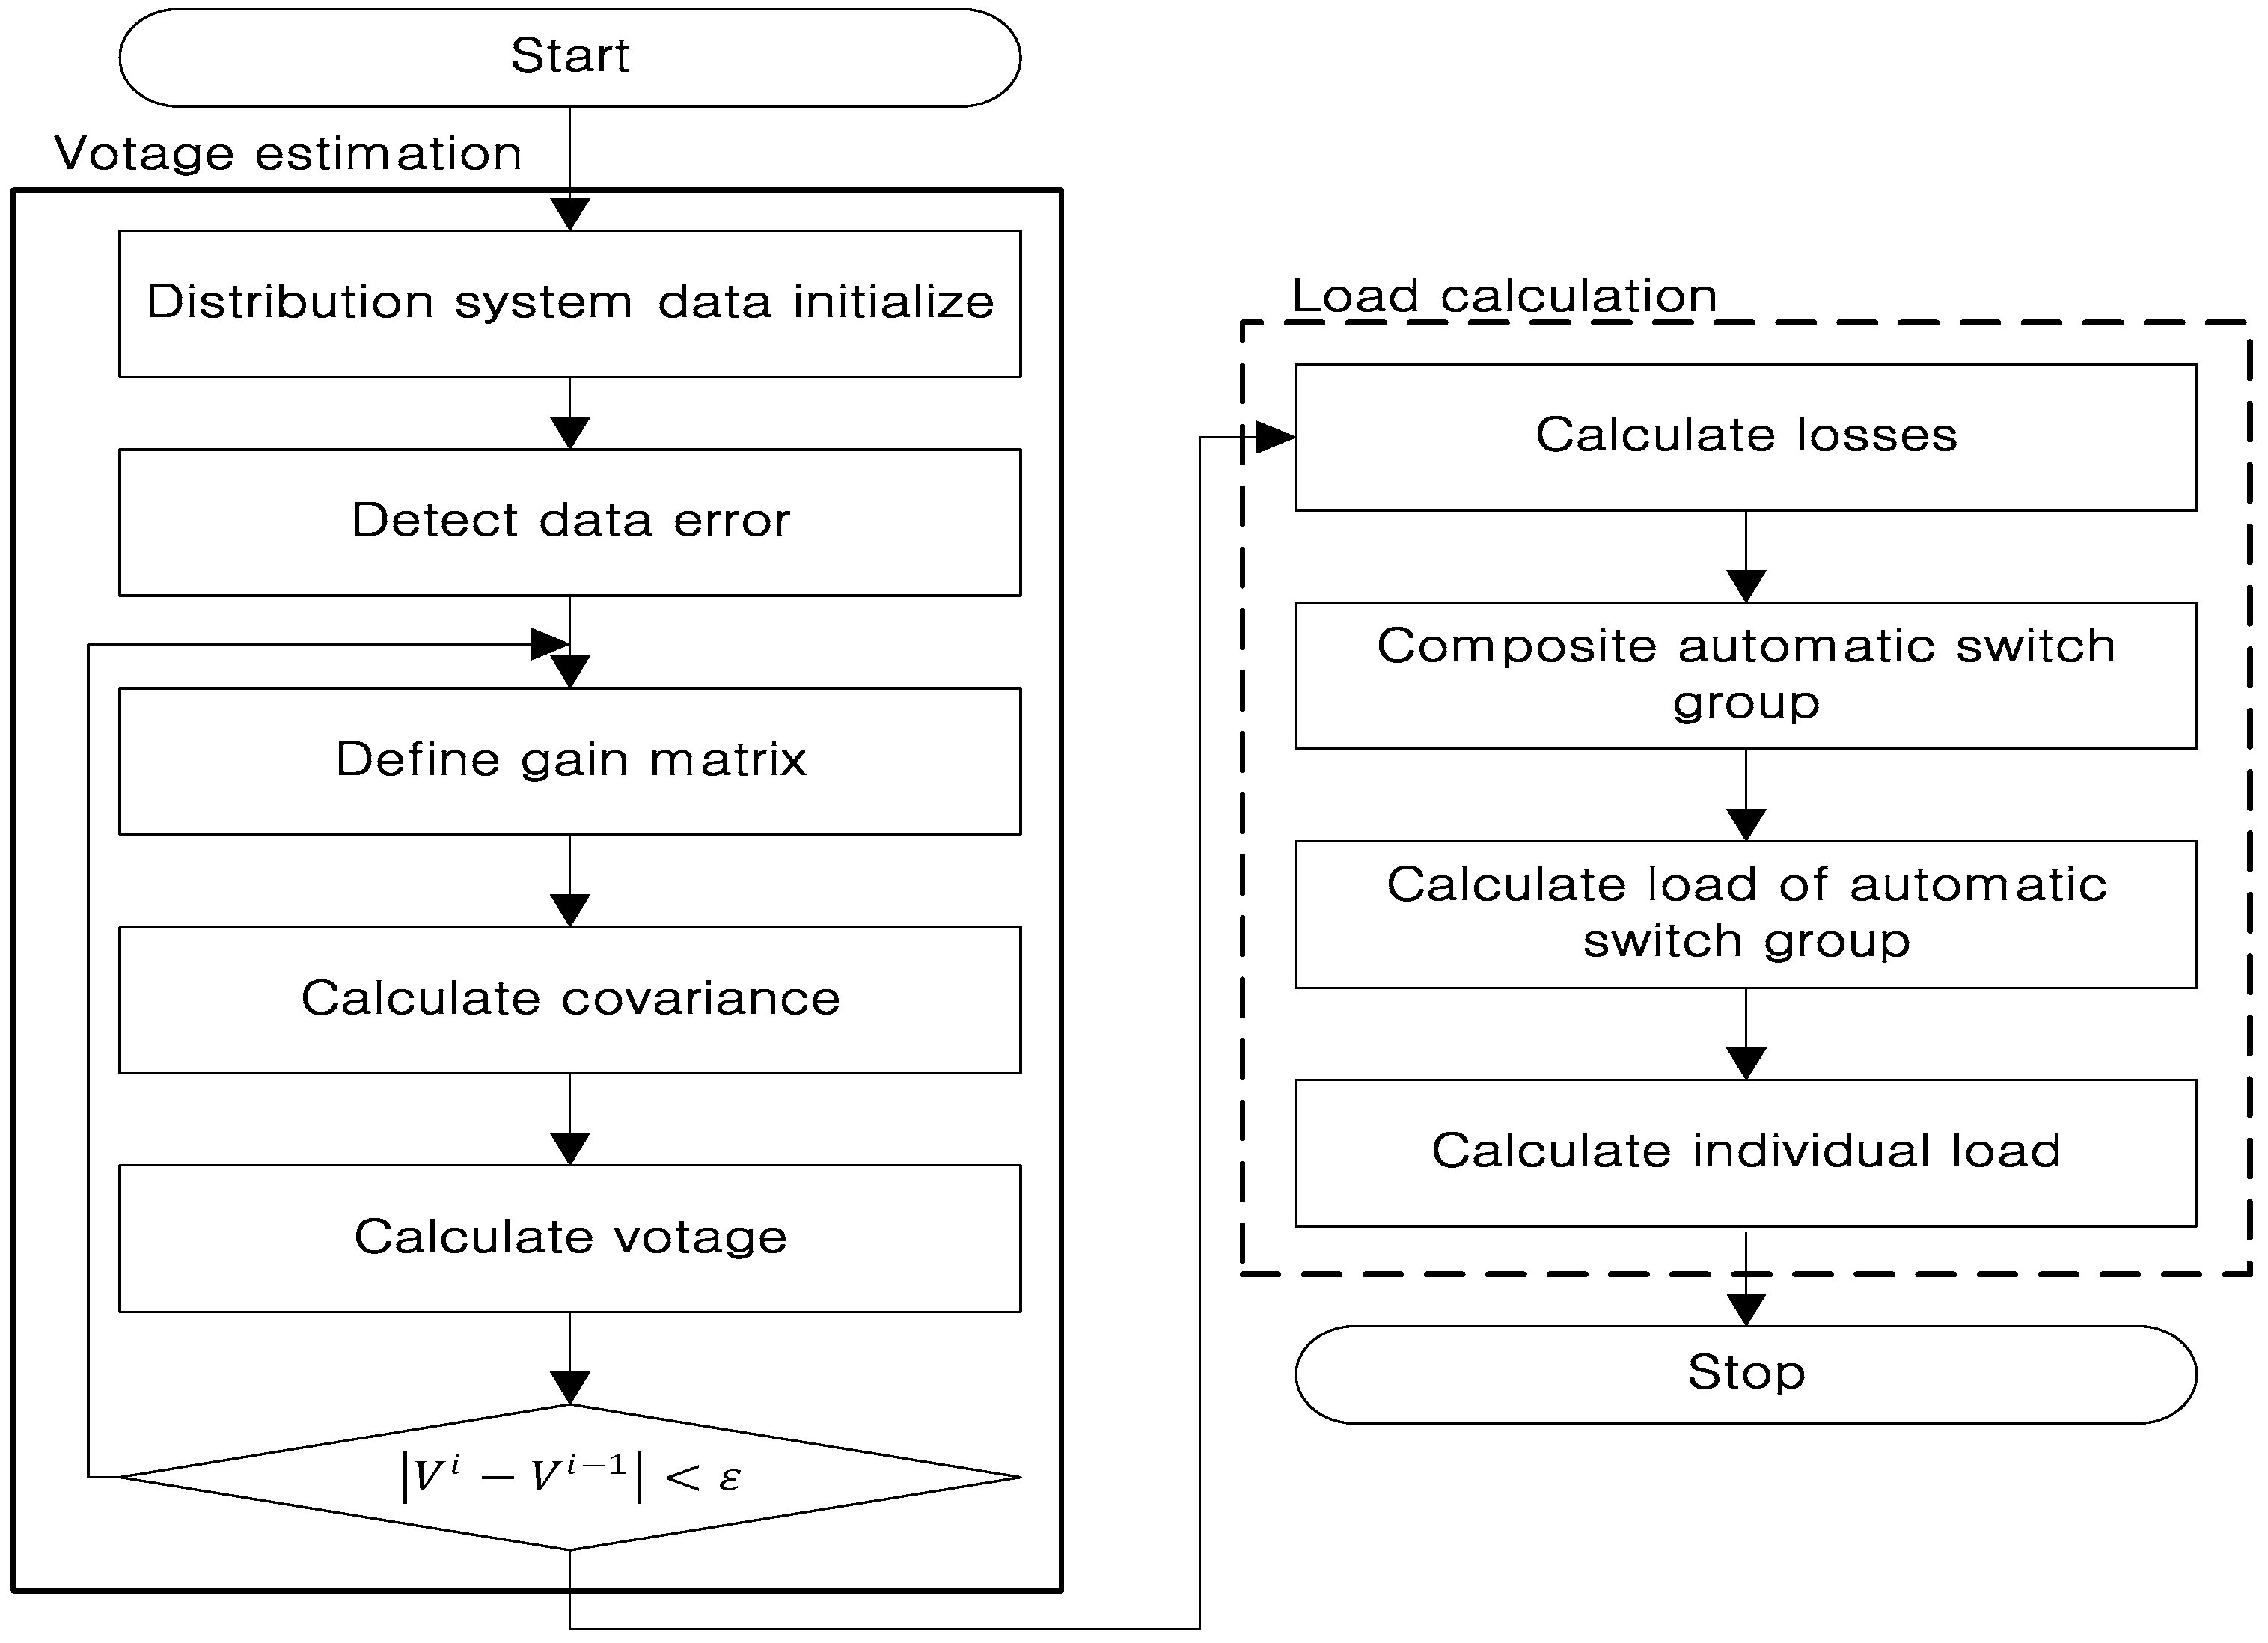
Figure 4.
Input screen for a preliminary evaluation of the DG connection in the networked version.
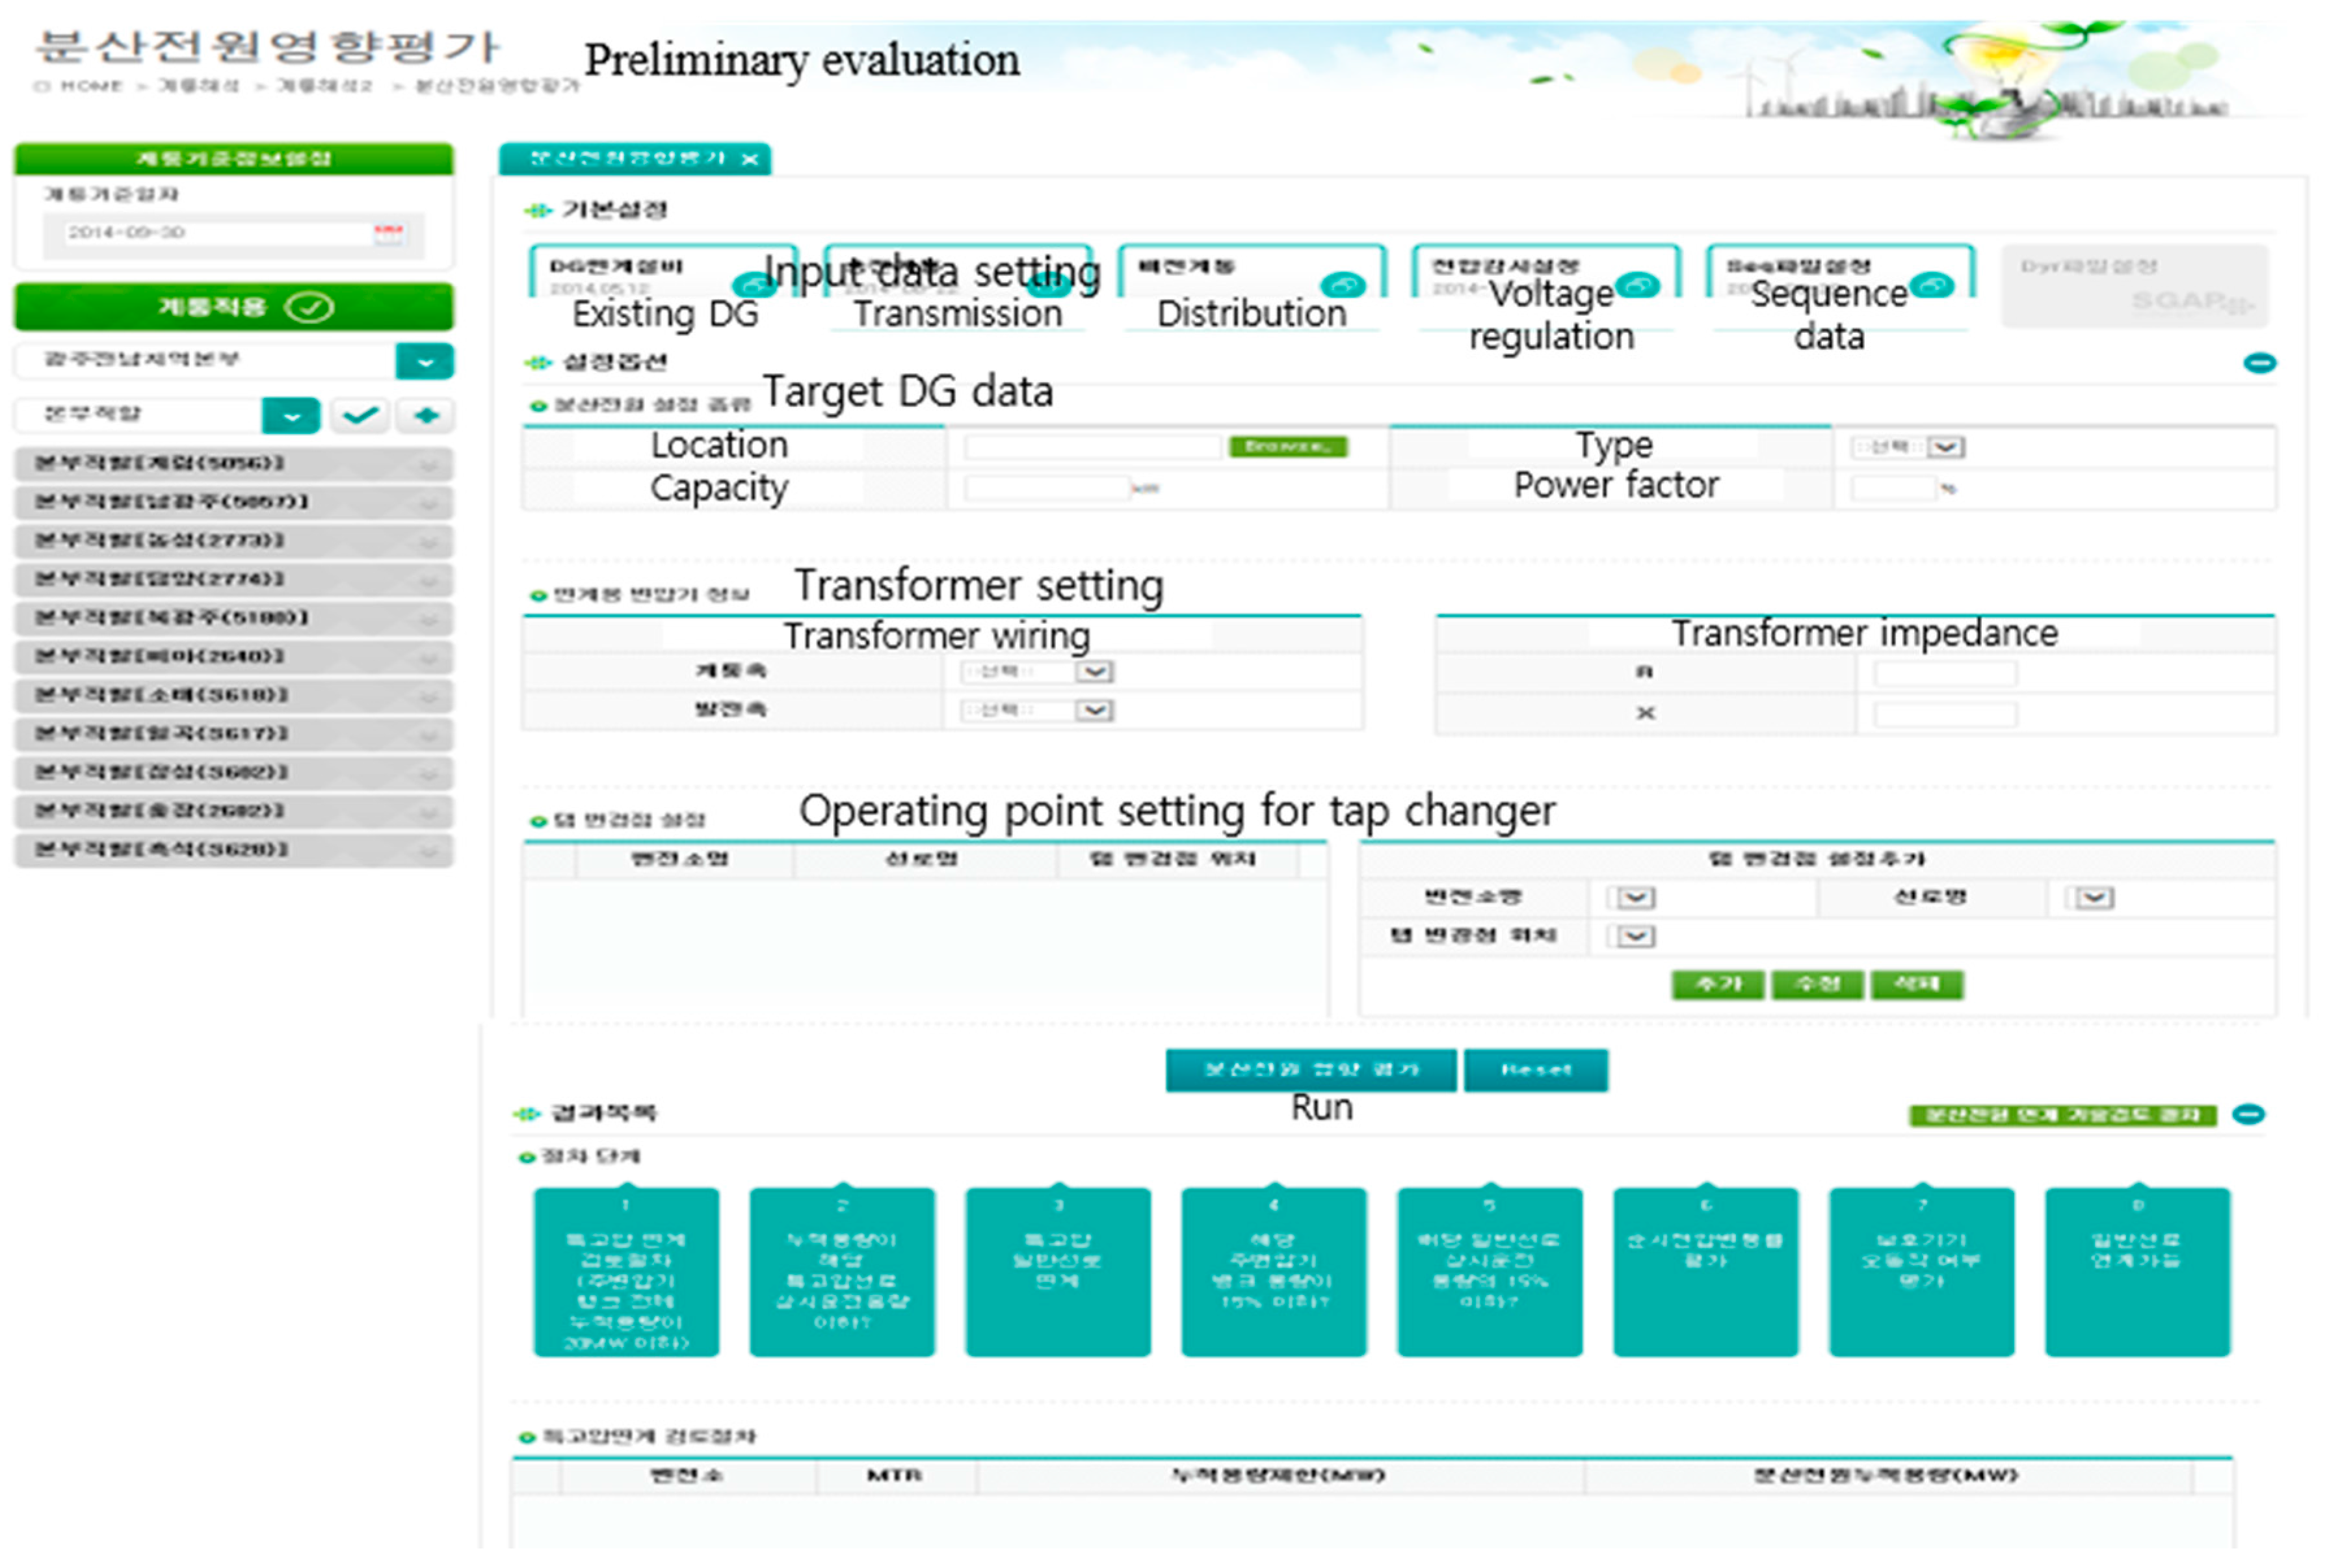
Figure 5.
Algorithm for preliminary evaluation of DG connection.

Figure 6.
Voltage profile of the Hwasun distribution system.

Figure 7.
Voltage profile of the South Gwangju distribution system.


Table 1.
Comparison between the conventional transmission analysis and integrated method.
| Substation Name | Transmission and Distribution Integrated Analysis | Conventional Transmission Analysis | ||
|---|---|---|---|---|
| Magnitude (P.U) | Angle (°) | Magnitude (P.U) | Angle (°) | |
| Hwasun | 1.0293 | −16.39 | 1.03 | −16.54 |
| South Gwangju | 1.0279 | −17.58 | 1.029 | −17.78 |
| Songjung | 1.0211 | −15.97 | 1.0315 | −17.13 |
| Naju | 1.0262 | −16.81 | 1.0291 | −17.2 |
| Maewol | 1.0216 | −17.51 | 1.0223 | −17.66 |
| Hwajeong | 1.0205 | −17.93 | 1.0213 | −18.09 |
| Nogseong | 1.0201 | −18.03 | 1.0209 | −18.19 |
Table 2.
Comparison between conventional distribution analysis and integrated method.
| Automatic Switch Number in Distribution System | Transmission and Distribution Integrated Analysis | Conventional Distribution Analysis | ||
|---|---|---|---|---|
| Magnitude (P.U) | Angle (°) | Magnitude (P.U) | Angle (°) | |
| 160028 | 1.025 | −19.27 | 0.997 | −0.77 |
| 160029 | 1.025 | −19.28 | 0.997 | −0.78 |
| 160030 | 1.024 | −19.28 | 0.996 | −0.78 |
| 160031 | 1.023 | −19.29 | 0.995 | −0.79 |
| 160032 | 1.021 | −19.3 | 0.993 | −0.8 |
Table 3.
Information of the switch between two substations.
| Substation 1 | Bank No. | Feeder Name | Substation 2 | Bank No. | Feeder Name |
|---|---|---|---|---|---|
| South Gwangju | 3 | Baekun | Hwajeong | 1 | Daemyung |
Table 4.
Phase angle difference between both ends of switch.
| Cases | Baekun Feeder | Daemyung Feeder | Difference | |||
|---|---|---|---|---|---|---|
| Magnitude (P.U) | Angle | Magnitude (P.U) | Angle | Magnitude (P.U) | Angle | |
| Without DG | 1.0164 | −19.37 | 1.0062 | −19.74 | 0.0102 | 0.37 |
| 9 MW DG in South Gwangju distribution | 1.0273 | −17.62 | 1.0097 | −18.86 | 0.0176 | 1.24 |
| 30 MW DG in South Gwangju distribution | 1.0302 | −16.88 | 1.0112 | −18.44 | 0.0190 | 1.56 |
| 9 MW DG in Hwajeong distribution | 1.0200 | −18.48 | 1.0179 | −17.89 | 0.0021 | −0.59 |
Table 5.
Fault current comparison.
| Substation | Fault Current without DG (A) | Fault Current with DG (A) |
|---|---|---|
| Hwasun | 18,572.8 | 20,033.1 |
| South Gwangju | 17,437.8 | 19,879.5 |
| Songjung | 24,416.4 | 24,858.8 |
| Naju | 24,332.7 | 25,626.7 |
| Maewol | 17,439.1 | 18,748.6 |
| Hwajeong | 17,029.2 | 18,432.7 |
| Nongseong | 16,969.0 | 18,411.7 |
Table 6.
Results of a preliminary evaluation of the DG connection and real operation.
| Cases | Line Capacity | Main Transformer Capacity | Substation Voltage Fluctuation | Voltage Violation | Instantaneous Voltage | Protection |
|---|---|---|---|---|---|---|
| Real operation result | Pass | Pass | Fail | Fail | Pass | Pass |
| Conventional process | Pass | Pass | Pass | Pass | Pass | Pass |
| Transmission and distribution integrated analysis and monitoring system | Pass | Pass | Fail | Fail | Pass | Pass |
© 2017 by the authors. Licensee MDPI, Basel, Switzerland. This article is an open access article distributed under the terms and conditions of the Creative Commons Attribution (CC BY) license (http://creativecommons.org/licenses/by/4.0/).
Share and Cite
MDPI and ACS Style
Suh, J.; Hwang, S.; Jang, G. Development of a Transmission and Distribution Integrated Monitoring and Analysis System for High Distributed Generation Penetration. Energies 2017, 10, 1282. https://doi.org/10.3390/en10091282
AMA Style
Suh J, Hwang S, Jang G. Development of a Transmission and Distribution Integrated Monitoring and Analysis System for High Distributed Generation Penetration. Energies. 2017; 10(9):1282. https://doi.org/10.3390/en10091282
Chicago/Turabian StyleSuh, Jaewan, Sungchul Hwang, and Gilsoo Jang. 2017. "Development of a Transmission and Distribution Integrated Monitoring and Analysis System for High Distributed Generation Penetration" Energies 10, no. 9: 1282. https://doi.org/10.3390/en10091282
Note that from the first issue of 2016, this journal uses article numbers instead of page numbers. See further details here.