Thermal Behaviour under Service Loads of a Thermo-Active Precast Pile
by
 ,
,
Borja Badenes
1,*,† ,
,
Teresa Magraner
1,†,
Cristina De Santiago
2,
Fernando Pardo de Santayana
2 and
Javier F. Urchueguía
1 1
Instituto de Aplicaciones de las Comunicaciones Avanzadas (ITACA), Universitat Politècnica de València, Camino de Vera S/N, 46022 Valencia, Spain
2
Laboratorio de Geotecnia (CEDEX) C/Alfonso XII, 3 y 5, 28014 Madrid, Spain
*
Author to whom correspondence should be addressed.
†
These authors contributed equally to this work.
Energies 2017, 10(9), 1315; https://doi.org/10.3390/en10091315
Submission received: 28 July 2017
/
Revised: 25 August 2017
/
Accepted: 29 August 2017
/
Published: 1 September 2017
(This article belongs to the Special Issue Low Enthalpy Geothermal Energy)
Abstract
:A research project was developed in Spain to undertake some studies on the geothermal use of pile foundations (PITERM PROJECT). The experiment consists of a specifically designed, constructed and fully monitored geothermal precast pile driven at Polytechnic University of Valencia. An important distinctive feature of the developed pile was the fact that it was assembled from two identical sections connected with a specific joint, developed by Rodio-Kronsa. This allows the installation of much longer precast piles into the ground. The pile is under two types of loads: mechanical and thermal. The mechanical load was applied by means of a mechanical frame anchored to the ground and three additional anchors used to induce an active compressive force. The thermal load was produced by means of a thermal rig able to inject heat or extract heat from the pile at any desired programable heat injection/extraction rate. One of the features of this precast pile is its geometry, similar to a single U borehole heat exchanger (BHE) which is not common in thermoactive piles, usually equipped with probes attached to the armatures. In our study, we have characterized the thermal behaviour of the precast pile experimentally and simulated its temperature response by means of a TRNSYS model. This article describes part of a test series carried out where the mechanical and thermal behaviour of a pile subjected to thermal and mechanical loads simulating a real pile in a building was studied. Therefore, this publication has only focused on the thermal performance of the pile and its thermal modelling by computer. From this model, the thermal parameters of the soil–pile system have been extracted and compared with those of a single standard single U BHE. In essence, our assessment points to a quite similar thermal behaviour of the studied precast pile compared to a conventional single U borehole heat exchanger of the same length and equivalent diameter, while the installation costs of such elements would be substantially lower due to its double, structural and thermal, function.
1. Introduction
Energy piles (thermo-active piles or geothermal piles) are foundations with double usefulness: to support the loads of the building and to serve as a heat exchanger with the ground. The geothermal use of pile foundations is a useful, efficient and cost effective method of installing ground heat exchangers for cooling and heating buildings. The key factor in the sustainability of thermo-active foundations systems is utilizing geo-structures that are already needed for structural purposes. This way, coupling piles with ground source heat pumps only requires a low extra over cost for shallow geothermal heat pump systems, and it supposes a minimal impact on the piling program. They constitute a growing energy technology that improve the energy efficiency of heating and cooling systems in building and have been widely developed and researched in recent years [1,2,3,4,5,6]. It is still necessary to understand how the thermal and mechanical loads affect the mechanical behaviour of the pile. On the other hand, as this is a relatively new technology, robust standards and guidelines have not yet been developed for the design of these systems.
Although it is widely accepted that energy piles foundations are an efficient solution for long-term carbon emission reduction and sustainable construction, they have received only partial acceptance because of concerns regarding the impact of cyclic thermal changes on their serviceability. In this sense, specific research is still needed to better understand how the thermal loads affect the pile behaviour: changes in vertical strains, stresses and axial loads along the pile, changes in shear stresses between pile shaft and soil, movements at head and toe of pile, changes in soil strength parameters, influence of ground lithological profile and water table position, effects of constrictions at head and toe of pile, possible associated phenomena regarding soil consolidation or negative skin friction, etc.
A research and development project in energy piles was performed in Spain from 2011 to 2015 (PITERM PROJECT). The purpose of this experience was to improve the knowledge and understanding the effects of cooling and heating on precast piles subjected to mechanical loads in terms of mechanical, geotechnical and thermal actions.
2. Materials and Methods
In this section, the main elements that made up the installation (energy pile, mechanical loading system and thermal loads generating facility) will be briefly described. An extensive description of the installation set up, sensors to monitor its mechanical and thermal behaviour during the thermal test and other related information can be found in [7].
2.1. Pile Design and Construction
A geothermal precast concrete pile was specifically designed and constructed at the Rodio-Kronsa factory (Figure 1).
This test pile, made of reinforced concrete with characteristic resistance () of 50 N/mm, a thermal expansion coefficient of 11 /C and a Young modulus of 31,314 N/mm (E = 8500·(), with a square cross section of 35 cm side and a total length of 17.4 m, was made of two pieces 8.70 m long each, connected by a joint. To activate it thermally, two polyethylene tubes were installed vertically within a steel pipe, 11.3 cm nominal diameter, located in the centre of the pile with a double U-shaped configuration to allow the passage of the heat carrying fluid (a sketch of the cross-section of the pile that can be found in [7]).
Ground conditions of the testing site in Valencia were taken into account to design the foundation: A superficial fill layer of sandy gravel (1 m thick); a second layer of stiff clay (1 m thick); a 6 m thick layer of soft and black organic clays; a 3 m thick layer of loose sands; and below depth 11 m, layers of sandy gravels extended up to a depth of at least 27 m, interlayered with some stiff clays levels. The ground water table was located at a depth of 2.0 m. Under these lithological conditions, the pile should work transferring loads to the soil levels located at more than 11 m of depth (a soil profile diagram that can be found in [7]).
The ultimate compressive resistance of the pile, calculated from in situ pile load test results by the method established in the Spanish Building Code [8], was 2568.2 kN. Subsequently, it was decided to apply a service compression load of 981 kN at the pile head.
2.2. Experimental Set Up
The pile was driven in June 2012 in Valencia. Driving tests were carried out to assess the ultimate vertical compressive resistance, resulting in a base resistance of 1800 kN and a shaft resistance of 711 kN. The pile was then subjected firstly to static load tests, and secondly to thermal tests by maintaining the mechanical service load of 981 kN. Therefore, two types of load application systems were needed: mechanical and thermal.
The mechanical load was applied by means of a metallic frame, as element of reaction, fixed to the ground by means of three 25 m long anchors, with an inclination of 5°. The compressive force was applied to the pile head by a hydraulic jack. A calibrated load cell measured the real load throughout the test (Figure 2).
The thermal load was provided by a thermal installation (Section 2.2.1), formed by a reversible heat pump, a tank, a three-way valve for regulating the temperature of the injected water, a flow meter and temperature probes with a data logger to record the inflow and outflow temperatures during the test.
Once the pile was driven into the soil and thermally activated, the steel pipe located in the centre of the pile was filled with high thermal conductivity mortar ( = 2.1 W/mK) made up of quartz sand and sulphate resistant cement. The characteristic resistance of this grout material is similar to that of the concrete used in the pile.
The initial temperatures recorded by all the sensors prior to start the initial load test were between 17 C and 21 C. Below 10.40 m depth the ground temperature remains constant at 19 C.
The a pile sensors diagram in relation to the mechanical stresses can be found in [7].
2.2.1. Thermal Loads Generating Facility
The main objective of the facility is to produce the thermal heat injection and to monitor the associated variables that allow to perform the thermal response test analysis.
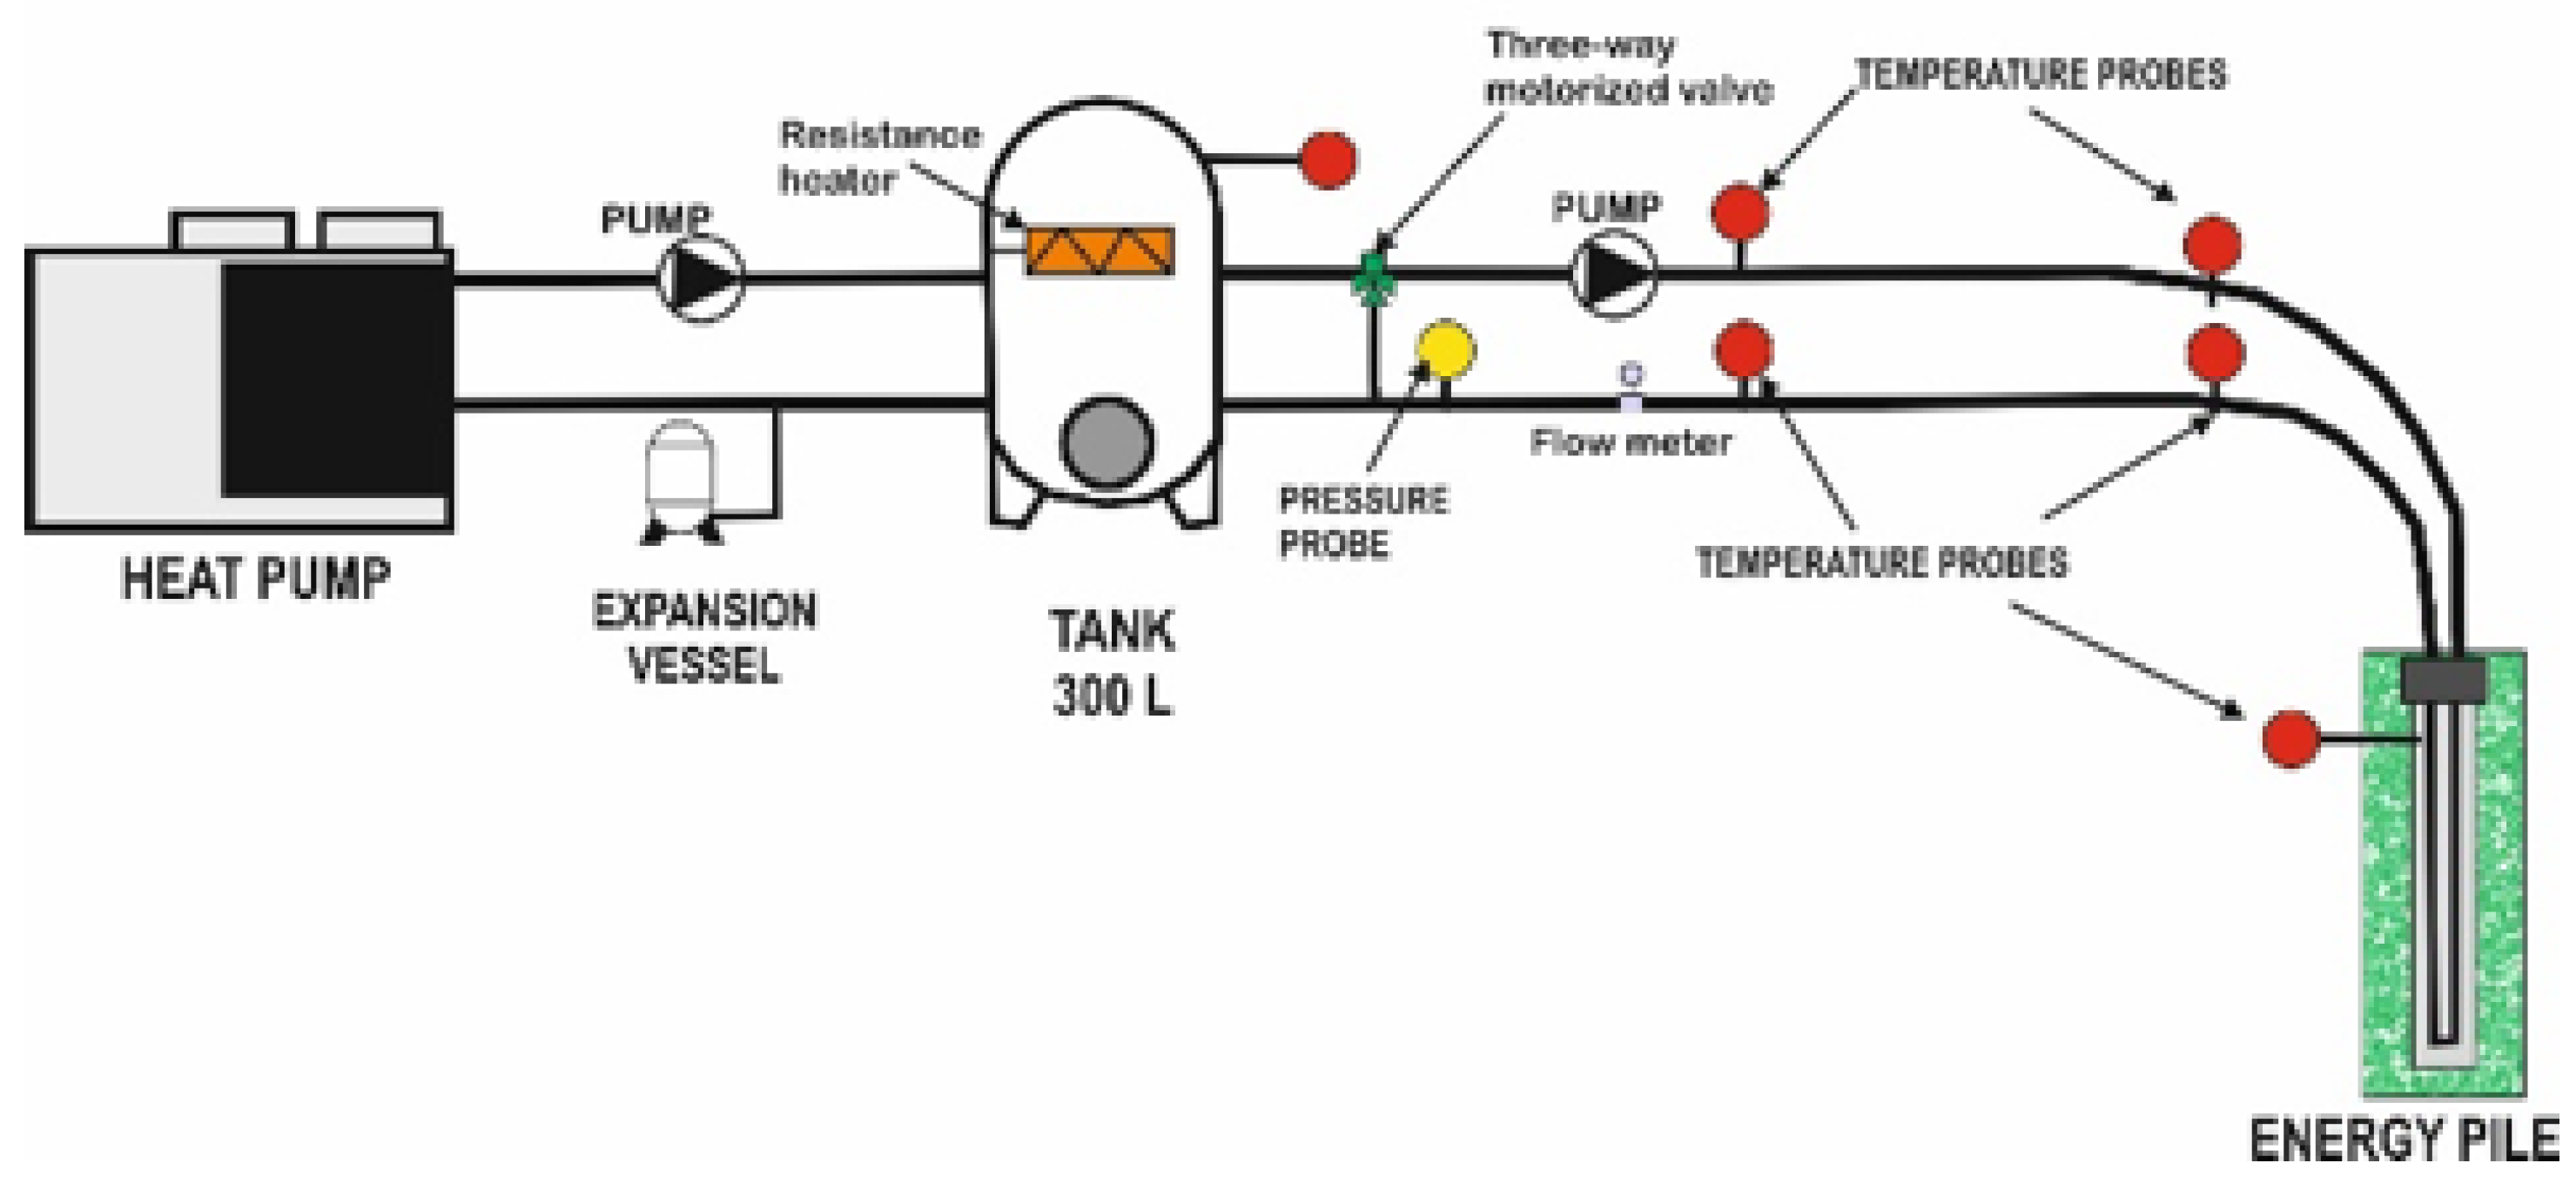
In order to produce thermal loads, the appliance uses a reversible heat pump (cooling) or a thermal resistance (heating) and a hydraulic circuit. Several measurement elements and electronic circuits are necessary for the required data-logging and measurement control. The facility is shown in Figure 3 schematically.
Throughout the test, water is circulated into the thermo-active pile and heat is exchanged with the surrounding soil through the pipes located inside, in a thermo-hydraulic configuration alike any conventional BHE.
The system contains two water circuits:
- The primary circuit, which contains the heat exchanger pipes installed in the pile, the primary circulation pump, a three-way valve for regulating the temperature of the injected water, a flow meter and various temperatures probes.
- The secondary circuit, which contains the heat pump, a storage tank equipped with a thermal resistance, an expansion vessel and the secondary circulation pump.
The primary circuit is responsible for maintaining a constant power supply to the experimental pile, maintaining a constant temperature difference between inlet and outlet of the pipe installed in the pile in order to activate it thermally. For this purpose, the secondary circuit supplies water heated or cooled by the thermal resistance or the heat pump.
The temperatures of the heat exchange fluid entering and exiting the pile during heat pump operation were monitored using pipe-plug thermocouples installed in the inlet and outlet ports of the manifold. The fluid will be able to extract or inject heat into the ground depending on the relationship between the temperatures of the heat carrier fluid and the ground around the pile at each moment throughout the test. Summarizing the main characteristics of the facility:
- Cold generation and heat generation (heat pump) and an electric resistance as auxiliary heat source.
- Regulation of the injected heat rate by means of pulse width modulation.
- Monitoring of the flow, inlet and outlet temperature and pressure.
- Remote control of the process.
- Data logging.
3. Discussion
During the course of the project, a series of experiments were carried out:
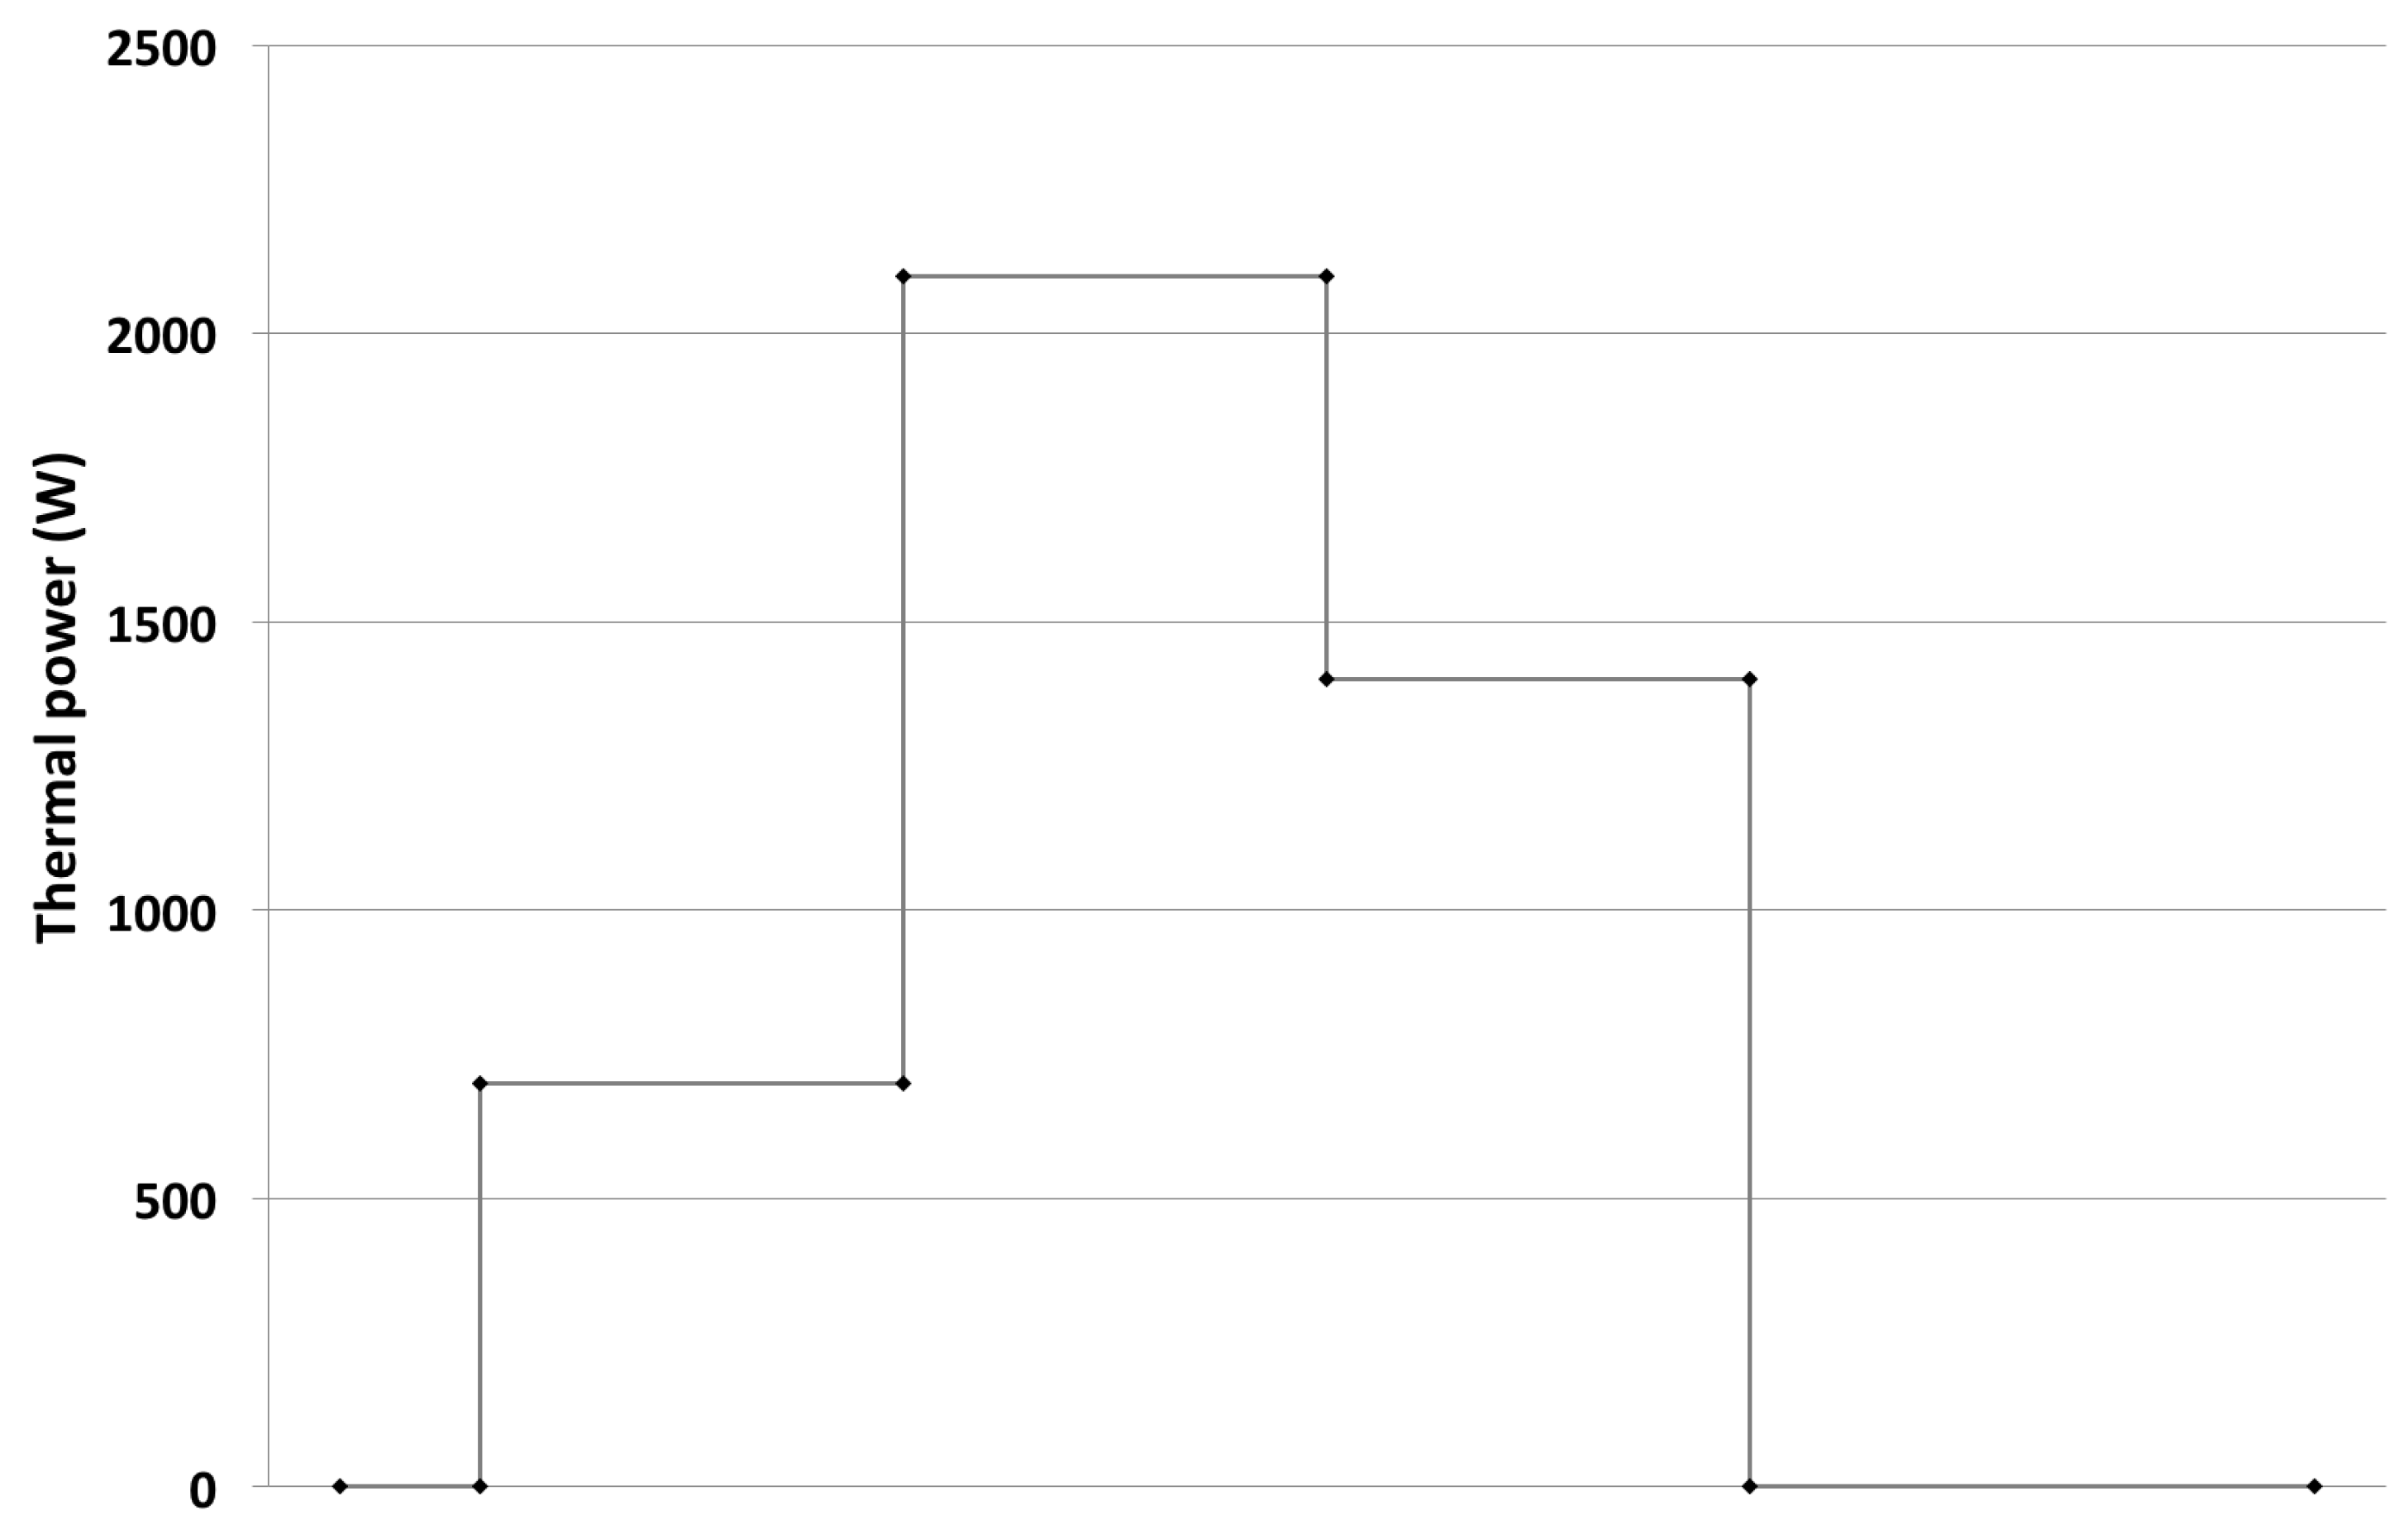
- In the first place, an experiment was performed to characterize the pile (Section 3.1) so that it could allow to extract the main parameters (see Table 3) to carry out simulations by means of computer software later. To this end, thermal heat was injected into the energy pile regulating three different thermal leaps with constant power, simulating the behaviour of the pile in a cooling system. Subsequently, a parametric adjustment was made by a simulation of TRNSYS to validate the simulated behaviour with the measured behaviour of the test.
- Apart from the mechanical behaviour of the pile, particularly in this article, the other side is analysed: its thermal behaviour as geothermal heat exchanger. For this purpose, a service thermal load test was performed injecting heat into the heat exchanger simulating that the pile was part of a ground coupled heat exchanger of a shallow geothermal heat pump system working in cooling mode in a tertiary building (Section 3.2).
- Finally, by another TRNSYS simulation, from the data obtained in the previous experiment, the thermal behaviour of the pile was analysed compared to a conventional single U BHE (Section 3.3).
3.1. Thermal Characterization of the Pile
The thermal characterization of the experimental pile was done by a heat injection test, simulating the thermal pile behaviour working as a heat exchanger of a cooling system. Once the working load was applied (981 kN), a TRT with three different thermal gaps was performed to characterize thermal behaviour of the pile. Taking into account the EP geometry (Table 1) and the GSHPA recommendations [6], the tests duration was longer than usual. The extended testing time ensures that the pile thermal resistance has reached a near steady state behaviour.
The EP characterization was carried out during 15 (5 + 5 + 5) days by introducing different injected heat rates to the experimental pile (700 W, 2100 W and 1050 W). The main parameters of the thermal tests are presented in Table 2.
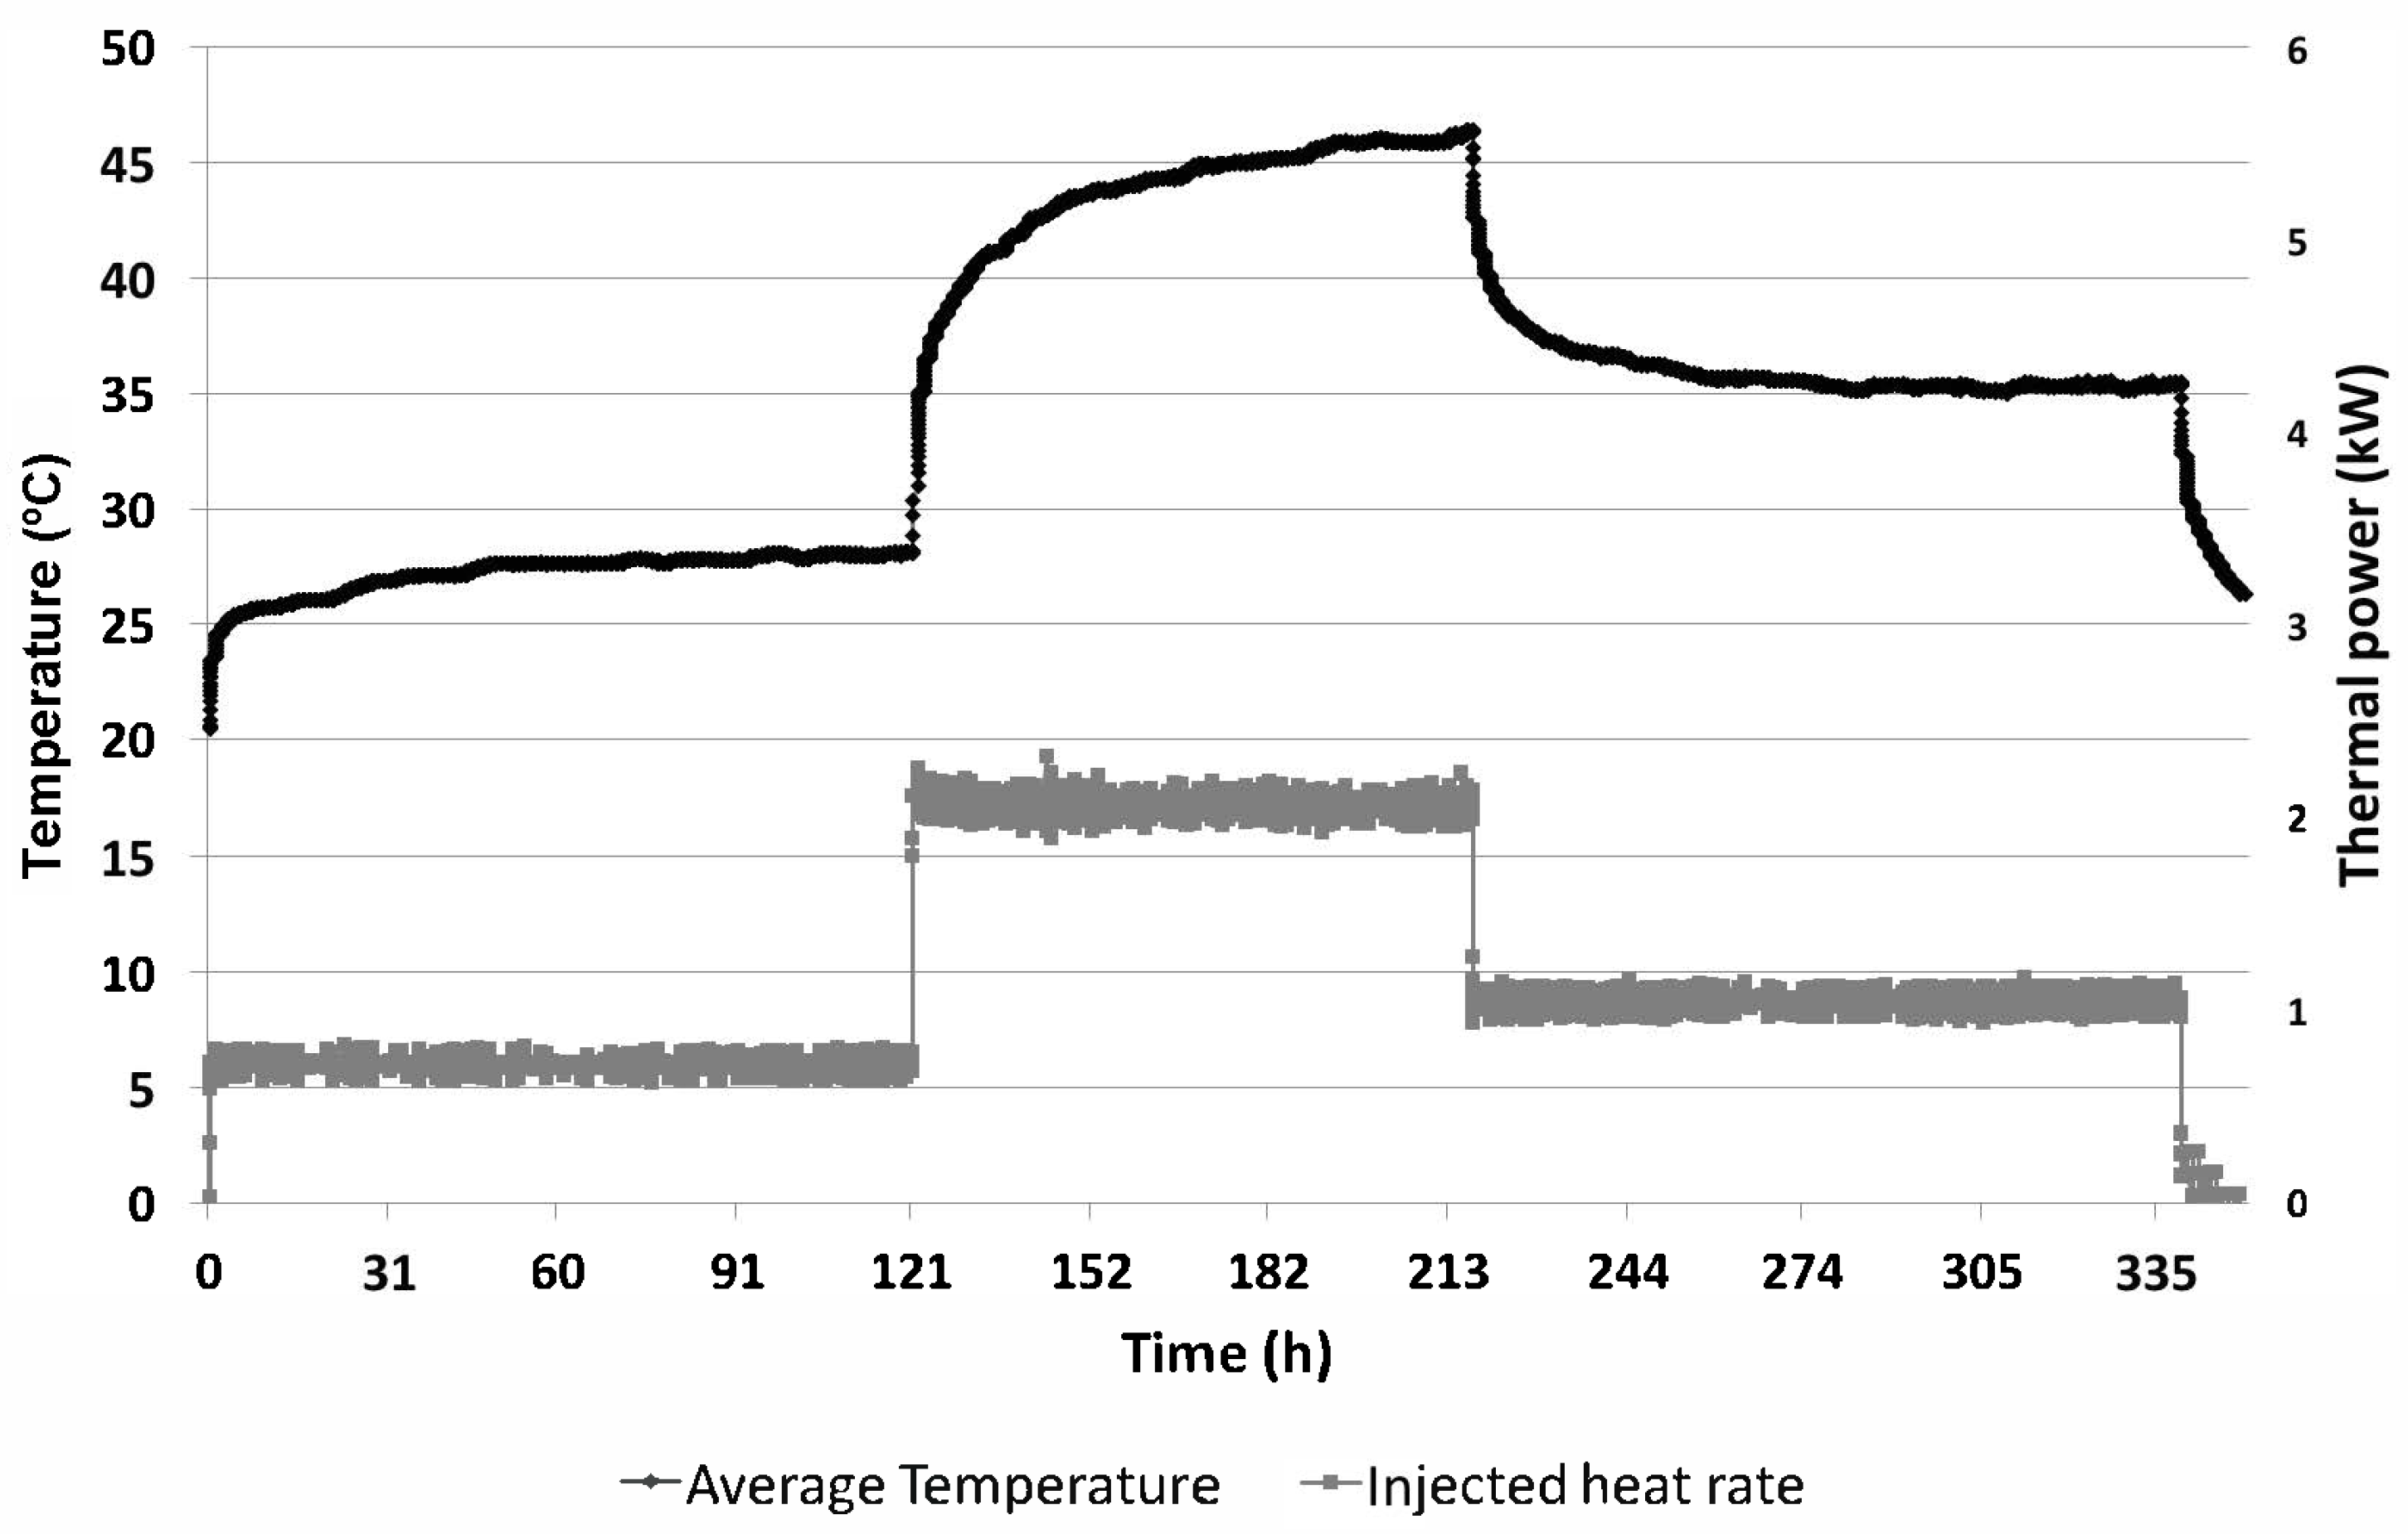
The temperatures of the heat exchange fluid entering and exiting the foundation during heat pump operation were monitored using pipe-plug thermocouples installed in the inlet and outlet ports of the manifold. In this manner, checking the temperature variations of the inlet and outlet pipes allowed to obtain the evolution of temperature over time. Figure 4 shows the schematic presentation of test and its results can be seen in Figure 5.
A parameter matching was performed using TRNSYS in order to get the simulation values that best fit the data obtained during the thermal tests. In the simulation of TRNSYS (Figure 6) the measured data (excel file named CARGA) was compared with the Type 557b (which simulates a buried exchanger with known borehole resistance) with the adjustment data detailed in Table 3.
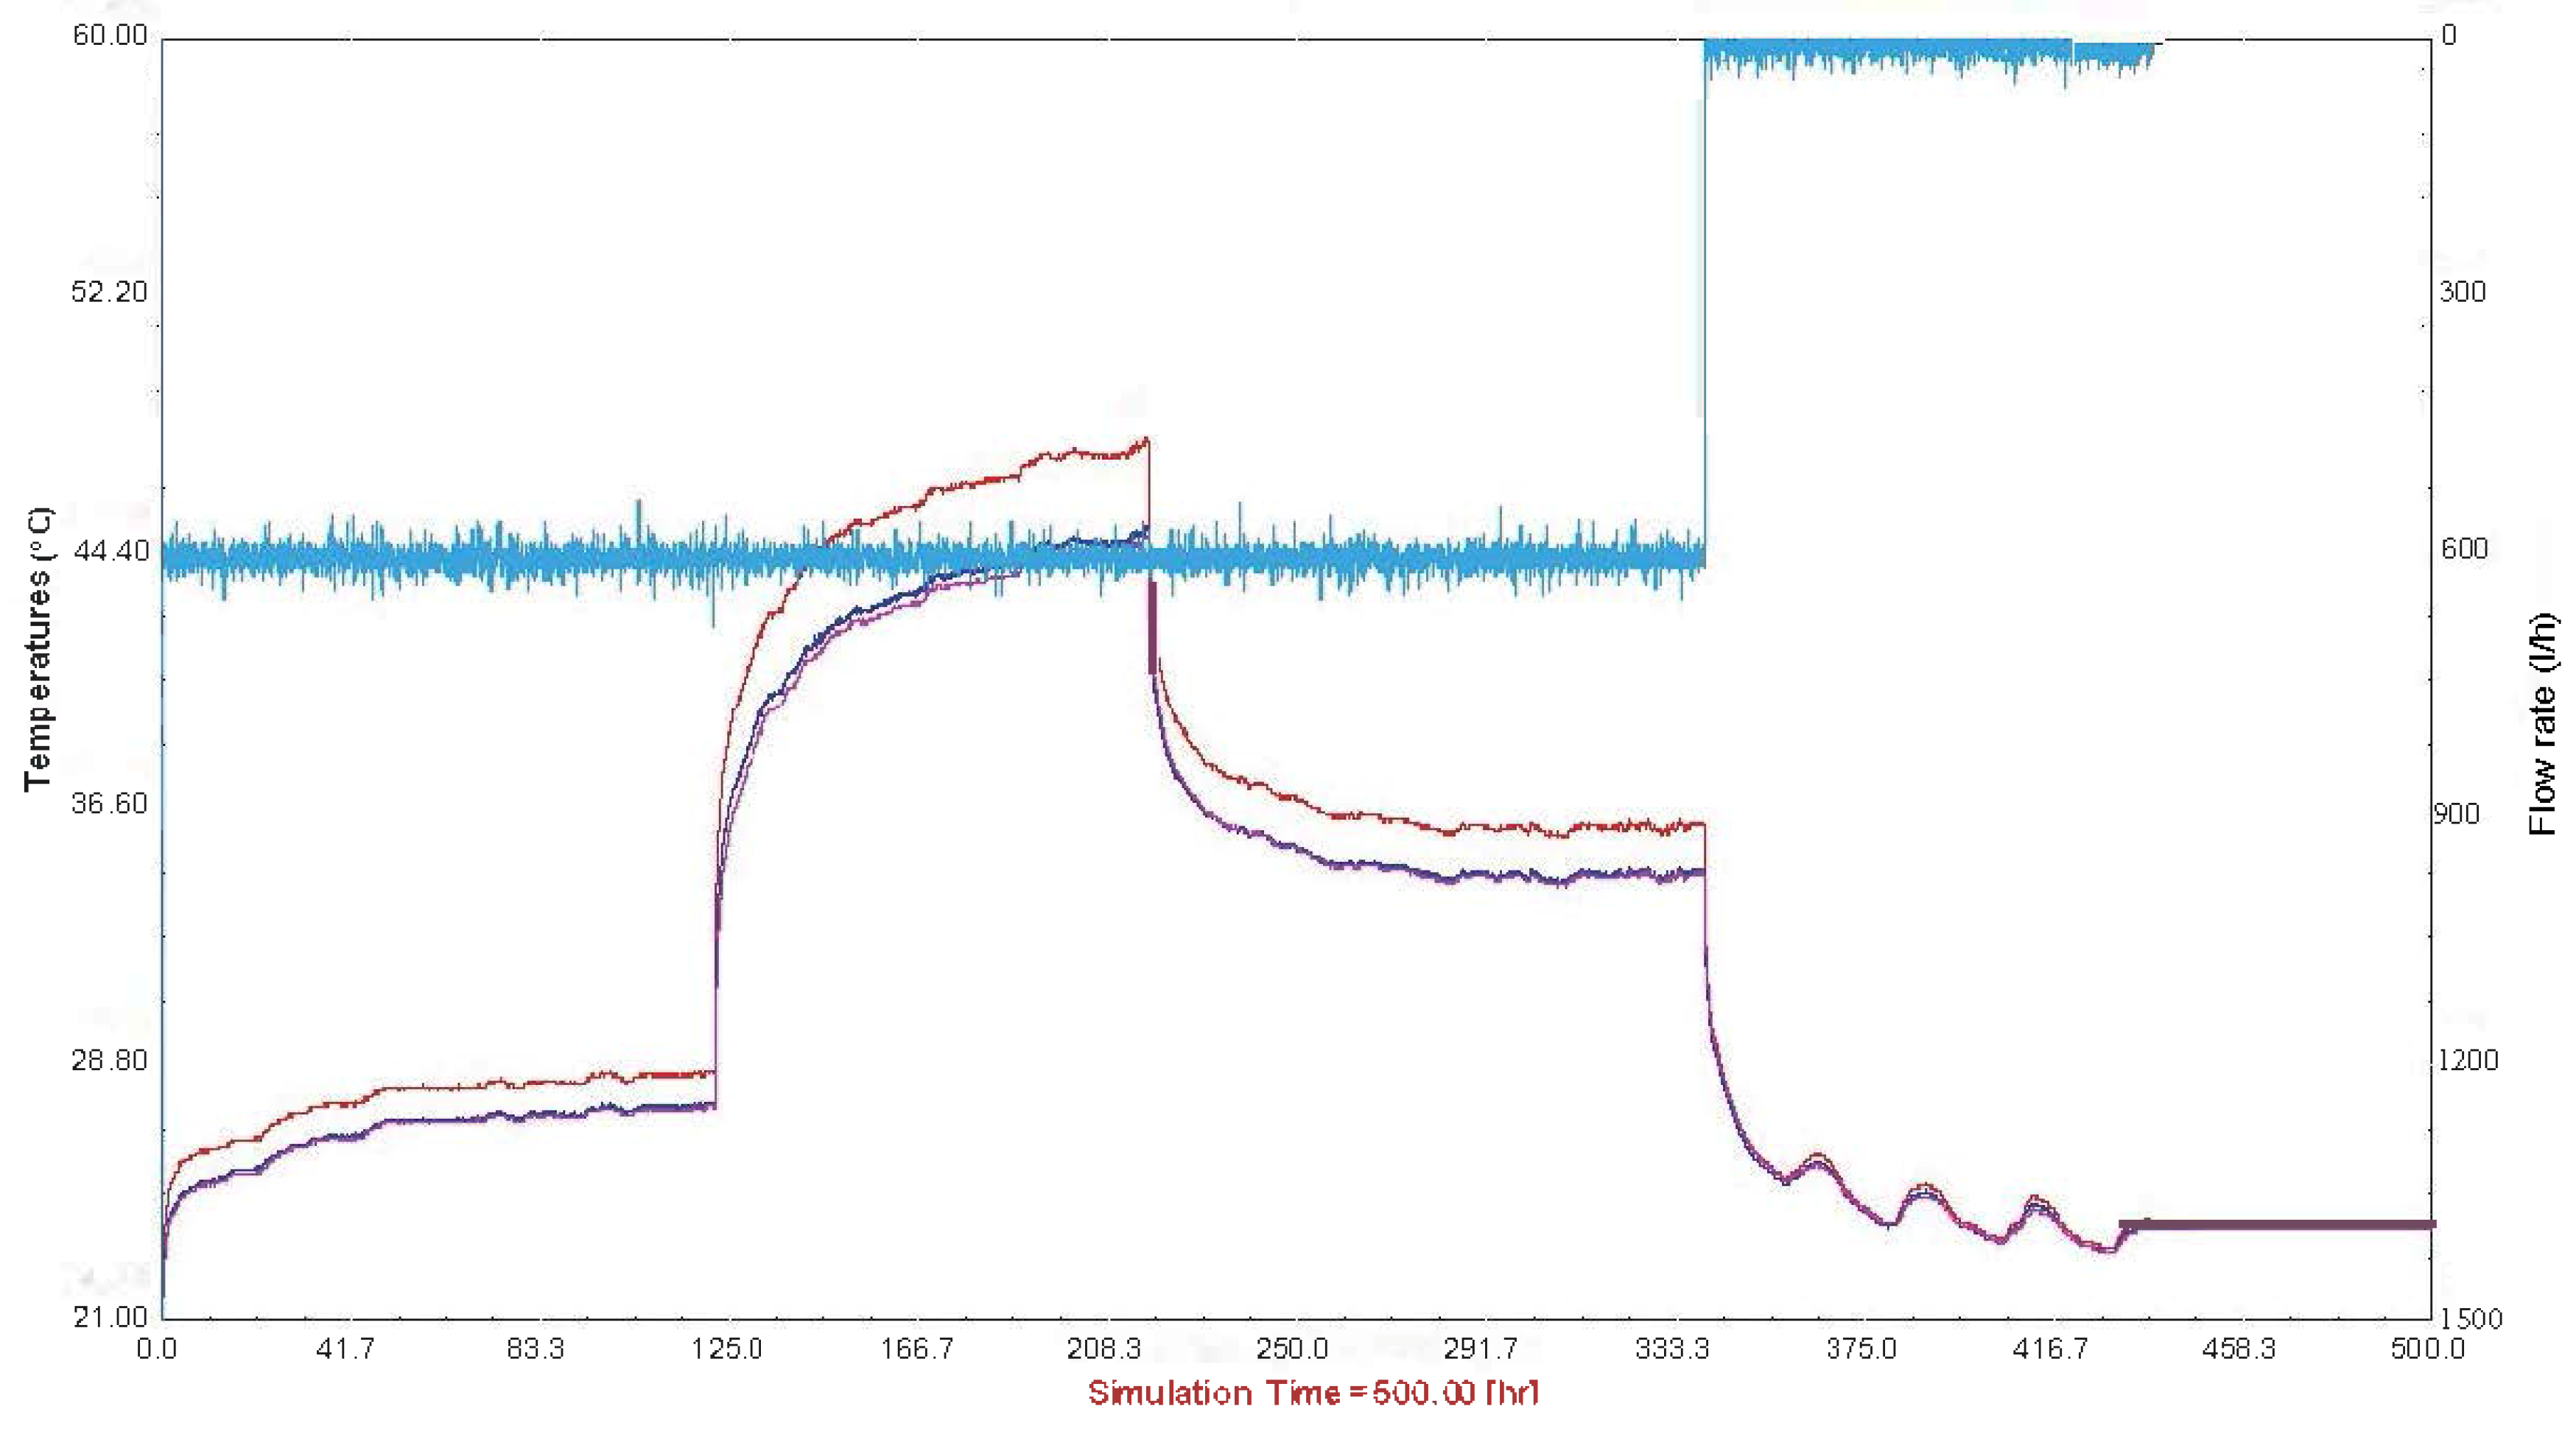
From the logged data of the inlet temperature, the thermal behaviour of the thermo-active pile was simulated by TRNSYS, working out the outlet temperature, and thus obtaining the evolution showed in Figure 7. That figure shows the inlet temperature of the pile during the experiment (red line) and it can be seen that the real measured outlet temperature of the energy pile (purple line) is well matched by the outlet temperature predicted by the model (blue line). It can therefore be concluded that the simulation is accurate. Moreover, it can be seen in [10] that the thermal parameters of the ground used are similar to the ground conductivity measured in the laboratory.
3.2. Thermal Behaviour under Service Loads
The aim of this test was to monitor the behaviour of the pile under heat loads as a ground coupled heat exchanger of a shallow geothermal heat pump system working in cooling mode. Through the EP with a fixed mechanical load of 100 metric tons, a cyclic varying amount of heat was injected into the ground simulating a thermoactive pile of a tertiary building.
In order to track the evolution of the test, two temperature sensors (inlet and outlet temperature of the pile) and a flow rate sensor have been installed and, throughout the duration of the test (two weeks), have been performing with a 3 minutes logging frequency.
3.2.1. Daily Profile of the Test
Figure 8 shows the cyclic varying amount of heat injected into the pile as a heat exchanger, that is to say, the heat that should be dissipated from a shallow geothermal heat pump system working in cooling mode. This profile corresponds to a tertiary building working in cooling mode.
3.2.2. Test Development
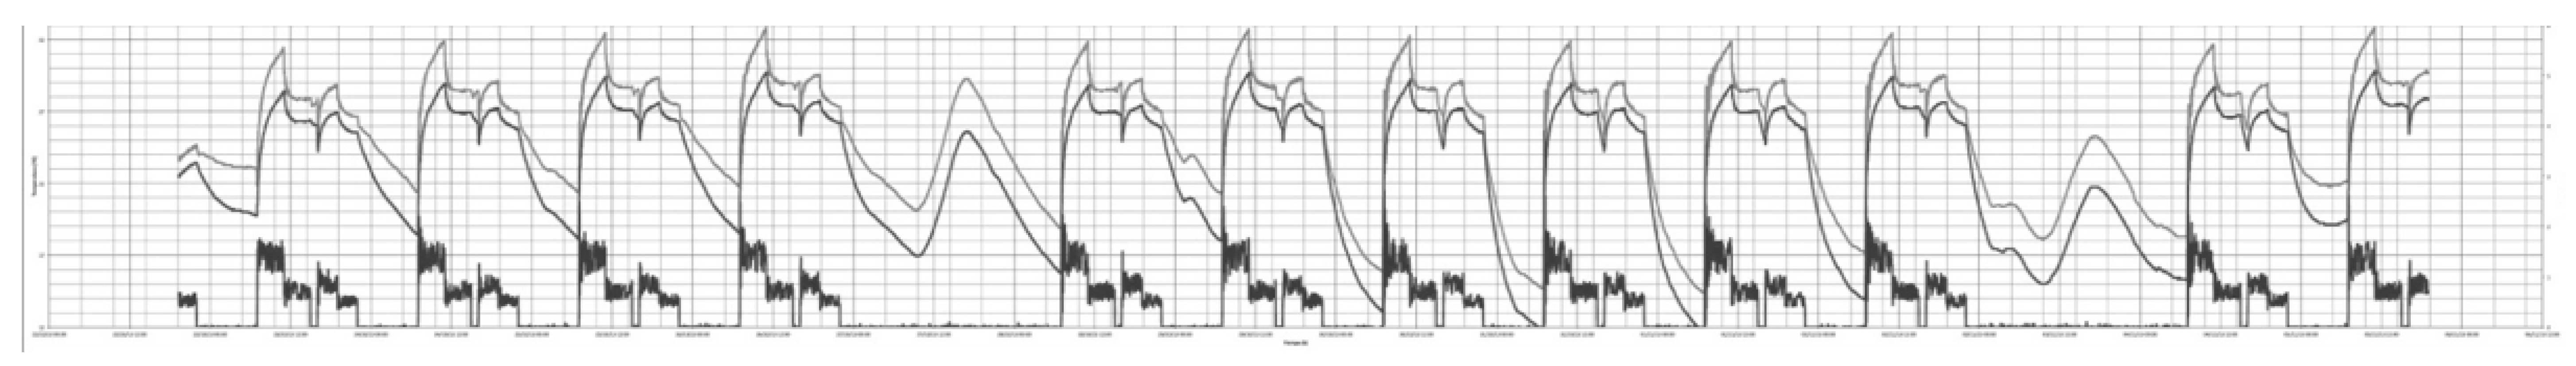
In Figure 9, the daily thermal behaviour of the pile during the course of every day of the test can be observed. The light grey line corresponds to the temperature of the water at the entrance of the pile and the darker grey line to the outlet temperature. The black line corresponds to the thermal power injected into geothermal pile.
3.2.3. Analysis of Results
The daily thermal behaviour of the pile with mechanical and thermal loads, simulating real conditions in a building (mechanical load due to its structural component and heat load due to heat dissipation from a geothermal heat pump) can be seen in Figure 10 and Figure 11. Daily graphs have been superimposed to analyse the thermal cycles from Figure 9.
The graphs show daily thermal cycles of the first week and the second week. From these graphs, the cyclic component and the long-term component of the temperature deviation of the pile is analysed with Equation (1):
where:
- Tinitial = temperature at the start of a day
- ΔT(t) = fluctuation due to the applied thermal demand
By comparing the different possible it is possible to get the long-term trend, while is the fluctuation due to demand. During the first week [from Wednesday to Saturday] (Figure 10), the initial temperature of the cycle is 22.8 C, and its evolution is: 24 C, 23.5 C and 24.2 C. During the second week [from Monday to Saturday] (Figure 11), its evolution is as follows: 21.8 C; 23.4 C; 20.8 C; 19.0 C; 19.1 C; 21.0 C. It is observed that its evolution stays within a range of 2–3 degrees during the entire cycle, without observing any tendency of a temperature increase.
It can be verified that its thermal behaviour is correct for the applied thermal load, i.e., the thermal load from the heat pump is properly dissipated by the EP, without producing a significant increase of the entering water temperature (EWT) that would excessively penalise system performance. An increase of this temperature would denote that the pile could not dissipate the supplied thermal load. Therefore, it can be deduced that the geothermal pile would thermally work without any problem as a heat exchanger of a shallow geothermal air-conditioning installation, under these test conditions.
3.3. Energy Pile Performance Analysis in Comparison with a Single U BHE
Once validated and characterized the correct behaviour of the EP under thermal and mechanical loads, there has been performed an analysis of its performance coupled to a heat pump in comparison between the performance of a single U BHE with the same length. The comparison has been made by modelling and simulating with TRNSYS software tool, commonly used by geothermal engineers. TRNSYS [11] is a transient system simulation program with a modular structure that was designed to solve complex energy system problems by breaking the problem down into a series of smaller components (referred to as “types”). TRNSYS Library includes the components commonly found in a geothermal system (ground heat exchanger, heat pump, circulation pump, etc.) and the program allows to directly join the components implemented using other software (e.g., Matlab or Excel). In this case this feature is important because the simulation uses as input values the experimental thermal loads injected (corrected by the SPF of the heat pump) to the pile and described above, in form of an Excel file.
Figure 12 shows the TRNSYS model scheme used to simulate both ground heat exchangers (BHE). The model scheme consists of four components: water-to-water heat pump, circulation pump, ground heat exchanger (pile or single U) and loads. The first three components have been selected from TRNSYS library and the last component and “loads” is an Excel file containing the thermal loads data.
The water-to-water heat pump selected component is a reversible heat pump (Type 668); it supplies the thermal loads absorbing energy from the ground (heating mode) or rejecting energy to the ground (cooling mode). This type is based on user-supplied data files containing catalogue data for the capacity and thermal power draw, based on the entering load and source temperatures. These files (one for heating and one for cooling) are modified introducing the values of a commercial unit that fits to the experimental facility size (2 kW). The circulation pump component (Type 3b) is a simple-speed model fixed at the maximum flow value.
Loads module represents the thermal loads that the building is demanding, the simulation uses the hourly thermal loads data showed in Figure 13, calculated from the injected heat to the pile during the test described in Section 3.2 (14 days) corrected by the heat pump performance. These loads correspond to a tertiary building profile running in cooling mode. At each time step of the simulation Excel loads module can supply the value of the corresponding hourly thermal load. Nevertheless, the quantity that the water to water heat pump module needs as one of its inputs is the inlet load temperature (). To calculate this input value from the hourly thermal load, the building internal circuit is considered to be a control volume where the thermal power balance can be evaluated as:
where:
- =
- hourly thermal loads
- =
- heat pump capacity at current conditions. The initial conditions were assumed as 20 C of pipes water temperature and a pipes volume of 0.3
Equation (2) is programmed in the Excel file, so the excel file directly supplies the inlet load temperature to the water to water heat pump module. Loads component also supplies to the heat pump module the control signals for running or stopping, in this case 12 C is fixed as stop temperature in cooling.
Two different TRNSYS Types of BHE have been used to make two comparisons. The first one, Type 557b, to simulate the EP behaviour, characterized as explained in Section 3.1. The second model used to simulate the single U BHE is the Type 557a. This type assumes that the boreholes are placed uniformly within a cylindrical storage volume of ground. There is convective heat transfer within the pipes, and conductive heat transfer to the storage volume. The temperature in the ground is calculated from three components: global temperature, local solution and a steady flux solution. The global and local problems are solved with the use of an explicit finite difference method. The steady flux solution is obtained analytically. The temperature is calculated using superposition methods. The user can define ground thermal properties like thermal conductivity and heat capacity and also determine the main heat exchanger characteristics (depth, radius, number of boreholes, etc.). The parameters used in the simulation are shown in Table 4. This model has been validated experimentally in previous investigations [12].
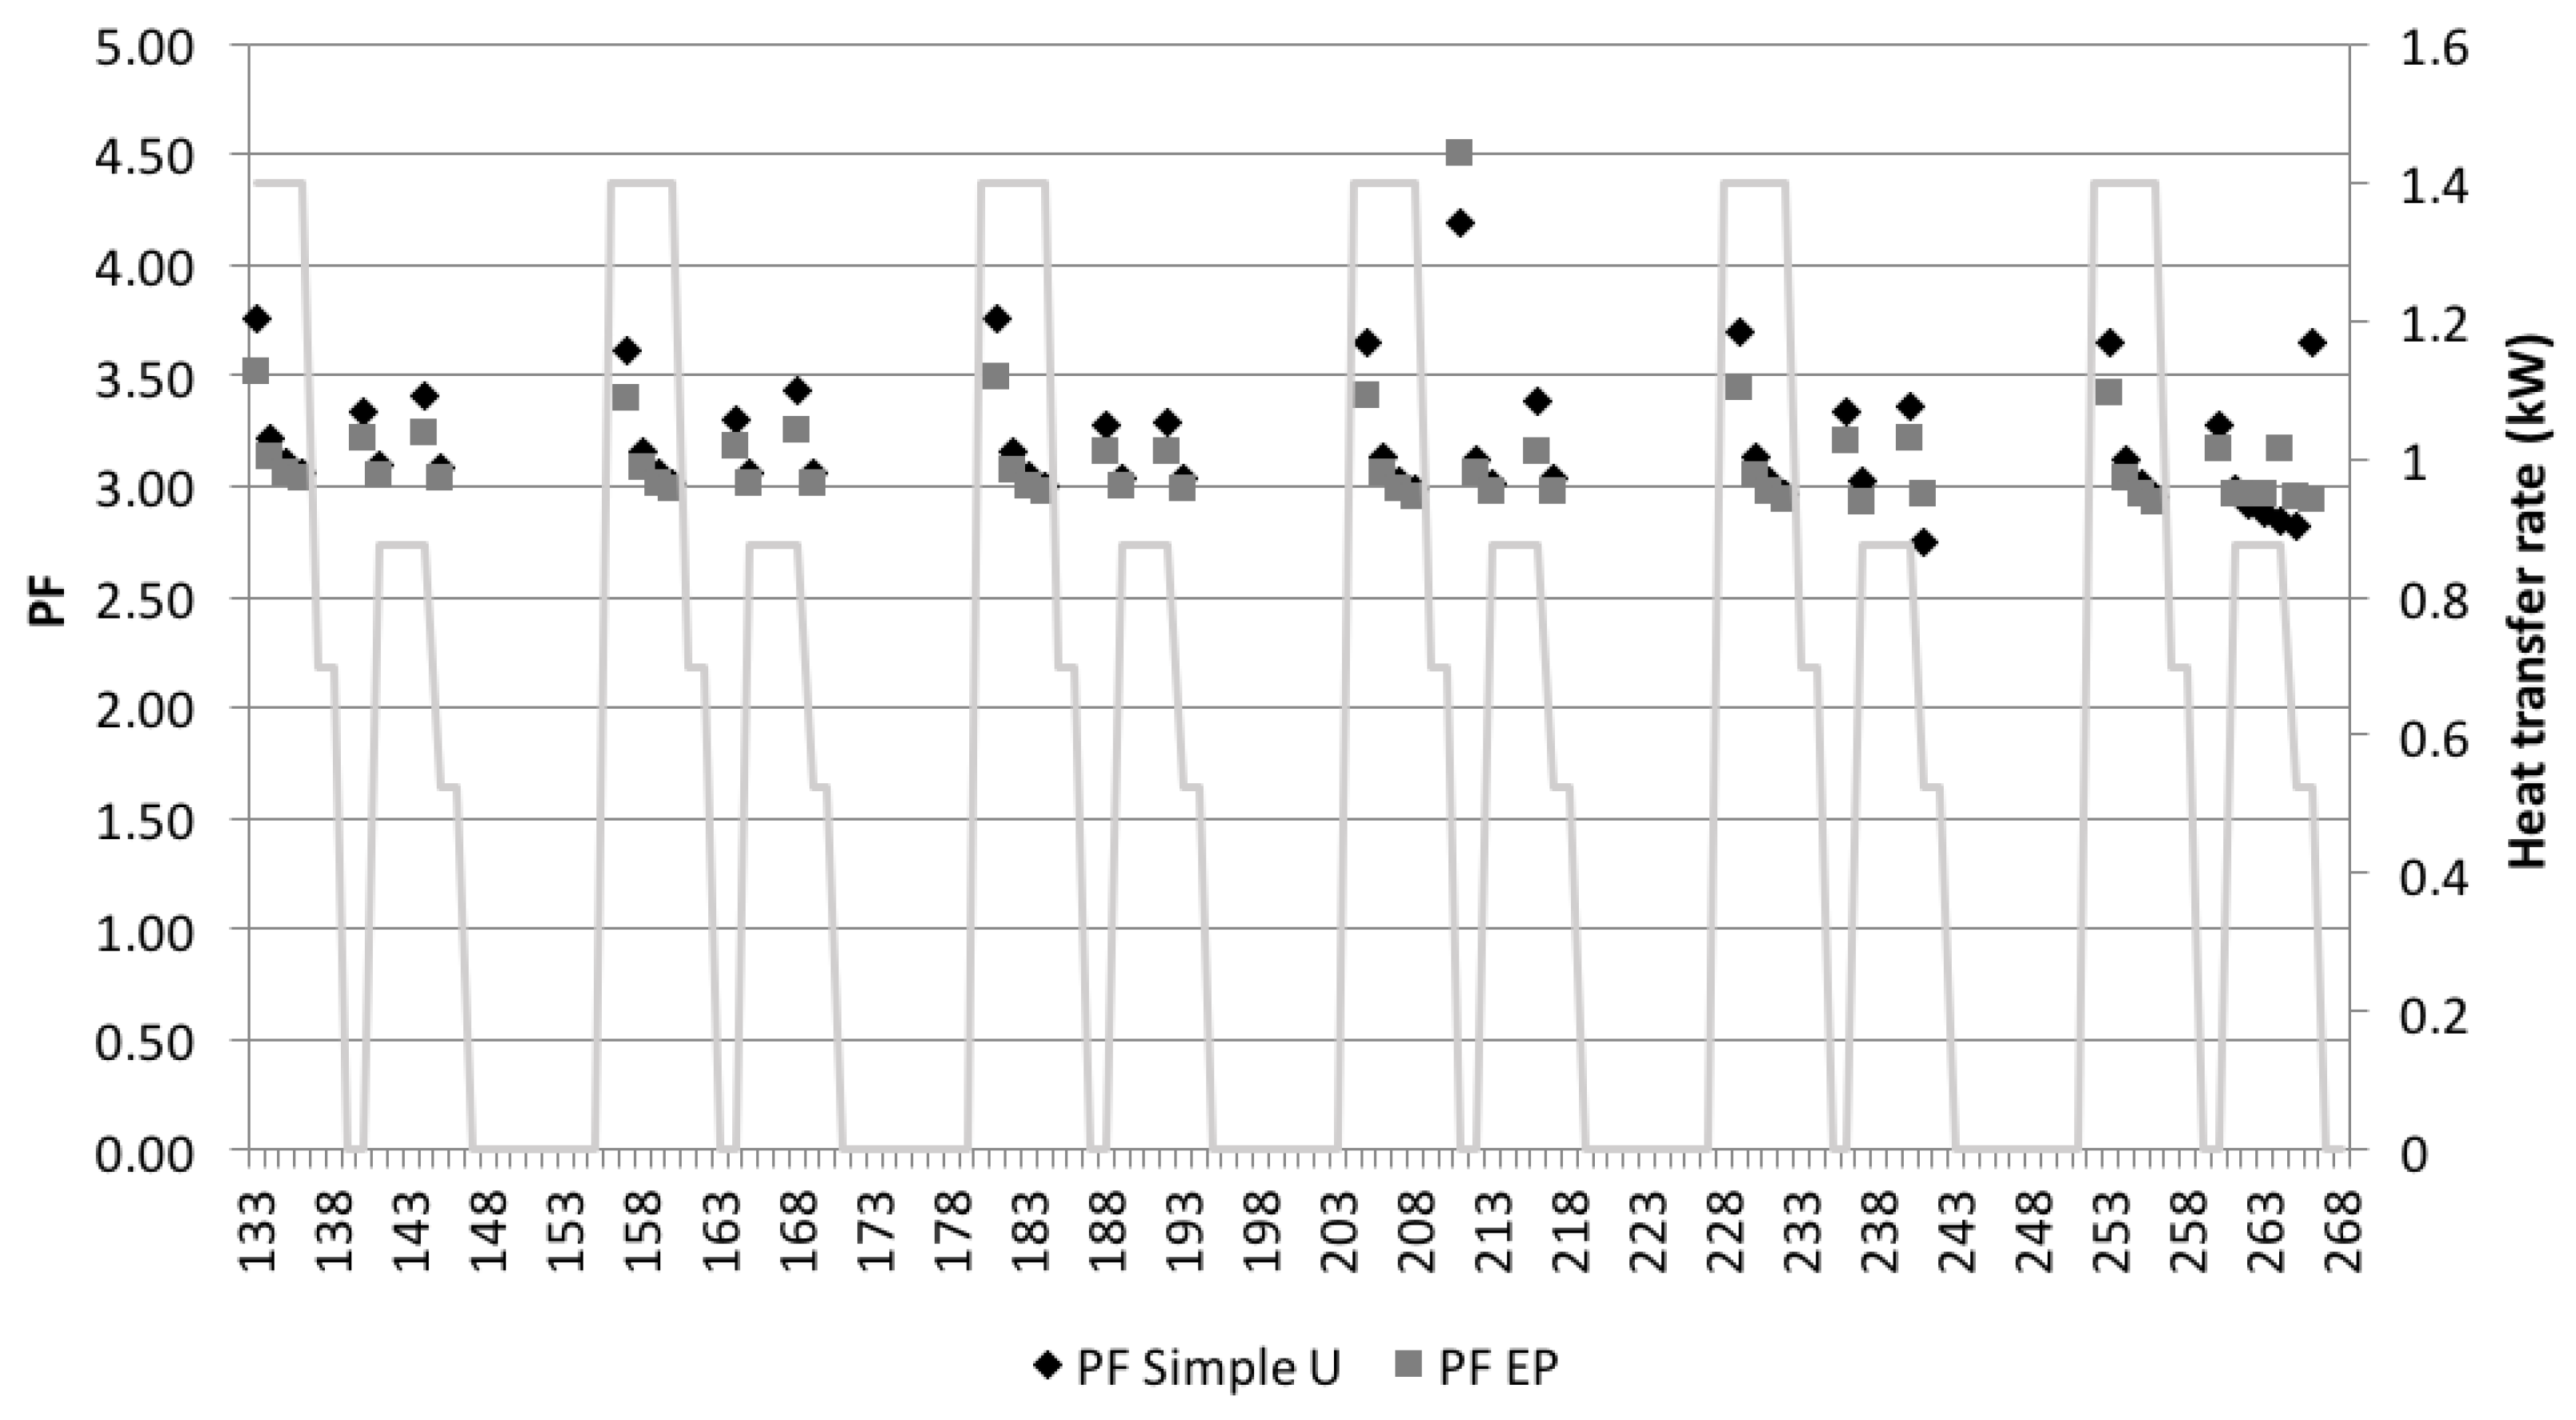
Through TRNSYS simulation the hourly performance factor (PF) for both models has been calculated: EP and single U BHE obtaining the results shown in Figure 14.
Figure 14 shows the simulation results from Monday to Saturday (between 133 and 268 h from test start). The value of the hourly performance factor obtained for both models (EP and single U BHE) has been plotted as well as the thermal load profile injected to help in the analysis. The first remark which can be outlined from the modelling results is that the injection test performed represents the worst working conditions for the EP, since to provide the desired thermal load profile, the heat pump works intermittently due to the water distribution system inertia. Thus, heat injection into the ground is not continuous as in the profile (see Figure 8 and Figure 14). It can be observed that, at the end of the morning and the evening, when the thermal demand declines, the heat pump does not start. Regarding the results of the comparison of the PF between the two systems, it can be concluded that the SPF of single U is slightly higher being this effect more pronounced during the demand peaks, e.g., in the morning, with a SPF increase of about 7% in the morning and about 4% in the afternoon. During the rest of the day the increase in performance of single U system over EP system is around 1%. These results are directly related to the somewhat lower borehole resistance, , of the conventional single U as compared to the EP, taking into account all the geometrical factors and characteristics of the grouting and cement materials present in this study. In spite of this, the improvement in the performance with the single U is not very high compared to the difference in investment costs between the two BHEs, since the energy pile installation saves the entire cost of drilling (about 30–40 €/m currently in Spain) by using the building’s own foundation as a geothermal heat exchanger. The resulting increase of techno-economic efficiency can be estimated, with the use of a simplistic Life Cycle Cost approach, to be of the order of 15%, taking into account the investment and operating costs over the life of the installation.
4. Conclusions
A precast thermo-active pile with a unique geometry has been designed, which allows assembling a single heat exchanger/pile from two or more single sections by means of a joint, and has been tested thermally and mechanically. Firstly, an adjustment of its parameters was performed by means of TRNSYS that allowed to simulate its thermal behaviour.
It has been verified that its mechanical behaviour under thermal loads is proper [7,9] and, as described in this article, its thermal behaviour is also adequate. The thermoactive pile working as a geothermal heat exchanger dissipates correctly the injected thermal power without suffering increases of flow temperature not compatible with the heat pump working temperatures. Therefore, under the test conditions, the thermoactive pile would work correctly in a GSHP installation.
Besides its thermal behaviour has been compared with that of the most used type of BHE (single U). It has been obtained that due to its geometry the performance obtained in the energy pile installation is very similar to the single U, although a little inferior, worsening in the dissipation of the thermal power peaks because the cement layer around the pipes increases its thermal resistance. However this decrease of performance is not significant in comparison with the difference of execution costs of both systems thus it is concluded that this typology of thermoactive structure is a reliable and techno-economically efficient solution.
Acknowledgments
We thank the Spanish Ministry of Economy and Competitiveness for its financial support, through the program INNPACTO 2011 (IPT-2011-1214-380000), for the design, installation and instrumentation of the geothermal pile in Valencia. We thank Rodio Kronsa, CEDEX and Energesis for their dedication and participation in the project.
Author Contributions
Borja Badenes, Teresa Magraner, Cristina de Santiago and Javier F. Urchueguia took part in the conception, design, performance and analysis of the experiments; Borja Badenes and Teresa Magraner wrote the article under the supervision of Javier F. Urchueguía and Cristina de Santiago.
Conflicts of Interest
The authors declare no conflict of interest.
Abbreviations
The following abbreviations are used in this manuscript:
| kW | kilowatt |
| t | tonne |
| EP | Energy Pile |
| TRT | Thermal Response Test |
| GSHPA | Ground Source Heat Pump Association |
| BHE | Borehole Heat Exchanger |
| Thermal resistance of the borehole | |
| PF | Performance Factor |
| SPF | Season Performance Factor |
References
- Olgun, C.G.; Ozudogru, T.Y.; Abdelaziz, S.L.; Senol, A. Long-term performance of heat exchanger piles. Acta Geotech. 2015, 10, 553–569. [Google Scholar] [CrossRef]
- Sutman, M.; Olgun, C.G.; Brettmann, T. Full-Scale Field Testing of Energy Piles. In Proceedings of the IFCEE, San Antonio, TX, USA, 17–21 March 2015; Available online: http://ascelibrary.org/doi/pdf/10.1061/9780784479087.148 (accessed on 28 August 2017).
- Murphy, K.D.; McCartney, J.S.; Henry, K.S. Evaluation of thermo-mechanical and thermal behavior of full-scale energy foundations. Acta Geotech. 2015, 10, 179–195. [Google Scholar] [CrossRef]
- Abdelaziz, S.L.; Ozudogru, T.Y. Selection of the design temperature change for energy piles. Appl. Therm. Eng. 2016, 107, 1036–1045. [Google Scholar] [CrossRef]
- Suryatriyastuti, M.E.; Mroueh, H.; Burlon, S. Numerical Analysis of the Bearing Capacity of Thermoactive Piles under Cyclic Axial Loading. In Energy Geostructures; John Wiley & Sons, Inc.: Hoboken, NJ, USA, 2013; pp. 139–155. [Google Scholar]
- Ground Source Heat Pump Association. Thermal Pile: Design, Installation & Materials Standards; Issue 1.0; Standard, Ground Source Heat Pump Association: Stillwater, OK, USA, 2012. [Google Scholar]
- De Santiago, C.; de Santayana, F.P.; de Groot, M.; Urchueguía, J.F.; Badenes, B.; Magraner, T.; Arcos, J.; Martín, F. Thermo-mechanical behavior of a thermo-active precast pile. Bulg. Chem. Commun. 2016, 48, 41–54. [Google Scholar]
- Dirección General de Vivienda. Código Técnico de la Edificación—Documento Básico de Seguridad Estructural; Standard, Ministerio de Fomento del Gobierno de España: Oviedo, Spain, 2009. [Google Scholar]
- De Groot, M.; de Santiago, C.; Pardo, F.; Arcos, J.L.; Martín, F.; Urchueguía, J.F.; Badenes, B. Heating and cooling an energy pile under working load in Valencia. In Proceedings of the European Geothermal Congress, Pisa, Italy, 3–7 July 2013. [Google Scholar]
- Badenes, B.; de Santiago, C.; Nope, F.; Magraner, T.; Urchueguía, J.F.; de Groot, M.; de Santayana, F.P.; Arcos, J.L.; Martín, F. Thermal characterization of a geothermal precast pile in Valencia (Spain). In Proceedings of the European Geothermal Congress, Strasbourg, France, 14–19 September 2016. [Google Scholar]
- Solar Energy Laboratory. TRNSYS 16. A Transient System Simulation Program; Licensed Department Física Aplicada—Universitat Politècnica de València: València, Spain, 2004. [Google Scholar]
- Magraner, T.; Montero, A.; Quilis, S.; Urchueguia, J. Comparison between design and actual energy performance of a HVAC-ground coupled heat pump system in cooling and heating operation. Energy Build. 2010, 42, 1394–1401. [Google Scholar] [CrossRef]
Figure 1.
Precast pile at the factory Rodio-Kronsa.
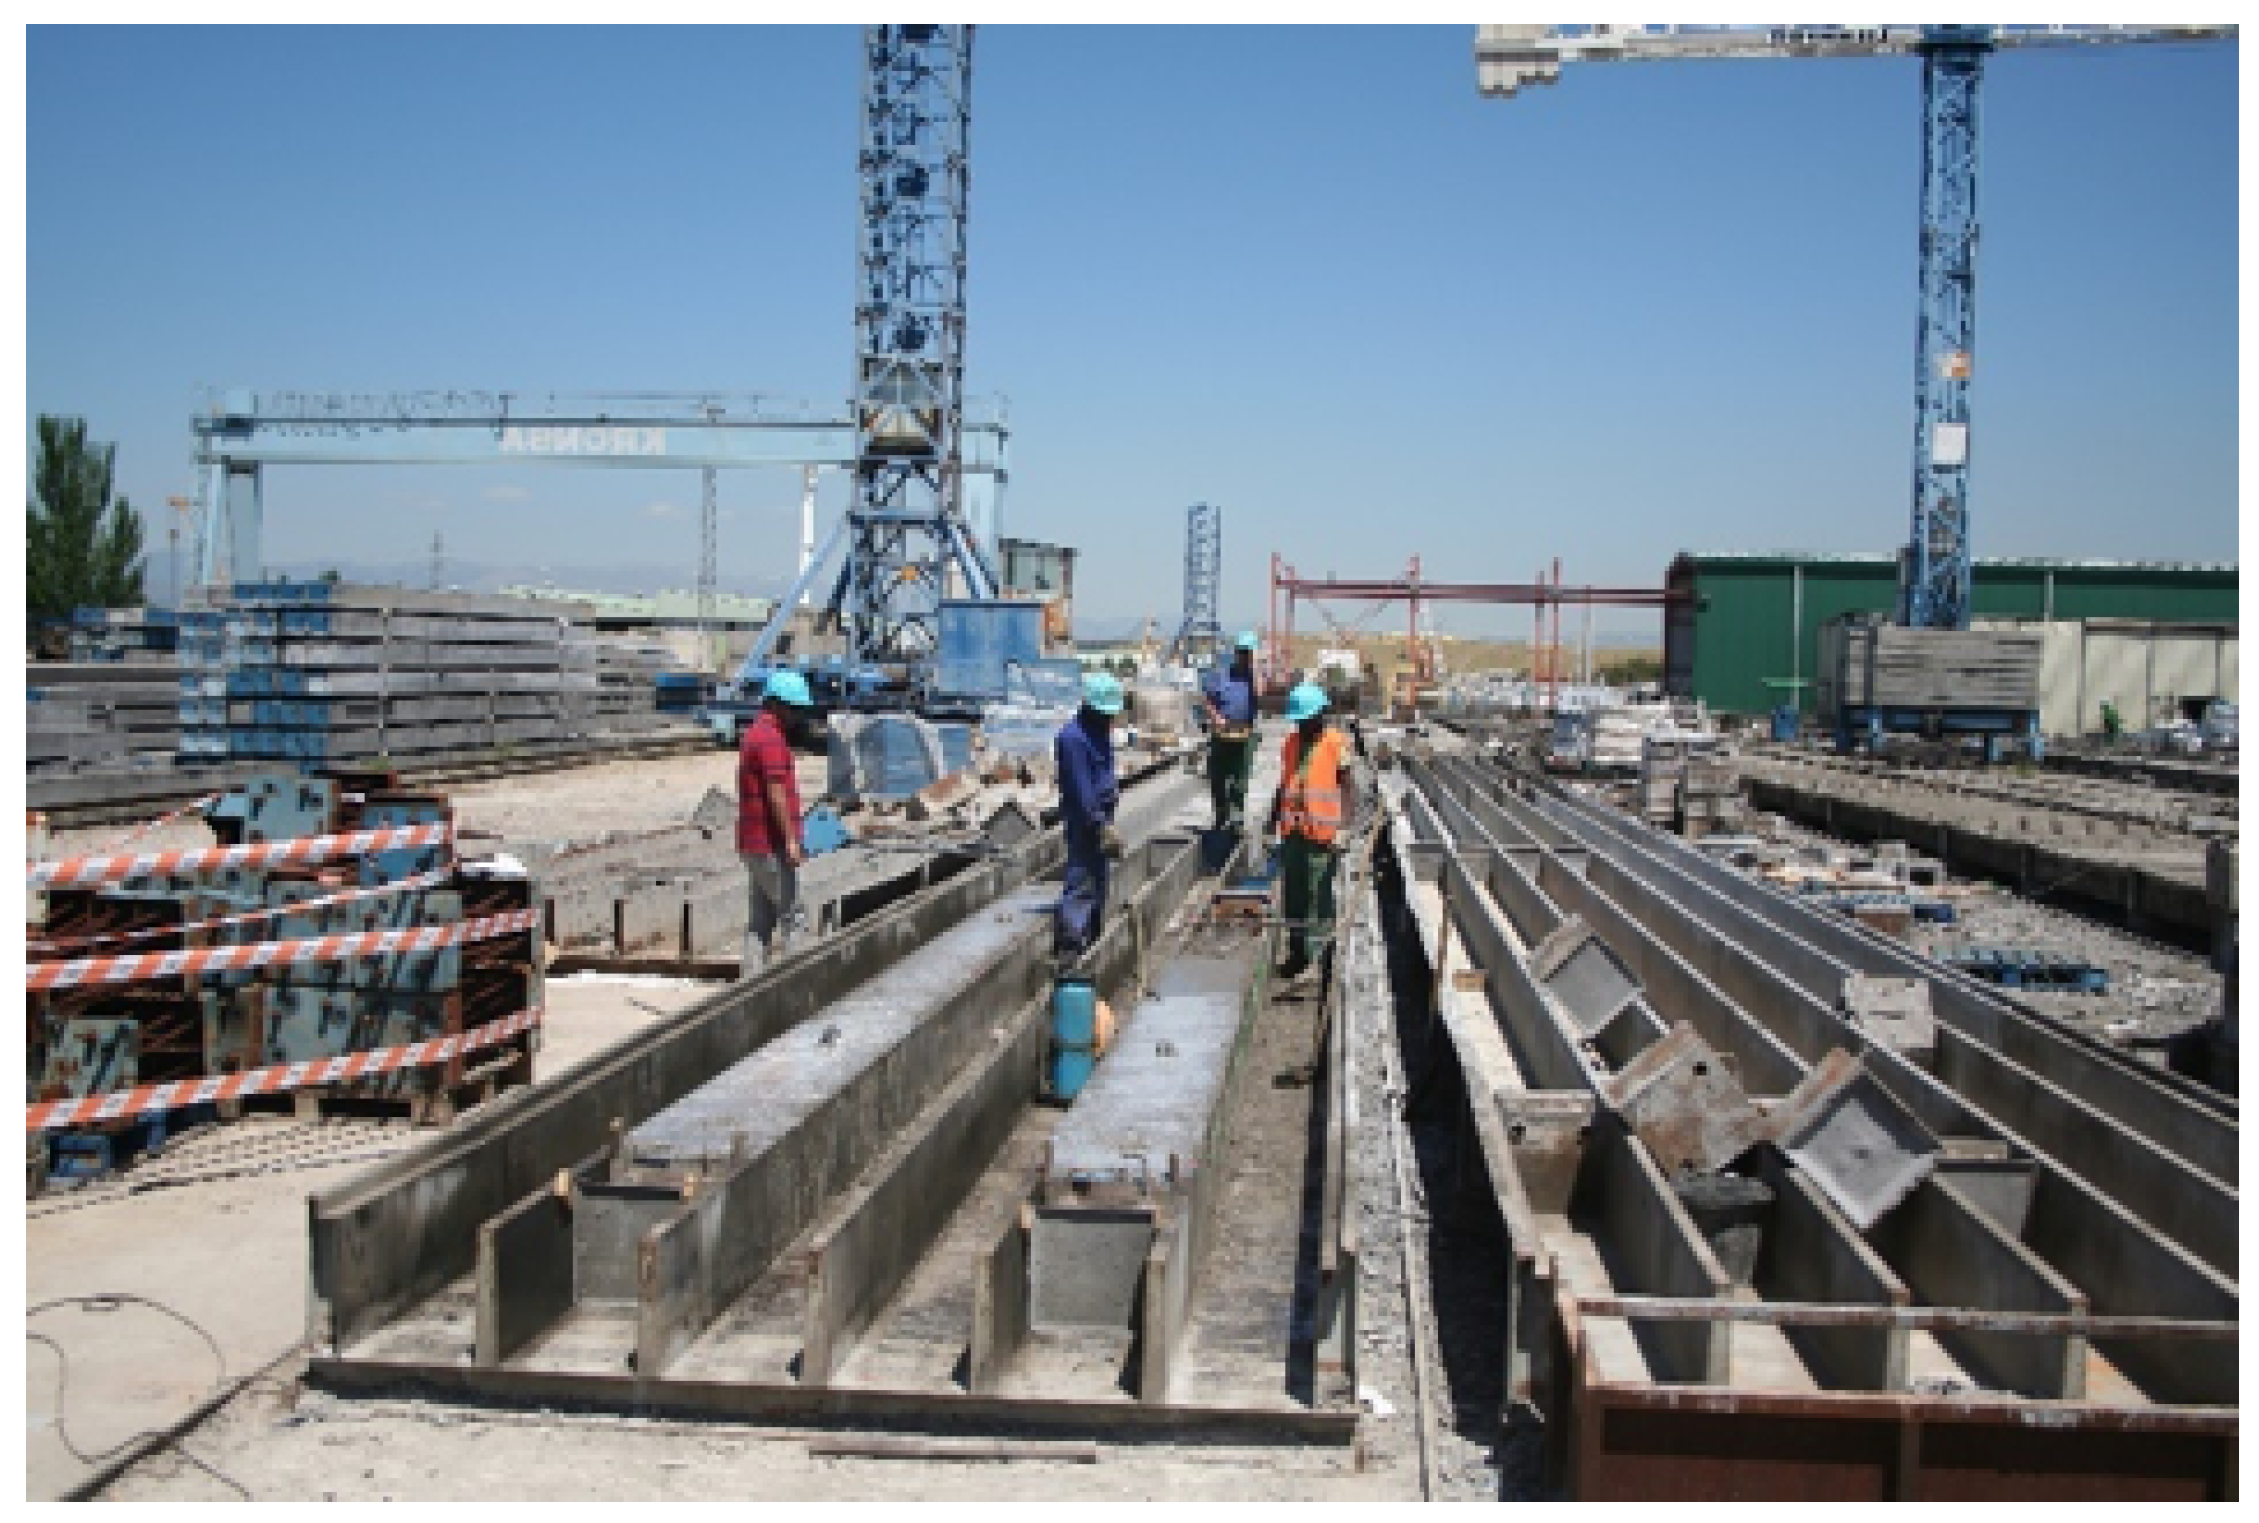
Figure 2.
Diagram showing: (a) Scheme of the mechanical loading system (units in meters) (b) view of the metallic frame.
Figure 2.
Diagram showing: (a) Scheme of the mechanical loading system (units in meters) (b) view of the metallic frame.
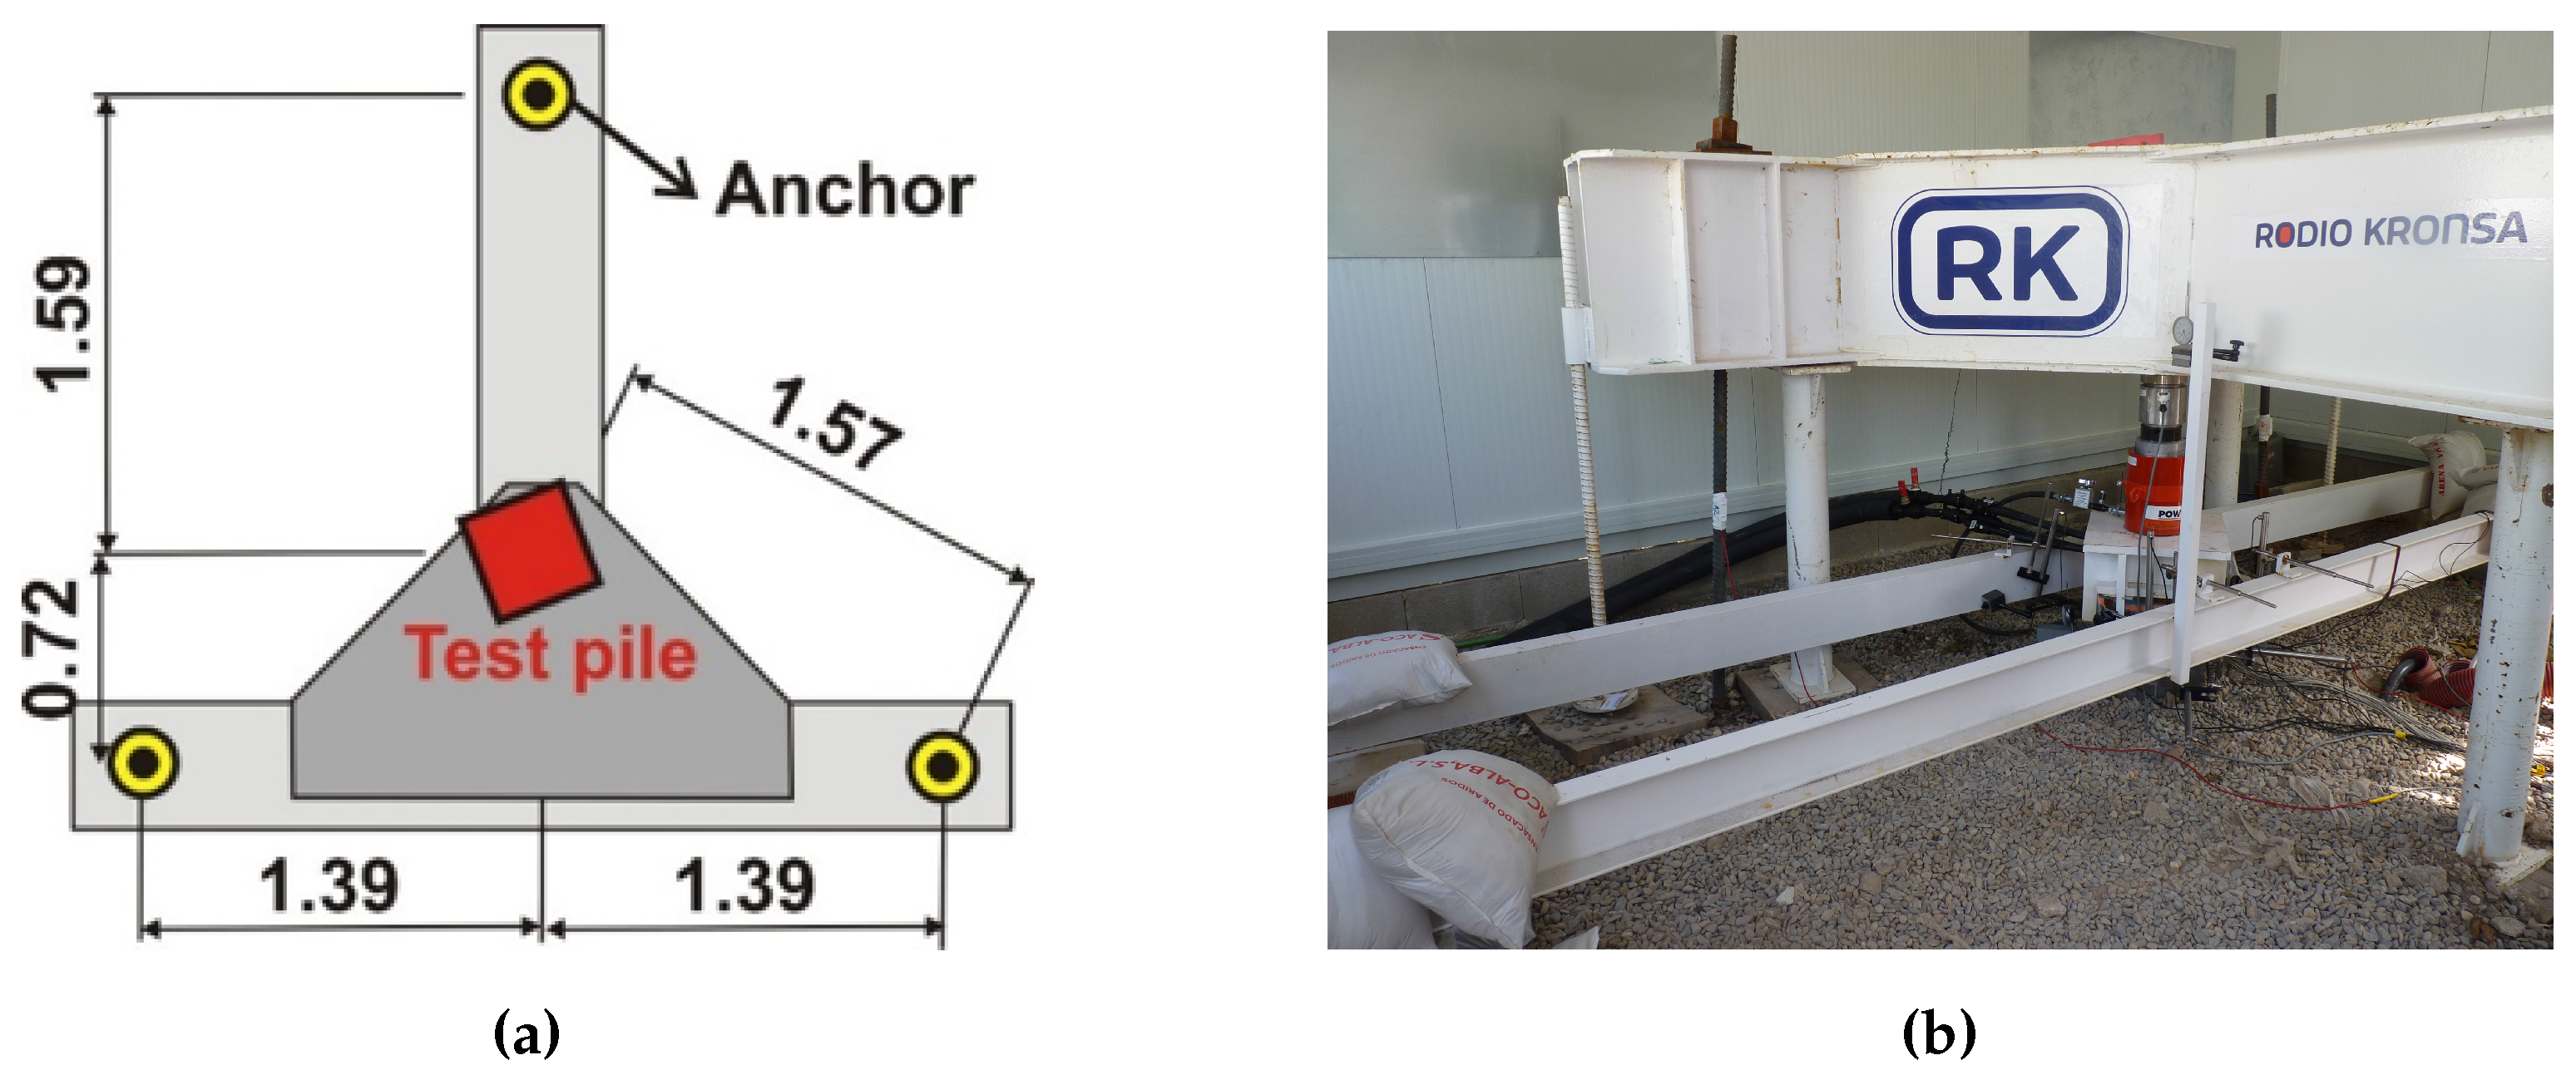
Figure 3.
Thermal loads generating facility.

Figure 4.
Schematic presentation of the thermal leaps over time (5 days each one).

Figure 5.
Data recording from the thermal installation during the tests.

Figure 6.
TRNSYS characterization model.
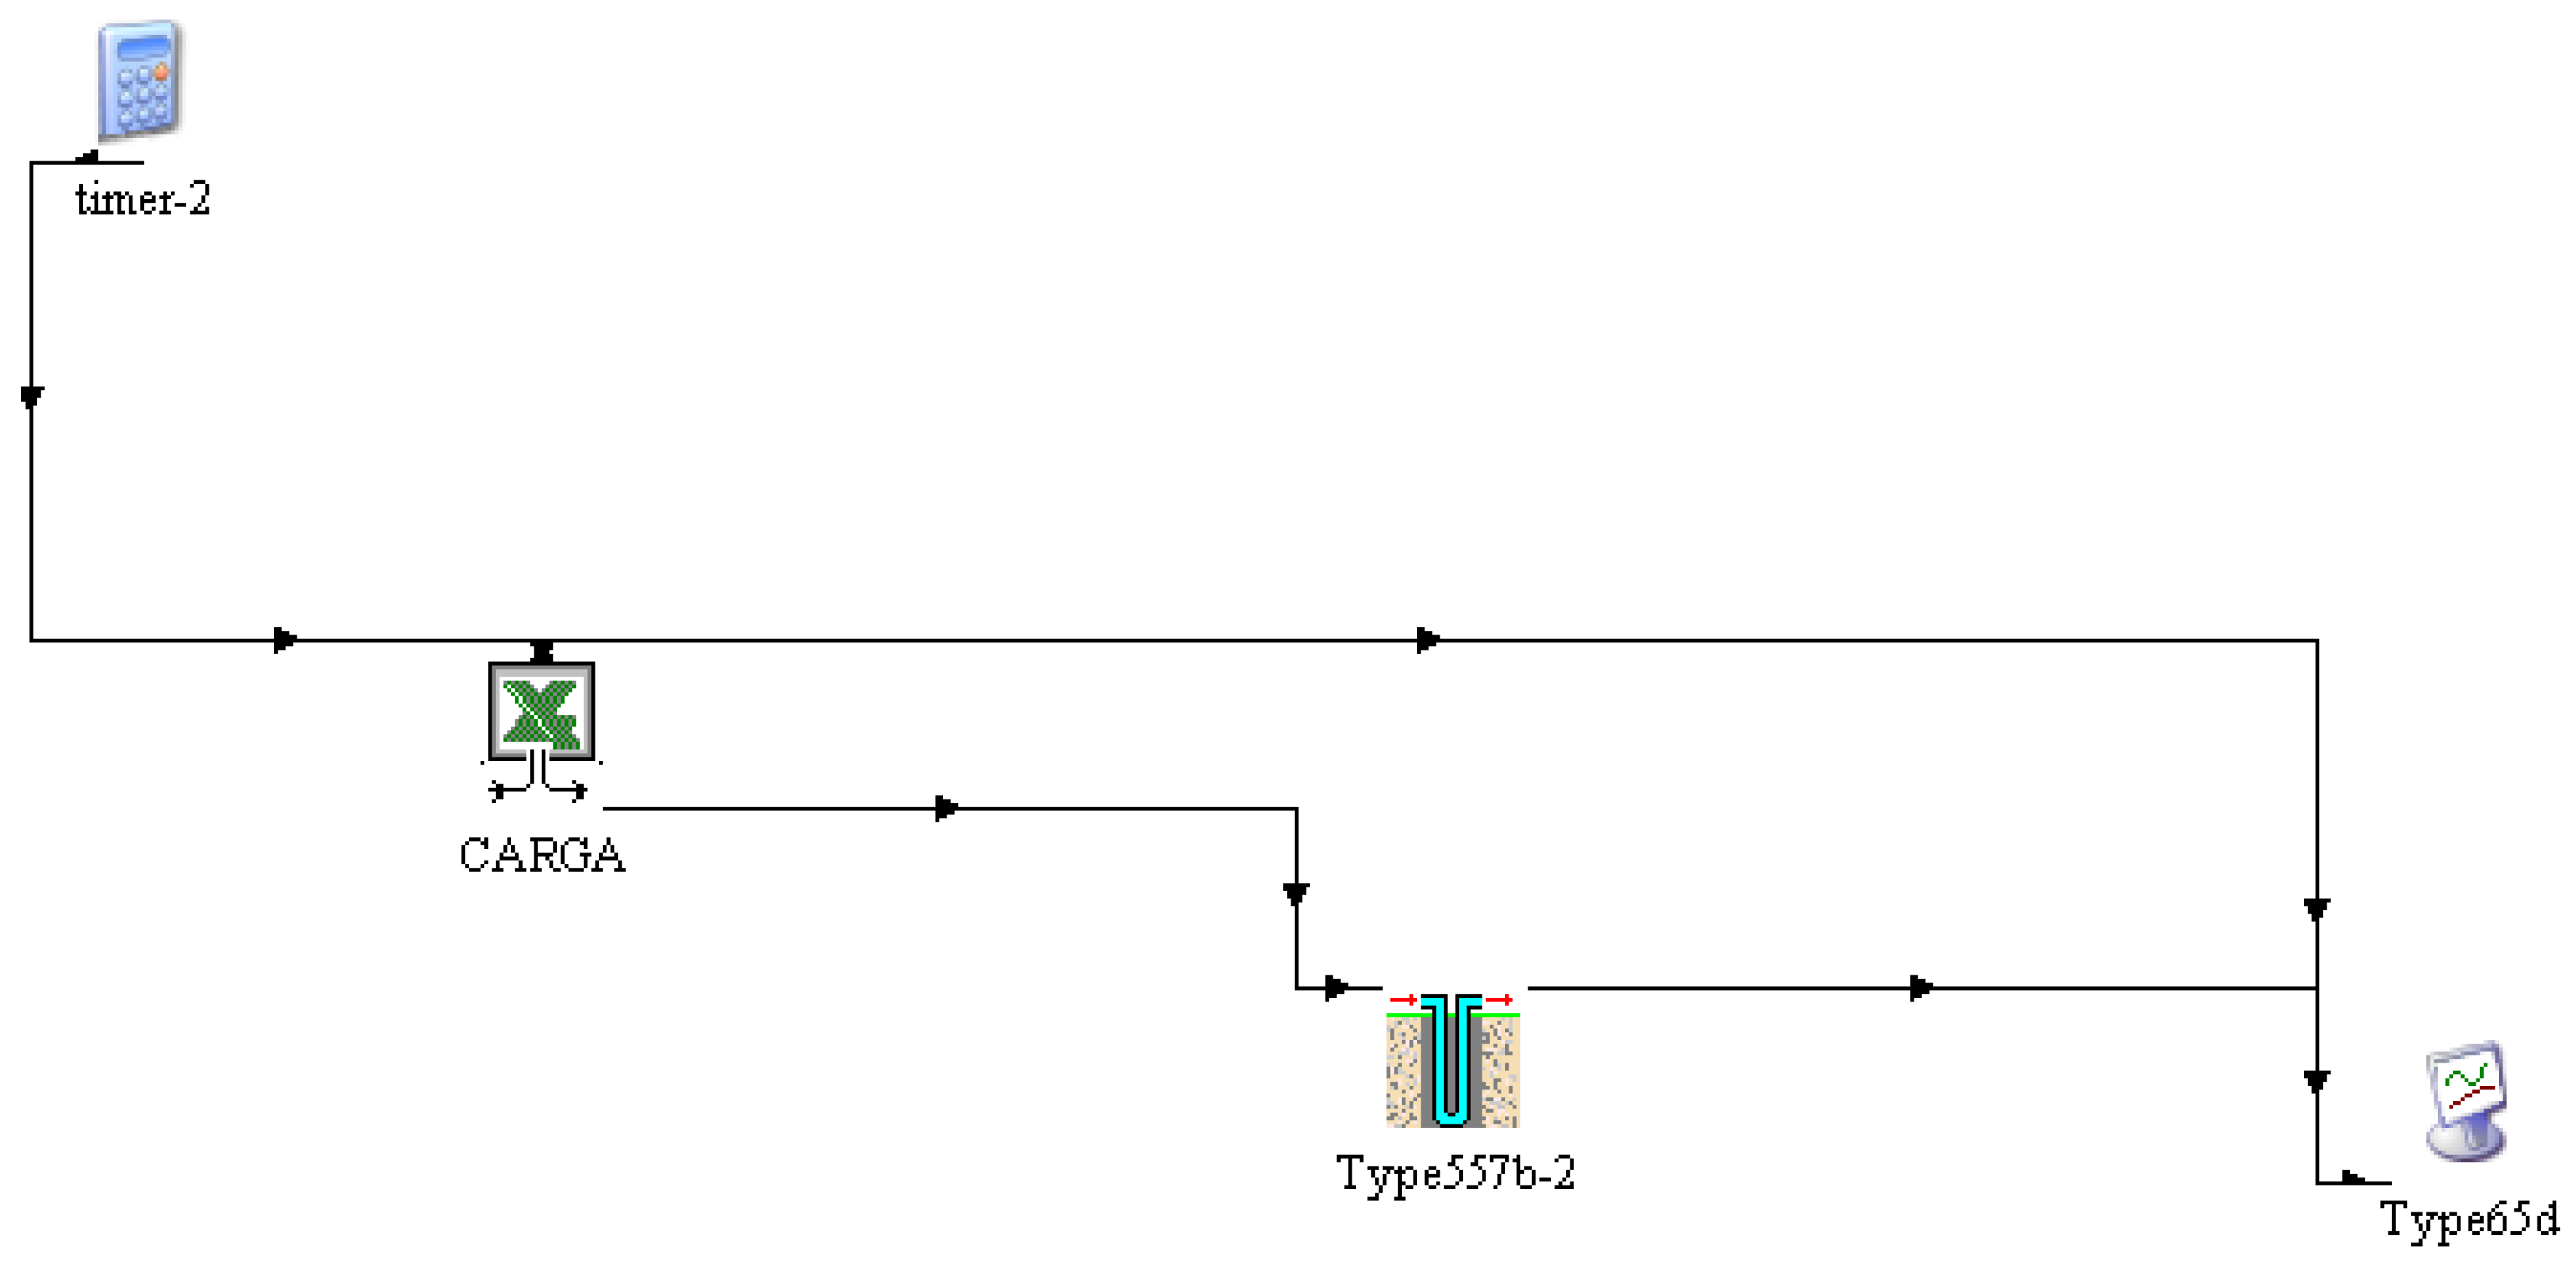
Figure 7.
Output of the TRNSYS simulation. Red line is the inlet temperature. It can be compared the simulated outlet temperature (blue) versus the actual outlet temperature from the test (purple).
Figure 7.
Output of the TRNSYS simulation. Red line is the inlet temperature. It can be compared the simulated outlet temperature (blue) versus the actual outlet temperature from the test (purple).

Figure 8.
Daily profile of the test (Monday to Saturday).
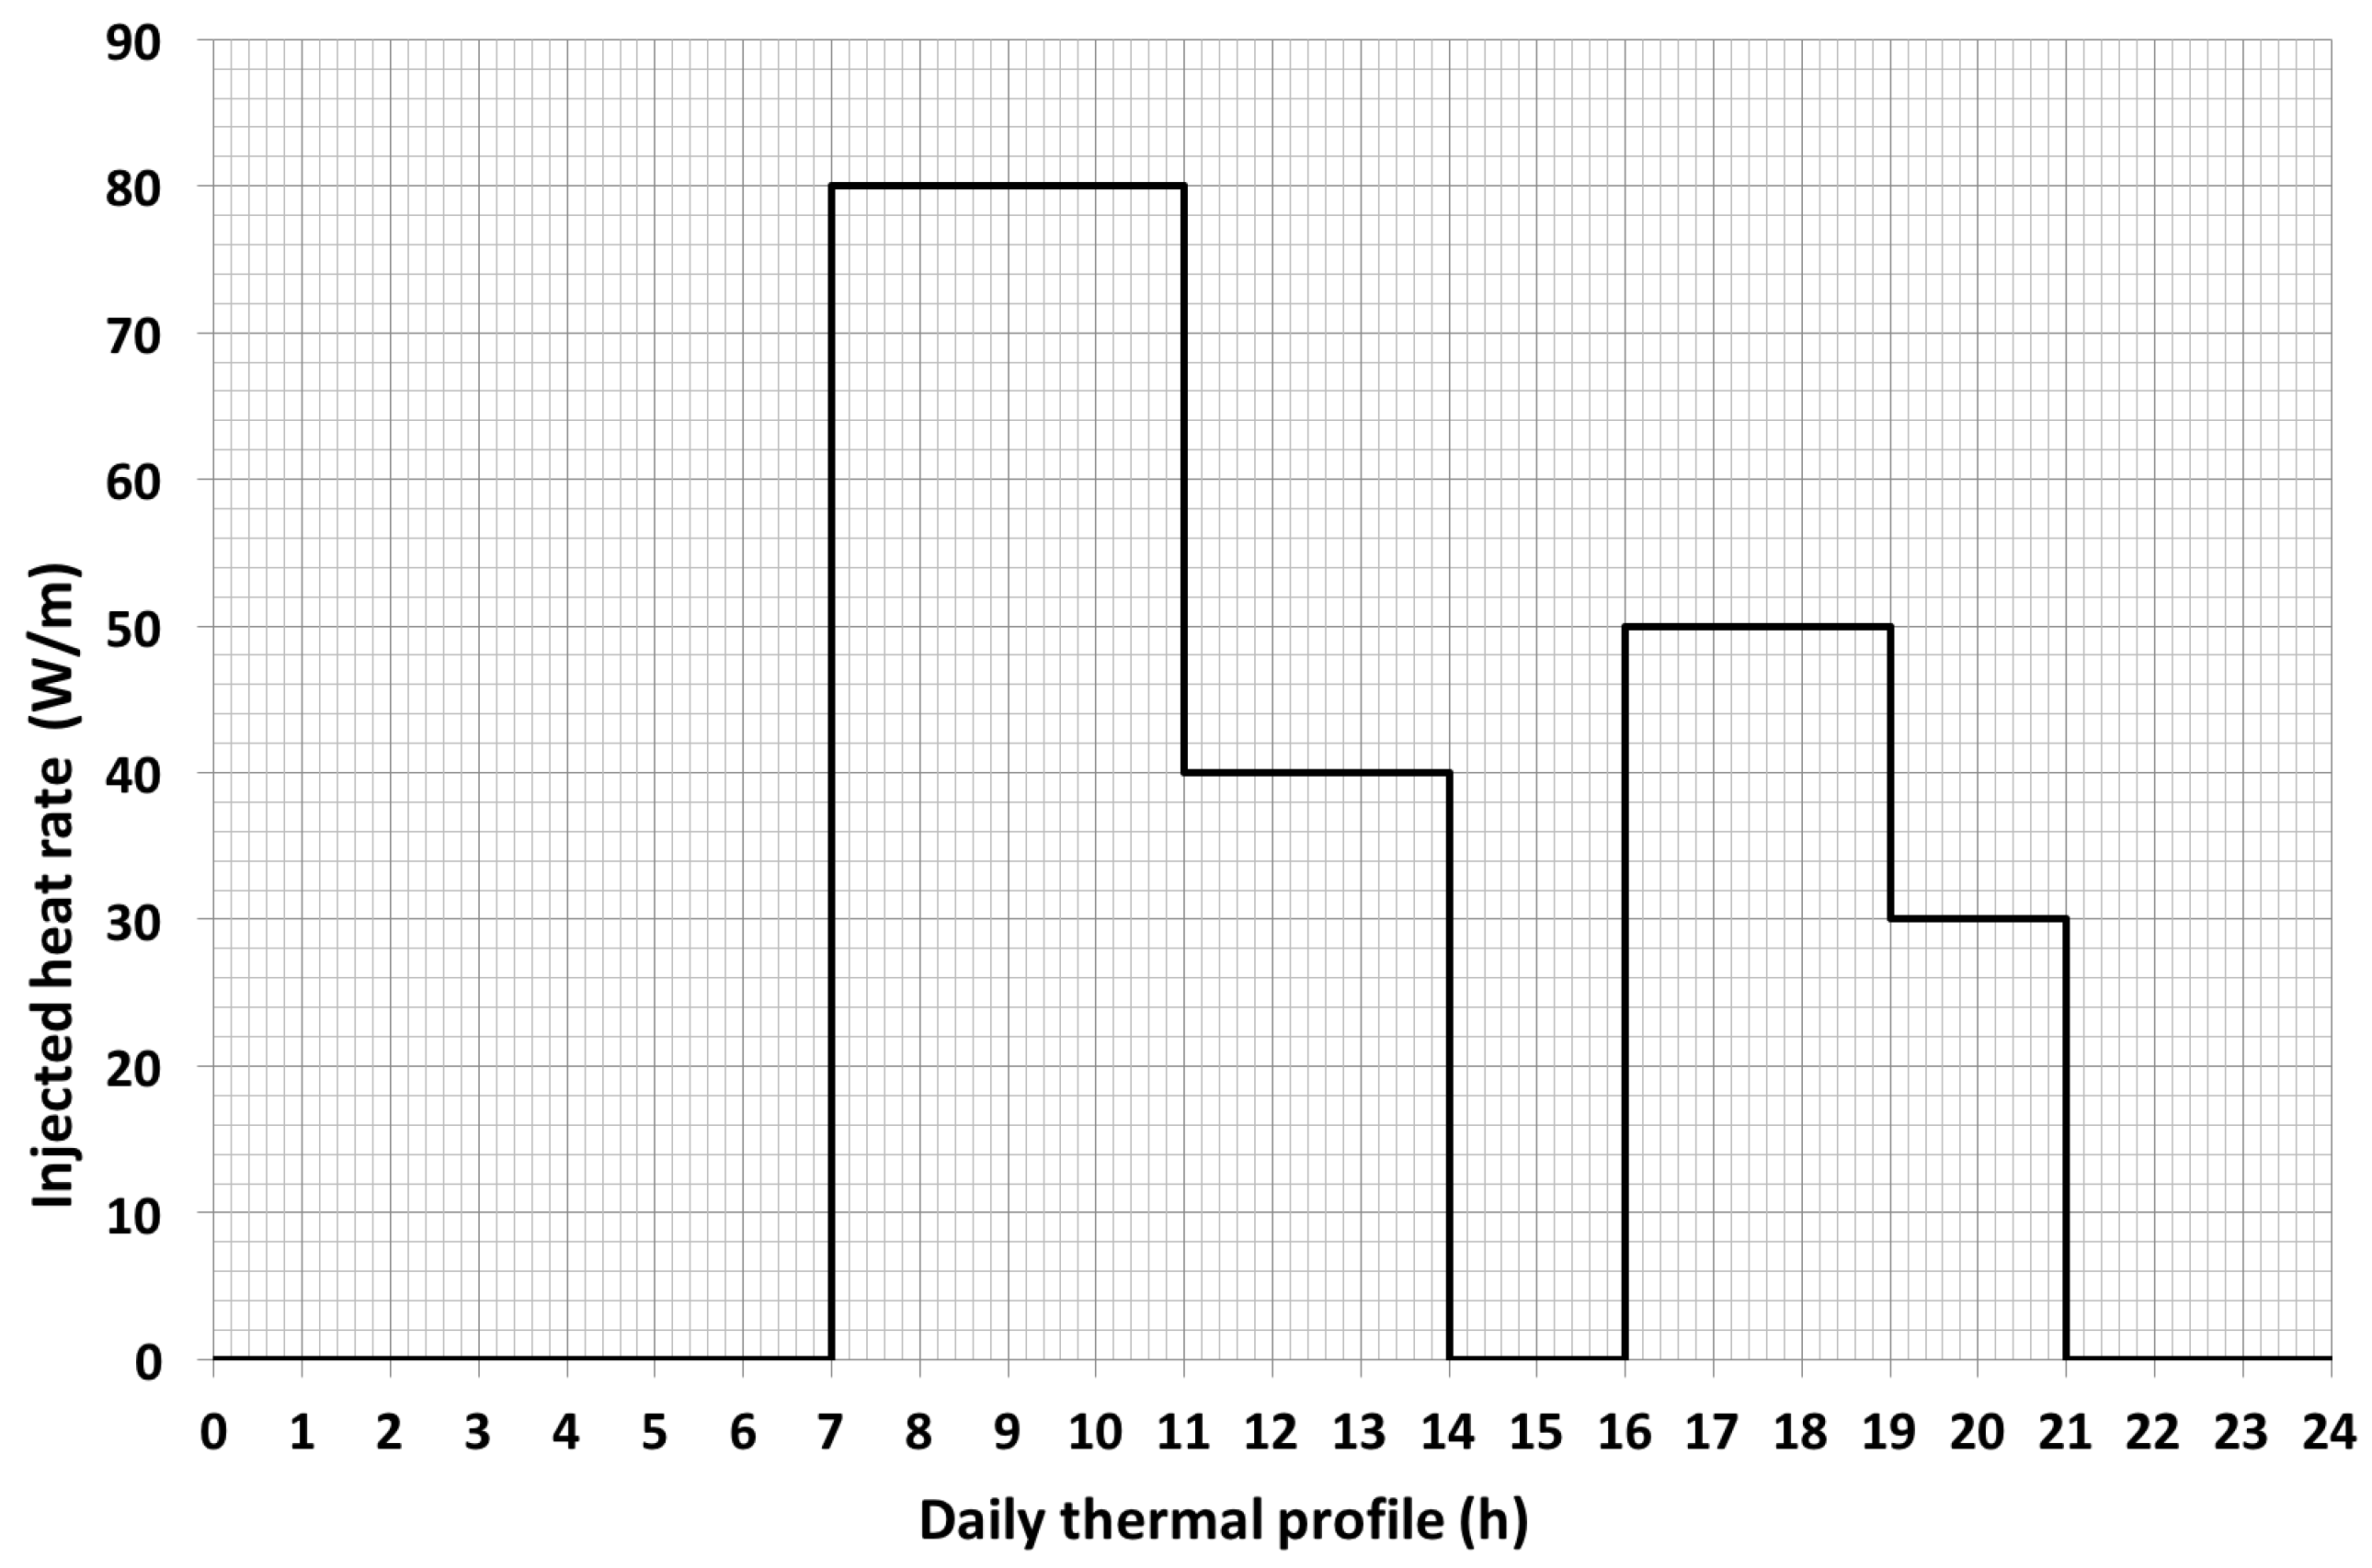
Figure 9.
Data recorded from the thermal installation during the tests.

Figure 10.
Superposition of daily cycles during the first week of the test.
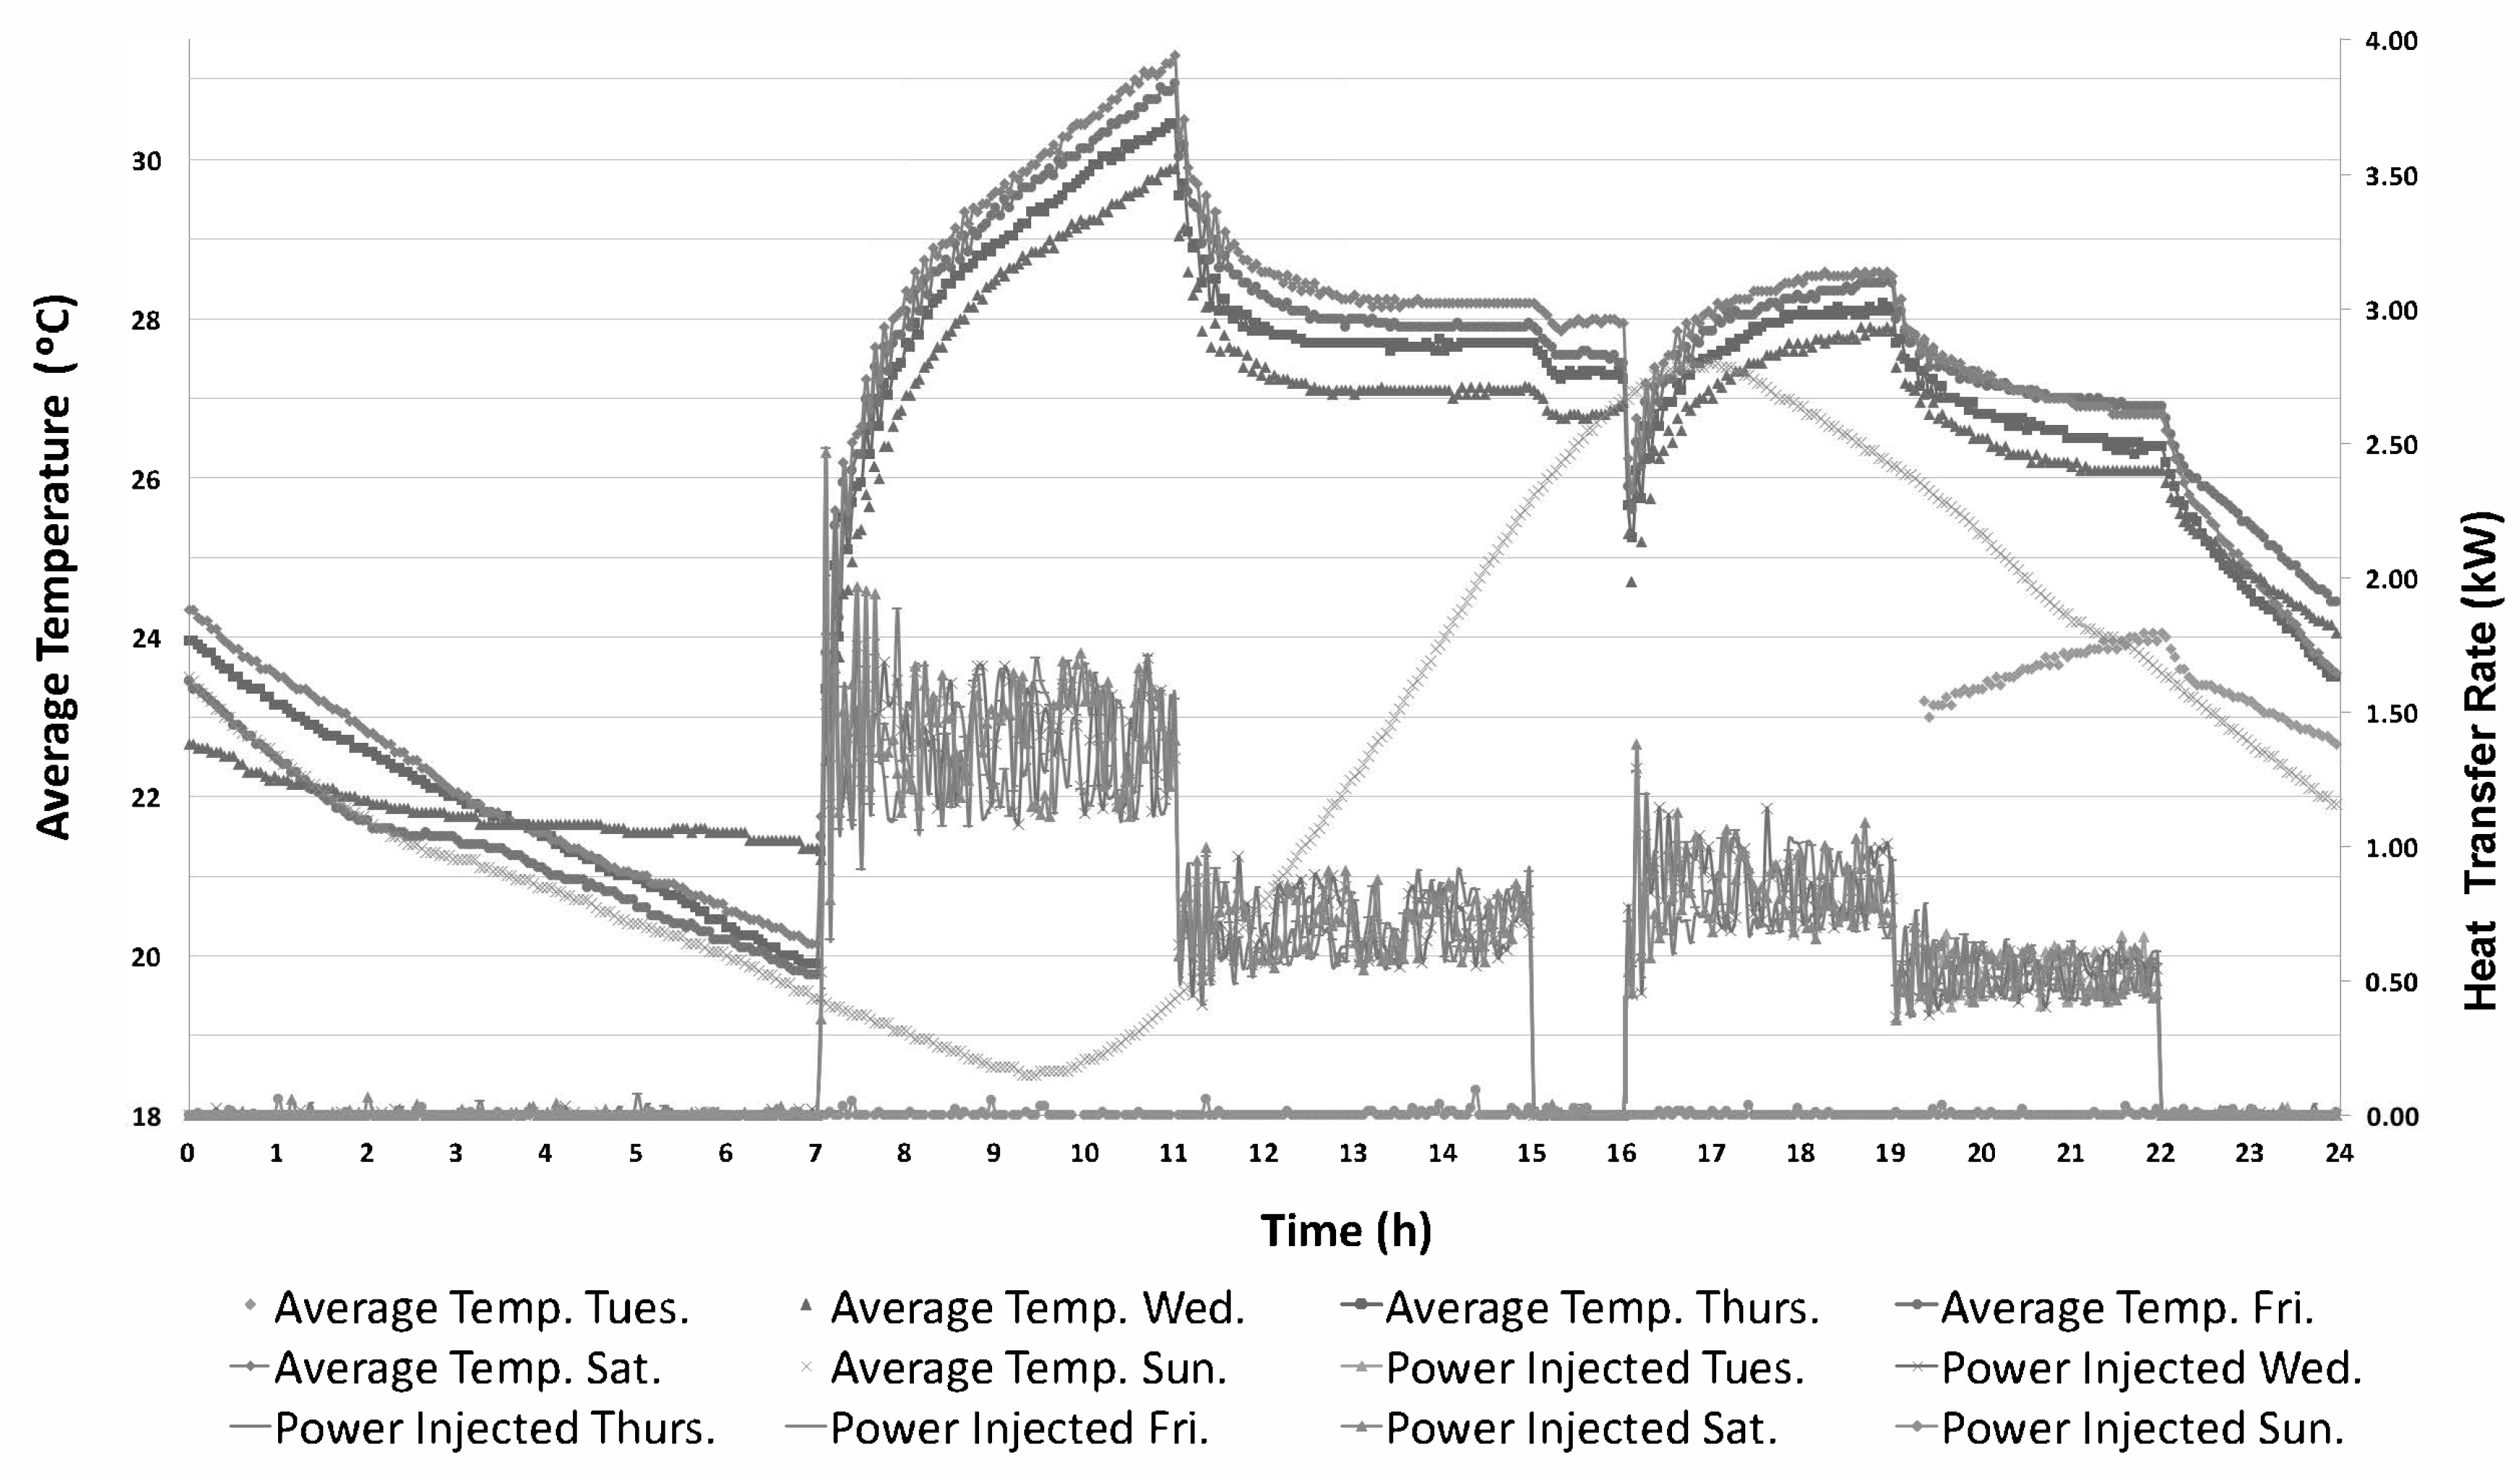
Figure 11.
Superposition of daily cycles during the second week of the test.
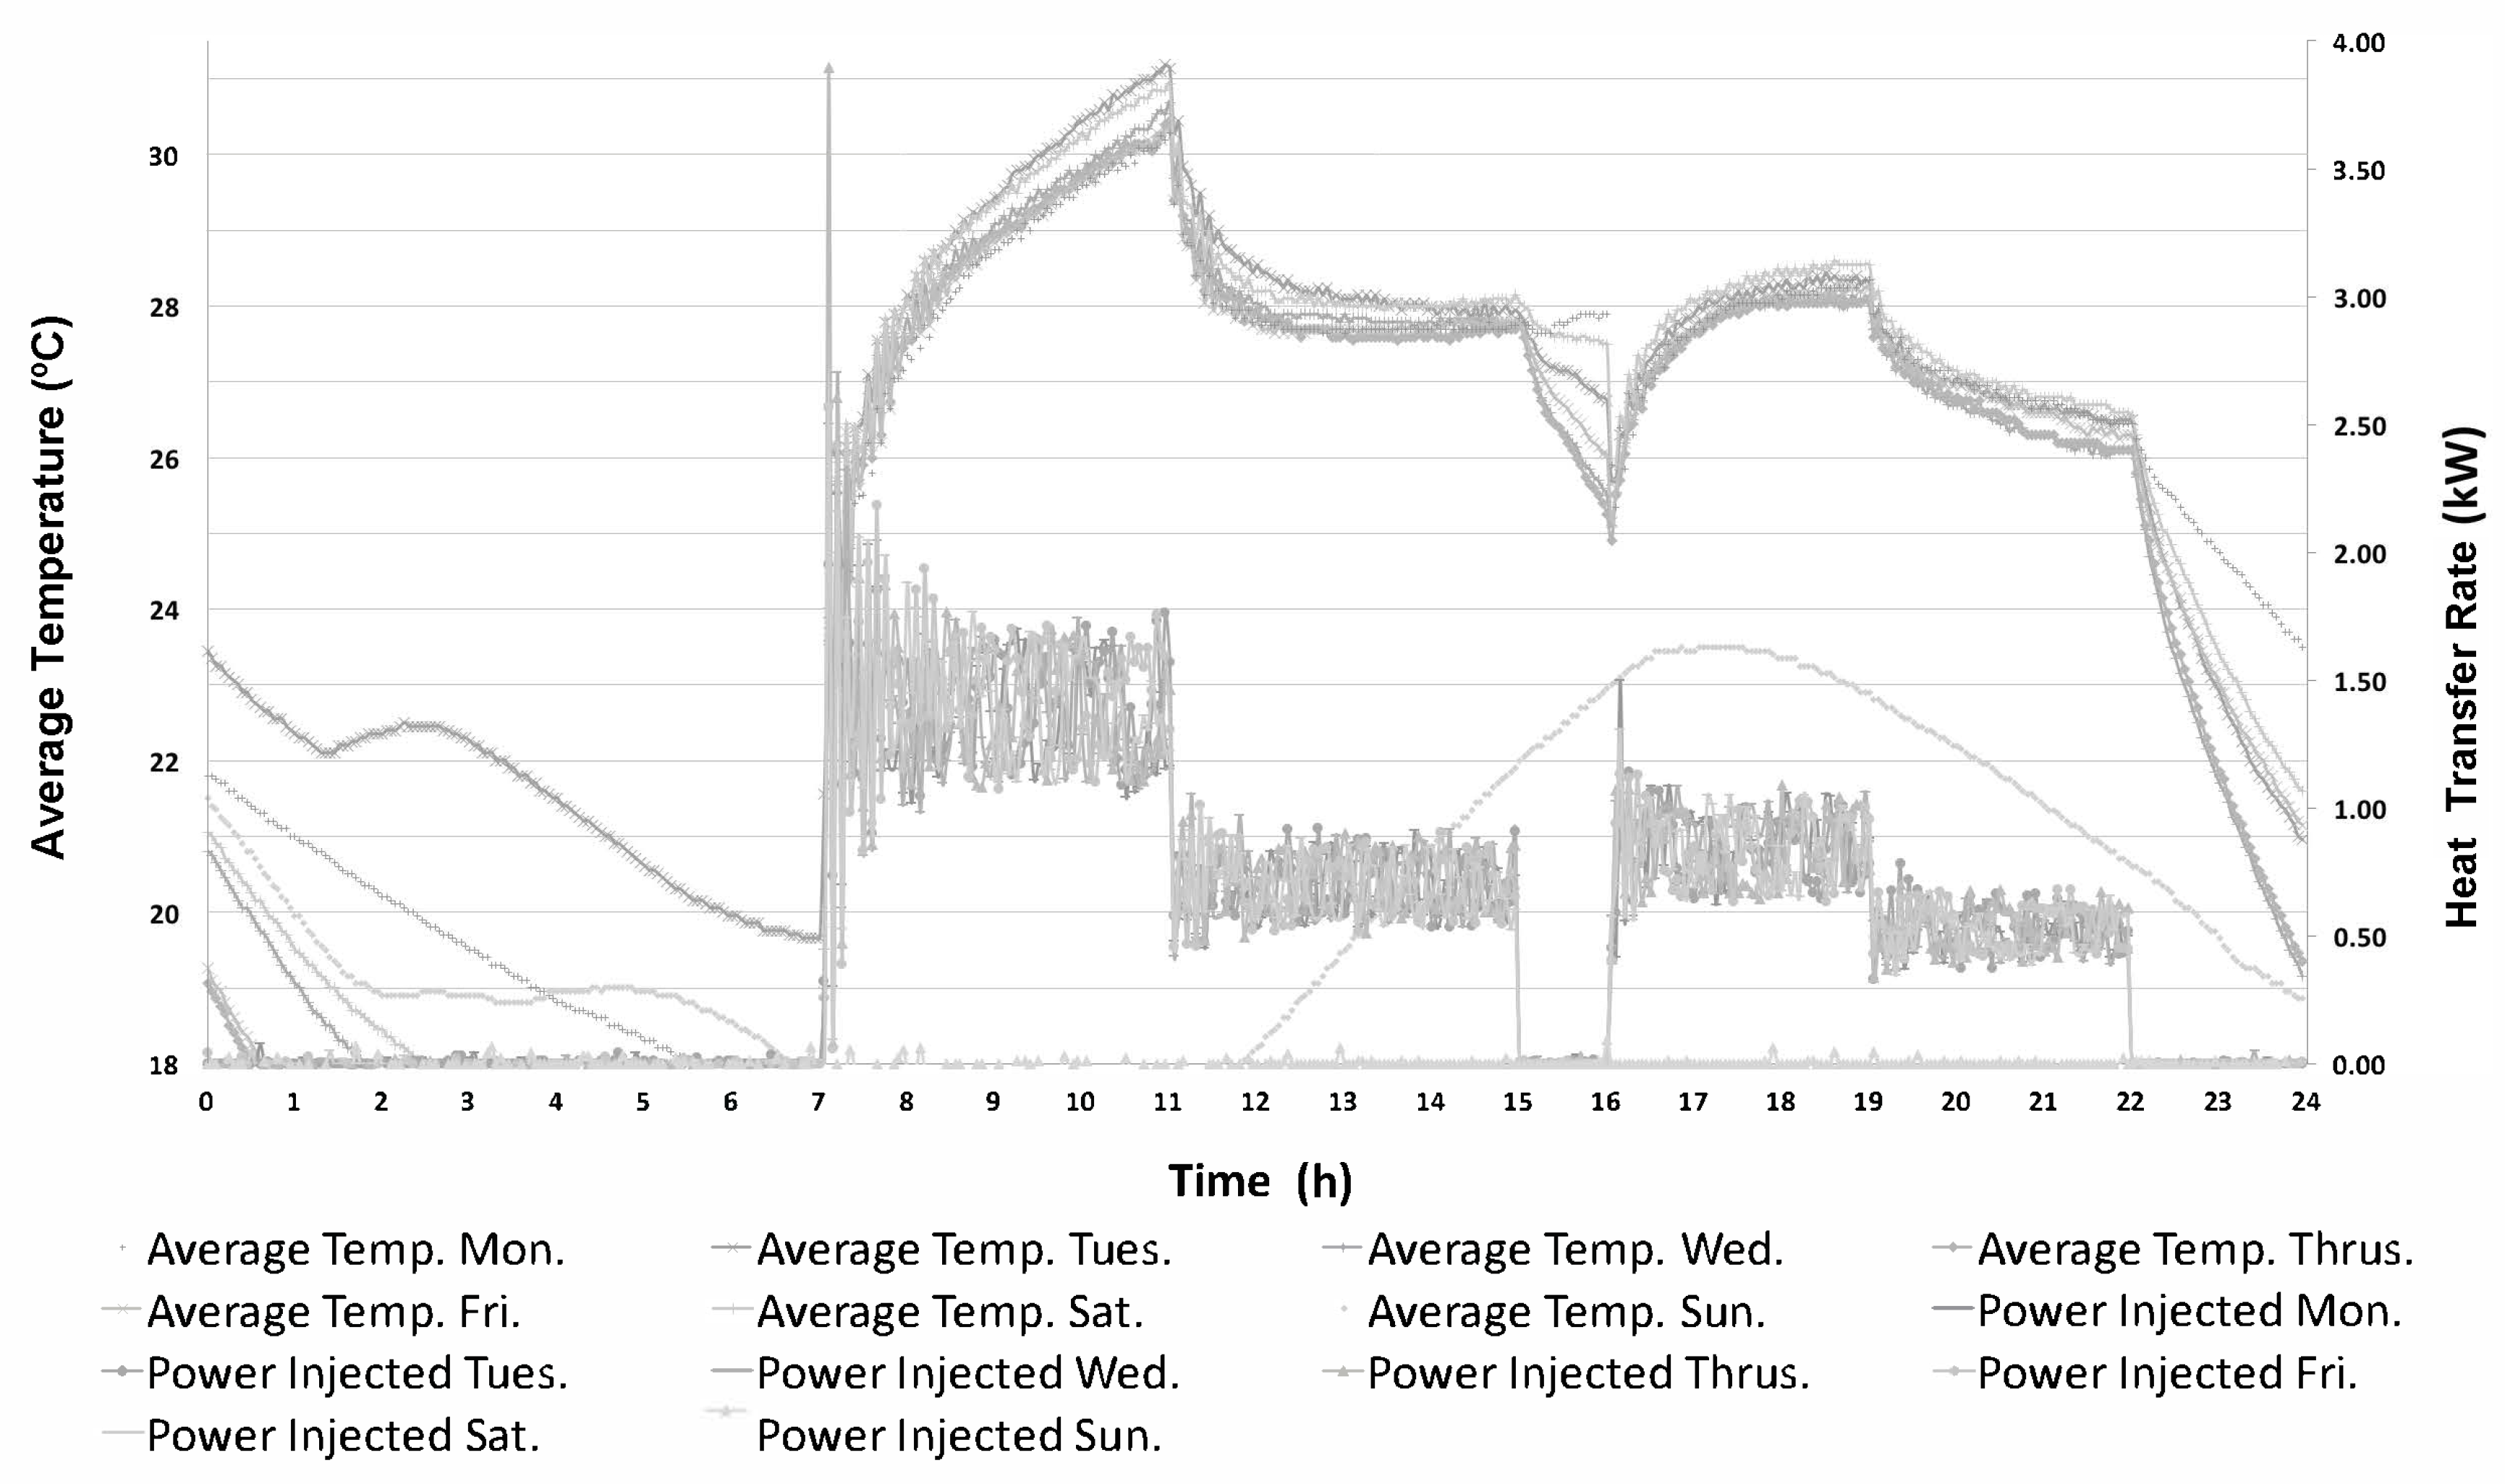
Figure 12.
TRNSYS model scheme used to simulate the ground heat exchangers.
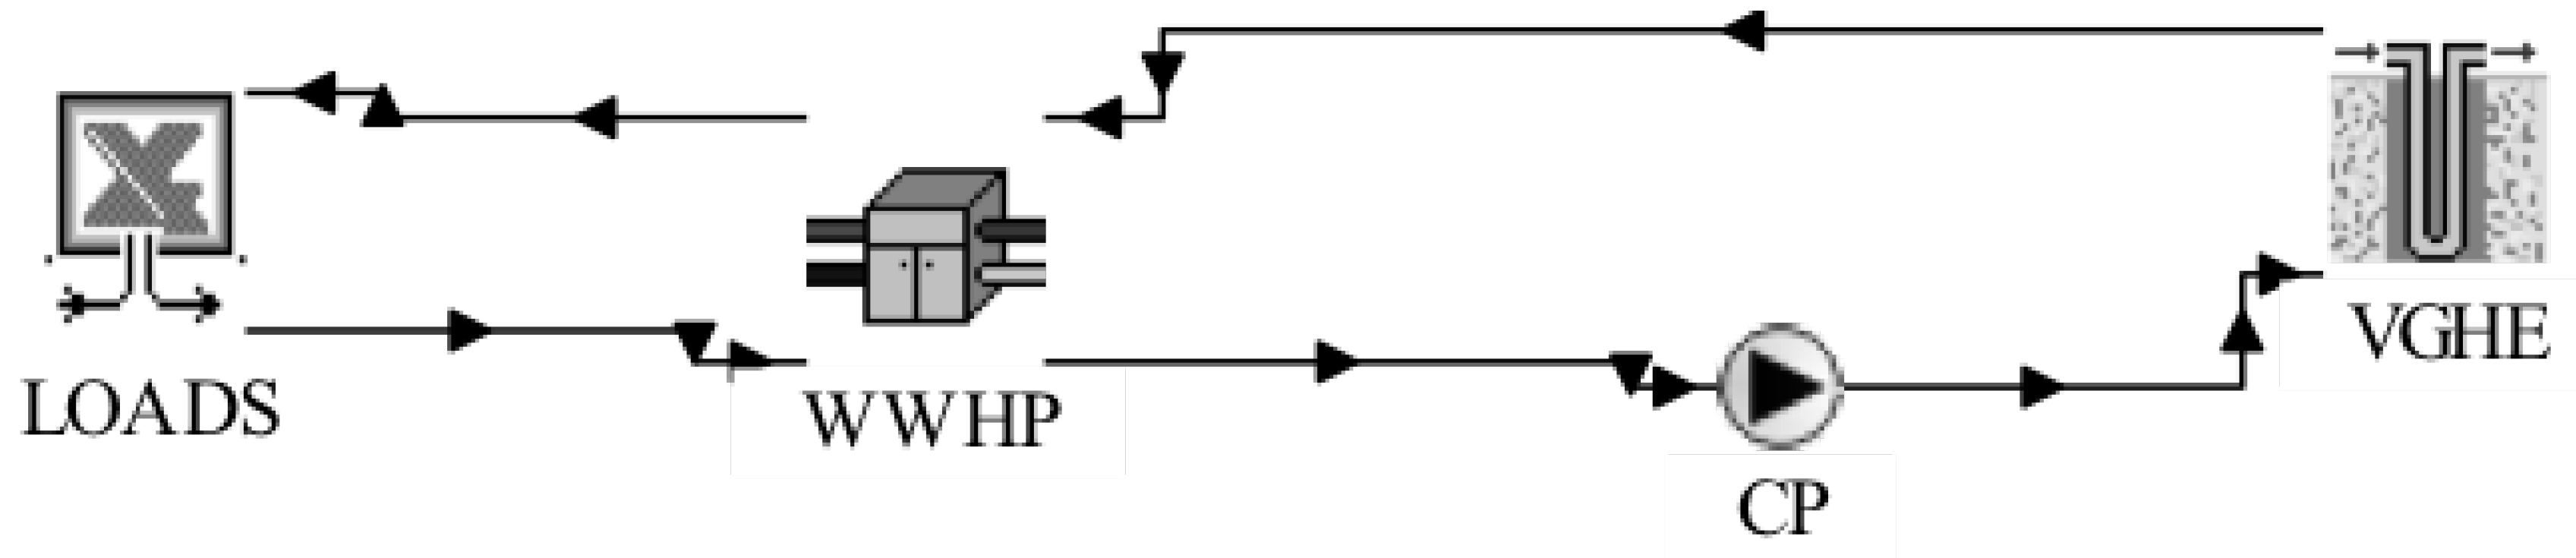
Figure 13.
Hourly thermal loads calculated from the experimental data (injected heat rate to the pile during the test).
Figure 13.
Hourly thermal loads calculated from the experimental data (injected heat rate to the pile during the test).
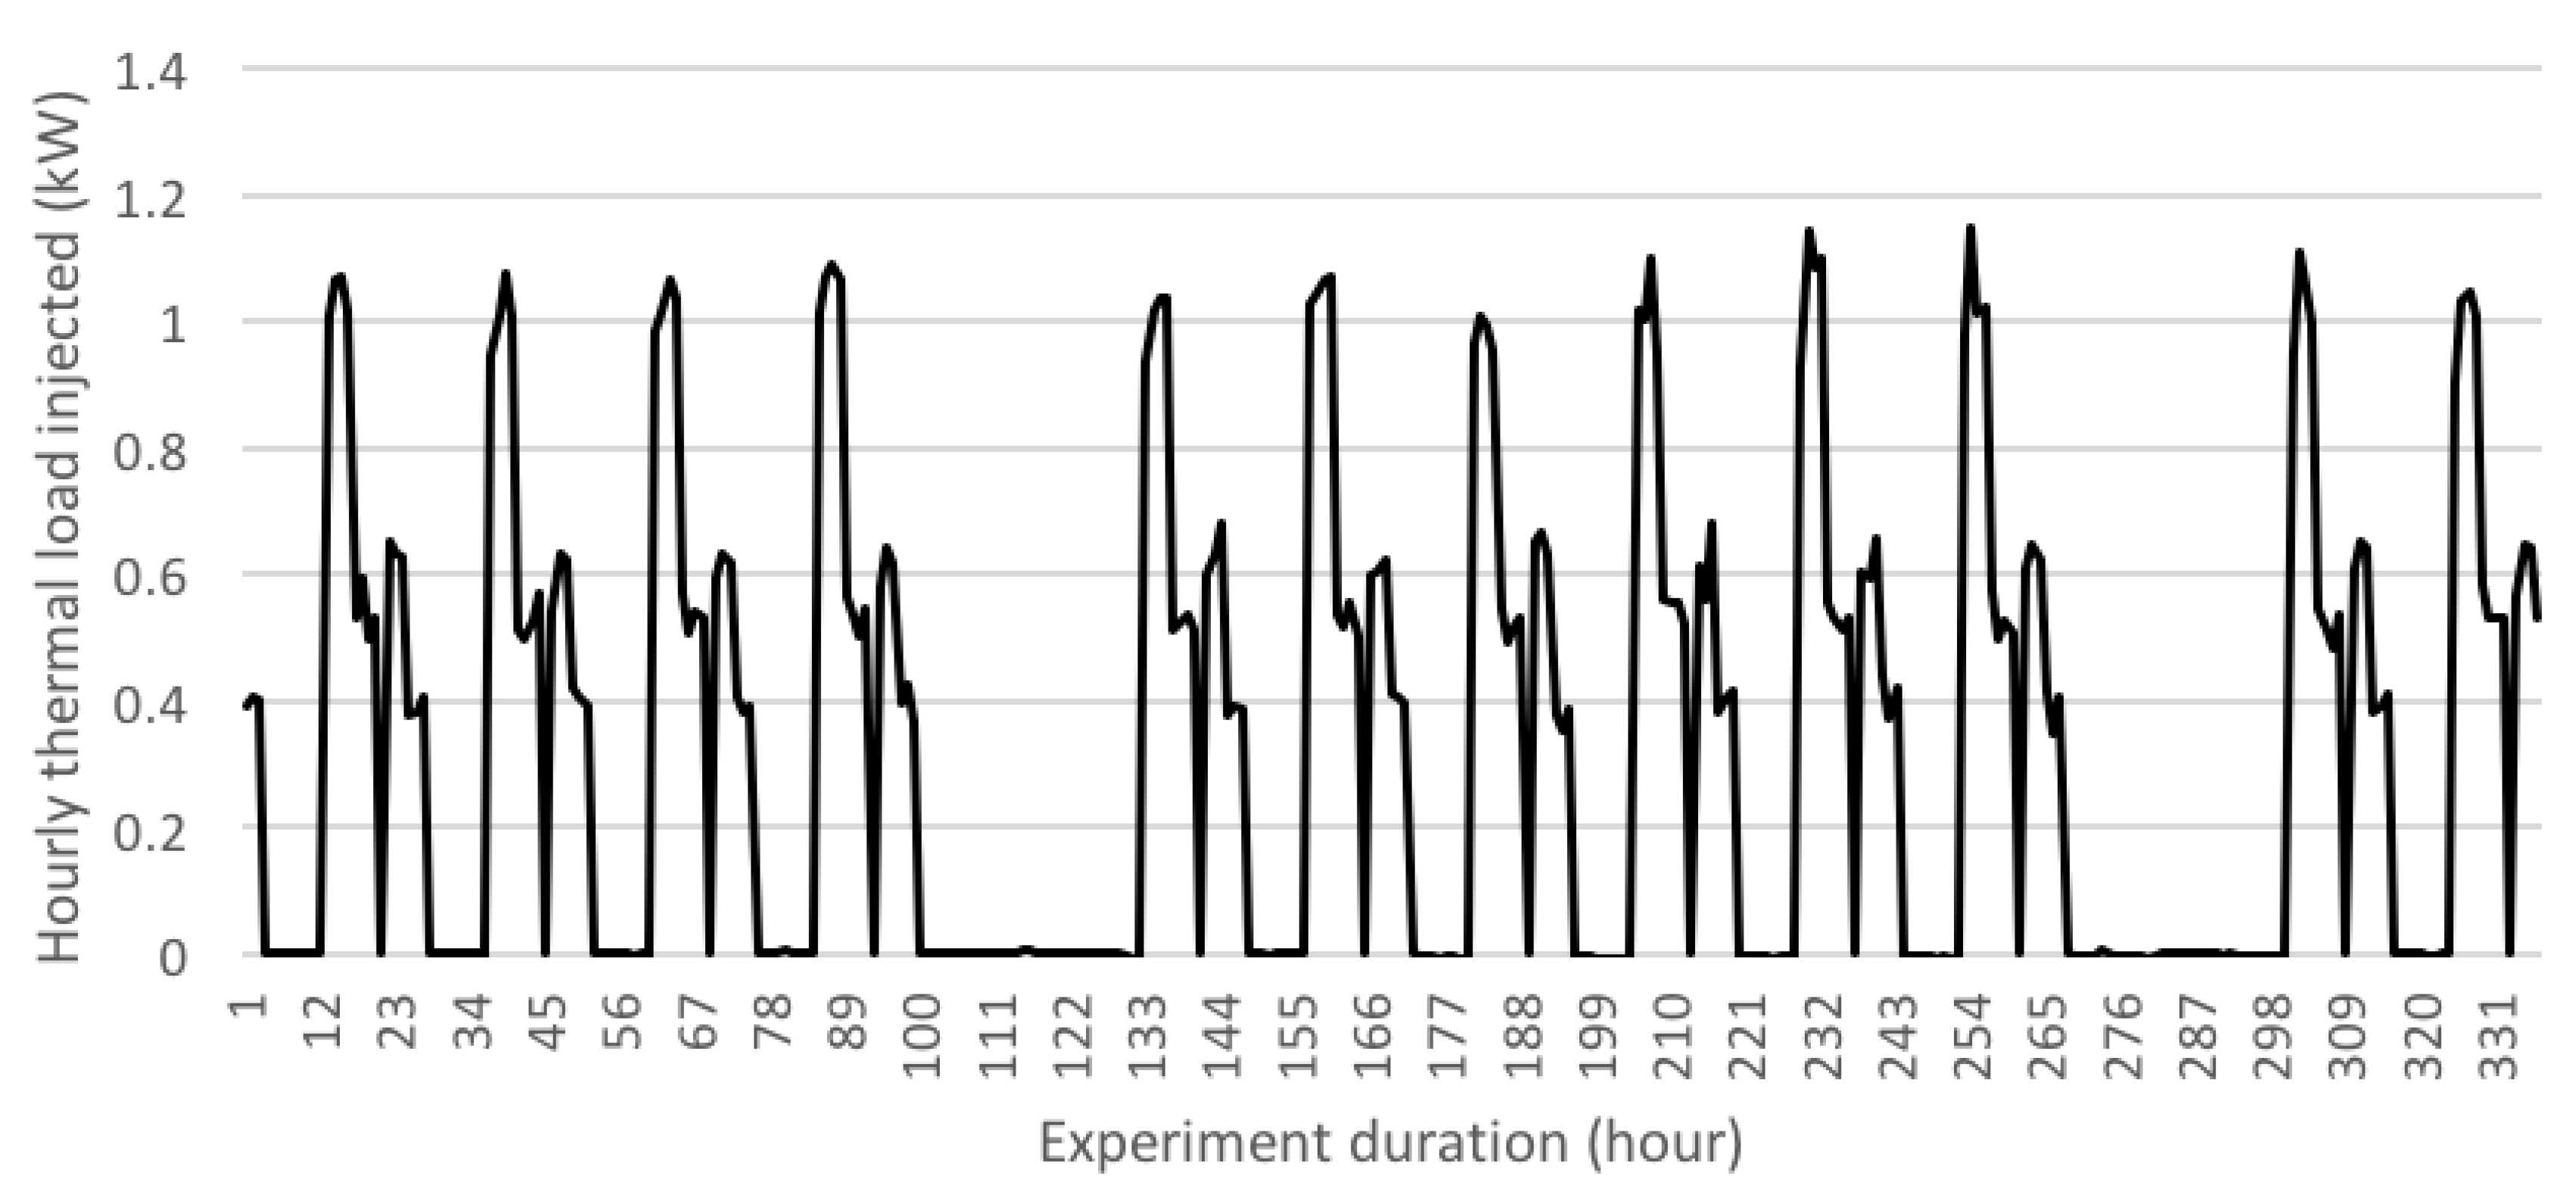
Figure 14.
Hourly performance factor (PF) obtained in the single U BHE and EP simulation.


Table 1.
Geometry of the tested energy pile.
| Parameter | Value |
|---|---|
| Pile Length (m) | 17.4 |
| Square cross section side (m) | 0.35 |
| Active pipe length (m) | 17 |
| Heat exchanger type | Double U |
| Number of pipes | 4 |
| PE Pipe Outer Diameter (m) | 25.0 |
| PE Pipe Inner Diameter (m) | 20.6 |
Table 2.
Thermal response test parameters.
| Parameter | Test 1 | Test 2 | Test 3 |
|---|---|---|---|
| Temperature step | 1 C | 3 C | 1.5 C |
| Flow rate | 0.6 /h | 0.6 /h | 0.6 /h |
| (10 L/min) | (10 L/min) | (10 L/min) | |
| Fluid (m) | Water | Water | Water |
| Injected heat | 700 W | 2100 W | 1050 W |
| Heat injection rate | 40 W/m | 120 W/m | 60 W/m |
| Duration | 5 days | 5 days | 5 days |
Table 3.
Description parameters of the EP.
| Parameter | Value |
|---|---|
| EP Parameters | |
| Number of boreholes | 1 |
| Borehole depth | 17.4 m |
| Equivalent borehole radius | 0.197 m |
| Borehole thermal resistance | 0.16 mK/W = 0.044 m·K·h/kJ |
| Fluid parameters | |
| Specific heat capacity of fluid | 4.18 kJ/kg·K |
| Fluid density | 1000 kg/ |
| Ground parameters | |
| Average ground temperature | 20 C |
| Storage thermal conductivity | 2.7 W/mK |
| Storage heat capacity | 2200 kJ/ K |
| Storage volume | 2000 K |
Table 4.
Description parameters of the single U BHE Type.
| Parameter | Value |
|---|---|
| Borehole Heat Exchanger Parameters | |
| Number of boreholes | 1 |
| Borehole depth | 17.4 m |
| Borehole radius | 0.120 m |
| Outer radius of U-tube pipe | 0.016 m |
| Inner radius of U-tube pipe | 0.0131 m |
| Filling thermal conductivity | 2.1 W/mK |
| Pipe thermal conductivity | 0.42 W/mK |
| Reference borehole flow rate | 420 kg/hr |
| Ground Parameters | |
| Undisturbed ground temperature | 18 C |
| Storage thermal conductivity | 2.7 W/mK |
| Storage heat capacity | 2200 kJ/ K |
© 2017 by the authors. Licensee MDPI, Basel, Switzerland. This article is an open access article distributed under the terms and conditions of the Creative Commons Attribution (CC BY) license (http://creativecommons.org/licenses/by/4.0/).
Share and Cite
MDPI and ACS Style
Badenes, B.; Magraner, T.; De Santiago, C.; Pardo de Santayana, F.; Urchueguía, J.F. Thermal Behaviour under Service Loads of a Thermo-Active Precast Pile. Energies 2017, 10, 1315. https://doi.org/10.3390/en10091315
AMA Style
Badenes B, Magraner T, De Santiago C, Pardo de Santayana F, Urchueguía JF. Thermal Behaviour under Service Loads of a Thermo-Active Precast Pile. Energies. 2017; 10(9):1315. https://doi.org/10.3390/en10091315
Chicago/Turabian StyleBadenes, Borja, Teresa Magraner, Cristina De Santiago, Fernando Pardo de Santayana, and Javier F. Urchueguía. 2017. "Thermal Behaviour under Service Loads of a Thermo-Active Precast Pile" Energies 10, no. 9: 1315. https://doi.org/10.3390/en10091315
Note that from the first issue of 2016, this journal uses article numbers instead of page numbers. See further details here.