A Quantitative Risk Analysis Method for the High Hazard Mechanical System in Petroleum and Petrochemical Industry

1
School of Mechatronic Engineering, Southwest Petroleum University, Chengdu 610500, China
2
Key Laboratory of Oil &Gas Equipment, Ministry of Education (Southwest Petroleum University), Chengdu 610500, China
3
Drilling & Production Engineering Technology Research Institute, Chuanqing Drilling Engineering Company Limited, CNPC, Guanghan 618000, China
4
School of Sciences, Southwest Petroleum University, Chengdu 610500, China
*
Author to whom correspondence should be addressed.
Energies 2018, 11(1), 14; https://doi.org/10.3390/en11010014
Submission received: 16 November 2017
/
Revised: 16 December 2017
/
Accepted: 19 December 2017
/
Published: 22 December 2017
Abstract
:The high hazard mechanical system (HHMS) has three characteristics in the petroleum and petrochemical industry (PPI): high risk, high cost, and high technology requirements. For a HHMS, part, component, and subsystem failures will result in varying degrees and various types of risk consequences, including unexpected downtime, production losses, economic costs, safety accidents, and environmental pollution. Thus, obtaining the quantitative risk level and distribution in a HHMS to control major risk accidents and ensure safe production is of vital importance. However, the structure of the HHMS is more complex than some other systems, making the quantitative risk analysis process more difficult. Additionally, a variety of uncertain risk data hinder the realization of quantitative risk analysis. A few quantitative risk analysis techniques and studies for HHMS exist, especially in the PPI. Therefore, a study on the quantitative risk analysis method for HHMS was completed to obtain the risk level and distribution of high-risk objects. Firstly, Fuzzy Set Theory (FST) was applied to address the uncertain risk data for the occurrence probability (OP) and consequence severity (CS) in the risk analysis process. Secondly, a fuzzy fault tree analysis (FFTA) and a fuzzy event tree analysis (FETA) were used to achieve quantitative risk analysis and calculation. Thirdly, a fuzzy bow-tie model (FBTM) was established to obtain a quantitative risk assessment result according to the analysis results of the FFTA and FETA. Finally, the feasibility and practicability of the method were verified with a case study on the quantitative risk analysis of one reciprocating pump system (RPS). The quantitative risk analysis method for HHMS can provide more accurate and scientific data support for the development of Asset Integrity Management (AIM) systems in the PPI.
1. Introduction
A statistical report from the Det Norske Veritas (DNV) showed that about 45% of the major accidents in the petroleum and petrochemical industry (PPI) in the last 50 years were caused by the high hazard mechanical system (HHMS) failure. In the PPI, when one HHMS has outburst failures in the production process, unexpected downtime of the entire production system occurs, along with major production losses and economic costs, potentially leading to significant casualty accidents and environmental pollution. The failure frequency of HHMS in the PPI is higher than that of other industries due to their changeable working conditions and poor operating environments [1]. As the competition among companies has become increasingly intense in the PPI, the production safety requirements have continuously improved, resulting in a growing concern for the failure risk of HHMS. When the high-risk components in the mechanical system are quantitatively identified and assessed, hazard frequency and hazard severity can be effectively reduced and controlled to ensure the reliable operation and safe production [2]. Moreover, quantitative risk level and distribution of the high-risk objects in one mechanical system can contribute to its fault prognostics, maintenance decisions, and health management. Thus, obtaining a quantitative risk assessment result for failure of subsystems, components, and parts of a HHMS in the PPI is important.
A large volume of research has been completed on the quantitative risk analysis and assessment methods in the field of engineering [3]. A fuzzy assessment for failure mode effects analysis was presented by Xu and Tang [4] for failure modes with uncertain and imprecise information in engine systems. Brandsæter [5] described a quantitative risk assessment for human, environmental and property health and safety in the offshore industry. A sustainability assessment approach, using fuzzy based bow-tie analysis, was presented by Shahriar and Sadiq [6] for risk analysis for oil and gas pipelines. Ferdous and Khan [7,8] applied Fault Tree analysis and Event Tree analysis to process systems to perform uncertainty handling formulations of risk analysis, and an innovative approach to quantitatively analyze system risks under uncertainty was completed using a bow-tie diagram. Moreover, some other quantitative risk assessment techniques and methods with other objects and fields have been presented and applied [9,10]. As we all know, the different risk analysis methods should be used for suitable objects and the corresponding situations. For the conventional risk analysis methods, related data are described by linguistic expressions so that the risk value cannot be quantitatively calculated. Therefore, most of these analysis methods only yield qualitative risk results. A considerable portion of the data used for risk assessment of HHMS is qualitative, uncertain, and vague; however, some of the data obtained by statistics methods in the PPI are quantitative. Although some uncertain data processing and quantitative risk analysis methods have been studied, the problems and difficulties in quantitative risk analysis for HHMS have some differences compared to other areas in the field of engineering. Thus, the existing quantitative risk analysis methods have not yet been directly or suitably applied for HHMS. However, few studies have researched the quantitative risk analysis methods for HHMS. To develop some effective risk control strategies and decisions for HHMS, a quantitative risk analysis method is required to obtain scientific and accurate risk results. The lack of data, and the use of uncertain and qualitative data, are inevitable in risk analysis processes of HHMS. Therefore, a data processing method solving the hybrid data problem should be improved to achieve the quantitative computation of all data in the process of risk quantitative analysis as well.
This study aimed to present a practical framework for the quantitative risk analysis of HHMS in the PPI. The remainder of the paper is organized as follows. Section 2 reviews the existing risk analysis methods for mechanical system. In Section 3, a quantitative risk analysis method for HHMS is presented based on failure mode effects and criticality (FMECA), fault tree analysis (FTA), event tree analysis (ETA), Bow-tie Model (BTM), and Fuzzy Set Theory (FST). The case study performed to demonstrate the proposed method is reviewed in Section 4. Conclusions and future work are discussed in Section 5.
2. Conventional Risk Analysis Methods for Mechanical Systems
Many qualitative and quantitative techniques exist for the risk analysis of a mechanical system, including FMECA, hazard and operability study (HAZOP), FTA, ETA, and Human Reliability Analysis (HRA) [9,10].
2.1. FMECA
Failure mode effects and criticality analysis (FMECA) is an analytical technique based on failure modes, that determines failure effects or consequences using a bottom-up, inductive analytical method [11]. It analyzes the influence of different failure modes on the functioning of the system, identifies the weak links and key items in the design, and provides basic information for evaluating and improving the reliability and safety of the system. FMECA extends the failure modes and effects analysis (FMEA) by including a Criticality Analysis (CA), used to chart the probability of failure modes against the severity of their consequences. When the CA for each failure mode of the system is completed in the FMECA report, the items and failure modes can be sorted and classified by the quantitative assessment results or qualitative assessment results. Then, the results of the CA highlight key items and critical failure modes with relatively high probability and severity of consequences so that remedial efforts can be directed to the area where the greatest value will be created. Obviously, the quantitative evaluation results of the CA are better than qualitative evaluation results in distinguishing the key projects and key failure modes. The calculation of the Risk Priority Number (RPN) is defined in the Reliability Analysis Center CRTA-Failure Mode Effects and Criticality Analysis (RAC CRTA–FMECA) and Military Handbook-338 (MIL–HDBK–338) as a way of replacing CA in FMECA [12].
2.2. Fault Tree Analysis
Fault tree analysis (FTA) is a top down, deductive failure analysis, in which an undesired state of a system is analyzed using Boolean logic to combine a series of lower-level events. This analysis method is mainly used in the fields of safety engineering and reliability engineering to understand how systems fail and to identify the best methods of reducing risk or to determine event rates of a safety accident or a particular system level failure. FTA is used in the aerospace, nuclear power, chemical and process, pharmaceutical, petrochemical, and other high-hazard industries, and is also used in fields with diverse risk factor identification needs such as for social service system failure. The Fault Tree Diagram (FTD) is usually written out using conventional logic gate symbols. A Cut Set is a combination of events, typically component failures, causing the top event. If no event can be removed from a Cut Set without causing the top event, then the Cut Set is called a Minimal Cut Set. This relationship is represented by the symbol and the logic gates and events symbols. The basic symbols used in FTA are grouped as events including top event, intermediate event, and basic event, gates (“OR” gate and “AND” gate), and transfer symbols [13].
2.3. Event Tree Analysis
Event tree analysis (ETA) is a forward, bottom up, logical modeling technique for both success and failure that explores responses through a single initiating event and lays a path for assessing probabilities of the outcomes and overall system analysis [13]. This analysis technique is used to analyze the effects of functioning or failed systems given an event has occurred. ETA is a powerful tool that identifies all consequences of a system that have a probability of occurring after an initiating event. It can be applied to a wide range of systems including nuclear power plants, spacecraft, and chemical plants. This technique may be applied to a system early in the design process to identify potential issues that may arise, as opposed to correcting issues after they occur. With this forward logic process, use of ETA as a tool in risk assessment can help prevent negative outcomes from occurring by providing a risk assessor with the probability of occurrence. ETA uses a type of modeling technique called Event Tree Diagram (ETD), which branches events from one single event using Boolean logic. Quantitative analysis in the ETA is the easiest method to determine the OP of an accident. The method calculates the accident probability of all result events with the probability of each event, comparing their probability value, and obtaining the possibility of accident sequence.
2.4. Bow-Tie Model
The Bow-Tie Model (BTM) is a common platform that couples FTA and ETA by considering a common top-event, called a critical event, and reflects a corresponding relationship between reasons and consequences. The bow-tie model diagram is shaped like a bow-tie, creating a clear differentiation between proactive and reactive risk management [14]. However, the traditional bow-tie model analysis requires the probability of input events to be precise, crisp data. In practice, the bow-tie model is a useful method for preventing, controlling, and reducing the occurrence of an accident with its logical development process. The FTD is placed on the left side of the bow-tie diagram. The diagram begins from the critical events (the top events), and then is extended to intermediate events and basic events by applying the basic events and the logic gates. The ETD is placed on the right side of the bow-tie diagram. It also begins from the critical event (the initial events), and proceeds to the intermediate events to the result events.
In summary, these techniques have their own advantages in some part of risk analysis, but have some shortcomings in their application. To overcome these shortcomings and highlight their advantages, two or more different risk analysis techniques and other related techniques could be integrated to create an innovative risk analysis model, and a method to solve the specific problem and meet the engineering requirements.
3. Study on a Quantitative Risk Analysis Method for HHMS
3.1. Establishing a Hierarchical Structure Tree
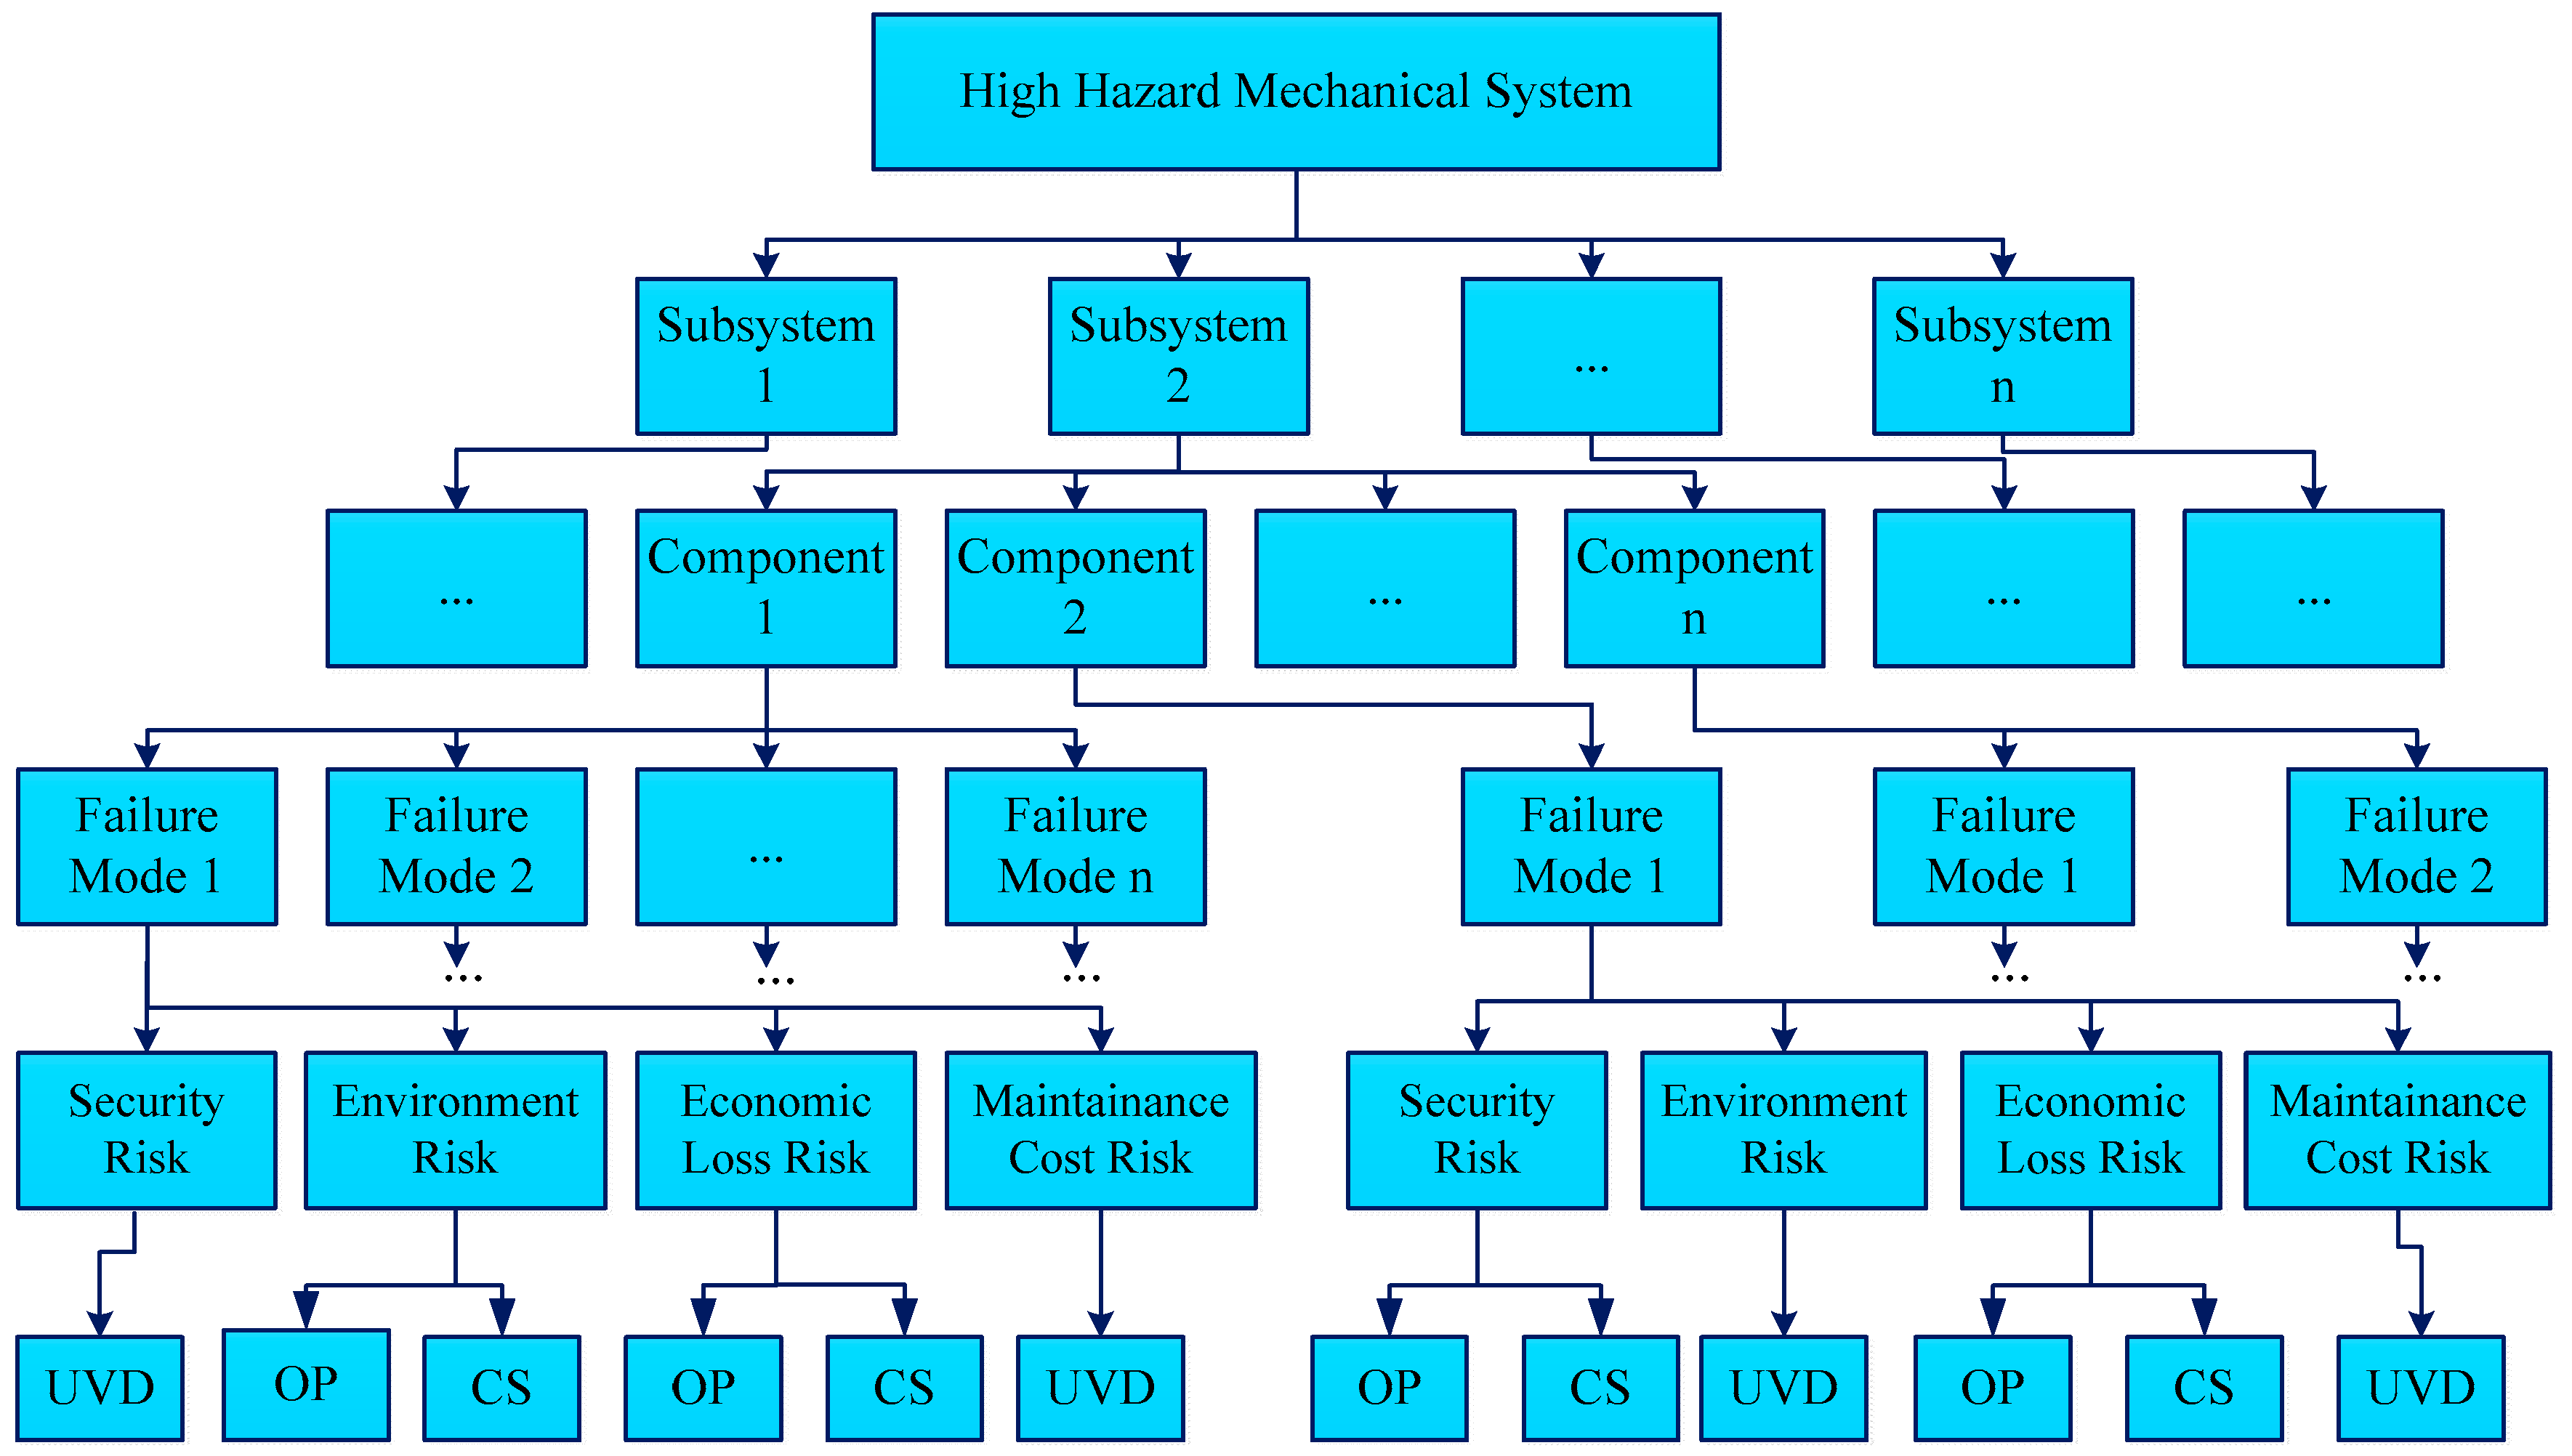
The FMECA is a commonly used analysis method for failure of a mechanical system in the PPI. According to the FMECA analysis report, in a petrochemical production system, the system or equipment contains several important functional items, including subsystems, components, and parts, and each has one or more failure modes [15]. In their risk evaluation, a failure mode corresponds to a variety of risk types, including safety risk, environmental risk, economic loss risk, and maintenance cost risk. Each risk type corresponds to multiple risk factors, including the OP and the CS. To analyze risk factors for the basic events associated with all failures of one HHMS, we first dissected the mechanical structure components. Secondly, a hierarchical structure tree (HST) for a conventional mechanical system was established, as shown in Figure 1. The establishment of the HST clarified the hierarchical relationship among all analysis objects in the process of quantitative risk analysis. The HST can be used as a reference for establishing the FTD and ETD of the HHMS as well.
As seen in Figure 1, the risk analysis of the HHMS was a comprehensive evaluation problem with a multi-level and complex structure. The OP and CS of some failure modes had a crisp value, but some always had uncertain and vague data (UVD) that were described by the linguistic expressions. Thus, the quantitative risk assessment results could not be obtained by directly applying FTA, ETA, or the bow-tie model. The OP and CS of the failure modes in the HST were always hybrid data types, including crisp and fuzzy numbers, so that conventional risk analysis techniques and methods could not be used in the risk analysis process of the HHMS. Therefore, proposing a data processing method for the hybrid data was necessary to achieve standardization and quantification for these data, so that new models and algorithms could be introduced to calculate the risk level and distribution of the HHMS.
3.2. Study on a Data Processing Method for Hybrid Data
The FST has been used in a wide range of domains in which information is incomplete or imprecise [16]. The FST is a well-accepted method to address uncertain information and data in many engineering applications, such as quality management and risk management.
3.2.1. Triangular Fuzzy Number
Due to its simplicity and ease of use, the triangular fuzzy number (TFN) in the FST was chosen to quantify the uncertain and vague data classified as subjective and vague by the expert’s knowledge and experience in this study. A TFN is a vector with factors , , and , which represent the minimum boundary, the closest value, and the maximum boundary, respectively [17]. The membership functions of the TFN can be defined as follows:
Various algorithms exist for the TFN. Its addition algorithms , subtraction algorithms , and multiplication algorithms are applied in this study [18]. The three basic algorithms were introduction as follows:
3.2.2. Method for Fuzzification and Defuzzification
For the risk assessment related data, such as the OP and the CS, accurately quantifying their value is difficult. A reasonable way of describing these parameters is often made with qualitative language variables using reviewer opinions and judgments. These subjective language variables (SLV), including very low, low, medium, high, and very high, are often used to describe the OP of some uncertain risks. In addition, the SLV describing the CS in risk assessment usually include slight, minor, moderate, critical, and catastrophic.
The SLV of the OP and the CS can be further defined with a membership function in the FST. For example, there is a set of SLV, , and , where is the SLV result of the mth object. Then, a fuzzy number of the with the TFN can be expressed as follows:
The transformation results between the SLV and TFN were obtained for the occurrence possibility and the CS, as shown in Table 1. The fuzzification transformation results in Table 1 have been widely used in the field of engineering [19].
Some mathematical reasoning methods of defuzzification exist for the fuzzification data in the FST. Among them, the Centroid Method is more logical and rigorous for defuzzification, and is widely used in various technologies and methods. For the defuzzification of the TFN, the mathematical expression as follows:
where is a numerical value by performing the defuzzification, is a numerical value of the ith TFN.
3.2.3. Fuzzy Method for a Crisp Number
In the risk assessment of a HHMS, the original OP and CS data are hybrid data that include some crisp numbers and some subjective language. The subjective language can be transformed into the fuzzy number using the fuzzification transformation method. To integrate all hybrid risk assessment data into the same algorithm, the crisp number was transformed into a fuzzy number to obtain a unified data form. Then, these fuzzy numbers quantifying basic data of the risk assessment were calculated with Equations (2)–(4). Thus, a fuzzy method for crisp numbers is presented in this study.
When the OP and CS of a basic event is , , the value of can be expressed equivalently with a fuzzy number such as based on the TFN. The defuzzification result of is can be proven using the Centroid Method. Thus, this fuzzy method of crisp number is feasible and reasonable.
Supposing two Ops exist, and that are crisp numbers, and , ,, , and . Then, and can be obtained with the fuzzy method for crisp number. Moreover, it can be proven that the rules of addition, subtraction, and multiplication are applicable in the operations process transforming a crisp number into a fuzzy number. These mathematical expressions are as follows [20].
3.3. Study on a Fuzzy Fault Tree Analysis
The FTA has been widely used in many areas of risk analysis. However, obtaining only crisp numbers for the OP of independent reason events, so that the OP of top events cannot be calculated, is challenging [21,22,23]. This problem often occurs in the FTA process for a complex structure mechanical system. To overcome the problem, FFTA is presented in this study that combines the FST and FTA.
When the OP of the reason events in the FTD are all crisp numbers, and the associated reason events are independent events, the OP of top event with an “AND” gate can be obtained by Equation (10).
where P is the OP of the top event, Pi is a OP of the ith reason event, and n is the total number of reason events associated with the “AND” gate.
For a top event with an “OR” gate, its OP can be determined with Equation (11):
When the OP of the reason events are fuzzy numbers in the FFTA method, the fuzzy occurrence probability (FOP) of the top event associated with an “AND” gate or an “OR” gate can be obtained using Equations (12) and (13) [24]:
where .
Based on the algorithm analysis above, the specific FFTA procedure is summarized as follows:
- Step 1:
- Establish a HST. The complex structural composition is analyzed for the HHMS.
- Step 2:
- Perform a FMECA. A FMECA report is obtained that provides risk analysis data for follow-up analysis.
- Step 3:
- Determine a top event and establish a FTD. For the top event determined, a set of related reason events is obtained from the FMECA report. A FTD can be constructed with the FTA.
- Step 4:
- Judge if all reason events are known. If the answer is true (YES), proceed to the next step. Otherwise (NO), jump to Step 7. This step determines the data type in the FTD. All reason events are divided into two types based on their data types: known reason events and unknown reason events. The OP of the known reason event is a crisp number, and an unknown reason event is subjective language.
- Step 5:
- Obtain crisp number of the OP of all reason events.
- Step 6:
- Calculate the OP of top event. In this step, the Probability Statistics method is used to calculate the probability of top event.
- Step 7:
- Judge whether all reason events are unknown. If it is true (YES), jump to Step 9. Otherwise (NO), go on to the next step.
- Step 8:
- Transform crisp numbers into fuzzy numbers. The fuzzy method for crisp numbers is applied to complete this process.
- Step 9:
- Evaluate the OP of unknown reason events. The qualitative evaluation and description obtained from opinions of the reviewers is handled with standard fuzzy semantics for the OP of unknown reason events.
- Step 10:
- Perform the fuzzification process with TFN. The fuzzy semantics obtained are transformed into fuzzy numbers based on the fuzzy transformation results in Table 1. To ensure the reasonableness of the result, the FOP should be integrated based on the opinions of a number of reviewers.
Because reviewers may have a difference in opinion on the likelihood of a reason event, legitimately integrating these different evaluation opinions to improve accuracy of assessment result is important. To address this, the Weighting Calculation Method was used, and its formula is as follows.
where is the fuzzy number of the OP of the ith reason event evaluated by the jth reviewer; m is the quantity of all reason events; n is quantity of all reviewers; is the weighting factor of the jth reviewer; and is the synthetic probability value combining all fuzzy number of ith reason event.
- Step 11:
- Calculate the FOP of the top event. The fuzzy numbers of the OP are converted into a fuzzy probability score using Equation (11) or Equation (12).
- Step 12:
- Perform the defuzzification process with the Centroid Method. The FOP of the top event is obtained from the fuzzy probability score of the top event with the Centroid Method.
- Step 13:
- Obtain the risk level and distribution results. By analyzing and explaining the results, the risk level and distribution in the HHMS are obtained.
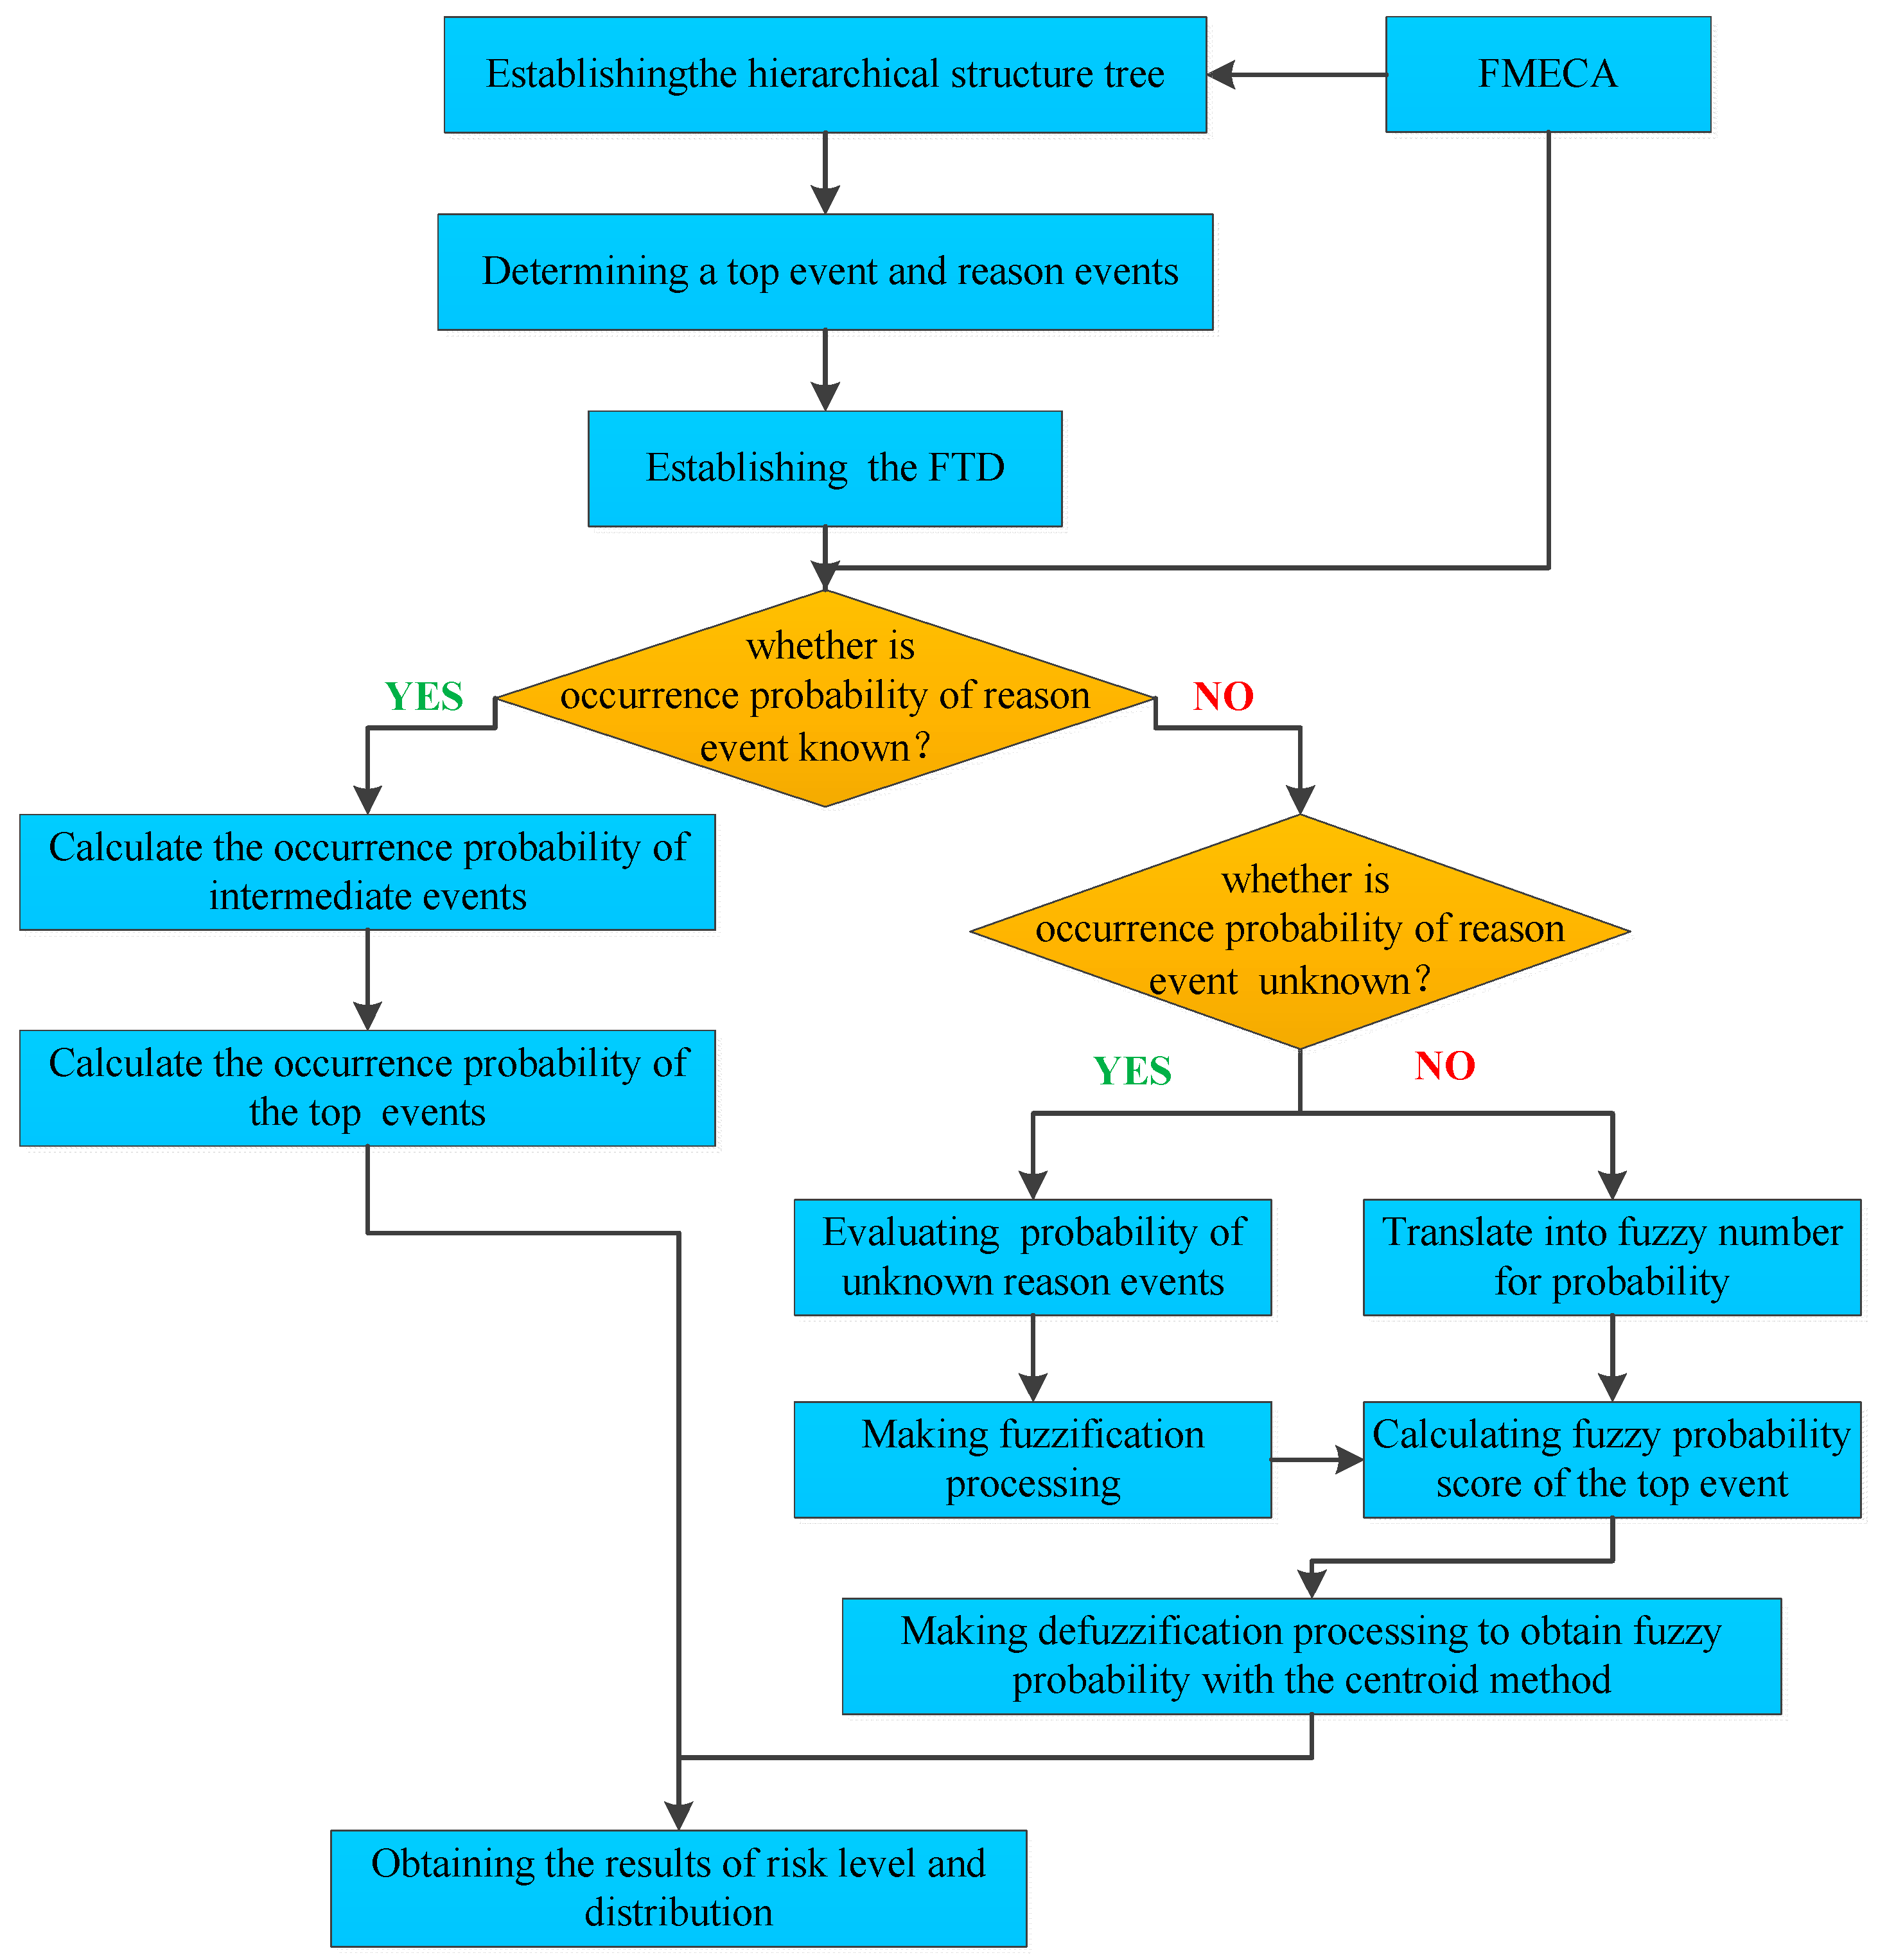
An algorithm flow chart of the FFTA is shown in Figure 2.
3.4. Study on a Fuzzy Event Tree Analysis
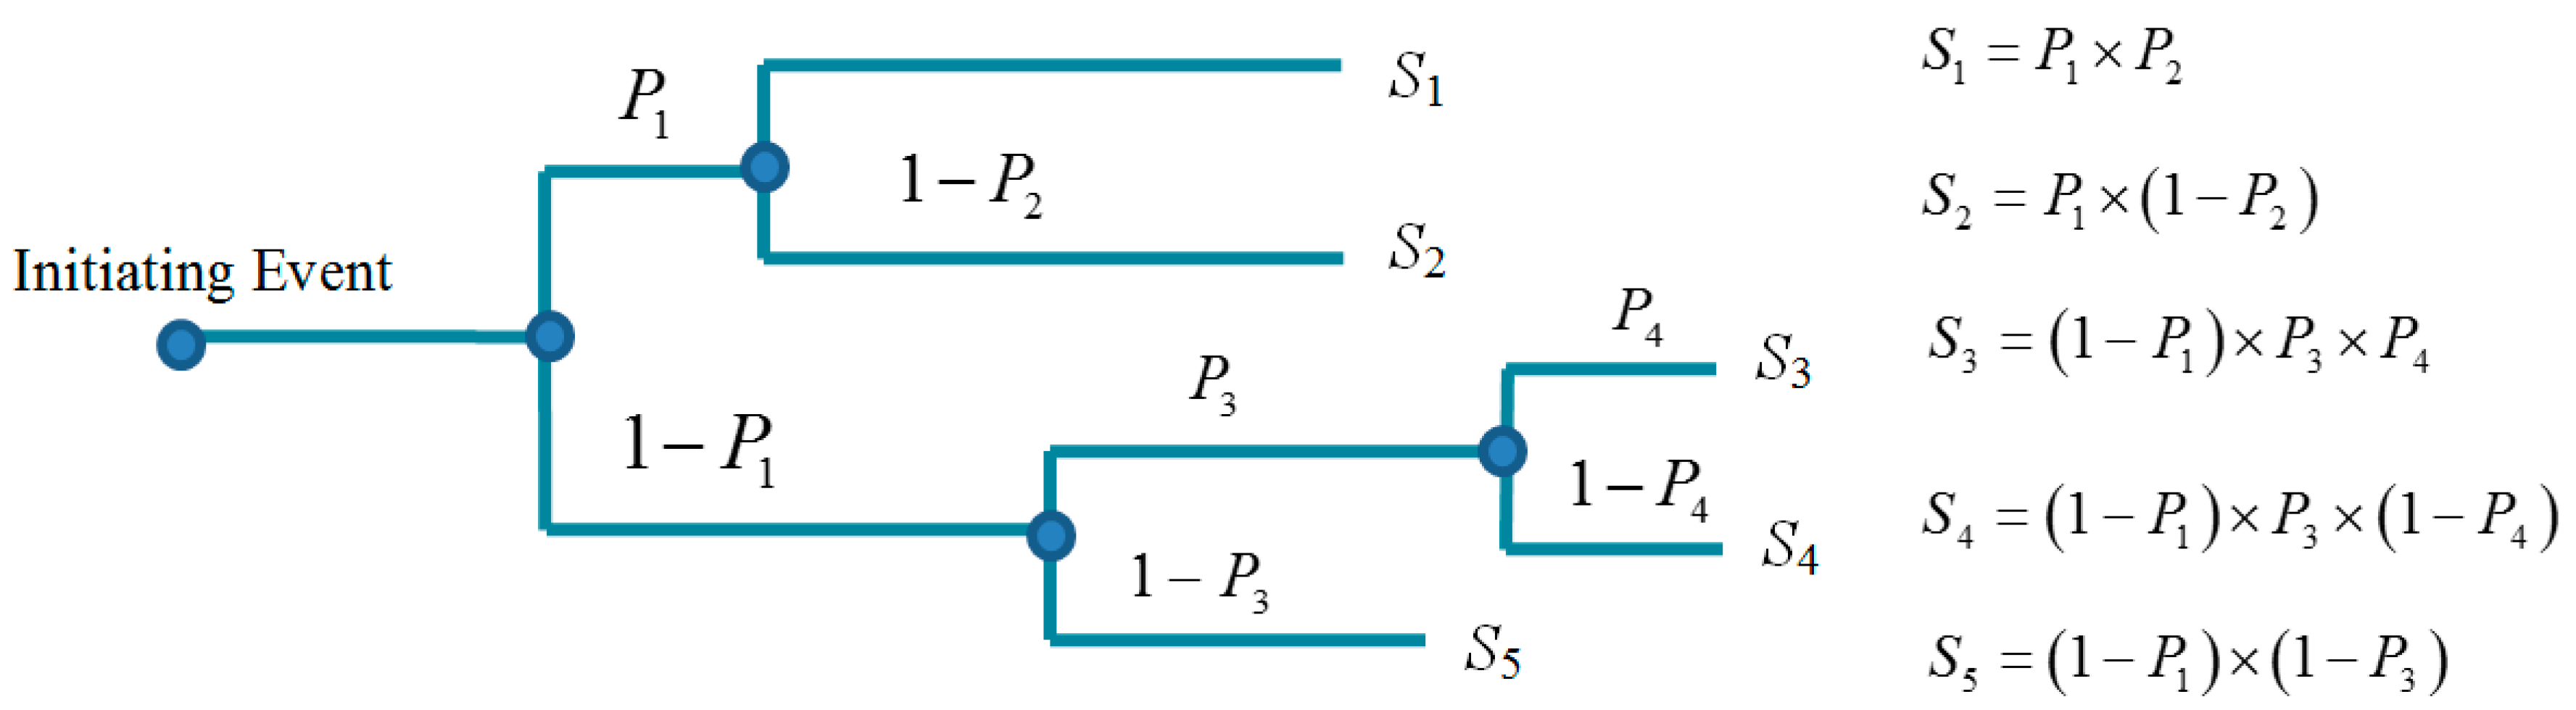
In the first case, the possibility of every event is a crisp number. Thus, the CS of result event could be calculated with a probabilistic method based on the ETD. For example, S4 could be obtained with Equation (15) based on the ETD in Figure 3.
where is the possibility that the ith event is Success, True, or Yes the in event development process, is the possibility of that the ith event is Failure, False, or No. Furthermore, the result event is the CS for ith result event in the EDT.
For the second case, some uncertainty data exist for the probability of some intermediate events, such as qualitative and linguistic descriptions. To complete a quantitative analysis, these uncertainty data could be transformed to fuzzy number probabilities with the FST method. Then, the CS of the result event could be calculated by the TFN rule of adding, subtracting, and multiplying [25]. For example, S4 could be obtained with Equation (16) based on the FFTA method.
where is possibility that the nth event is Success, True, or Yes in the event development process, and is the possibility of that the nth event is Failure, False, or No. The result event is the nth event in the FETA.
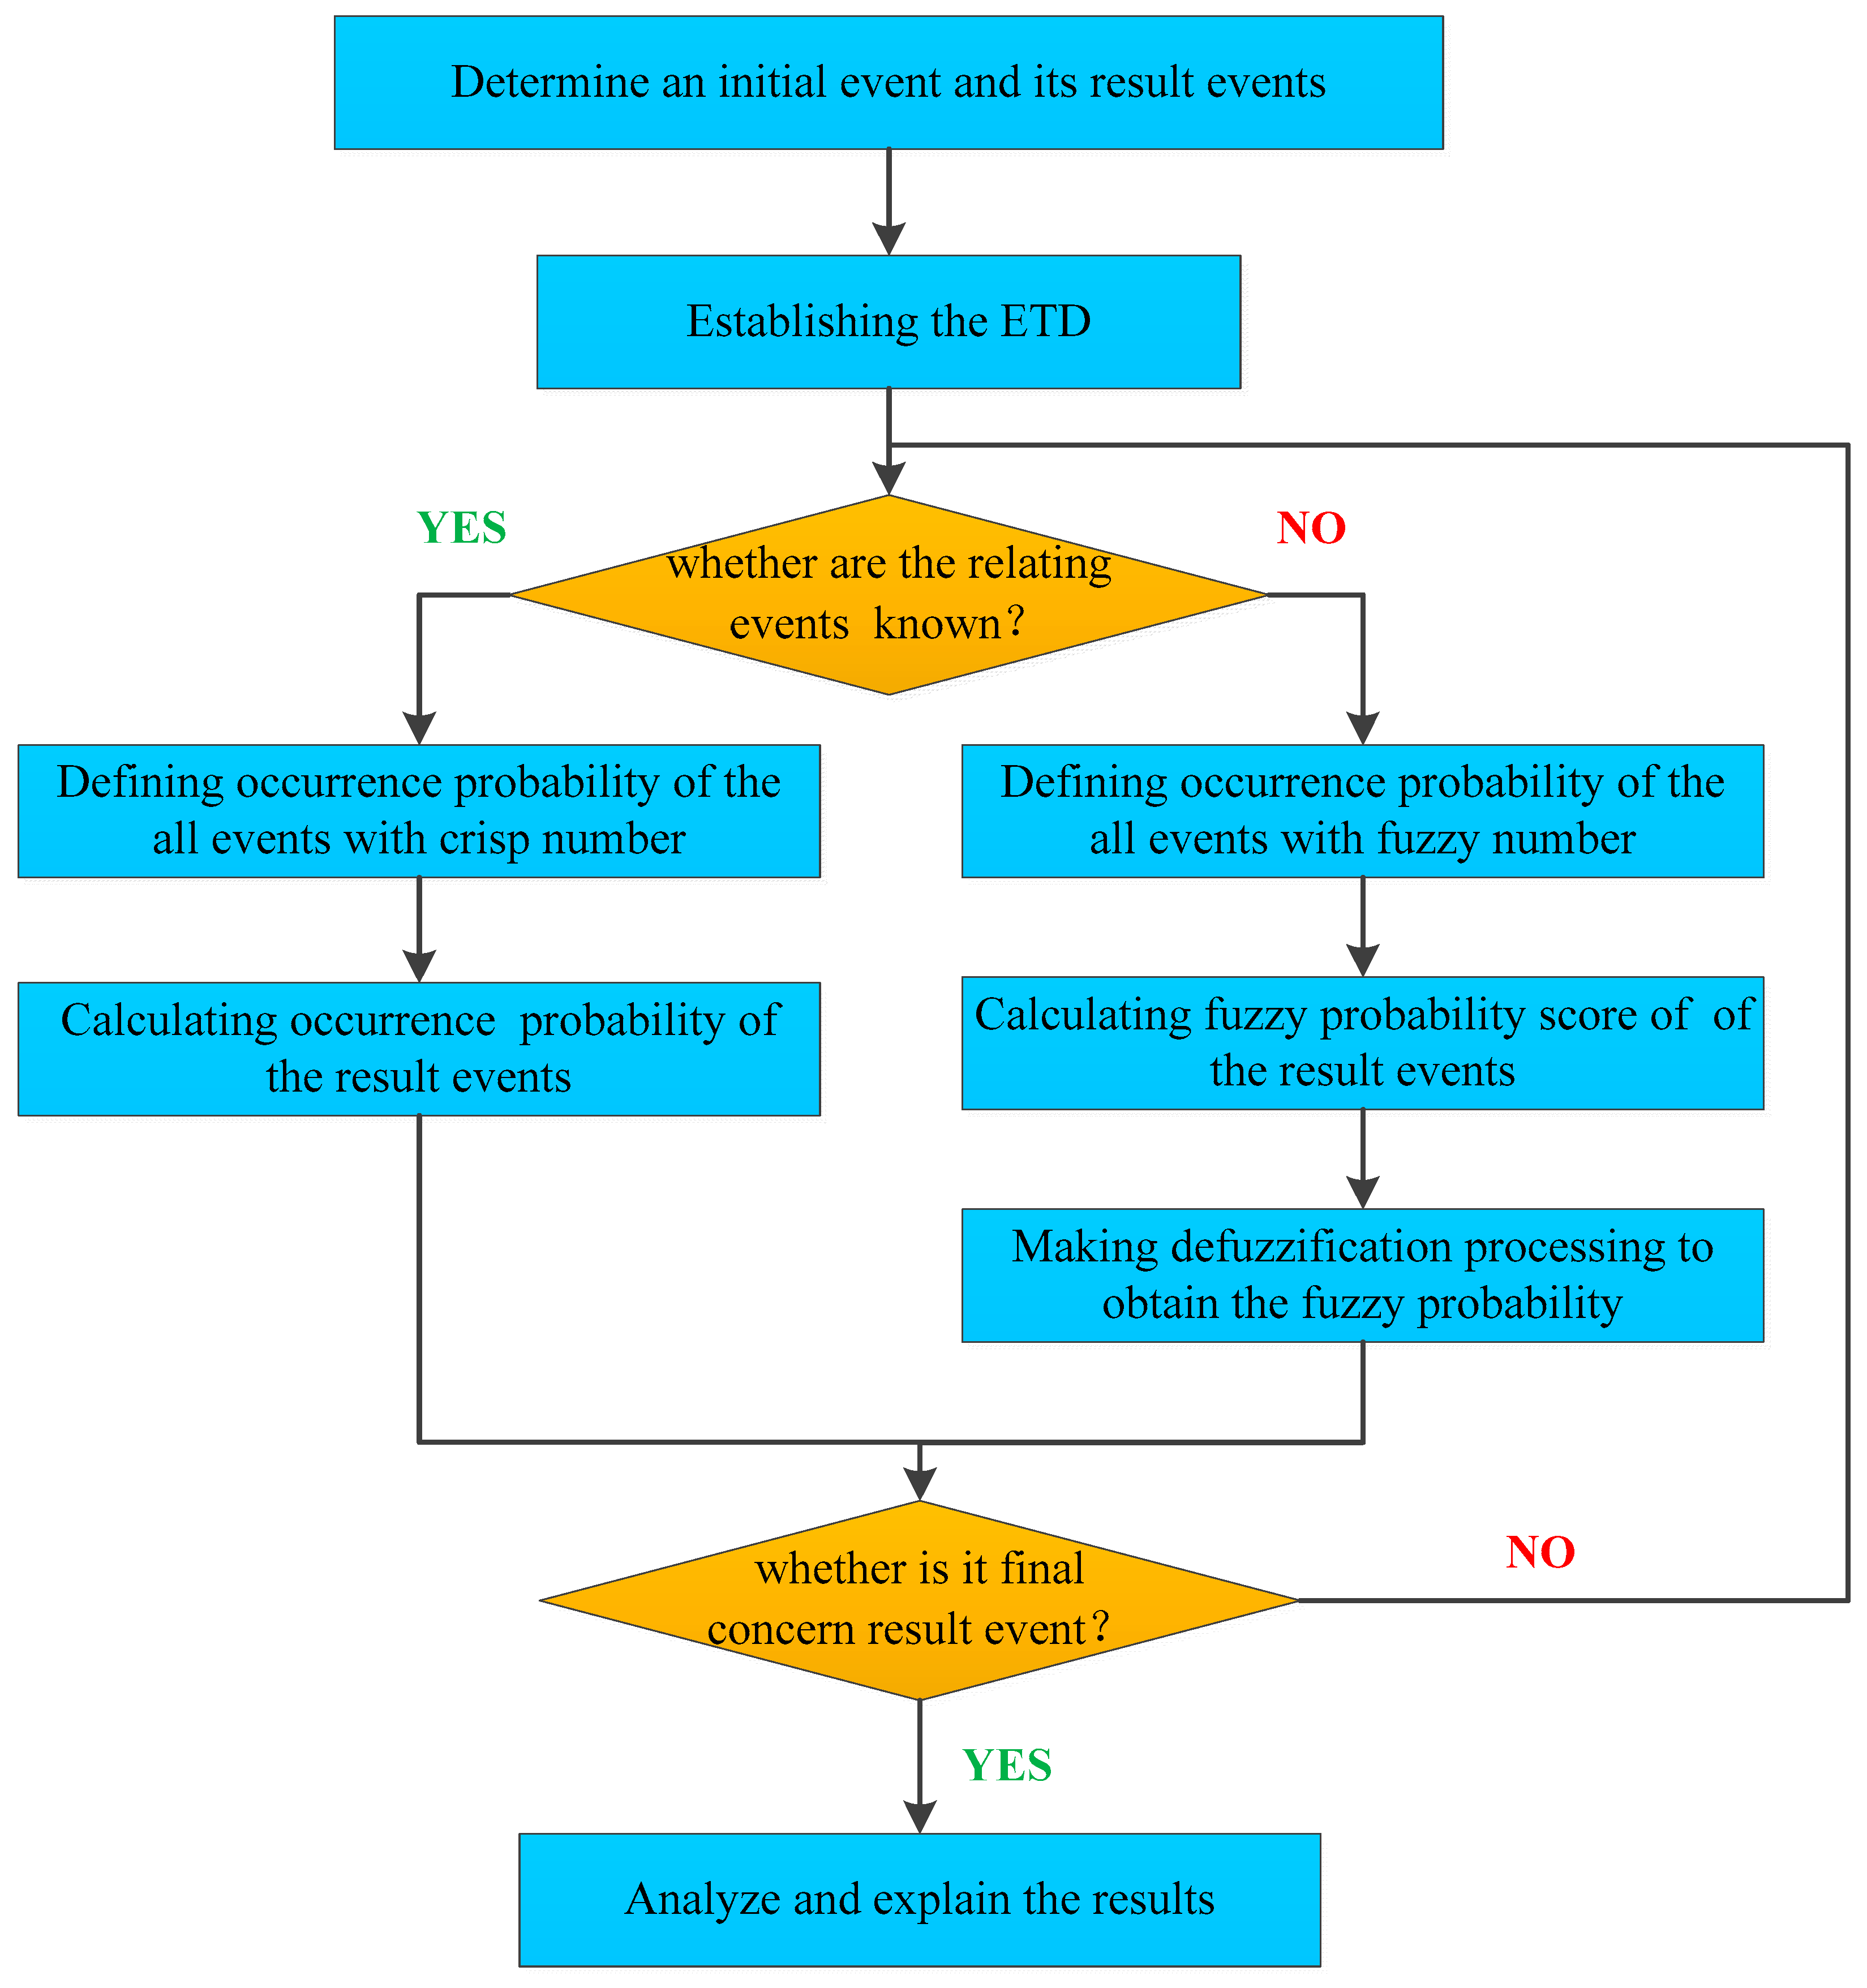
The calculation steps and contents of the FETA include eight steps as follows:
- Step 1:
- Determine an initial event and constructing its ETD with ETA. For an initial identified event, a set of possible intermediate events and result events can be obtained for the FMECA report, and the ETD is established by the ETA.
- Step 2:
- Judge whether the initial event and its result events are known at the first event node, namely, the possibility of every event being a crisp number should be confirmed. If it is true (YES), then proceed Step 3. Otherwise (NO), proceed to Step 4.
- Step 3:
- Define and calculate occurrence probability with crisp numbers. The probability of the result event at one event node is defined by crisp numbers and calculated with the conventional rule, like Equation (15). Then, jump to Step 7.
- Step 4:
- Define occurrence probability with fuzzy numbers. The possibility of all events relating to this result event before the event node is fuzzed with the TFN. The quantitative values of their occurrence possibility are obtained by transformation from the qualitative evaluation result. Moreover, all crisp numbers are transformed into fuzzy numbers.
- Step 5:
- Calculate the fuzzy probability score. The fuzzy numbers of the CS of the result events are converted into the fuzzy consequence severity (FCS) of the result events with Equation (16).
- Step 6:
- Perform defuzzification process. The CS of the result events are obtained from the FCS using the Centroid Method.
- Step 7:
- Judge if the result events are the final result events. If true (YES), proceed to Step 8. Otherwise (NO), proceed to Step 2.
- Step 8:
- Analyze and explain the results.The specific flow chart of the FETA is shown in Figure 4, based on the calculation steps.
3.5. Study of a Fuzzy Bow-Tie Model
The fuzzy bow-tie model (FBTM) integrates the FFTA method and the FETA method into one common platform system. The FBTM extended some original functions and features of the bow-tie model and increased the ability of fuzzy analysis [13]. An algorithm flow chart for the FBTM is shown in Figure 5.
In Figure 5, the basic events that may occur are defined with FTA and FFTA. The crisp OP (COP) or FOP of the top event are obtained by calculating the OP of the basic event. Using the same method, crisp CS (CCS) and FCS are obtained by the ETA and the FETA. By multiplying and , a crisp risk priority (CRP) is calculated with Equation (17). Through the fuzzy product of and , the fuzzy risk priority (FRP) is calculated based on the FBTM with Equation (18) [26]. Finally, the quantitative risk assessment results were obtained by using the Centroid Method to create the defuzzification.
The FBTM method combines the logical relationship between the reasons and the consequences of all events, and considers both the OP and the CS of critical events. Thus, application of the FBTM method can further prevent, control, and reduce the occurrence of major accidents for HHMS in the PPI. However, when using the methods above, we need to pay attention to the following point that the uncertainty of risk data is always included in the process of fuzzification and defuzzification. Thus, there is still uncertainty about the result of the final quantitative risk assessment.
4. Case Study
The reciprocating pump system (RPS) is a common and important, as well as complex, mechanical system in PPI. Sudden failure of the RPS may have some adverse consequences, including production losses, property damage, environmental pollution, and personal casualties in the PPI. Therefore, the RPS has all the characteristics of a conventional HHMS. The RPS was used as an example to verify the quantitative risk analysis method for HHMS in this study.
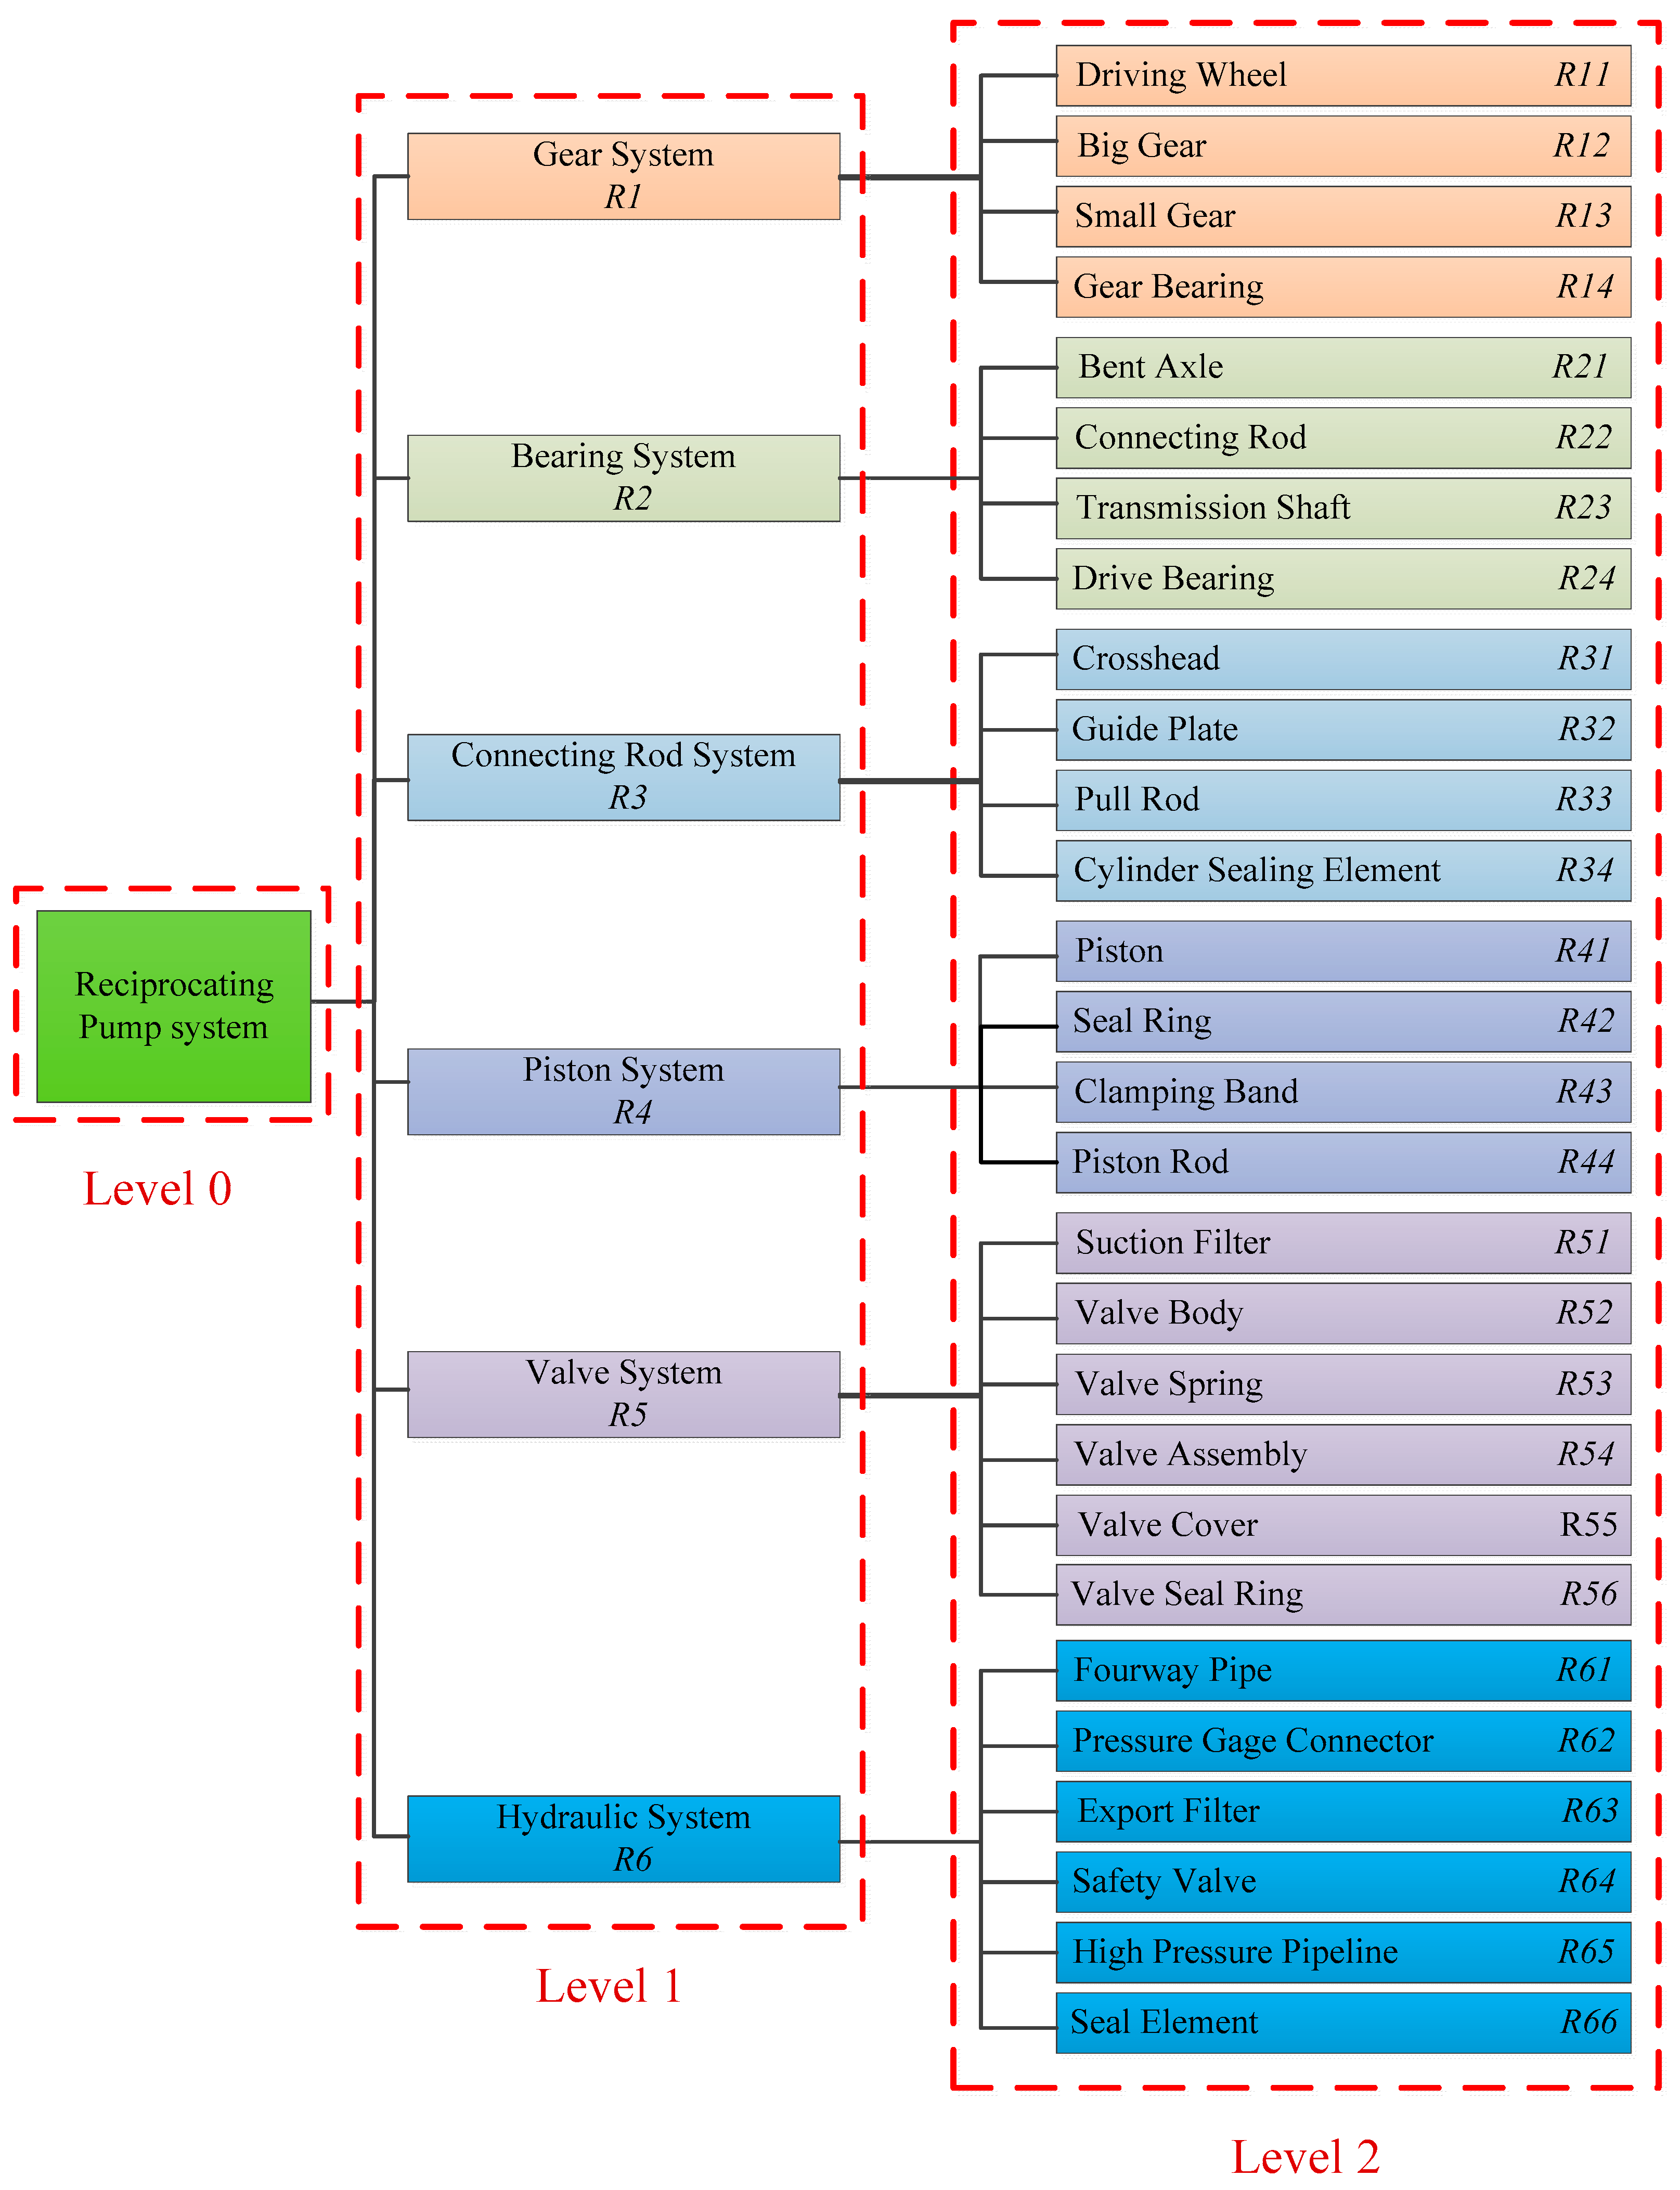
To analyze risk factors, or basic events, associated with the failures of RPS, we first dissected the mechanical structure components. A HST for the RPS was established, as shown in Figure 6. According to different functions and characteristics, the RPS was divided into six subsystems, including Gear System R1, Bearing System R2, Connecting Rod System R3, Piston System R4, Valve System R5, and Hydraulic System R6, as shown in level 1 in Figure 6. Subsystems from R1 to R6 have 28 components, as shown in Level 2 in the HST in Figure 6.
Through the field data statistics and experts’ experience and evaluation, the initial data of OP and CS, including crisp numbers and fuzzy semantics, were obtained. Then, with data processing method for hybrid data, these data were uniformly transformed into fuzzy data with the TFN. With the FFTA, FETA and FBTM methods, the fuzzy occurrence probability (FOP), fuzzy consequence severity (FCS), and fuzzy risk priority (FRP) of all components from R11 to R66 in Level 2 were calculated, as shown in Table 2.
Then, the risk level and distribution of all components in Level 2 of the HST of the RPS were calculated (Figure 7). In Figure 7, the relative risk value and the risk ranking of every component can be obtained. The risk level and distribution of high risk are then understood, as seen with the seal ring, piston, cylinder liner, drive wheel, crosshead, and guide plate. Therefore, petrochemical enterprise can develop targeted Preventive Maintenance (PM) programs and risk management technologies to avoid or decrease the high risk component failures, so that the reliability of the RPS is guaranteed.
The COP, CCS, and CRP of all subsystems from R1 to R6 in the Level 1 of the HST of the RPS were calculated by the FFTA, the FETA, and the FBTM. Finally, the quantitative risk assessment results of the RPS were obtained in Figure 8.
The quantitative risk assessment results, the risk level, and distribution of the RPS subsystems were obtained (Figure 8). For the failure risk of the RPS, the gear system (R1) is the highest, and the valve deck system (R5) and the piston system (R4) are also relatively high in all their subsystems. Thus, the focus should be on the failure modes of the gear system (R1), the valve deck system (R5), and the piston system (R4) during the operation and maintenance of the RPS. Moreover, some appropriate preventive measures, such as Periodical Maintenance (PM) and Prognostic and Health Management (PHM), should be adopted for the high hazard subsystems and components, to ensure operation safety in the process of oil and gas exploration and development.
5. Conclusions
In this paper, a quantitative risk assessment method was presented for the HHMS in the PPI that solved the hybrid data problem in risk analysis. The common features and problems of the HHMS were first analyzed, and the risk assessment methods that can be applied to the mechanical systems were reviewed. Next, to address the hybrid data problem, the method of transforming crisp numbers and linguistic values into fuzzy numbers with the TFN, based on FST, was used in risk assessment of the HHMS. We proved that the calculated results were closed for the rules of addition, subtraction, and multiplication after a crisp number was transformed into a TFN. Under fuzzification transformation results with the TFN, the method could be used for other hybrid data problems in the field of engineering as well. The FFTA and FETA methods were then presented to analyze and calculate the OP and CS of basic events by improving the traditional FTA and ETA. Next, the FBTM method was used for quantitative risk assessment of the HHMS. Finally, a case study was performed to verify the feasibility and practicability of our quantitative risk analysis method by using a RPS as an example.
The risk analysis methods used in this study, including the FFTA, FETA, and FBTM, can be applied to other HHMS in oil and gas exploration and development. Quantitative risk assessment results for the mechanical system were obtained, which can provide data support and reference for the decision process for their maintenance, monitoring, and evaluation of health status. Risk identification and quantitative evaluation is one of the core components of AIM for HHMS. Therefore, the method presented in this study can provide technical and data support for the development of an AIM system for the mechanical systems in the PPI. The variety of risk analysis and data processing methods in this paper can serve as a reference for the risk analysis in other industries and for other objects.
Since subjective evaluation is involved in the application of this method, some actual errors are generated and carried forward into the next analysis process. There is still uncertainty about the result of the final quantitative risk assessment. Thus, the next step in this line of work is to consider establishing an error elimination method. Moreover, the membership function plays a decisive role in the process of fuzzification, so further research is necessary on the choice of membership function to improve the accuracy of the quantitative risk assessment results. In fact, once the causality is clear and estimate outcome is given, Bayesian networks (BN) are more recent than fuzzy logic to tackle this kind of problems in the mathematical aspect. The final result of a BN will still contain and show all the uncertainty information that has been included in the inputs.
Acknowledgments
This work is supported by the Open Fund (OGE201702-22) of Key Laboratory of Oil &Gas Equipment, Ministry of Education (Southwest Petroleum University); National Natural Science Foundation of China (11401494); National Science and Technology Major Project (2016ZX05028-001-006) and Key Research and Development Projects of Sichuan Science and Technology Department (2017GZ0386).
Author Contributions
Yang Tang, Jiajia Jing and Yan Yang conceived and designed the methodologies; Jiajia Jing, Yang Tang and Zhidong Zhang analyzed the data; Zhidong Zhang contributed the data; Yang Tang and Yan Yang wrote the paper.
Conflicts of Interest
The authors declare they have no conflicts of interest.
Abbreviations
| AIM | Asset Integrity Management |
| BN | Bayesian network |
| BTM | Bow-tie Model |
| CA | Criticality Analysis |
| CS | Consequence severity |
| CCS | Consequence severity ranking |
| DNV | Det Norske Veritas |
| ETA | Event tree analysis |
| ETD | Event Tree Diagram |
| HHMS | High hazard mechanical system |
| HST | Hierarchical structure tree |
| FFTA | Fuzzy fault tree analysis |
| FETA | Fuzzy event tree analysis |
| FBTM | Fuzzy bow-tie model |
| FFTA | Fuzzy Fault Tree Analysis |
| FMECA | Failure mode effects and criticality |
| FOP | Fuzzy occurrence probability |
| FTA | Fault tree analysis |
| FTD | Fault Tree Diagram |
| FRP | Fuzzy risk priority |
| FST | Fuzzy Set Theory |
| OP | Occurrence probability |
| OPR | Occurrence probability ranking |
| PHM | Prognostic and Health Management |
| PM | Periodical Maintenance |
| PPI | Petroleum and petrochemical industry |
| RPS | Reciprocating pump system |
| RPN | Risk Priority Number |
| RR | Risk ranking |
| SLV | Subjective language variables |
| TFN | Triangular fuzzy number |
| UVD | Uncertain and vague data |
References
- Landucci, G.; Necci, A.; Antonioni, G.; Argenti, F.; Cozzani, V. Risk assessment of mitigated domino scenarios in process facilities. Reliab. Eng. Syst. Saf. 2017, 160, 37–53. [Google Scholar] [CrossRef]
- Landucci, G.; Paltrinieri, N. A methodology for frequency tailorization dedicated to the Oil & Gas sector. Process Saf. Environ. Prot. 2016, 104, 123–141. [Google Scholar]
- Goerlandt, F.; Khakzad, N.; Reniers, G. Validity and validation of safety-related quantitative risk analysis: A review. Saf. Sci. 2017, 99, 127–139. [Google Scholar] [CrossRef]
- Xu, K.; Tang, L.C.; Xie, M.; Ho, S.L.; Zhu, M.L. Fuzzy assessment of FMEA for engine systems. Reliab. Eng. Syst. Saf. 2002, 75, 17–29. [Google Scholar] [CrossRef]
- Brandsæter, A. Risk assessment in the offshore industry. Saf. Sci. 2002, 40, 231–269. [Google Scholar] [CrossRef]
- Shahriar, A.; Sadiq, R.; Tesfamariam, S. Risk analysis for oil & gas pipelines: A sustainability assessment approach using fuzzy based bow-tie analysis. J. Loss Prev. Process Ind. 2012, 25, 505–523. [Google Scholar]
- Ferdous, R.; Khan, F.; Sadiq, R.; Amyotte, P.; Veitch, B. Fault and event tree analyses for process systems risk analysis: Uncertainty handling formulations. Risk Anal. Int. J. 2010, 31, 86–107. [Google Scholar] [CrossRef] [PubMed]
- Ferdous, R.; Khan, F.; Sadiq, R.; Amyotte, P.; Veitch, B. Analyzing system safety and risks under uncertainty using a bow-tie diagram: An innovative approach. Process Saf. Environ. Prot. 2013, 91, 1–18. [Google Scholar] [CrossRef]
- Goerlandt, F.; Reniers, G. On the assessment of uncertainty in risk diagrams. Saf. Sci. 2016, 84, 67–77. [Google Scholar] [CrossRef]
- Landucci, G.; Bonvicini, S.; Cozzani, V. A methodology for the analysis of domino and cascading events in Oil & Gas facilities operating in harsh environments. Saf. Sci. 2017, 95, 182–197. [Google Scholar]
- Scorsetti, M.; Signori, C.; Lattuada, P.; Urso, G.; Bignardi, M.; Navarria, P.; Trucco, P. Applying failure mode effects and criticality analysis in radiotherapy: Lessons learned and perspectives of enhancement. Radiother. Oncol. 2010, 94, 367–374. [Google Scholar] [CrossRef] [PubMed]
- Tchorzewska-Cieslak, B. A fuzzy model for failure risk in water-pipe networks analysis. Ochr. Srodowiska 2011, 33, 35–40. [Google Scholar]
- Goerlandt, F.; Reniers, G. An approach for reconciling different perspectives and stakeholder views on risk ranking. J. Clean. Prod. 2017, 149, 1219–1232. [Google Scholar] [CrossRef]
- Chevreau, F.R.; Wybo, J.L.; Cauchois, D. Organizing learning processes on risks by using the bow-tie representation. J. Hazard. Mater. 2006, 130, 276–283. [Google Scholar] [CrossRef] [PubMed]
- Markowski, A.S.; Mannan, M.S.; Bigoszewska, A. Fuzzy logic for process safety analysis. J. Loss Prev. Process Ind. 2009, 22, 695–702. [Google Scholar] [CrossRef]
- Landucci, G.; Antonioni, G.; Tugnoli, A.; Bonvicini, S.; Molag, M.; Cozzani, V. HazMat transportation risk assessment: A revisitation in the perspective of the Viareggio LPG accident. J. Loss Prev. Process Ind. 2017, 49, 36–46. [Google Scholar] [CrossRef]
- Yaghoubpour, Z.; Givehchi, S.; Tabrizi, M.A.; Masoudi, F.; Nourian, L. Public transport risk assessment through FTA. Int. J. Hum. Cap. Urban Manag. 2016, 1, 93–102. [Google Scholar]
- Sun, S.; Kensek, K.; Noble, D.; Schiler, M. A method of probabilistic risk assessment for energy performance and cost using building energy simulation. Energy Build. 2016, 110, 1–12. [Google Scholar] [CrossRef]
- American Institute of Chemical Engineers (AIChE). Guidelines for Chemical Process Quantitative Risk Analysis, 2nd ed.; AIChE: New York, NY, USA, 2000. [Google Scholar]
- Tchorzewska-Cieslak, B.; Boryczko, K.; Eid, M. Failure scenarios in water supply system by means of fault tree analysis. In Proceedings of the Advances in Safety, Reliability and Risk Management, Troyes, France, 18–22 September 2011. [Google Scholar]
- Ferdous, R.; Khan, F.; Sadiq, R.; Amyotte, P.; Veitch, B. Handling data uncertainties in ETA. Process Saf. Environ. Prot. 2009, 87, 283–292. [Google Scholar] [CrossRef]
- De Barros, L.C.; Bassanezi, R.C.; Lodwick, W.A. Fuzzy Sets Theory and Uncertainty in Mathematical Modeling. In A First Course in Fuzzy Logic, Fuzzy Dynamical Systems, and Biomathematics; Springer: Berlin/Heidelberg, Germany, 2017; pp. 1–21. [Google Scholar]
- Senol, Y.E.; Sahin, B. A novel real-time continuous fuzzy fault tree analysis (RC-FFTA) model for dynamic environment. Ocean Eng. 2016, 127, 70–81. [Google Scholar] [CrossRef]
- Tchórzewska-Cieslak, B.; Boryczko, K.; Piegdon, I. Possibilistic risk analysis of failure in water supply network. In Safety and Reliability: Methodology and Applications, Proceedings of the European Safety and Reliability Conference, Wroclaw, Poland, 14–18 September 2014; CRC Press: Boca Raton, FL, USA, 2014; pp. 1473–1480. [Google Scholar]
- Sadiq, R.; Saint-Martin, E.; Kleiner, Y. Predicting risk of water quality failures in distribution networks under uncertainties using fault-tree analysis. Urban Water J. 2008, 5, 287–304. [Google Scholar] [CrossRef]
- Landucci, G.; Argenti, F.; Tugnoli, A.; Cozzani, V. Quantitative assessment of safety barrier performance in the prevention of domino scenarios triggered by fire. Reliab. Eng. Syst. Saf. 2015, 143, 30–43. [Google Scholar] [CrossRef]
Figure 1.
The hierarchical structure tree (HST) of a conventional high-hazard mechanical system (HHMS). UVD: uncertain and vague data; OP: occurrence probability; CS: consequence severity.
Figure 1.
The hierarchical structure tree (HST) of a conventional high-hazard mechanical system (HHMS). UVD: uncertain and vague data; OP: occurrence probability; CS: consequence severity.

Figure 2.
The algorithm flow chart of the fuzzy fault tree analysis (FFTA). FTD: fault tree diagram; FMECA: failure mode effects and criticality analysis.
Figure 2.
The algorithm flow chart of the fuzzy fault tree analysis (FFTA). FTD: fault tree diagram; FMECA: failure mode effects and criticality analysis.

Figure 3.
An example of a conventional Event Tree.

Figure 4.
The flow chart of the fuzzy event tree analysis (FETA). ETD: event tree diagram.

Figure 5.
The algorithm flow chart of the fuzzy bow-tie model (FBTM). FTA: fault tree analysis; ETA: event tree analysis; FETA: fuzzy event tree analysis.
Figure 5.
The algorithm flow chart of the fuzzy bow-tie model (FBTM). FTA: fault tree analysis; ETA: event tree analysis; FETA: fuzzy event tree analysis.
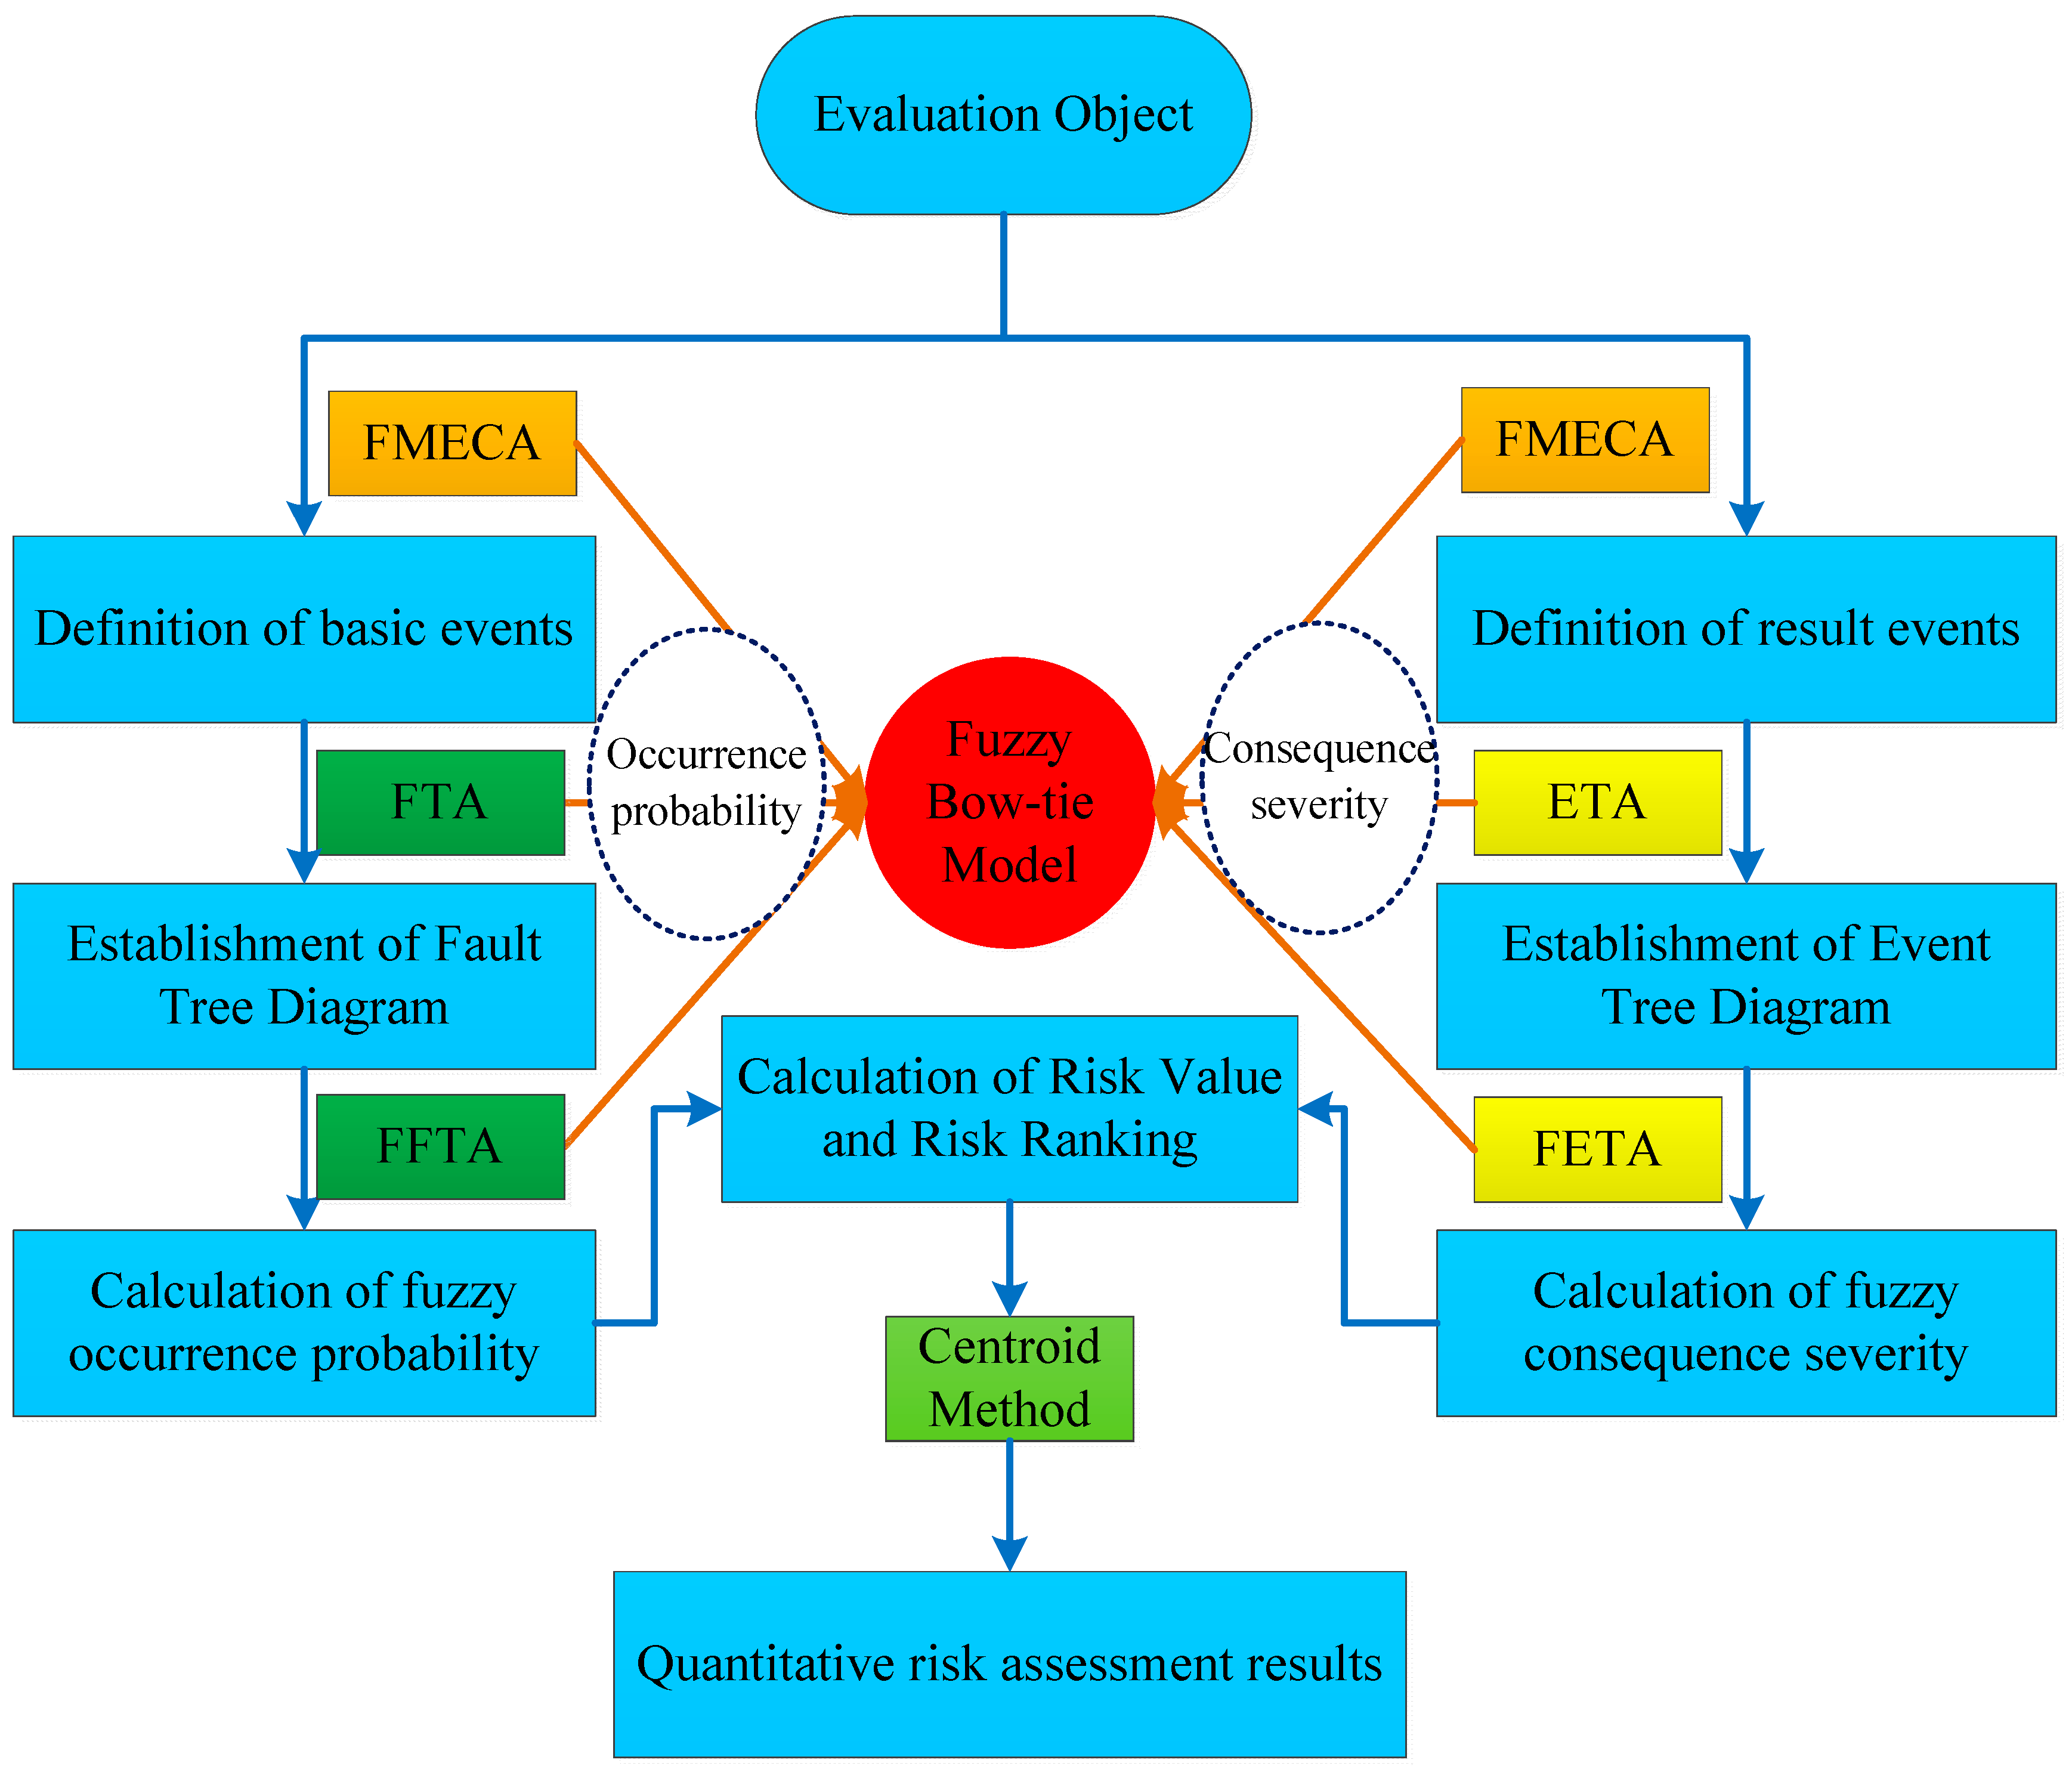
Figure 6.
The hierarchical structure tree (HST) of the reciprocating pump system (RPS)

Figure 7.
Risk ranking, shown by the red numbers, and risk distribution of components in the reciprocating pump system (RPS).
Figure 7.
Risk ranking, shown by the red numbers, and risk distribution of components in the reciprocating pump system (RPS).
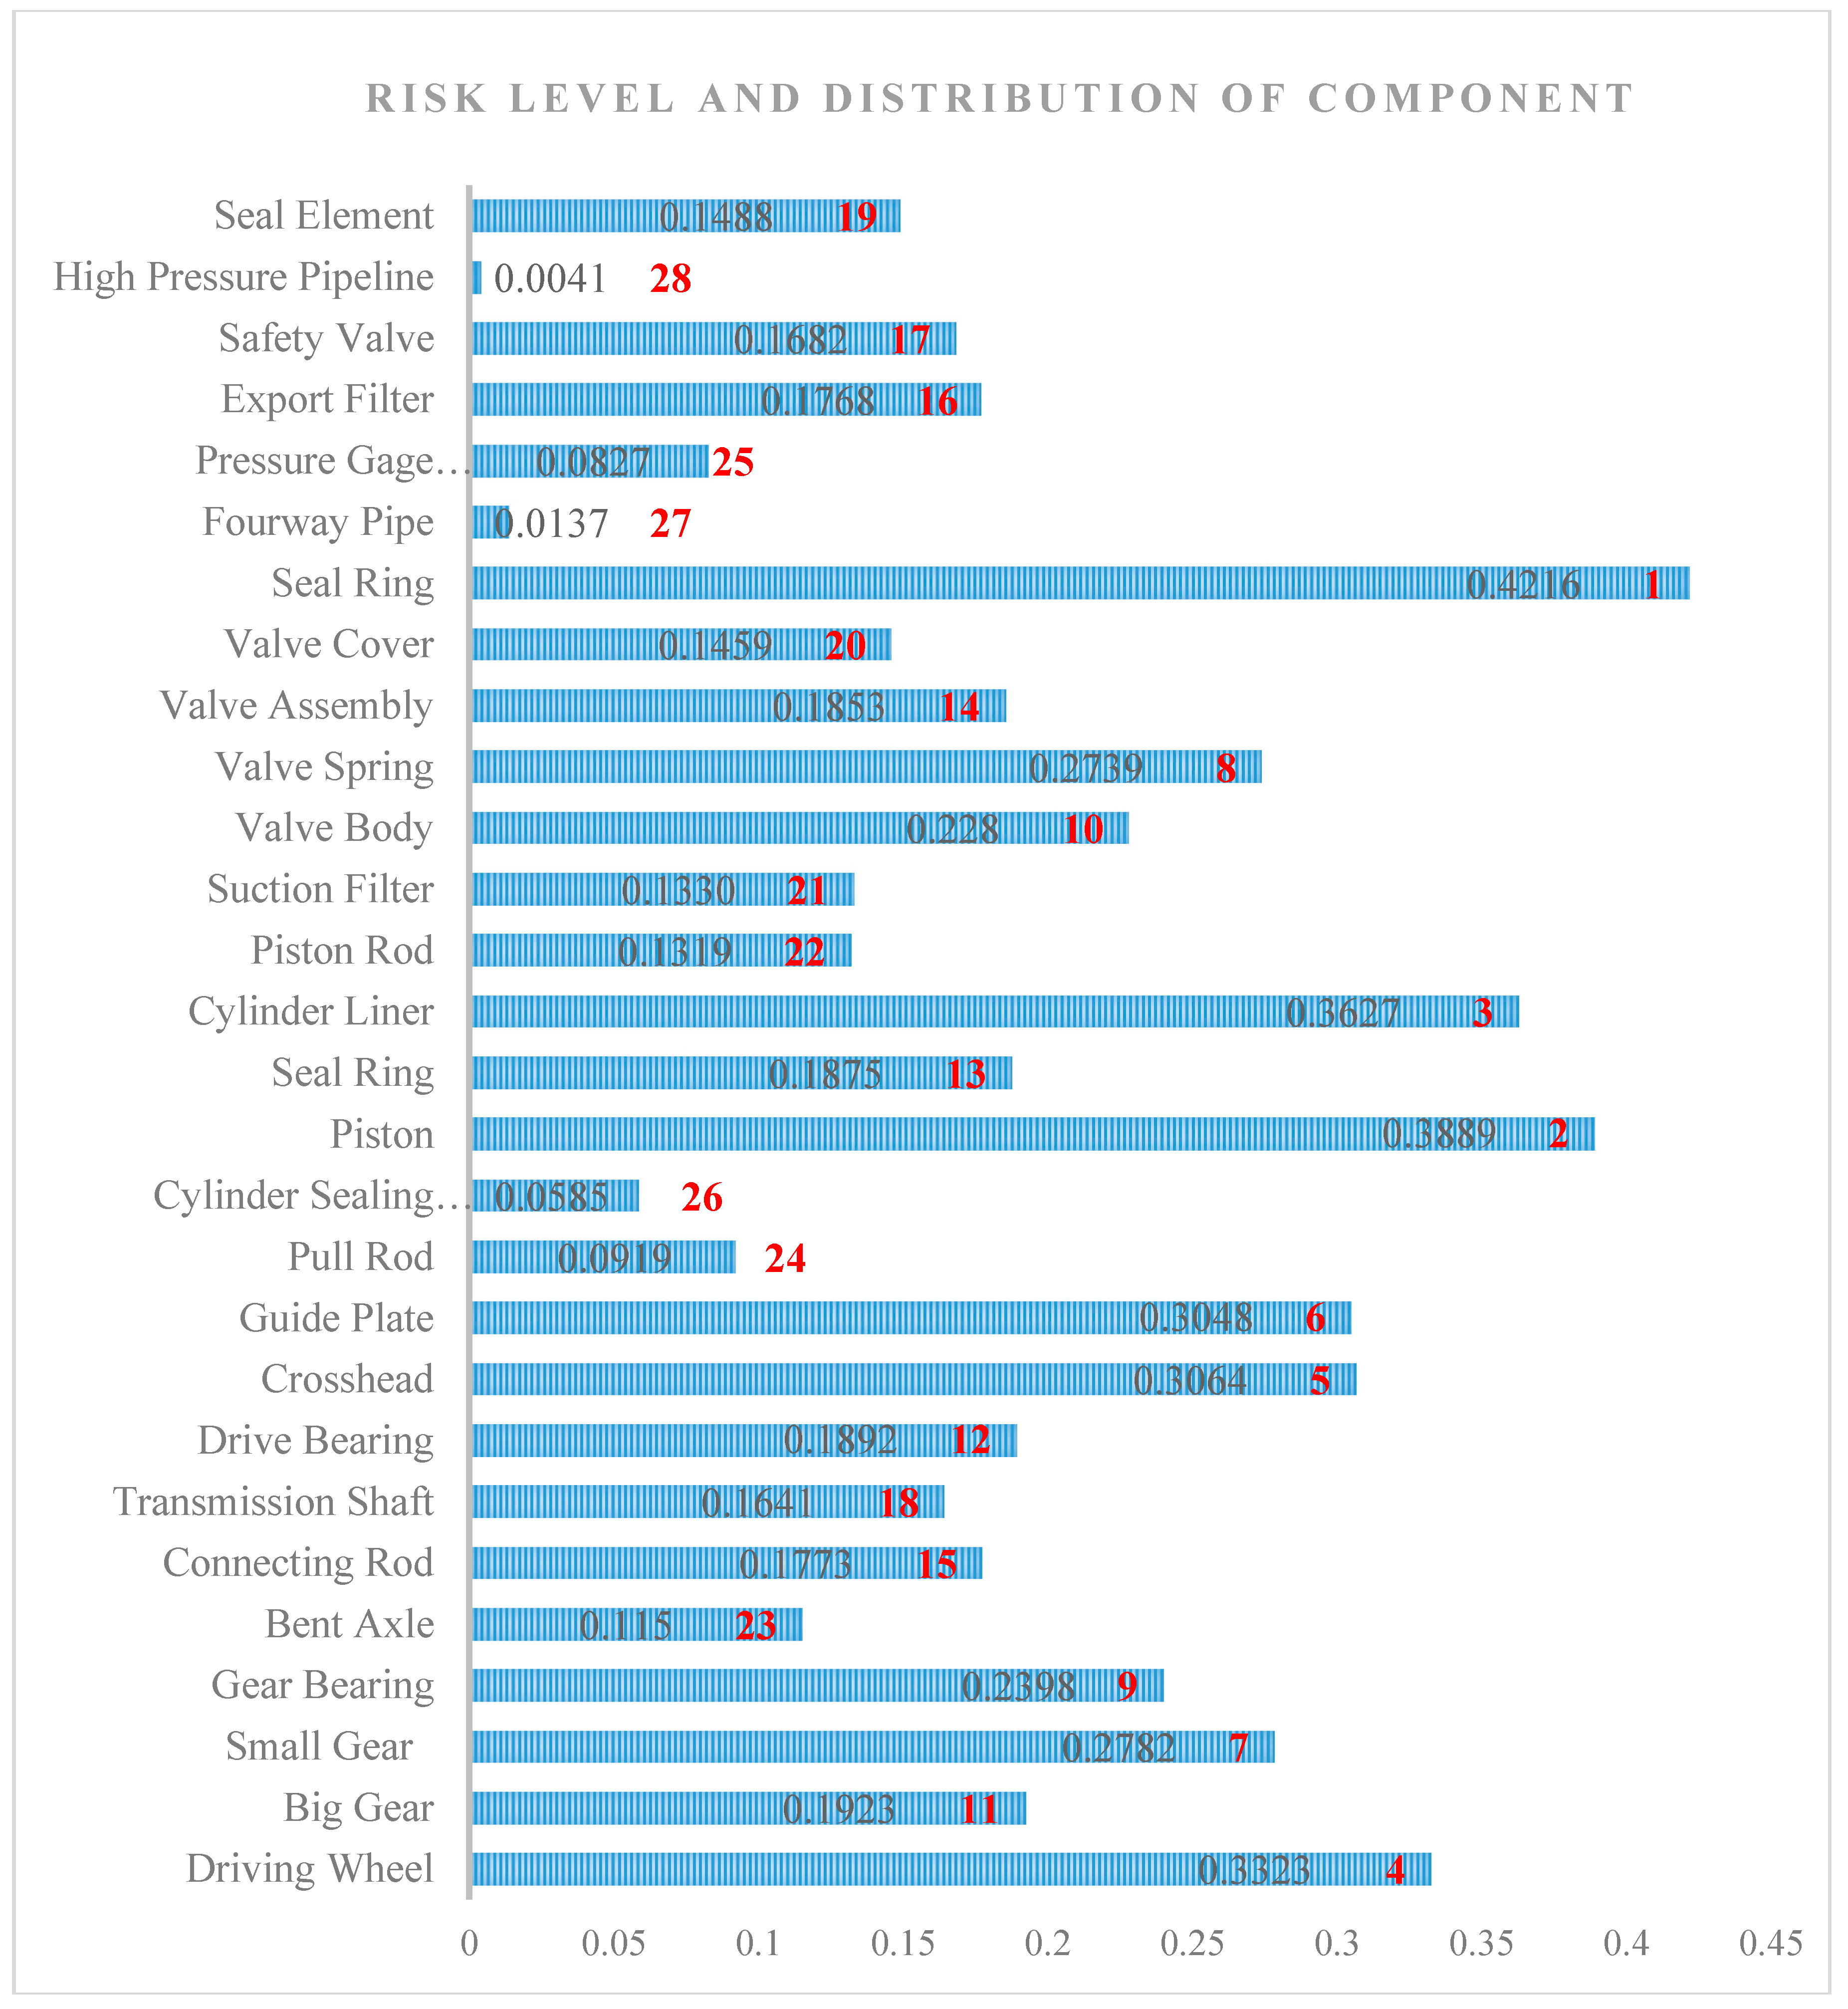
Figure 8.
Risk level of the subsystems in the RPS, using crisp occurrence probability (COP), crisp consequence severity (CCS), and crisp risk priority (CRP).
Figure 8.
Risk level of the subsystems in the RPS, using crisp occurrence probability (COP), crisp consequence severity (CCS), and crisp risk priority (CRP).


Table 1.
Fuzzification transformation results with the triangular fuzzy number (TFN).
| SN | Occurrence Probability | Consequence Severity | Membership Function |
|---|---|---|---|
| 1 | Very low (VL) | Slight (SL) | (0.00, 0.00, 0.25) |
| 2 | Low (L) | Minor (MI) | (0.00, 0.25, 0.50) |
| 3 | Medium (M) | Moderate (MO) | (0.25, 0.50, 0.75) |
| 4 | High (H) | Critical (CR) | (0.50, 0.75, 1.00) |
| 5 | Very high (VH) | Catastrophic (CA) | (0.75, 1.00, 1.00) |
Table 2.
The fuzzy occurrence probability (FOP), fuzzy consequence severity (FCS), and fuzzy risk priority (FRP) of the components in the reciprocating pump system (RPS).
Table 2.
The fuzzy occurrence probability (FOP), fuzzy consequence severity (FCS), and fuzzy risk priority (FRP) of the components in the reciprocating pump system (RPS).
| Failure of Level 2 Components | FOP | FCS | FRP |
|---|---|---|---|
| Driving Wheel | (0.3245, 0.4257, 0.5483) | (0.8712, 0.7954, 0.6854) | (0.2827, 0.3386, 0.3758) |
| Big Gear | (0.1245, 0.2537, 0.3545) | (0.9754, 0.8745, 0.6587) | (0.1214, 0.2219, 0.2335) |
| Small Gear | (0.2354, 0.3547, 0.4538) | (0.9654, 0.8642, 0.6628) | (0.2273, 0.3065, 0.3008) |
| Gear Bearing | (0.3578, 0.4562, 0.5578) | (0.6587, 0.5398, 0.4257) | (0.2357, 0.2463, 0.2375) |
| Bent Axle | (0.0985, 0.1256, 0.2357) | (0.9534, 0.8218, 0.6275) | (0.0939, 0.1032, 0.1479) |
| Connecting Rod | (0.1253, 0.2387, 0.3654) | (0.8542, 0.7628, 0.6645) | (0.1070, 0.1821, 0.2428) |
| Transmission Shaft | (0.1364, 0.2497, 0.3434) | (0.7865, 0.7241, 0.5948) | (0.1073, 0.1808, 0.2043) |
| Drive Bearing | (0.2876, 0.3587, 0.4987) | (0.6245, 0.5102, 0.4112) | (0.1796, 0.1830, 0.2051 |
| Crosshead | (0.6159, 0.7301, 0.9000) | (0.6250, 0.4375, 0.2500) | (0.3849, 0.3115, 0.2230) |
| Guide Plate | (0.6059, 0.7119, 0.9020) | (0.6361, 0.4264, 0.2500) | (0.3854, 0.3036, 0.2255) |
| Pull Rod | (0.1148, 0.2225, 0.3945) | (0.6455, 0.4432, 0.2612) | (0.0741, 0.0986, 0.1030) |
| Cylinder Sealing Element | (0.6219, 0.7285, 0.9110) | (0.1254, 0.1025, 0.0250) | (0.0780, 0.0747, 0.0228) |
| Piston | (0.6124, 0.7052, 0.8831) | (0.6200, 0.5400, 0.4600) | (0.3797, 0.3808, 0.4062) |
| Seal Ring | (0.6320, 0.7171, 0.9012) | (0.2500, 0.2500, 0.2500) | (0.1580, 0.1793, 0.2253) |
| Cylinder Liner | (0.6146, 0.7009, 0.8612) | (0.5000, 0.5000, 0.5000) | (0.3073, 0.3504, 0.4306) |
| Piston Rod | (0.1154, 0.2114, 0.3930) | (0.6500, 0.5500, 0.5200) | (0.0750, 0.1163, 0.2044) |
| Suction Filter | (0.1575, 0.2245, 0.3945) | (0.6500, 0.5300, 0.4500) | (0.1024, 0.1190, 0.1775) |
| Valve Body | (0.3219, 0.4185, 0.5680) | (0.6227, 0.5724, 0.4300) | (0.2004, 0.2395, 0.2442) |
| Valve Spring | (0.4427, 0.5245, 0.6765) | (0.5000, 0.5000, 0.5000) | (0.2213, 0.2622, 0.3383) |
| Valve Assembly | (0.3112, 0.4024, 0.5245) | (0.4800, 0.4500, 0.4300) | (0.1494, 0.1811, 0.2255) |
| Valve Cover | (0.1857, 0.2872, 0.4022) | (0.5000, 0.5000, 0.5000) | (0.0929, 0.1436, 0.2011) |
| Valve Seal Ring | (0.5648, 0.6421, 0.7812) | (0.7854, 0.6245, 0.5378) | (0.4436, 0.4010, 0.4201) |
| Fourway Pipe | (0.0157, 0.0367, 0.0978) | (0.7743, 0.6356, 0.5378) | (0.0122, 0.0233, 0.052) |
| Pressure Gage Connector | (0.1246, 0.2124, 0.2987) | (0.6215, 0.4521, 0.2500) | (0.0774, 0.0960, 0.0747) |
| Export Filter | (0.1578, 0.2441, 0.3375) | (0.8021, 0.7524, 0.6521) | (0.1266, 0.1837, 0.2201) |
| Safety Valve | (0.1354, 0.2257, 0.3045) | (0.8541, 0.7998, 0.6845) | (0.1156, 0.1805, 0.2084) |
| High Pressure Pipeline | (0.0058, 0.0158, 0.0598) | (0.6326, 0.4410, 0.2500) | (0.0037, 0.0070, 0.015) |
| Seal Element | (0.1424, 0.2612, 0.3187) | (0.7854, 0.6245, 0.5378) | (0.1118, 0.1631, 0.1714) |
© 2017 by the authors. Licensee MDPI, Basel, Switzerland. This article is an open access article distributed under the terms and conditions of the Creative Commons Attribution (CC BY) license (http://creativecommons.org/licenses/by/4.0/).
Share and Cite
MDPI and ACS Style
Tang, Y.; Jing, J.; Zhang, Z.; Yang, Y. A Quantitative Risk Analysis Method for the High Hazard Mechanical System in Petroleum and Petrochemical Industry. Energies 2018, 11, 14. https://doi.org/10.3390/en11010014
AMA Style
Tang Y, Jing J, Zhang Z, Yang Y. A Quantitative Risk Analysis Method for the High Hazard Mechanical System in Petroleum and Petrochemical Industry. Energies. 2018; 11(1):14. https://doi.org/10.3390/en11010014
Chicago/Turabian StyleTang, Yang, Jiajia Jing, Zhidong Zhang, and Yan Yang. 2018. "A Quantitative Risk Analysis Method for the High Hazard Mechanical System in Petroleum and Petrochemical Industry" Energies 11, no. 1: 14. https://doi.org/10.3390/en11010014
Note that from the first issue of 2016, this journal uses article numbers instead of page numbers. See further details here.