Effect of Electrolyte Thickness on Electrochemical Reactions and Thermo-Fluidic Characteristics inside a SOFC Unit Cell

Abstract
:1. Introduction
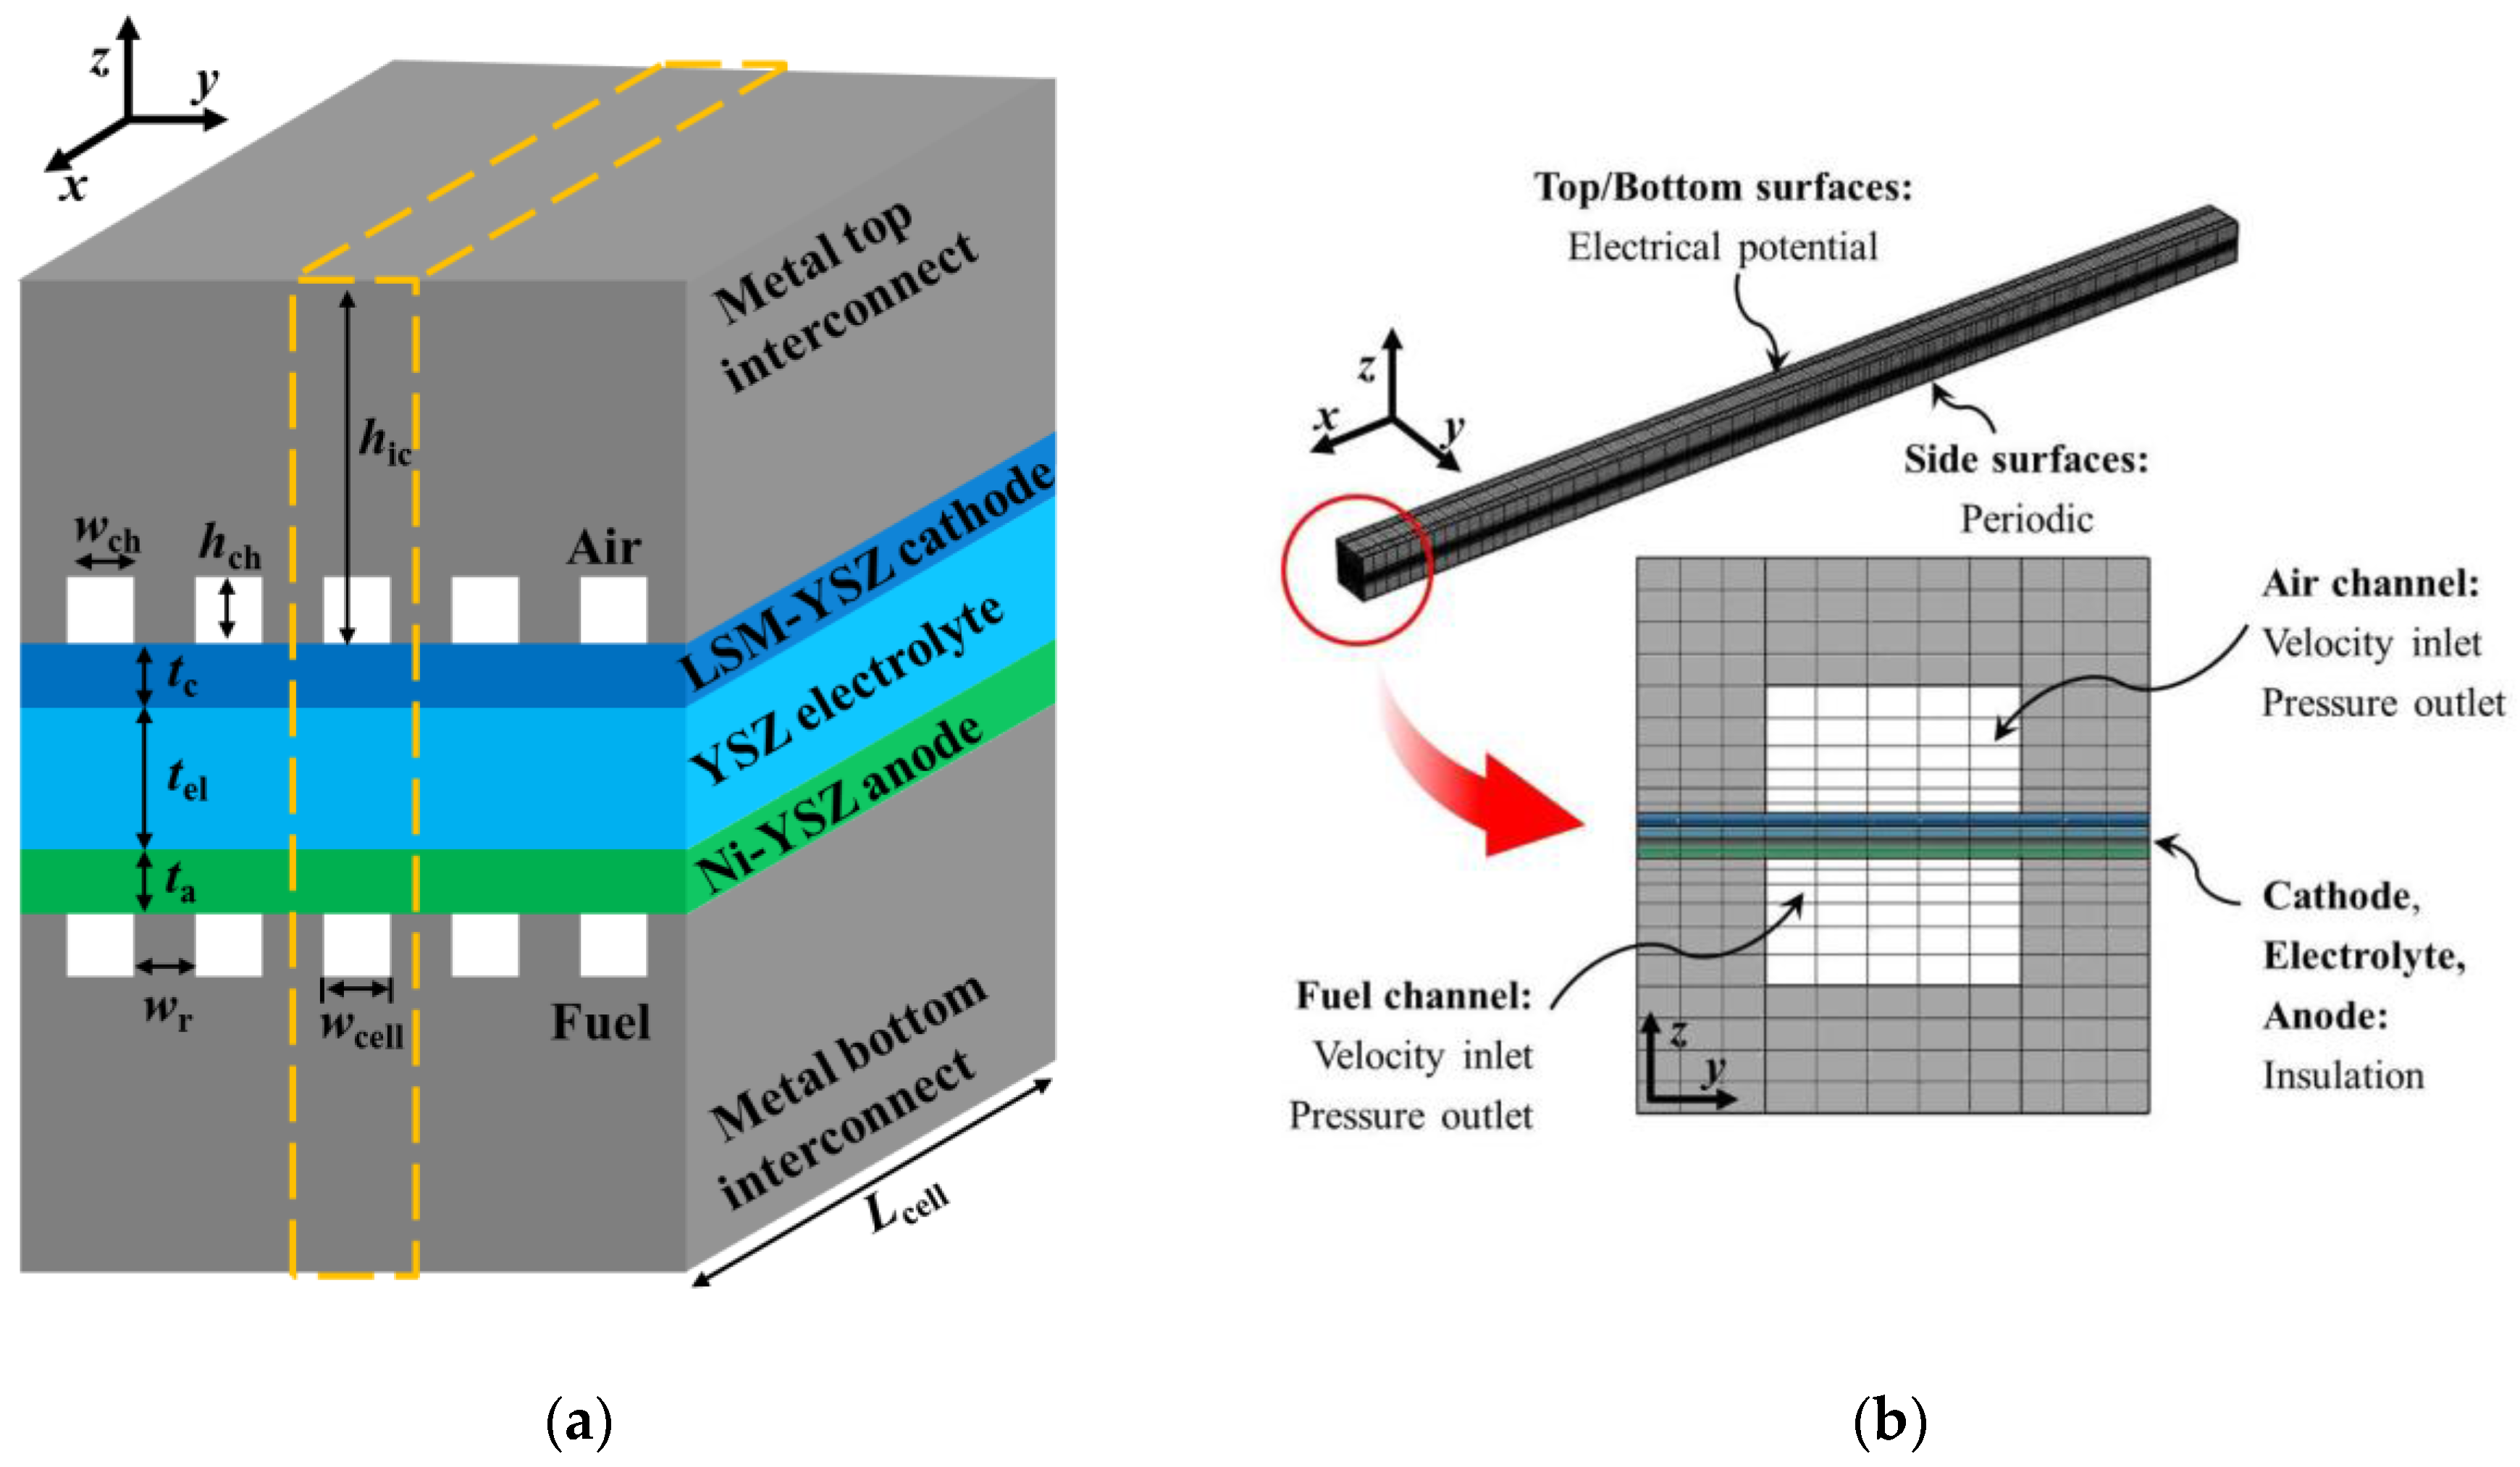
2. Model Geometry and Physics
2.1. Charge Conservation Equation
2.2. Mass and Momentum Conservation Equation
2.3. Species Conservation Equation
2.4. Energy Conservation Equation
2.5. Electrochemistry
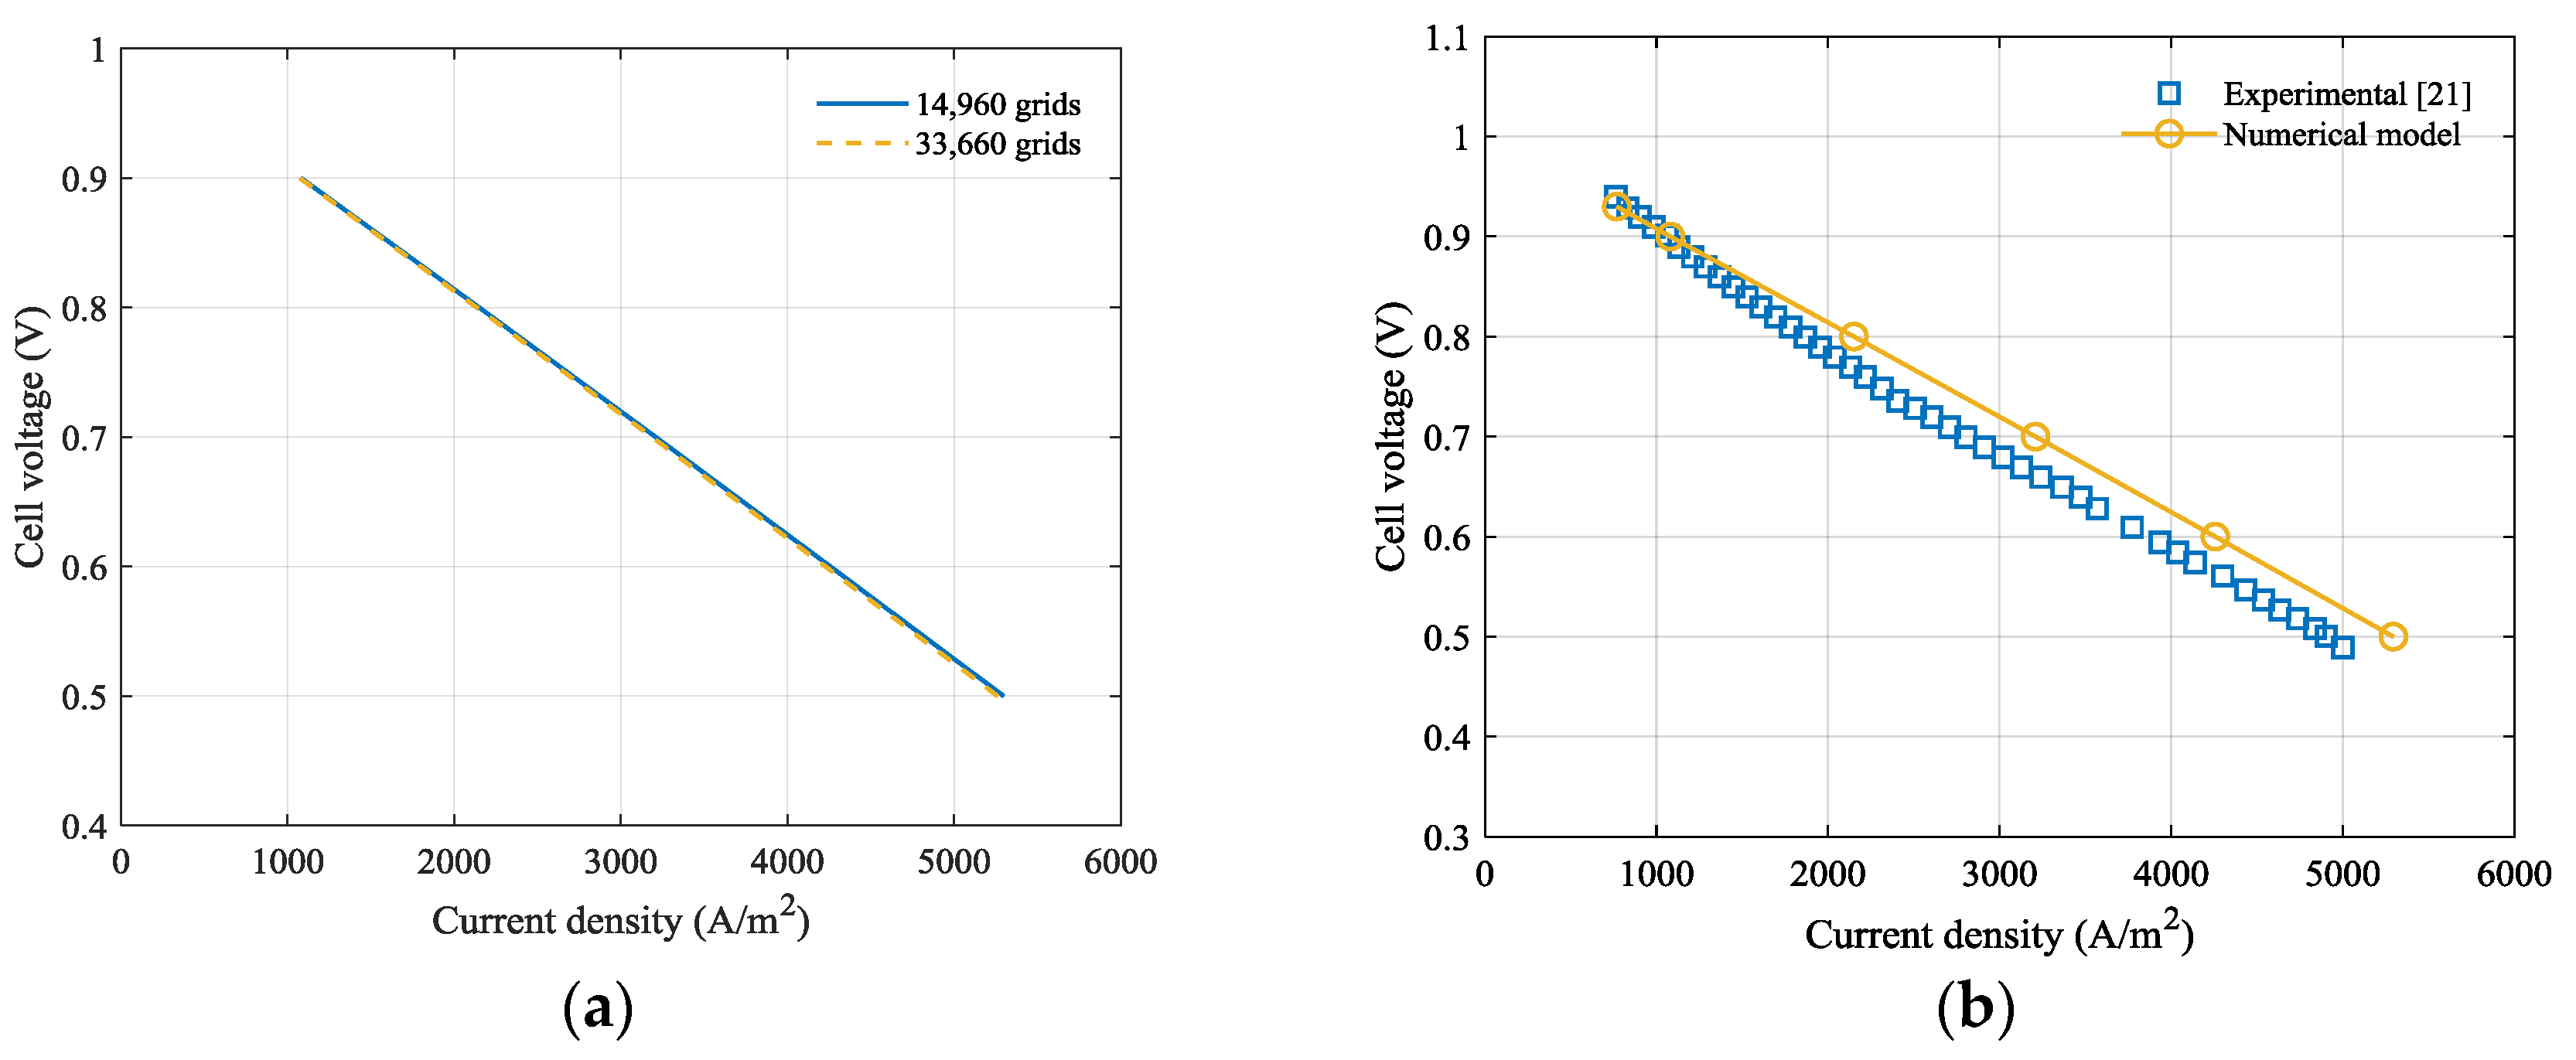
3. Numerical Details
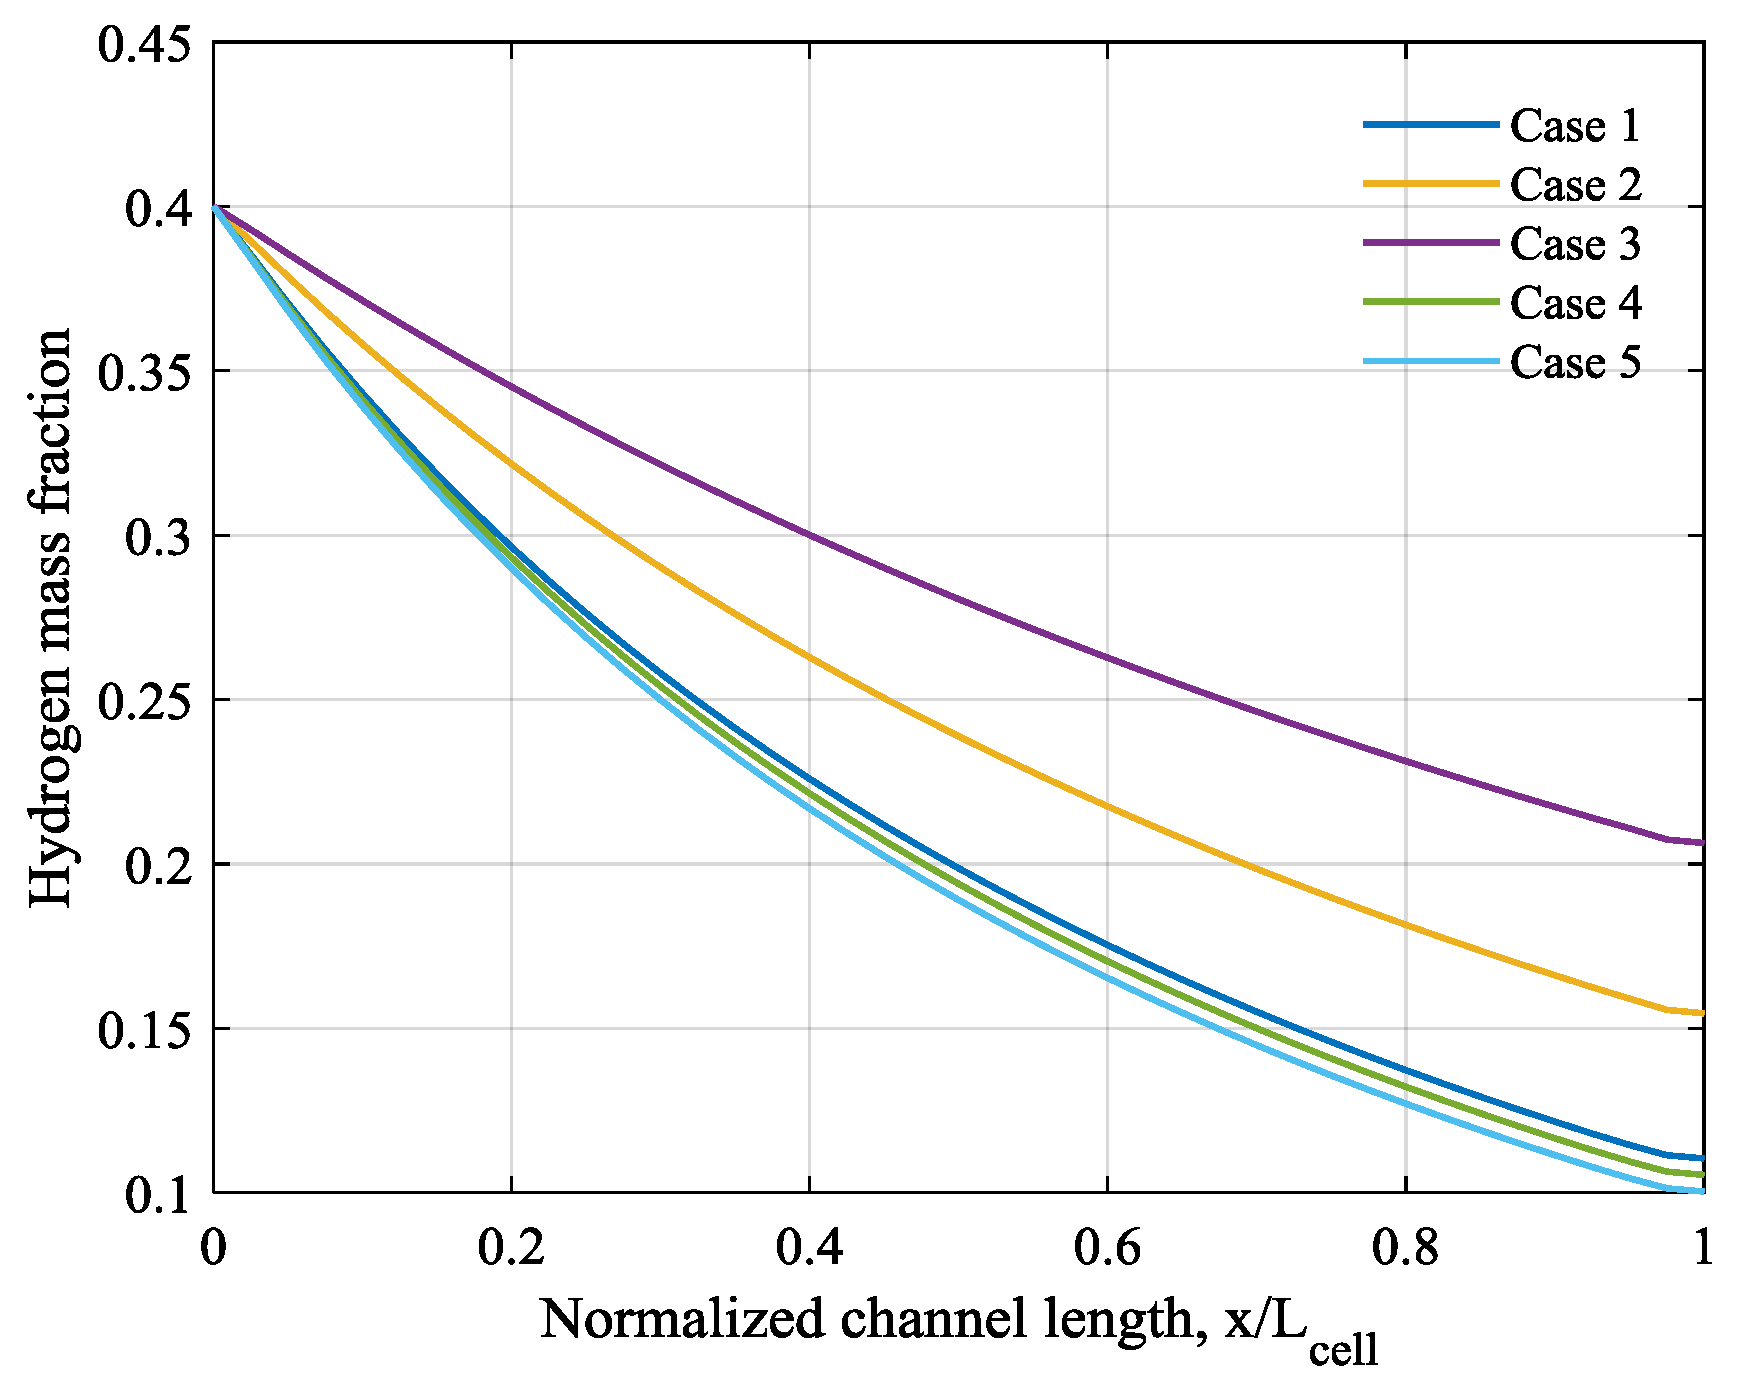
4. Results and Discussion
5. Conclusions
Acknowledgments
Author Contributions
Conflicts of Interest
References
- Evans, A.; Bieberle-Hutter, A.; Rupp, J.L.M.; Gauckler, L.J. Review on microfabricated micro-solid oxide fuel cell electrolytes. J. Power Sources 2009, 194, 119–129. [Google Scholar] [CrossRef]
- Oh, S.T.; Saha, B.B.; Kariya, K.; Hamamoto, Y.; Mori, H. Fuel cell waste heat powered adsorption cooling systems. Int. J. Air-Cond. Refrig. 2013, 21, 1350010. [Google Scholar] [CrossRef]
- Liu, K.Y.; Yun, Y.J.; Lee, S.H.; Su, P.C. Sputtered nanoporous PtNi thin film cathodes with improved thermal stability for low temperature solid oxide fuel cells. J. Power Sources 2009, 194, 119–129. [Google Scholar] [CrossRef]
- Muecke, U.P.; Beckel, D.; Bernard, A.; Bieberle-Hutter, A.; Graf, S.; Infortuna, A.; Muller, P.; Lupp, J.L.M.; Schneider, J.; Gauckler, L.J. Micro solid oxide fuel cells on glass ceramic substrates. Adv. Funct. Mater. 2008, 18, 3158–3168. [Google Scholar] [CrossRef]
- Jung, W.; Kim, J.J.; Tuller, H.L. Investigation of nanoporous platinum thin films fabricated by reactive sputtering: Application as micro-SOFC electrode. Electrochim. Acta 2017, 247, 558–563. [Google Scholar] [CrossRef]
- Hleig, J.; Tuller, H.L.; Maier, J. Electrodes and electrolytes in micro-SOFCs: A discussion of geometrical constraints. Solid State Ion. 2004, 174, 261–270. [Google Scholar]
- Huang, H.; Nakamura, M.; Su, P.; Fasching, R.; Saito, Y.; Frinz, F.B. High-performance ultrathin solid oxide fuel cells for low-temperature operation. J. Electrochem. Soc. 2007, 154, B20–B24. [Google Scholar] [CrossRef]
- Kong, W.; Gao, X.; Liu, S.; Su, S.; Chen, D. Optimization of the interconnect ribs for a cathode-supported solid oxide fuel cell. Energies 2014, 7, 295–313. [Google Scholar] [CrossRef]
- Dyer, C.K. Fuel cells for portable applications. J. Power Sources 2002, 106, 31–34. [Google Scholar] [CrossRef]
- Ugartemendia, J.; Ostolaza, J.X.; Zubia, I. Operating point optimization of a hydrogen fueled hybrid solid oxide fuel cell-steam turbine (SOFC-ST) plant. Energies 2013, 6, 5046–5068. [Google Scholar] [CrossRef]
- Liu, S.; Kong, W.; Lin, Z. A microscale modeling tool for the esign and optimization of solid oxide fuel cells. Energies 2009, 2, 427–444. [Google Scholar] [CrossRef]
- Hanna, J.; Lee, W.Y.; Shi, Y.; Ghoniem, A.F. Fundamentals of electro- and thermochemistry in the anode of solid oxide fuel cells with hydrocarbon and syngas fuels. Prog. Energy Combust. Sci. 2014, 40, 74–111. [Google Scholar] [CrossRef]
- Andersson, M.; Paradis, H.; Yuan, J.; Sunden, B. Three dimensional modeling of a solid oxide fuel cell coupling charge transfer phenomena with transport processes and heat generation. Electrochim. Acta 2013, 109, 881–893. [Google Scholar] [CrossRef]
- Akhtar, N.; Decent, S.P.; Kendall, K. Numerical modeling of methane-powered micro-tubular, single-chamber solid oxide fuel cell. J. Power Sources 2010, 195, 7796–7807. [Google Scholar] [CrossRef]
- Andersson, M.; Yuan, J.; Sunden, B. SOFC cell design optimization using the finite element method based CFD approach. Fuel Cells 2014, 14, 177–188. [Google Scholar] [CrossRef]
- Lee, S.; Kim, H.; Yoon, K.J.; Son, J.W.; Lee, J.H.; Kim, B.K.; Choi, W.; Hong, J. The effect of fuel utilization on heat and mass transfer within solid oxide fuel cells examined by three-dimensional numerical simulations. Int. J. Heat Mass Transf. 2016, 97, 77–93. [Google Scholar] [CrossRef]
- Shi, Y.; Cai, N.; Li, C. Numerical modeling of an anode-supported SOFC button cell considering anodic surface diffusion. J. Power Sources 2007, 164, 639–648. [Google Scholar] [CrossRef]
- Jeon, D.H. A comprehensive CFD model of anode-supported solid oxide fuel cells. Electrochim. Acta 2009, 54, 2727–2736. [Google Scholar] [CrossRef]
- Shi, J.; Xue, X. CFD analysis of a novel symmetrical planar SOFC design with micro-flow channels. Chem. Eng. J. 2010, 163, 119–125. [Google Scholar] [CrossRef]
- He, Z.; Li, H.; Birgersson, E. Reduced model for the planar solid oxide fuel cell. Comput. Chem. Eng. 2013, 52, 155–167. [Google Scholar] [CrossRef]
- Raj, A.; Sasmito, A.P.; Shamim, T. Numerical investigation of the effect of operating parameters on a planar solid oxide fuel cell. Energy. Convers. Manag. 2015, 90, 138–145. [Google Scholar] [CrossRef]
- Damm, D.L.; Fedorov, A.G. Radiation heat transfer in SOFC materials and components. J. Power Sources 2005, 143, 158–165. [Google Scholar] [CrossRef]
- Mejri, I.; Mahmoudi, A.; Abbassi, M.A.; Omri, A. Radiation Heat Transfer Effect in Solid Oxide Fuel Cell: Application of the Lattice Boltzmann Method. Int. J. Phys. Math. Sci. 2014, 8, 642–646. [Google Scholar]
- Lee, S.; Park, M.; Kim, H.; Yoon, K.J.; Son, J.W.; Lee, J.H.; Kim, B.K.; Choi, W.; Hong, J. Thermal conditions and heat transfer characteristics of high-temperature solid oxide fuel cells investigated by three-dimensional numerical simulations. Energy 2017, 120, 293–305. [Google Scholar] [CrossRef]
- Ferguson, J.R.; Fiard, J.M.; Herbin, R. Three-dimensional numerical simulation for various geometries of solid oxide fuel cells. J. Power Sources 1996, 58, 109–122. [Google Scholar] [CrossRef]
- He, Z.; Brigersson, E.; Li, H. Reduced non-isothermal model for the planar sold oxide fuel cell and stack. Energy 2014, 70, 478–492. [Google Scholar] [CrossRef]
- Current Density Distribution in Solid Oxide Fuel Cell. COMSOL Multiphysics Tutorial Guide. Available online: https://cn.comsol.com/model/current-density-distribution-in-a-solid-oxide-fuel-cell-514 (accessed on 24 February 2018).
- Janardhanan, V.M.; Deutschmann, O. CFD analysis of a solid oxide fuel cell with internal reforming coupled interactions of transport, heterogeneous catalysis and electrochemical processes. J. Power Sources 2006, 162, 1192–1202. [Google Scholar] [CrossRef]
- Khazaee, I.; Rava, A. Numerical simulation of the performance of solid oxide fuel cell with different flow channel geometries. Energy 2017, 119, 235–244. [Google Scholar] [CrossRef]
- Akhtar, N.; Decent, S.P.; Loghin, D.; Kendall, K. A three-dimensional numerical model of a single-chamber solid oxide fuel cell. Int. J. Hydrogen Energy. 2009, 34, 8645–8663. [Google Scholar] [CrossRef]
- Borgnakke, C.; Sonntag, R.E. Thermodynamic and Transport Properties; Wiley: New York, NY, USA, 1997. [Google Scholar]
- Todd, B.; Young, J.B. Thermodynamic and transport properties of gases for use in solid oxide fuel cell modeling. J. Power Sources 2002, 110, 186–200. [Google Scholar] [CrossRef]
- Janardhanan, V.M.; Heuveline, V.; Deutchmann, O. Performance analysis of a SOFC under direct internal reforming conditions. J. Power Sources 2007, 172, 296–307. [Google Scholar] [CrossRef]
- Andersson, M.; Yuan, J.; Sunden, B. SOFC modeling considering electrochemical reactions at the active three phase boundaries. Int. J. Heat Mass Transf. 2012, 55, 773–788. [Google Scholar] [CrossRef]
- Zhao, F.; Virkar, A.V. Dependence of polarization in anode-supported solid oxide fuel cells on various cell parameters. J. Power Sources 2005, 141, 79–95. [Google Scholar] [CrossRef]
- Barzi, Y.M.; Raoufi, A.; Lari, H. Performance analysis of a SOFC button cell using a CFD model. Int. J. Hydrogen Energy 2010, 35, 9468–9478. [Google Scholar] [CrossRef]
- Kaur, G. Solid Oxide Fuel Cell Components; Springer International Publishing: Cham, Switzerland, 2016; pp. 43–78. ISBN 978-3-319-25598-9. [Google Scholar]
- Nakajo, A.; Mueller, F.; Brouwer, J.; Van Herle, J.; Favrat, D. Progressive activation of degradation processes in solid oxide fuel cell stacks: Part II: Spatial distribution of the degradation. J. Power Sources 2012, 216, 434–448. [Google Scholar] [CrossRef]


| Description | Symbol | Value (mm) |
|---|---|---|
| Gas channel width | wch | 2 |
| Anode thickness | ta | 0.15 |
| Cathode thickness | tc | 0.1 |
| Electrolyte thickness | tel | 0.1 |
| Gas channel height | hch | 1 |
| Cell width | wcell | 4 |
| Interconnect height | hic | 2 |
| Cell length | Lcell | 100 |
| Description | Conditions | Value (unit) |
|---|---|---|
| Top interconnect | Electric potential | 0.5 (V) |
| Bottom interconnect | Electric ground | 0 (V) |
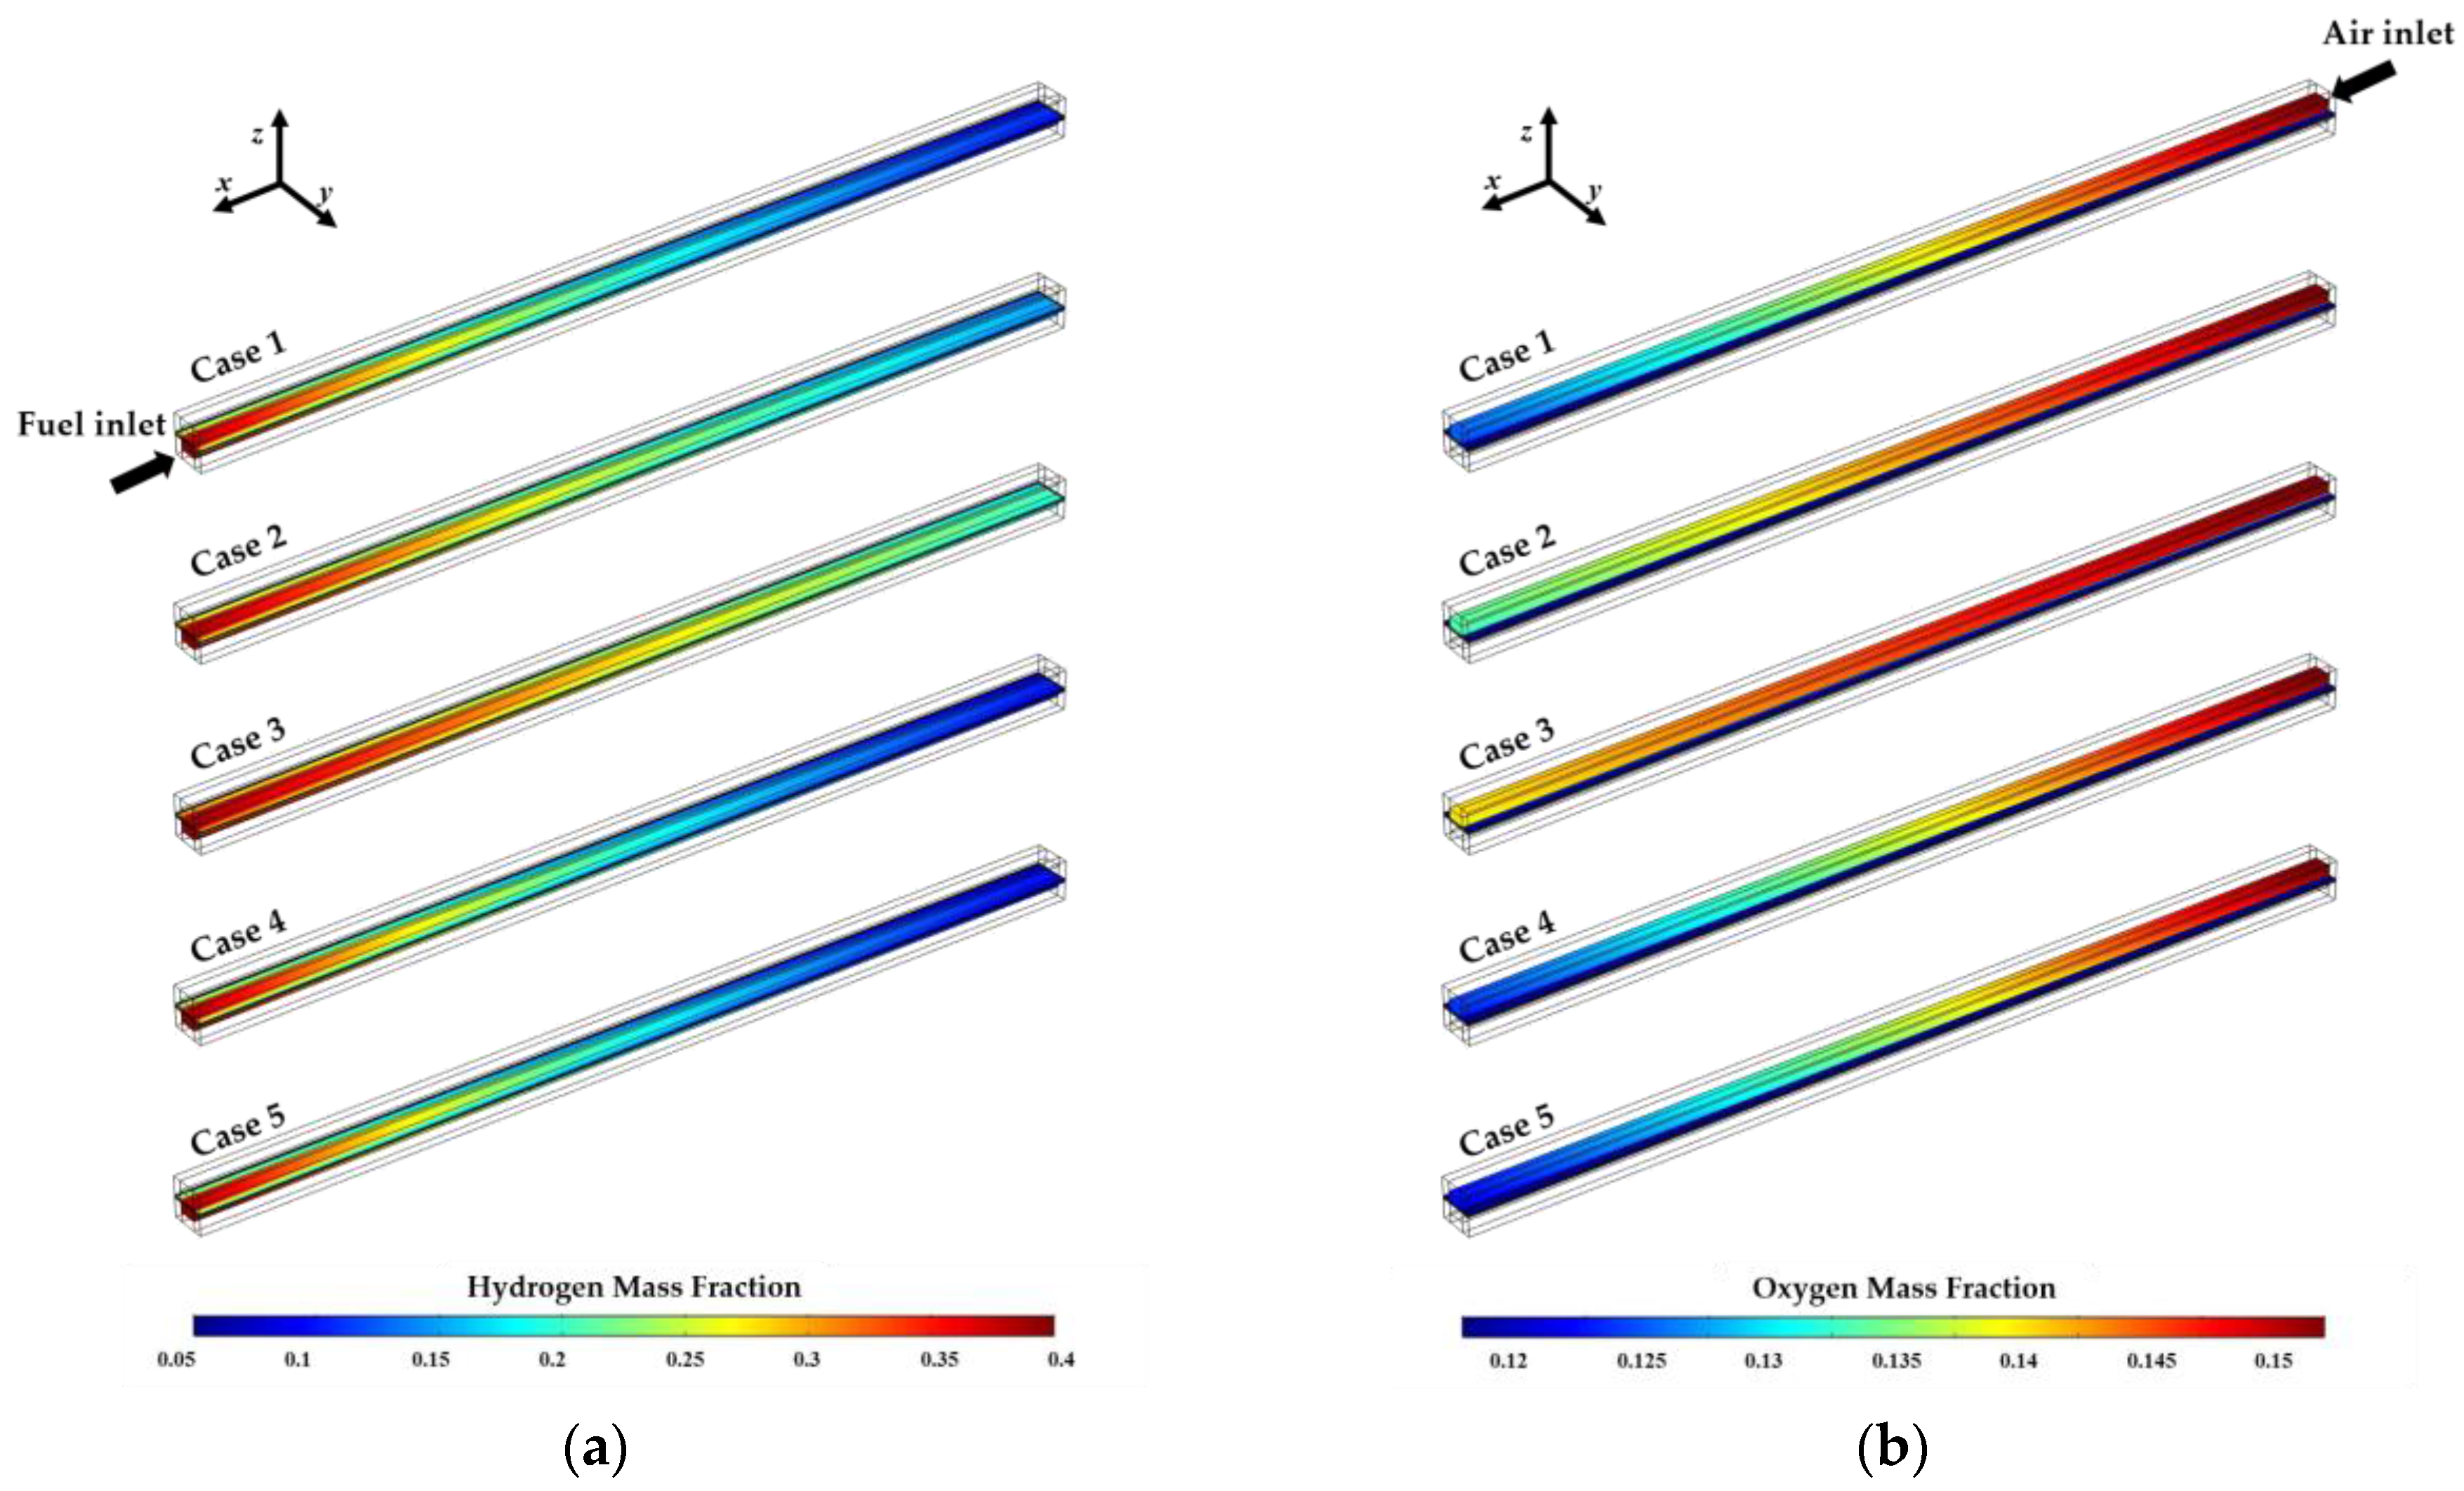
| Air inlet | Velocity Mass fraction Temperature | 3 (m/s) O2:N2 = 0.15:0.85 700, 750, 800 (°C) |
| Air outlet | Pressure (gauge) | 0 (Pa) |
| Fuel inlet | Velocity Mass fraction Temperature | 0.4 (m/s) H2:H2O = 0.4:0.6 700, 750, 800 (°C) |
| Fuel outlet | Pressure (gauge) | 0 (Pa) |
| Description | Symbol | Value (unit) | References |
|---|---|---|---|
| Ionic conductivity, electrolyte | σel | 2.2669 (S/m) | [25] |
| Electronic conductivity, anode | σa | 2149.2 (S/m) | [25] |
| Electronic conductivity, cathode | σc | 5093 (S/m) | [25] |
| Electronic conductivity, interconnect | σic | 310.93 (S/m) | [25] |
| Exchange current density, anode | i0,a | 4637.4 (A/m2) | [29] |
| Exchange current density, cathode | i0,c | 1166.2 (A/m2) | [29] |
| Specific surface area, anode | Sa,a | 102,500 (1/m) | [30] |
| Specific surface area, cathode | Sa,c | 102,500 (1/m) | [30] |
| Equilibrium voltage, anode | Eeq,a | 0 (V) | [27] |
| Equilibrium voltage, cathode | Eeq,c | 1 (V) | [27] |
| Anodic transfer coefficient, anode | 2 | [26] | |
| Cathodic transfer coefficient, anode | 1.5 | [26] | |
| Anodic transfer coefficient, cathode | 1 | [26] | |
| Cathodic transfer coefficient, cathode | 0.5 | [26] | |
| Activation energy, anode | Ea | 140 (kJ/mol) | [29] |
| Activation energy, cathode | Ec | 137 (kJ/mol) | [29] |
| Pre-exponential factor, anode | Aa | 6.54 × 10¹¹ | [29] |
| Pre-exponential factor, cathode | Ac | 2.35 × 10¹¹ | [29] |
| Description | Symbol | Value (unit] | References |
|---|---|---|---|
| Reference diffusivity | 3.16 × 10⁻⁸ (m2/s) | [31] | |
| Mixture averaged diffusivity, O2 | 1.9235 × 10⁻⁴ (m2/s) | [31] | |
| Mixture averaged diffusivity, N2 | 1.9235 × 10⁻⁴ (m2/s) | [31] | |
| Mixture averaged diffusivity, H2 | 8.1794 × 10⁻⁴ (m2/s) | [31] | |
| Mixture averaged diffusivity, H2O | 8.1794 × 10⁻⁴ (m2/s) | [31] | |
| Effective diffusivity, O2 | 1.2018 × 10⁻⁵ (m2/s) | [31] | |
| Effective diffusivity, N2 | 1.2342 × 10⁻⁵ (m2/s) | [31] | |
| Effective diffusivity, H2 | 4.9825 × 10⁻⁵ (m2/s) | [31] | |
| Effective diffusivity, H2O | 2.7041 × 10⁻⁵ (m2/s) | [31] | |
| Porosity, anode | εa | 0.4 | [29] |
| Porosity, cathode | εc | 0.4 | [29] |
| Permeability, anode | κa | 1.76 × 10⁻¹¹ (m2) | [29] |
| Permeability, cathode | κc | 1.76 × 10⁻¹¹ (m2) | [29] |
| Description | Symbol | Value (unit] | References |
|---|---|---|---|
| Viscosity, air | μair | 4.4574 × 10⁻⁵ (Pa·s) | [32] |
| Viscosity, fuel | μfuel | 2.4320 × 10⁻⁵ (Pa·s) | [26] |
| Solid density, interconnect | ρic | 3030 (kg/m3) | [33] |
| Solid density, anode | ρa | 3310 (kg/m3) | [33] |
| Solid density, cathode | ρc | 3030 (kg/m3) | [33] |
| Solid density, electrolyte | ρel | 5160 (kg/m3) | [33] |
| Specific gas constant, air | Rair | 0.2870 (kJ/kg·K) | [31] |
| Specific gas constant, fuel | Rfuel | 4.1240 (kJ/kg·K) | [31] |
| Universal gas constant | R | 8.3144 (J/mol·K) | [31] |
| Tortuosity, anode | τa | 3.8 | [28] |
| Tortuosity, cathode | τc | 3.8 | [28] |
| Pore size, anode | rpore,a | 5 × 10⁻⁷ (m) | [26] |
| Pore size, cathode | rpore,c | 5 × 10⁻⁷ (m) | [26] |
| Description | Symbol | Value (unit) | References |
|---|---|---|---|
| Solid thermal conductivity, interconnect | kic | 20 (W/m·K) | [34] |
| Solid thermal conductivity, anode | ka | 11 (W/m·K) | [34] |
| Solid thermal conductivity, cathode | kc | 6 (W/m·K) | [34] |
| Solid thermal conductivity, electrolyte | kel | 2.7 (W/m·K) | [34] |
| Fluid thermal conductivity, air | kair | 0.07406 (W/m·K) | [30] |
| Fluid thermal conductivity, fuel | kfuel | 0.40514 (W/m·K) | [30] |
| Solid heat capacity, interconnect | Cp,ic | 550 (J/kg·K) | [29] |
| Solid heat capacity, anode | Cp,a | 450 (J/kg·K) | [29] |
| Solid heat capacity, cathode | Cp,c | 430 (J/kg·K) | [29] |
| Solid heat capacity, electrolyte | Cp,el | 470 (J/kg·K) | [29] |
| Fluid heat capacity, air | Cp,air | 1171.3 (J/kg·K) | [30] |
| Fluid heat capacity, fuel | Cp,fuel | 13410 (J/kg·K) | [30] |
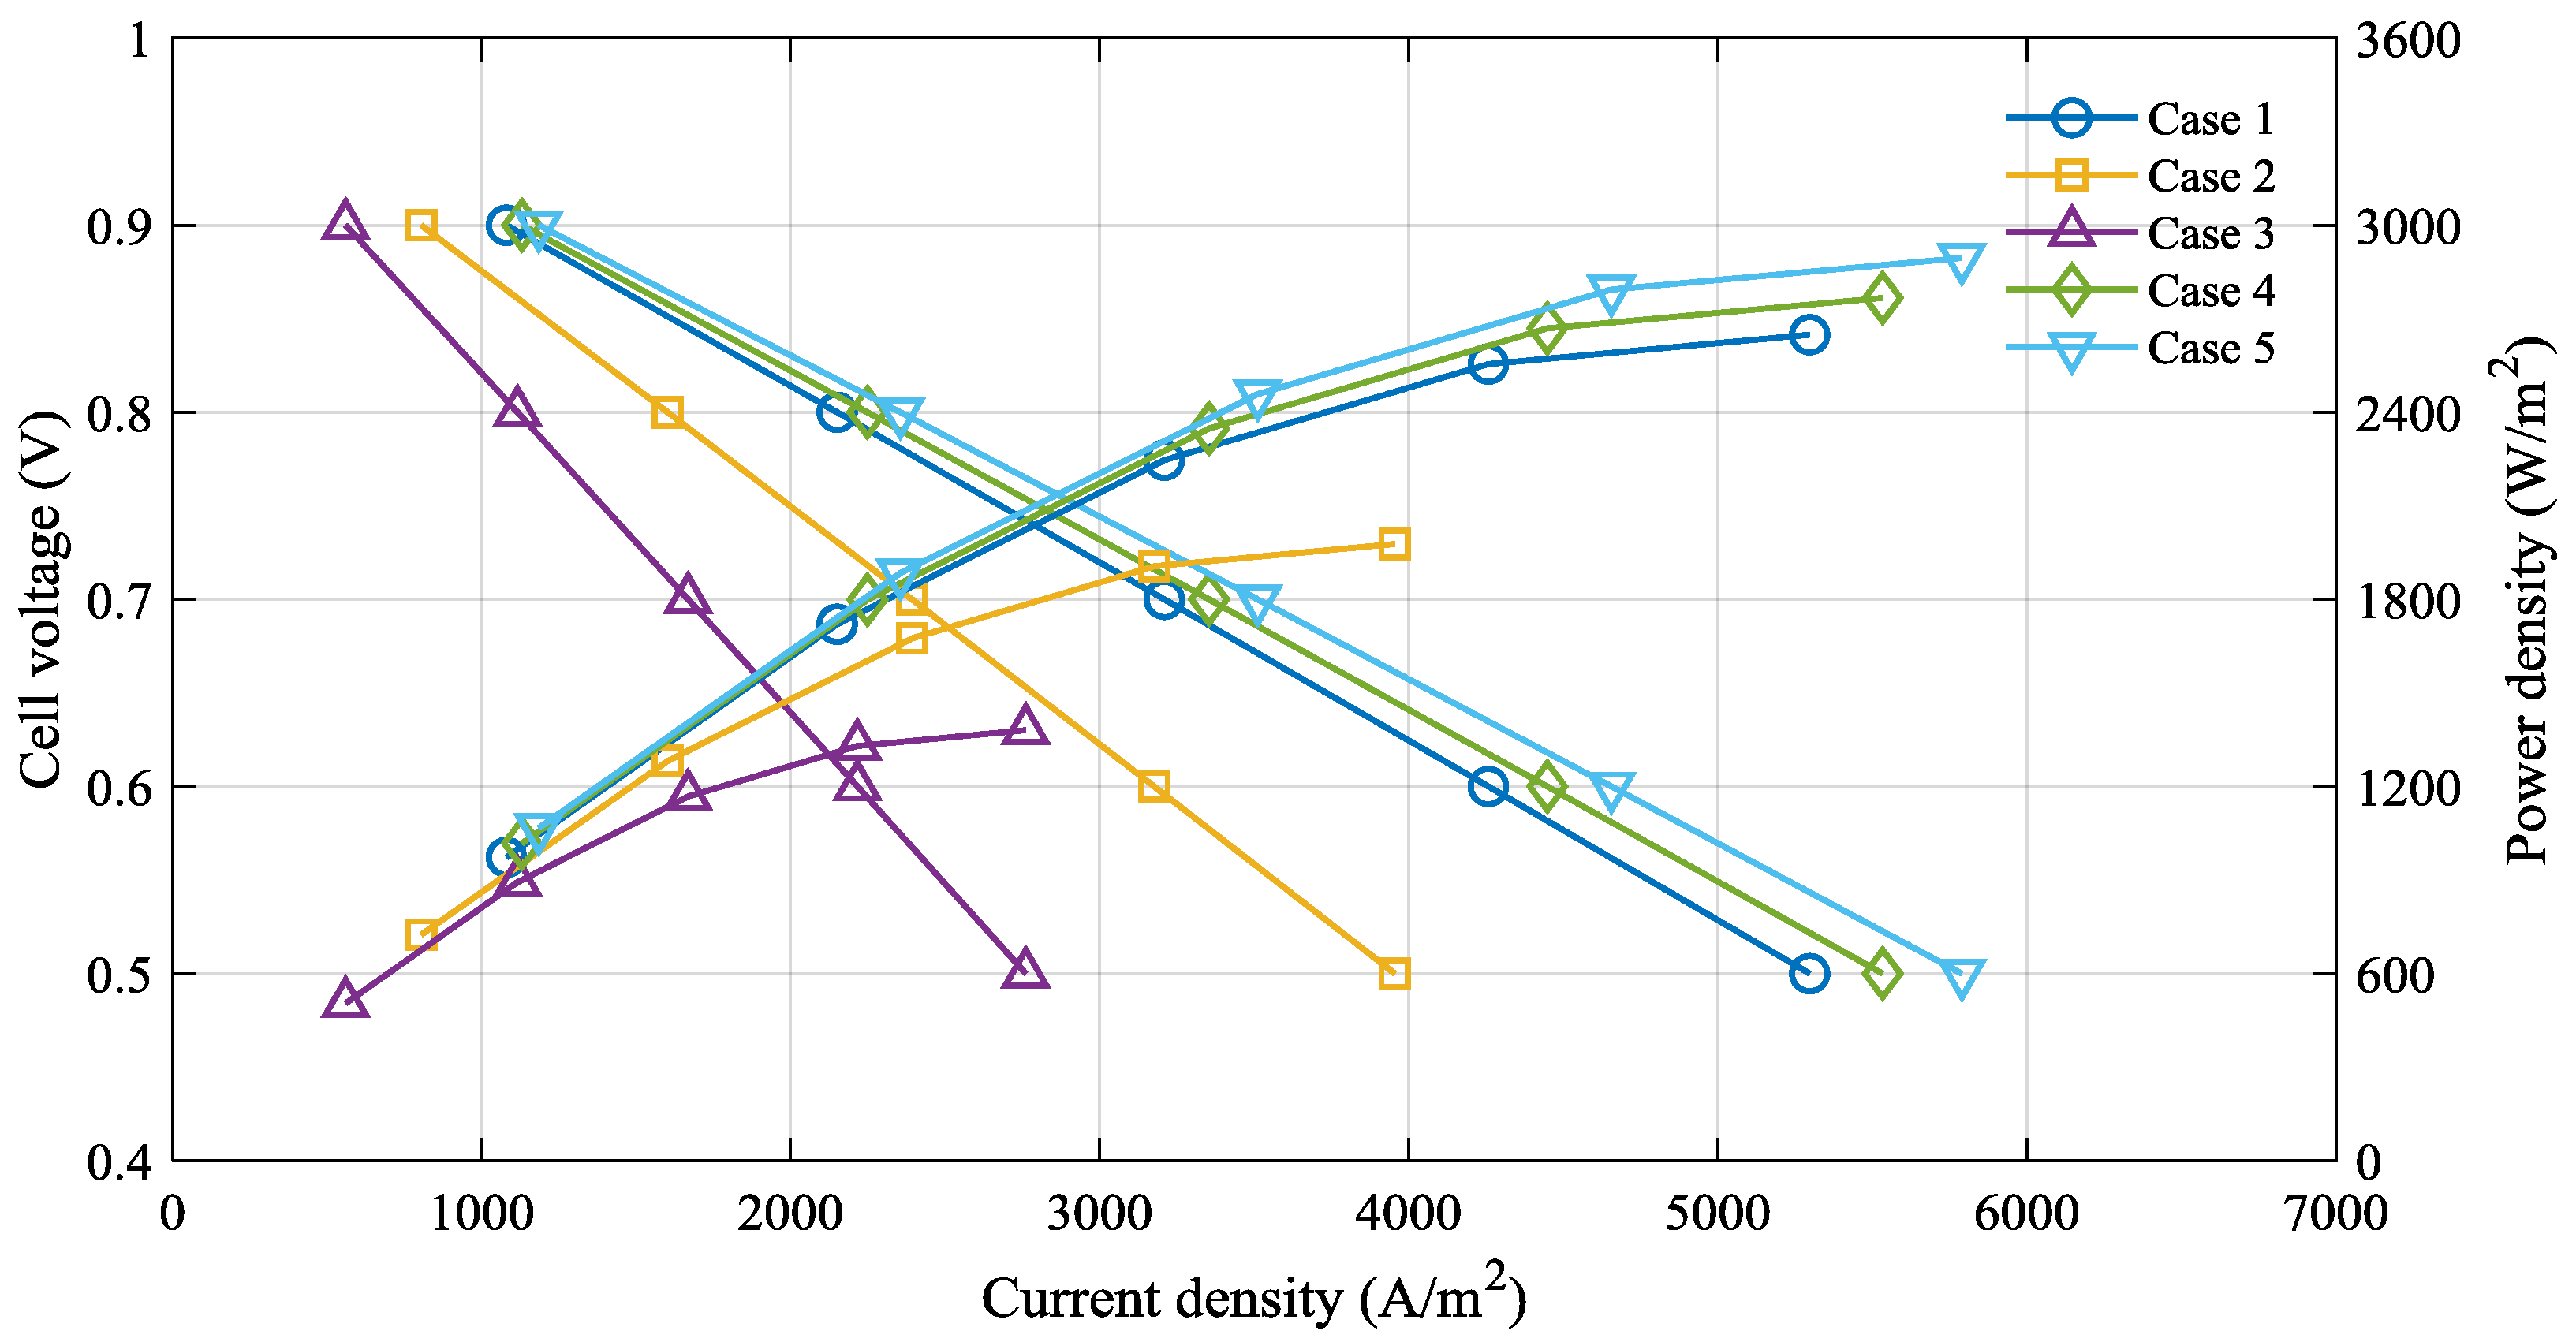
| Case | Electrolyte Thickness (μm) | Operating Temperature (°C) |
|---|---|---|
| 1 | 100 | 800 |
| 2 | 100 | 750 |
| 3 | 100 | 700 |
| 4 | 90 | 800 |
| 5 | 80 | 800 |
© 2018 by the authors. Licensee MDPI, Basel, Switzerland. This article is an open access article distributed under the terms and conditions of the Creative Commons Attribution (CC BY) license (http://creativecommons.org/licenses/by/4.0/).
Share and Cite
Park, J.M.; Kim, D.Y.; Baek, J.D.; Yoon, Y.-J.; Su, P.-C.; Lee, S.H. Effect of Electrolyte Thickness on Electrochemical Reactions and Thermo-Fluidic Characteristics inside a SOFC Unit Cell. Energies 2018, 11, 473. https://doi.org/10.3390/en11030473
Park JM, Kim DY, Baek JD, Yoon Y-J, Su P-C, Lee SH. Effect of Electrolyte Thickness on Electrochemical Reactions and Thermo-Fluidic Characteristics inside a SOFC Unit Cell. Energies. 2018; 11(3):473. https://doi.org/10.3390/en11030473
Chicago/Turabian StylePark, Jee Min, Dae Yun Kim, Jong Dae Baek, Yong-Jin Yoon, Pei-Chen Su, and Seong Hyuk Lee. 2018. "Effect of Electrolyte Thickness on Electrochemical Reactions and Thermo-Fluidic Characteristics inside a SOFC Unit Cell" Energies 11, no. 3: 473. https://doi.org/10.3390/en11030473