Flow Control over the Blunt Trailing Edge of Wind Turbine Airfoils Using Circulation Control

1
School of Aeronautics, Northwestern Polytechnical University, Xi’an 710072, China
2
Research & Development Institute of Northwestern Polytechnical University in Shenzhen, Shenzhen 518057, China
*
Author to whom correspondence should be addressed.
Energies 2018, 11(3), 619; https://doi.org/10.3390/en11030619
Submission received: 16 February 2018
/
Revised: 4 March 2018
/
Accepted: 8 March 2018
/
Published: 10 March 2018
(This article belongs to the Collection Wind Turbines)
Abstract
:A new partial circulation control (PCC) method is implemented on the blunt trailing edge DU97-Flatback airfoil, and compared with the traditional full circulation control (FCC) based on numerical analysis. When the Coanda jet is deactivated, PCC has an attractive advantage over FCC, since the design of PCC doesn’t degrade aerodynamic characteristics of the baseline flatback section, in contrast to FCC, which is important in practical use in case of failure of the circulation control system. When the Coanda jet is activated, PCC also outperforms FCC in several respects. PCC can produce much higher lift coefficients than FCC over the entire range of angles of attack as well as the entire range of jet momentum coefficients under investigation, but with slightly higher drag coefficients. The flow field of PCC is less complex than that of FCC, indicating less energy dissipation in the main flow and hence less power expenditure for the Coanda jet. The aerodynamic figure of merit (AFM) and control efficiency for circulation control are defined, and results show that PCC has much higher AFM and control efficiency than FCC. It is demonstrated that PCC outperforms FCC in terms of effectiveness, efficiency and reliability for flow control in the blunt trailing edge wind turbine application.
1. Introduction
The world’s ever-growing energy demand posts a huge challenge for humans in the context of gradual depletion of fossil-fuel reserves. The serious energy crisis and stricter environmental regulations have prompted people and governments around the world to make great efforts to develop wind energy which is one of the most promising and fastest growing clean renewable energy forms due to its wide availability [1]. Advanced horizontal axis wind turbines (HAWTs) with ever-larger sizes and excellent aerodynamic characteristics are designed aiming to reduce the cost of energy and keep wind energy economically competitive with traditional and other renewable energy sources. Larger turbines are desirable because the cost of energy can be reduced by increasing the lifetime power output which is proportional to the swept area of the rotor disk [2]. As the rotor blade size grows, the blade mass increases at approximately the cube of the blade length, leading to a rapid increase of gravitational loading. In addition, the aerodynamic loads on the blade increases with approximately the square of the blade length, producing ever larger thrust perpendicular to the rotational plane. As the loads on the HAWT result from the added contributions of each airfoil along the blade, the gravitational and aerodynamic load distributions on the blades induces concerns in the blade structure, the most important of which is the flap-wise bending moment and the chord-wise torsion moment along the blade, which is rather severe in the inboard region [3]. Demand for wyas of addressing this structural concern gives rise to the need for thick airfoils in the inboard region of the large wind turbine, since thick airfoils could enhance structural strength. However, traditional thick airfoils with sharp trailing edges tend to have relatively poor aerodynamic performance characteristics. In particular, the lift characteristics of the traditional sharp trailing edge thick airfoil is sensitive to flow transition due to surface contamination and strong adverse pressure gradient on the upper surface, leading to reduction of lift curve slope and maximum lift coefficient. These negative effects are detrimental to wind turbine power output [4].
Flatback airfoils with blunt trailing edges have been proposed to improve the aerodynamic performance characteristics of traditional sharp trailing edge thick airfoils in the inboard region of large wind turbines. A flatback airfoil is usually created by symmetrically adding thickness to either side of the camber line of a traditional sharp trailing edge thick airfoil after the maximum thickness location. This adding of thickness method can preserve the important geometric aspects of airfoils, such as the nose geometry, airfoil thickness and camber, while providing a blunt trailing edge with desired bluntness [5]. Compared with the sharp trailing edge airfoils with the same thickness, flatback profiles are less demanding in terms of pressure recovery and hence have better stall characteristics, leading to reduction of leading-edge roughness sensitivity [6]. As a result, flatback airfoils can increase the maximum lift as well as the lift curve slope [6]. Moreover, flatback profiles have larger cross-sectional area and better structural characteristics, due to the added thickness. Lee et al. [7] designed digital models of three-dimensional blades with different levels of blunt trailing-edge thickness by modifying the inboard portion of the original NREL Phase VI blade [8], and obtained numerical aerodynamic characteristics at various wind speeds, demonstrating that generally the blunt trailing edge airfoil could alleviate structural and manufacturing constraints while increasing the blade’s power performance. Therefore, the incorporation of blunt trailing edge airfoils would allow blade designers to more freely address the structural demands without having to sacrifice aerodynamic performance.
Through implementation of flatback airfoils, the structural and aerodynamic issues associated with large wind turbines have been mitigated. However, efforts remain to be made to further enhance the aerodynamic performance characteristics. The inboard region for flatback airfoils might account for up to 40% of the whole blade [7,9], and the enhancement of aerodynamic characteristics will definitely increase the power output and hence decrease the cost of energy. Flow control is recognized as an effective method to improve the blade’s aerodynamic characteristics, and has been widely investigated for decades [3]. For flow control on flatback wind turbine airfoils, most current efforts focus on reducing drag by passive-steady flow control methods. The significant base drag is an inherent penalty of flatback airfoils, which is mainly due to bluff-body vortex shedding and the resulting drop in pressure behind the blunt trailing edge. Numerical and experimental studies on flatback airfoils [10,11,12] have shown that devices such as a simple splitter, a base cavity, or an offset cavity can reduce drag by up to 50%. Other control methods and devices were also proven to be effective, such as a slotted cavity [13], a ventilated cavity [13], splitter wedges [14], serrated trailing edges [14,15], a stepped afterbody [16], and so on. However, it is noted that the drag reduction devices also reduce the lift under certain circumstances. For example, when the splitter plate is parallel to the chord and extends downstream of the flatback trailing edge, the effective camber of the airfoil will be reduced, resulting in a lower lift coefficient. In contrast to the above drag-reduction-based method, Nikoueeyan et al. [17] conducted an experimental research aiming to control the lift of the flatback airfoil rather than the base drag by using a Gurney flap. Compared to the baseline flatback airfoil, the Gurney flap mounted on the pressure side with a height of 5% chord length can significantly increase the lift coefficient by about 38–41%. They also tested Gurney flaps with different heights on either the pressure side or the suction side, showing effective control on the lift and moment over the entire range of angles of attack up to stall. However, it is expected that the drag will increase substantially due to the obvious increase in bluntness of the trailing edge with a Gurney flap, although the drag data was not reported in their work.
To the best of current authors’ knowledge, research of active flow control of flatback wind turbine airfoils is rare. Some active flow control studies based on plasma actuators were conducted on some general blunt or round trailing edge profiles [18,19,20], demonstrating that the actuator can enhance the mixing of the wake near the trailing edge, but only limited enhancement in aerodynamic performance was achieved. Recently, the current authors, Xu et al. [21], proposed an effective and efficient active control technique for the flatback wind turbine airfoil using circulation control (CC). The blunt trailing edge of a DU97-flatback airfoil [22] is locally modified to a round shape with a pair of small steps on the suction side as well as the pressure side. A jet slot is designed at the upper step perpendicular to the circular surface. CC relies on the Coanda effect [23] and is implemented by tangentially blowing a small high velocity jet over the circular Coanda surface. It was found that CC not only significantly increases the lift by enhancing the circulation, but also greatly reduces the base drag by eliminating the wake vortex, indicating a promising active flow control technique in the application of large wind turbines with blunt trailing edge airfoils. However, it was also found that the modified round trailing edge airfoil undergoes significant degradation in the lift characteristics due to the modification when CC is deactivated, compared with its baseline flatback airfoil. This poses a problem for practical use. Active control techniques are generally designed to enable high performance under off-design conditions. Under the conditions of the design operation point or a failure the active flow control system may encounter, the wind turbine will operate normally without control activated. An ideal active control technique should at least maintain the aerodynamic performance comparable to the baseline flatback airfoil. Therefore, efforts are still needed to make to improve the previously proposed CC technique.
In the present study, an improved CC scheme is proposed for the flatback wind turbine airfoil. It is designed on the basis of the previous one [21]. This new design involves less modification to the baseline trailing edge, but provides significant improvements in the lift characteristics. The objective of the present study is to make a comprehensive comparison between the newly proposed CC technique and the previous one using computational fluid dynamics (CFD). This study is organized as follows: Section 2 describes the detailed design of the modified CC airfoils. Section 3 provides methodologies including CFD methods, implementation of CC, aerodynamic characteristics analysis method and a newly defined aerodynamic figure of merit. Section 4 addresses the validation of the present CFD code. Section 5 presents the results and discussions. Section 6 gives some conclusions drawn from the present study.
2. Description of CC Airfoil Configurations
The DU97-Flatback airfoil, a flatback version of the TU-Delft DU97-W-300 airfoil [24], is employed in the present study as the baseline blunt trailing edge airfoil, as shown in Figure 1 with a blue dashed line. The DU97-Flatback airfoil is created by adding thickness symmetrically to the aft 60% of the DU97-W-300 airfoil, giving a blunt trailing edge with a thickness of 10% chord. Comparing with the past approach of truncating an amount from the aft part to form a blunt trailing edge, this method has the advantage of holding the blunt trailing edge airfoil’s maximum thickness and camber constant with its baseline thin trailing edge airfoil.
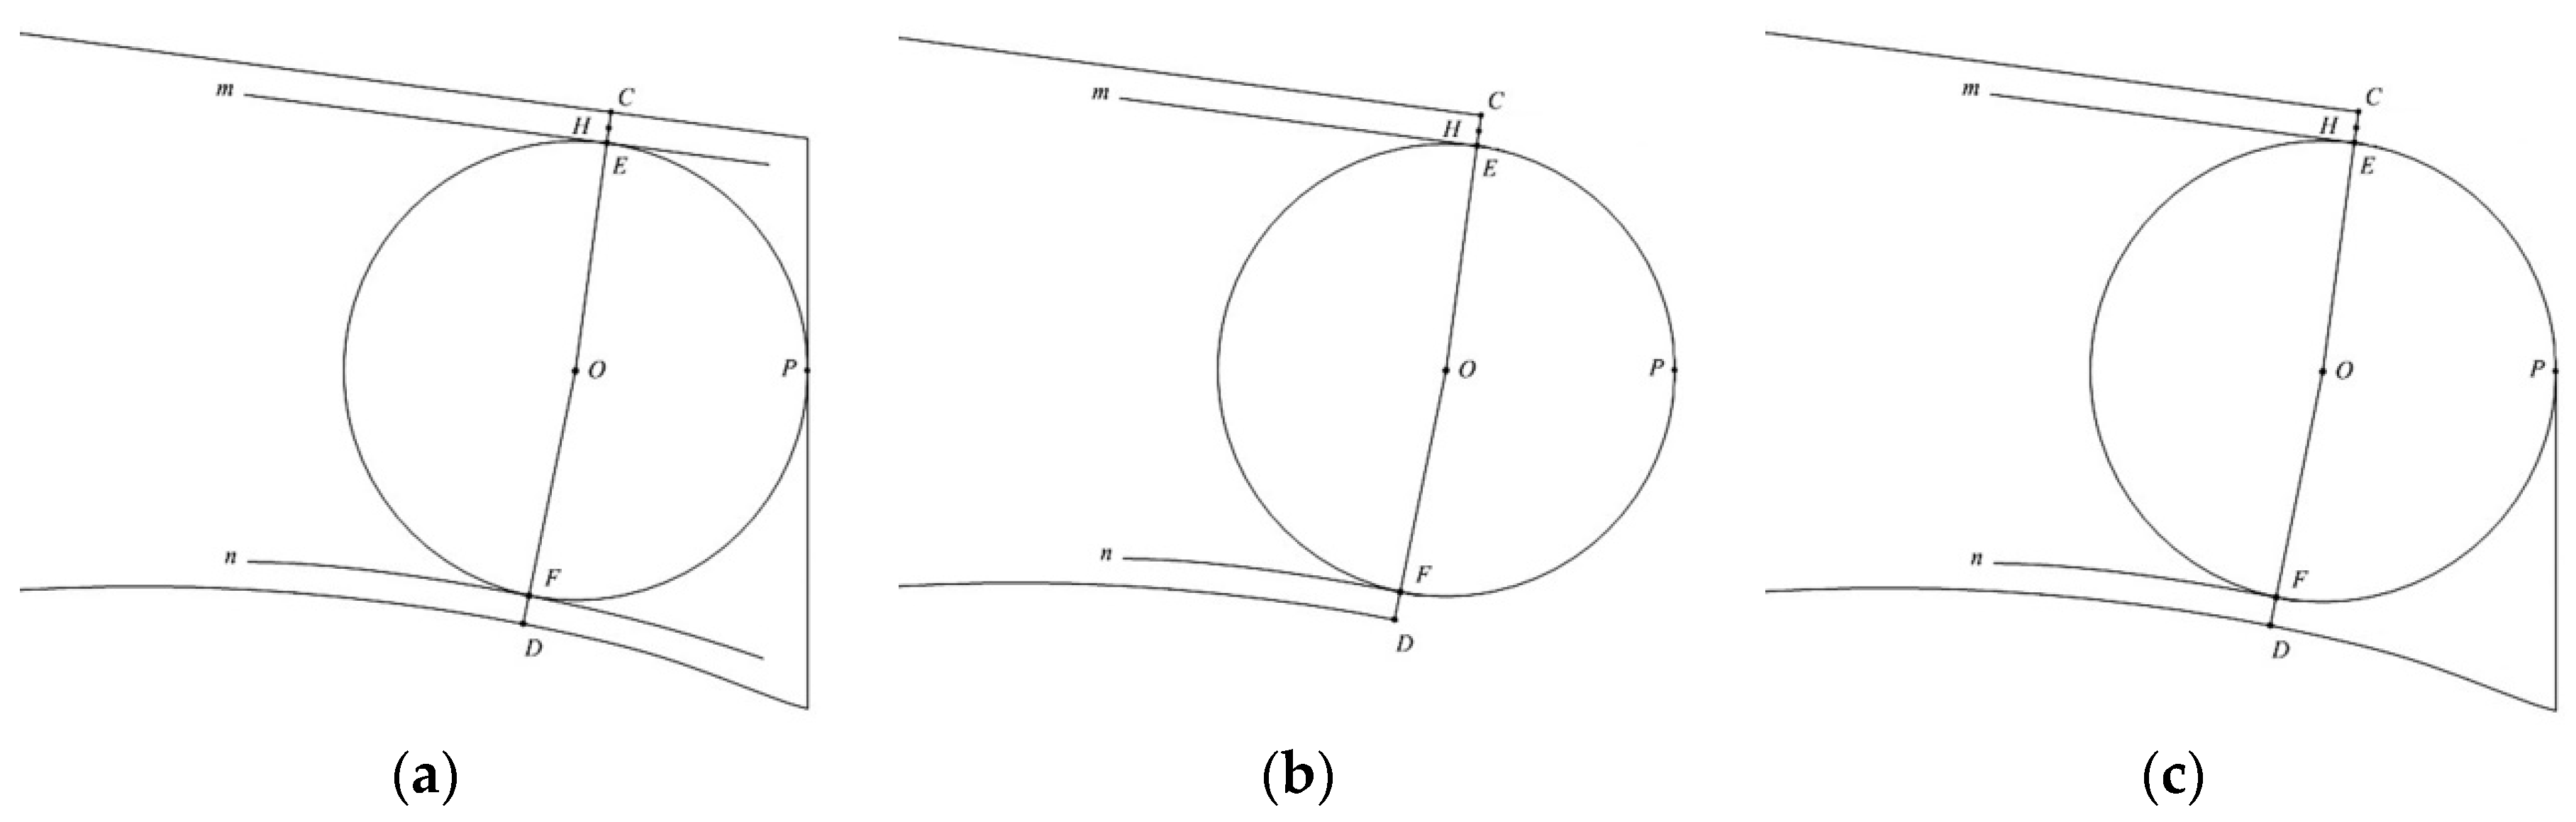
The DU97-Flatback airfoil inherently displays the necessary shape characteristics of blunt trailing edge that just meet the requirement of CC implementation if an appropriate local modification is made to create a highly curved smooth Coanda surface at the trailing edge. In the present study, the Coanda surface is designed to be a circular shape. Figure 2 shows the sketch map of the trailing edge Coanda surface design. The procedure is given as follows: (1) Copy the upper and lower surface profile lines, and translate them inward by a distance of 0.5% chord, forming lines m and n; (2) Construct a circle with the constraint that the circle is tangent to the upper and lower translated lines m and n, as well as the trailing edge line, forming three tangency points E, F and P; (3) Connect the center point O of the circle to the two tangency points E and F, respectively, and then extend the two line segments OE and OF to intersect with the upper and lower profile lines, obtaining two intersection points C and D; (4) For traditional circulation control, the whole part of the circular surface EPF is treated as the Coanda surface [21,25,26,27], as shown in Figure 2b. This traditional CC approach is denoted as full circulation control (FCC) in the present study, in order to distinguish it from the newly proposed partial circulation control (PCC) shown in Figure 2c. In PCC, only the circular surface EP is used as the Coanda surface, which is a less-than-a-half part of the Coanda surface in FCC. Therefore, the naming convention for the three airfoils involved in this study is as follows. The baseline blunt trailing edge airfoil is DU97-Flatback. The modified blunt trailing edge airfoil with traditional CC is denoted as DU97-Flatback-FCC. The modified blunt trailing edge airfoil with the present newly proposed CC is denoted as DU97-Flatback-PCC; (5) The Coanda jet slot is designed at the segment EH with a width of 0.2% chord. To make the jet simulation more realistic, a high-pressure cavity is designed, as shown in Figure 1. The lower surface of the cavity shares a part of the circular surface EF, ensuring that the jet at the slot EH is tangent to the Coanda surface.
3. Methodologies
3.1. Numerical Methods
The numerical simulations in the present study are carried out using an in-house CFD code which is capable of compressible Reynolds-averaged Navier-Stokes (RANS) simulation based on the Spalart-Allmaras one-equation turbulence model [28]. The classic central finite volume method [29] is used for the discretization of governing equations. The inviscid fluxes are discretized using the upwind Roe scheme [30] with a third-order Monotone Upstream-centered Scheme for Conservation Laws (MUSCL) reconstruction [31]. The viscous fluxes are computed using the second-order central differencing. The Lower-Upper Symmetric-Gauss-Seidel (LU-SGS) method [32] is used to march pseudo time steps. The convergence of iteration is accelerated by implementing the OpenMP parallel computing technique [33].
3.2. Boundary Conditions
There are three different types of boundary conditions in the present study, namely, the wall boundary, far-field boundary and jet inlet boundary. On the wall boundary, the no-slip flow condition is applied. The density and pressure on the wall boundary are obtained by extrapolation from the interior solution. On the far-field boundary, the treatment of boundary condition is based on the Riemann invariants for a one-dimensional flow normal to the boundary [34]. For the DU97-Flatback-FCC and DU97-Flatback-PCC airfoils with the Coanda jet activated, the high-pressure cavity is included in simulations. In practice, a non-dimensional similarity parameter called jet momentum coefficient is specified at the jet slot, which is defined as:
where is the jet mass flow rate, Vj is the jet velocity, ρ∞ is the free-stream density, V∞ is the free-stream velocity, and S is equal to the chord length c for the present two-dimensional cases. According to the momentum theorem, the numerator is a thrust force in the opposite direction of the jet flow which is perpendicular to the slot surface. Therefore, Equation (1) can be rewritten as
where FThrust represents the jet reaction force, and CThrust is the jet thrust coefficient which is a non-dimensional parameter analogous to CL and CD.
On the jet inlet boundary, the total pressure, total temperature and flow angle are specified, and the inflow velocity is extrapolated from the interior domain. The total pressure at the jet inlet boundary is adjusted every 500 pseudo time-marching iterations until the flow is converged and simultaneously the desired jet momentum coefficient is achieved.
As shown in Figure 3, the solid surface of the cavity is defined as the wall boundary. When the Coanda jet is deactivated, the jet slot EH is assumed to be a wall boundary since there is no flow through the slot, and hence the cavity is not included in the computation.
3.3. Aerodynamic Force Analysis for a CC Airfoil
For a CC airfoil, the analysis of lift and drag characteristics is quite different from that of a conventional airfoil. For a conventional airfoil with a pure and closed solid boundary, the aerodynamic force on the surface is due to only two basic sources, namely, pressure distribution and shear stress distribution. The net effect of the pressure and shear stress distributions integrated over the whole airfoil surface is the resultant lift and drag. However, as shown in Figure 3, taking the DU97-Flatback-PCC airfoil for example, there is an inlet boundary in the high-pressure cavity, which causes a difference in the force analysis. To simplify the analysis, the inner two solid boundaries and one flow inlet boundary in the high-pressure cavity, as drawn with blue lines in Figure 3, are not included in the aerodynamic force calculation. Their contributions to the overall aerodynamic forces are taken into account through the specific aerodynamic analysis at the slot surface denoted by the red dashed line in the enlarged drawing in Figure 3. Therefore, the CC airfoil profile shape for aerodynamic force analysis is considered as two parts: the outer solid surface enclosed by the black bold profile line and the jet slot surface represented by the red dashed line. The slot surface is a jet passage, and the jet could produce a reaction force. Hence, once it is considered as a part of airfoil profile for aerodynamic force analysis, it suffers from three types of forces, namely, pressure, shear stress and a reaction force. The shear stress is negligible because the slot surface is an “air” surface and the jet direction is perpendicular to it. It should be noted that the pressure force exerted on the slot surface cannot be neglected because it has a great contribution to the total aerodynamic force, especially the drag. As sketched in the enlarged window in Figure 3, the force exerting on the slot surface consists of the pressure force Fpressure and the reaction force , which are all pointing forward and hence contribute to a reduced drag. Therefore, the overall aerodynamic force exerting on the CC airfoil includes not only the pressure and shear stress forces on the outer solid surface, but also the reaction force due to the jet emanating from the slot and the pressure force on the slot surface. Based on the above analysis, the total aerodynamic force is computed by summing three components: the pressure force on the outer solid surface as well as the slot surface, the shear stress force on the outer solid surface, and the jet reaction force on the slot surface. Corresponding non-dimensional force coefficients can be expressed as CL,p, CL,τ, CL,jet, CD,p, CD,τ, CD,jet, respectively. Thus, the total lift and drag coefficients can be expressed as:
where CL,p+τ, CD,p+τ are calculated by the standard integral operation just as same as that in the normal simulation, while CL,jet, CD,jet are computed from:
and:
where () is the unit vector representing the drag and lift direction, respectively, and is the jet velocity vector at the slot surface.
3.4. Aerodynamic Figure of Merit (AFM) and Control Efficiency
As an active flow control method, the CC implementation requires a certain amount of auxiliary power to energize the Coanda jet. Assessment of the active method should not only include the enhancement of aerodynamic characteristics, but also take the power expenditure into account. Whether the increment of power output due to the flow control implementation can or cannot exceed the power expenditure will definitely affect the method’s practicability and economy in the wind turbine application. It is necessary to build an appropriate effectiveness criterion for the analysis of power expenditure, power gain and control efficiency. A prerequisite for comparing the wind turbine performance, with and without flow control, is identification of appropriate figure of merit. Comparison parameters for flow control actuators were previously discussed by Seifert [35]. Two aerodynamic figures of merit (AFMs) for actuator performance comparison were suggested and their relative values were discussed for various types of actuators. However, those two AFMs are only suitable for fixed-wing applications. Stalnov et al. [36] defined a third AFM for wind turbine applications, which was based on the ratio between generated powers with and without active flow control. But it was specifically tailored for wind turbines with zero-mass-flux piezofluidic actuators during the HAWT start-up process. All of the three AFMs are not suitable for the current CC implementation. In the present study, a new figure of merit for the wind turbine application with CC is given as follows.
Assume that the Coanda jet is generated by pumping the free stream around the nacelle into the higher-pressure cavity. A pump is located in the nacelle and the high-pressure cavity is connected to the flow outlet of the pump through a well-designed air passage inside the blade and hub. The power expenditure for CC is the power needed to pump the Coanda jet, which is usually evaluated by a power coefficient Pc,jet that is defined as:
where ηjet is the pump efficiency which is assumed to be 0.85 in the present study, cp is the specific heat at constant pressure, P01 is the total pressure at the pump inlet, P02 is the total pressure at the pump exit, and T01 is the total temperature at the pump inlet.
Figure 4 depicts the relative orientation of lift and drag to the rotation plane with respect to the relative wind V∞, where α is effective angle of attack, β is the twist angle at a given radial station. The power coefficient generated by a two-dimensional airfoil with unit span is computed by:
where ηWT is the wind turbine efficiency of power generation from the torque, and is assumed to be 0.85 in the present study.
Hence, the power coefficient of the baseline flatback airfoil is:
and the power coefficient of the flatback-CC airfoil (PCC or FCC) is:
Therefore, the power coefficient enhancement due to the implementation of circulation control is:
Since CC is used to improve the aerodynamic and power production characteristics of the baseline flatback airfoil, a new AFM suitable for CC is formulated to quantify the gained power in terms of the multiple of the generated power by the baseline flatback airfoil, which is defined as:
Moreover, to assess the ability of CC to enhance wind power output in terms of a unit of power expenditure, the circulation control efficiency ηCC is defined as:
which is the ratio between the power gain and power expenditure.
4. Validation of CFD Code
The present CFD code is validated in previous publications, including the S809 airfoil at different Reynolds numbers [37,38,39], the DU97-W-300 and DU97-Flatback airfoils [21], and the CC020-010EJ airfoil [21]. In Xu et al. [21], the grid independency study was performed on the DU97-W-300 airfoil rather than the DU97-Flatback airfoil, and the grids for DU97-Flatback and CC airfoil are directly generated based on the scale of the chosen mesh for DU97-W-300 after the grid independency study. In the present study, a similar strategy is adopted. Because DU97-W-300 is not under the current study, no validation will be carried out for it. Therefore, a grid independency study will be performed for the DU97-Flatback first. Then the scale of the chosen grid is used to generate pertinent CC airfoils.
4.1. Grid Independency Study for the DU97-Flatback Airfoil
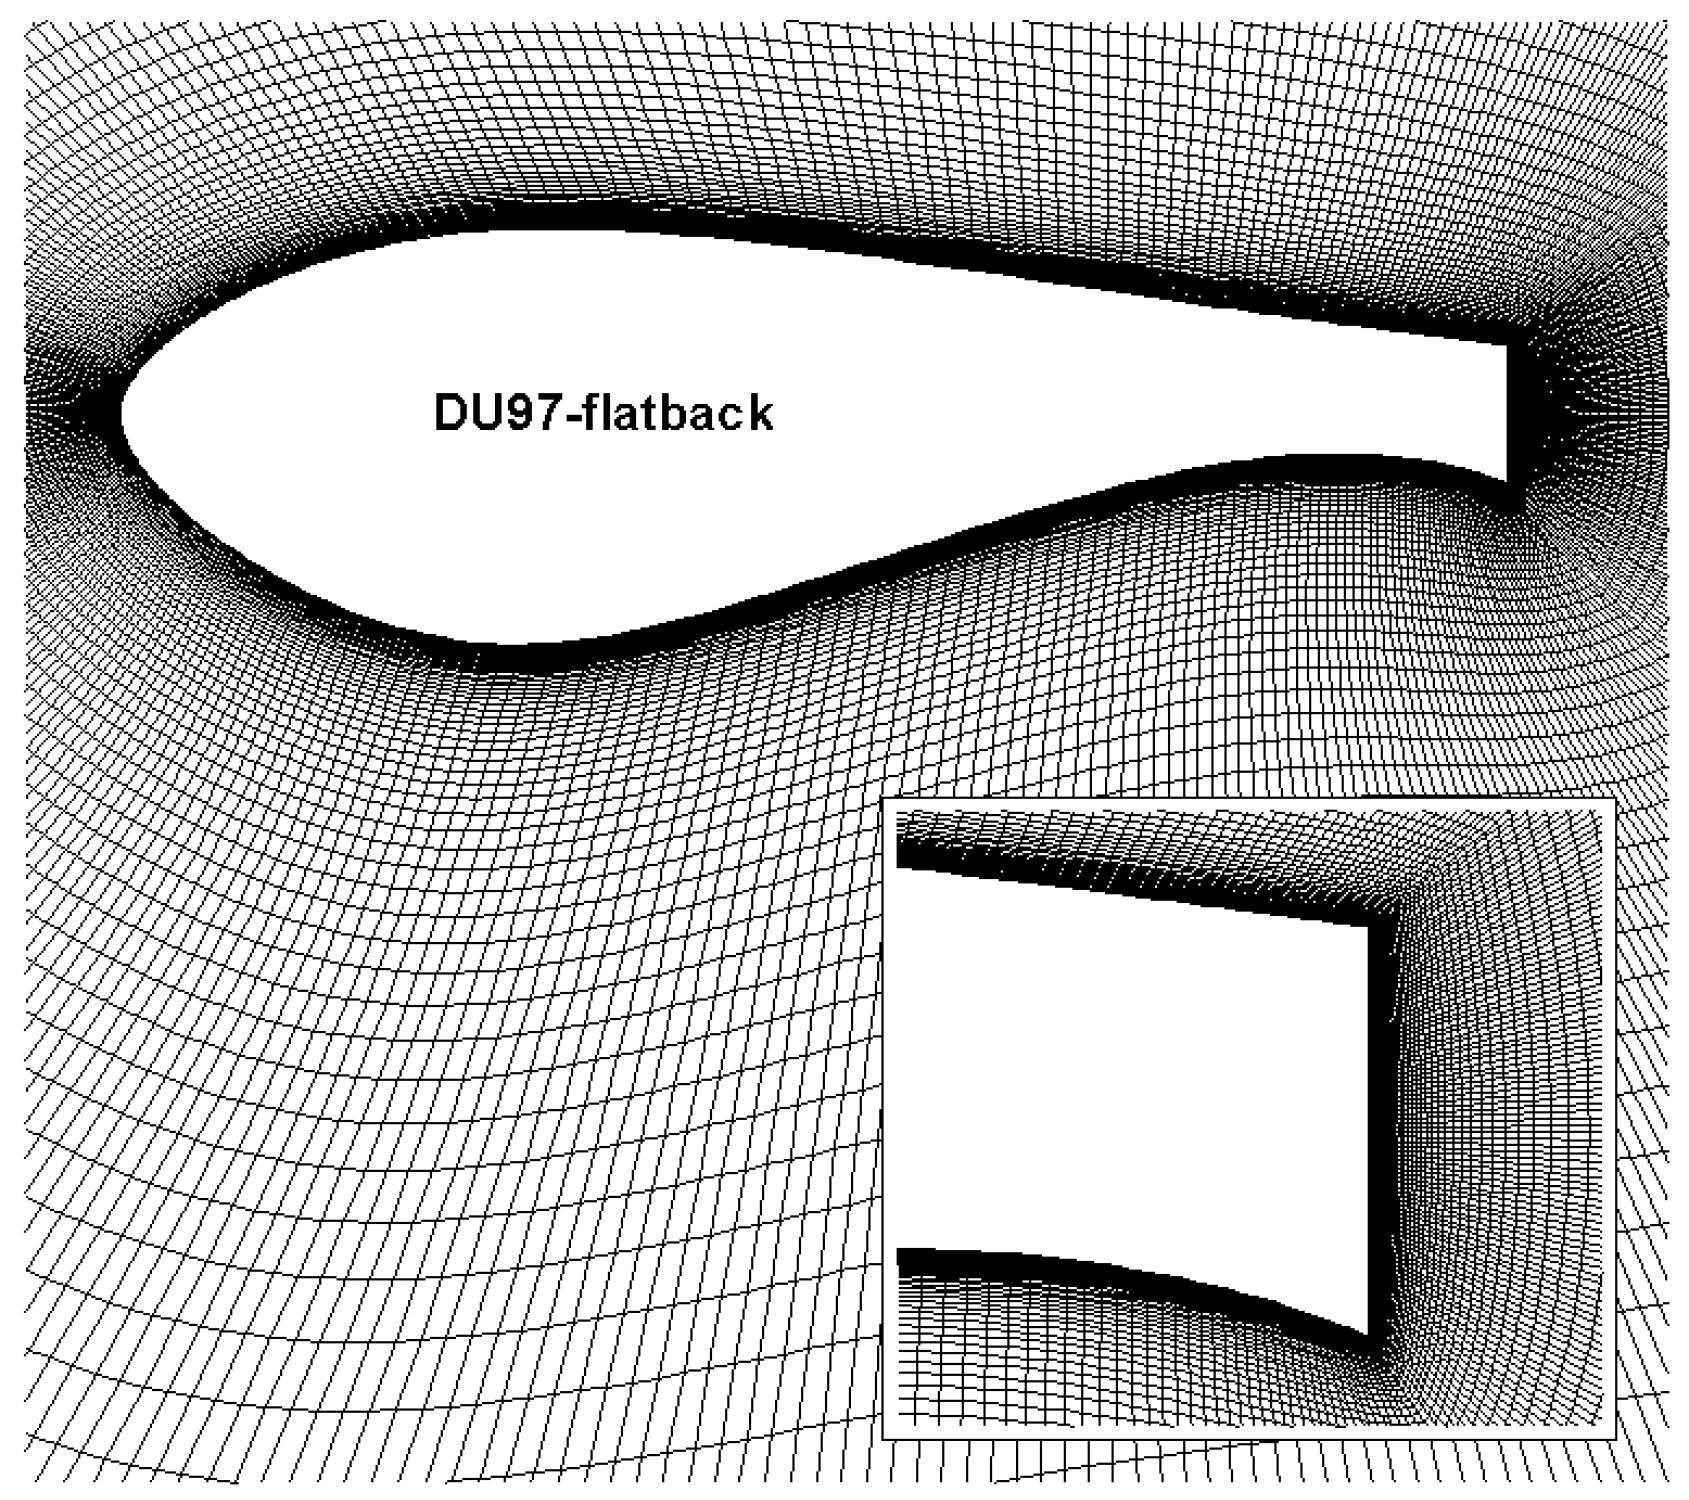
The DU97-Flatback airfoil has a blunt trailing edge with tTE/c = 10%, which is relatively thick in comparison to most other common airfoils. One issue that must be addressed is the treatment of the trailing edge for grid generation. In the structured grid method, there are two typical grid topologies, namely, the C-grid and O-grid. A C-grid is usually used for the RANS simulations for sharp trailing edge airfoils, due to the ability to minimize the skewness of the near-wall mesh around the trailing edge and obtain better stability and convergence in the simulation. The fact that the trailing edge has some thickness poses a problem in terms of how one treats the closure of the trailing edge. Standish et al. [4] deemed reasonable to extend the chord of the airfoil by 0.2% and fit a quadratic polynomial to both the top and bottom surfaces for a blunt trailing edge airfoil using the C-grid topology, although this treatment actually changes a little the shape of the trailing edge. An alternative way is to use the O-grid topology for such a blunt trailing edge airfoil, which is popular since it can provide better orthogonality in grid lines near the blunt trailing edge, thus generating a better grid than a C-grid. Moreover, the O-grid can reduce the grid number and avoid high aspect ratio of grids in the far wake. Therefore, the O-grid is adopted for the present DU97-Flatback airfoil.
To perform the grid independency study, four grids are generated with gradually increasing grid numbers, namely, a coarse grid of 225 × 100, a medium grid A of 315 × 141, a medium grid B of 450 × 200, and a fine grid of 630 × 283. As a result, the cell numbers of the four grids increase by a factor of about two. In addition, some other relevant parameters of the four grids are changed step by step, including first layer spacing and normal spacing increasing ratio. The largest first layer spacing of the grids is 1.2 × 10⁻⁵ which is small enough to ensure that the y+ is less than 1. According to the gridding guidelines given in Mavriplis et al. [40], the first two layers of cells at the wall are of similar spacing, and the growth rate of the normal spacing through the boundary layer is below 1.20. The details of the four grids are listed in Table 1.
For the DU97-Flatback airfoil, only a few experimental data for CFD code validation can be found in the literature. Barone et al. [22] provided the measured aerodynamic coefficients for a DU97-Flatback airfoil at only three angles of attack (AoA), and all of them are chosen for the present CFD code validation. According to the experimental setup, the present validation conditions are set as AoA = 4.12°, 11.05°, 13.40°, respectively, with the same Ma = 0.168 and Re = 3.0 × 10⁶. The results of lift, drag and moment coefficients are given in Table 2, Table 3 and Table 4. The calculated lift coefficients agree rather well with the experiment, while the drag and moment coefficients have a little larger discrepancies with the experimental data but within an acceptable extent. The discrepancy between the calculated and experimental drag coefficients might be due to several aspects, including the limitation of the RANS turbulence model, lack of transition prediction, uncertainty of the experiment which is subject to error, unsteadiness and wind tunnel wall interference, etc. The moment coefficients are calculated from the corresponding lift and drag coefficients, and hence there is no surprising that they have some discrepancies with the experiment. In Table 2, Table 3 and Table 4, it is shown that the lift, drag and momentum coefficients all decrease a little with increasing grid number. Looked from the overall, the relative changes between two successive grids are quite small, and the maximum is 5.26% which corresponds to CD comparison between the coarse grid and medium grid A at AoA = 11.05°. The maximum relative change is 2.6% between the medium grids A and B, and 1.8% between the medium grid B and fine grid. Therefore, the maximum relative change between the medium grid B and fine grid is the smallest. The relative percentage of variation of 1.8% is acceptable for the present grid independency study, and hence the present study adopts the medium grid B as the result of the grid independency study for DU97-Flatback. The medium grid B is shown in Figure 5 with a close-up of the trailing edge, and it is demonstrated that it’s satisfactory for the present RANS simulation. The computational grids for CC airfoils will be generated based on the scale of the current medium grid B.
4.2. Validation of the GACC Airfoil
An experimental airfoil General Aviation Circulation Control (GACC) which is analogous to the present FCC configuration is chosen to conduct the present CFD validation for CC implementation, since there is no test data available for the present proposed CC wind turbine airfoils. The GACC airfoil was developed in a test program intended to address some technology issues associated with CC implementation in the aeronautical application [25]. It is a supercritical airfoil model with dual slotted circulation control capability for low speed testing in the LaRC Basic Aerodynamic Research Tunnel. According to the test setup and test data available, the validation condition is set as AoA = 0°, Ma = 0.10, Re = 5.33 × 10⁵, Cμ = 0.06. The pressure coefficient distribution is calculated and shown in Figure 6, and the experimental data and CFD result by Jones et al. [25] using the FUN2D code are shown for comparison. The FUN2D code employed the same RANS equations in conservation-law form along with the Spalart-Allmaras turbulence model as the present solver, except that the grid is fully unstructured. Hence, as expected, the present result agrees very well with that from FUN2D, nearly coincident with each other. There is a favorable comparison of the CFD and experimental pressure coefficient distributions. The CFD results agree very well with the experiment over almost the entire airfoil surface except the bottom trailing edge area where the local measured pressure coefficient even exceeds 2.0. This discrepancy may be due to the lack of confidence in the experimental trailing edge pressure data and the associated error magnitudes, as indicated in Jones et al. [25]. The flow field with streamlines and Mach number contour is given in Figure 7, showing that the free stream is deflected significantly due to the Coanda effect at the trailing edge. This validation demonstrates that the present solver is reliable and adequate for the circulation control simulations.
5. Results and Discussion
5.1. Aerodynamic Analysis and Comparison
In this subsection, five different airfoils are involved, including the DU97-Flatback, DU97-Flatback-FCC, DU97-Flatback-FCC_jet-off, DU97-Flatback-PCC, DU97-Flatback-PCC_jet-off. In the following text, the last four will be referred for short as FCC-on, FCC-off, PCC-on, PCC-off, respectively. The FCC-off and PCC-off airfoils are identical to the corresponding FCC-on and PCC-on airfoils, respectively, if the high-pressure cavity is disregarded and removed in simulations when the Coanda jet is switched off. Therefore, only two grids are needed to generate, namely, a grid for FCC-on and a grid for PCC-on. The grids for FCC-off and PCC-off can be obtained by directly removing the grid in the cavity of FCC-on and PCC-on, respectively.
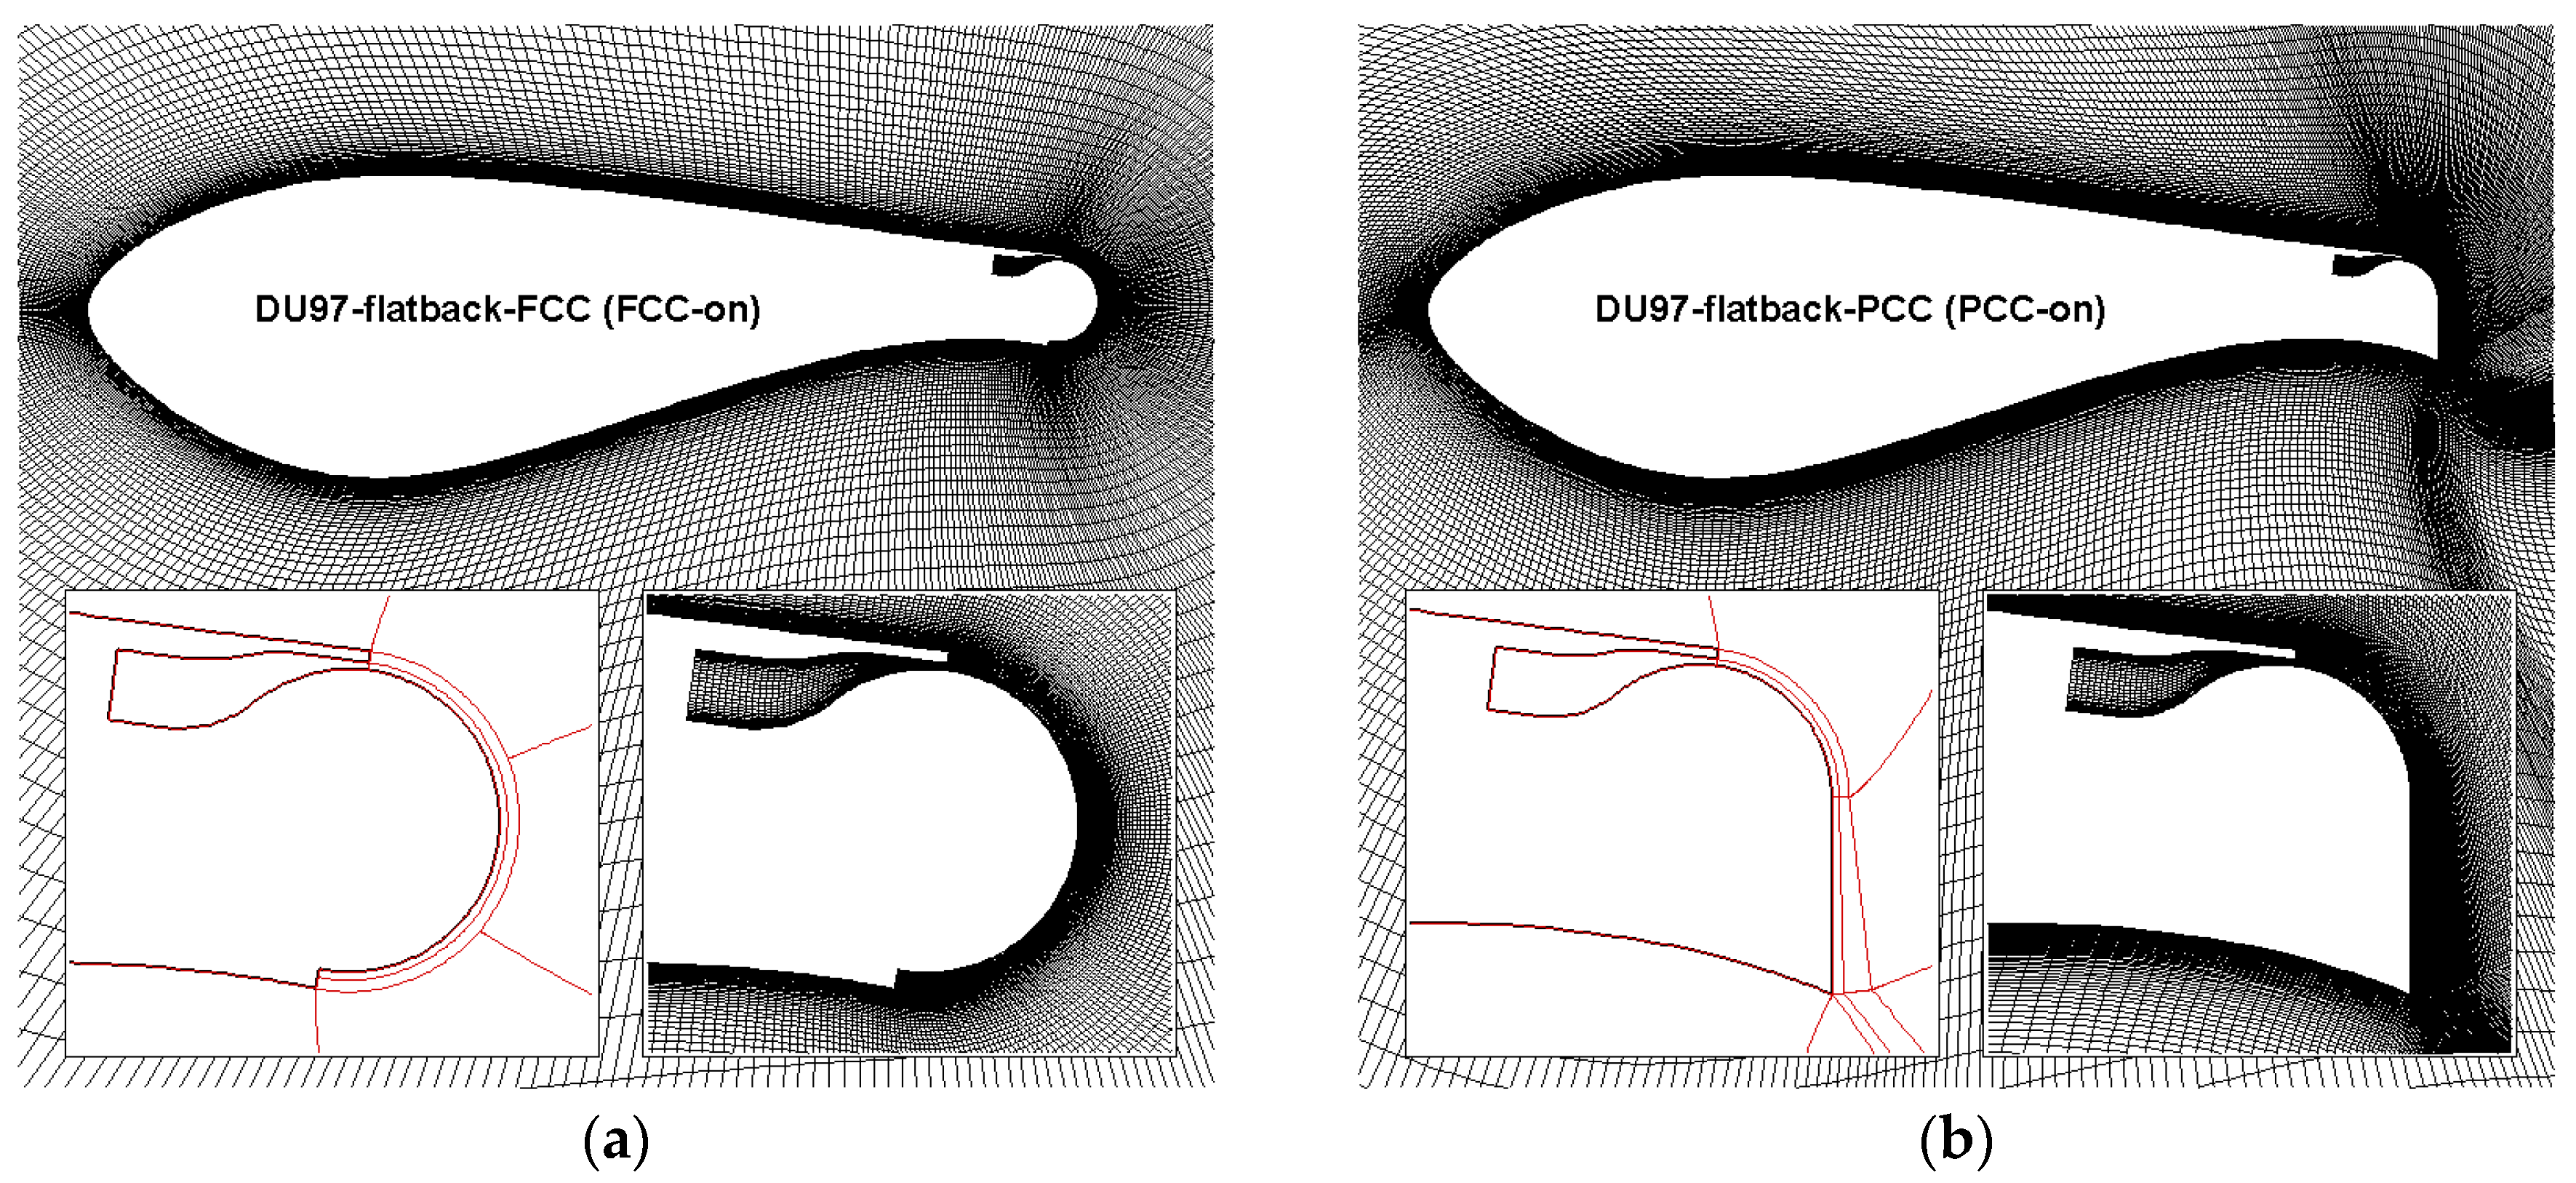
As mentioned in Section 4.1, the grids for CC airfoils are generated based on the scale of the medium B grid of DU97-Flatback. For the FCC-on airfoil as shown in Figure 8a, the O-grid topology and point distribution on the surface other than the Coanda surface are the same as the DU97-Flatback, and 150 points are equally distributed on the Coanda surface to match the scale distribution and obtain a smooth grid. However, the situation is quite different for the PCC-on airfoil as shown in Figure 8b, where the point scales and distributions on the surfaces, both non-Coanda surface and Coanda surface, are similar to the DU97-Flatback and FCC-on, but the grid topology is C-type rather than O-type. This difference is due to the different design of the Coanda surfaces. The grid boundary lines between different structured grid subzones are shown in the left enlarged views of the trailing edge areas in Figure 8 to illustrate the grid topologies near the trailing edges. The dual-step design in FCC-on creates a bottom step, and facilitates local structured grid generation around the Coanda surface as well as in the cavity. The structured zonal grids originate from the inlet boundary in the cavity and the upper step surface, and end at the bottom step surface, forming a perfect closure. However, in the single-step design in PCC-on, no bottom step is created to act as the ending boundary for the zonal structured grids originating from the same cavity and upper step surface, causing difficulty in O-grid generation. Therefore, the C-type grid is adopted for PCC-on, and the left enlarged view in Figure 8b illustrates the C-topology with boundary lines of zonal grids. From the right enlarged views in Figure 8, it can be found that the grid distributions on the Coanda surfaces and in the normal directions are both fine, which is helpful in resolving the Coanda jet flow.
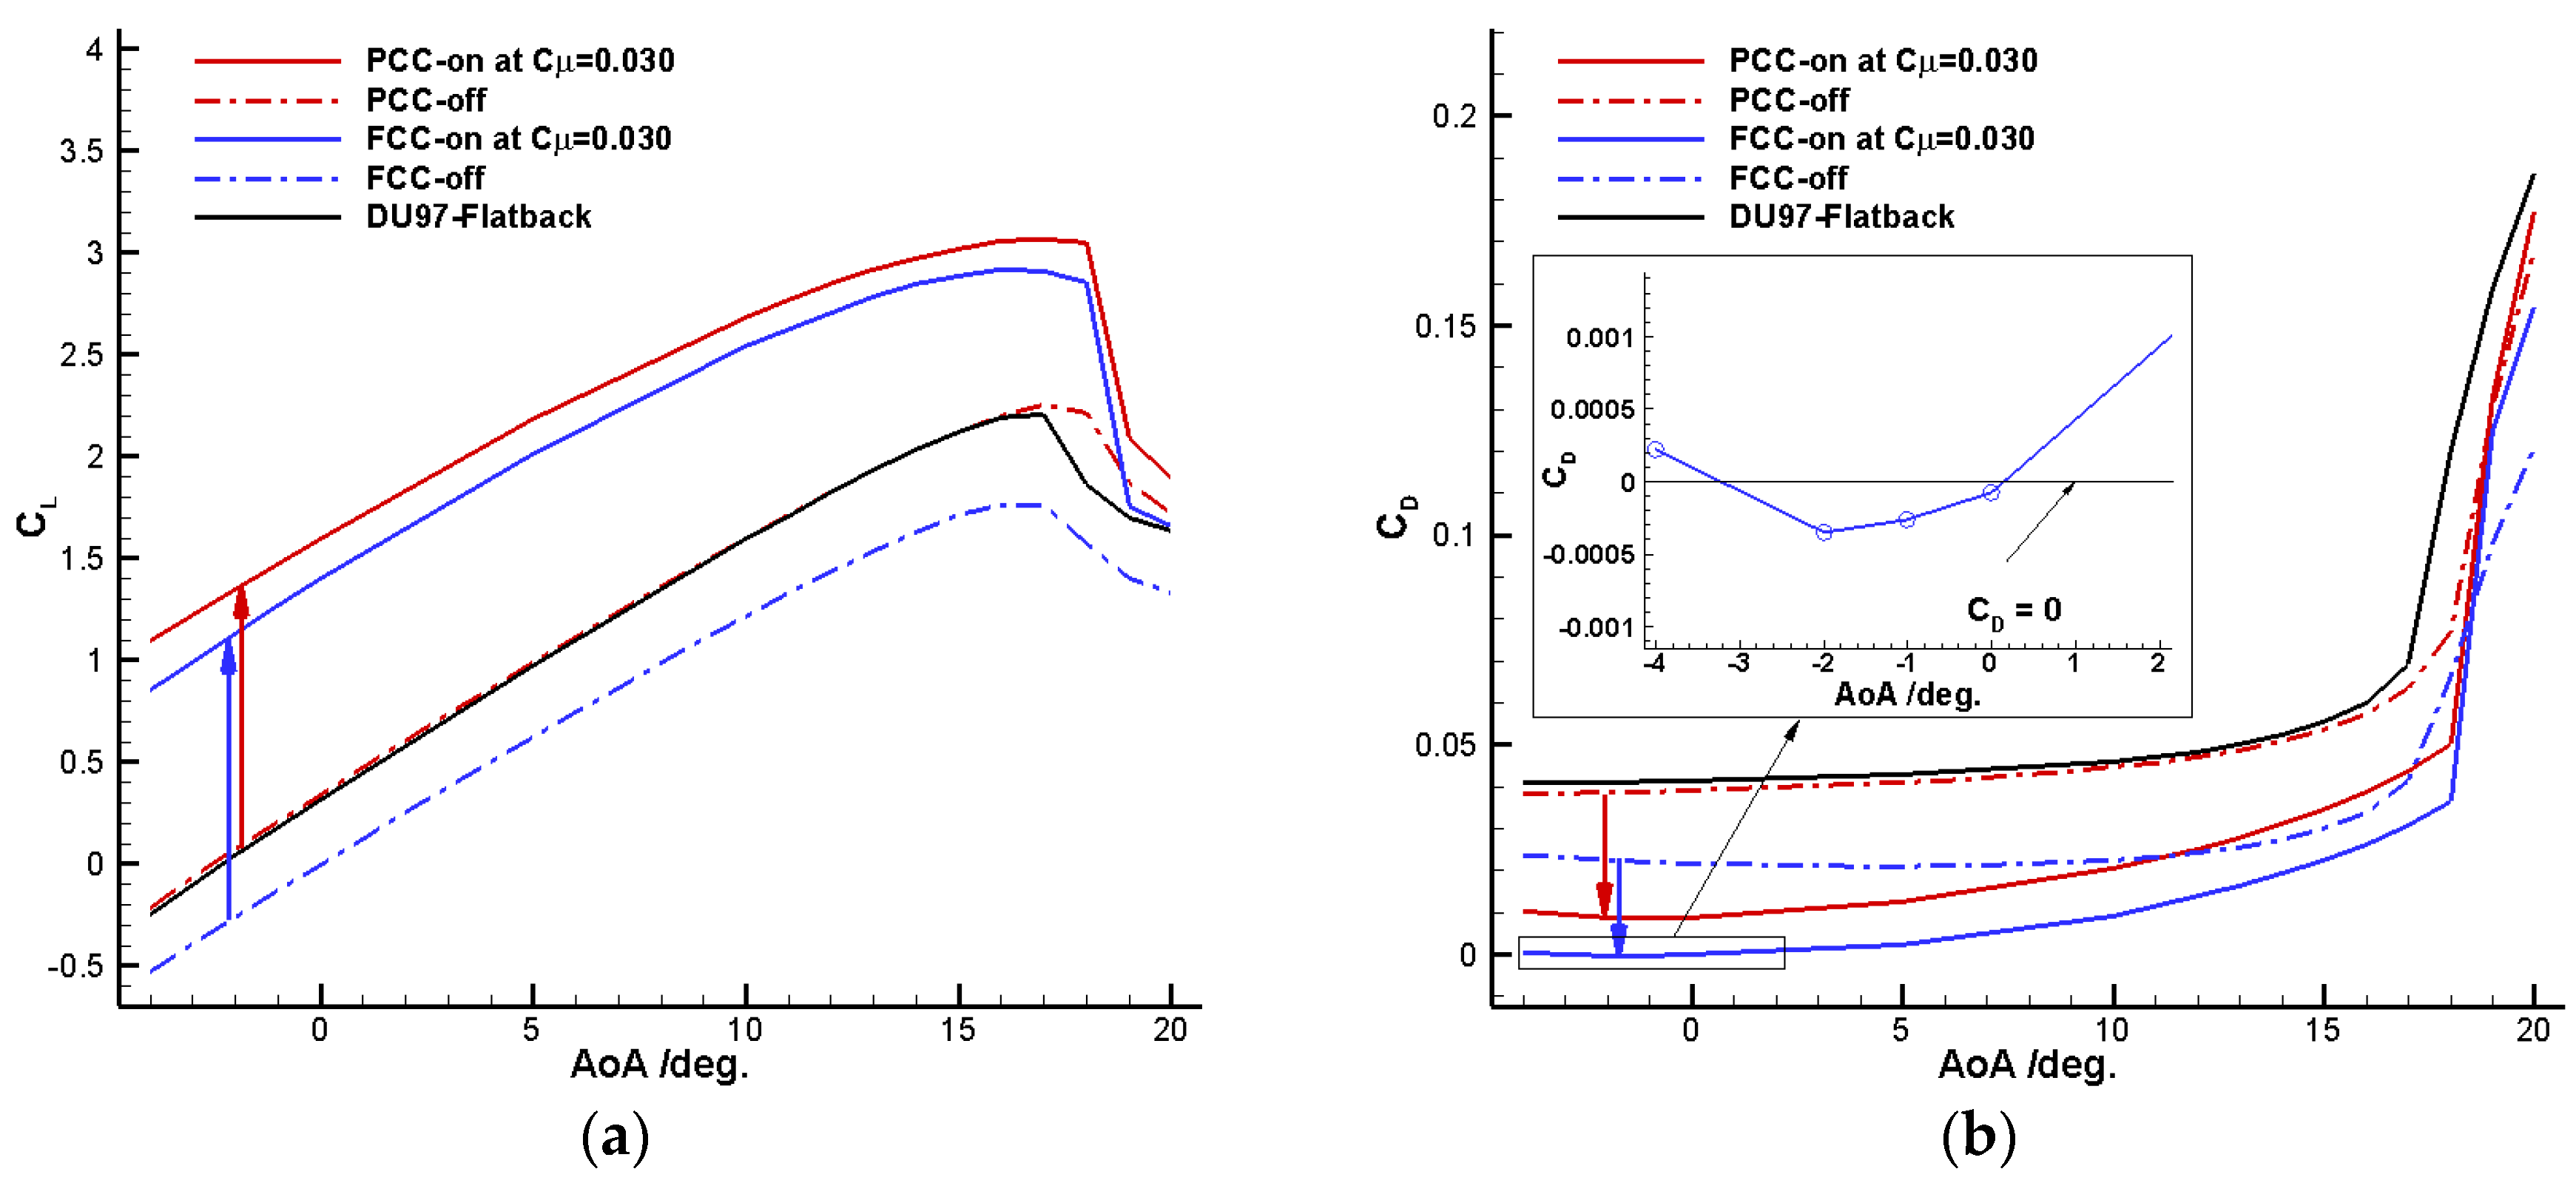
In general, the blunt trailing edge airfoil is located in the inboard region within 40% of the blade, and the working wind speed is usually below 15 m/s. Due to the concerns of compressibility and aero-acoustic noise, the tip speed of the conventional large wind turbine blade is usually limited below 80 m/s (the actual tip speed might be higher for modern wind turbines). Therefore, the head wind speed of the blunt trailing edge section is usually in the low subsonic regime and varies with the radial location. On the other hand, in the CFD simulation using a code without any pre-condition treatment, a Mach number much lower than 0.1 may cause the slow-convergence problem. Hence, in the present study, Ma = 0.10 is chosen for the head wind Mach number, although it might be a little higher than an actual situation. The chord Reynolds number is set as Re = 3.0 × 10⁶, and AoAs = −4–20°. For the CC simulations in this subsection, Cμ = 0.030. All the five airfoils are simulated for comparison at the same aforementioned conditions of Mach number, Reynolds number and AoAs. For the two jet-off configurations, the high-pressure cavities are removed, and the slot surfaces are defined as solid surfaces. Figure 9 gives the comparison of lift and drag coefficients between different cases.
Four observations can be obtained from the comparison of lift coefficients in Figure 9a. (1) PCC-off has the ability to maintain the lift level of the baseline DU97-Flatback, and even provide slight enhancement in lift characteristics at some AoAs. The lift coefficient is increased a little for AoAs below 10°, and the stall is delayed by about 1°. For AoAs = 10~16°, the lift coefficient line almost coincides with that of the baseline DU97-Flatback. That is to say, the PCC modification to the trailing edge can avoid any degradation in lift characteristics compared with the baseline flatback airfoil. This is a very important advantage of the newly proposed PCC design; (2) FCC-off generates significant reduced lift while remains almost unchanged stall AoA. At the typical working AoA = 15°, the lift coefficients of FCC-off and the baseline DU97-Flatback are 1.71 and 2.12, respectively. The FCC-off design causes a decrement as high as 0.41, which is detrimental to the wind turbine performance once the Coanda jet is turned off; (3) Both the PCC-on and FCC-on with Cμ = 0.030 significantly enhance the lift coefficients and increase the stall AoA a little by about 1°, compared with the baseline DU97-Flatback. Moreover, PCC-on generates a much higher lift coefficient than FCC-on over the entire range of AoAs, which is another advantage of the present PCC design. At the typical working AoA = 15°, the lift coefficient of PCC-on reaches 3.02, while that of FCC-on is 2.89. This increment of 0.13 in lift coefficient is significant in amount in flow control; (4) It is interesting to note that the increment in lift coefficient between the jet-off and jet-on cases of FCC is larger than that of PCC, although PCC outperforms FCC in terms of total lift characteristics in both jet-off and jet-on situations. As indicated with the arrows in Figure 9a, at AoA = −2°, the increments of PCC and FCC are 1.277 and 1.394, respectively, and FCC’s is 0.117 larger than PCC’s. This phenomenon exists over the entire range of AoAs, especially at higher AoAs, indicating that the lift-enhancement efficiency in terms of lift increment between jet-on and jet-off is better for FCC, compared with PCC. This might be one reason that the FCC design is in common use in aeronautical CC applications. This study finds that this may be misleading. The lift characteristics in terms of ultimate total value rather than just increment between jet-on and jet-off cases should be the most concerned aspect in practice. The larger increment of FCC is offset by its much lower jet-off lift coefficient value, resulting in a much lower total lift coefficient value than that of PCC. Therefore, PCC is better than FCC in terms of lift characteristics. It is noted that both PCC-on and FCC-on cause severe and abrupt stall, and only slightly favorable control are achieved, since the lift coefficients after stall are a little higher than the baseline DU97-Flatback, and the drag coefficients after stall are a little lower than the baseline DU97-Flatback. Hence, this stall behavior indicates that the present CC technique is effective only for the attached flow regime.
From the comparison of drag coefficients shown in Figure 9b, three more observations can be obtained: (1) The baseline DU97-Flatback has the highest drag, which is consistent with the fact that DU97-Flatback has the bluntest trailing edge that will produce a larger base drag; (2) For the two jet-off configurations, PCC-off has a slightly lower drag and FCC-off has a significantly lower drag, compared with the baseline DU97-Flatback. This is understandable if we observe the trailing edges shown in Figure 2. The flatback trailing edge of DU97-Flatback is modified to a smoother and streamlined shape with a full circular Coanda surface to form FCC and with a partial circular Coanda surface to form PCC. Moreover, the trailing edge thicknesses of PCC and FCC are reduced after the modification to the baseline flatback trailing edge. Because FCC loses more trailing edge thickness, its drag is reduced more significantly, nearly reaching half of the baseline; (3) When the Coada jet is activated, PCC-on and FCC-on can both reduce drag to very low levels, and FCC-on has the lowest drag over the entire range of AoAs in the attached flow regime. Just as the above comparison between FCC and PCC in terms of total lift coefficient and increment in lift coefficient, there is also a similar comparison between FCC and PCC in terms of ultimate total drag coefficient and decrement in drag coefficient. As indicated with the downward arrows in Figure 9b, also taking AoA = −2°, for example, the drag coefficient of PCC reduces from 0.0386 to 0.0086, producing a decrement of 0.0300; the drag coefficient of FCC reduces from 0.0225 to a negative value of −0.0004, producing a decrement of 0.0229. PCC has a better ability in reducing drag than FCC in terms of drag decrement, whereas FCC-on outperforms PCC-on in terms of ultimate total drag. The advantage of reducing more drag for PCC is offset by its larger jet-off drag, resulting in a much higher ultimate total drag than that of FCC. Therefore, FCC is better than PCC in terms of drag characteristics. However, it should be noted that the difference between PCC-on and FCC-on in drag coefficient (0.0090 at AoA = −2°) is relatively small when compared with the difference in lift coefficient (0.217 at AoA = −2°). From the formula for wind power output given by Equation (8), it can be found that lift increment will contribute more to the power output than drag decrement. Therefore, in this sense, the present PCC is better than FCC based on comprehensive analysis on lift and drag characteristics.
As mentioned in the above drag characteristics analysis, it’s interesting to note that the drag coefficients at AoAs = −2°, −1° and 0° are below zero, as shown in the close-up window in Figure 9b. This means there is a thrust rather than a drag for FCC-on at these AoAs, which is seemingly contradicting our common sense that any solid body produces an amount of drag when moving in a fluid. Actually, considering the aerodynamic analysis for CC implementation in Section 3.3, it is possible for the drag to reach a negative value if the Coanda jet is injecting at a sufficiently high momentum coefficient. It was also found in previous studies of co-flow jet control [37] and Coanda jet control [21] that the jet reaction force is the main contribution to the negative drag. Here, we would highlight this phenomenon by explaining more from a different perspective rather than just repeat the finding. According to Equations (3) and (4) in Section 3.3, the total lift and drag coefficients are decomposed into two components, respectively: lift and drag coefficients from pressure and shear stress, lift and drag coefficients from Coanda jet mass flow. Figure 10 displays the decomposition results. Due to the jet reaction thrust, PCC-on and FCC-on both produce a very small amount of positive lift, as well as a relatively large negative drag which leads to total negative drags at AoAs = −2°, −1° and 0°. In Figure 10, Cμ remains 0.03 for all cases, and hence the resultant jet thrust CThrust is kept constant. The amount that the jet thrust contributes to lift or drag is dependent on the angle between the thrust direction and the lift or drag direction. By examining the profiles of DU97-Flatback-PCC and DU97-Flatback-FCC, it can be found that the angle between the horizontal chord line and the jet thrust direction is 7.5°. As a result, the angle between the lift direction and the jet thrust direction can be expressed as 90–7.5°-AoA, and hence it is 86.5° at the starting AoA = −4°, and monotonically reduces to 62.5° at the ending AoA = 20°. Similarly, the angle between the drag direction and the jet thrust direction varies from 3.5° at AoA = −4–27.5° at AoA = 20°. Therefore, the lift component of the jet thrust has an increasing trend over AoAs = −4–20° as shown in the enlarged view in Figure 10a, and the drag component of the jet thrust has a decreasing trend in absolute values over AoAs = −4–20° as shown in the enlarged view in Figure 10b. The lift and drag coefficients of PCC-on and FCC-on due to the jet thrust are almost coincident, because the two configurations possess the same slot design and jet momentum coefficient.
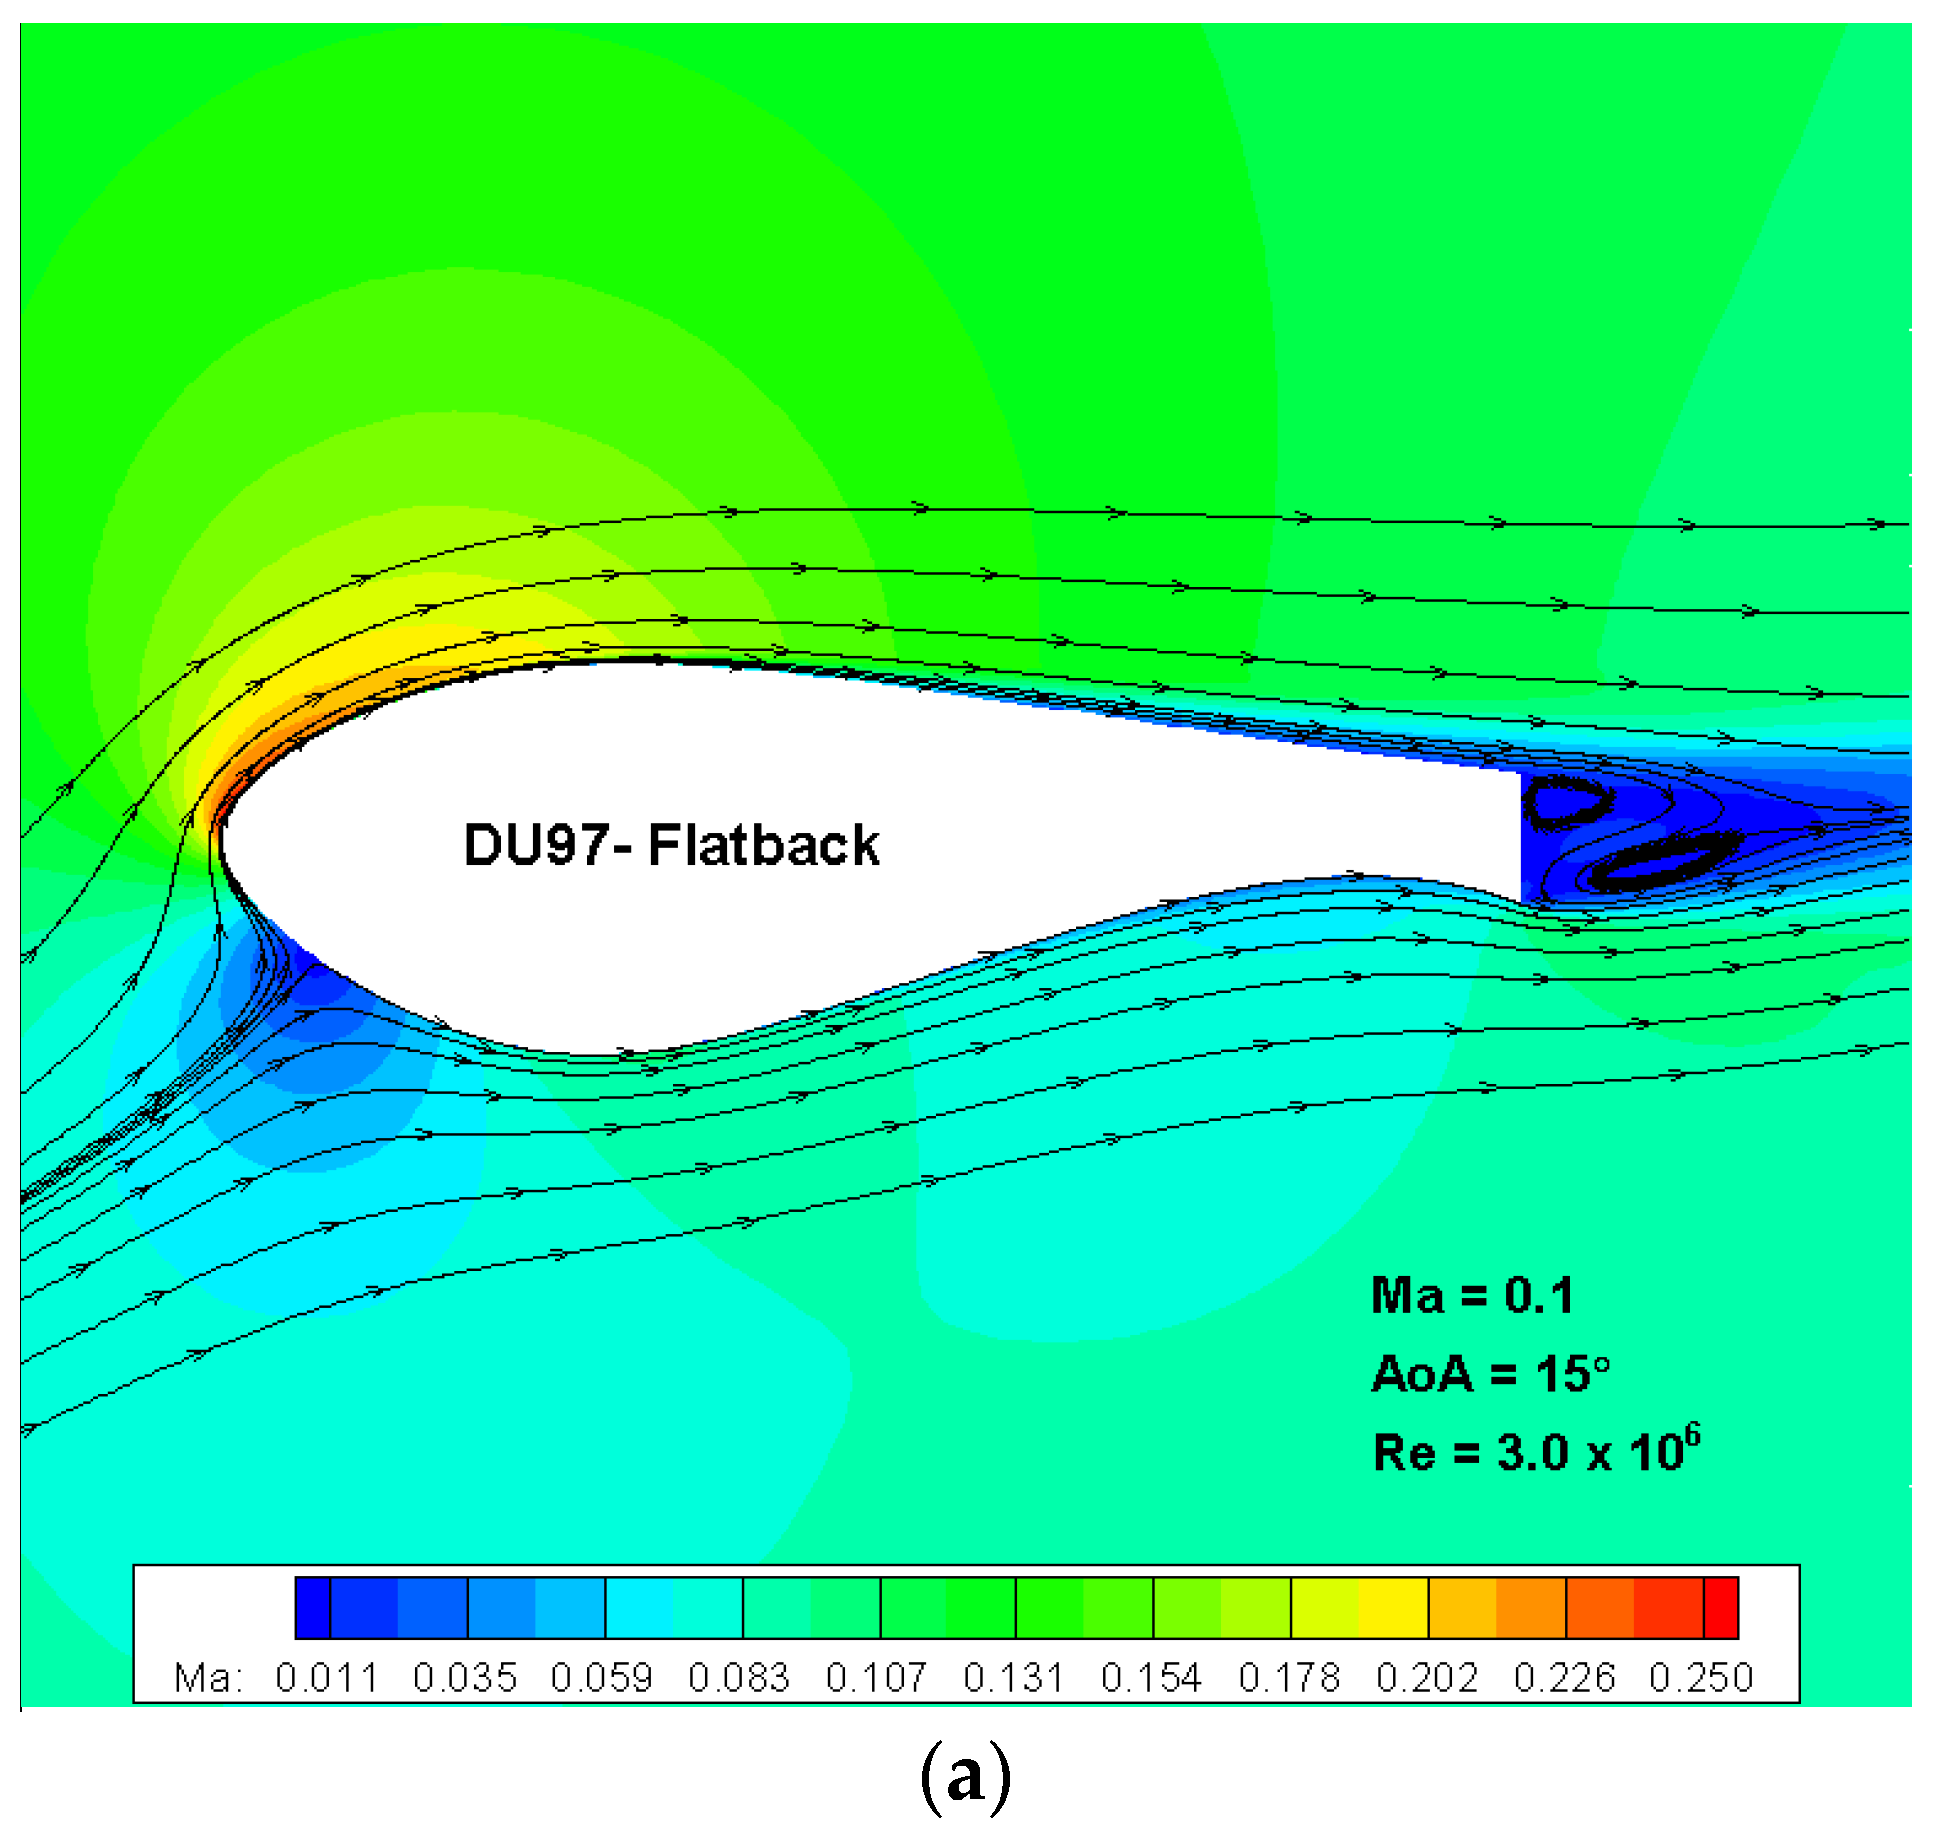
The flow fields of the five airfoils at the same AoA = 15° with streamlines and Mach number contours on the same scale are given in Figure 11. Comparing the first three cases without jets, the baseline DU97-Flatback has the largest counter rotating wake vortex pair due to the bluntest trailing edge, thus producing the largest base drag. In addition, the comparison of streamline patterns near the bottom trailing edges in Figure 11a–c can intuitively indicates the difference in lift. The streamlines near the bottom trailing edge of the baseline DU97-Flatback and PCC-off are both forced to bend more downward than FCC-off, due to the presence of the sharp and downward-oriented corner. The circular shape of the bottom trailing edge after the FCC modification results in a significant change to the effective camber as well as the trailing edge Kutta condition. The streamlines near the bottom trailing edge of FCC-off will not bend downward as much as the PCC-off or the baseline DU97-Flatback. Therefore, FCC-off suffers a significant degradation in lift performance, while PCC-off holds the same lift level as the baseline DU97-Flatback, as shown in Figure 9a. For the two cases with Coanda jets activated shown in Figure 11d,e, the streamlines bend downward significantly due to the entrainment of jets. From the discussion on circulation around a lifting circular cylinder in the classic aerodynamics textbook by Anderson [41], a larger circulation is accompanied by a larger deflection of free stream direction and a more downstream leading edge stagnation point. Therefore, in this sense, the Coanda jets in Figure 11d,e drastically increase the circulation and hence the lift. To compare the deflection degrees of freestream streamlines in an intuitive way, the views in Figure 11 are all displayed in the same scale when plotting these flow fields, and the streamlines through the respective leading edge stagnation points are given. It can be seen that the streamlines of PCC-on bend downward the most, and the streamline deflection degree of FCC-on is weaker than but very close to that of PCC-on, which will be further illustrated in Figure 12 by comparing the pressure distributions.
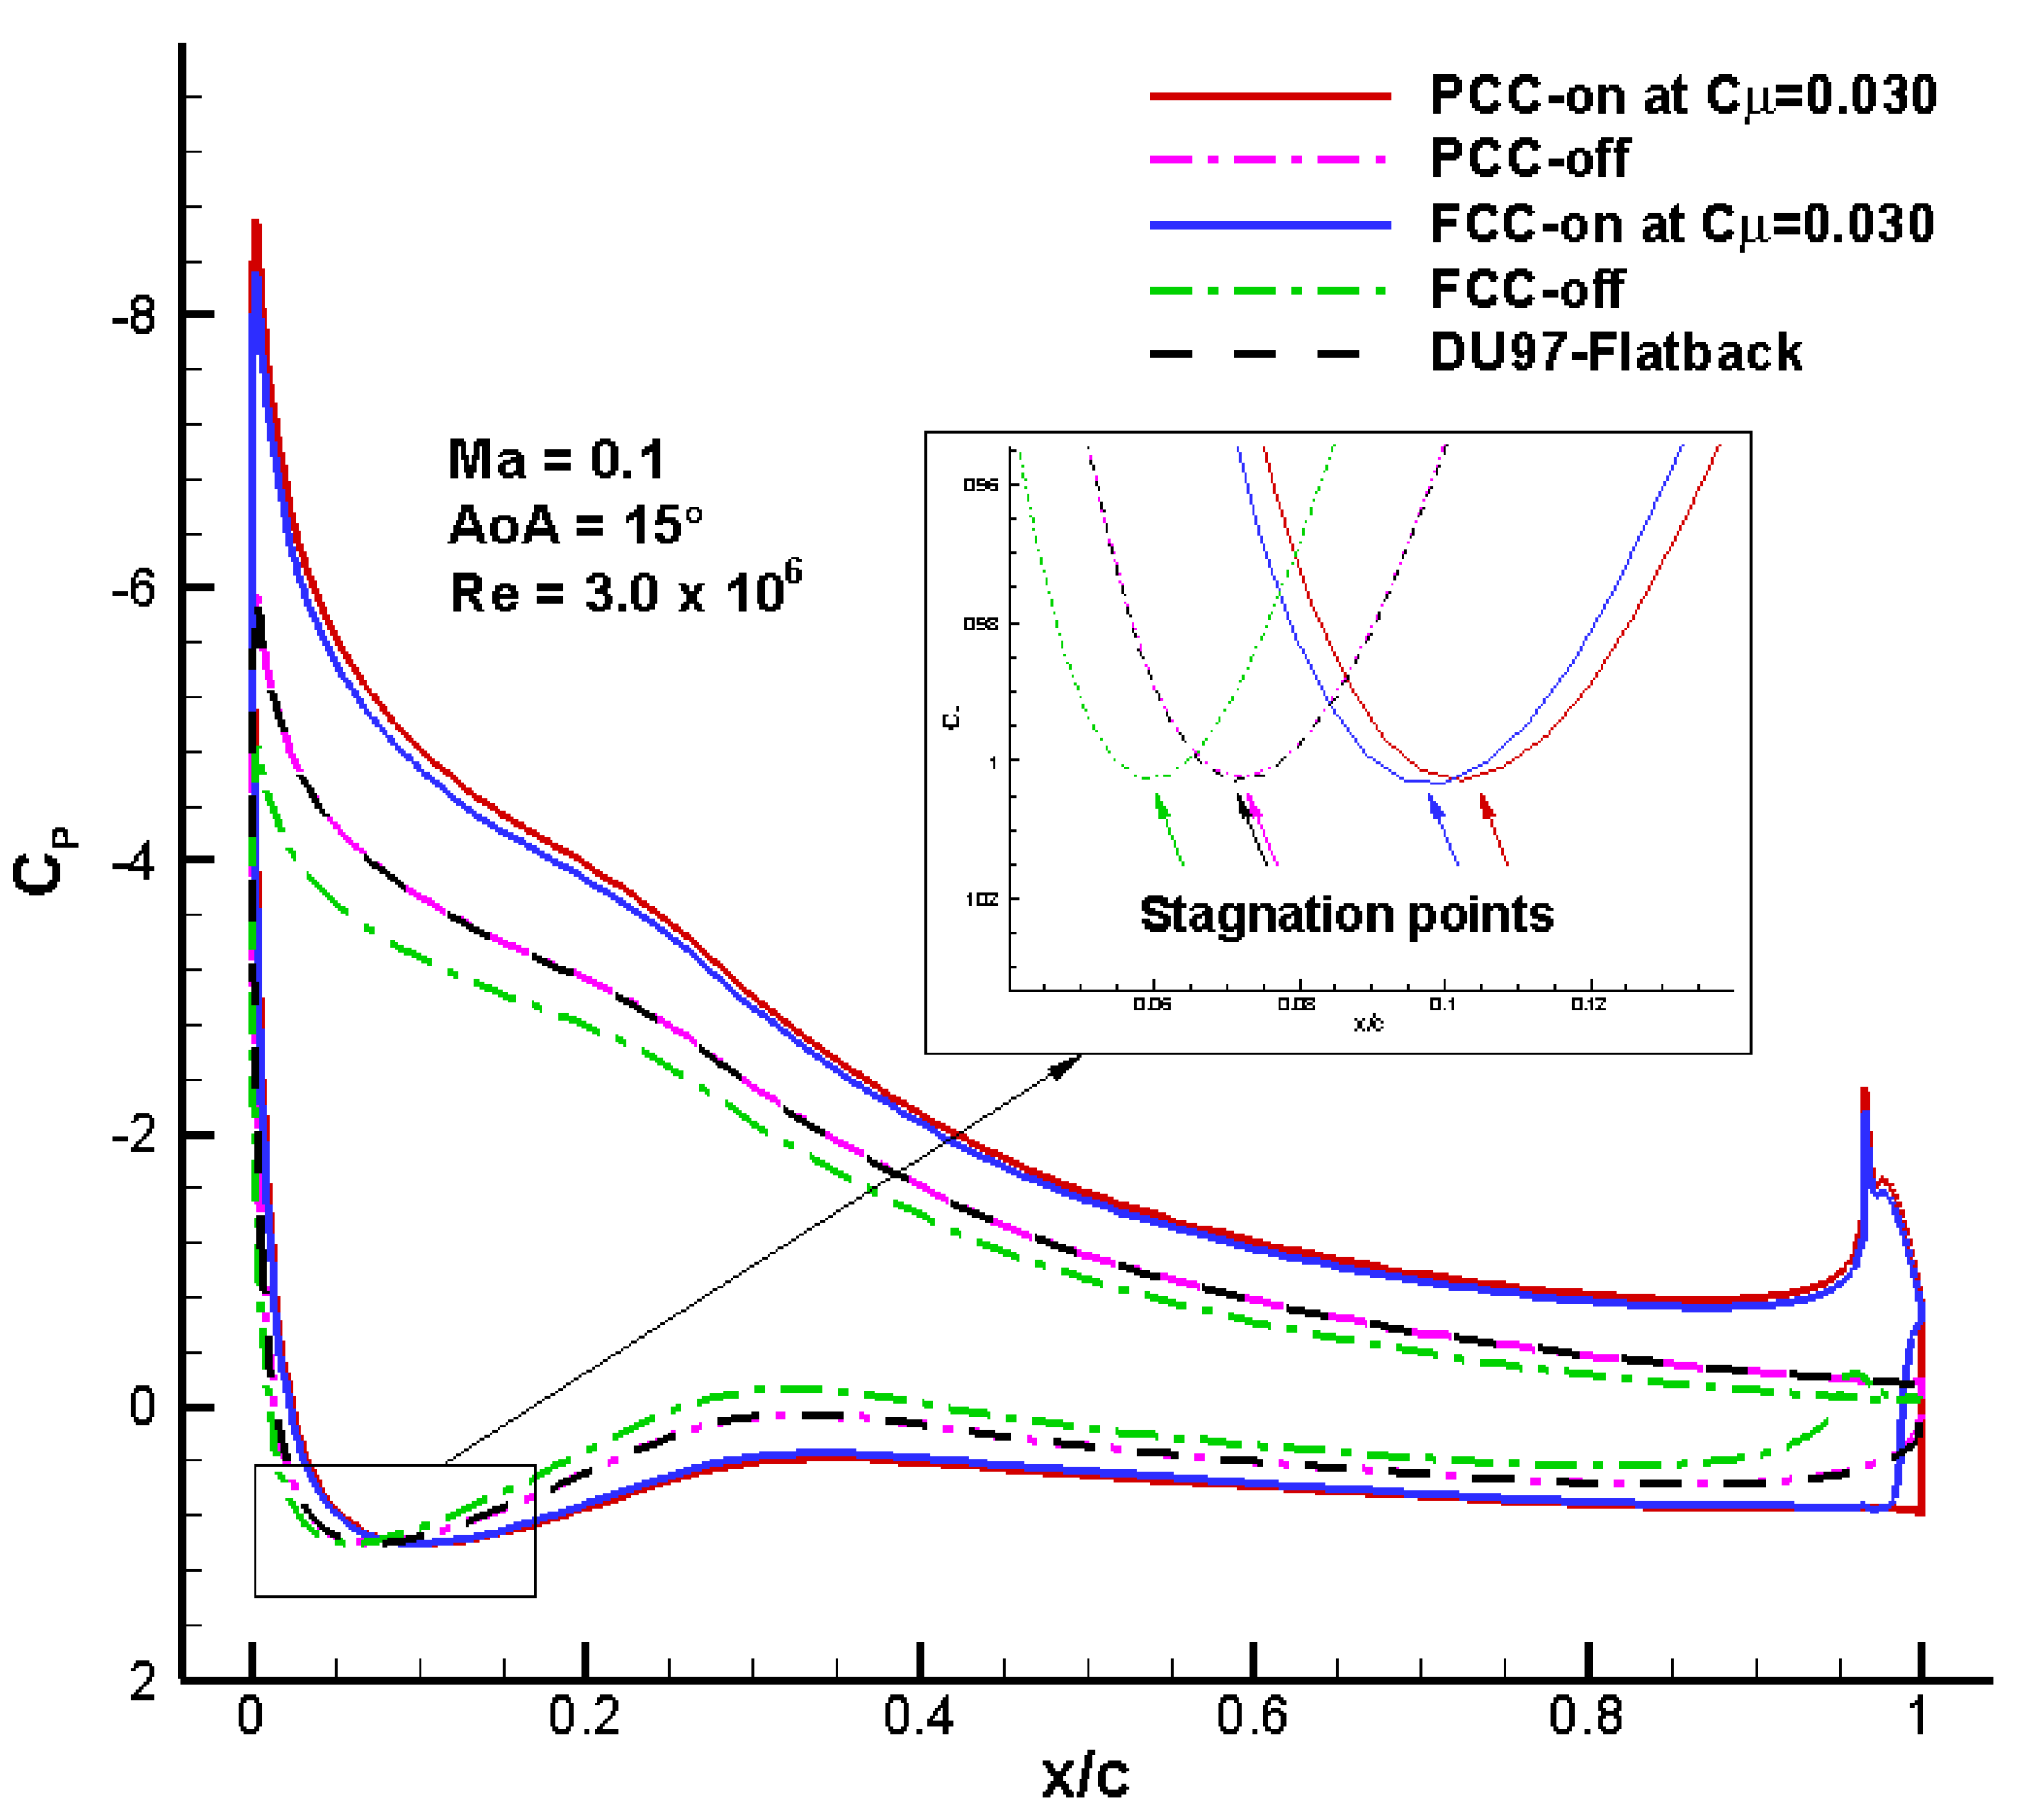
Figure 12 shows the pressure distributions of all the above five cases at the same AoA = 15° with an enlarged window indicating the locations of leading edge stagnation points. Comparing PCC-on and FCC-on, we can find that the enclosed area of PCC-on is a little larger than that of FCC-on, and the leading edge suction surface and bottom trailing edge surface contribute the most to the surplus area. The pressure distribution of PCC-off is almost coincident with that of the baseline DU97-Flatback. The enclosed area of FCC-off is significantly reduced, compared with DU97-Flatback. It is obviously noted that the FCC-off modification to the trailing edge causes significant loss of the suction on the upper surface and pressure on the bottom trailing edge area. The locations of stagnation points shown in the close-up window reflect the difference between the enclosed areas and hence lifts. The larger the enclosed area, the higher the lift generated, and the more downstream the leading edge stagnation point will move. PCC-off has a slightly more downstream stagnation point than the baseline DU97-Flatback (although seemingly coincident), indicating a slightly higher lift coefficient. PCC-on has the most downstream stagnation point since it has the highest lift coefficient. Therefore, from the pressure distribution analysis, it is further demonstrated that the PCC design is a better choice to implement CC on the flatback airfoil.
5.2. Comparison of the Jet Momentum Coefficient Effect
Just as its name implies, circulation control is to change a body’s aerodynamic characteristics, especially enhancing lift, by controlling the circulation around the body via a Coanda jet, in which the strength of a jet is characterized by the parameter of momentum coefficient Cμ. Therefore, for the circulation control study, it is important to figure out the variation law of aerodynamic characteristics versus jet momentum coefficient, in order to guide the practical application. In practice, the large wind turbine is usually operating with variable speed. A variable speed wind turbine is regulated by collective pitch control, and the power output coefficient is often but not always constant within the region from cut-in wind speed to the rated wind speed [42,43]. Under normal working conditions, the angle of incidence of blade section always remains relatively large but below stall, corresponding to the maximum lift to drag ratio when at optimum. For the present study, according to Figure 9, AoA = 15° has a relatively large lift as well as lift-to-drag ratio for DU97-Flatback, and hence it is a usable angle of attack to operate under normal working conditions. Therefore, in this study AoA = 15° is selected to perform the investigation of the jet momentum coefficient effect in this subsection as well as the aerodynamic figure of merit analysis in the next subsection.
Fifteen more cases for the PCC-on and FCC-on configurations with a range of Cμ from 0.010 to 0.080 are simulated under the same conditions: Ma = 0.10, Re = 3.0 × 10⁶, AoA = 15°. The computed lift and drag coefficients are plotted versus Cμ in Figure 13. The discrete points of the computed lift coefficients for PCC-on and FCC-on are fitted with piecewise straight lines, respectively, to better display the variation law versus Cμ. It is found that the common feature of PCC-on and FCC-on is that the lift coefficient varies linearly with increasing Cμ with a fixed slope till a certain transition Cμ, and then continues to increase with increasing Cμ but with a lower fixed slope till beyond Cμ = 0.080. Indeed, this feature is consistent with the previous finding in the circulation control research by the aeronautical community [44] and in the previous work at a much lower AoA [21]. In general, circulation control experiences two typical regimes as Cμ increases, which are defined as separation control and super-circulation control [44], as illustrated in Figure 13a. The two regimes are characterized by different global lift-enhancement efficiencies which can be reflected by the slope of the lift coefficient curve versus Cμ. All the previous findings showed that the lift-enhancement efficiency in the separation control regime is higher than the super-circulation control regime. The present results also demonstrate that PCC-on and FCC-on at the present specific condition both exhibit the same global feature. However, there are also some significant differences between PCC-on and FCC-on, such as the lift coefficient level, the value of transition Cμ and the slope of each regime. The lift coefficient of PCC-on is much higher than that of FCC-on over the entire investigated Cμ, demonstrating the superiority of PCC-on over FCC-on. The transition Cμ of PCC-on is about 0.030, while the transition Cμ of FCC-on is delayed to about 0.038, indicating that PCC-on will enter super-circulation control earlier than FCC-on. Regarding the slope, FCC-on has a higher slope in the separation control regime, while PCC-on has a slightly higher slope in the super-circulation control regime; namely, the lift-enhancement efficiency of PCC-on is lower in the separation regime, but higher in the super-circulation regime. For the drag coefficient shown in Figure 13b, PCC-on and FCC-on have different variation trend with increasing Cμ. The CD of PCC-on decreases monotonically with increasing Cμ, and the average slope in the separation control regime is lower than that in the super-circulation control regime. The CD of FCC-on first decreases to a minimum at about Cμ = 0.030, and then increases to a maximum at about Cμ = 0.047, and then decreases again nearly linearly with a much lower slope than PCC-on. Overall, the drag variation of PCC-on is much more drastic than that of FCC-on.
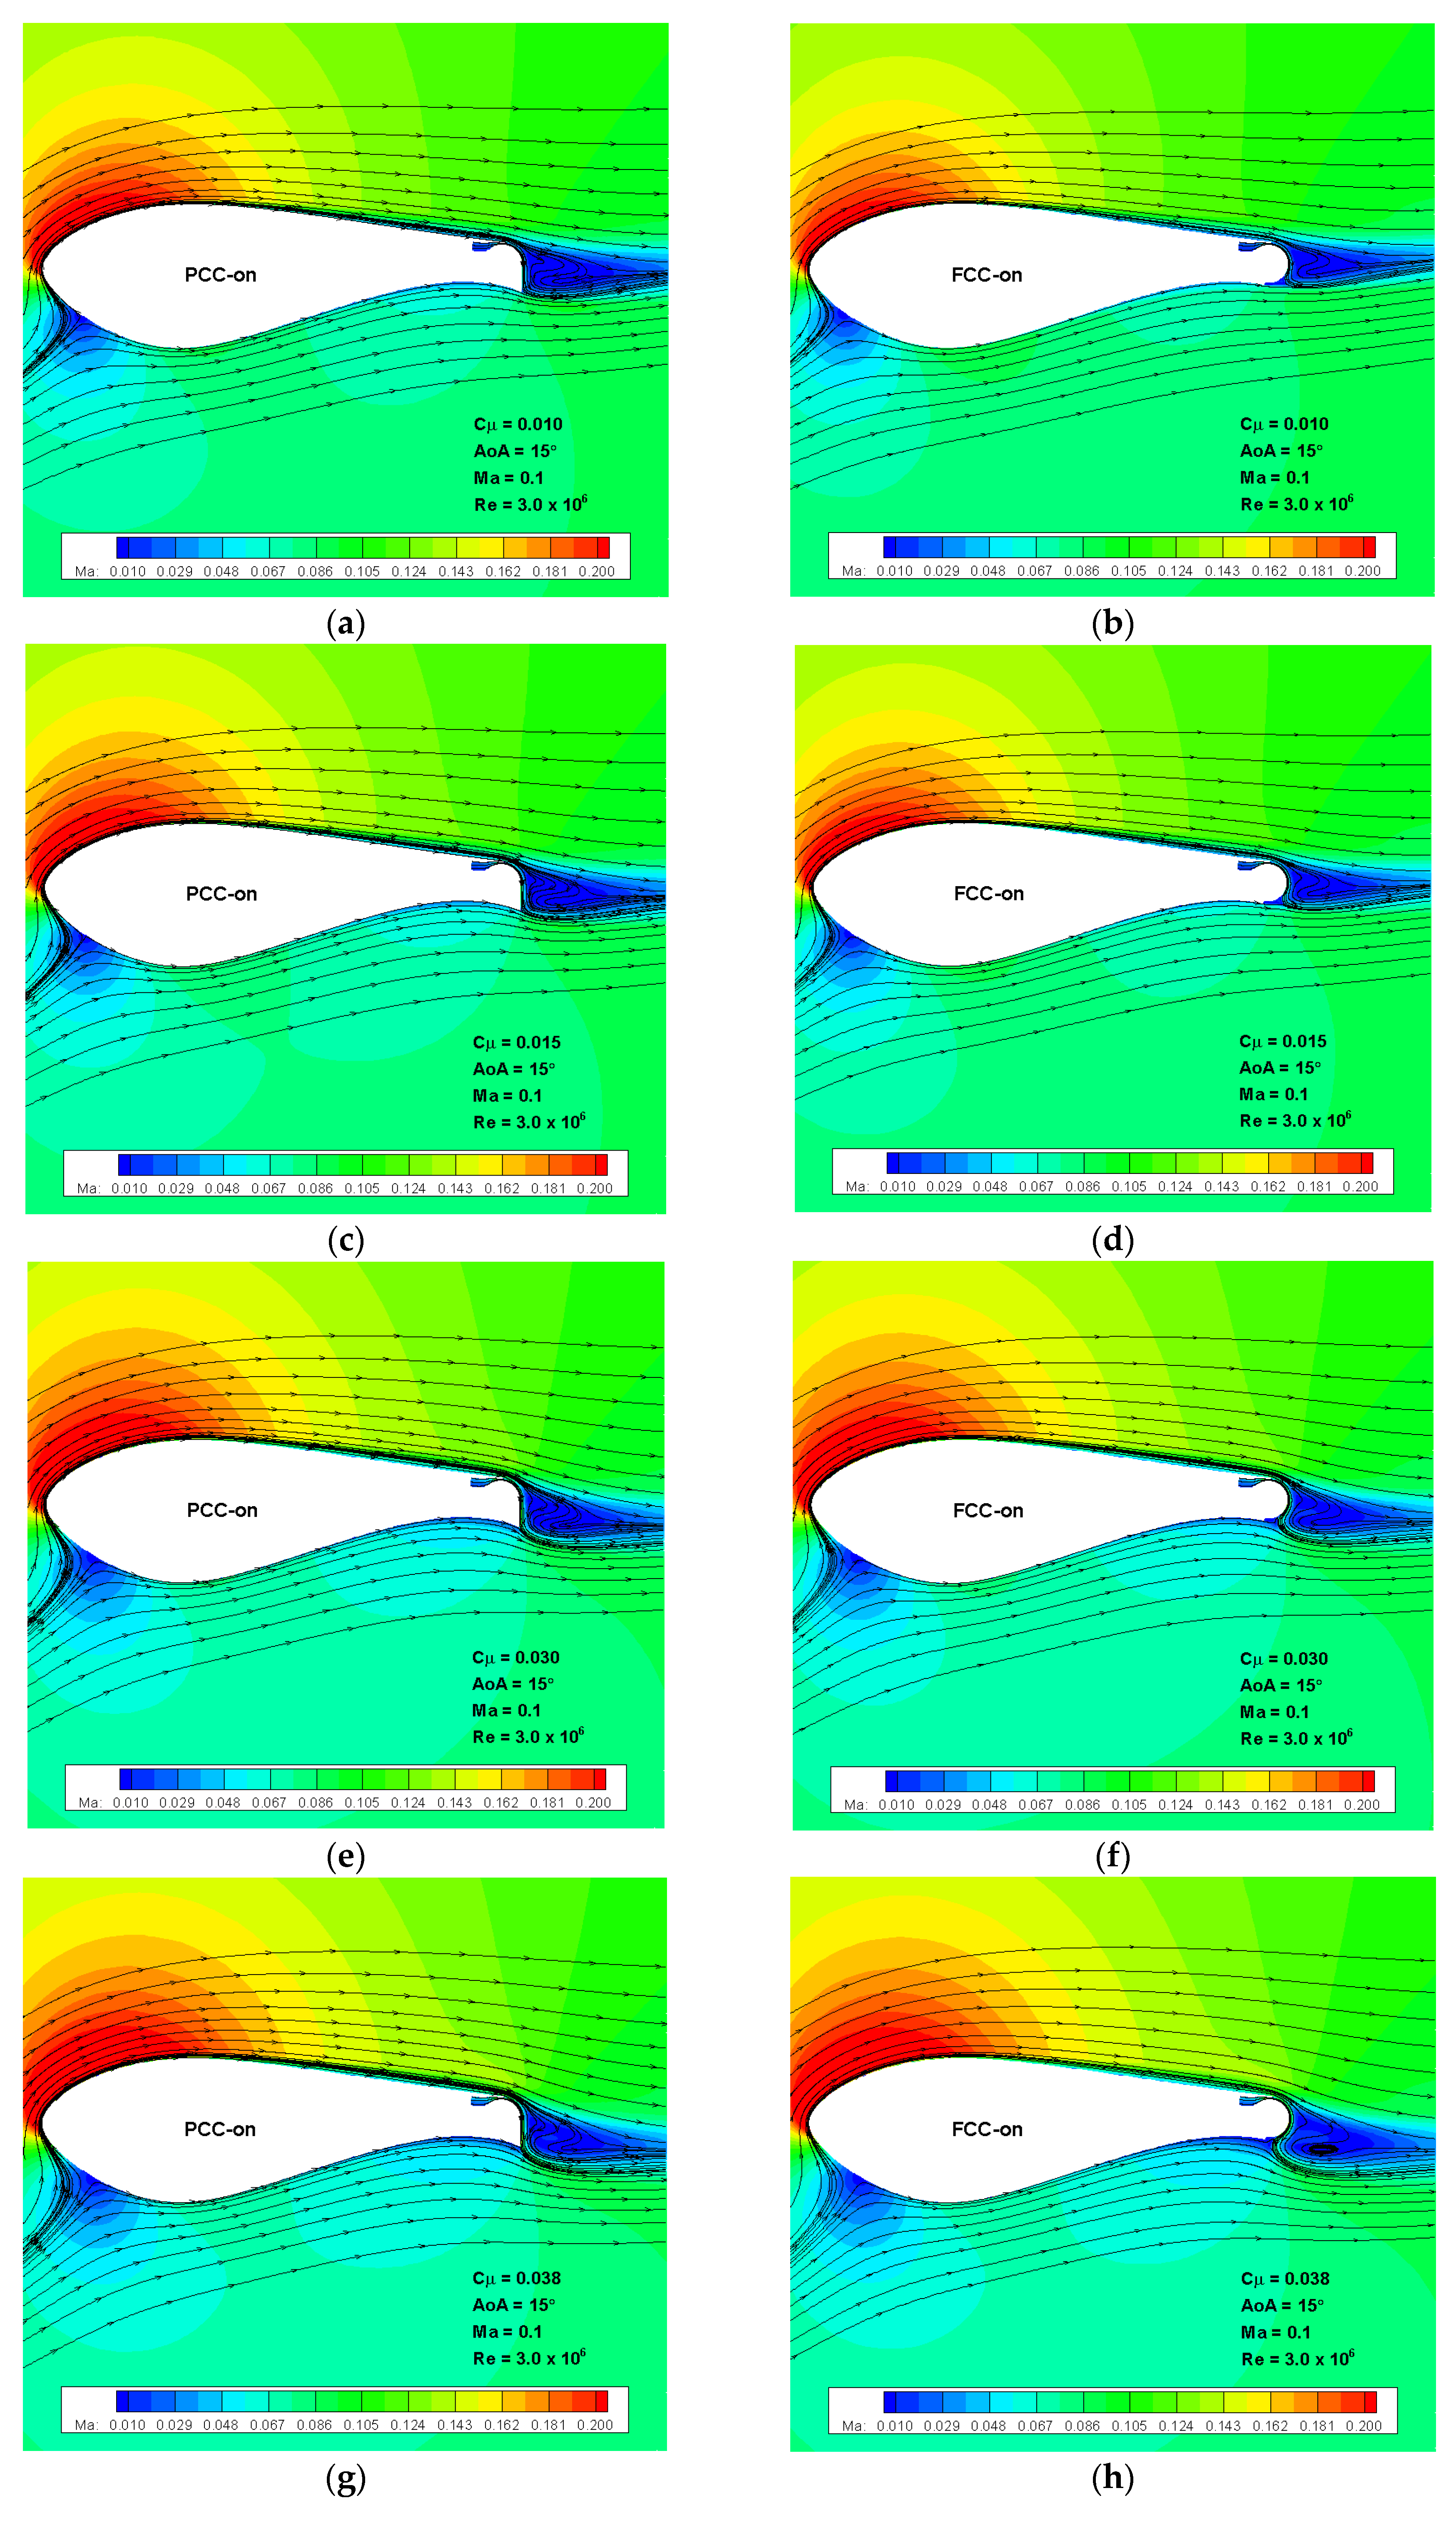
Figure 14 shows the flow fields of both PCC-on and FCC-on at different Cμ levels with streamlines and Mach number contours. The plotted views as well as Mach number legends of all figures are in the same scale, respectively, in order to make comparison easier and more intuitive. Comparing the contours of different configurations at the same Cμ, we can easily see that the flow speed of PCC-on at the leading edge suction area is higher than that of FCC-on. Taking Cμ = 0.010 for example, the range of the same legend red color in Figure 14a near the leading edge is obviously larger than that in Figure 14b, indicating that a stronger suction is generated for PCC-on. Similarly, comparing the contours of the same configuration at different Cμ, we can also easily see the difference in lift generated. Taking PCC-on at the lowest Cμ = 0.010 and the highest Cμ = 0.080 for example, the red color area in Figure 14m is much larger than that in Figure 14a, indicating that the lift generated at Cμ = 0.080 is much higher than that at Cμ = 0.010. The comparison can also be performed using the deflection of the freestream streamlines.
For the traditional CC, the separation location of the jet on the Coanda surface determines whether the jet is performing a separation control or a super-circulation control [21]. The present FCC-on also exhibits the same feature. For the cases with Cμ = 0.010~0.038, as shown in Figure 14b,d,f,h, which correspond to the separation control regime, the separation locations are all on the Coanda surface, and the separation location of the case with Cμ = 0.038 is very close to the bottom end of the Coanda surface. For the cases with Cμ = 0.047~0.080 which correspond to the super-circulation control regime, as shown in Figure 14j,l,n, the separation locations are all at the bottom end of the Coanda surface; that is to say, the bottom step forces the jet to separate in the super-circulation control regime. From Figure 14b,d,f,h, it can be seen that the flow separation in the wake of the trailing edge is well controlled by implementing the Coanda jet. Thus, this observation explains the reason why the control type is defined as “separation control”. As can be seen in Figure 14j,l,n, the attached Coanda jet injects into the main flow below the trailing edge at a large angle relative to the main flow, acting as a jet-type Gurney flap. There appears a gradually increasing standing vortex just before the jet plume, and a large vortex region behind the jet plume. Therefore, in this sense, the super-circulation control for FCC-on can be viewed as a kind of pneumatic flap, the effect of which on the lift enhancement is proportional to the jet strength Cμ. This could explain why the slope in the super-circulation control regime is nearly a constant. It is noteworthy that the standing vortex existing before the pneumatic flap changes the aerodynamic effective shape of FCC-on by significantly increasing the thickness of the aft part, and this could be one reason why the slope of FCC-on is a little lower than that of PCC-on in the super-circulation control regime, as shown in Figure 13a.
For the PCC-on cases shown in Figure 14, the flow fields are not as complex as those of FCC-on, mainly because the jet travels the entire Coanda surface without separation in every case, regardless of the jet strength Cμ. As shown in Figure 14a,c,e, the jet is not strong enough to affect the bottom main flow, although it attaches the Coanda surface all the time before reaching the bottom corner. The influence of this weak jet on the entire flow field can be viewed as separation control, and the wake vortex structure is even like that of the corresponding FCC-on case. After the jet strength exceeds Cμ = 0.030, the jet is sufficiently strong to affect the bottom main flow, acting as a pneumatic flap. Hence, the super-circulation control starts. However, the flow structures behind and before the jet plume are quite different from those of FCC-on. There is neither a standing vortex before the jet plume nor a large separation vortex behind the jet plume. For PCC-on, the larger the Cμ, the smoother the flow behind the jet plume; whereas for FCC-on, the larger the Cμ, the larger the separation vortex behind the jet plume will grow. This phenomenon is the most significant difference in the flow field comparison between PCC-on and FCC-on. To say the least, from the viewpoint of energy conservation, less aerodynamic force will be generated if more flow energy is dissipated. Taking the comparison between Figure 14m,n for example, the vortices before and behind the jet plume in the FCC-on case will definitely dissipate an amount of flow energy, consequently resulting in a lower lift generated on the airfoil. Therefore, this is one reason why PCC-on has a much higher lift coefficient as well as a slightly larger increasing slope than FCC-on, as shown in Figure 13a.
5.3. Comparison of Power Consumption, AFM and Control Efficiency
The power consumed by the pump to generate the Coanda jet is given in Figure 15. The power coefficient of PCC-on is very close to but slightly lower than that of FCC-on over the entire range of jet momentum coefficients. The discrepancy seems to increase gradually with increasing Cμ, although it is still very small in value. This observation can be explained by comparing the flow fields shown in Figure 14. From the above analysis, the base drag of PCC-off is larger than that of FCC-off, as shown in the drag coefficient comparison in Figure 9b as well as in the flow field comparison in Figure 11b,c. A higher base drag indicates a lower base pressure due to the separation vortices. Hence, the pressure behind the trailing edge of PCC-off is lower than that of FCC-off. It is a common sense that it will feel easier for the pump to drive the jet flow to a lower pressure area, and hence save power expenditure. Therefore, once the Coanda jet is activated with a same momentum coefficient, the power coefficient of PCC-on will be a little lower than that of FCC-on. Regarding the increasing variation trend of the difference, there is more explanation. Looking at the jet plumes of PCC-on and FCC-on in Figure 14, especially at larger jet momentum coefficients, we can find that the injection directions of the jet into the main flow in PCC-on cases are always perpendicular to the chord line, whereas the jet in FCC-on cases will flow upstream for some distance before it is forced to deflect downstream by the main flow. In the present specific study, the angle between the jet plume direction and local main flow near the bottom trailing edge is an acute angle for PCC-on, but a larger obtuse angle for FCC-on. The influence of the main flow to the jet injection is obviously weaker in PCC-on cases than in FCC-on cases. Therefore, the jet of FCC-on needs to resist more head wind than PCC-on, thus consuming more power. Moreover, the obtuse angle for FCC-on becomes even larger when Cμ increases, while the acute angle for PCC-on remains unchanged. This is why the difference in power coefficient grows with increasing Cμ.
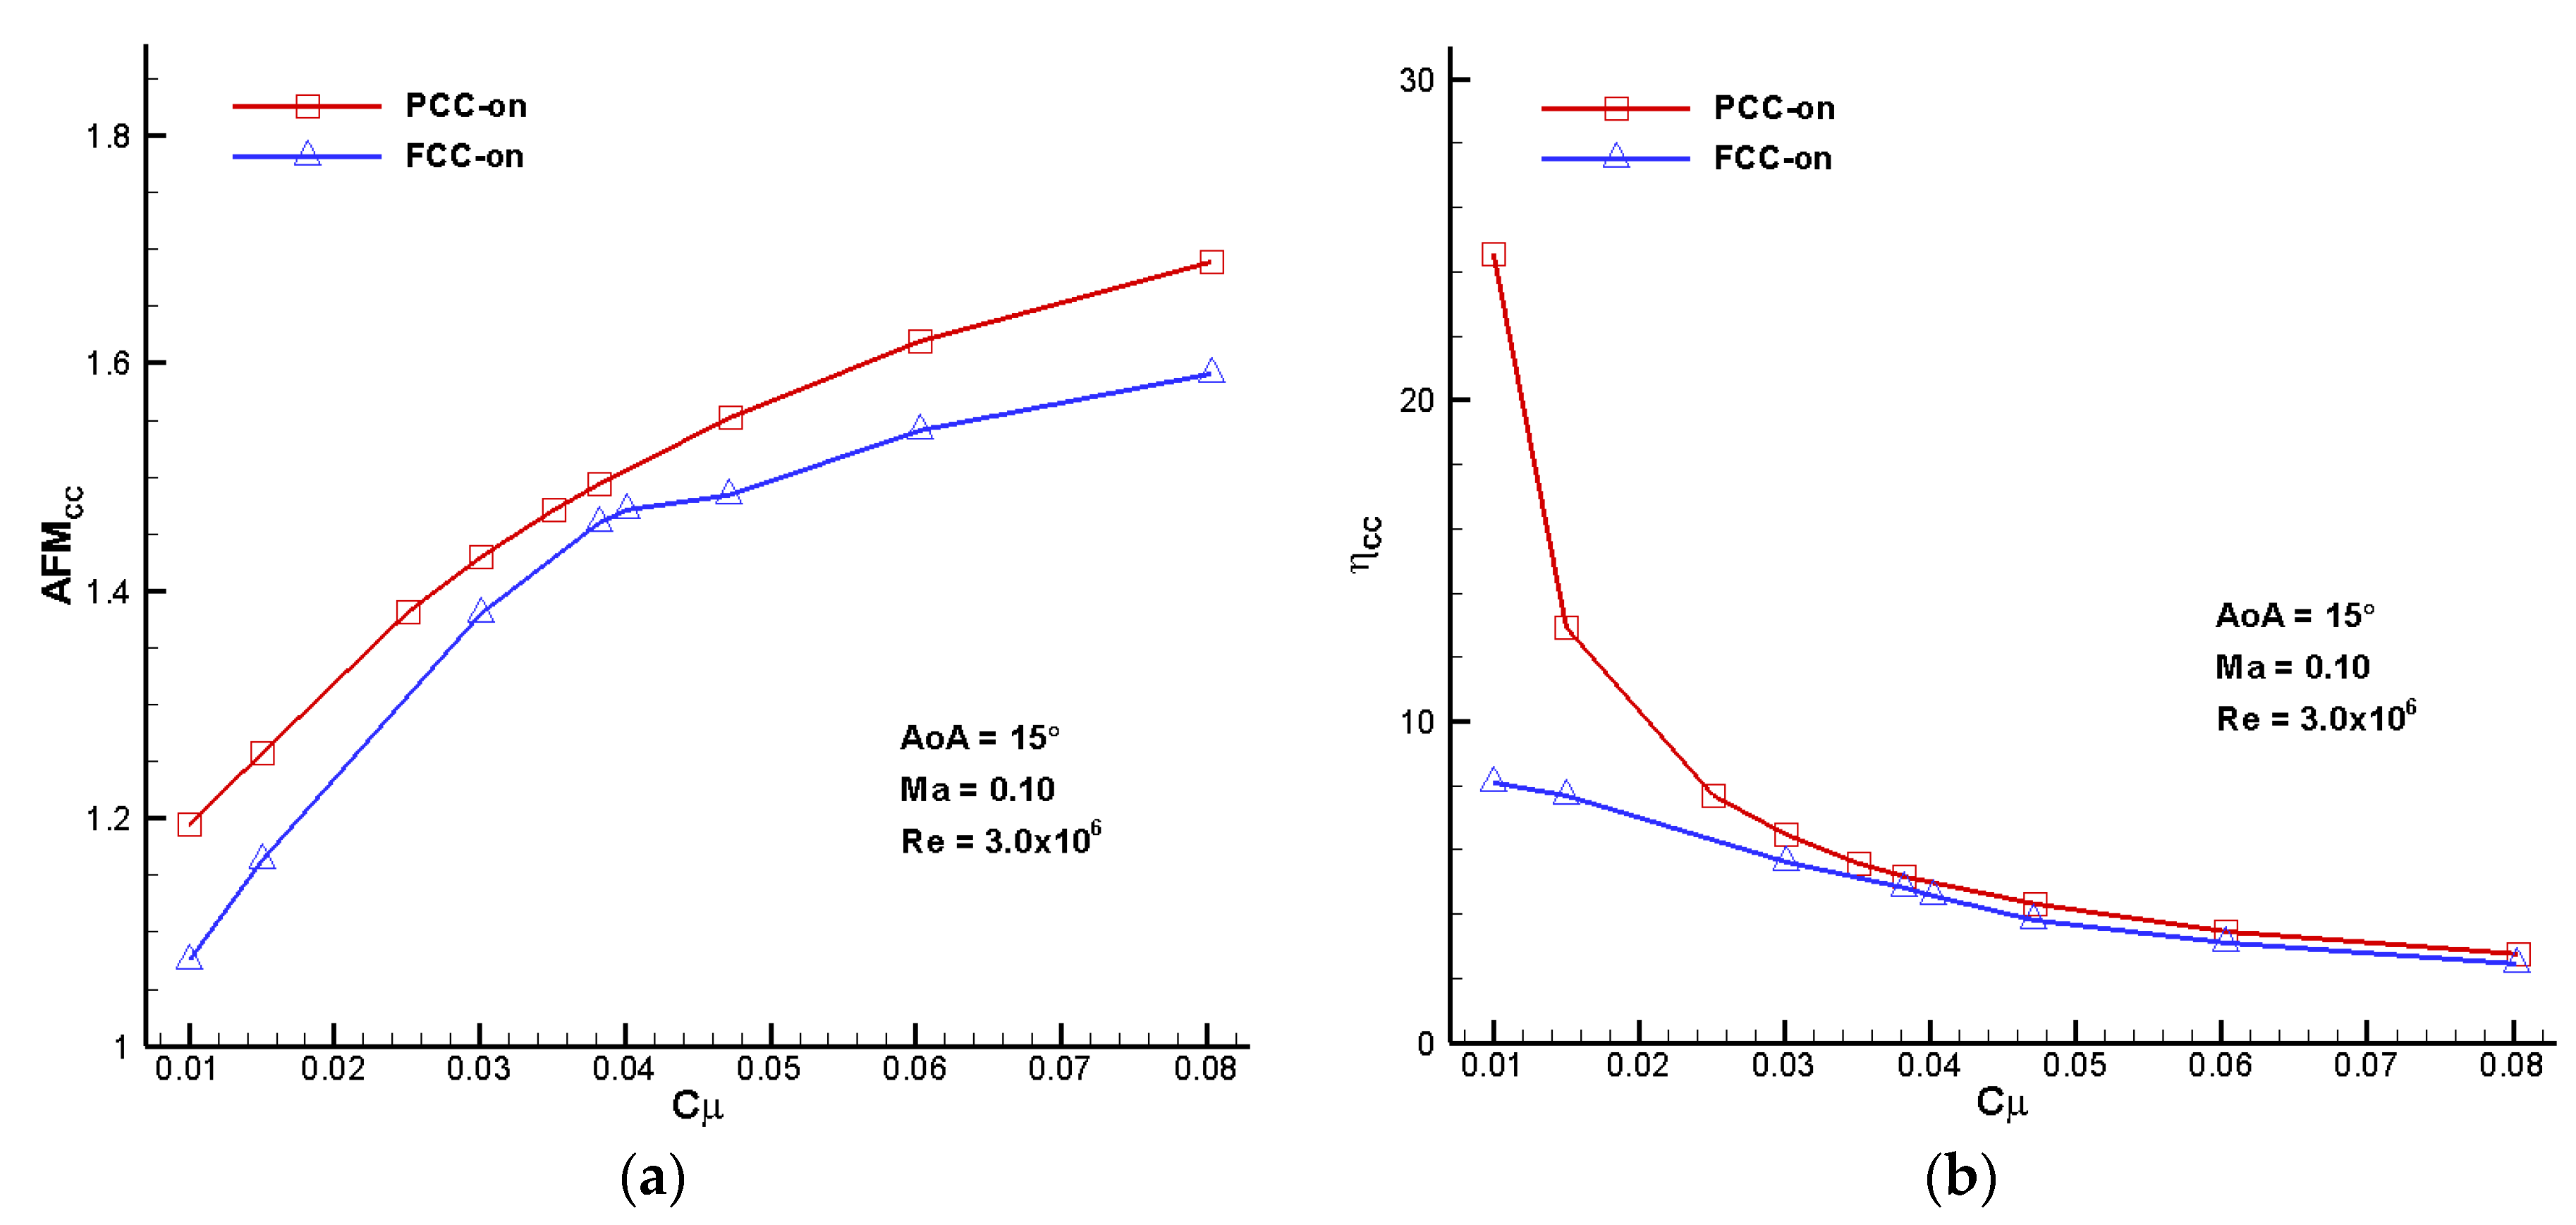
The comparison of aerodynamic figures of merit and circulation control efficiencies is given in Figure 16. As defined in Section 3.4, the AFMCC in the present study is the ratio between the power output gain with circulation control and the power output of the baseline flatback section without control. Therefore, it is desired to obtain an AFMCC greater than unit with circulation control, and the larger the better. From Figure 16a, all the AFMCC of both PCC-on and FCC-on are larger than 1, and the AFMCC of PCC-on is much higher than that of FCC-on over the entire range of Cμ, demonstrating that PCC-on significantly outperforms FCC-on in terms of AFMCC. For example, PCC-on will provide a power output gain of nearly 10% of the total power output of the baseline DU97-Flatback when Cμ = 0.080, compared with FCC-on, which is a relatively large increment in power output. The control efficiency shown in Figure 16b is the ratio of the power output gain with control and the pump power expenditure, hence indicating the ratio between reward and cost. It describes the ability of the circulation control to amplify the consumed power by Coanda jet implementation in terms of rewarded wind power gain. Therefore, ηCC can be essentially viewed as a kind of figure of merit related to power transformation. At first sight, it is a little confusing that the ηCC shown in Figure 16b has an opposite variation trend to that of AFMCC shown in Figure 16a, since they are both ratios between powers. The ηCC monotonically decreases with increasing Cμ, whereas AFMCC monotonically increases with increasing Cμ. To explain more, AFMCC is a figure of merit relative to the power output by the baseline DU97-Flatback which is a fixed quantity in a specific condition, while ηCC is another figure of merit relative to the power input to the circulation control system which is a variable quantity varying with the law shown in Figure 15. Just due to the quite different reference quantities when evaluating AFMCC and ηCC, opposite variation trends are obtained as shown in Figure 16a,b. Clearly, the control efficiency of PCC is much higher in the separation control regime before Cμ = 0.030, and a little higher in the super-circulation control regime, demonstrating that PCC outperforms FCC in terms of control efficiency.
6. Conclusions
The partial circulation control on the flatback wind turbine airfoil is proposed and compared with the traditional full circulation control using computational fluid dynamics. The RANS solver based on Spalart-Allmaras turbulence model is validated by comparing the computed results of the DU97-Flatback and GACC airfoils with experimental data. The performance of PCC and FCC is analyzed and compared from several aspects, including the lift and drag characteristics, flow fields, influence of jet momentum coefficient, power consumption, aerodynamic figure of merit and control efficiency. Some conclusions are drawn as follows: (1) The present solver can adequately predict the aerodynamic characteristics of the blunt trailing edge airfoil as well as CC airfoils, and computed results agree well with test data and CFD results from literature; (2) PCC-off has an attractive advantage that the lift coefficient is no less than that of the baseline flatback airfoil over the entire range of AoAs, while FCC-off has a much lower lift coefficient than that of the baseline flatback airfoil. Moreover, the drag of PCC-off is a little lower than that of the baseline flatback airfoil. Therefore, PCC will not degrade the aerodynamic performance of the wind turbine in case of failure of the circulation control system, and even slightly enhance the performance due to the slightly higher lift coefficient and lower drag coefficient, which is a significant advantage over FCC; (3) PCC-on performs much better in lift enhancement than FCC-on over the entire AoA range as well as the entire Cμ range, but with a little higher drag. From the viewpoint of contribution to power output, the benefit from the great lift enhancement outweighs the disadvantage of a little higher drag level; (4) The two typical control regimes, namely separation control and super-circulation control, are also found for PCC-on cases. As indicated by the slope of the lift coefficient curves versus Cμ, the lift-enhancement efficiency of PCC is a little lower than that of FCC in the separation control regime, but a little higher in the super-circulation control regime; (5) Investigation of the aerodynamic figure of merit and control efficiency shows that PCC-on has a much higher aerodynamic figure of merit as well as higher control efficiency over the entire Cμ range, indicating that PCC-on can generate more wind power than FCC-on. In summary, the PCC implementation can greatly enhance the aerodynamic characteristics as well as the aerodynamic figure of merit, and outperforms the traditional FCC implementation in all respects. It is demonstrated that PCC is an attractive and promising flow control strategy in the blunt trailing edge wind turbine application.
The present study focuses on the active circulation control, and doesn’t involve any passive control study such as the vortex generator. Due to the lack of the similar AFM study on blunt trailing edge airfoils using vortex generators, no quantitative comparison of AFM could be provided at this stage. In view of the significant enhancement in aerodynamic characteristics using the proposed PCC, it could be qualitatively expected that the AFM of PCC is much higher than that of vortex generators. However, despite the attractive advantages in terms of aerodynamic characteristics enhancement, the implementation of circulation control raises several concerns, such as noise emission from the jet, structural reinforcement due to the requirement of spanwise slots, possible ice accretion at the jet exit when the jet is turned off. Regarding the noise problem, the upside of applying circulation control is the suppression of the base vortex and hence a lower noise emission from the base vortex shedding; the downside is that the jet itself will cause some amount of noise. The comparison between the wake flow noise reduction and the jet noise emission remains to be investigated. Regarding the structural reinforcement due to the implementation of the Coanda jet, the cost may offset some amount of profit from circulation control. In the cold rainy or snowy weather, the circulation control system will be turned off to prevent possible adverse effects, and ice accretion at the jet exit may be encountered. Therefore, such concerns require further efforts to make the circulation control more practical for wind turbine applications.
Acknowledgments
This work was partially supported by the National Natural Science Foundation of China (Grant No. 11472223), the Science and Technology Program of Shenzhen government (Grant No. JCYJ20160331142601031), the Aeronautical Science Foundation of China (Grant No. 2016ZA53008), the Natural Science Foundation of Shaanxi Province (Grant No. 2016JM1015), the 111 Project (B17037), ATCFD Project (2015-F-016) and the Fundamental Research Funds for the Central Universities of China. The authors would like to acknowledge the computing services from the High Performance Computing Center of Northwestern Polytechnical University.
Author Contributions
He-Yong Xu wrote the paper. Qing-Li Dong and Chen-Liang Qiao carried out the numerical simulations. Zheng-Yin Ye analyzed the calculated results and provided constructive guidance in the process of preparing this paper.
Conflicts of Interest
The authors declare no conflict of interest.
References
- Sun, X.J.; Huang, D.G.; Wu, G.Q. The current state of offshore wind energy technology development. Energy 2012, 41, 298–312. [Google Scholar] [CrossRef]
- Johnson, S.J.; Baker, J.P.; van Dam, C.P.; Berg, D. An overview of active load control techniques for wind turbines with an emphasis on microtabs. Wind Energy 2010, 13, 239–253. [Google Scholar] [CrossRef]
- Aubrun, S.; Leroy, A.; Devinant, P. A review of wind turbine-oriented active flow control strategies. Exp. Fluids 2017, 58, 134. [Google Scholar] [CrossRef]
- Standish, K.J.; van Dam, C.P. Aerodynamic analysis of blunt trailing edge airfoils. J. Sol. Energy Eng. 2003, 125, 479–487. [Google Scholar] [CrossRef]
- Murcia, J.P.; Pinilla, A. CFD analysis of blunt trailing edge airfoils obtained with several modification methods. Revista de Ingenieria 2011, 31, 14–24. [Google Scholar]
- Baker, J.; Mayda, E.; van Dam, C.P. Experimental analysis of thick blunt trailing-edge wind turbine airfoils. J. Sol. Energy Eng. 2006, 128, 422–431. [Google Scholar] [CrossRef]
- Lee, S.G.; Park, S.J.; Lee, K.S.; Chung, C. Performance prediction of NREL (National Renewable Energy Laboratory) Phase VI blade adopting blunt trailing edge airfoil. Energy 2012, 47, 47–61. [Google Scholar] [CrossRef]
- Hand, M.M.; Simms, D.A.; Fingersh, L.J.; Jager, D.W.; Contrell, J.R.; Schreck, S.J.; Larwood, S.M. Unsteady Aerodynamics Experiment Phase VI: Wind Tunnel Test Configurations and Available Data Campaigns; NREL/TP-500-29955; National Renewable Energy Laboratory (NREL): Fort Collins, CO, USA, 2001.
- Berry, D.; Lockard, S.; Jackson, K.; Zuteck, M.; van Dam, C. Innovative Design Approaches for Large Wind Turbine Blades: Final Report; SAND 2004-0074; Sandia National Laboratories: Albuquerque, NM, USA, 2004.
- Manolesos, M.; Voutsinas, S.G. Experimental study of drag-reduction devices on a flatback airfoil. AIAA J. 2016, 54, 3382–3396. [Google Scholar] [CrossRef]
- Baker, J.P.; van Dam, C.P. Drag reduction of blunt trailing-edge airfoil. In Proceedings of the International Colloquium on Bluff Bodies Aerodynamics and Applications, Milano, Italy, 20–24 July 2008. [Google Scholar]
- Baker, J.P.; van Dam, C.P.; Gilbert, B.L. Flatback Airfoil Wind Tunnel Experiment; Sandia National Laboratory Report, SAND 2008-2008; Sandia National Laboratory: Albuquerque, NM, USA, 2008.
- Nash, J.F. A Discussion of Two-Dimensional Turbulent Base Flows; Aeronautical Research Council, TR R&M 3468; Her Majesty’s Stationery Office: London, UK, 1967. [Google Scholar]
- Tanner, M. Reduction of base drag. Prog. Aerosp. Sci. 1975, 16, 369–384. [Google Scholar] [CrossRef]
- Gai, S.L.; Sharma, S.D. Experiments on the reduction of base drag of a blunt trailing edge aerofoil in subsonic flow. Aeronaut. J. 1981, 85, 206–210. [Google Scholar]
- Krentel, D.; Nitsche, W. Investigation of the near and far wake of a bluff airfoil model with trailing edge modifications using time-resolved particle image velocimetry. Exp. Fluids 2013, 54, 1–16. [Google Scholar] [CrossRef]
- Nikoueeyan, P.; Strike, J.A.; Magstadt, A.S.; Hind, M.D.; Naughton, J.W. Characterization of the aerodynamic coefficients of a wind turbine airfoil with a Gurney flap for flow control applications. In Proceedings of the 32nd AIAA Applied Aerodyanmics Conference, Atlanta, GA, USA, 16–20 June 2014. [Google Scholar]
- Nati, G.; Kotsonis, M.; Ghaemi, S.; Scarano, F. Control of vortex shedding from a blunt trailing edge using plasma actuators. Exp. Therm. Fluid Sci. 2013, 46, 199–210. [Google Scholar] [CrossRef]
- Kotsonis, M.; Pul, R.; Veldhuis, L. Influence of circulation on a rounded-trailing-edge airfoil using plasma actuators. Exp. Fluids 2014, 55, 1772. [Google Scholar] [CrossRef]
- Naghib-Lahouti, A.; Hangan, H.; Lavoie, P. Distributed forcing flow control in the wake of a blunt trailing edge profiled body using plasma actuators. Phys. Fluids 2015, 27, 035110. [Google Scholar] [CrossRef]
- Xu, H.Y.; Qiao, C.L.; Yang, H.Q.; Ye, Z.Y. Active circulation control on the blunt trailing edge wind turbine airfoil. AIAA J. 2018, 56, 554–570. [Google Scholar] [CrossRef]
- Barone, M.F.; Berg, D. Aerodynamic and aeroacoustic properties of a flatback airfoil: An update. In Proceedings of the 47th AIAA Aerospace Sciences Meeting Including the New Horizons Forum and Aerospace Exposition, Orlando, FL, USA, 5–8 January 2009. [Google Scholar]
- Coanda, H. Lifting Device Coanda Effect. US Patent 1936, 3261, 162. [Google Scholar]
- Timmer, W.A.; van Rooij, R.P.J.O.M. Summary of the Delft University wind turbine dedicated airfoils. J. Sol. Energy Eng. 2003, 125, 488–496. [Google Scholar] [CrossRef]
- Jones, G.S.; Viken, S.A.; Washburn, A.E.; Jenkins, L.N.; Cagle, C.M. An active flow circulation controlled flap concept for general aviation aircraft applications. In Proceedings of the 1st AIAA Flow Control Conference, St. Louis, MO, USA, 24–26 June 2002. [Google Scholar]
- Cagle, C.M.; Jones, G.S. A wind tunnel model to explore unsteady circulation control for general aviation applications. In Proceedings of the 22nd AIAA Aerodynamic Measurement Technology and Ground Testing Conference, St. Louis, MO, USA, 24–26 June 2002. [Google Scholar]
- Englar, R.J.; Jones, G.S.; Allan, B.G.; Lin, J.C. 2-D circulation control airfoil benchmark experiments intended for CFD code validation. In Proceedings of the 47th AIAA Aerospace Sciences Meeting Including the New Horizons Forum and Aerospace Exposition, Orlando, FL, USA, 5–8 January 2009. [Google Scholar]
- Spalart, P.R.; Allmaras, S.R. A one-equation turbulence model for aerodynamic flows. In Proceedings of the 30th AIAA Aerospace Sciences Meeting and Exhibit, Reno, NV, USA, 6–9 January 1992. [Google Scholar]
- Jamson, A.; Schmidt, W.; Turkel, E. Numerical solutions of the Euler equations by finite volume methods using Runge-Kutta time stepping scheme. In Proceedings of the 14th AIAA Fluid and Plasma Dynamics Conference, Palo Alto, CA, USA, 23–25 June 1981. [Google Scholar]
- Roe, P. Approximate Riemann solvers, parameter vectors, and difference schemes. J. Comput. Phys. 1981, 43, 357–372. [Google Scholar] [CrossRef]
- Van Leer, B. Towards the ultimate conservative difference scheme, V: A second order sequel to Godunov’s method. J. Comput. Phys. 1979, 32, 101–136. [Google Scholar] [CrossRef]
- Yoon, S.; Jameson, A. Lower-upper symmetric-Gauss-Seidel method for the Euler and Navier-Stokes equations. AIAA J. 1988, 26, 1025–1026. [Google Scholar] [CrossRef]
- Hermanns, M. Parallel Programming in FORTRAN95 Using OpenMP. Technique Report, Universidad Politecnica De Madrid, 2002. Available online: http://www.openmp.org/presentations/miguel/F95_OpenMPv1_v2.pdf (accessed on 25 October 2015).
- Jameson, A.; Baker, T.J. Multigrid solution of the Euler equations for aircraft configurations. In Proceedings of the 22nd AIAA Aerospace Sciences Meeting, Reno, NV, USA, 9–12 January 1984. [Google Scholar]
- Seifert, A. Closed-loop active flow control systems: Actuators. In Notes on Numerical Fluid Mechanics and Multidisciplinary Design; King, R., Ed.; Springer: Berlin, Germany, 2007; Volume 95, pp. 85–102. [Google Scholar]
- Stalnov, O.; Kribus, A.; Seifert, A. Evaluation of active flow control applied to wind turbine blade section. J. Renew. Sustain. Energy 2010, 2, 063101. [Google Scholar] [CrossRef]
- Xu, H.Y.; Xing, S.L.; Ye, Z.Y. Numerical study of the S809 airfoil aerodynamic performance using a co-flow jet active control concept. J. Renew. Sustain. Energy 2015, 7, 023131. [Google Scholar] [CrossRef]
- Xu, H.Y.; Qiao, C.L.; Ye, Z.Y. Dynamic stall control on the wind turbine airfoil via a co-flow jet. Energies 2016, 9, 429. [Google Scholar] [CrossRef]
- Xu, H.Y.; Qiao, C.L.; Yang, H.Q.; Ye, Z.Y. Delayed detached eddy simulation of the wind turbine airfoil S809 for angles of attack up to 90 degrees. Energy 2017, 118, 1090–1109. [Google Scholar] [CrossRef]
- Mavriplis, D.J.; Vassberg, J.C.; Tinoco, E.N.; Mani, M.; Brodersen, O.P.; Eisfeld, B.; Wahls, R.A.; Morrison, J.H.; Zickuhr, T.; Levy, D.; et al. Grid quality and resolution issues from the drag prediction workshop series. In Proceedings of the 46th AIAA Aerospace Sciences Meeting and Exhibit, Reno, NV, USA, 7–10 January 2008. [Google Scholar]
- Anderson, J.D. Fundamentals of Aerodynamics, 5th ed.; Mc Graw Hill: New York, NY, USA, 2011. [Google Scholar]
- Lanzafame, R.; Messina, M. Horizontal axis wind turbine working at maximum power coefficient continuously. Renew. Energy 2010, 35, 301–306. [Google Scholar] [CrossRef]
- Sedaghat, A.; Hassanzadeh, A.; Jamali, J.; Mostafaeipour, A.; Chen, W.H. Determination of rated wind speed for maximum annual energy production of variable speed wind turbines. Appl. Energy 2017, 205, 781–789. [Google Scholar] [CrossRef]
- Jones, G.S.; Lin, J.C.; Allan, B.G.; Milholen, W.E.; Rumsey, C.L.; Swanson, R.C. Overview of CFD validation experiments for circulation control applications at NASA. In Proceedings of the International Powered Lift Conference, London, UK, 22 July 2008; pp. 22–24. [Google Scholar]
Figure 1.
Profiles of the flatback and CC (Circulation Control) airfoils.
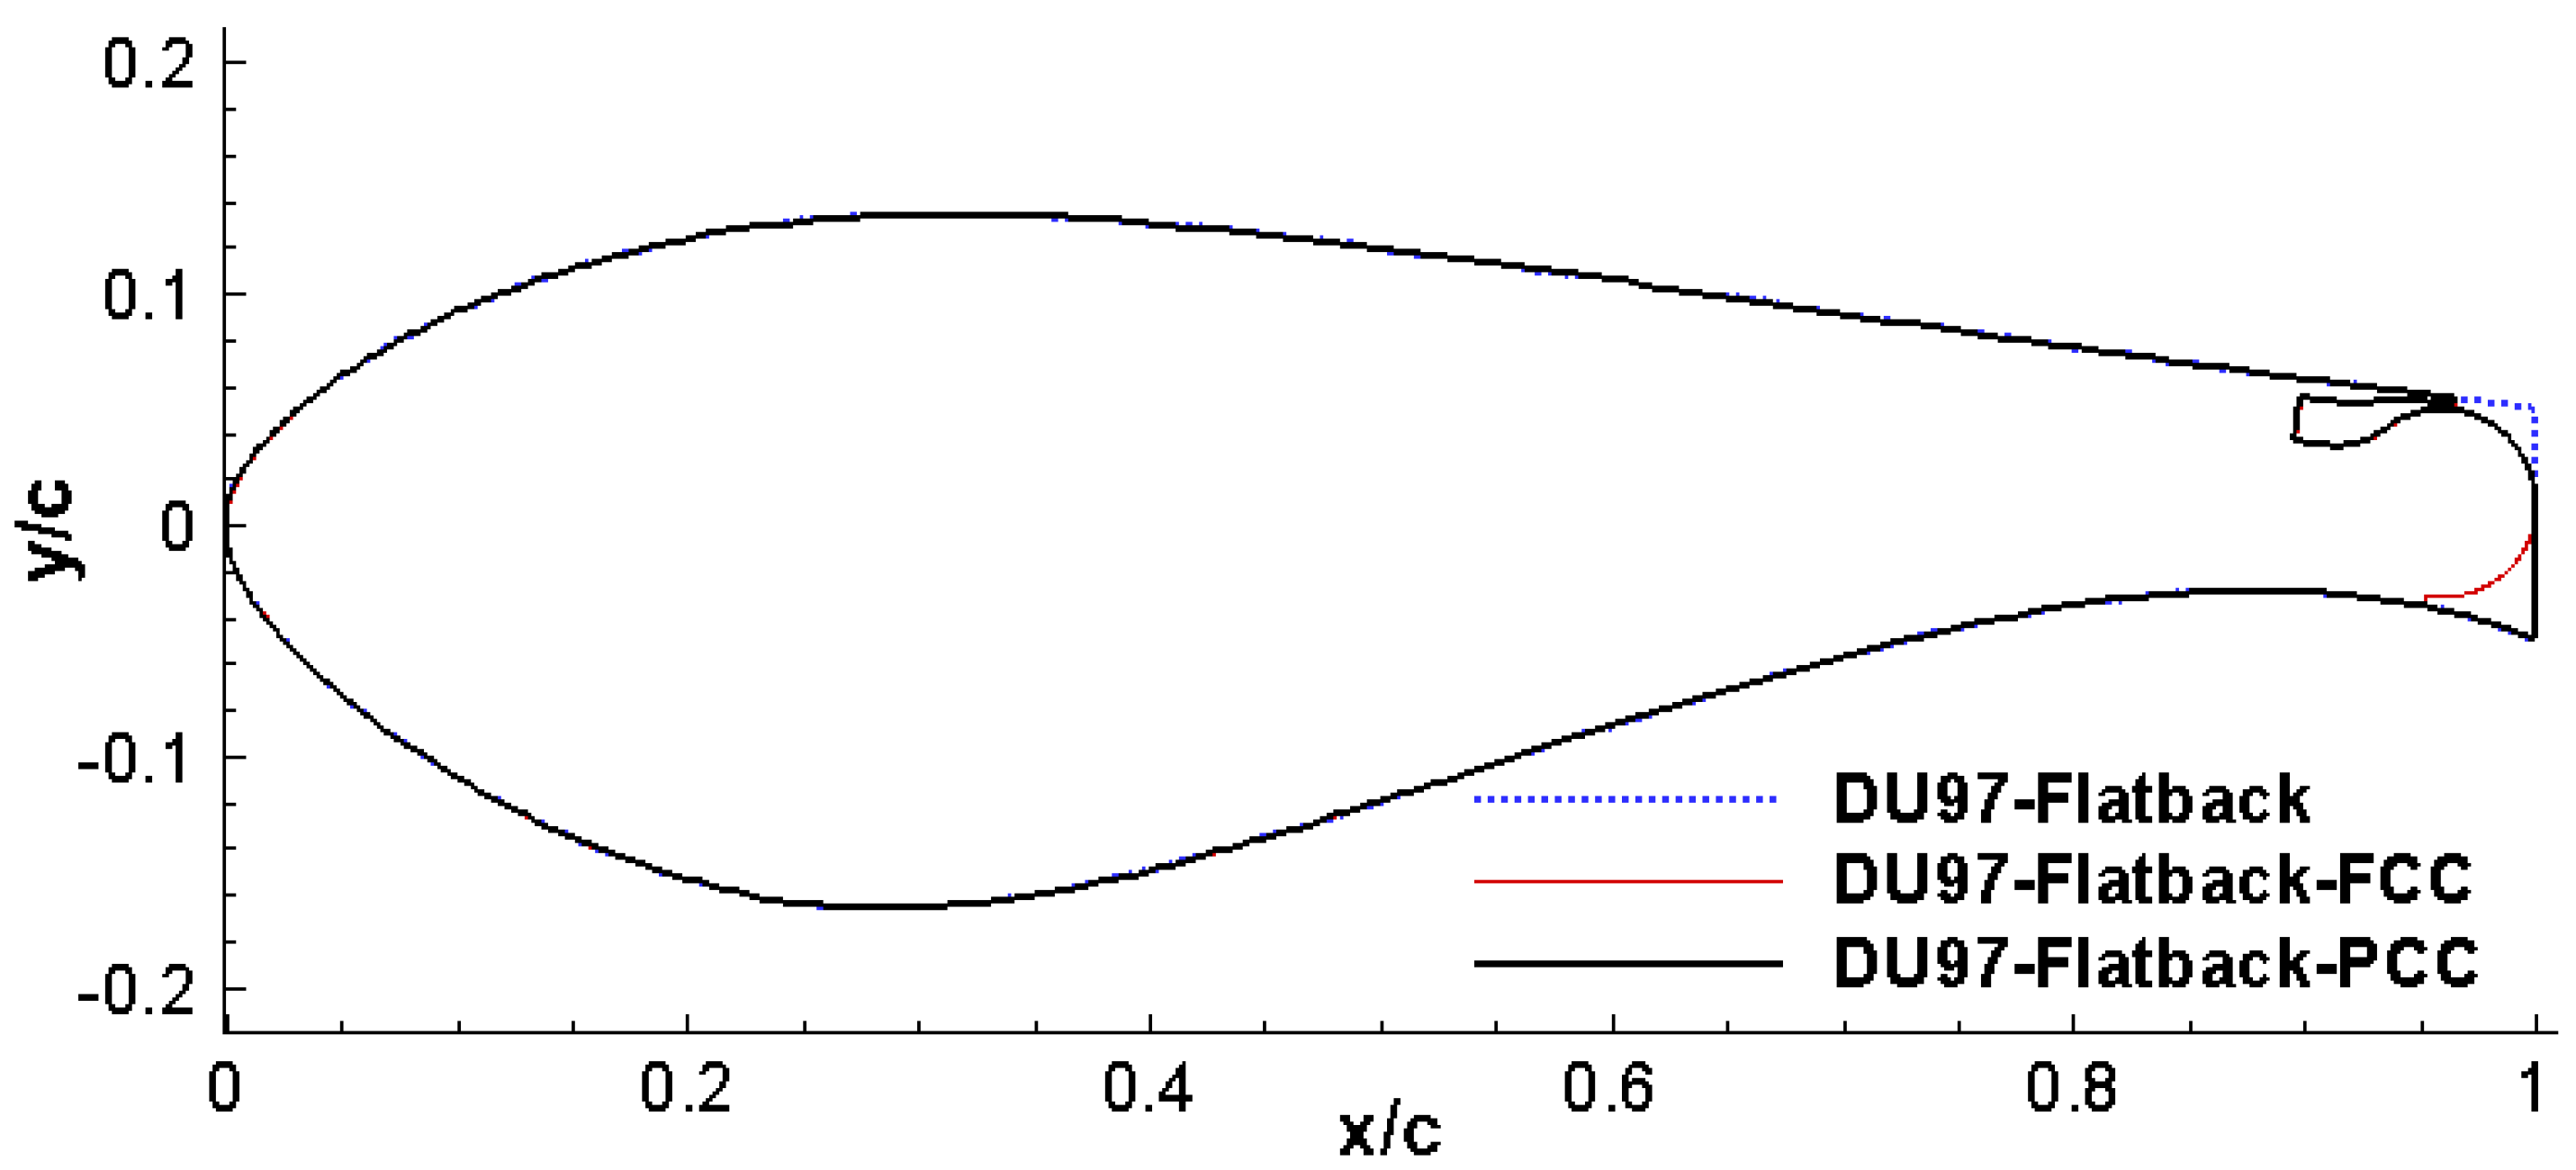
Figure 2.
Details of the blunt trailing edge design: (a) DU97-Flatback; (b) DU97-Flatback-FCC (Full Circulation Control); (c) DU97-Flatback-PCC (Partial Circulation Control).
Figure 2.
Details of the blunt trailing edge design: (a) DU97-Flatback; (b) DU97-Flatback-FCC (Full Circulation Control); (c) DU97-Flatback-PCC (Partial Circulation Control).

Figure 3.
Close-up of the trailing edge area of the DU97-Flatback-PCC airfoil.
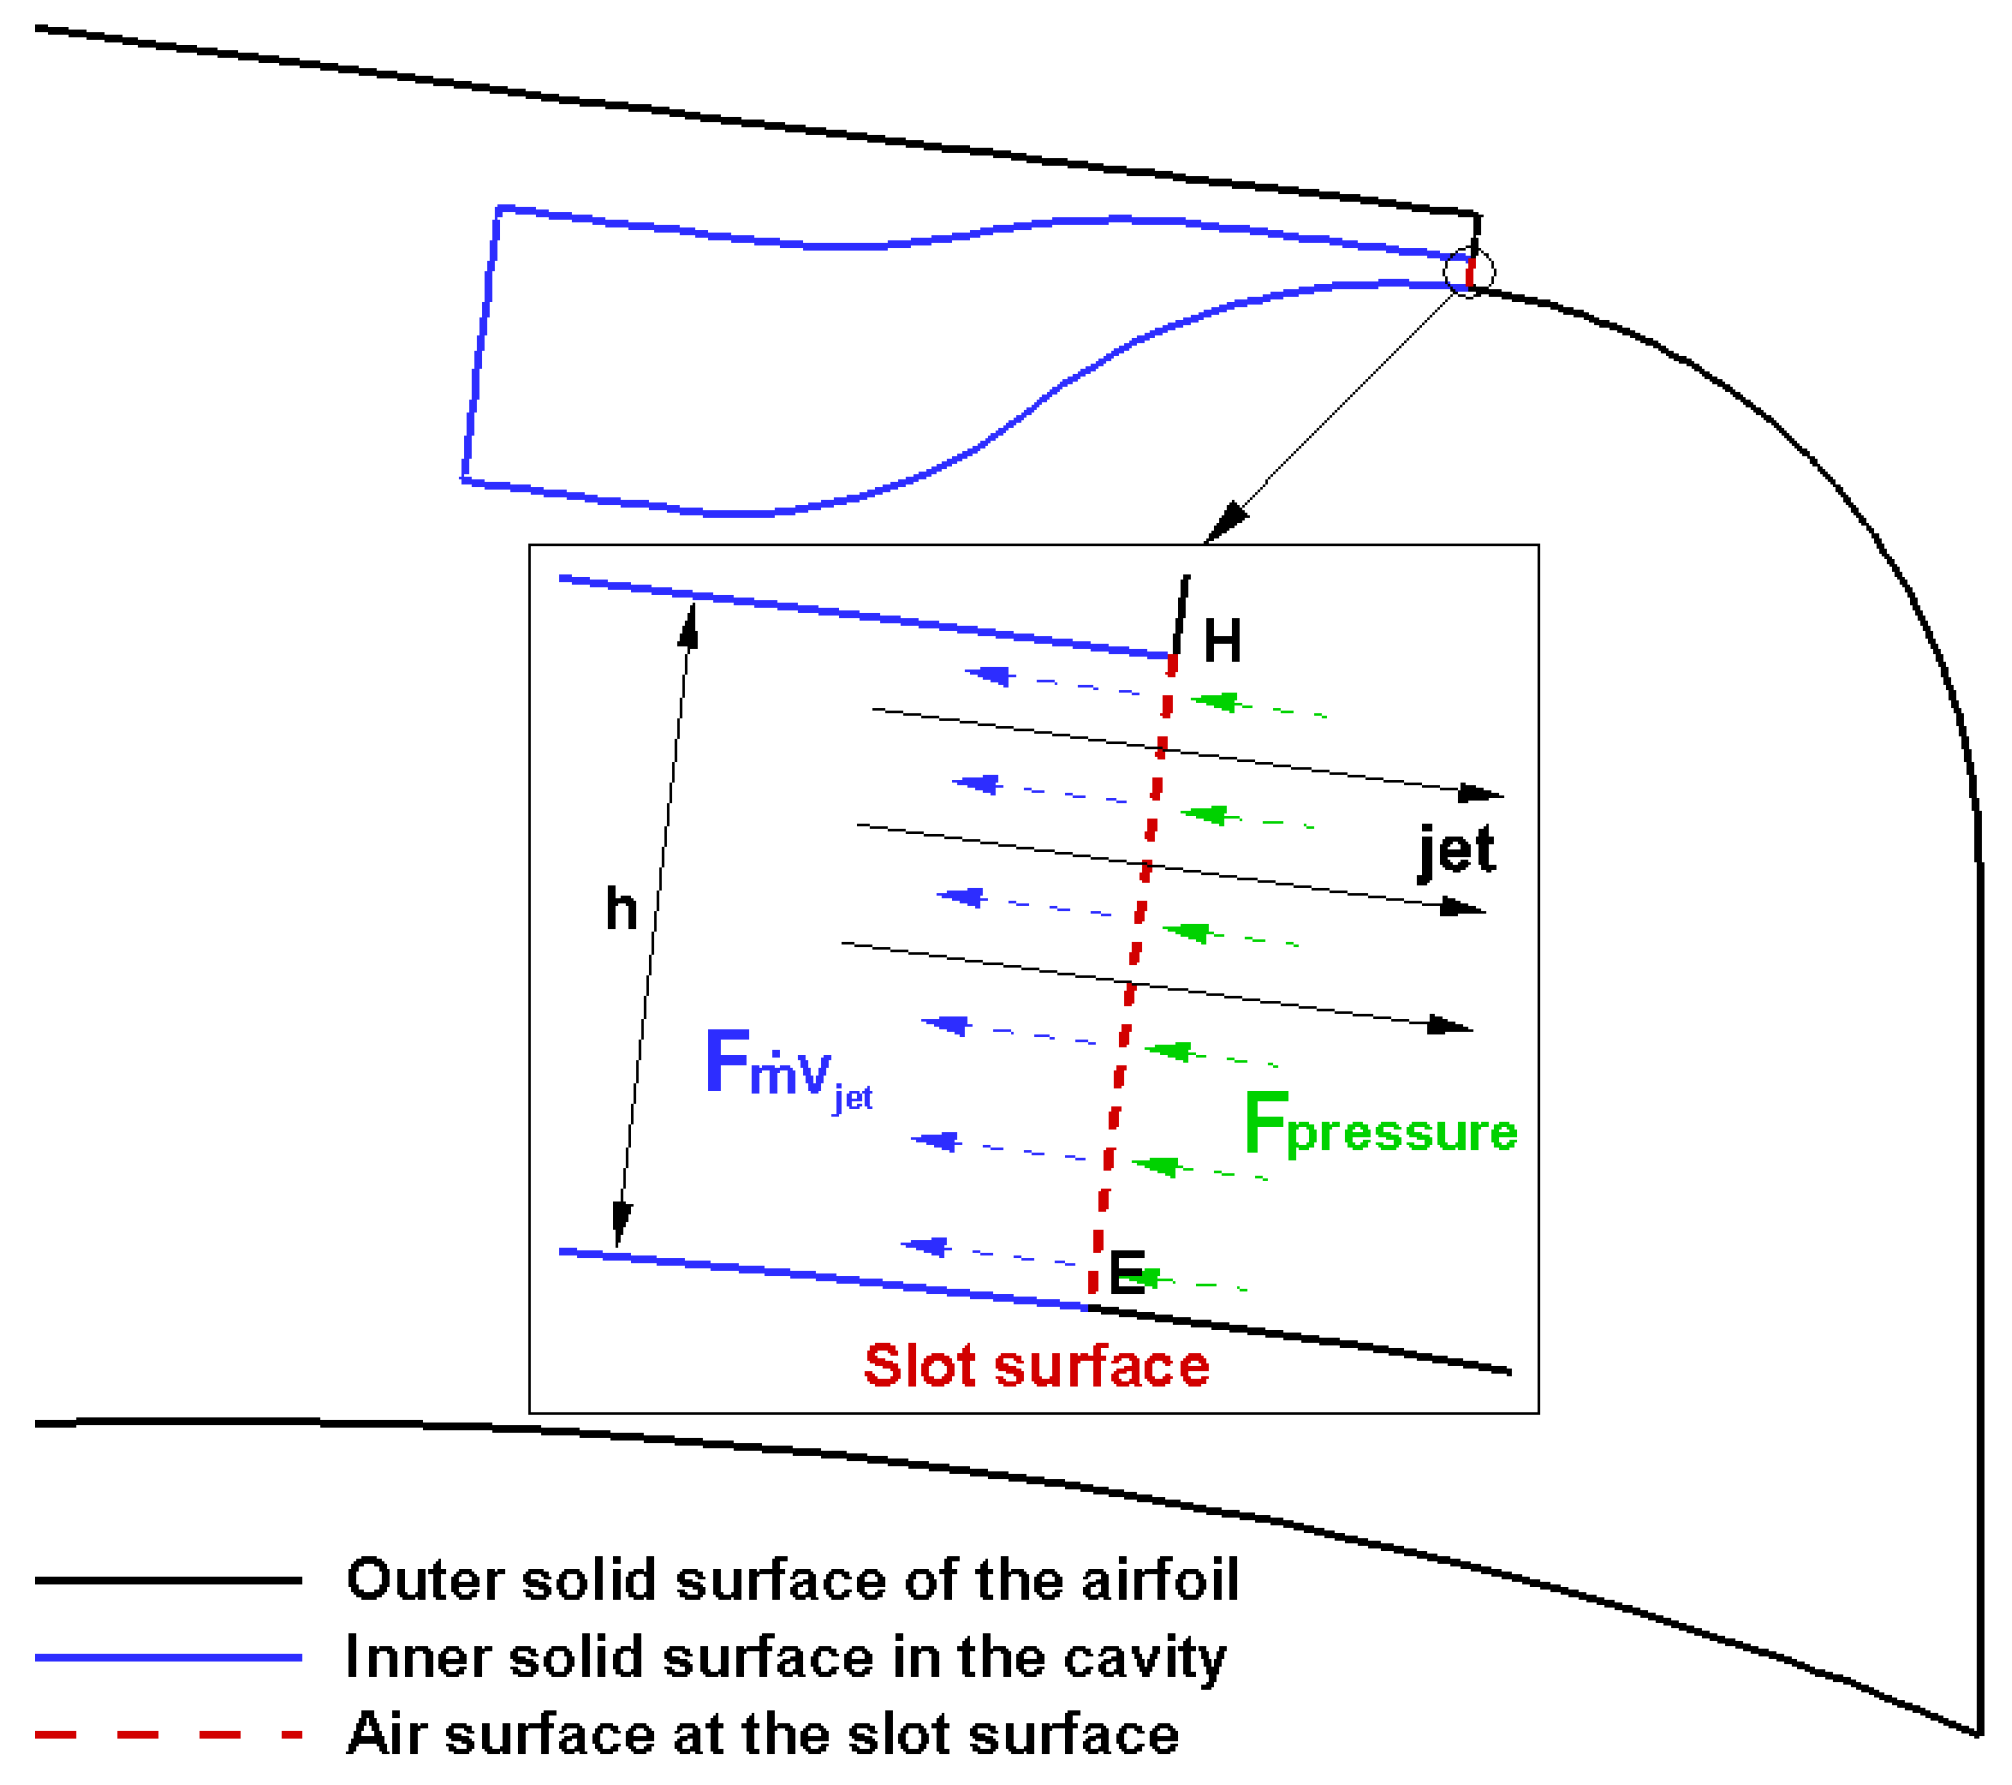
Figure 4.
Aerodynamic force analysis of the wind turbine section.
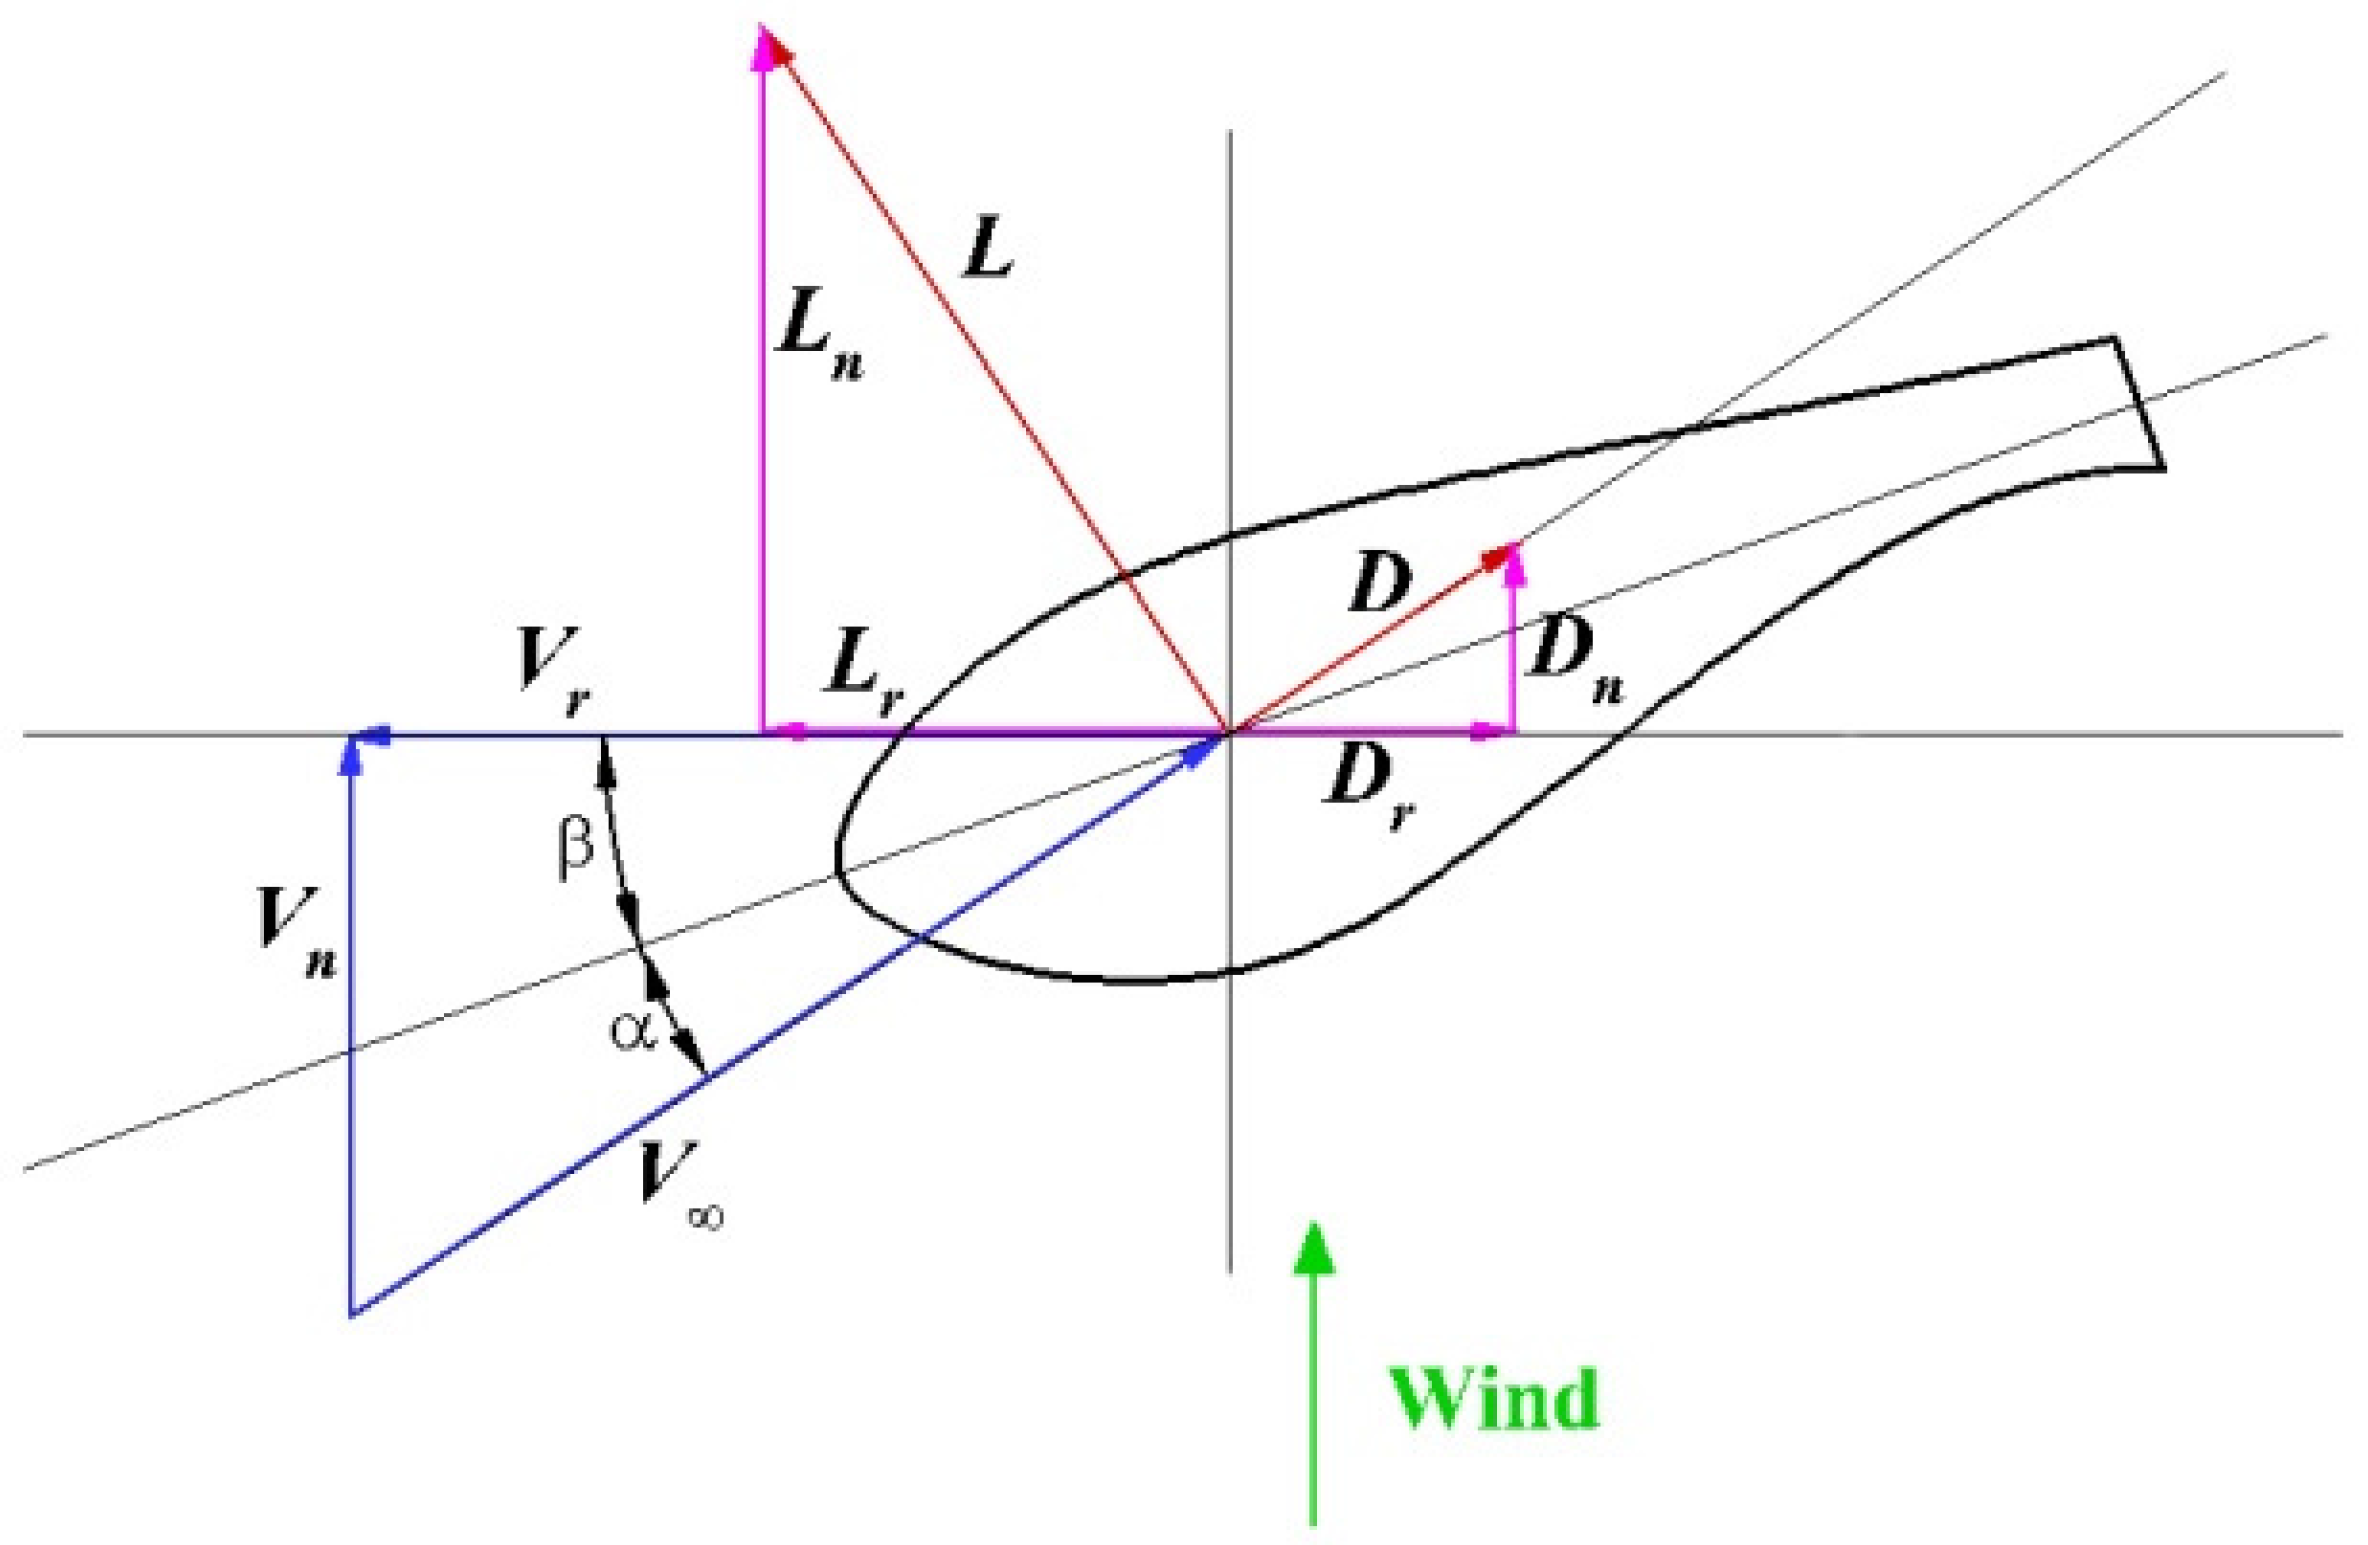
Figure 5.
Computational grid of a DU97-Flatback airfoil with close-up of the trailing edge.

Figure 6.
Pressure coefficient distributions.
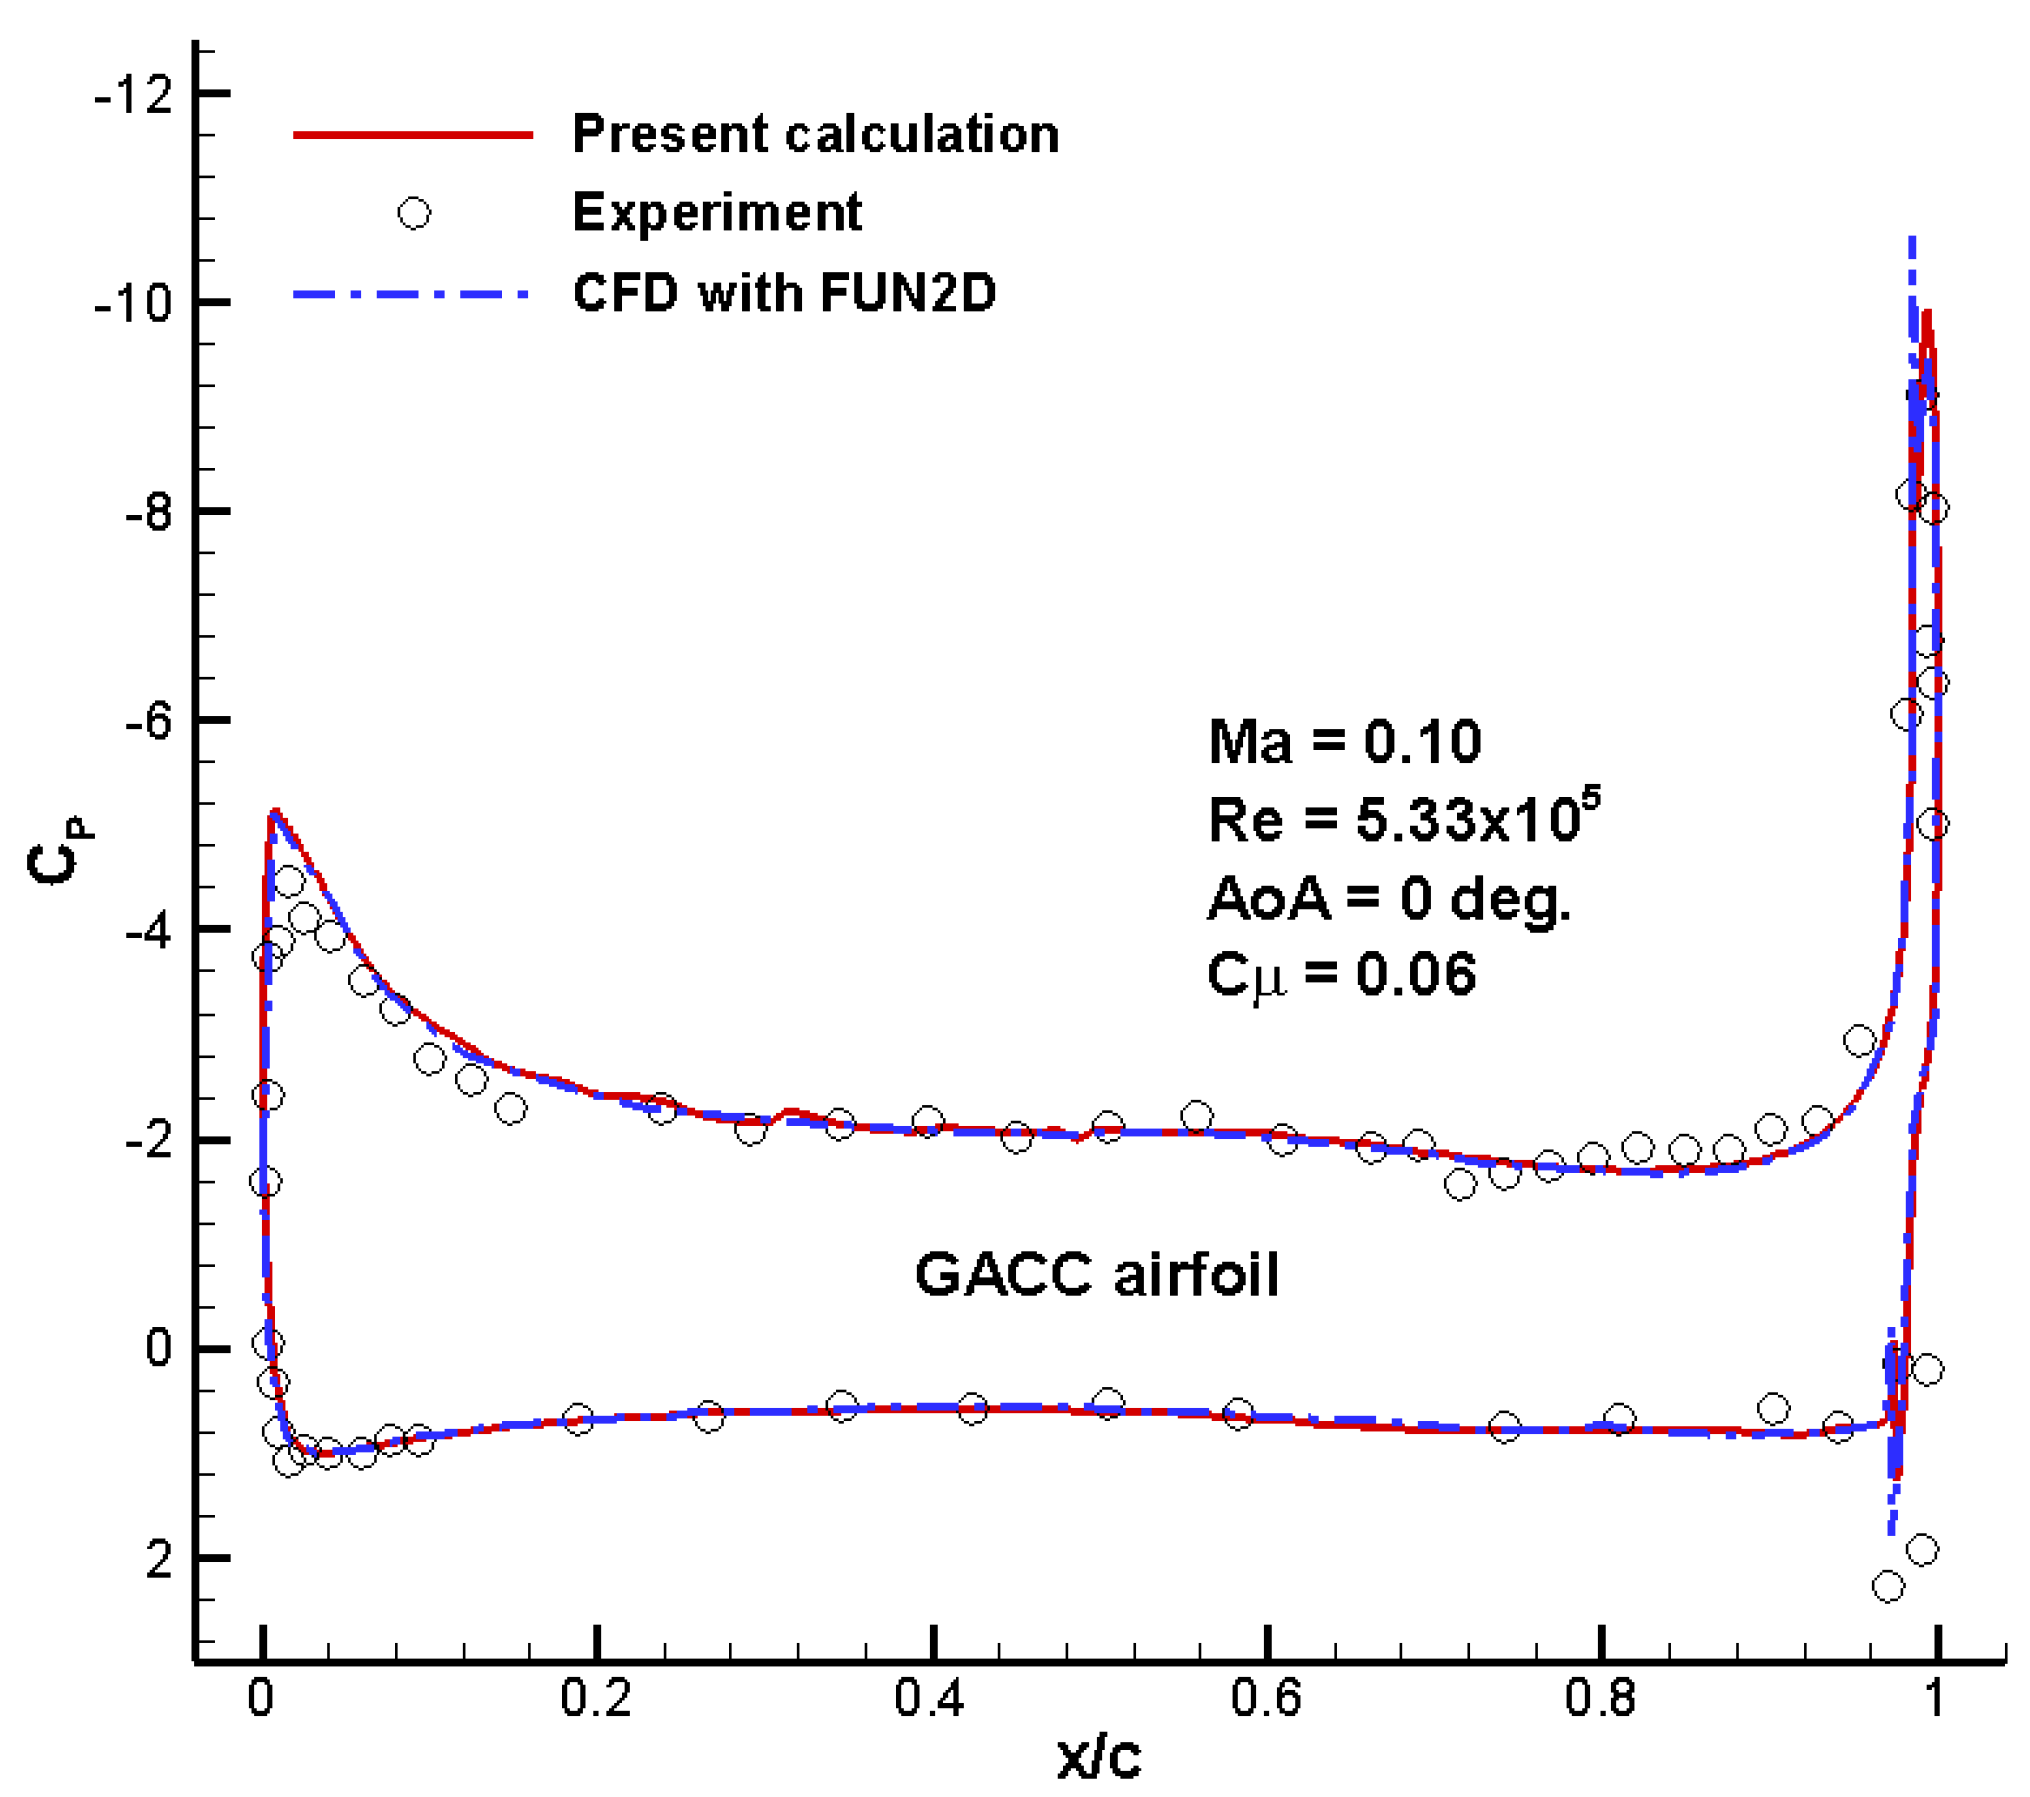
Figure 7.
Flow field with streamlines and Mach contour.

Figure 8.
Grids of the FCC-on and PCC-on airfoils: (a) FCC-on; (b) PCC-on.

Figure 9.
Comparison of lift and drag coefficients between different airfoils: (a) Lift coefficient; (b) Drag coefficient.
Figure 9.
Comparison of lift and drag coefficients between different airfoils: (a) Lift coefficient; (b) Drag coefficient.

Figure 10.
Decomposition of the force coefficients for PCC-on and FCC-on: (a) Lift coefficient; (b) Drag coefficient.
Figure 10.
Decomposition of the force coefficients for PCC-on and FCC-on: (a) Lift coefficient; (b) Drag coefficient.
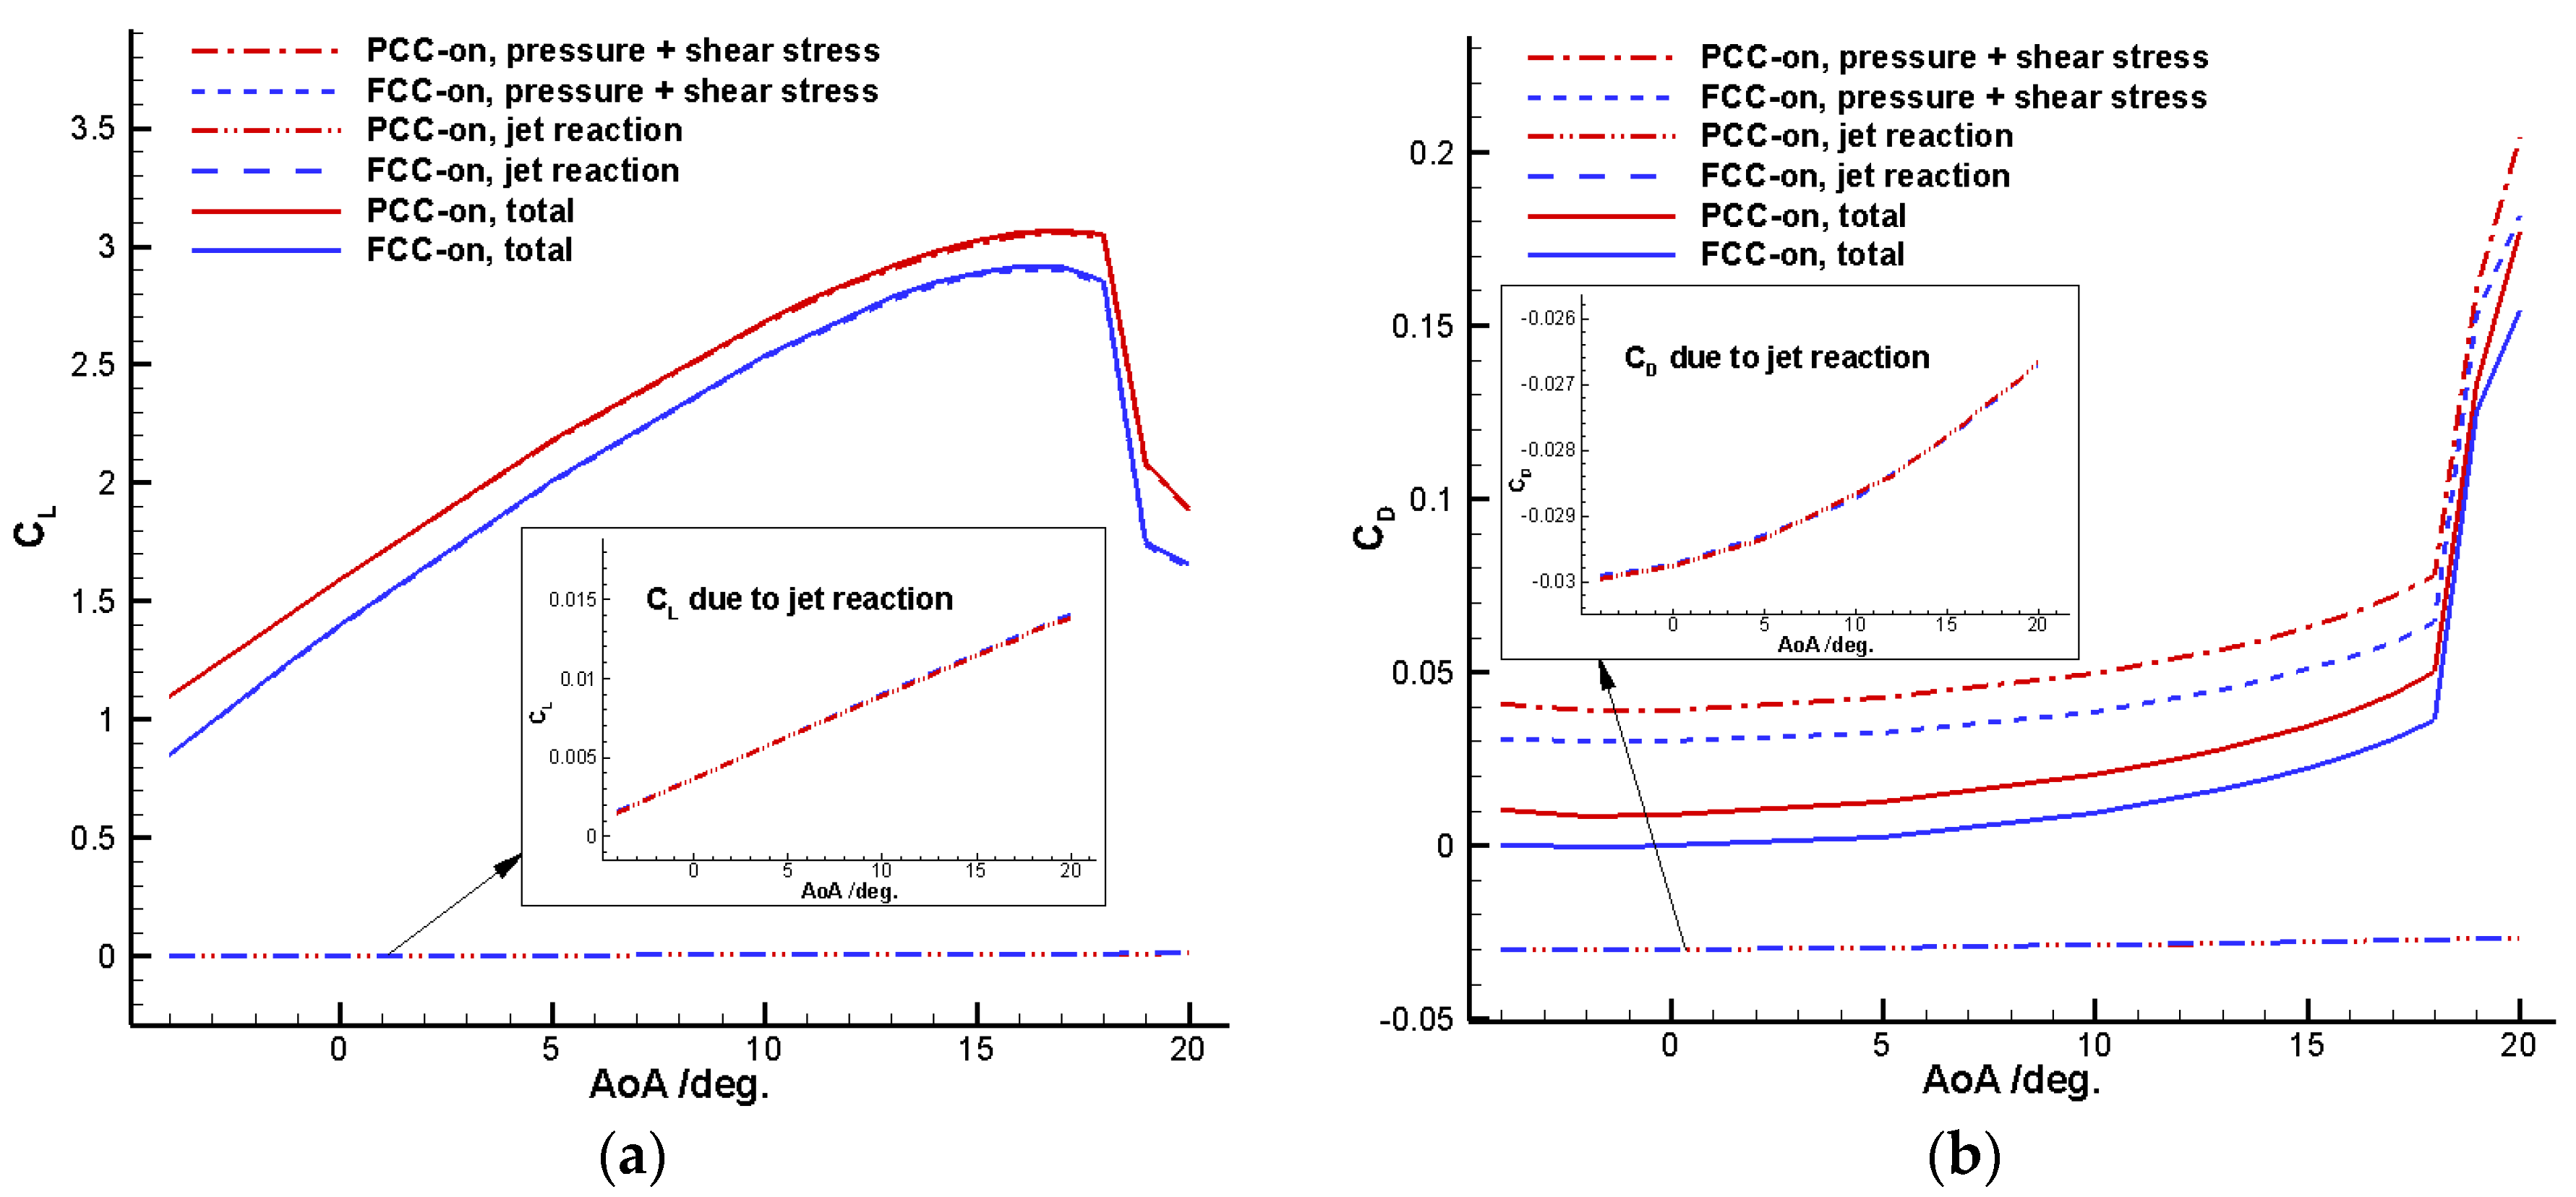
Figure 11.
Flow fields of different cases at AoA = 15°: (a) DU97-Flatback; (b) PCC-off; (c) FCC-off; (d) PCC-on; (e) FCC-on.
Figure 11.
Flow fields of different cases at AoA = 15°: (a) DU97-Flatback; (b) PCC-off; (c) FCC-off; (d) PCC-on; (e) FCC-on.

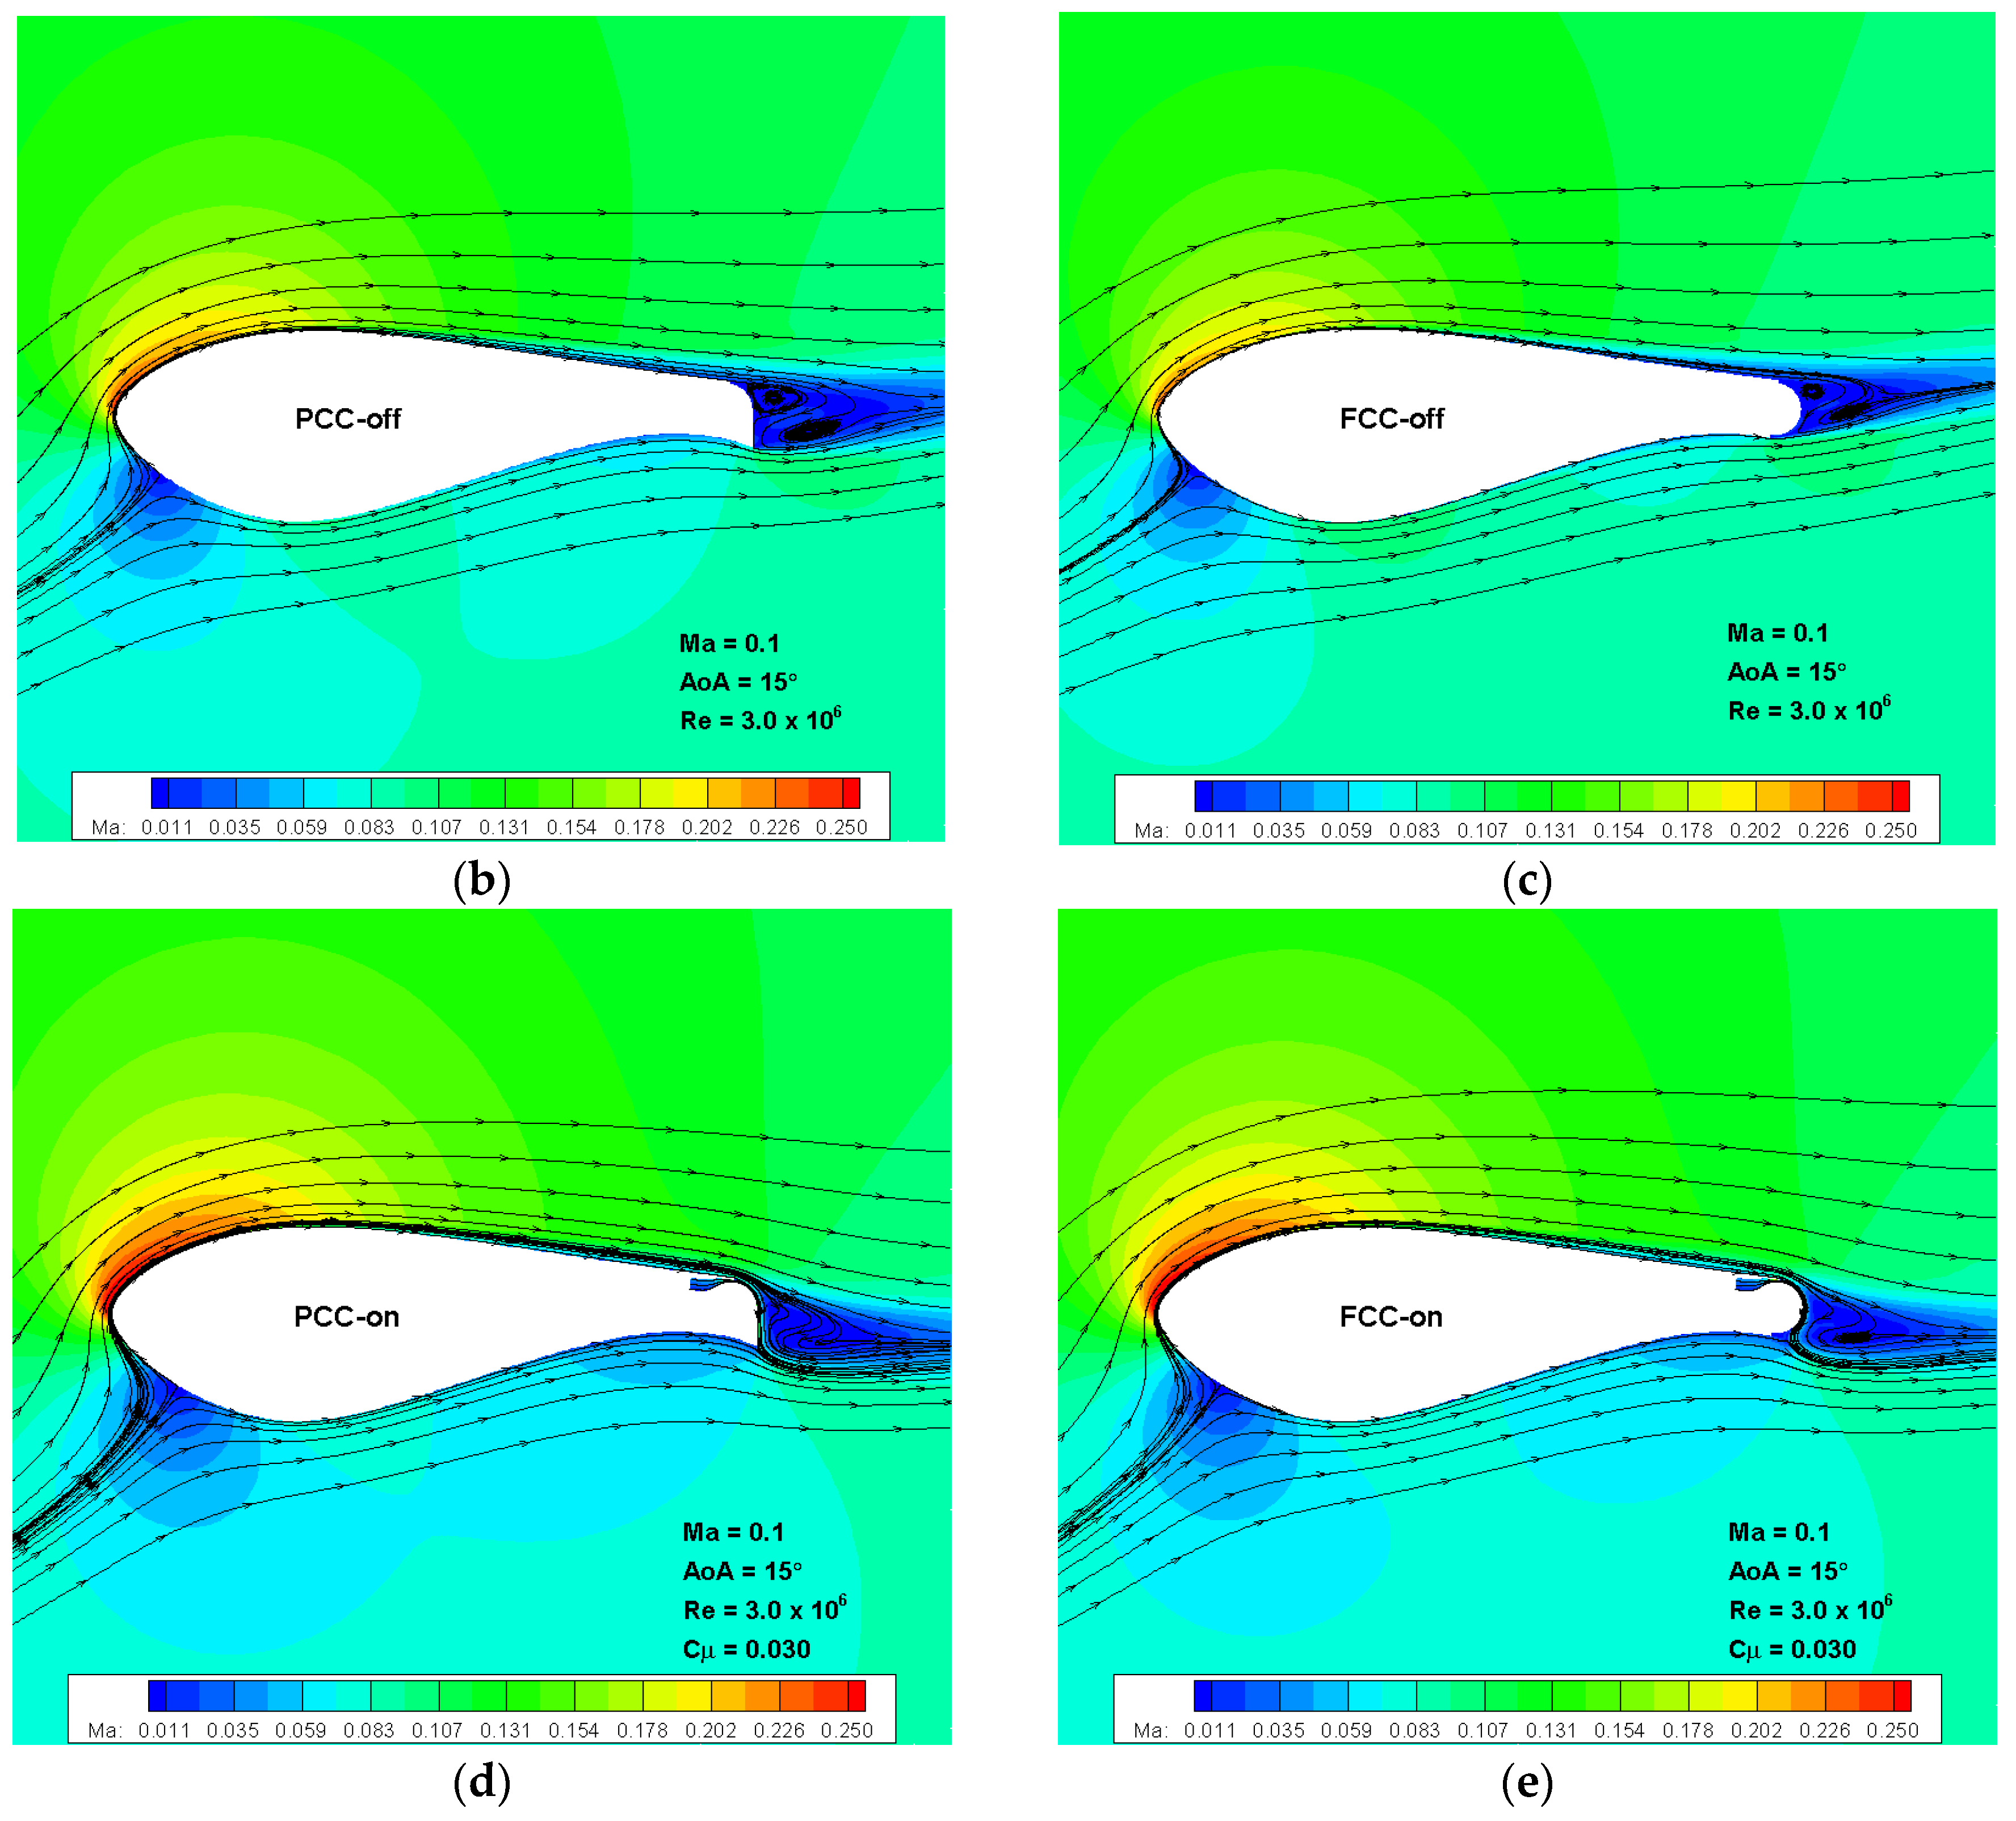
Figure 12.
Comparison of pressure distributions at AoA = 15°.

Figure 13.
Variation of force coefficients versus jet momentum coefficient: (a) Lift coefficient; (b) Drag coefficient.
Figure 13.
Variation of force coefficients versus jet momentum coefficient: (a) Lift coefficient; (b) Drag coefficient.
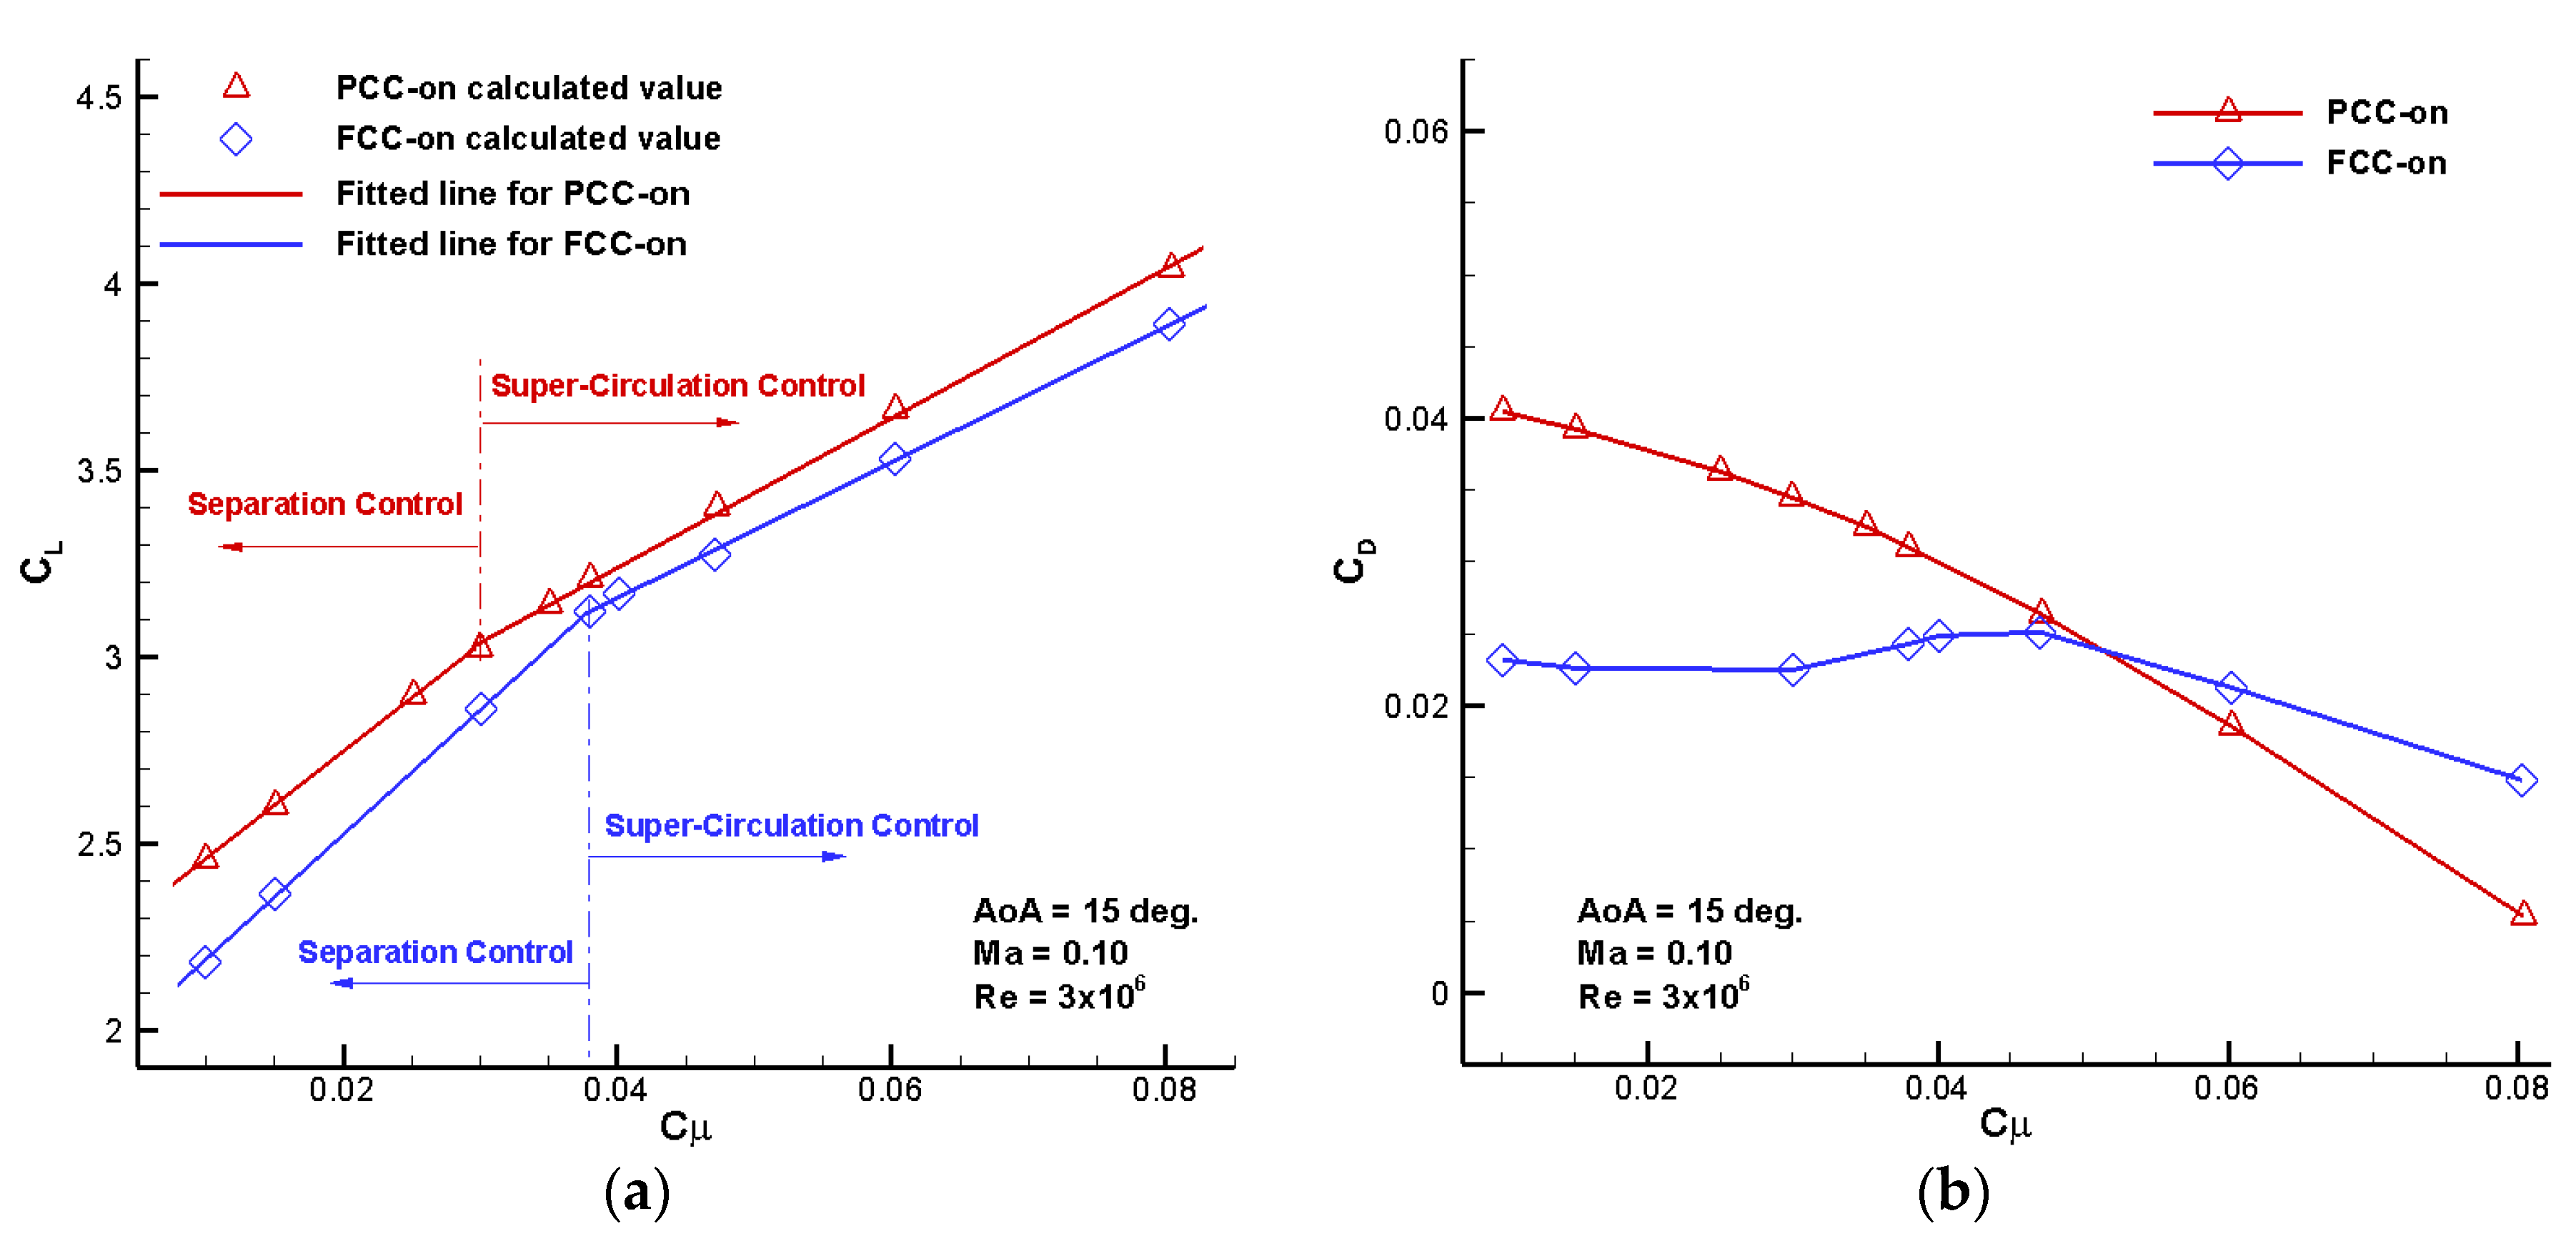
Figure 14.
Flow fields of PCC-on and FCC-on at different jet momentum coefficient levels: (a) PCC-on at Cμ = 0.010; (b) FCC-on at Cμ = 0.010; (c) PCC-on at Cμ = 0.015; (d) FCC-on at Cμ = 0.015; (e) PCC-on at Cμ = 0.030; (f) FCC-on at Cμ = 0.030; (g) PCC-on at Cμ = 0.038; (h) FCC-on at Cμ = 0.038; (i) PCC-on at Cμ = 0.047; (j) FCC-on at Cμ = 0.047; (k) PCC-on at Cμ = 0.060; (l) FCC-on at Cμ = 0.060; (m) PCC-on at Cμ = 0.080; (n) FCC-on at Cμ = 0.080.

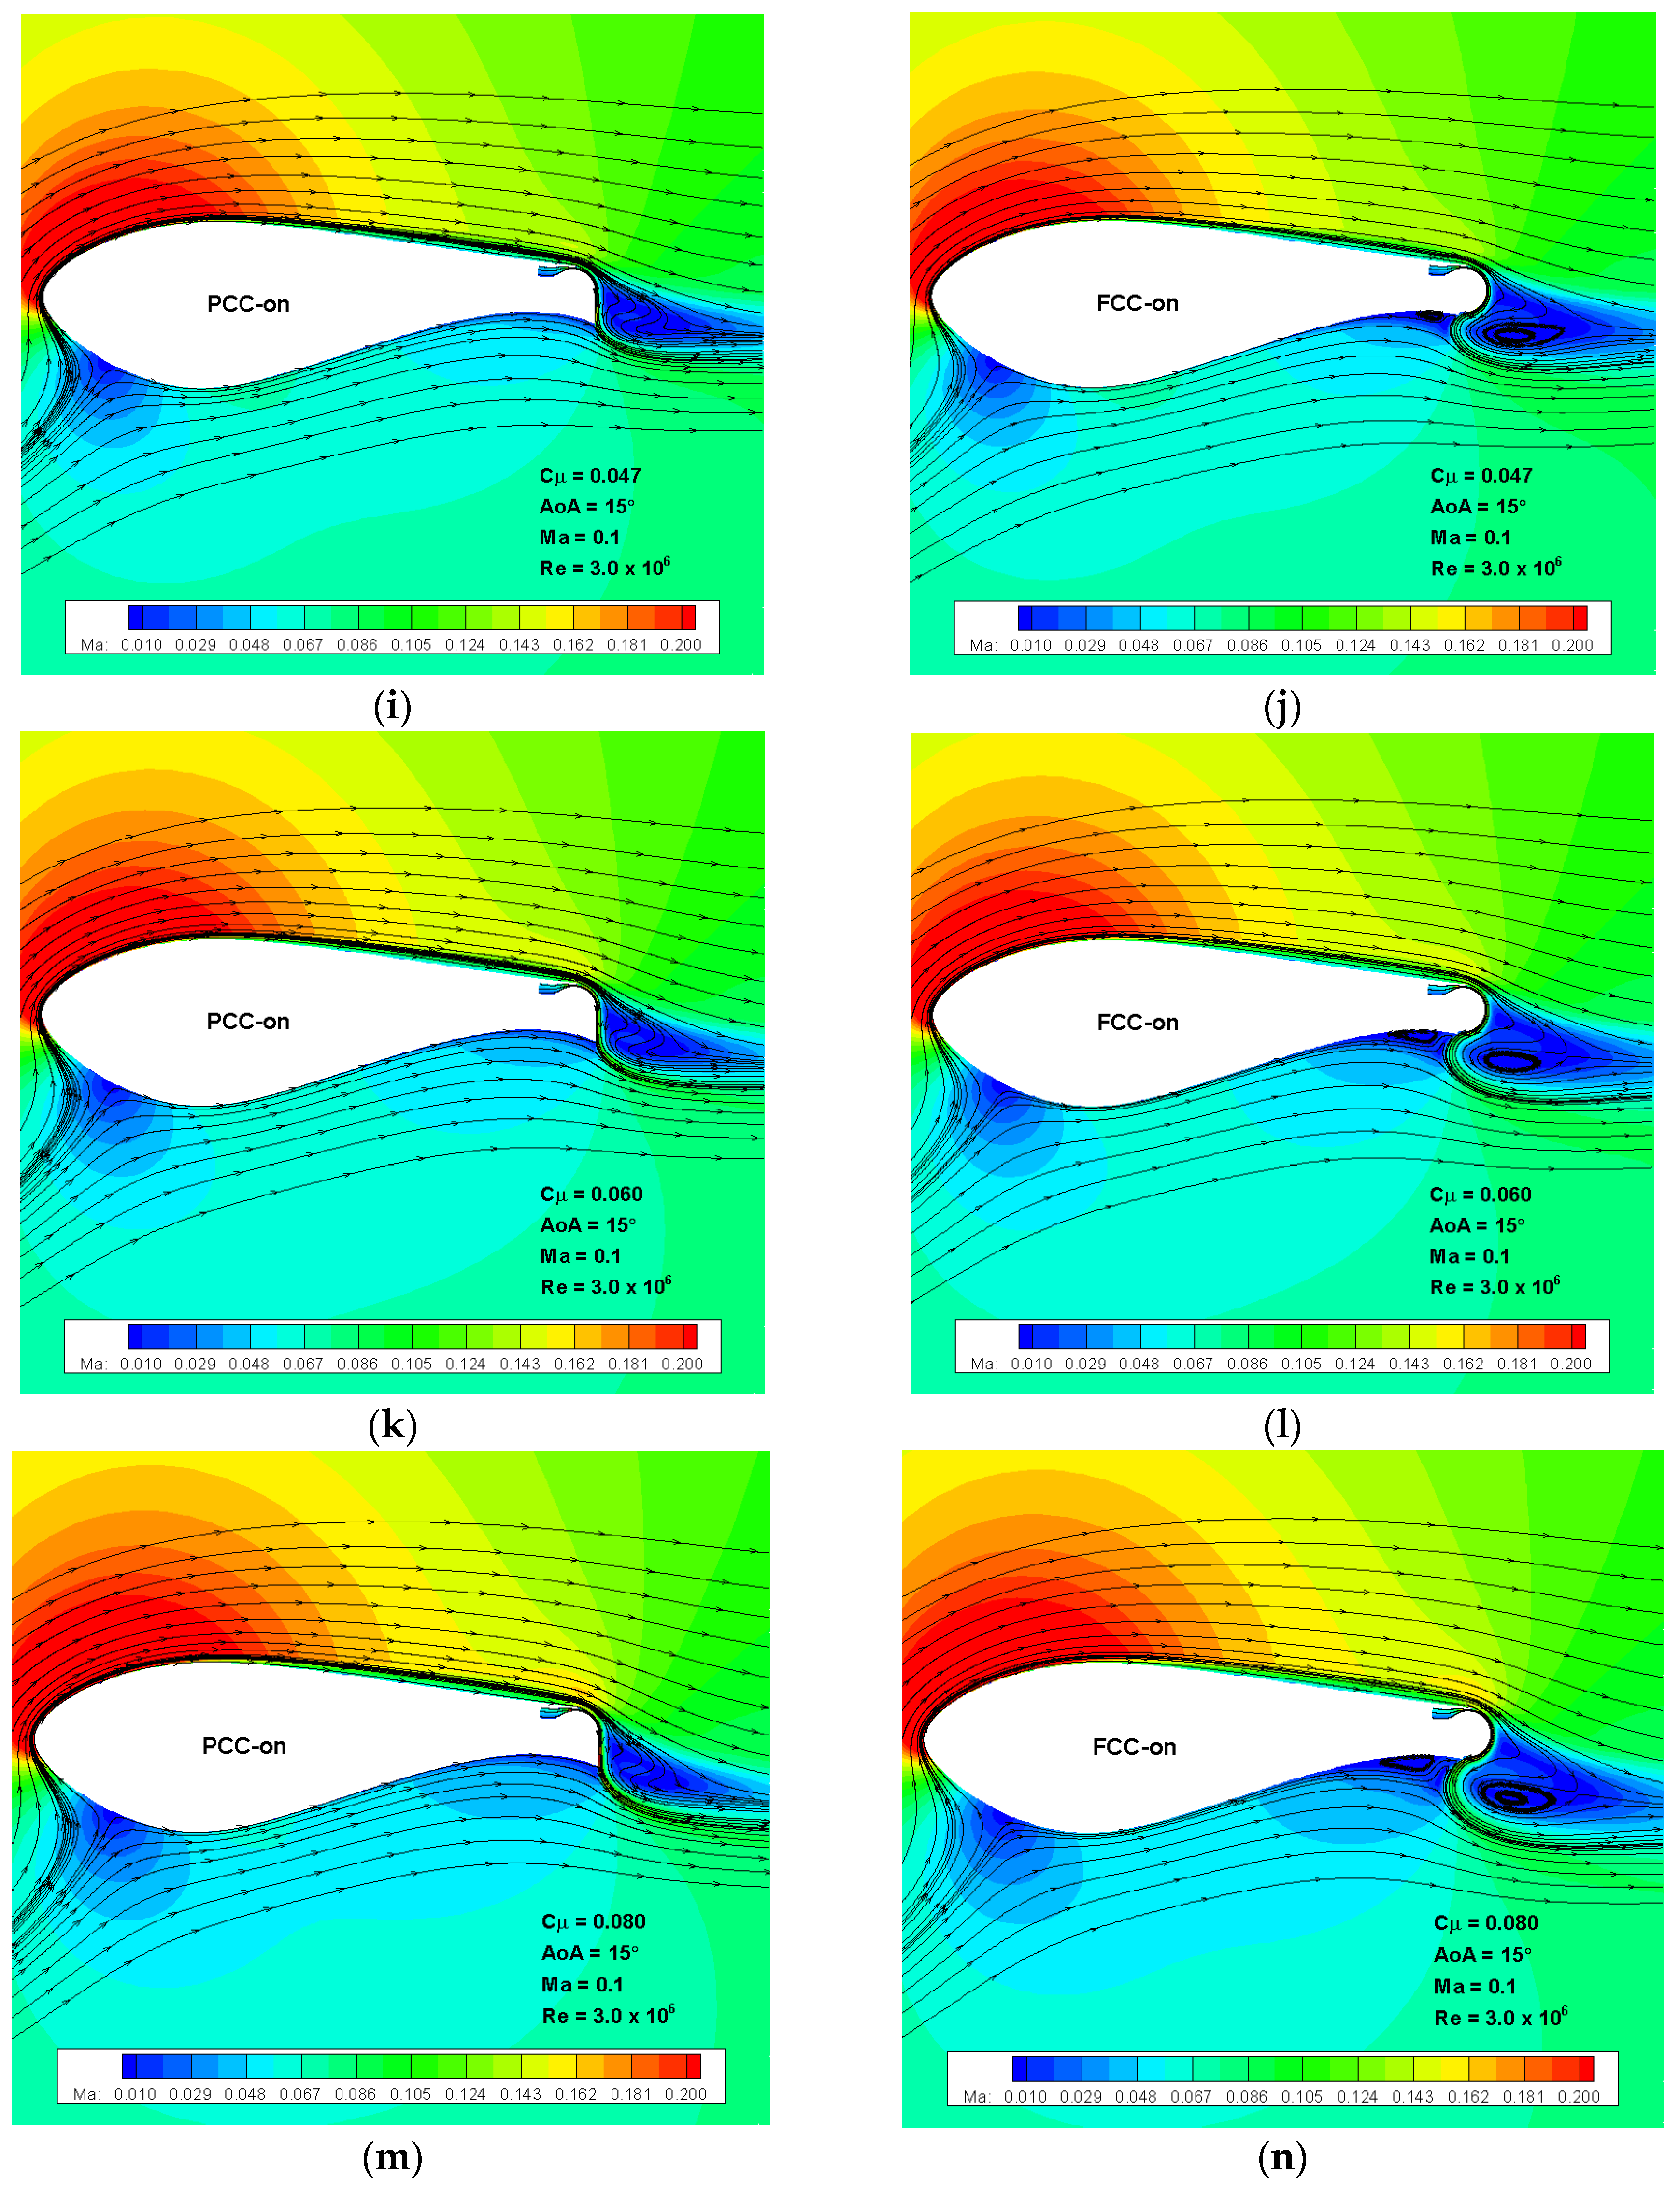
Figure 15.
Power coefficients versus jet momentum coefficient.
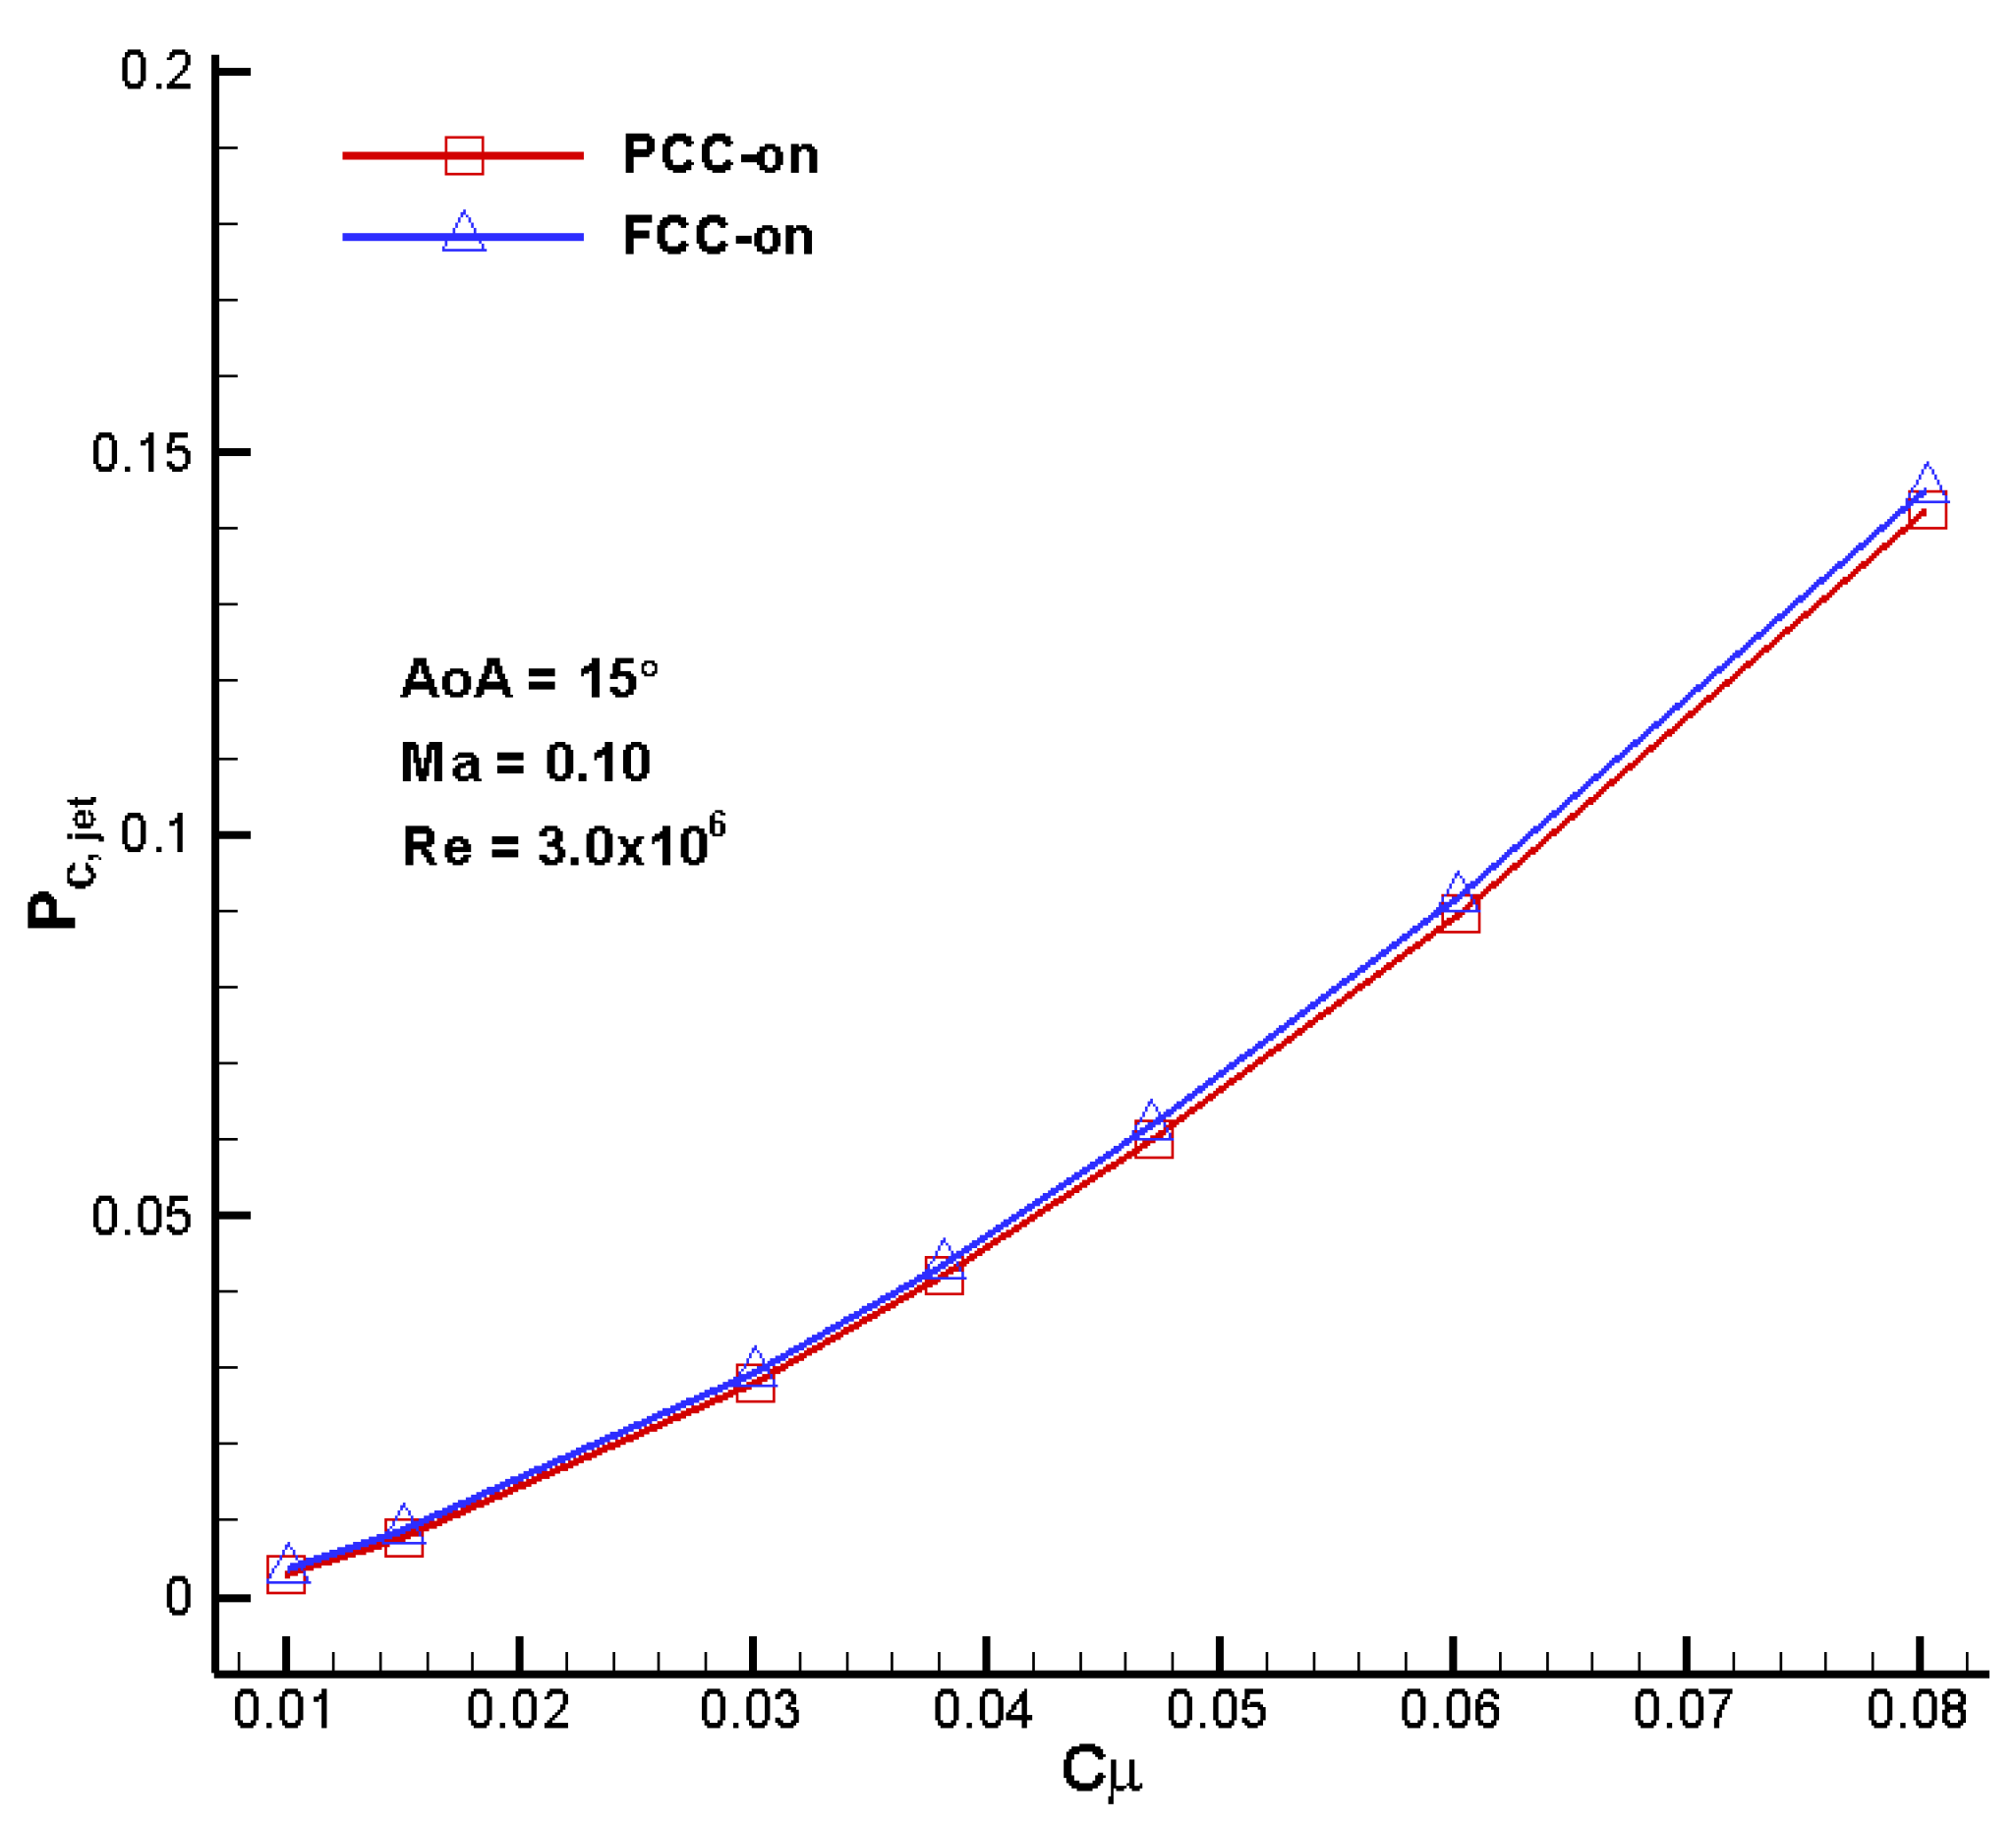
Figure 16.
Comparisons of aerodynamic figure of merit and control efficiency: (a) Aerodynamic figure of merit; (b) Circulation control efficiency.
Figure 16.
Comparisons of aerodynamic figure of merit and control efficiency: (a) Aerodynamic figure of merit; (b) Circulation control efficiency.


Table 1.
Details of the grids employed for the DU97-Flatback airfoil.
| Parameters | Wrap-around Points | Normal Layers | Total Number of Cells | First Layer Spacing/c | Spacing Increasing Ratio |
|---|---|---|---|---|---|
| Coarse grid | 225 | 100 | 22,500 | 1.2 × 10⁻⁵ | 1.20 |
| Medium grid A | 315 | 141 | 44,415 | 1.0 × 10⁻⁵ | 1.16 |
| Medium grid B | 450 | 200 | 90,000 | 0.8 × 10⁻⁵ | 1.13 |
| Fine grid | 630 | 283 | 178,290 | 0.6 × 10⁻⁵ | 1.10 |
Table 2.
Comparison of aerodynamic coefficients at AoA = 4.12°.
| Parameters | Coarse Grid | Medium Grid A | Medium Grid B | Fine Grid | Experiment |
|---|---|---|---|---|---|
| CL | 0.8696 | 0.8688 | 0.8650 | 0.8598 | 0.833 |
| CD | 0.04545 | 0.04311 | 0.04198 | 0.04145 | 0.0598 |
| CM | −0.1419 | −0.1410 | −0.1404 | −0.1390 | −0.164 |
Table 3.
Comparison of aerodynamic coefficients at AoA = 11.05°.
| Parameters | Coarse Grid | Medium Grid A | Medium Grid B | Fine Grid | Experiment |
|---|---|---|---|---|---|
| CL | 1.7339 | 1.7338 | 1.7292 | 1.7248 | 1.736 |
| CD | 0.05095 | 0.04827 | 0.04715 | 0.04630 | 0.0545 |
| CM | −0.1697 | −0.1690 | −0.1679 | −0.1666 | −0.2010 |
Table 4.
Comparison of aerodynamic coefficients at AoA = 13.40°.
| Parameters | Coarse Grid | Medium Grid A | Medium Grid B | Fine Grid | Experiment |
|---|---|---|---|---|---|
| CL | 1.9918 | 1.9915 | 1.9864 | 1.9838 | 2.033 |
| CD | 0.05526 | 0.05238 | 0.05130 | 0.05063 | 0.0466 |
| CM | −0.1737 | −0.1727 | −0.1715 | −0.1702 | −0.210 |
© 2018 by the authors. Licensee MDPI, Basel, Switzerland. This article is an open access article distributed under the terms and conditions of the Creative Commons Attribution (CC BY) license (http://creativecommons.org/licenses/by/4.0/).
Share and Cite
MDPI and ACS Style
Xu, H.-Y.; Dong, Q.-L.; Qiao, C.-L.; Ye, Z.-Y. Flow Control over the Blunt Trailing Edge of Wind Turbine Airfoils Using Circulation Control. Energies 2018, 11, 619. https://doi.org/10.3390/en11030619
AMA Style
Xu H-Y, Dong Q-L, Qiao C-L, Ye Z-Y. Flow Control over the Blunt Trailing Edge of Wind Turbine Airfoils Using Circulation Control. Energies. 2018; 11(3):619. https://doi.org/10.3390/en11030619
Chicago/Turabian StyleXu, He-Yong, Qing-Li Dong, Chen-Liang Qiao, and Zheng-Yin Ye. 2018. "Flow Control over the Blunt Trailing Edge of Wind Turbine Airfoils Using Circulation Control" Energies 11, no. 3: 619. https://doi.org/10.3390/en11030619
Note that from the first issue of 2016, this journal uses article numbers instead of page numbers. See further details here.