Performance Analysis and Optimization of a Parabolic Trough Solar Power Plant in the Middle East Region


Department of Electrical Engineering, College of Engineering, Majmaah University, Majmaah 11952, Saudi Arabia
*
Author to whom correspondence should be addressed.
Energies 2018, 11(4), 741; https://doi.org/10.3390/en11040741
Submission received: 2 February 2018
/
Revised: 15 March 2018
/
Accepted: 21 March 2018
/
Published: 24 March 2018
Abstract
:The Middle East is one among the areas of the world that receive high amounts of direct solar radiation. As such, the region holds a promising potential to leverage clean energy. Owing to rapid urbanization, energy demands in the region are on the rise. Along with the global push to curb undesirable outcomes such as air pollution, emissions of greenhouse gases, and climate change, an urgent need has arisen to explore and exploit the abundant renewable energy sources. This paper presents the design, performance analysis and optimization of a 100 MWe parabolic trough collector Solar Power Plant with thermal energy storage intended for use in the Middle Eastern regions. Two representative sites in the Middle East which offer an annual average direct normal irradiance (DNI) of more than 5.5 kWh/m2/day has been chosen for the analysis. The thermodynamic aspect and annual performance of the proposed plant design is also analyzed using the System Advisor Model (SAM) version 2017.9.5. Based on the analysis carried out on the initial design, annual power generated from the proposed concentrating solar power (CSP) plant design in Abu Dhabi amounts to 333.15 GWh whereas that in Aswan recorded a value of 369.26 GWh, with capacity factors of 38.1% and 42.19% respectively. The mean efficiency of the plants in Abu Dhabi and Aswan are found to be 14.35% and 14.98% respectively. The optimization of the initial plant design is also carried out by varying two main design parameters, namely the solar multiple and full load hours of thermal energy storage (TES). Based on the findings of the study, the proposed 100 MW parabolic trough collector solar power plant with thermal energy storage can contribute to the sustainable energy future of the Middle East with reduced dependency on fossil fuels.
1. Introduction
Conventional energy sources in the world are fast depleting and it is very important to tap the enormous potential of renewable energy sources to meet escalating energy demands. Harnessing energy from renewable energy sources can significantly reduce the carbon emissions and can contribute towards the energy generation in a sustainable way and at stable costs. Earth receives about 1.8 × 10¹⁴ kW of energy from the sun and out of this only 60% reaches the earth’s surface [1]. Tapping less than 1% of this available solar thermal potential is enough to stabilize the world climate by virtue of significant reduction in carbon emissions.
Solar energy can be converted into thermal energy or to electrical energy among other forms. In solar thermal technology the energy from the incident solar rays is converted in to heat and the same is utilized for different applications. Solar thermal power is more environmentally friendly as it has very little polluting emissions when compared to conventional energy generation technologies. This technology can be effectively used in regions which have high amount of direct solar radiation. Middle Eastern regions are among the potential areas of the world which receive direct high intensity solar radiation [2,3]. The Middle East region is ideal for the installation of solar thermal plants as the region has rich solar potential combined with lot of uninhibited space. There is an increase in the average annual DNI values when moving from northern to southern parts of the Middle East. This can be attributed to the fact that the latitude decreases along this direction and the region is close to the earth’s equator. Solar radiation is found to be high in the south western parts of the Middle East. Thus most of the regions in the Middle East, except for the northern parts, are highly suitable for the installation of concentrating solar power (CSP) plants. The countries like Egypt, Yemen and Saudi Arabia possess the highest exposed areas, followed by countries like U.A.E., Syria, Oman and Jordan [4]. The Middle East region is also known for its unpredictable weather and the region experiences sand storms which vary in frequency and intensity seasonally [5]. Deposition of dust on the solar collectors will have an adverse effect on the solar thermal power generation, which necessitates effective dust management by way of a proper maintenance schedule [6].
Govindaraj Kumaresan et al. [7] experimentally investigated the performance of a solar parabolic trough collector (PTC), integrated with thermal energy storage (TES). The study concluded that the PTC should be located very close to the storage system and different components of the storage system have to be insulated properly for reducing heat losses. Reddy et al. [8] performed energy and exergetic analysis of PTC power plant by calculating the losses and efficiencies. The operating pressure for a Rankine heat engine has been optimized for maximum efficiency. Montes et al. [9] detailed the effect of solar multiple on the annual performance of a PTC power plant employing direct steam generation. Kearney et al. [10] carried out an investigation on the use of molten salt as the heat transfer fluid (HTF) and TES medium for a PTC solar power plant. Their feasibility study recommends the use of molten salt as HTF to minimize the levelized cost of electricity (LCOE). Martin et al. [11] used a mathematical programming technique to optimize the operation of a CSP plant employing regenerative Rankine cycle for a site in Spain. A simulation model for predicting the electrical output of a 50 MWe PTC power plant was developed by Garcia et al. [12]. The model results were compared with the experimental data of a power plant operating in Spain. A feasibility study for the installation of PTC power plant in the island of Cyprus was carried out by Poullikkas et al. [13]. The study was performed by varying different parameters such as plant capacity, capital investment and operating hours of the plant. Larrain et al. [14] developed a thermodynamic model to evaluate the performance of a 100 MWe hybrid PTC plant in Chile. Boukelia et al. [15] presented a comparative study on the performance of different configurations of PTC plants operating with two different HTF fluids. The same authors [16] carried out feasibility analysis and optimization of PTC plants equipped with integrated TES and fuel backup system (FBS) for Algerian conditions. The outcome of the study recommends the installation of CSP plants in arid and semi-arid regions of Algeria. Abbas et al. [17] carried out performance assessment of a 100 MWe PTC solar power plant for feasible locations in Algeria. An experimental investigation on the performance of a PTC system under Tunisian climatic conditions has been conducted by Mohamed Chafie et al. [18]. Reddy and Kumar [19] presented a techno-economic feasibility analysis of PTC plant for different locations in India. Deepak et al. [20] analyzed the performance of a 100 MWe PTC plant for the location of Udaipur in India. Mezher et al. [21] presented various renewable energy initiatives of U.A.E. and evaluated the benefits of introducing CSP plants in to the energy mix of the country. Shouman et al. [22] described a strategic road map for the introduction of CSP technology in Egypt. Aidin et al. [23] presented an economic modeling of a 25 MWe PTC solar power plant operating in Iran. The influence of storage system on plant operating hours was also investigated for different load conditions. Mohammed et al. [24] proposed a prototype of a 50 MWe CSP plant in Jordan and carried out an economic feasibility analysis of the plant. The study concludes that the southern location of Jordan has enormous potential for the installation of CSP plants.
From these literature reviews, it is evident that majority of the research work on design and performance assessment and optimization of PTC solar power plants is carried out for locations in USA, Europe, Algeria, Tunisia and India. The literature available on the application of PTC CSP technology in the Middle Eastern region is rather restricted to only an initial assessment of the benefits of implementation of CSP plants and economic feasibility analysis. There are very few research works available which concentrate on design, performance analysis and optimization of the PTC solar power plants for feasible locations in the Middle East. The research on this aspect is highly significant as there is a high demand to tap the abundant renewable energy sources in the region to meet growing energy demands. Moreover, this is essential for the future development of the Middle East region as it reduces the dependency on fossil fuels and eliminates the problems associated with air pollution and greenhouse gases. Hence, this research is carried out to design, analyze and optimize the performance of a commercial 100 MWe parabolic trough collector solar power plant with TES for feasible locations in the Middle East region. The thermodynamic aspect and annual performance of the proposed plant will also be analyzed in the work.
Concentrating Solar Power (CSP) Technology
CSP technology is a solar thermal power generation technology that concentrates the heat from the solar radiation in to a small area for generating power. CSP-based technology is found to be suitable for regions with high DNI. Figure 1 shows the fundamental principle of solar thermal power generation, which is comprised of four main sub-systems, namely solar collector field, solar receiver, storage and/or back up system, and power conversion system. Solar collector field consists of an array of mirrors or reflectors that collect the solar radiation and focus it onto a receiver tube. The receiver tube with a thermal energy carrier absorbs the heat from the concentrated solar energy which can be used directly or with the help of a secondary circuit to generate power. A certain amount of heat is lost during the energy conversion process. Also, a part of the solar radiation is reflected back and does not even reach the absorber. Hence the choice of an appropriate solar collector is very important to suit the application requirement and to attain the desired temperature level [25]. Most of the commercial CSP plant designs incorporate TES systems for generating power in the absence of sunshine [26]. According to the focus geometry, CSP systems can be classified as point-focus concentrators and line-focus concentrators. Solar Tower systems and parabolic dishes uses point focus concentrators whereas PTC’s and linear Fresnel collectors employ line-focus concentrators [27].
Figure 2 shows the cross sectional view of a Parabolic Trough Collector. The absorber tube consists of a metal tube with a glass envelope covering it. The region between the glass envelope and metal tube is filled with either air or vacuum so as to allow for thermal expansion and reduction of convective heat losses. Direct solar radiation is focused on to the focal line of the collector axis. The collector assembly incorporates single-axis tracking mechanism to ensure that the solar beam falls parallel to its axis.
Parabolic Trough collectors can only use the direct component of solar radiation, that is, direct normal irradiance (DNI). Parabolic Trough-based CSP projects are very popular in countries like Spain and the USA where they are used for medium- to large-scale power generation. PTC solar power plants are the most commercially established among the power plants operating with CSP technology [28,29]. Parabolic trough Collector is selected for the CSP plant design analysed in this work as they have superior heat absorption rate when compared to flat plat collectors.
2. Site Selection and Solar Resource Assessment
The suitable site selection for the installation of the CSP plant is very important for reaping maximum benefit from the plant. CSP plants are found to be economically viable for locations where DNI is greater than 5.5 kWh/m2/day (1800 kWh/m2/year) [27]. The typical meteorological year (TMY) data, which includes hourly DNI, ambient temperature, wind speed and atmospheric pressure, are decisive parameters for accurately predicting the solar field thermal power of a CSP plant. In this research work two representative sites in the Middle East which offer an annual average DNI of more than 5.5 kWh/m2/day, has been chosen for the analysis and optimization of the proposed 100 MWe PTC Solar power plant. Table 1 shows the characteristics of two identified locations namely Abu Dhabi (U.A.E) and Aswan (Egypt).
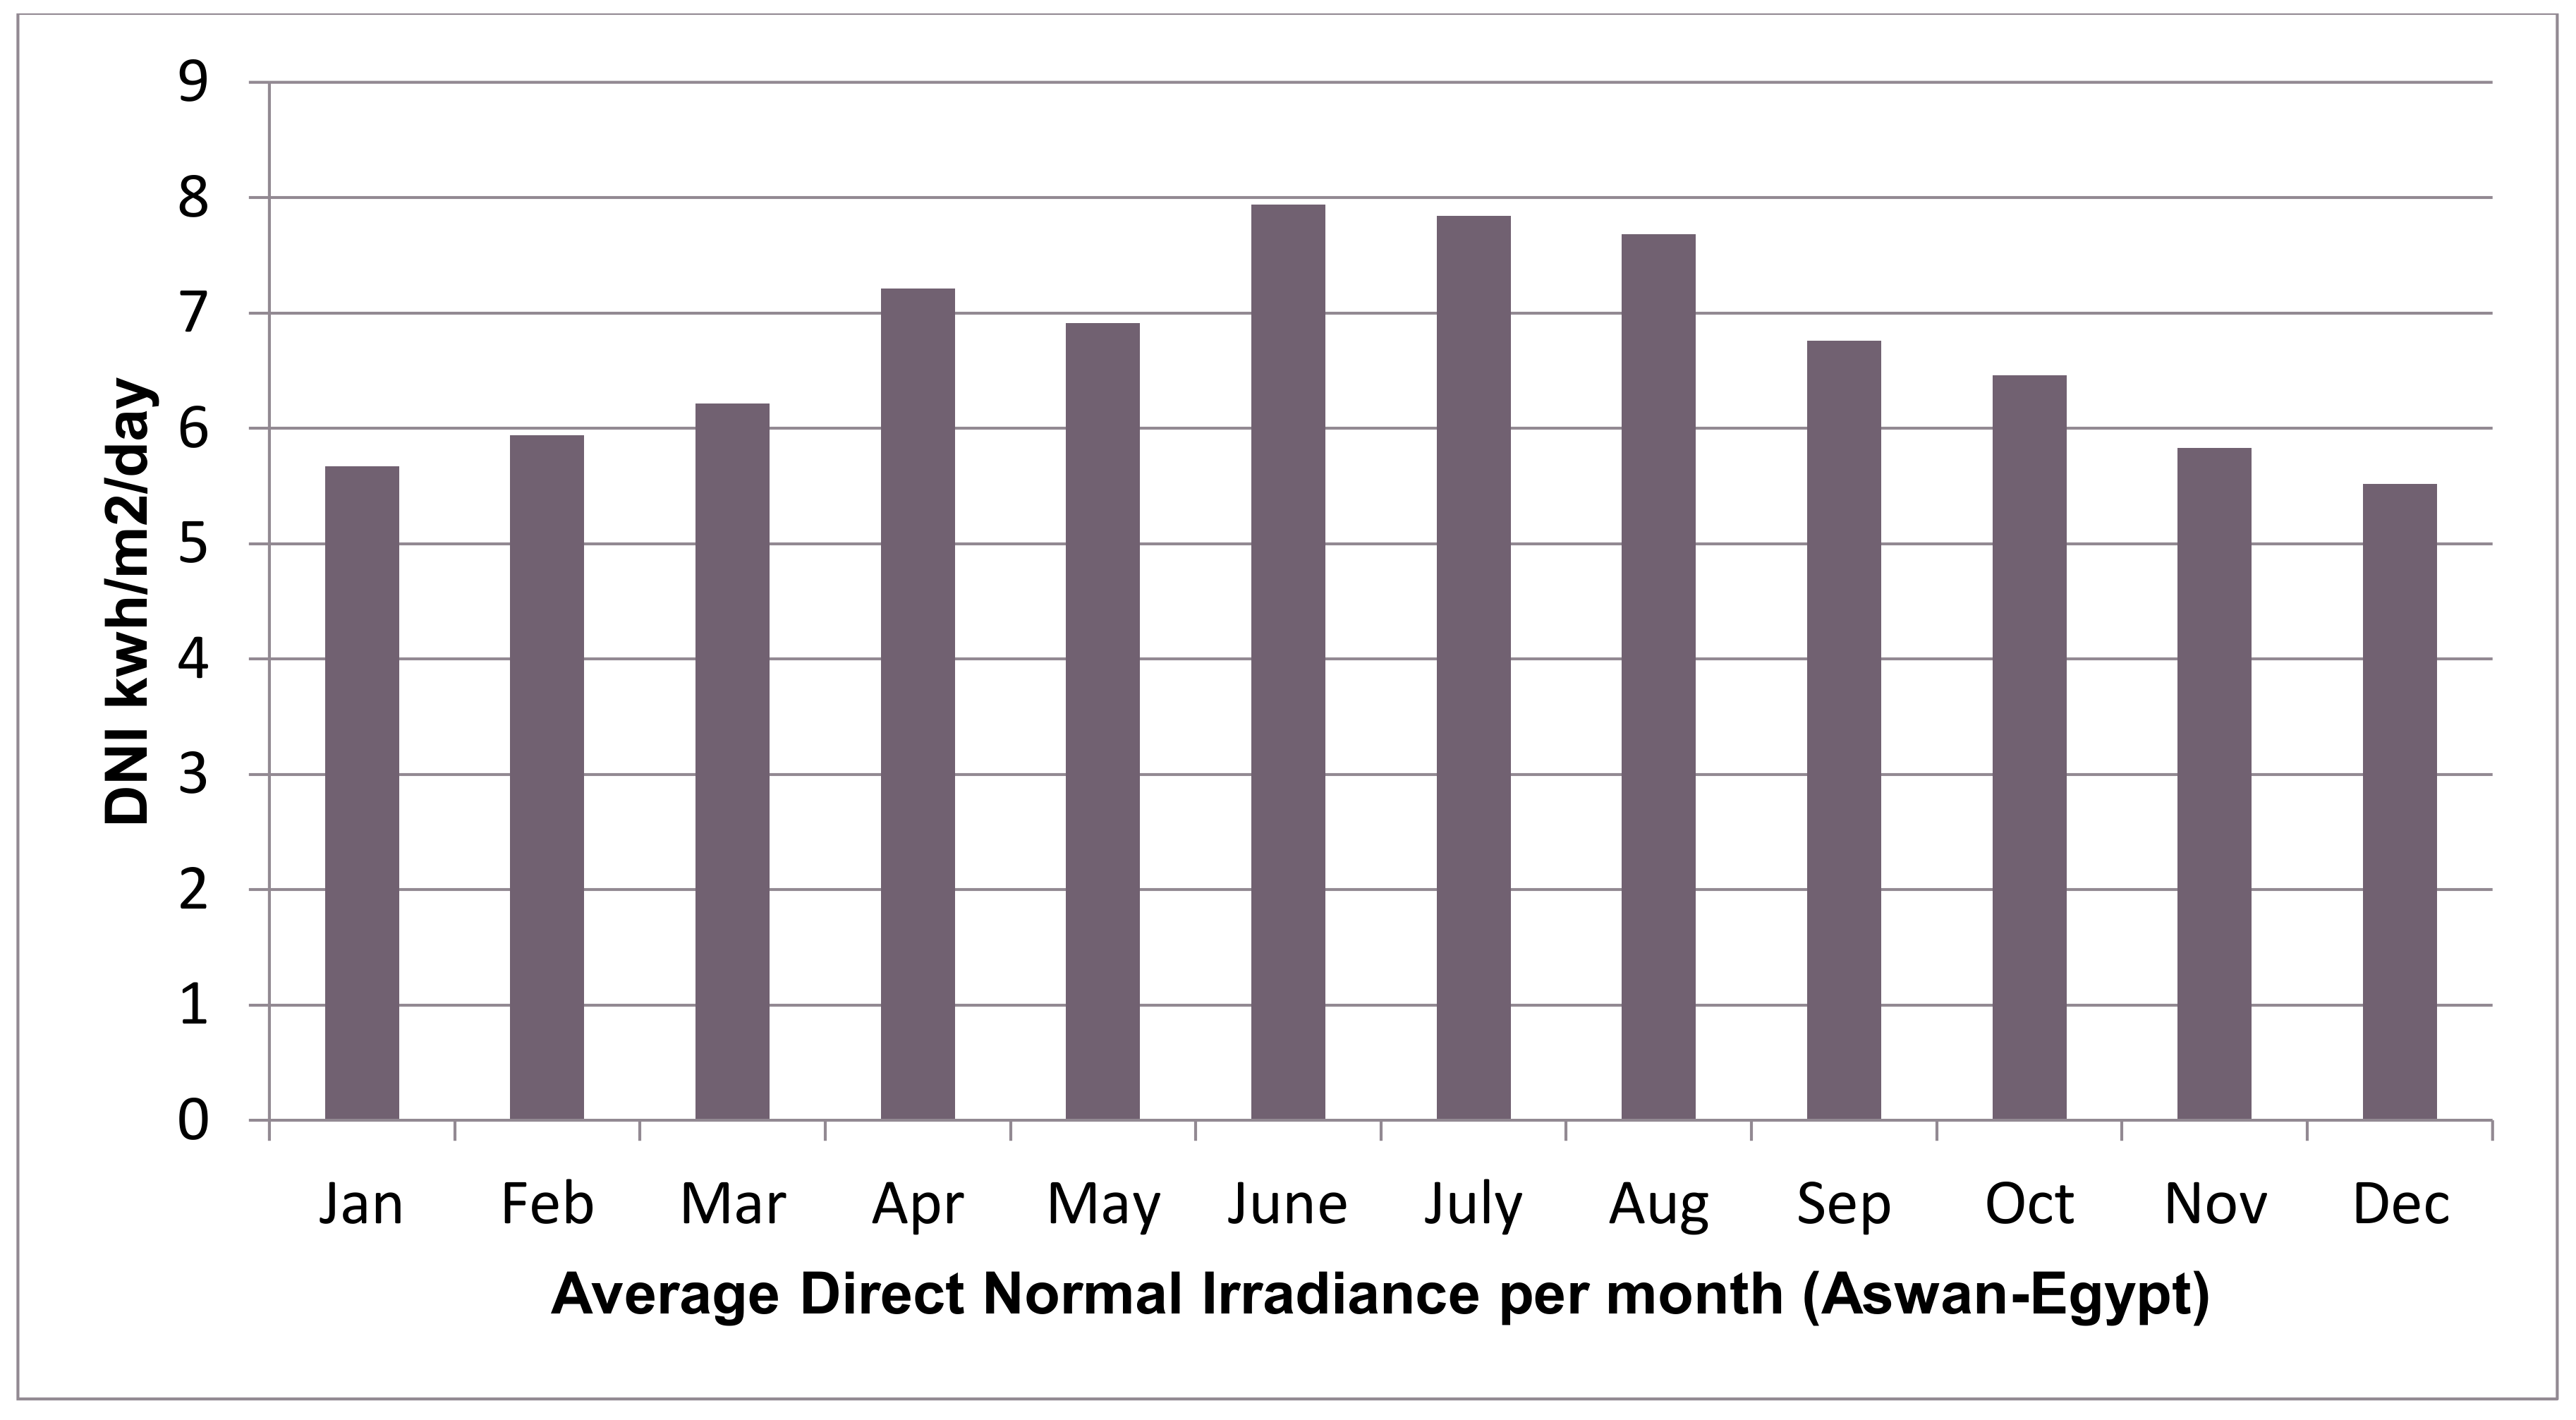
Hourly TMY weather data sourced from International Weather for Energy Calculations (IWEC) database in SAM [30] is used to study the DNI pattern of the locations. Figure 3 and Figure 4 show the monthly variations of average direct normal irradiance for a typical year at Abu Dhabi and Aswan sites respectively. The Abu Dhabi site is characterized by high irradiance level greater than 5.5 kWh/m2/day throughout the year except for the months of March and December as shown in Figure 3. Maximum DNI of 7.458 kWh/m2/day is received during the month of June while the minimum value of 5.191 kWh/m2/day is recorded during December. From Figure 4, it is clear that the location in Aswan offers an average DNI value greater than 5.5 kWh/m2/day throughout the year with the peak value of 7.93 kWh/m2/day during June and a minimum value of 5.51 kWh/m2/day during December.
3. Design of the 100 MW Parabolic Trough Based CSP Power Plant
An initial design of a 100 MW PTC Solar Power Plant has been carried out to assess the performance of the proposed plant in Abu Dhabi and Aswan. The initial design will be further optimized for the ideal values of solar multiple and full load hours of TES.
3.1. Modelling of the Proposed Concentrated Solar Power Plant
Figure 5 shows the CSP plant model considered for analysis in this research work. A PTC Solar Power plant with TES system is selected for the design. The entire CSP plant model can be divided in to three sub systems, namely the Solar field, Thermal storage system and Power block as shown in Figure 5. The solar field consists of parabolic trough solar collectors which direct solar radiation received from the sun to the tubular receivers. The heat transfer fluid (HTF) flowing through the metal tubes of the receiver absorbs the heat energy from the solar field and transfers it to the power block.
The power block is working based on the Rankine cycle and consists of a turbine coupled with an alternator for generating power from the thermal energy received from solar field. For the TES system, a two tank system is selected with Hitec solar salt being the storage medium. The various design parameters of the proposed PTC CSP plant such as solar multiple, full load hours of TES and overall energy efficiency can be determined as follows:
3.1.1. Solar Multiple
Solar Multiple is defined as the ratio between thermal energy obtained by the solar field at the design point to the thermal energy required by the power block at nominal conditions [9].
3.1.2. Full Load Hours of TES
Full load hours of TES is the thermal energy storage capacity of the TES system, expressed in hours of thermal energy delivered at power block design thermal input level [31], and is given by the expression,
where empty is the thermal energy storage capacity (kWht) expressed in hours of power block capacity.
3.1.3. Energy Analysis
Total incident solar energy received by solar field aperture area is:
Total useful energy delivered by the solar field is given as,
Therefore, the thermal efficiency of the solar field is calculated as,
The thermal efficiency of the power block is calculated as,
The Overall Energy efficiency of the plant can be found as,
The net capacity factor of the designed 100 MWe CSP plant is given by:
3.2. Economic Analysis
The economic assessment of the plants are assessed in the software System Advisor Model (SAM), where the levelized cost of electricity in cents/kWh is calculated as given below,
where
3.3. Characteristics of the Proposed CSP Plant Design
The efficiency of a Solar collector depends on the ratio between effective aperture area and surface area of the absorber. Table 2 shows the configuration of the solar collector selected for the design of the proposed CSP plant. The Sky Fuel Sky Trough Collector Model with 80 mm OD receiver is selected for the design. The thermal receiver selected for the design is Schott PTR 80 which is having an absorber tube with inner diameter of 0.076 m. For initial analysis, the value of solar multiple is selected as 2 and full load hours of TES is assumed to be 6 h. The optimization of the values of solar multiple and full load hours of TES will be carried out after the initial performance assessment of the plant.
The initial design parameters of the proposed 100 MW PTC solar power plant are summarized in Table 3.
4. Performance Analysis of the CSP Plant Design
The performance analysis of the proposed PTC Solar power plant has been carried out using System Advisor Model (SAM) [30] developed by National Renewable Energy Laboratory (NREL). The validation of the software was carried out by Price [32]. Figure 6 and Figure 7 show the monthly energy generation from the proposed CSP plants in Abu Dhabi and Aswan respectively. The annual energy generated from the CSP plants is found to be 333.15 GWh and 369.26 GWh for the locations in Abu Dhabi and Aswan respectively. The monthly energy generated from the CSP plant in Abu Dhabi peaks during the month of May and June, reaching a value of 41.66 GWh and 42.58 GWh respectively. Energy generated from the plant during January and December is found to be minimum with values of 13.13 GWh and 11.01 GWh respectively, as is clear from Figure 6. From Figure 7, it can be observed that the energy generation profile for the location in Aswan is better than that of Abu Dhabi, which is in agreement with the DNI characteristics for the locations been mentioned in Figure 3 and Figure 4.
For the site in Aswan, monthly energy generated peaks during the months of June, July and August and reach to a value of 47.36 GWh, 47.49 GWh and 44.21 GWh respectively. Energy generation during January and December recorded the least with values of 14.64 GWh and 12.24 GWh respectively as is shown in Figure 7.
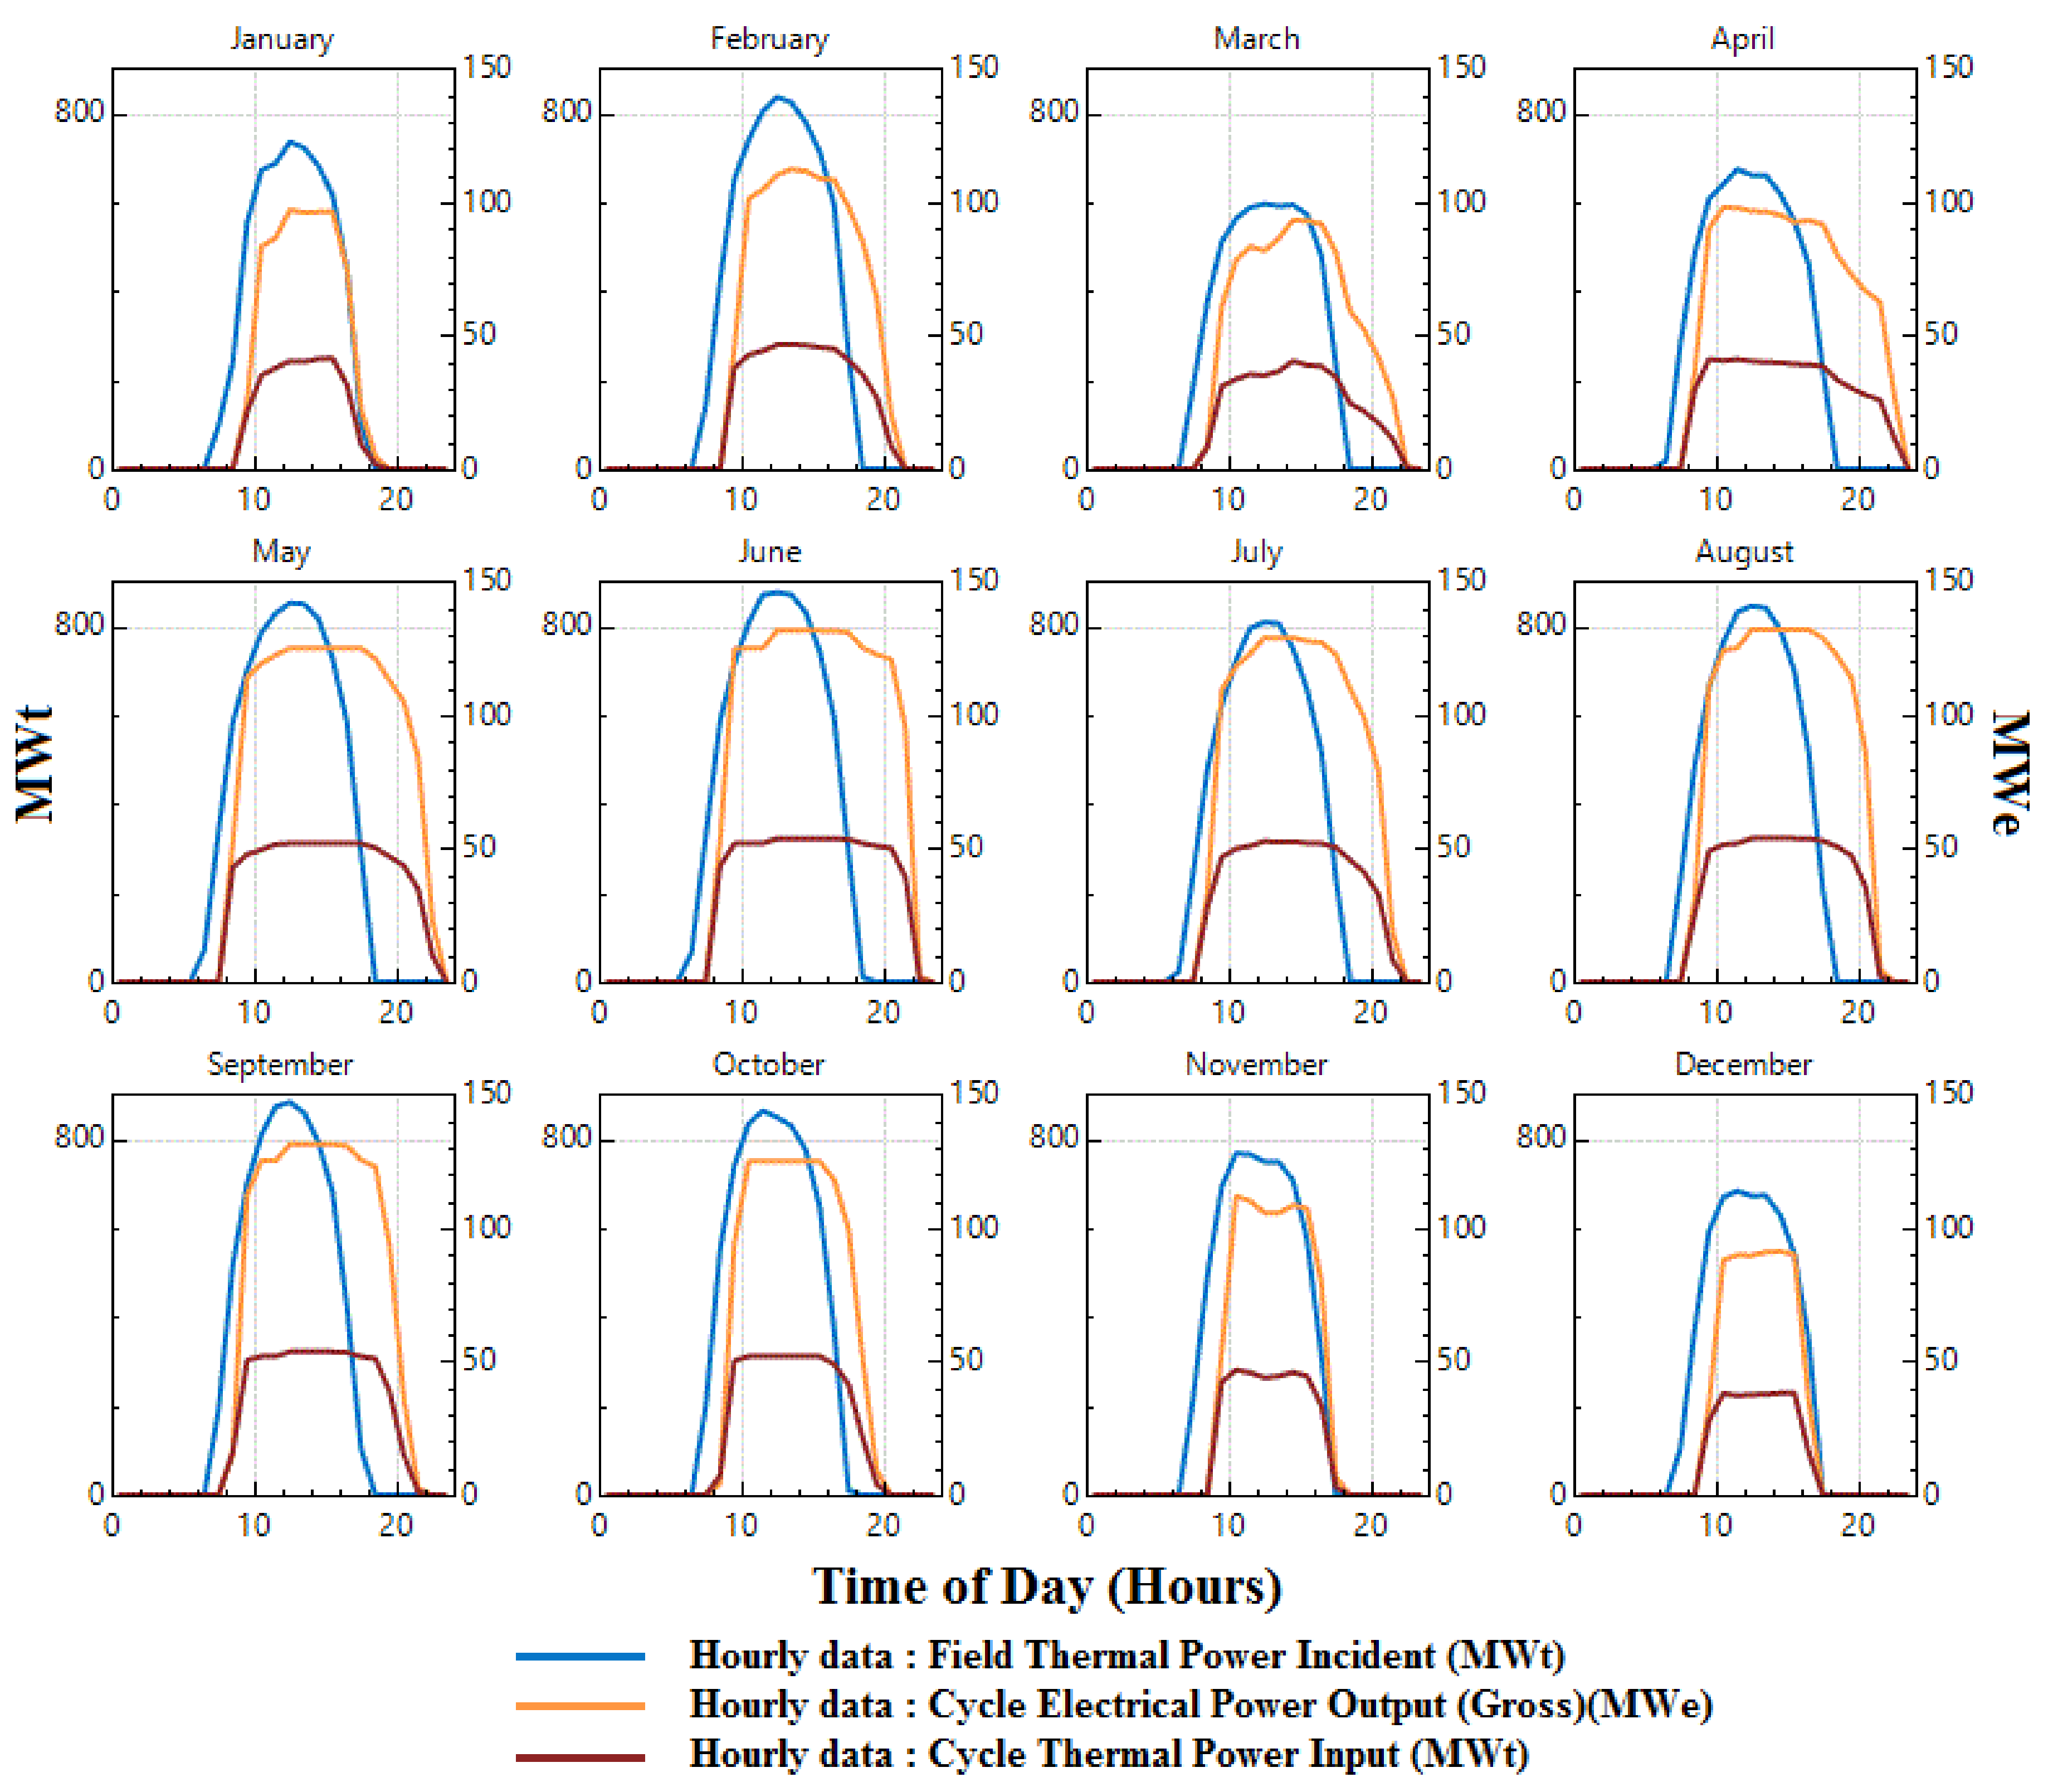
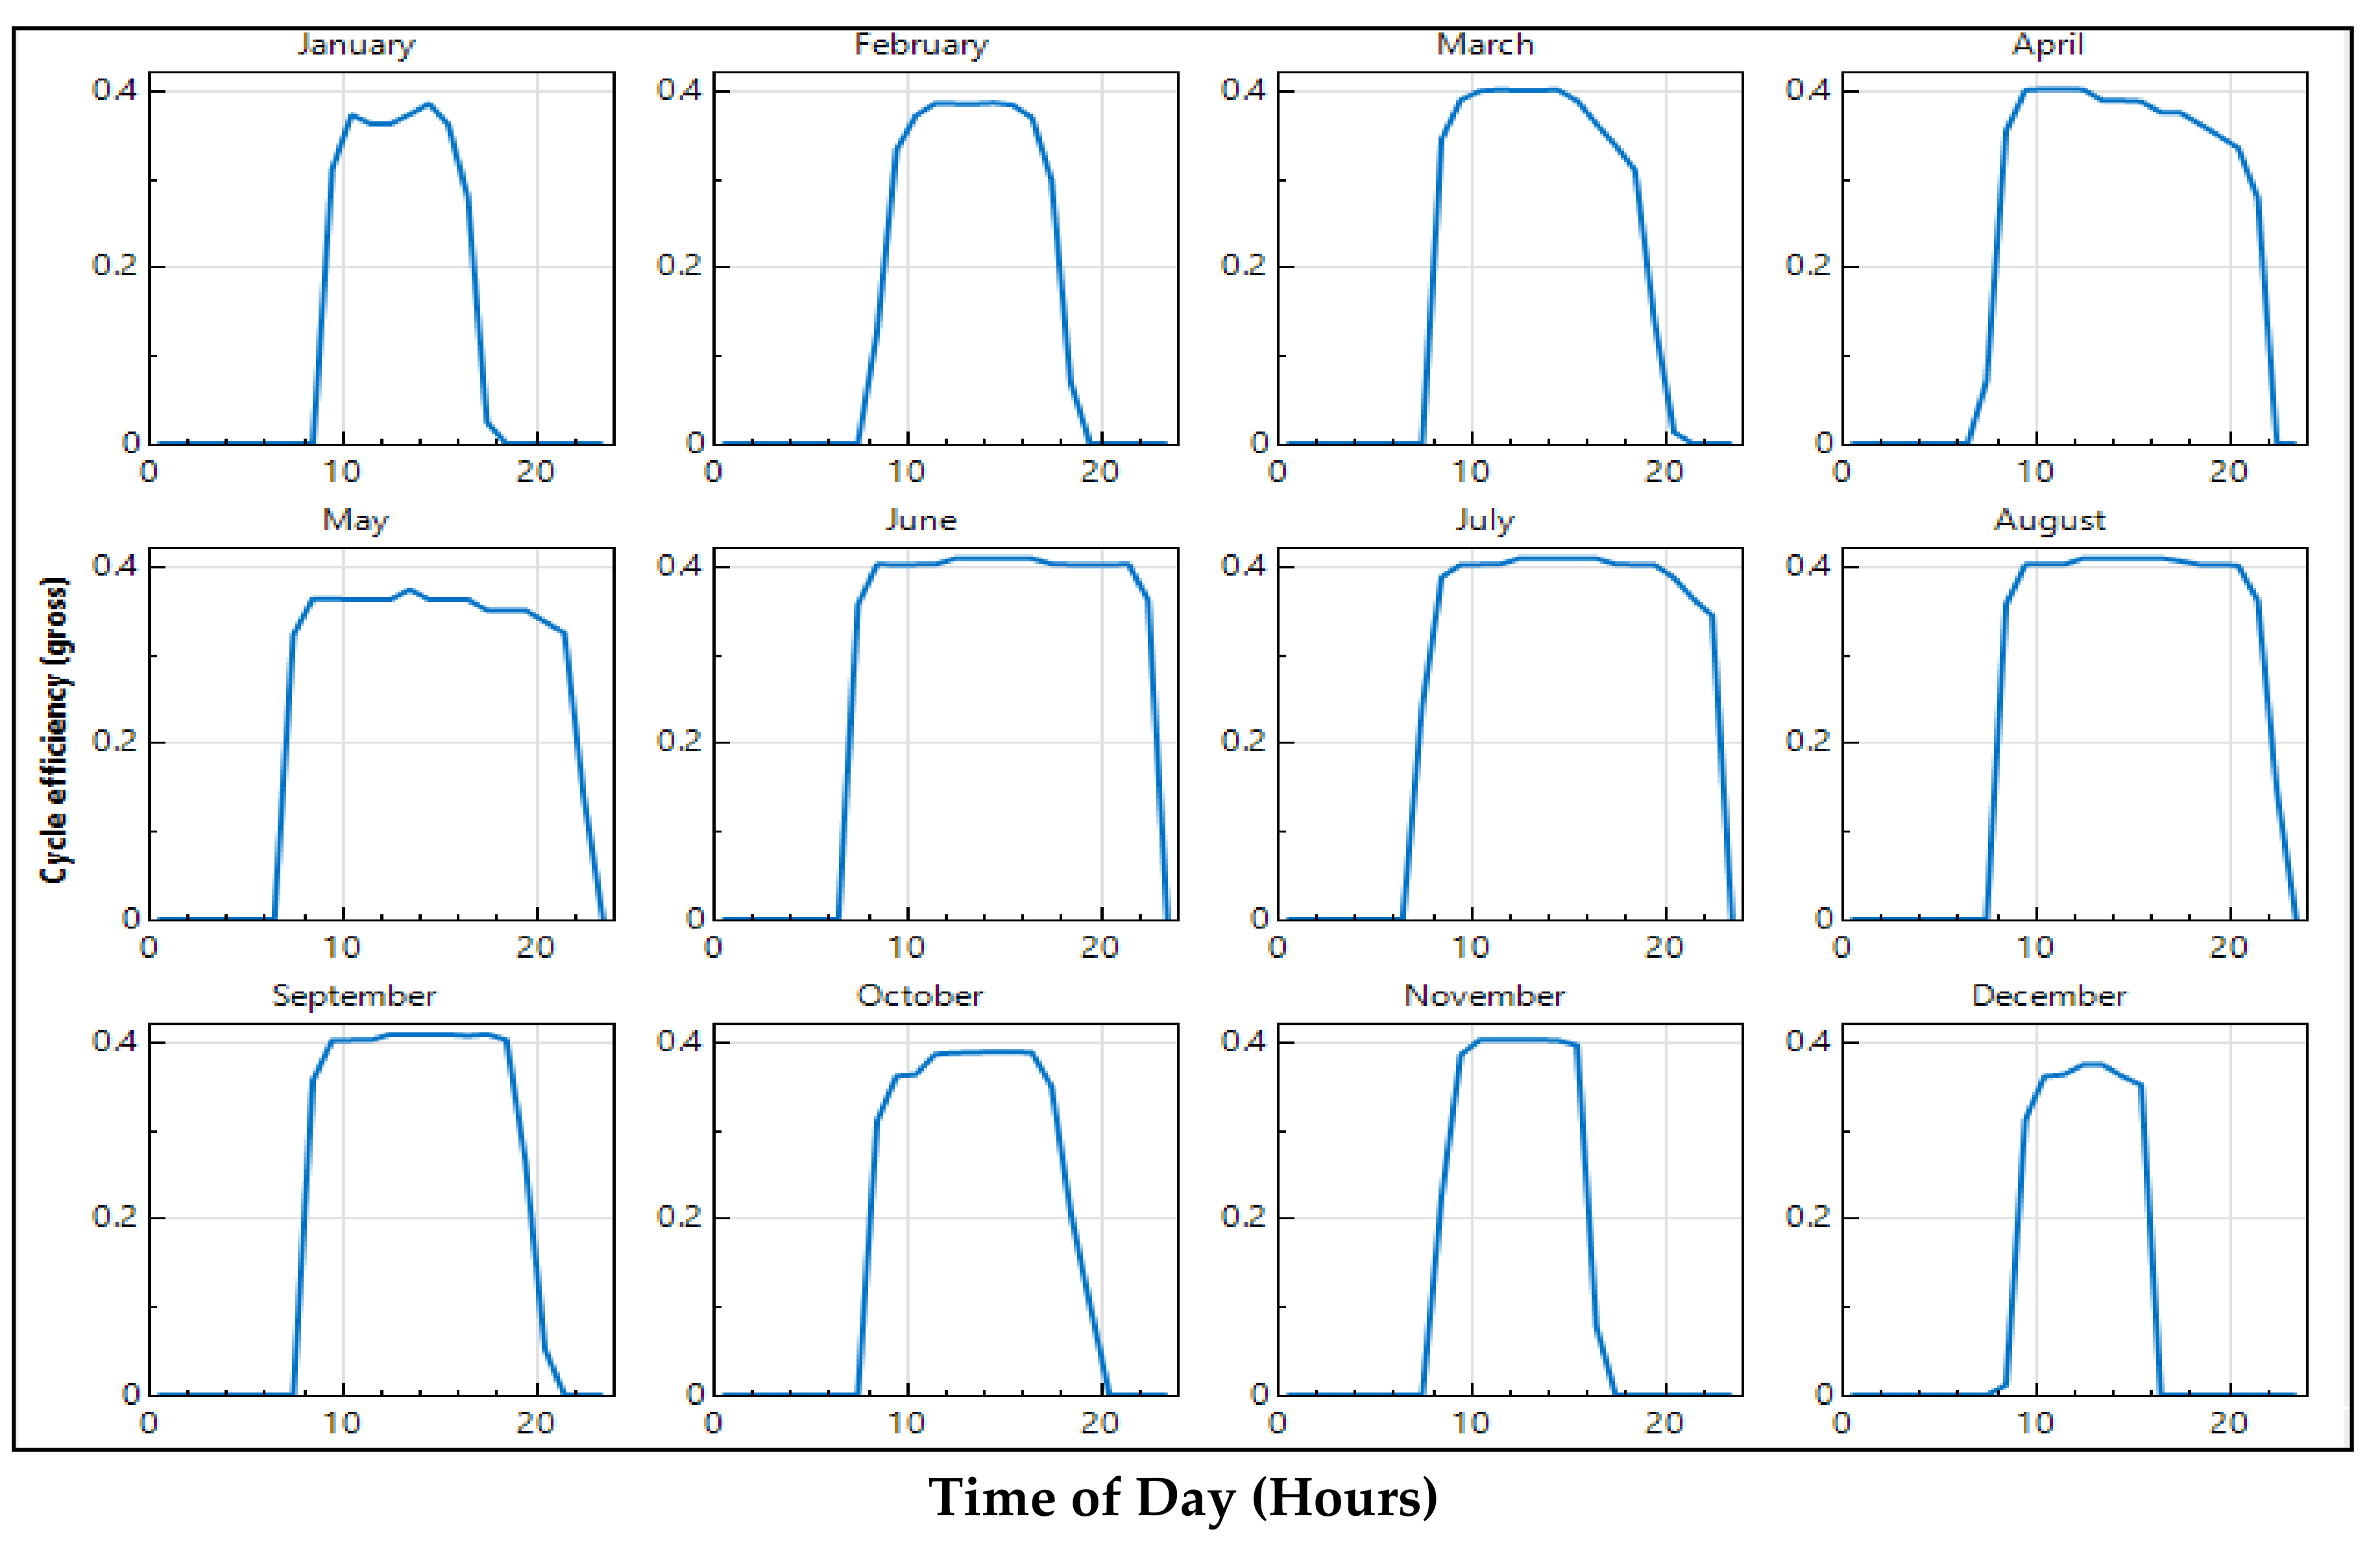
Figure 8 shows the hourly data of cycle thermal power input, gross electrical output and thermal power incident on the field for the proposed plant in Abu Dhabi. The gross electrical power output from the plant depends on the incident irradiation and the cycle thermal power input to the turbine. The maximum value of thermal power incident on the field is found to be 883.212 MWt, whereas the maximum value for cycle thermal power input is recorded as 323.062 MWt for the month of August. Figure 9 shows the cycle efficiency of the designed PTC solar power plant in Abu Dhabi and the cycle efficiency reaches a maximum value of 0.40862 during the month of August.
The hourly data of cycle thermal power input, gross electrical output and thermal power incident on the field for the proposed plant in Aswan is illustrated in Figure 10. The maximum value of thermal power incident on the field is recorded as 913.416 MWt, which is higher than that recorded in Abu Dhabi. Similarly the peak value for cycle thermal power input is recorded as 323.154 MWt for the month of August. Figure 11 shows the cycle efficiency of the proposed PTC solar power plant in Aswan which records a maximum value of 0.40868 during the month of August.
The annual energy yield comparison of the proposed CSP plants at the two sites in the Middle East region is summarized in Table 4. The annual energy generated from the proposed CSP plant design in Abu Dhabi amounts to 333.15 GWh whereas that in Aswan recorded a value of 369.26 GWh with a capacity factor of 38.1% and 42.19% respectively. The mean efficiency of the plant in Abu Dhabi and Aswan is found to be 14.35% and 14.98% respectively, which is in close agreement with other designs available in the literature. To further optimize the performance of the proposed 100 MW CSP plant, the design parameters such as solar multiple and full load hours of TES are varied and the optimization procedure is detailed in the following section.
5. Optimization of the Initial CSP Plant Design
The optimization procedure helps determine the least value of LCOE with maximum annual energy generation. Optimization of the proposed design is carried out by varying two main design parameters, namely solar multiple and full load hours of TES. Figure 12 and Figure 13 show the variation in the annual energy generation and LCOE of the two plants for different values of solar multiple. From the results, it is clear that an increase in the solar multiple consequently increases the annual energy generated from the plants. This can be attributed to the fact that an increase in solar multiple results in a corresponding increase in solar field aperture area and header pipe length, and hence a greater steam outlet temperature from the solar field.
From Figure 12, it can be observed that LCOE of the proposed CSP plant in Abu Dhabi reaches a minimum value of 4.408 cents/kWh corresponding to a solar multiple of 2.6 and annual energy generation of 393.564 GWh. If the solar multiple is increased beyond 2.6, LCOE value is increasing with a negligible increase in the annual energy being generated from the plant. Also it is worth noting the fact that there is a sharp decrease in LCOE value until the solar multiple is increased to 2.2 and thereafter the reduction in the cost is minimal. Based on the tradeoff between the LCOE and Annual power generated, the optimum value of solar multiple for the proposed plant in Abu Dhabi is recommended to be in between 2.2 to 2.4.
From Figure 13, it can be observed that LCOE reaches a minimum value of 4.163 cents/kWh for a solar multiple of 2.4 with annual energy generation from the plant amounting to 407.307 GWh. It can be seen from Figure 13 that when solar multiple is increased beyond 2.4, there is a significant increase in the value of LCOE with minimal increase in the annual energy. This is due to the increase in investment cost of the plant as the maximum net capacity is fixed at 100 MWe. Thus optimum value of solar multiple for the proposed plant in Aswan is also recommended to be in between 2.2 to 2.4. The cost per unit of generated electricity and annual energy generated from the proposed design is found to be better for the location in Aswan as compared to that of Abu Dhabi due to the region’s superior DNI characteristics.
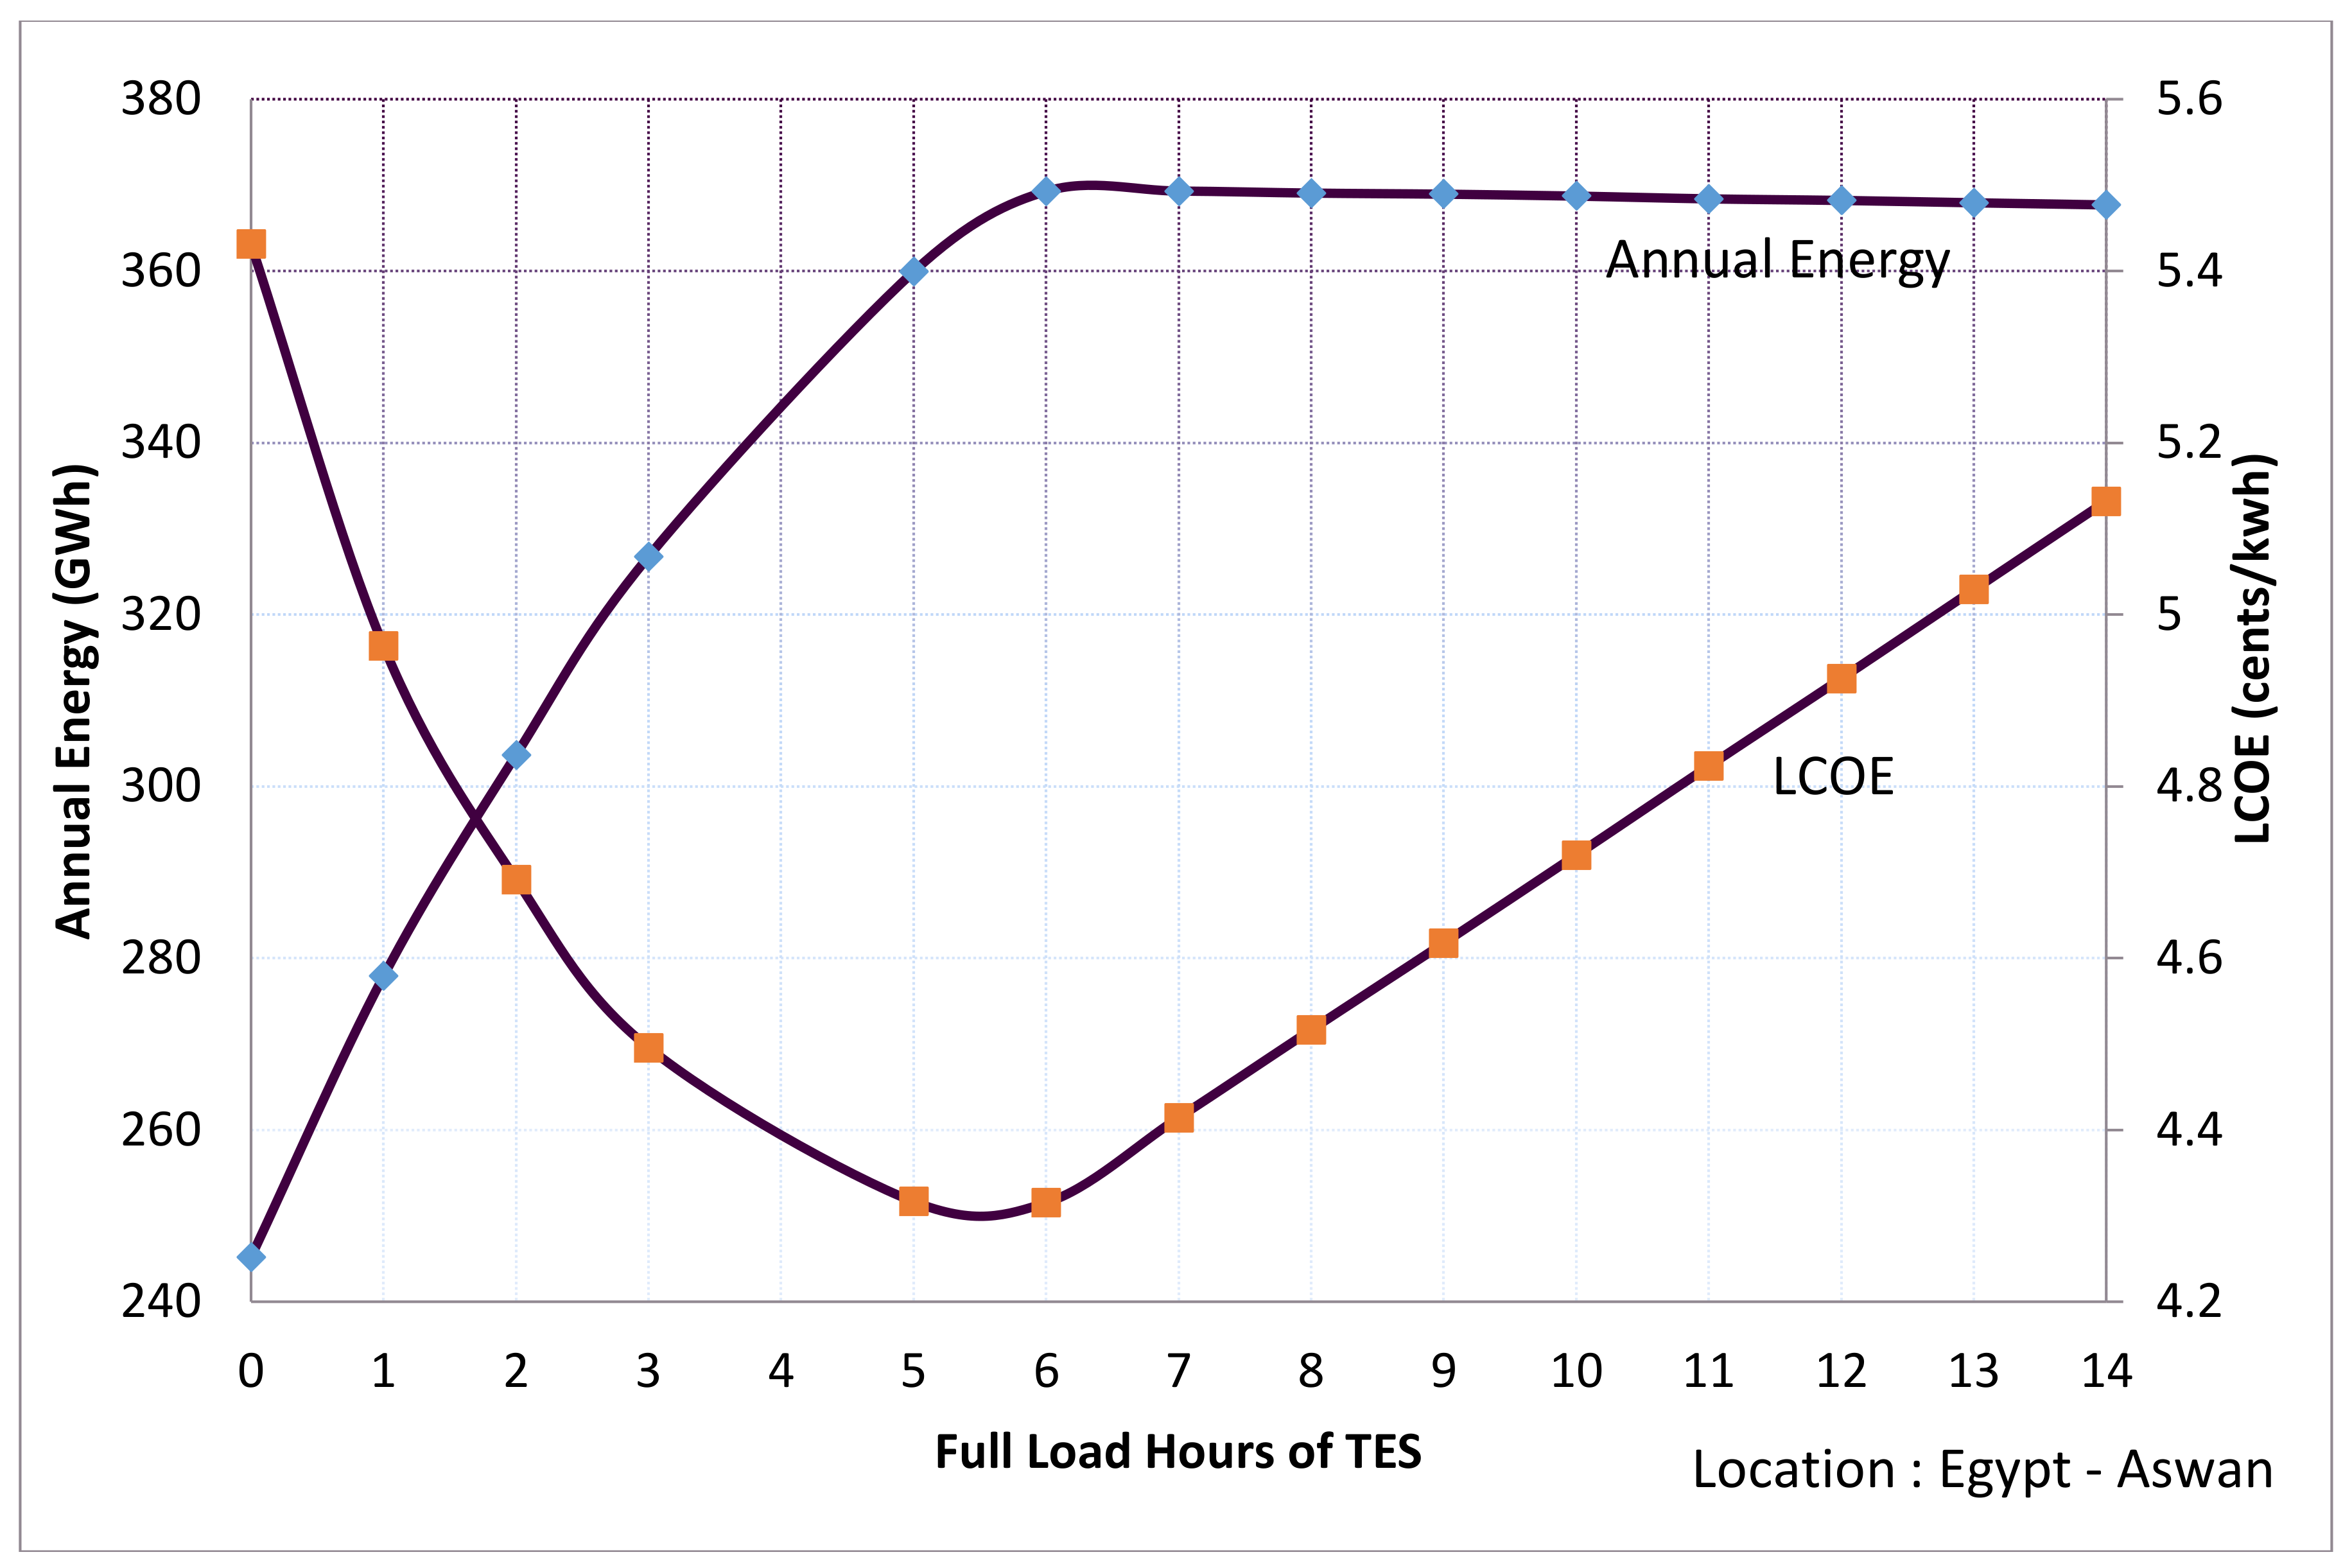
The second design parameter considered for optimization is the full load hours of TES in the CSP plant, which is very important to enhance the potential of the plant and its efficiency to operate for longer time intervals. Moreover, the TES system ensures that the power block receives more energy during the period when the solar radiation is low. Figure 14 and Figure 15 show the variation in the annual energy generated and LCOE with full load hours of TES for the location in Abu Dhabi and Aswan respectively. From the figures, it is clear that LCOE decreases with increase in full load hours of TES until a particular value and thereafter it starts to increase again. From Figure 14, the optimum value of full load hours of TES for the proposed plant in Abu Dhabi is found to be 5 h with a corresponding LCOE value of 4.663 cents/kWh.
Six hours of TES as considered in the initial analysis for Aswan is found to be the optimum value as observed from Figure 15, with an LCOE value of 4.315 cents/kWh. The full load hours of TES for the proposed design, if increased beyond the optimum value of 5 for Abu Dhabi and 6 for Aswan, will result in an increase in LCOE value of the plants. This fact is due to the increase in the investment cost as well as the below par utilization of the TES system when compared to its design capacity.
The optimum design parameters for the solar multiple and full load hours of TES obtained from the above analysis is further utilized to improve the performance of the initial design. For Abu Dhabi, full load hours of TES has been fixed as 5 h and performance of the plant was assessed for various values of solar multiple ranging from 2.2 to 2.4. Similar analysis has been done for Aswan, with full load hours of TES been fixed as 6 h.
Table 5 summarizes the results obtained for the optimized design with that of the initial design for the proposed CSP. The optimized configuration is selected based on the tradeoff between annual power generated, LCOE and mean efficiency of the plant. From the table it is clear that there is a significant improvement in the annual energy generation, capacity factor and LCOE values for the optimized configuration when compared to that of the initial design. The performance parameters of the optimized configuration is compared to the results reported by Abbas et al. [17] for four different sites in Algeria. A comparison of the results show that the capacity factor, annual energy generated and mean efficiency of the proposed plants in Abu Dhabi and Aswan is in close agreement with the reported results with a significant reduction in the LCOE value. Thus the performance of a 100 MWe PTC solar power plant design intended for the locations in the Middle East region is found to be feasible based on the analysis carried out for two locations in Abu Dhabi and Aswan. The installation of the proposed CSP plant in the region could significantly contribute to the sustainable energy future of the region with reduced dependency on fossil fuels.
6. Conclusions
The design, performance analysis and optimization of a 100 MWe parabolic trough collector Solar Power Plant with thermal energy storage has been carried out for two locations in the Middle Eastern region. The SAM software has been used to assess the performance of the designed CSP plant in two locations of the Middle East whose annual average DNI is greater than 5.5 kWh/m2/day. The initial analysis of the proposed design revealed that the CSP plant in Aswan has an annual energy yield of 369.26 GWh whereas that in Abu Dhabi recorded 333.15 GWh. The performance of the proposed CSP plant is further optimized by varying the initial design parameters such as solar multiple and full load hours of TES. The optimum values for solar multiple and full load hours of TES for the Aswan site is found to be 2.2 and 6 h respectively. For the Abu Dhabi site, optimum performance can be achieved by selecting 5 h of thermal energy storage and a solar multiple of 2.2. The analysis of this optimum configuration revealed that annual energy generation can be increased to 392.587 GWh and 353.69 GWh respectively for Aswan and Abu Dhabi, sites with a corresponding decrease in LCOE values. Based on the findings of the study, the proposed 100 MW parabolic trough-based CSP plant with TES system is found to be ideally suited for the Middle East region and can contribute to the sustainable energy future of the region.
Acknowledgments
The authors would like to thank the Deanship of Scientific Research, Majmaah University (Contract No. 37/70), Majmaah, 11952, Saudi Arabia for supporting this research project.
Author Contributions
Praveen R.P. conceived, designed and analyzed the initial and optimum design developed in the research work. Mohammad Abdul Baseer contributed towards result analysis and manuscript preparation. Ahmed Bilal Awan and Muhammad Zubair reviewed and discussed the work with the rest of authors and refined the manuscript. Praveen R.P. wrote the paper with able support from all the co-authors.
Conflicts of Interest
The authors declare no conflicts of interest.
Nomenclature
| Angle of incidence (degree) | |
| DNI | Direct normal irradiance (kWh/m2) |
| Collector’s aperture area (m2) | |
| Thermal energy obtained by the solar field (kWh) | |
| Thermal energy required by the power block (kWh) | |
| Design cycle Power (kW) | |
| Total incident solar energy received by collector’s aperture area (kWh) | |
| Total thermal energy received by the power block (kWh) | |
| Total useful energy delivered by solar field (kWh) | |
| Total Investment Cost (US$) | |
| Total Energy Output (kWh) | |
| Total number of desired storage hours (h) | |
| Annual discount rate | |
| N | Analysis Period (years) |
| Annual operating and maintenance costs (US$) | |
| Capacity factor | |
| Design point cycle efficiency | |
| Energy efficiency of the solar field | |
| Energy efficiency of the power block | |
| Overall energy efficiency of the plant | |
| Enthalpy at the outlet solar field (kJ/kg) | |
| Enthalpy at the inlet of solar field (kJ/kg) | |
| Mass flow rate of the HTF (kg/s) | |
| Environmental cost according to CO2 rejected (US$) | |
| Net Energy generated (kWh) | |
| Capital recovery factor | |
| PTC | Parabolic Trough Collector |
| LCOE | Levelized cost of electricity |
| CSP | Concentrated solar power |
| DNI | Direct normal irradiance |
| SAM | System Advisor model |
References
- Thirugnanasambandam, M.; Iniyan, S.; Goic, R. A review of solar thermal technologies. Renew. Sustain. Energy Rev. 2010, 14, 312–322. [Google Scholar] [CrossRef]
- Tsikalakis, A.; Tomtsi, T.; Hatziargyriou, N.D.; Poullikkas, A.; Malamatenios, C.; Giakoumelos, E.; Jaouad, O.C.; Chenak, A.; Fayek, A.; Matar, T.; et al. Review of best practices of solar electricity resources applications in selected Middle East and North Africa (MENA) countries. Renew. Sustain. Energy Rev. 2011, 15, 2838–2849. [Google Scholar] [CrossRef]
- Nematollahi, O.; Hoghooghi, H.; Rasti, M.; Sedaghat, A. Energy demands and renewable energy resources in the Middle East. Renew. Sustain. Energy Rev. 2016, 54, 1172–1181. [Google Scholar] [CrossRef]
- Jahangiri, M.; Ghaderi, R.; Haghani, A.; Nematollahi, O. Finding the best locations for establishment of solar-wind power stations in Middle-East using GIS: A review. Renew. Sustain. Energy Rev. 2016, 66, 38–52. [Google Scholar] [CrossRef]
- Furman, H.K.H. Dust Storms in the Middle East: Sources of Origin and their Temporal Characteristics. Indoor Built Environ. 2003, 12, 419–426. [Google Scholar] [CrossRef]
- Hernandez, R.R.; Easter, S.B.; Murphy-Mariscal, M.L.; Maestre, F.T.; Tavassoli, M.; Allen, E.B.; Barrows, C.W.; Belnap, J.; Ochoa-Hueso, R.; Ravi, S.; et al. Environmental impacts of utility-scale solar energy. Renew. Sustain. Energy Rev. 2014, 29, 766–779. [Google Scholar] [CrossRef]
- Kumaresan, G.; Sridhar, R.; Velraj, R. Performance studies of a solar parabolic trough collector with a thermal energy storage system. Energy 2012, 47, 395–402. [Google Scholar] [CrossRef]
- Reddy, V.S.; Kaushik, S.C.; Tyagi, S.K. Exergetic analysis and performance evaluation of parabolic trough concentrating solar thermal power plant (PTCSTPP). Energy 2012, 39, 258–273. [Google Scholar] [CrossRef]
- Montes, M.J.; Abànades, A.; Martınez-Val, J.M. Performance of a direct steam generation solar thermal power plant for electricity production as a function of the solar multiple. Sol. Energy 2009, 83, 679–689. [Google Scholar] [CrossRef] [Green Version]
- Kearney, D.; Kelly, B.; Herrmann, U.; Cable, R.; Pacheco, J.; Mahoney, R.; Price, H.; Blake, D.; Nava, P.; Potrovitza, N. Engineering aspects of a molten salt heat transfer fluid in a trough solar field. Energy 2004, 29, 861–870. [Google Scholar] [CrossRef]
- Martin, L.; Mariano, M. Optimal year-round operation of a concentrated solar energy plant in the south of Europe. Appl. Therm. Eng. 2013, 59, 627–633. [Google Scholar] [CrossRef]
- Garcia, L.I.; Alvarez, J.L.; Blanco, D. Performance model for parabolic trough solar thermal power plants with thermal storage: Comparison to operating plant data. Sol. Energy 2011, 85, 2443–2460. [Google Scholar] [CrossRef]
- Poullikkas, A. Economic analysis of power generation from parabolic trough solar thermal plants for the Mediterranean region-a case study for the island of Cyprus. Renew. Sustain. Energy Rev. 2009, 13, 2474–2484. [Google Scholar] [CrossRef]
- Larrain, T.; Escobar, R.; Vergara, J. Performance model to assist solar thermal power plant siting in northern Chile based on backup fuel consumption. Renew. Energy 2010, 35, 1632–1643. [Google Scholar] [CrossRef]
- Boukelia, T.E.; Mecibah, M.S.; Kumar, B.N.; Reddy, K.S. Investigation of solar parabolic trough power plants with and without integrated TES (thermal energy storage) and FBS (fuel backup system) using thermic oil and solar salt. Energy 2015, 88, 292–303. [Google Scholar] [CrossRef]
- Boukelia, T.E.; Mecibah, M.S.; Kumar, B.N.; Reddy, K.S. Optimization, selection and feasibility study of solar parabolic trough power plants for Algerian conditions. Energy Convers. Manag. 2015, 101, 450–459. [Google Scholar] [CrossRef]
- Abbas, M.; Belgroun, Z.; Aburidah, H.; Merzouk, N.K. Assessment of a solar parabolic trough power plant for electricity generation under Mediterranean and arid climate conditions in Algeria. Energy Procedia 2013, 42, 93–102. [Google Scholar] [CrossRef]
- Chafie, M.; Aissa, M.F.B.; Bouadila, S.; Balghouthi, M.; Farhat, A.; Guizani, A. Experimental investigation of parabolic trough collector system under Tunisian climate: Design, manufacturing and performance assessment. Appl. Therm. Eng. 2016, 101, 273–283. [Google Scholar] [CrossRef]
- Reddy, K.S.; Kumar, K.R. Solar collector field design and viability analysis of standalone parabolic trough power plants for Indian conditions. Energy Sustain. Dev. 2012, 16, 456–470. [Google Scholar] [CrossRef]
- Bishoyi, D.; Sudhakar, K. Modeling and performance simulation of 100 MW PTC based solar thermal power plant in Udaipur India. Case Stud. Therm. Eng. 2017, 10, 216–226. [Google Scholar] [CrossRef]
- Mezher, T.; Goldsmith, D.; Choucri, N. Renewable Energy in Abu Dhabi: Opportunities and Challenges. J. Energy Eng. 2011, 137, 169–176. [Google Scholar] [CrossRef]
- Shouman, E.R.; Khattab, N.M. Future economic of concentrating solar power (CSP) for electricity generation in Egypt. Renew. Sustain. Energy Rev. 2015, 41, 1119–1127. [Google Scholar] [CrossRef]
- Kordmahaleh, A.A.; Naghashzadegan, M.; Javaherdeh, K.; Khoshgoftar, M. Design of a 25MWe Solar Thermal Power Plant in Iran with Using Parabolic Trough Collectors and a Two-Tank Molten Salt Storage System. Int. J. Photoenergy 2017. Available online: https://www.hindawi.com/journals/ijp/2017/4210184/ (accessed on 17 January 2018). [CrossRef]
- Al-Soud, M.S.; Hrayshat, E.S. A 50MW concentrating solar power plant for Jordan. J. Clean. Prod. 2009, 17, 625–635. [Google Scholar] [CrossRef]
- Bellos, E.; Tzivanidis, C. Assessment of the thermal enhancement methods in parabolic trough collectors. Int. J. Energy Environ. Eng. 2018, 9, 59–70. [Google Scholar] [CrossRef]
- Llamas, J.M.; Bullejos, D.; Ruiz de Adana, M. Techno-Economic Assessment of Heat Transfer Fluid Buffering for Thermal Energy Storage in the Solar Field of Parabolic trough Solar Thermal Power Plants. Energies 2017, 10, 1123. [Google Scholar] [CrossRef]
- Zhang, H.L.; Baeyens, J.; Degreve, J.; Caceres, G. Concentrated solar power plants: Review and design methodology. Renew. Sustain. Energy Rev. 2013, 22, 466–481. [Google Scholar] [CrossRef]
- Fernandez-Garcia, A.; Zarza, E.; Valenzuela, L.; Perez, M. Parabolic-trough solar collectors and their applications. Renew. Sustain. Energy Rev. 2010, 14, 1695–1721. [Google Scholar] [CrossRef]
- Jebasingh, V.K.; Herbert, G.M.J. A review of solar parabolic trough collector. Renew. Sustain. Energy Rev. 2016, 54, 1085–1091. [Google Scholar] [CrossRef]
- System Advisor Model Version 2017.9.5 (SAM 2017.9.5); National Renewable Energy Laboratory: Golden, CO, USA. Available online: https://sam.nrel.gov/content/downloads (accessed on 12 January 2018).
- Blair, N.; Dobos, A.; Freeman, J.; Neises, T.; Wagne, M.; Ferguson, T.; Gilman, P.; Janzou, S. System Advisor Model, SAM 2014.1.14, General Description; NREL Report No. TP-6A20-61019; National Renewable Energy Laboratory (NREL): Golden, CO, USA, 2014; p. 19.
- Price, H. A Parabolic trough Solar Power Plant Simulation model. In Proceedings of the ASME 2003 International Solar Energy Conference, Kohala Coast, HI, USA, 15–18 March 2003; pp. 665–673. [Google Scholar]
Figure 1.
Principle of solar thermal power generation.
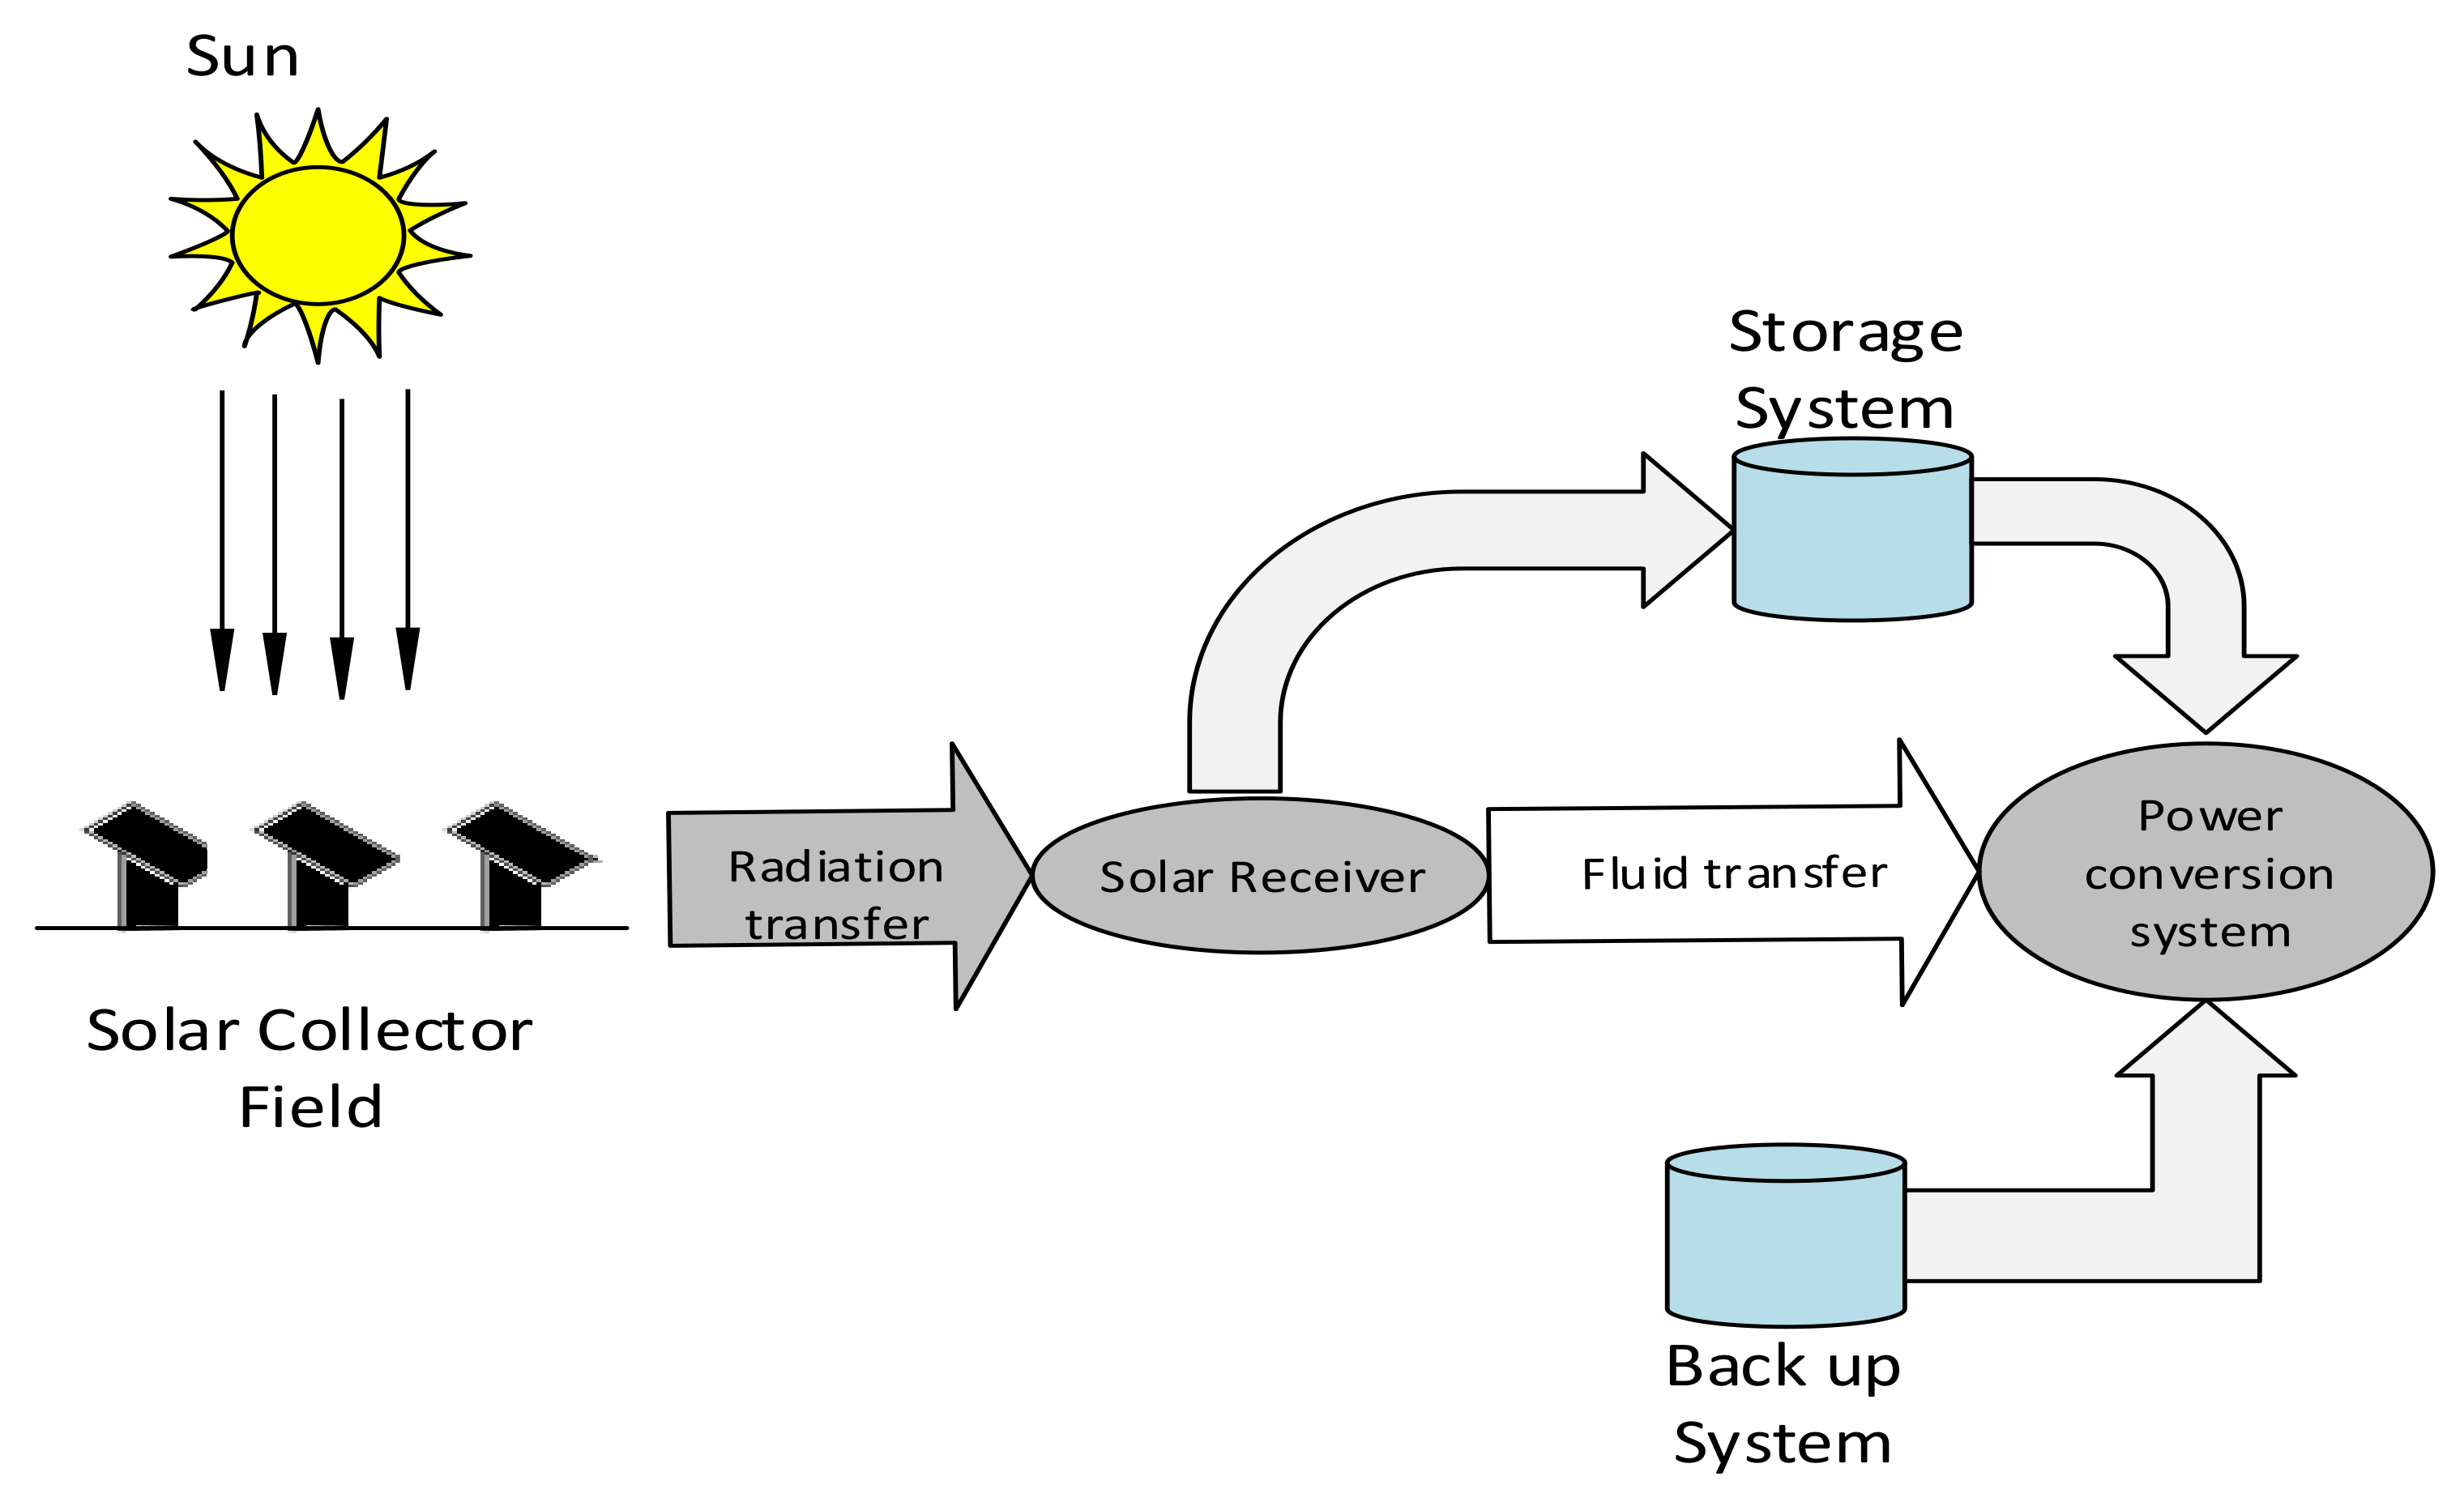
Figure 2.
Cross sectional view of Parabolic Trough Collector.
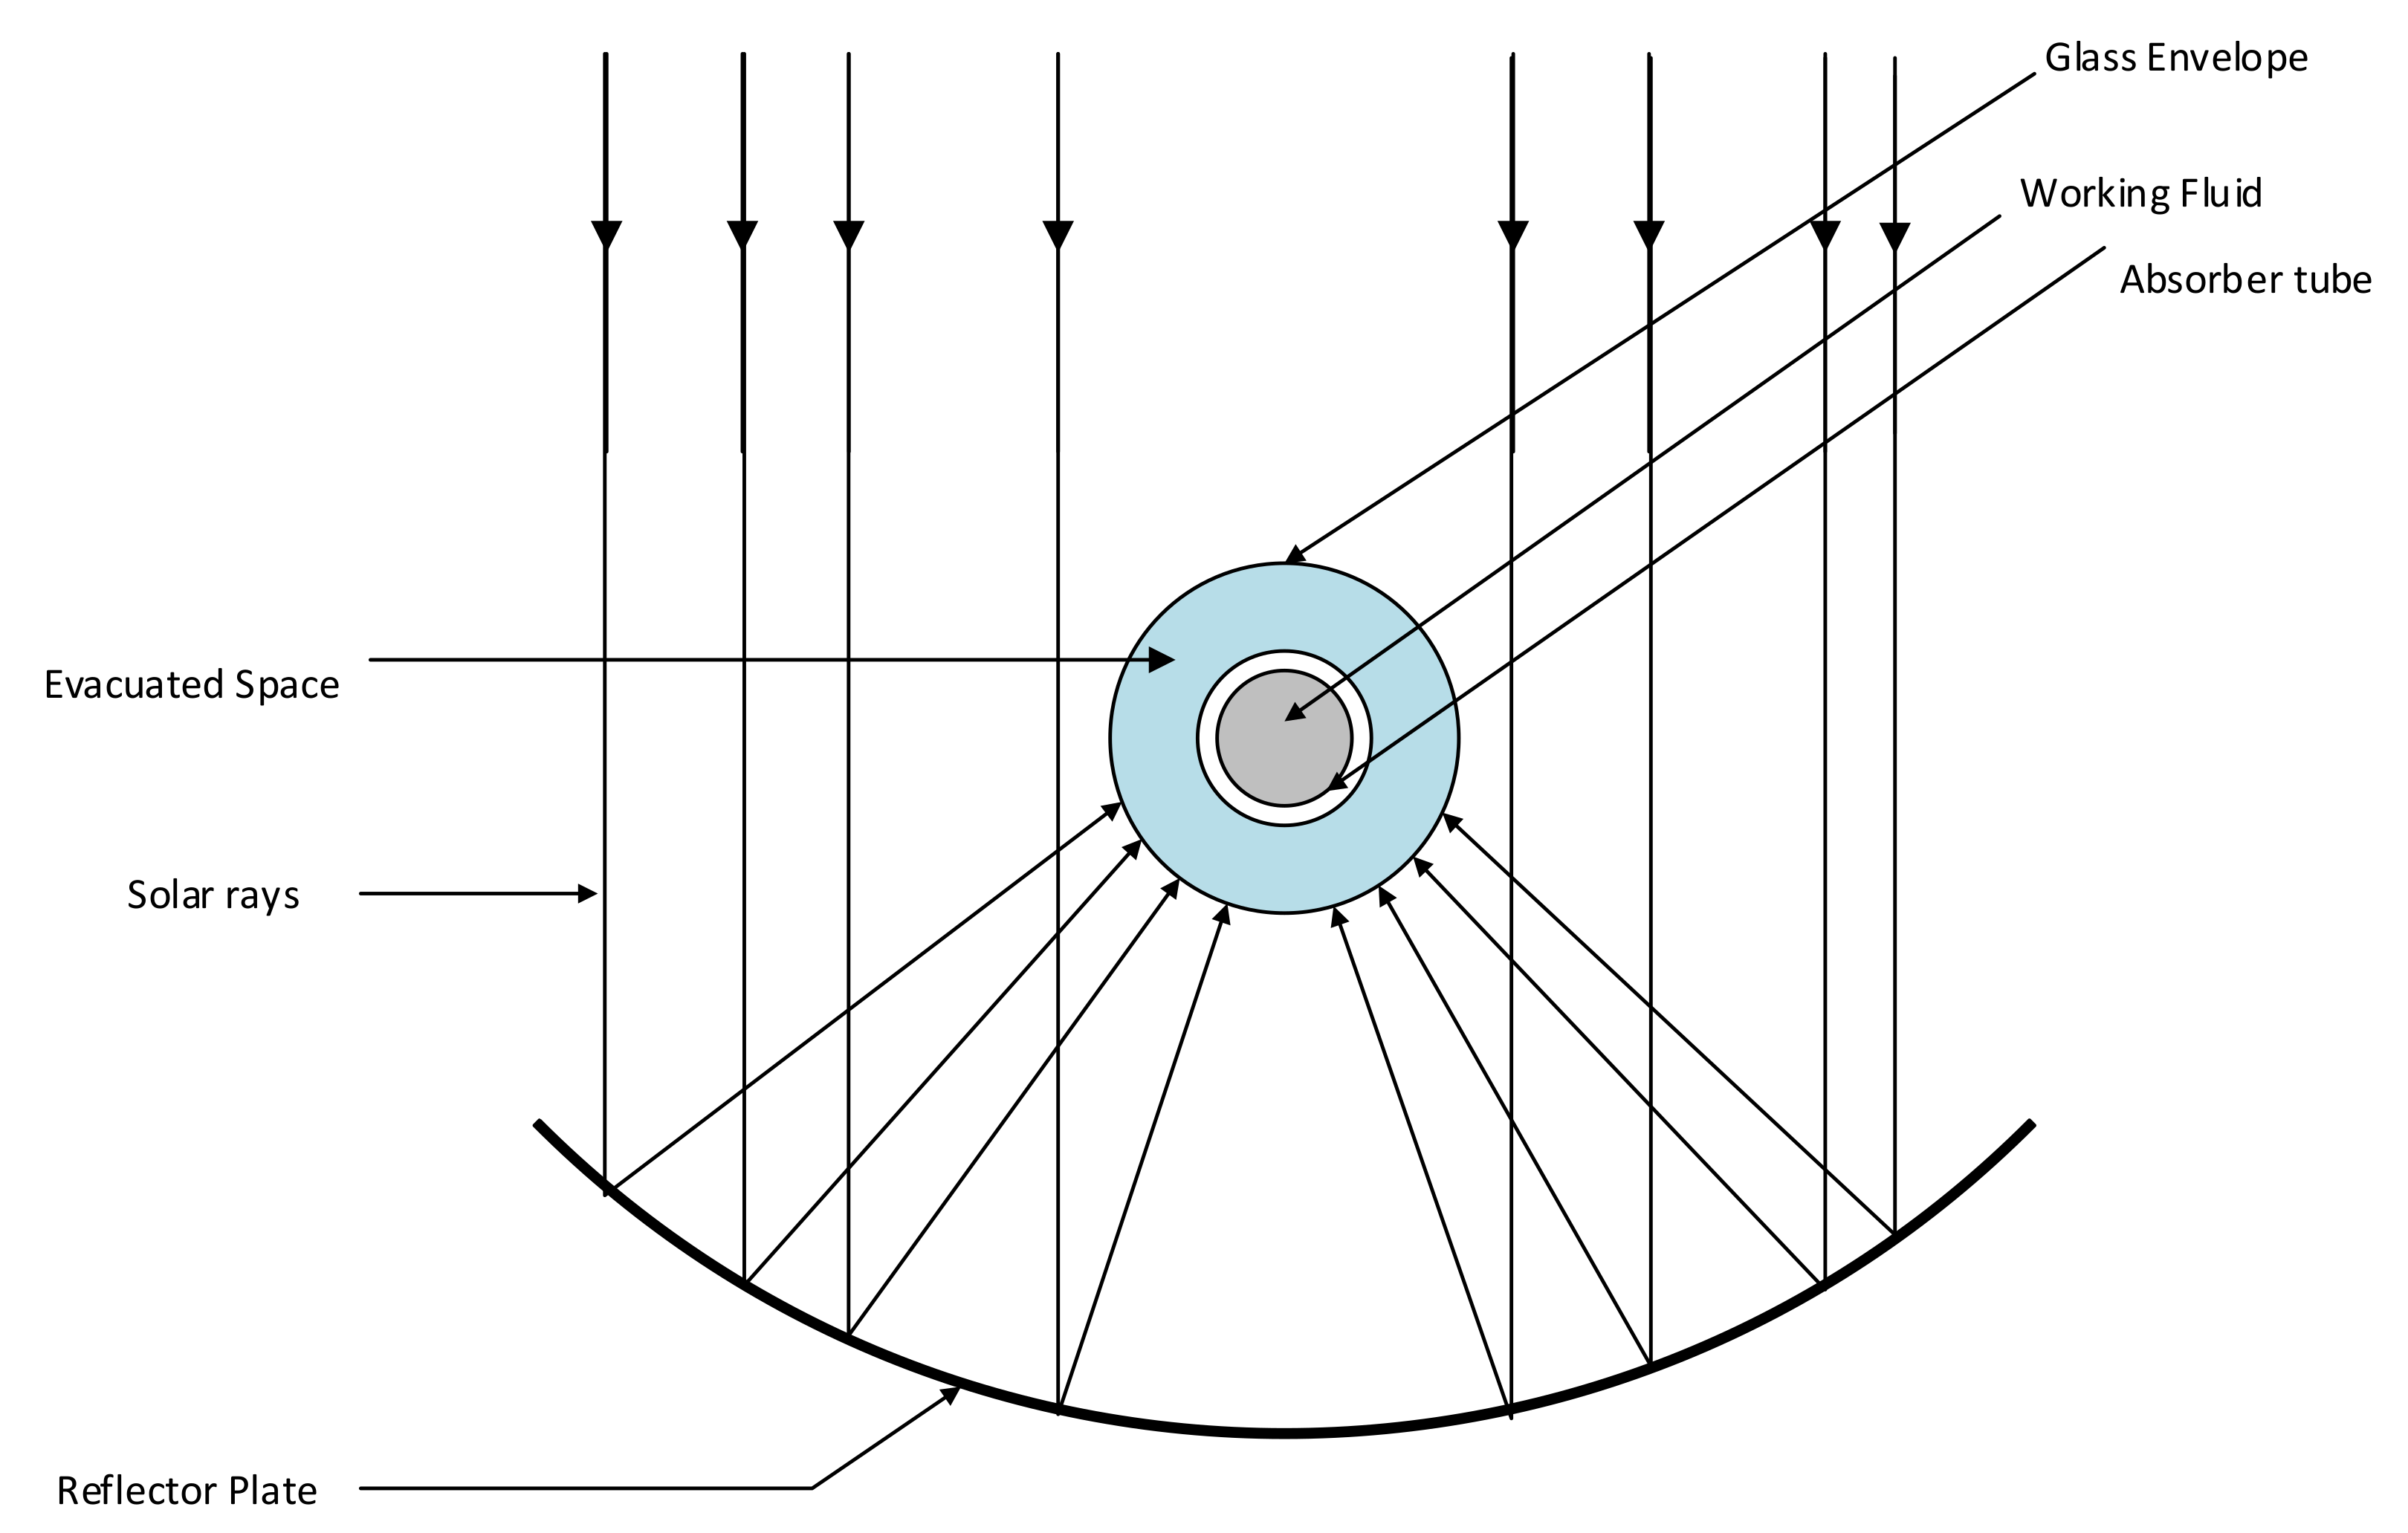
Figure 3.
Average Direct normal irradiance per month (DNI) for Abu Dhabi.
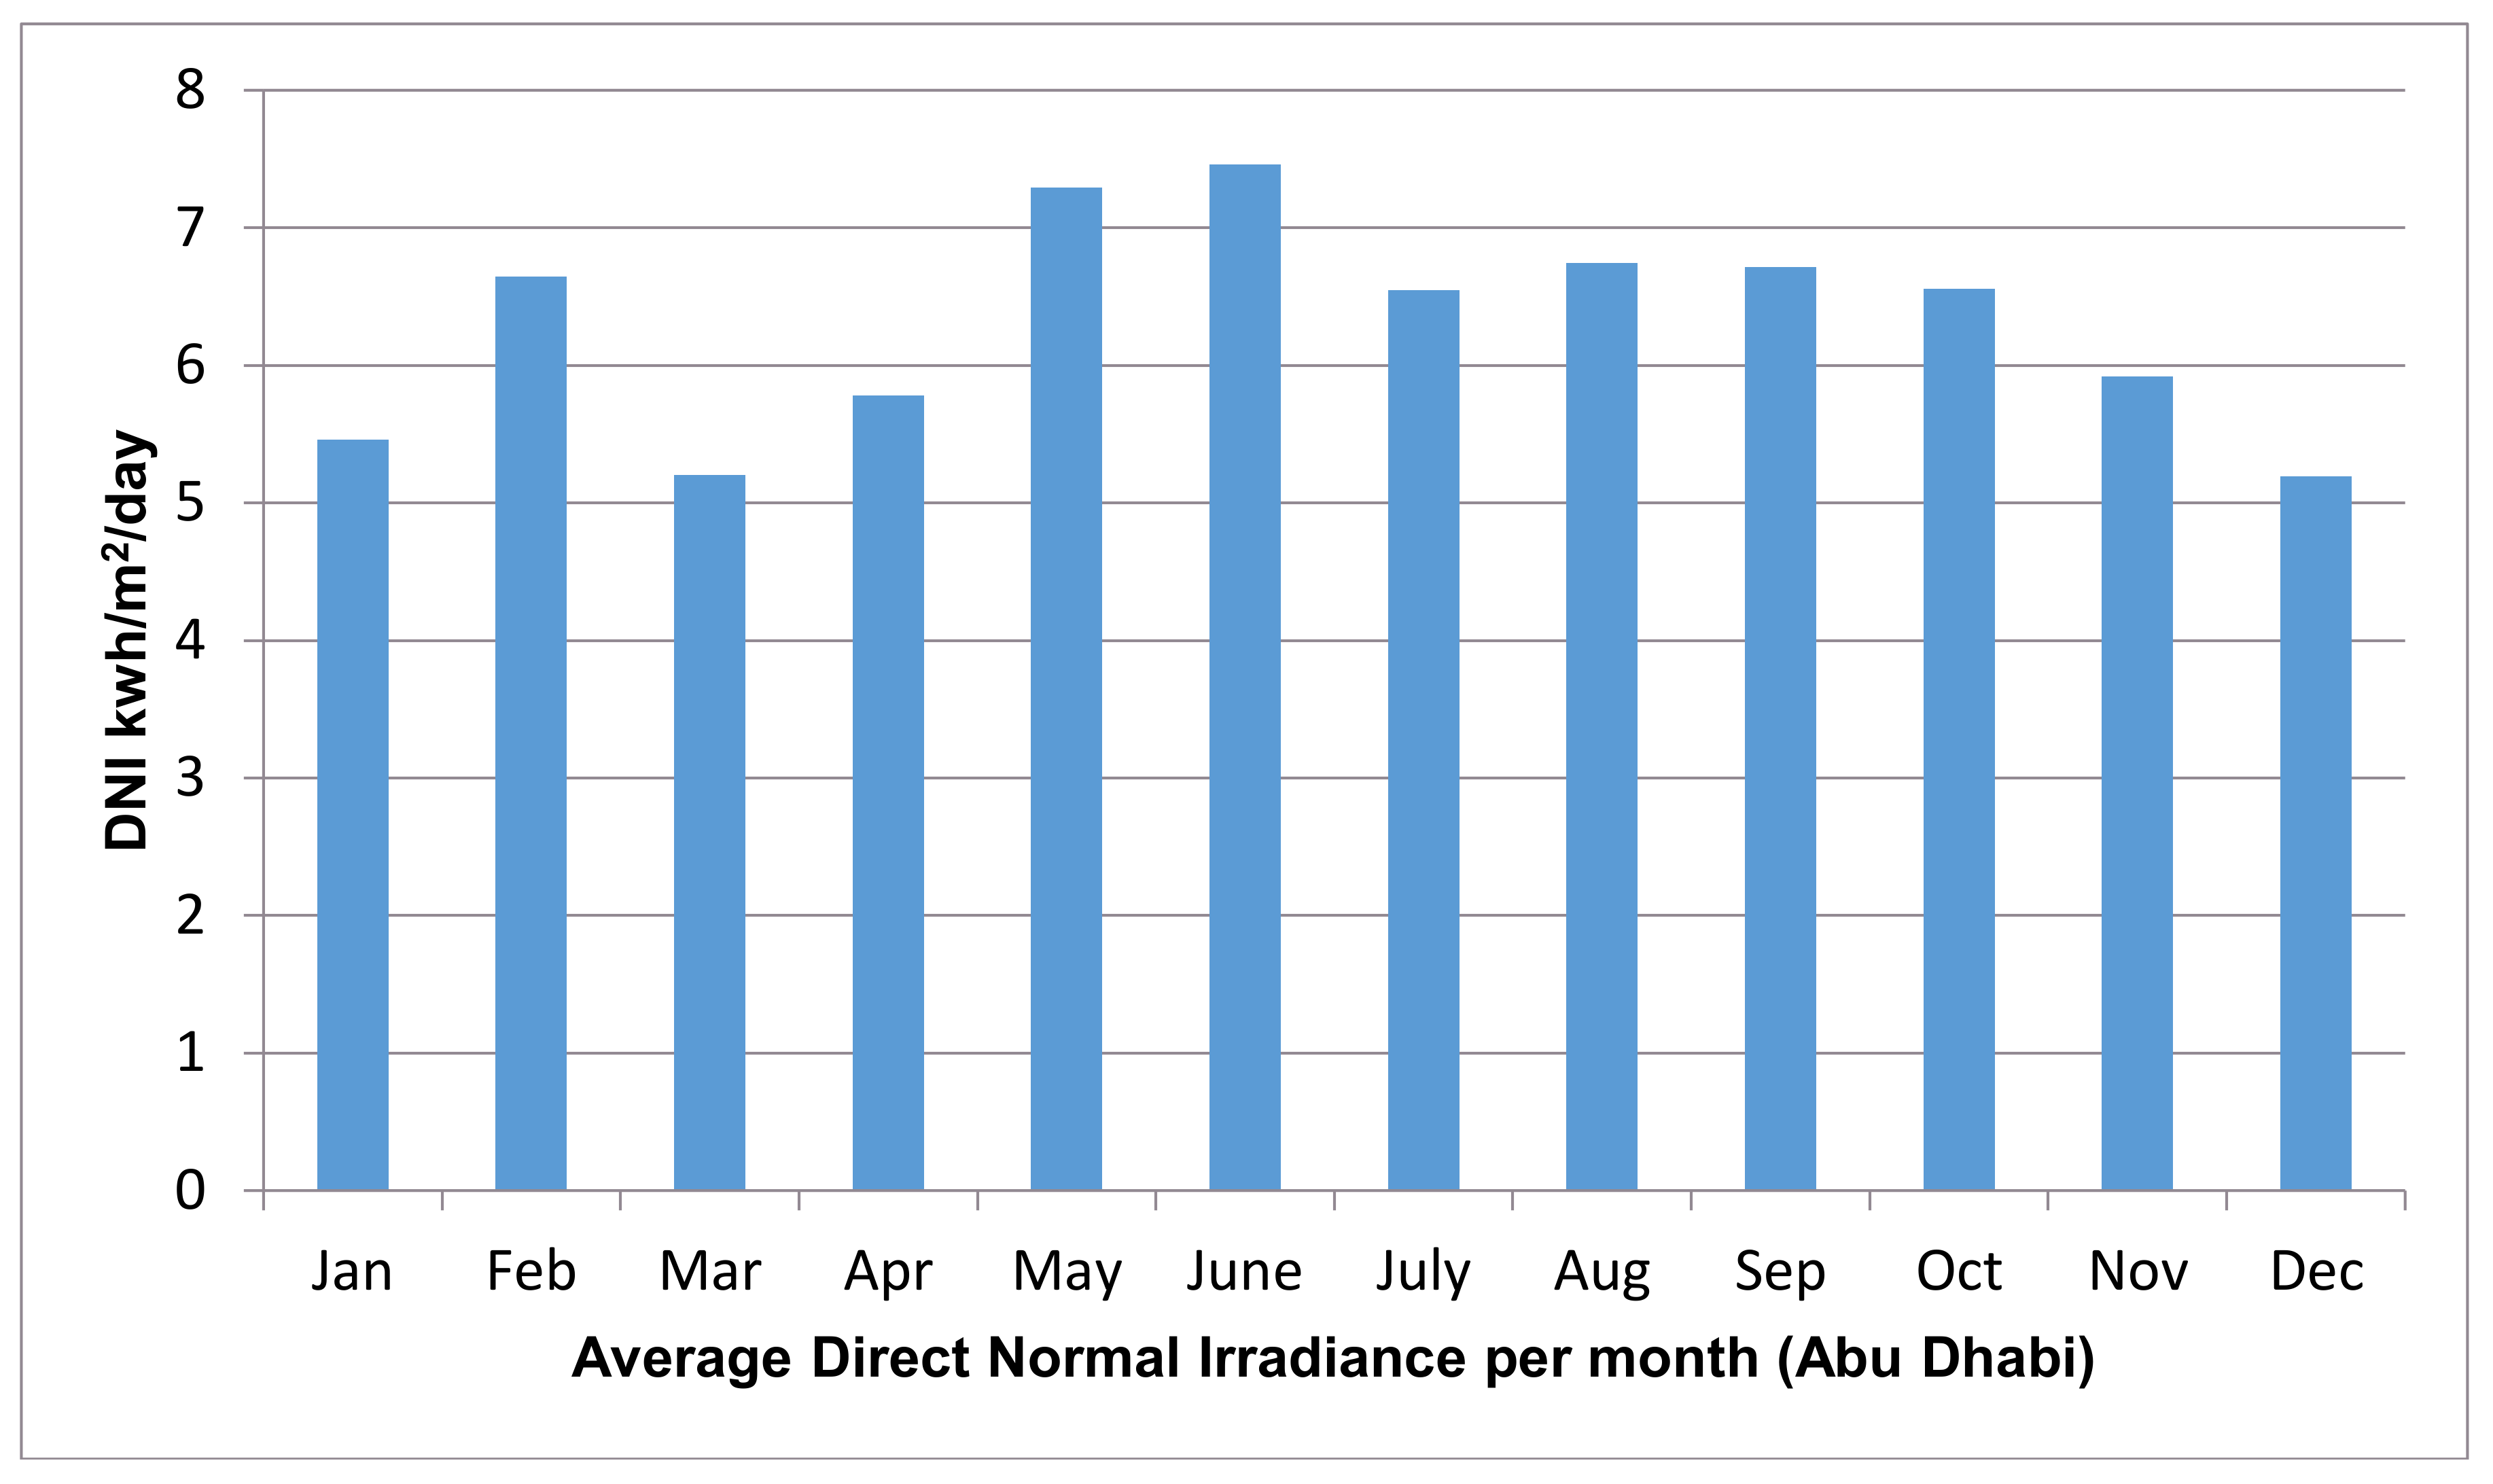
Figure 4.
Average Direct normal irradiance of Aswan (Egypt).

Figure 5.
Concentrating solar power (CSP) plant model with thermal energy storage (TES) system.
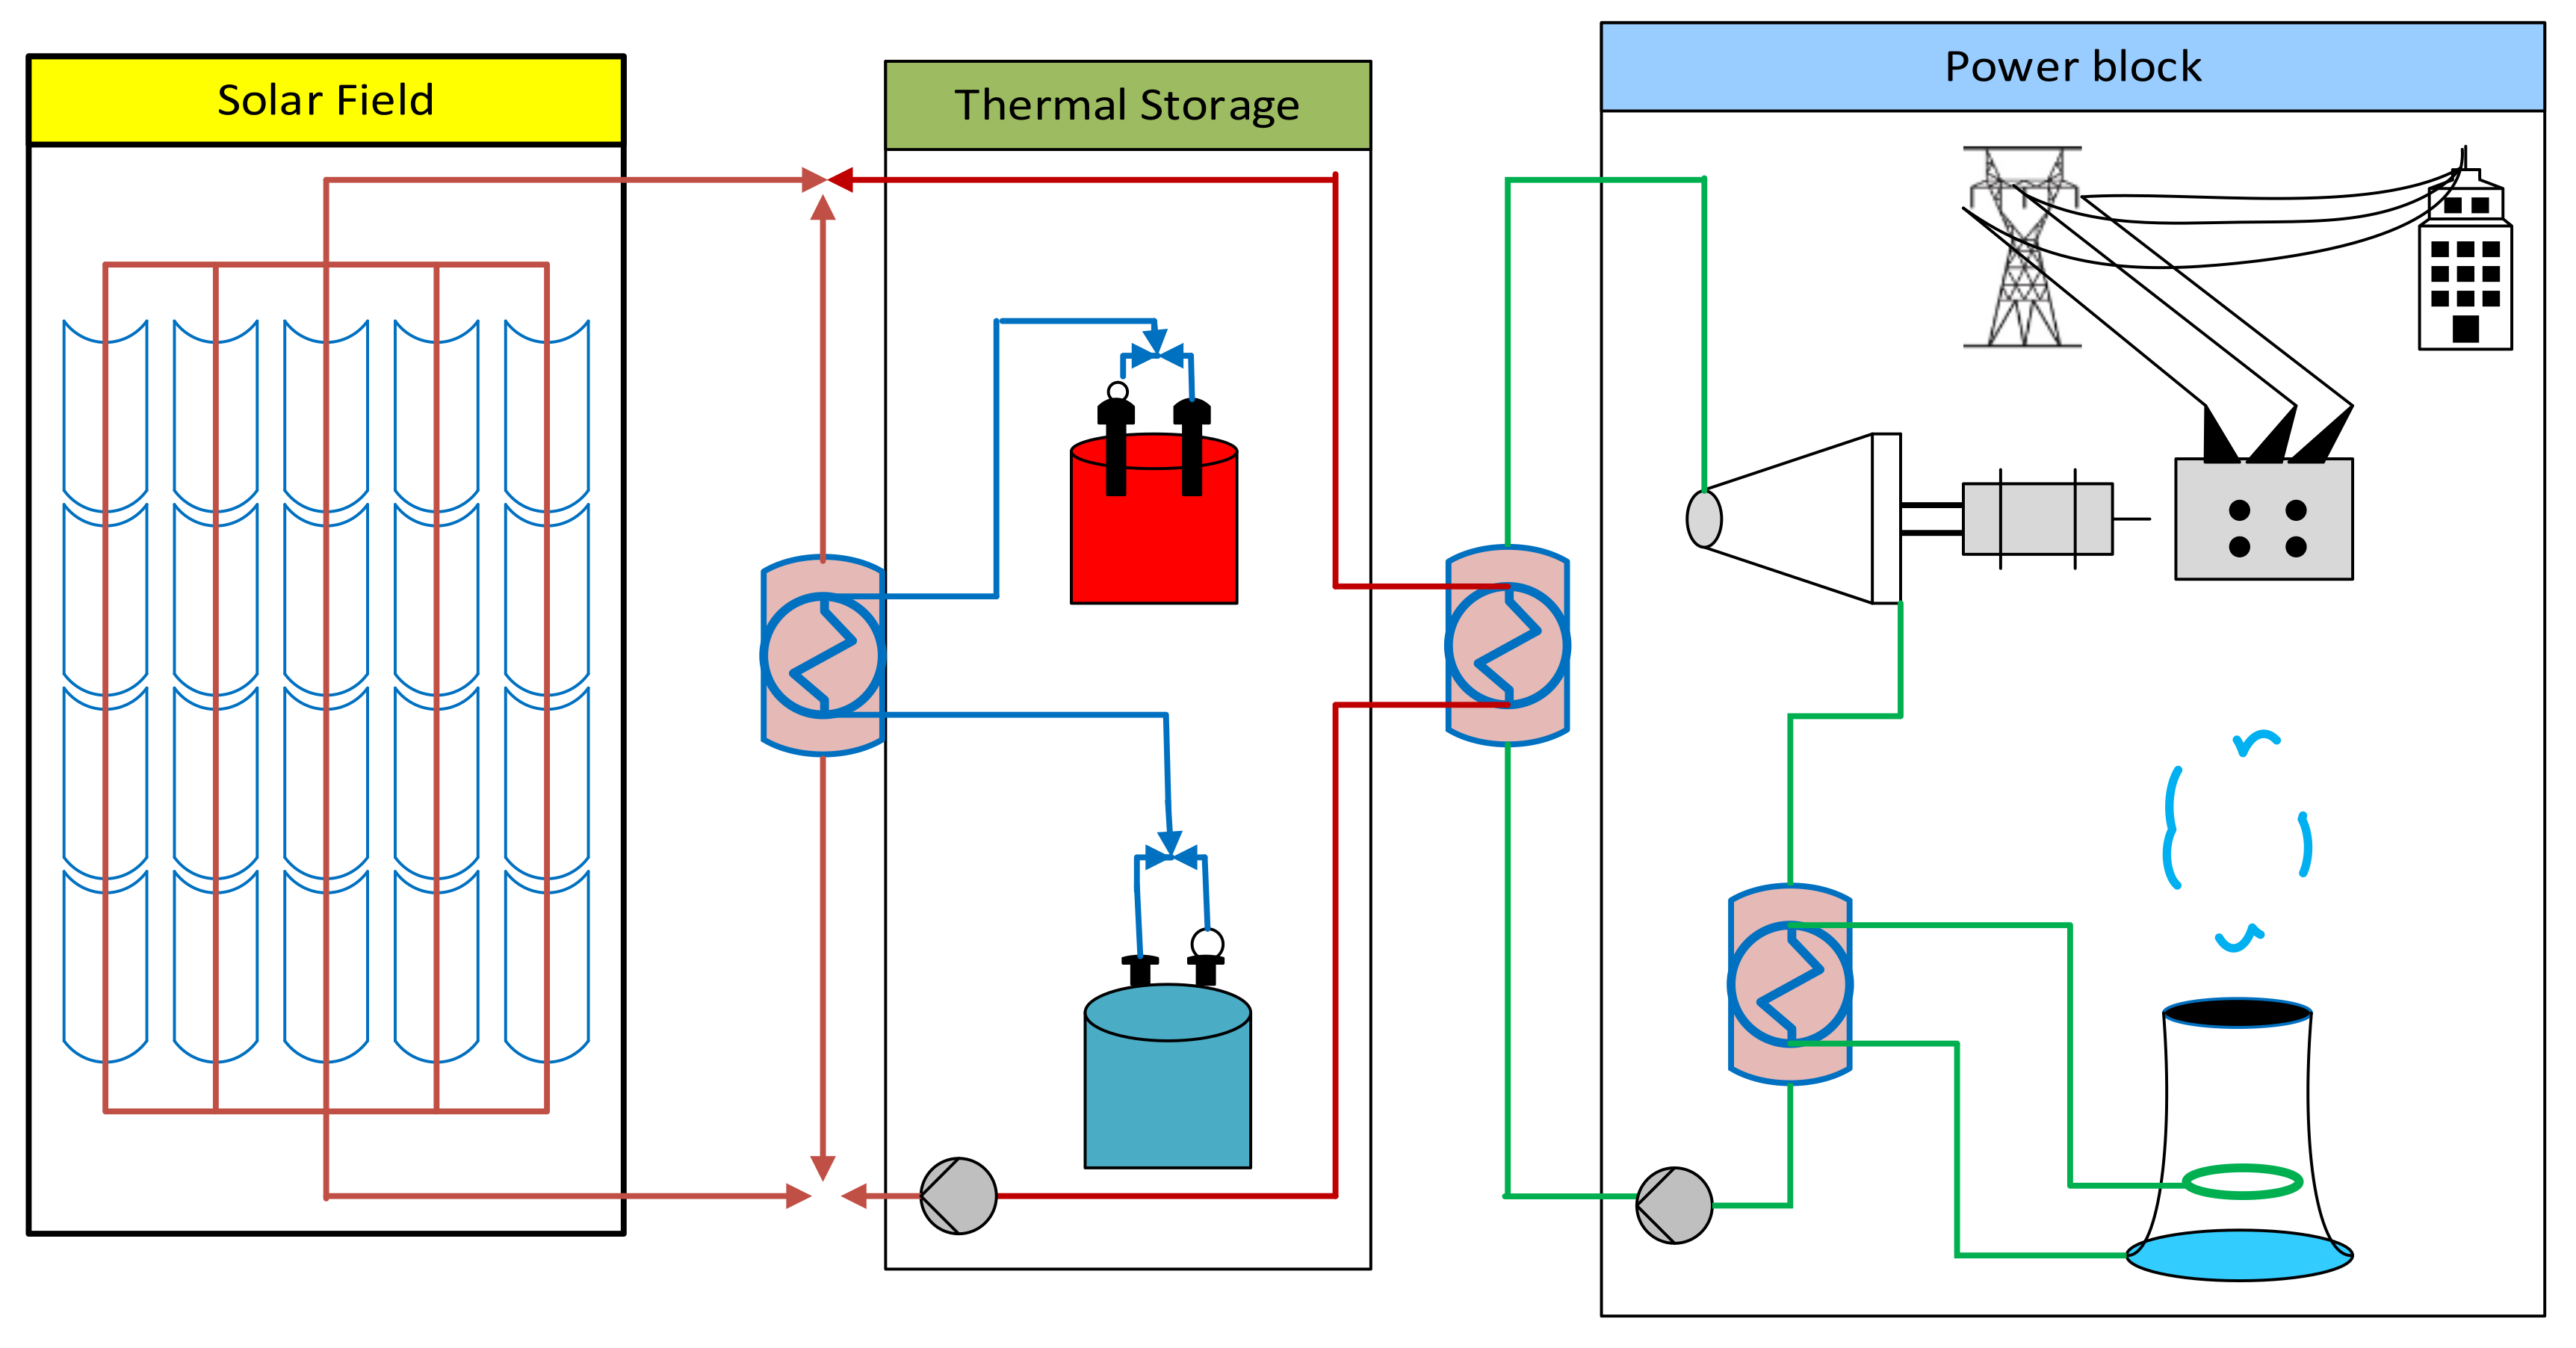
Figure 6.
Monthly energy generation for the proposed CSP plant in Abu Dhabi.
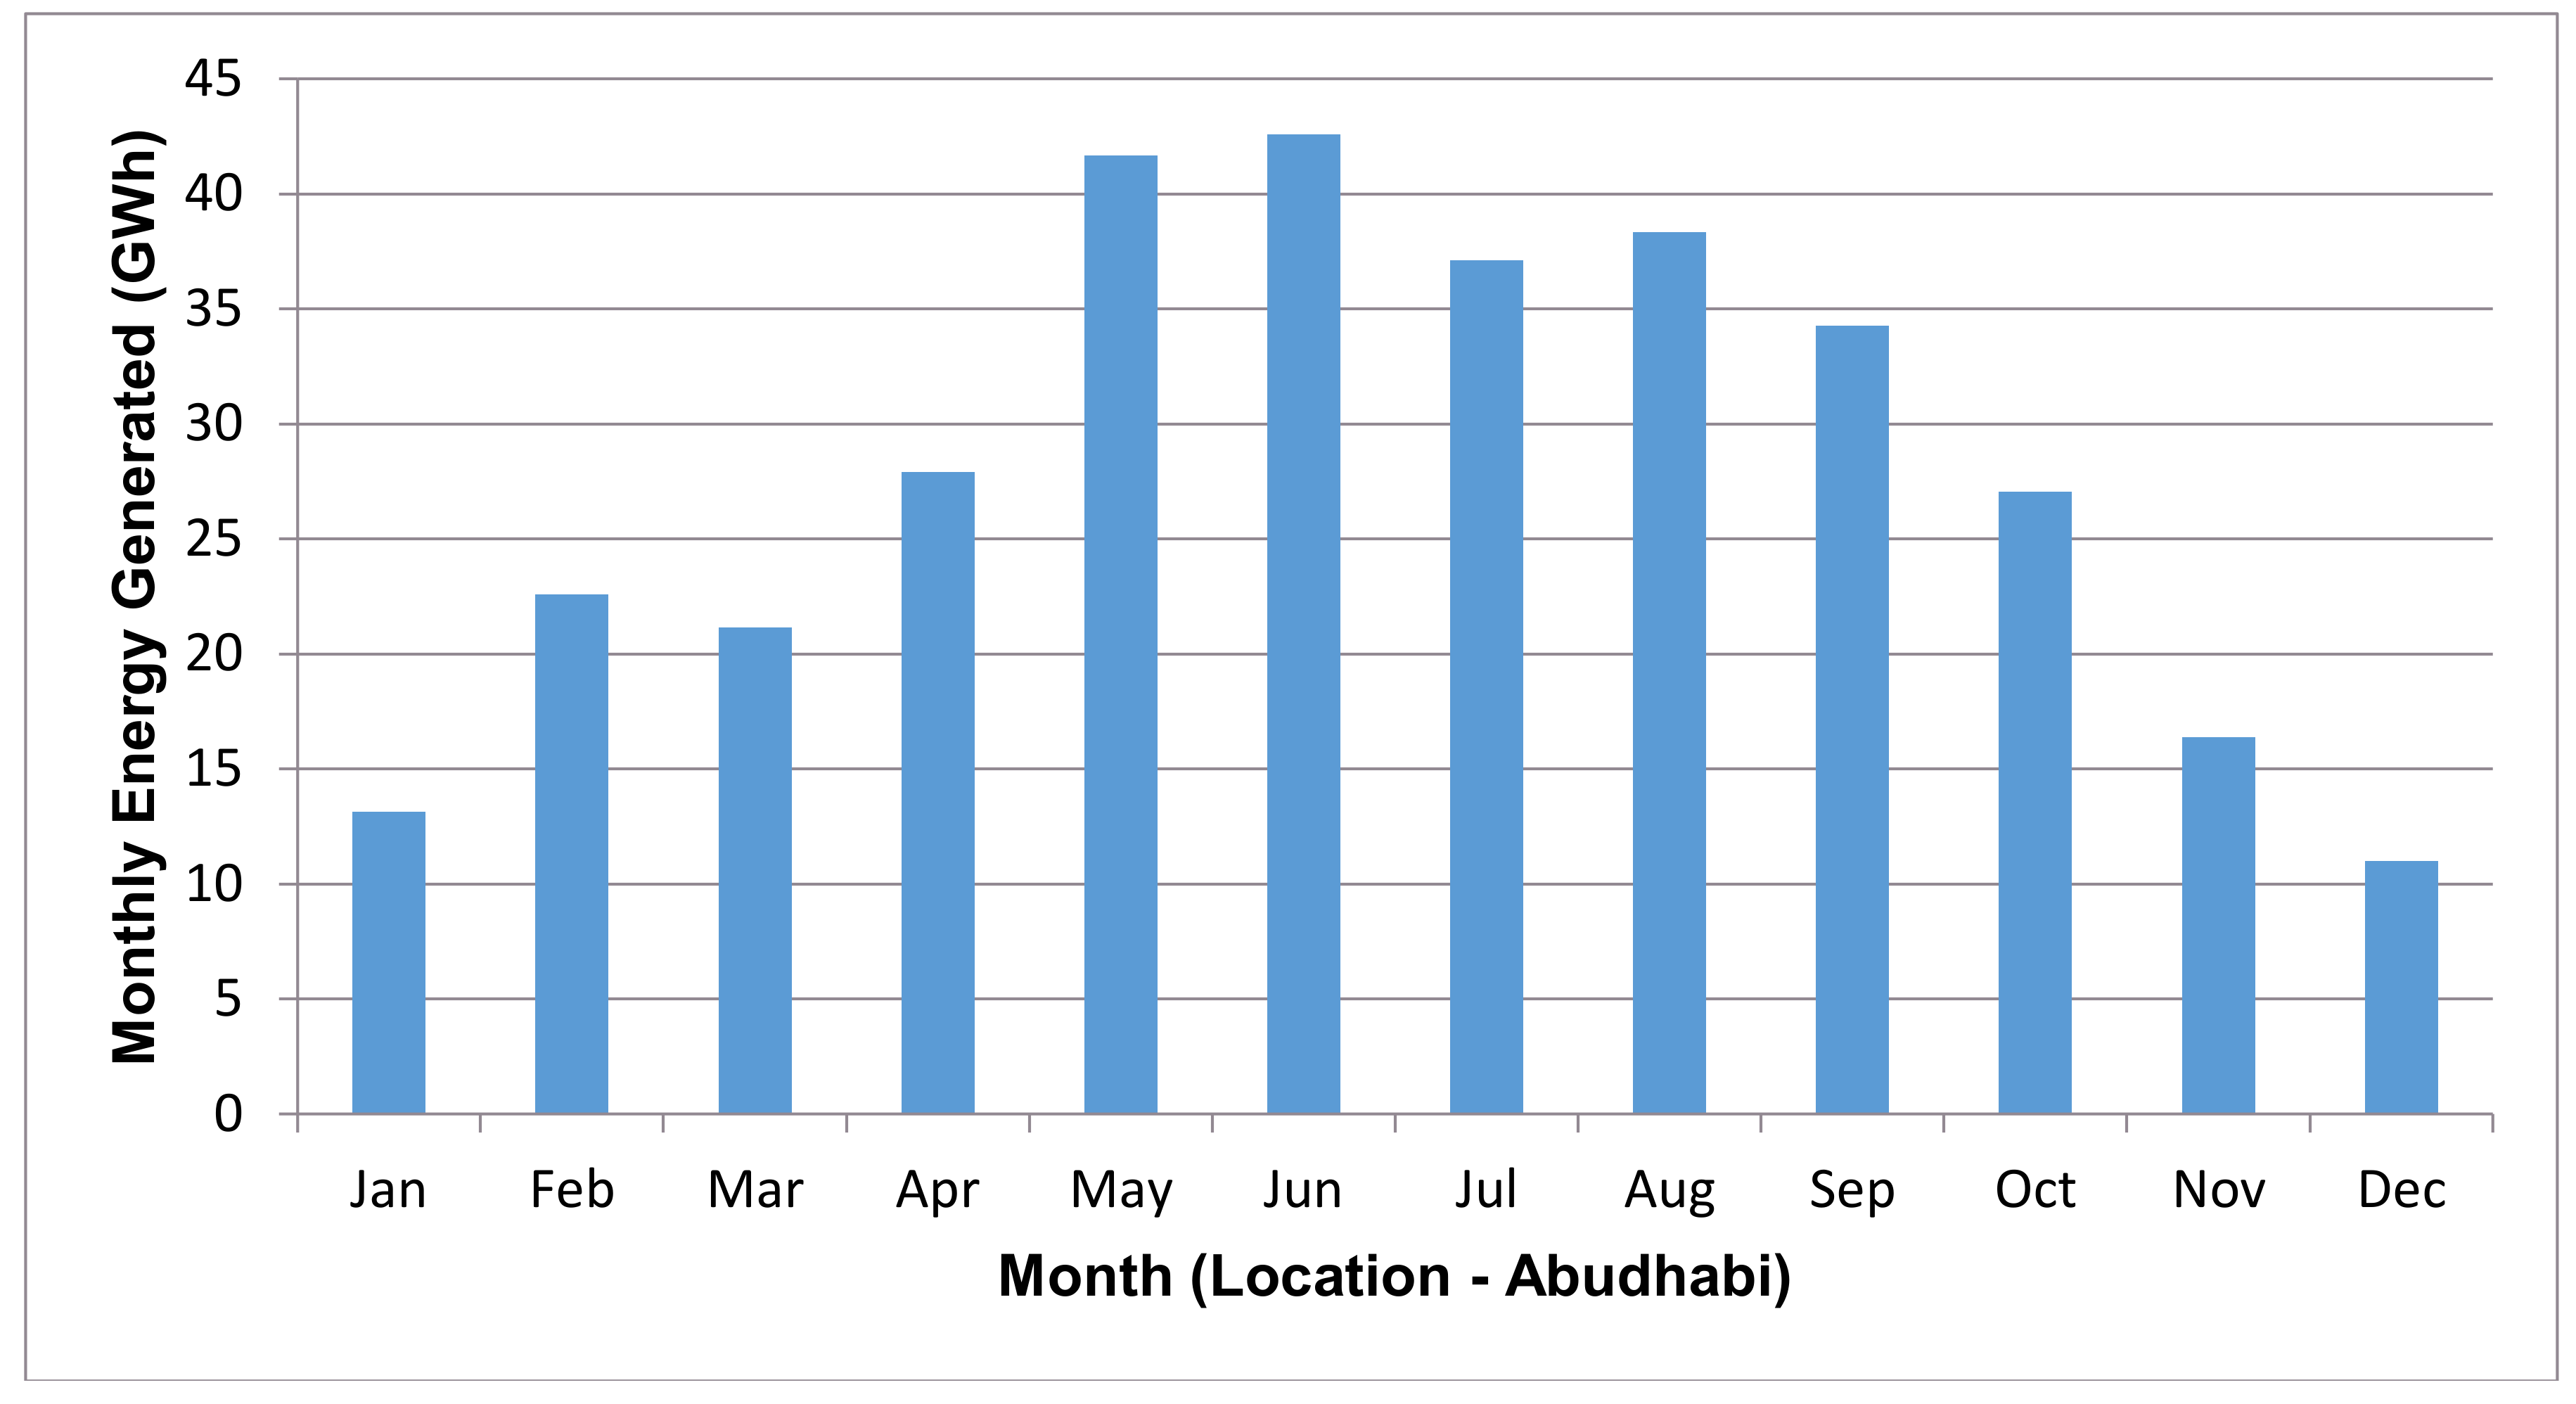
Figure 7.
Monthly energy generation for the proposed CSP plant in Aswan.

Figure 8.
Hourly data of cycle thermal power input, gross electrical output and field thermal power for the proposed plant in Abu Dhabi.
Figure 8.
Hourly data of cycle thermal power input, gross electrical output and field thermal power for the proposed plant in Abu Dhabi.

Figure 9.
Cycle Efficiency of the proposed plant in Abu Dhabi.
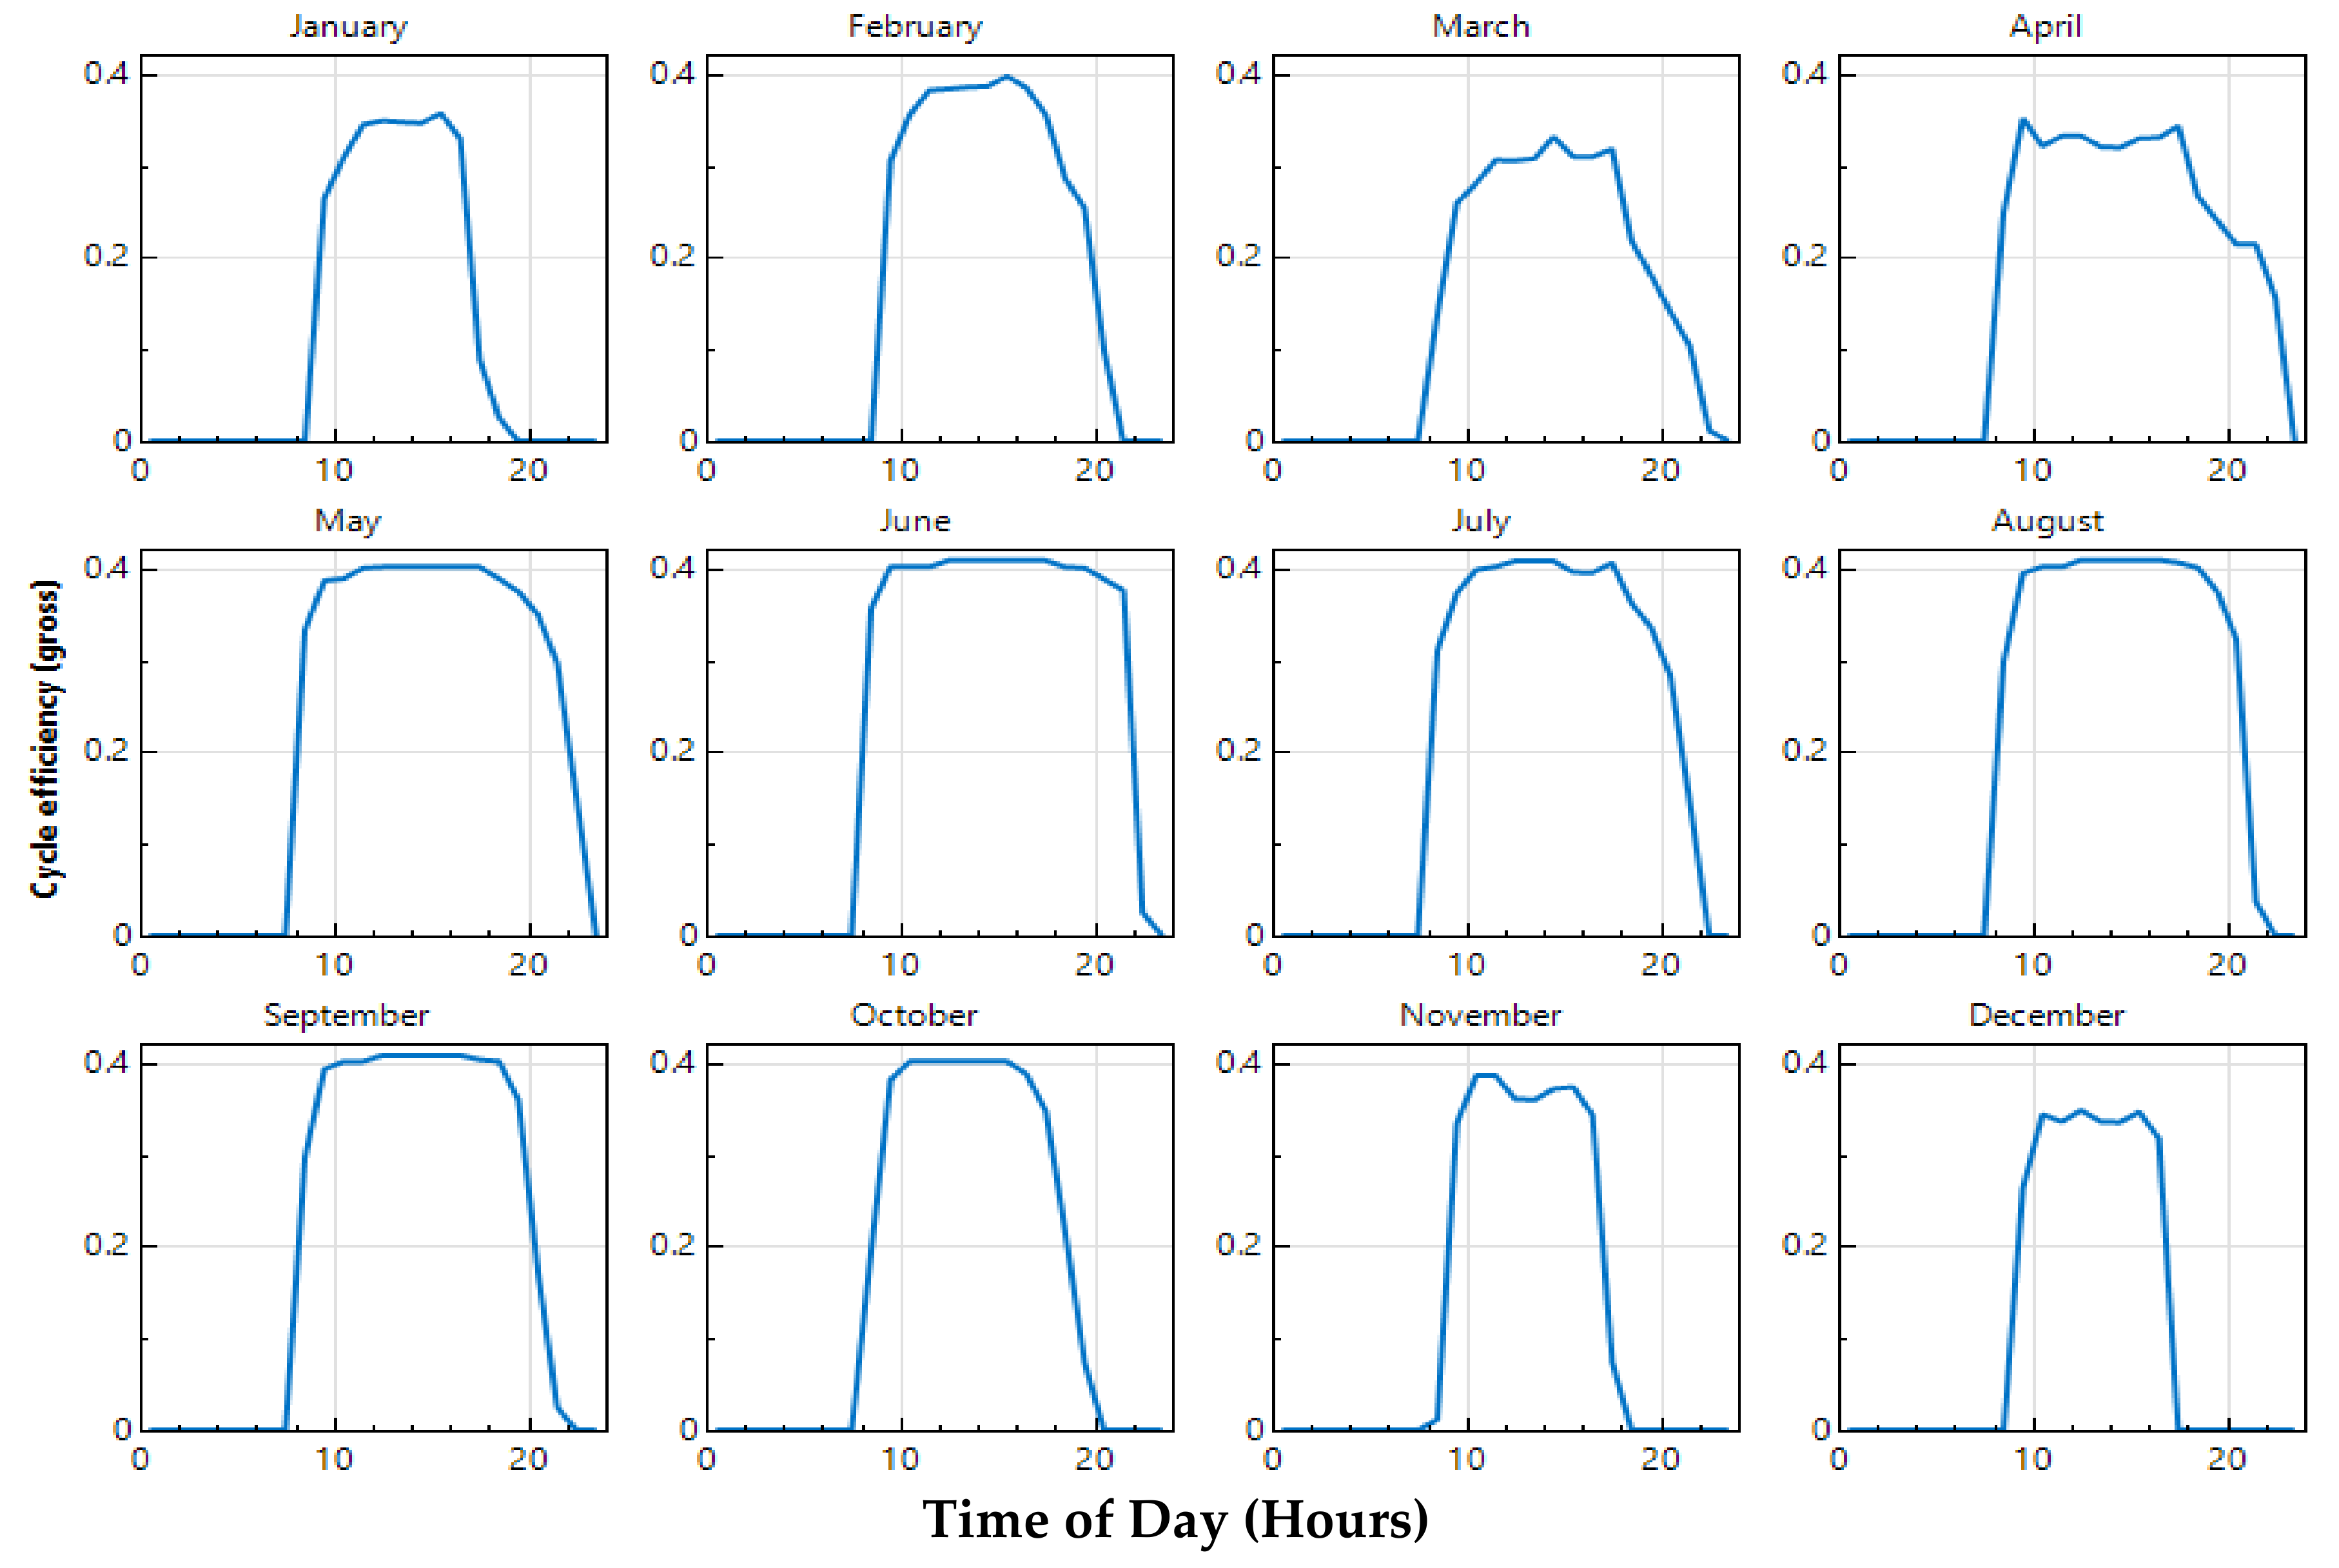
Figure 10.
Hourly data of cycle thermal power input, gross electrical output and field thermal power for the proposed plant in Aswan.
Figure 10.
Hourly data of cycle thermal power input, gross electrical output and field thermal power for the proposed plant in Aswan.
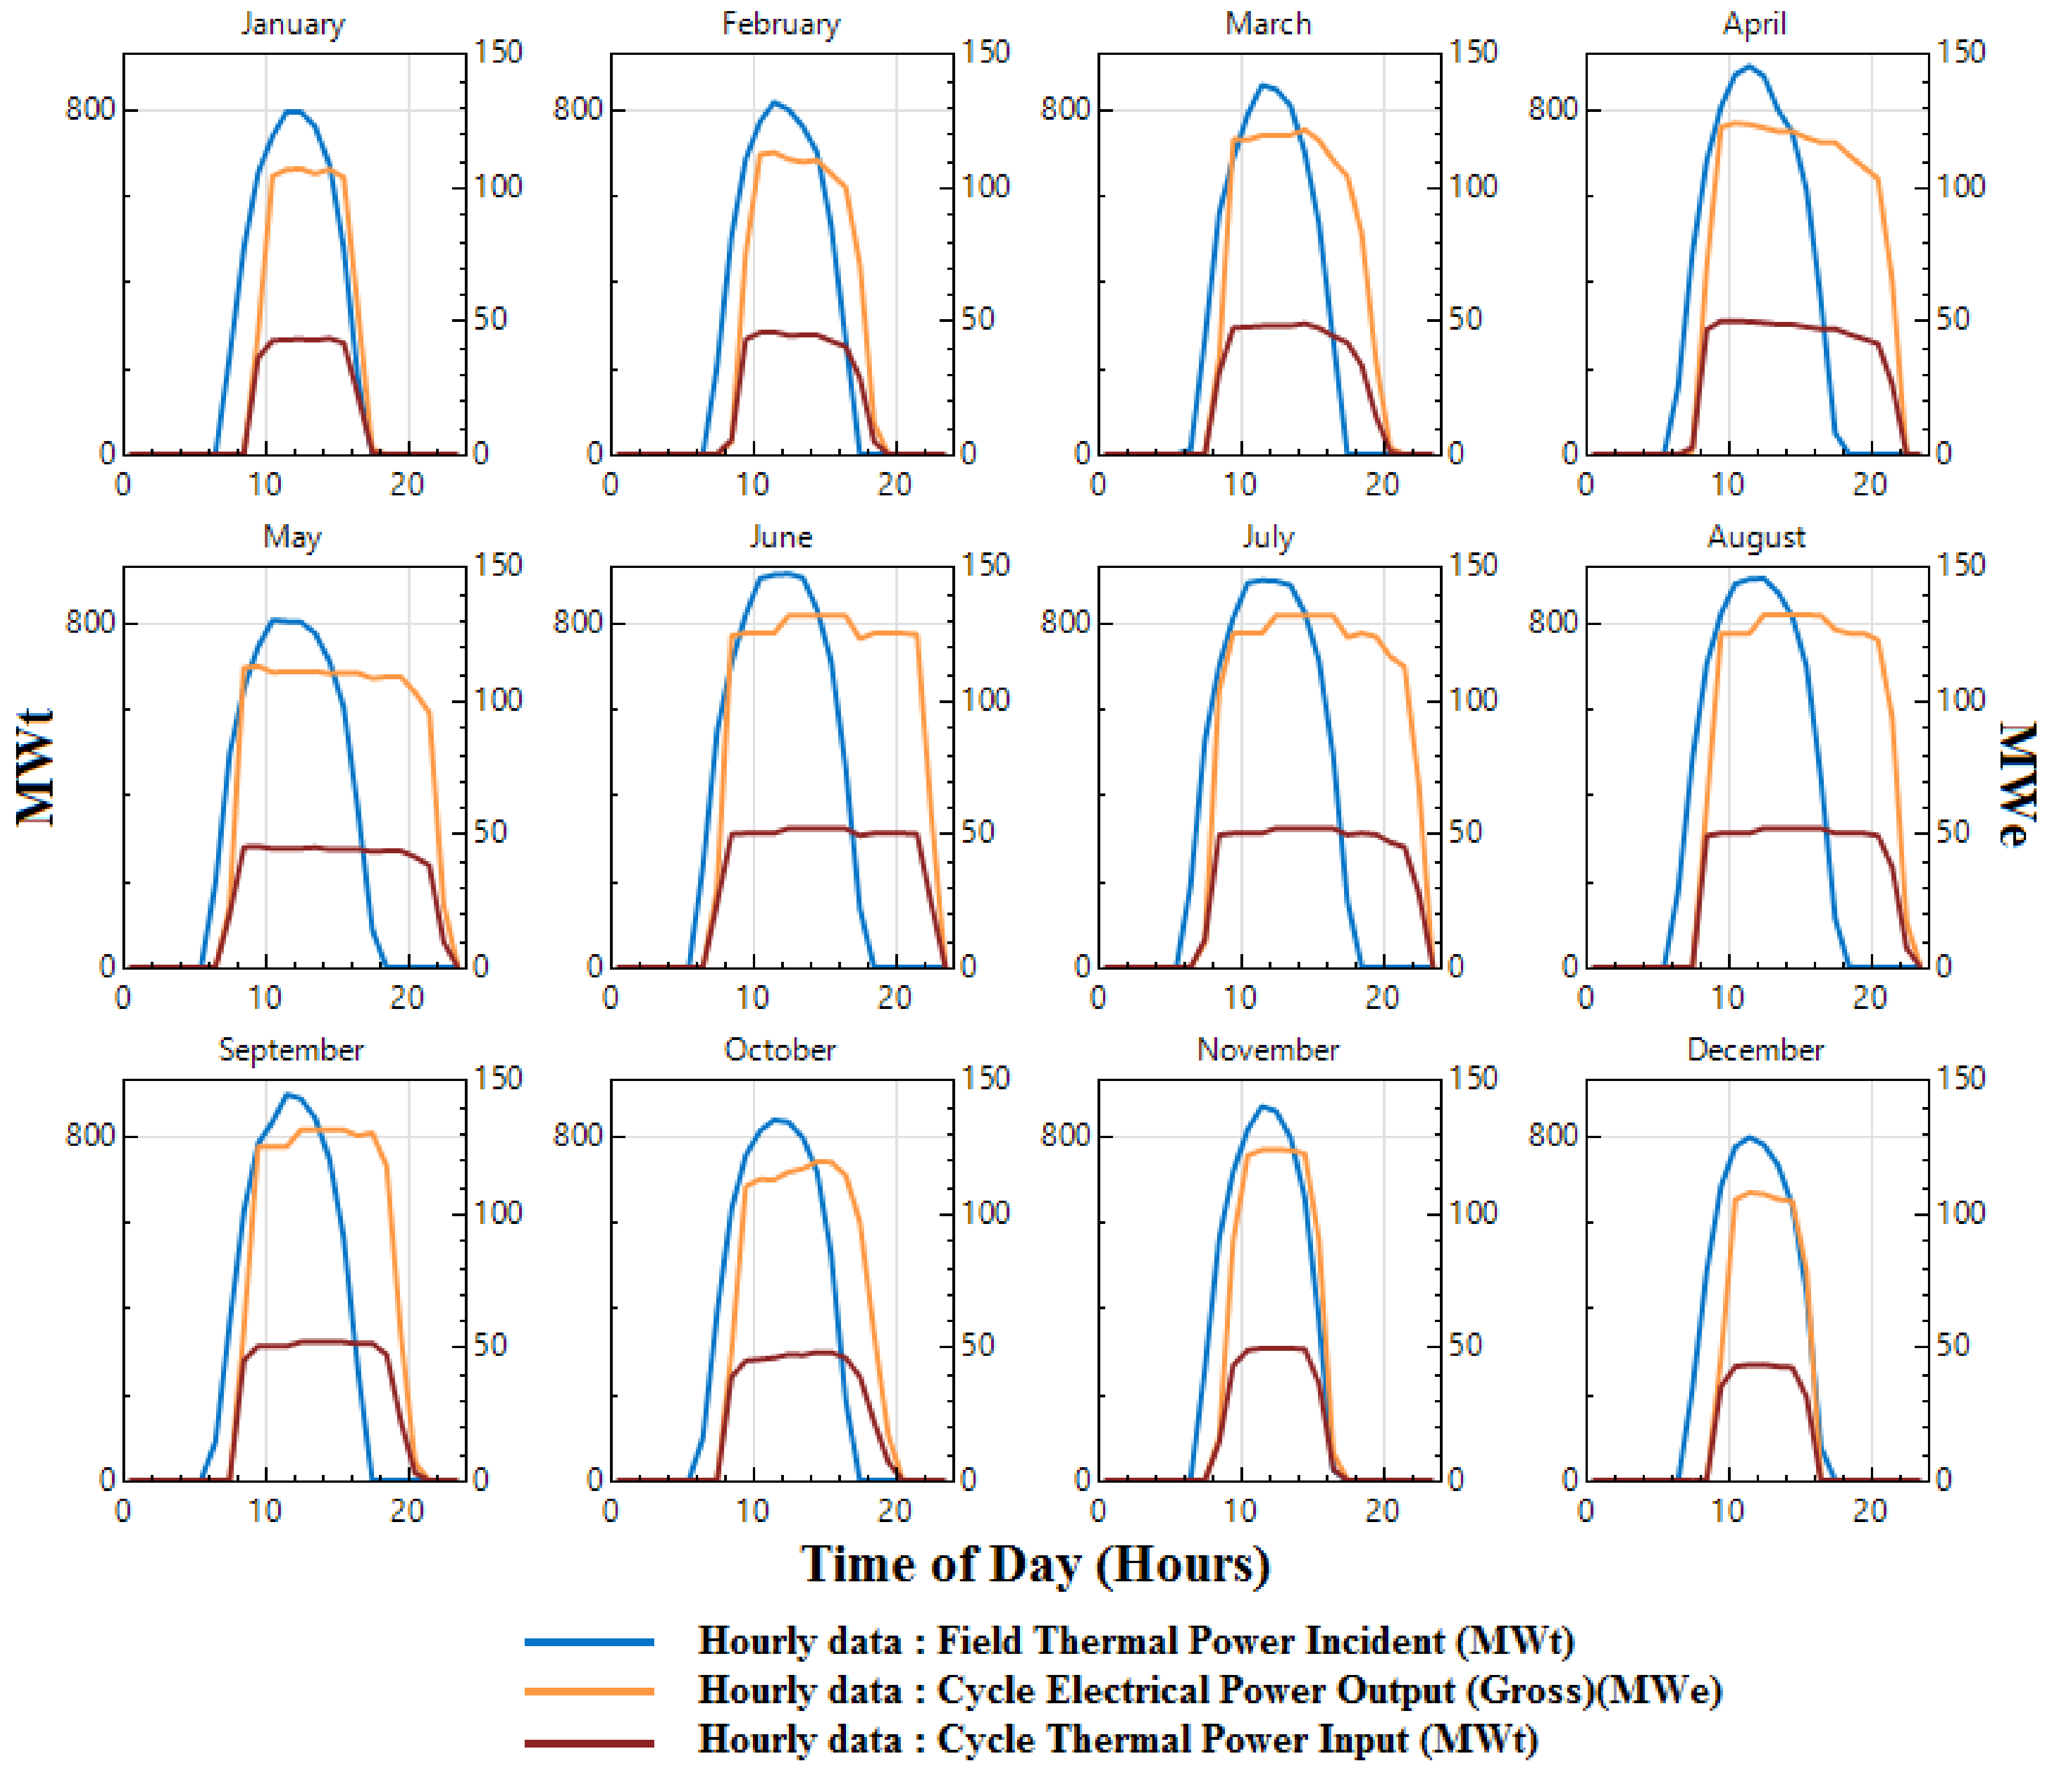
Figure 11.
Cycle Efficiency of the proposed plant in Aswan.

Figure 12.
Variation of annual energy generation and levelized cost of electricity (LCOE) with solar multiple for Abu Dhabi.
Figure 12.
Variation of annual energy generation and levelized cost of electricity (LCOE) with solar multiple for Abu Dhabi.
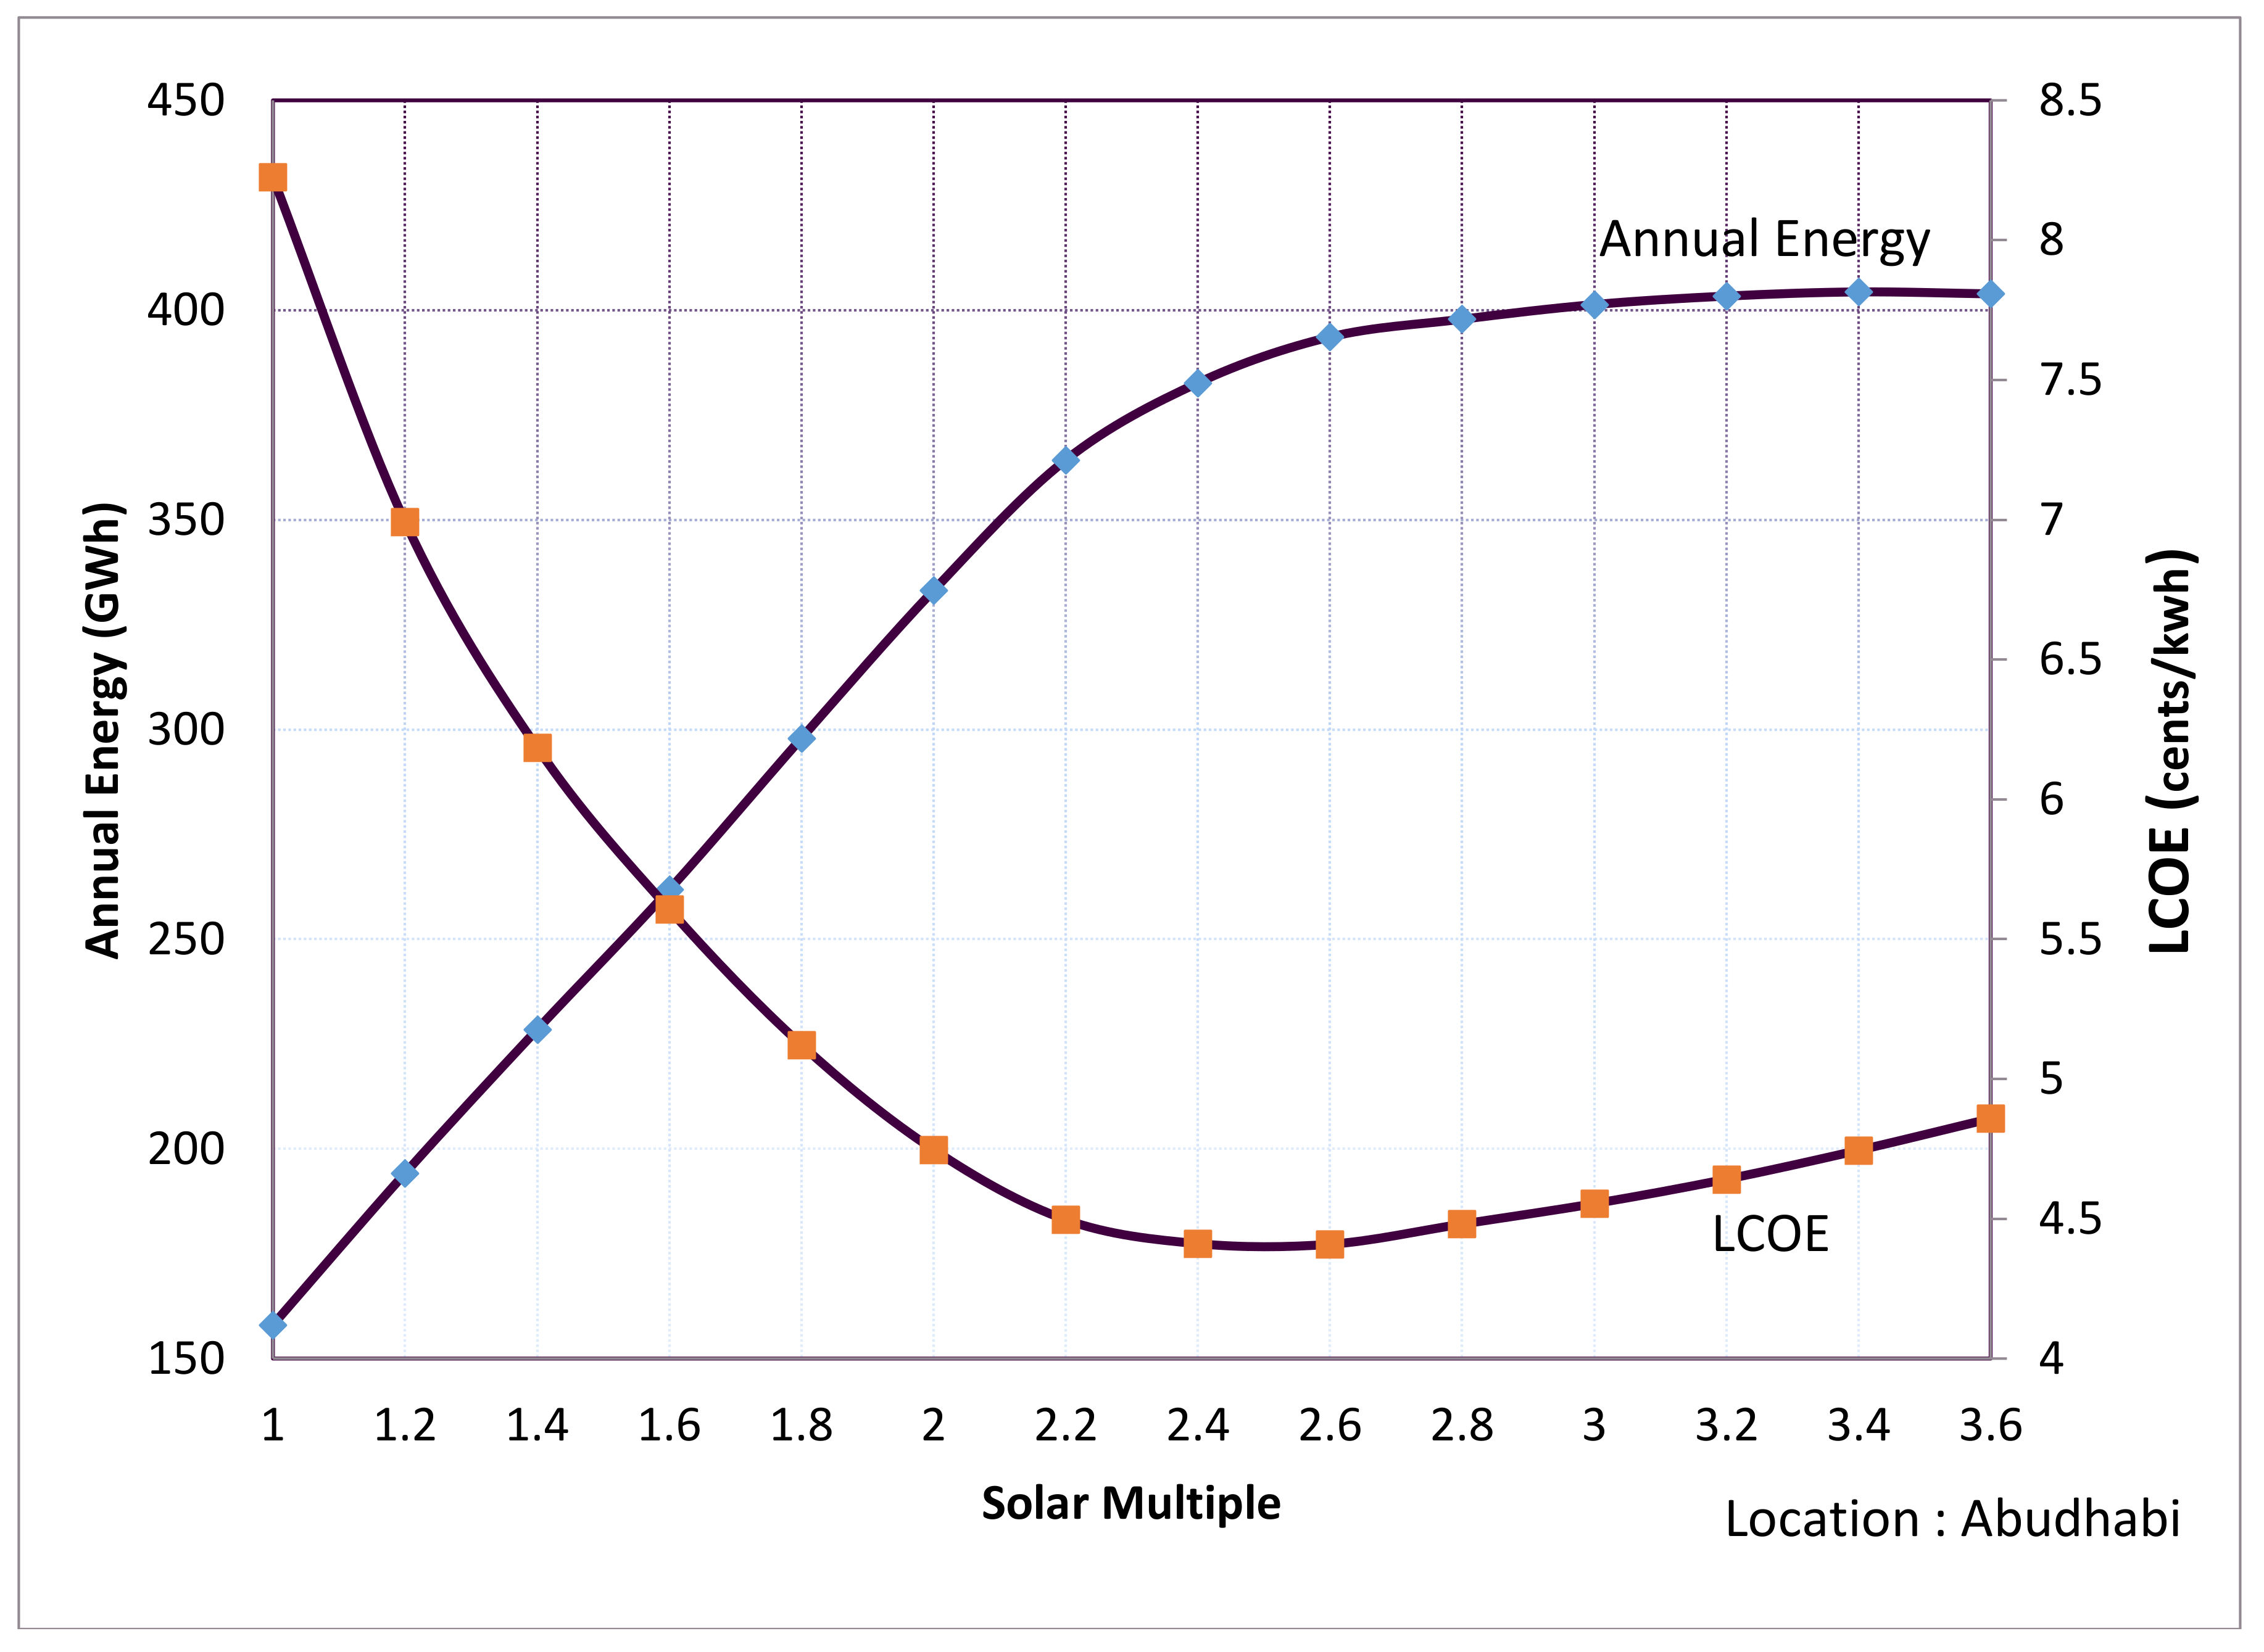
Figure 13.
Variation of annual energy generation and LCOE with solar multiple for Aswan.
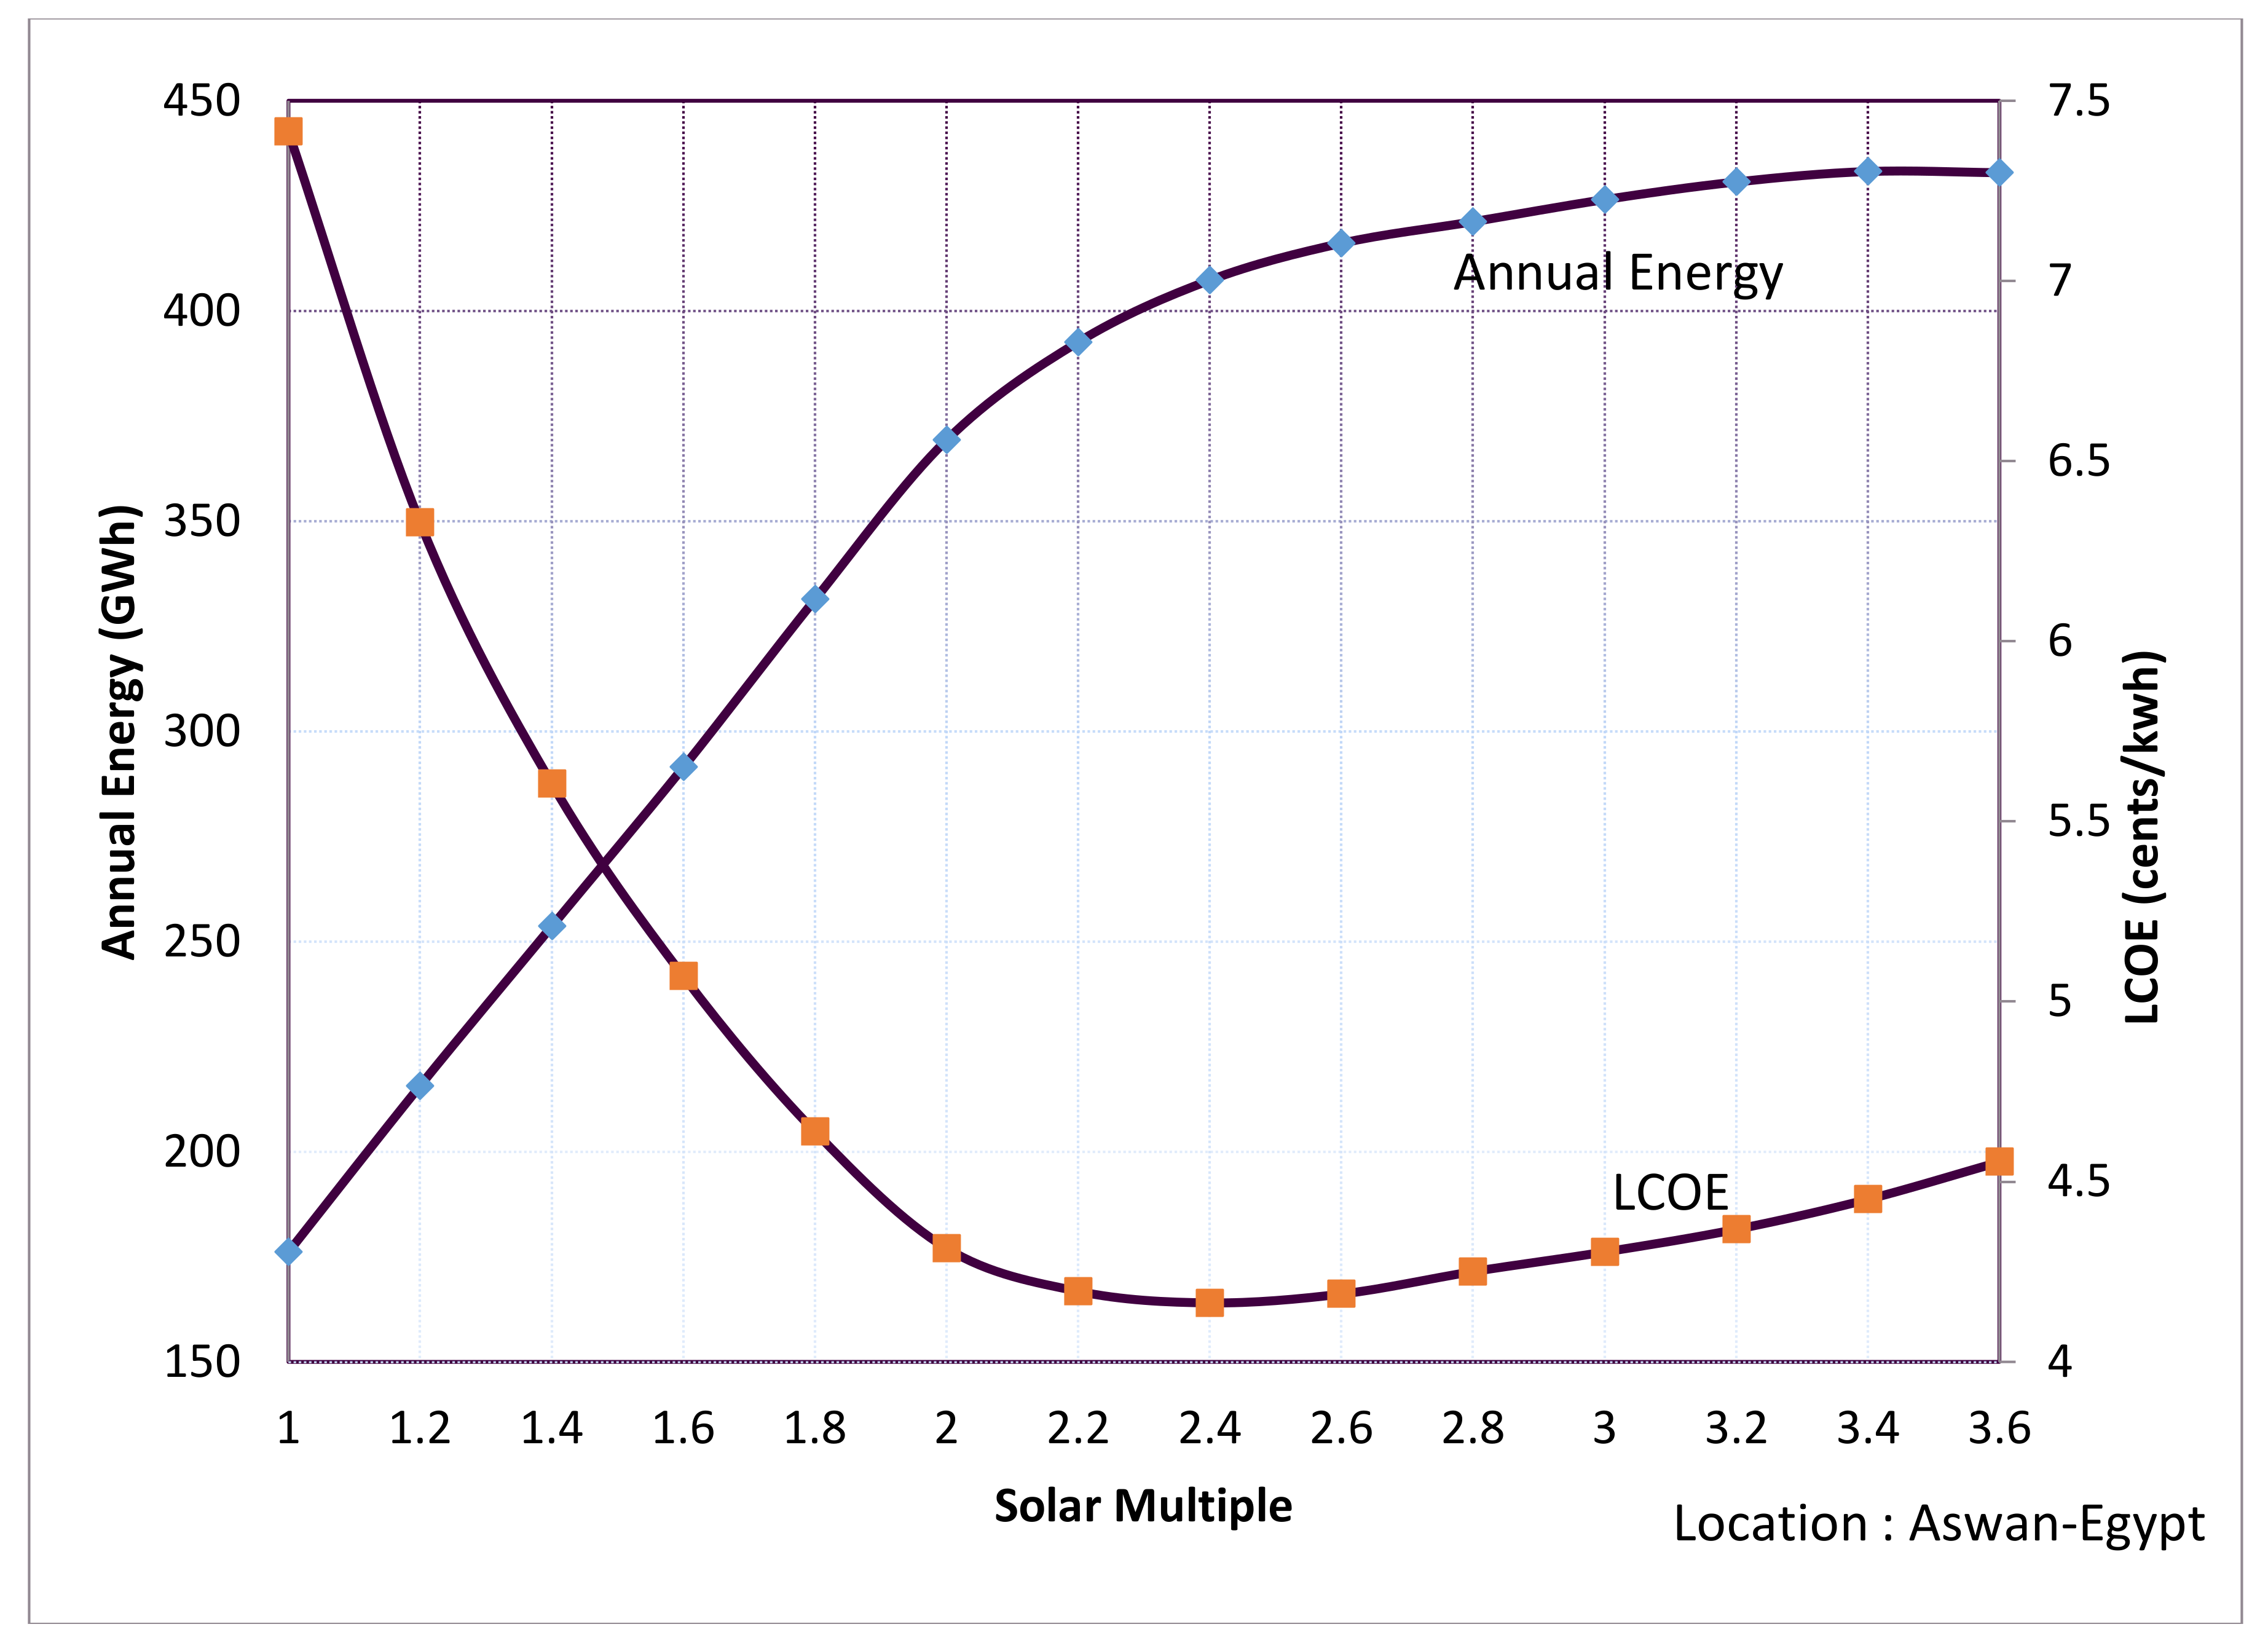
Figure 14.
Variation of annual energy generation and LCOE with full load hours of TES for Abu Dhabi.
Figure 14.
Variation of annual energy generation and LCOE with full load hours of TES for Abu Dhabi.
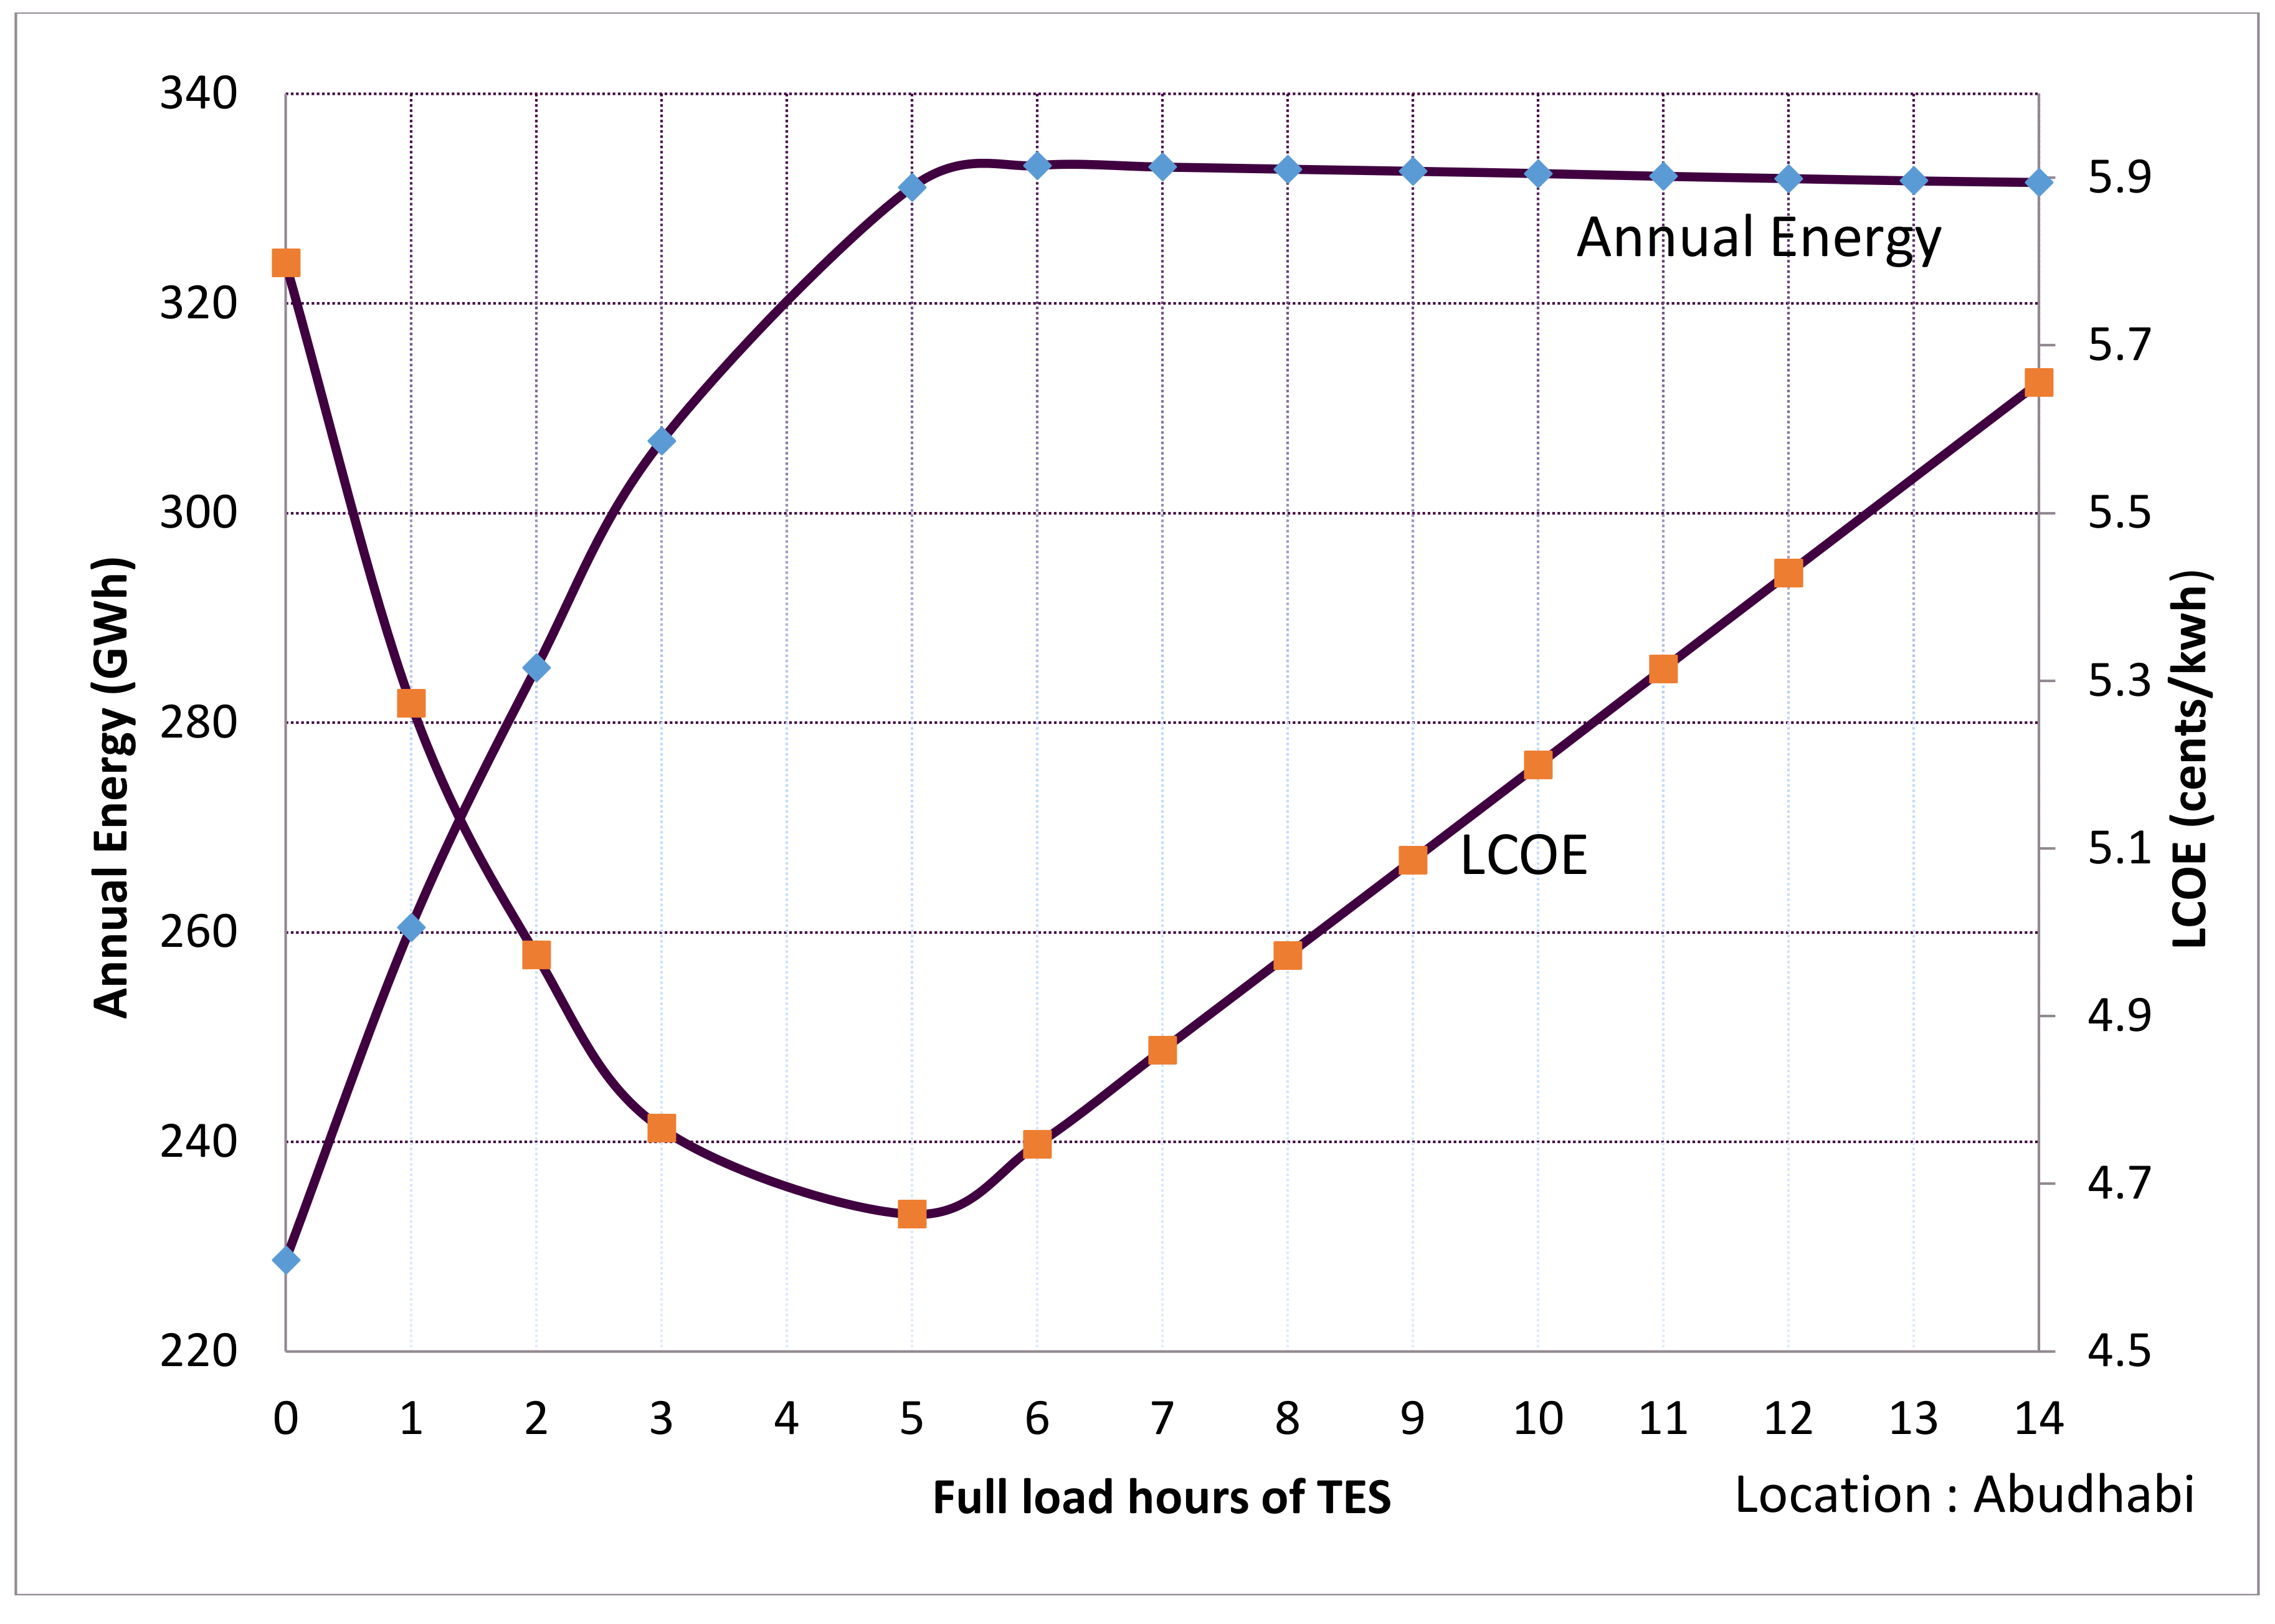
Figure 15.
Variation of annual energy generation and LCOE with full load hours of TES for Aswan.

Table 1.
Characteristics of the shortlisted locations analyzed in this work.
| Location | Latitude and Longitude | Annual DNI (kWh/m2/day) | Average Temperature (°C) | Elevation (m) | Data Source |
|---|---|---|---|---|---|
| Abu Dhabi (U.A.E) | 24.43° N, 54.65° E | 6.29 | 27.1 °C | 27 | IWEC |
| Aswan (Egypt) | 23.97° N, 32.78° E | 6.67 | 26.2 °C | 194 | IWEC |
Table 2.
Sky Fuel Sky Trough (80 mm Outer Diameter Receiver) Collector Characteristics.
| Parameter | Value |
|---|---|
| Reflective aperture area per SCA | 656 m2 |
| Aperture Width | 6 m |
| Length of Collector Assembly | 115 m |
| Number of modules per assembly | 8 |
| Length of single module | 14.375 m |
| Focal length | 2.15 m |
| Mirror reflectivity | 0.93 |
| Optical efficiency at design | 0.8484 |
Table 3.
Design Characteristics of the proposed Parabolic Trough Power Plant.
| Characteristics | Value |
|---|---|
| Total Plant Capacity | 100 MWe |
| Total Land Area | 3,565,283 m2 |
| Condenser type | Evaporative |
| Collectors and Solar Field | |
| Total field reflector area | 1,018,112 m2 |
| Number of Loops | 194 |
| Single Loop Aperture | 5248 m2 |
| Solar Multiple (6 h of thermal energy storage) | 2 |
| Water usage per wash | 0.7 L/m2 aperture |
| Number of washes per year | 63 |
| Row spacing | 15 m |
| Number of field sub-sections | 2 |
| Thermal Receiver and HTF properties | |
| Receiver Type | Schott PTR80 |
| Absorber Tube Inner Diameter | 0.076 m |
| Absorber Tube Outer Diameter | 0.08 m |
| Glass envelope inner diameter | 0.115 m |
| Glass envelope outer diameter | 0.12 m |
| Absorber material type | 304 L |
| HTF Type | Hitec Solar Salt |
| Design Loop Outlet temperature | 525 °C |
| Design Loop Inlet Temperature | 293 °C |
| Boiler Operating Pressure | 86 bar |
| Thermal Energy Storage (TES) | |
| Full load hours of TES | 6 h |
| Storage Type | Two Tank |
| Storage Fluid | Hitec Solar Salt |
| Storage Volume | 10,482.8 m3 |
| Tank Diameter | 25.833 m |
| Tank Loss coefficient | 0.4 W/m2-K |
| Estimated Heat loss | 0.334119 MWt |
| Efficiency of Electric Heater used in storage tank | 0.98 |
Table 4.
Annual Energy yield comparison for the proposed CSP plants in two locations.
| Parameter | Abu Dhabi | Aswan |
|---|---|---|
| Annual Power Generation (GWh) | 333.15 | 369.26 |
| Gross to net conversion factor of Power Cycle (%) | 81.1 | 82.14 |
| Capacity Factor (%) | 38.1 | 42.19 |
| Mean efficiency of the Solar field () | 0.476 | 0.489 |
| Mean efficiency of the power block () | 0.3015 | 0.3065 |
| Mean efficiency of the plant () | 0.1435 | 0.1498 |
Table 5.
Annual Energy yield comparison for the optimized CSP plant design in two locations.
| Parameter | Abu Dhabi | Aswan | ||
|---|---|---|---|---|
| Initial | Optimized | Initial | Optimized | |
| Annual Power Generation (GWh) | 333.15 | 353.669 | 369.26 | 392.587 |
| Capacity Factor (%) | 38.1 | 40.4 | 42.19 | 44.9 |
| Solar Multiple | 2 | 2.2 | 2 | 2.2 |
| Full load hours of TES | 6 | 5 | 6 | 6 |
| LCOE (cents/kWh) | 4.7 | 4.52 | 4.3 | 4.2 |
| Mean efficiency of the plant () | 0.1435 | 0.1410 | 0.1498 | 0.1474 |
© 2018 by the authors. Licensee MDPI, Basel, Switzerland. This article is an open access article distributed under the terms and conditions of the Creative Commons Attribution (CC BY) license (http://creativecommons.org/licenses/by/4.0/).
Share and Cite
MDPI and ACS Style
R. P., P.; Abdul Baseer, M.; Awan, A.B.; Zubair, M. Performance Analysis and Optimization of a Parabolic Trough Solar Power Plant in the Middle East Region. Energies 2018, 11, 741. https://doi.org/10.3390/en11040741
AMA Style
R. P. P, Abdul Baseer M, Awan AB, Zubair M. Performance Analysis and Optimization of a Parabolic Trough Solar Power Plant in the Middle East Region. Energies. 2018; 11(4):741. https://doi.org/10.3390/en11040741
Chicago/Turabian StyleR. P., Praveen, Mohammad Abdul Baseer, Ahmed Bilal Awan, and Muhammad Zubair. 2018. "Performance Analysis and Optimization of a Parabolic Trough Solar Power Plant in the Middle East Region" Energies 11, no. 4: 741. https://doi.org/10.3390/en11040741
Note that from the first issue of 2016, this journal uses article numbers instead of page numbers. See further details here.