Article

Nitric Acid Pretreatment of Jerusalem Artichoke Stalks for Enzymatic Saccharification and Bioethanol Production

by
Urszula Dziekońska-Kubczak
*,
Joanna Berłowska
,
Piotr Dziugan
,
Piotr Patelski
,
Katarzyna Pielech-Przybylska
and
Maria Balcerek
Institute of Fermentation Technology and Microbiology, Faculty of Biotechnology and Food Sciences, Lodz University of Technology, Wolczanska 171/173, 90-924 Lodz, Poland
*
Author to whom correspondence should be addressed.
Energies 2018, 11(8), 2153; https://doi.org/10.3390/en11082153
Submission received: 8 June 2018 / Revised: 9 August 2018 / Accepted: 13 August 2018 / Published: 17 August 2018
(This article belongs to the Special Issue Biofuel and Bioenergy Technology)

Abstract

:
This paper evaluated the effectiveness of nitric acid pretreatment on the hydrolysis and subsequent fermentation of Jerusalem artichoke stalks (JAS). Jerusalem artichoke is considered a potential candidate for producing bioethanol due to its low soil and climate requirements, and high biomass yield. However, its stalks have a complexed lignocellulosic structure, so appropriate pretreatment is necessary prior to enzymatic hydrolysis, to enhance the amount of sugar that can be obtained. Nitric acid is a promising catalyst for the pretreatment of lignocellulosic biomass due to the high efficiency with which it removes hemicelluloses. Nitric acid was found to be the most effective catalyst of JAS biomass. A higher concentration of glucose and ethanol was achieved after hydrolysis and fermentation of 5% (w/v) HNO3-pretreated JAS, leading to 38.5 g/L of glucose after saccharification, which corresponds to 89% of theoretical enzymatic hydrolysis yield, and 9.5 g/L of ethanol. However, after fermentation there was still a significant amount of glucose in the medium. In comparison to more commonly used acids (H2SO4 and HCl) and alkalis (NaOH and KOH), glucose yield (% of theoretical yield) was approximately 47–74% higher with HNO3. The fermentation of 5% nitric-acid pretreated hydrolysates with the absence of solid residues, led to an increase in ethanol yield by almost 30%, reaching 77–82% of theoretical yield.

1. Introduction

According to forecasts by the International Energy Agency (IEA), as the population increases (1.3-fold) between 2009 and 2050, energy consumption will grow even more quickly (2-fold), reaching 15–18 billion tons of oil equivalent (TOE) in 2035 [1,2]. Thus far, world energy demand has been met mainly by burning fossil fuels. However, due to the depletion of coal, oil, and natural gas reserves, as well as increasing public awareness of the environmental impact of emissions, more attention is being focused on developing renewable energy sources, such as biofuels [3]. First-generation biofuels are mostly produced from starch- and sugar-based biomass, derived from food crops grown on agricultural land using standard processes. This can affect food supply and prices. Interest has therefore been growing in second generation biofuels, produced using different feedstocks.
Second generation bioethanol production requires energy crops with high biomass yields per unit land area, resistance to changing climatic conditions, diseases and pests, and the ability to grow in poor soil conditions. Jerusalem artichoke (JA) corresponds to all these requirements [4,5]. An herbaceous perennial plant belonging to the Asteraceae (also called Compositae) family, JA consists mainly of small underground tubers with 1-3 m tall stalks. Originally used in food and feed, JA tubers contain 75–79% water, 15–16% carbohydrates (in the form of inulin), and 2–3% protein [6,7]. In the past few decades, JA has been cultivated extensively for fructose, oligofructose, and inulin extraction (as functional food ingredients, and more recently to produce bioethanol from the tuber inulin [8,9,10,11]. It is also possible to obtain other valuable biochemicals from lignocellulosic biomass, including biobutanol [12] and dimethylfuran [13]. Jerusalem artichoke tubers are considered an attractive feedstock, for producing these chemicals [14,15].
Much less attention has been given to the opportunities for producing bioethanol from JA stalks (JAS). Like all lignocellulosic material, JAS consist mainly of cellulose, hemicellulose, and lignin, bound together in a complex matrix which makes the raw material resistant to enzymatic hydrolysis [16,17]. Appropriate pretreatment must therefore be applied, to break down this recalcitrant structure and make the cellulose more accessible to hydrolyzing enzymes [16]. Many pretreatment methods exist, including physical, chemical, physicochemical, biological, and combined methods. However, the best method for pretreating JAS has not yet been found. Only a few papers describe bioethanol production from JAS. Kim et al. [18] and Kim and Kim [19] suggest using whole JA plants for bioethanol production. Using SSF and CBP processes, respectively, these authors treated the tubers as a source of nitrogen for Kluyveromyces marxianus yeasts. Khatun et al. [20] used inulinase producing Saccharomyces cerevisiae yeasts, for the fermentation of JAS pretreated with NaOH. Song et al. [21] investigated the effect of hydrogen peroxide-acetic acid (HPAC) pretreatment. All these studies have had a significant impact on research into bioethanol production from JAS. However, many issues regarding the pretreatment of JAS remain unresolved.
Dilute acid pretreatment is the most commonly used method for preparing lignocellulosic biomass and has great potential for industrial applications. This method is recommended by the National Renewable Energy Laboratory (NREL), as it enables the removal and recovery of most of the hemicelluloses, in the form of dissolved sugars, so higher yields of glucose can be achieved [22]. The removal of hemicelluloses facilitates access to the cellulose. However, this method does not result in significant delignification [23,24]. Dilute sulfuric acid, has been widely used to pretreat various types of lignocellulosic biomass [25,26,27]. Much less attention has been given to hydrochloric, and especially nitric acid. In comparison to sulfuric acid, nitric acid causes less equipment corrosion, and has been found to be much faster and effective for hydrolysis of lignocellulosic biomass [28,29,30]. Unlike acid pretreatment, alkaline pretreatment removes lignin, as well as acetyl and uronic acid groups present in hemicelluloses. It thus leads to the solubilization of lignocellulosic complexes. The main advantage of alkaline methods is that the reaction is performed under normal pressure and temperature, so less energy input is required [31]. Alkaline treatment has been applied with success to various lignocellulosic feedstocks, including switchgrass [32] and sweet sorghum bagasse [33], enabling a high rate of cellulose digestibility.
Given the advantages of JA as a feedstock for biofuel production, and the limited research regarding the use of JAS in second-generation processes, this paper assessed the impact of various pretreatments on this type of biomass. Each kind of lignocellulosic biomass requires the selection of the most appropriate pretreatment method. This study investigated the effect of different alkaline (sodium and potassium hydroxide) and acidic (sulfuric, hydrochloric and nitric acid) pretreatments, on the yields of subsequent enzymatic hydrolysis and fermentation. Based on our previous research [34], as well as on literature review [35,36], the effect of the acids and alkalis was evaluated under uniform conditions, i.e., 121 °C for 60 min; as these conditions were found to be sufficient to release the structure of the lignocellulosic complex, and thus enhance enzymatic hydrolysis. It was assumed that the use a of a less severe method of pretreatment would also result in the production of fewer inhibitors. To the best knowledge of the authors, this was the first study to evaluate the effect on JAS biomass, of pretreatment with hydrochloric and nitric acids or potassium hydroxide.

2. Results and Discussions

2.1. Chemical Composition of Raw and Pretreated Jerusalem Artichoke Stalks

The composition of whole plant JA biomass is highly variable and depends on climatic and cultivation conditions [18]. To evaluate the potential of JAS as a feedstock for second generation bioethanol production, the biomass was analyzed for total solids [37], cellulose [38], hemicellulose [39], and lignin content [40]. The raw JAS were composed of 89.05 ± 0.55% dry matter, 34.95 ± 2.59% d.m. cellulose, 12.69 ± 3.23% d.m. hemicellulose, and 20.24 ± 2.13% d.m. lignin. The content of cellulose, the most important component, was comparable to that of other feedstock commonly used for bioethanol production, e.g., 36.3% for corn stover [41], 36.9% for sweet sorghum bagasse [33], 35.8% for rice straw [42], and 38.7% for wheat straw [43].
To increase the susceptibility of lignocellulosic biomass to enzymatic hydrolysis, appropriate pretreatment methods must be applied. In our study, the effect of different concentrations of acids (2% and 5% w/v HCl, H2SO4, HNO3) and alkalis (2% and 5% w/v NaOH, KOH) on JAS was evaluated by analyzing the solid and liquid fractions obtained after each pretreatment. The solid residues were analyzed after washing for cellulose, hemicellulose, and lignin content. The dry weight loss was also measured, to calculate the percentage of recovered solids. In the liquid fraction, the concentrations of inhibitory compounds (formic acid, acetic acid, 5-hydroxymethylfurfural—HMF, furfural, and total phenolics) and of sugars released during pretreatment (cellobiose, glucose, xylose, and arabinose) were measured using the HPLC method. The rate of hemicellulose and cellulose hydrolysis was calculated, based on the concentrations of xylose and glucose in the hydrolysates and the initial hemicellulose and cellulose contents in the raw JAS. The results are presented in Table 1, Table 2 and Table 3.
Analysis of the solid fractions revealed that when acid pretreatment was applied, the hemicellulose content in the biomass decreased significantly, from 12.69% d.m. to 1.31% d.m. (nitric acid pretreatment), while the cellulose and lignin content increased. This could be explained by the fact that the main reaction which occurred during pretreatment in acidic environments was the decomposition of hemicelluloses, especially the xylan fraction. As a result, higher recovery of hemicellulosic sugars is possible, and the cellulose present in the solid fraction is more susceptible to enzymatic hydrolysis [44,45]. The highest cellulose content in the biomass (77.27% d.m.) was achieved when 5% nitric acid was applied (Table 1). Under the same conditions, 96% of the hemicelluloses were hydrolyzed (Table 2). However, biomass recovery was significantly lower (p < 0.05) (66% for 2% w/v HNO3 and 57% for 5% w/v HNO3) than when other pretreatment methods were used. Rodríguez-Chong et al. [28] reported that nitric acid exhibits much higher efficiency for hemicellulose removal, and the whole process is faster than when hydrochloric or sulfuric acids are used. Under optimal conditions (i.e., 6% HNO3, 122 °C, 9.3 min), after pretreatment these authors obtained a liquor containing 18.6 g xylose/L, 2.87 g glucose/L, 2.04 g arabinose/L, 0.9 g acetic acid/L, and 1.32 g furfural/L. Zhang et al. [29] evaluated the effect of low concentrations of nitric acid on the hydrolysis of hemicelluloses. The optimum conditions were reported as 0.6% HNO3, 150 °C for 1 min, releasing 22.01 g xylose/L, 1.91 g glucose/L, 2.90 g arabinose/L, 2.42 g acetic acid/L, and 0.21 g furfural/L. However, these authors did not perform enzymatic hydrolysis of the solids obtained, so the effects on cellulose saccharification are still unclear.
The recovery of solids after pretreatment with HCl or H2SO4, NaOH or KOH at 2% concentration, was approximately 72–74%. Increasing the acid or alkali concentration to 5% resulted in solids recovery in the range of 59–66%. In the liquid fraction obtained after acid pretreatment, glucose was present at a similar level (2.2–2.8 g/L), regardless of the type of acid used, except for 5% w/v nitric acid, with which 5.70 g/L of glucose was obtained (corresponding to 14.66% of cellulose hydrolysis) (Table 2). After acid pretreatment, large amounts of furan derivatives were found in the liquid fraction, reaching 0.74 g/L for HMF and 0.52 g/L for furfural (Table 3). Herrera et al. [46] obtained 2.5 g/L and 1.0 g/L of acetic acid and furfural, respectively, in hydrolysate from 2% w/v HCl-pretreated sorghum straw at 100 °C. When alkaline treatment is applied, the main reactions are saponification and solvation, causing lignin to be removed from the lignocellulosic matrix. Unlike acid treatment, the deployment of alkaline reagents leads to lower hemicellulose hydrolysis and lower production of inhibitory compounds [45]. In our study, the application of NaOH or KOH resulted in the removal of 66–76% of the lignin, whilst the cellulose and hemicellulose contents were approximately 56–63% d.m. and 8–10% d.m., respectively (Table 1).
The concentration of glucose in the liquid fraction was at a similar level to that with acid pretreatment (p > 0.05). However, the concentrations of xylose and furan derivatives were significantly lower, by up to 0.31 g/L and 0.98–16.43 mg/L, respectively (Table 2 and Table 3). Nevertheless, the concentration of aliphatic carboxylic acids was higher than in the acid-treated samples (p < 0.05), due to the removal of acetic and other uronic acids, which were substituted for hemicelluloses because of alkaline treatment [47]. The concentration of phenolic compounds was also significantly higher (p < 0.05) in alkaline-treated samples than in acid-treated ones, and ranged from 1.12 to 1.39 g/L. The application of acidic pretreatment led to the release of 0.46 to 1.08 g/L of TPC. Moreover, there were significant differences (p < 0.05) in obtained level of TPC depending on acid used, with the lowest concentration of phenols obtained for nitric acid pretreatment, and the highest for sulfuric acid pretreatment. However, as reported by Kim et al [48], phenolic compounds are released from biomass during enzymatic hydrolysis, regardless of whether the pretreatment step was applied or not. Phenolic compounds are strong inhibitors, which are proven to inhibit enzymes used in the saccharification step, as well as being responsible for their deactivation. Ximenes et al. [49,50], have shown that phenolic compounds are important inhibitors and deactivators of cellulolytic enzymes, especially β-glucosidase, with the strongest negative effect exhibited by a polymeric compound—tannin acid. Authors imply that the removal of inhibitors, in particular, phenolic compounds, prior to the saccharification process, ought to be performed to ensure high enzyme activity and to achieve better hydrolysis yield.
Taking into consideration the results obtained in our study, the pretreatment using nitric acid, resulted in significantly lower (p < 0.05) concentrations of inhibitors in liquid fractions. Therefore, acid treatment using nitric acid is a promising pretreatment method for JAS biomass, enabling a large cellulose fraction to be obtained from the solid material.

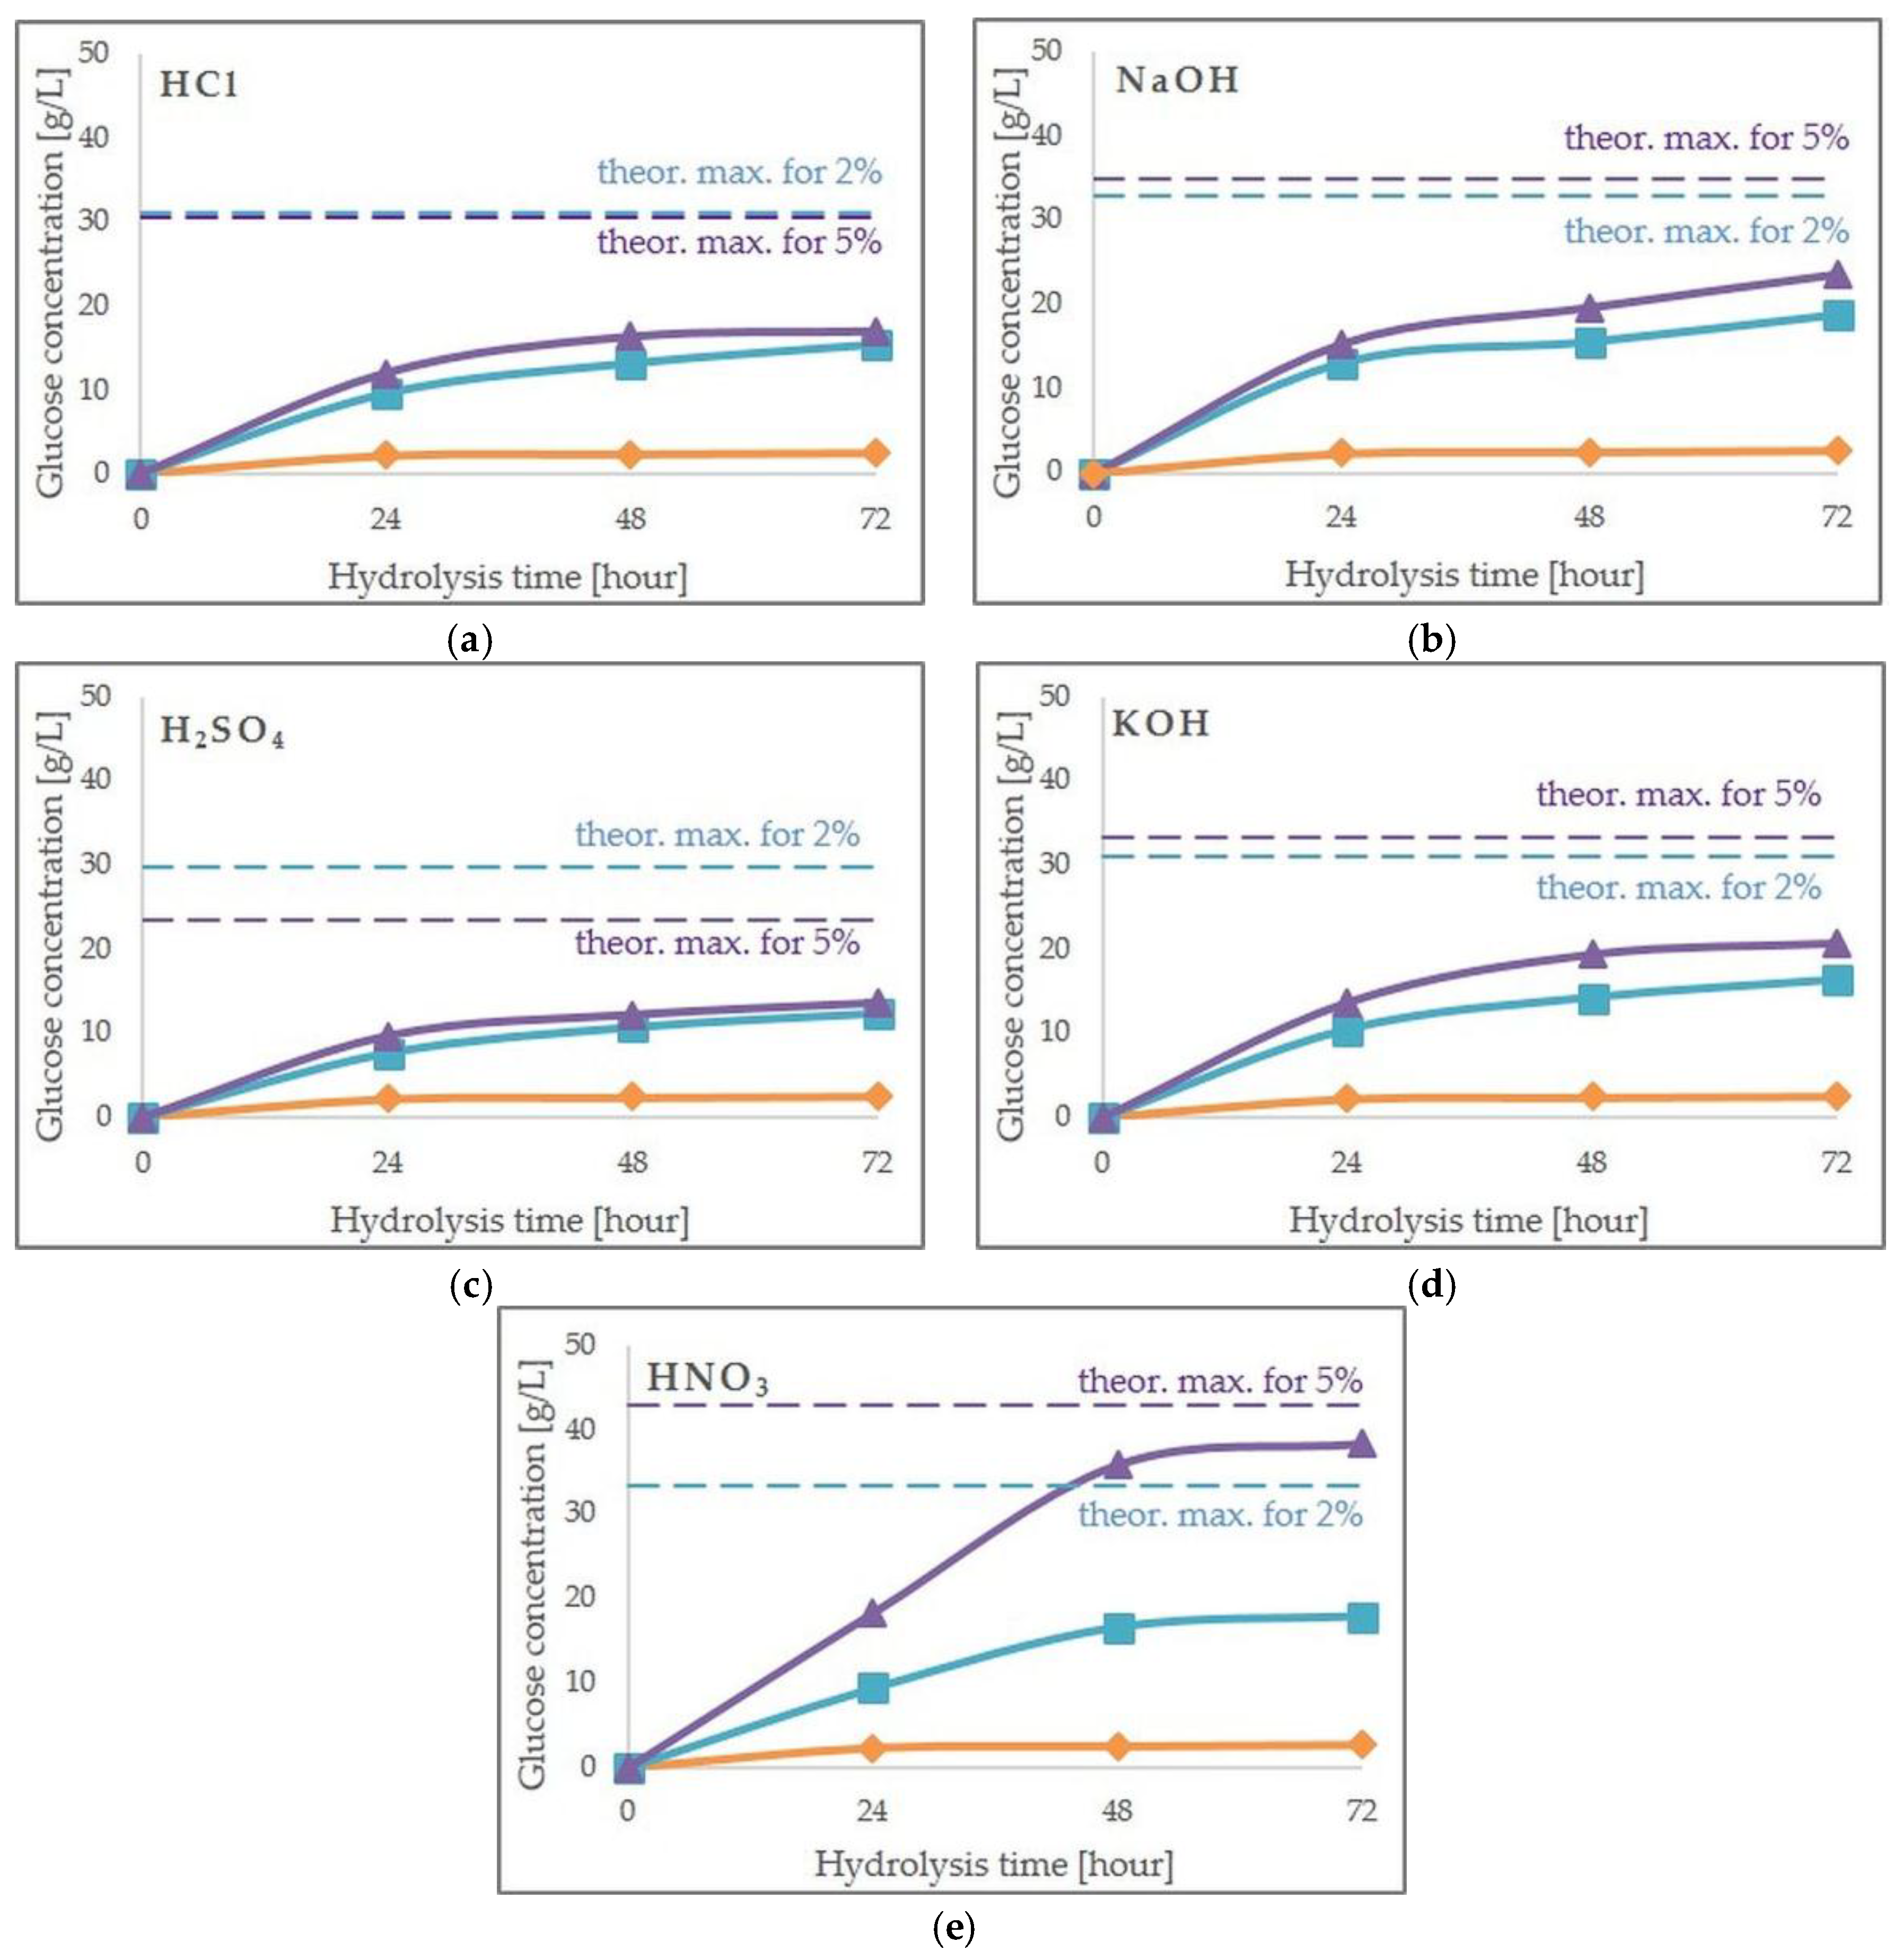
2.2. Effect of Pretreatment on Enzymatic Hydrolysis

To evaluate the susceptibility of acid and alkali pretreated JAS to enzymatic hydrolysis, the biomass obtained after each pretreatment was subjected to saccharification at 50 °C for 72 h. During that time, samples were collected every 24 h and the concentrations of glucose and other saccharides (cellobiose, xylose, and arabinose) were assessed. The results are presented in Figure 1 and Table 4. The hydrolysis of untreated JAS resulted in the formation of a small amount of glucose (approximately 2.5 g/L). This concentration was achieved after 24 h of hydrolysis and remained at an almost constant level until the end of the process. The best results from among the acid pretreatment methods, were obtained when nitric acid was used. Not only did it provide the highest glucose yield after hydrolysis (89% of the theoretical yield) (Table 4), but more than 92% of this glucose was formed within the first 48 h of hydrolysis (Figure 1). A similar situation was observed in the case of 5% (w/v) HCl. However, the total amount of glucose and the glucose yield were significantly lower (p < 0.05) (17 g/L and 55.5%, respectively). The application of 2% (w/v) HCl, or H2SO4 (at both concentrations—2% and 5% (w/v)), required more than 48 h of hydrolysis (Figure 1). The application of sulfuric acid resulted in the formation of 12.5 and 13.5 g/L of glucose, respectively, when 2% and 5% (w/v) of reagent was used. Increasing the acid concentration did not lead to a significant increase in released glucose (p > 0.05). However, taking into consideration the cellulose content in pretreated biomass, the yield of cellulose hydrolysis was significantly (p < 0.05) higher when 5% (w/v) H2SO4 was applied (58% of the theoretical yield), as compared with 2% (w/v) H2SO4 (42% of the theoretical yield) (Table 4).
An inverse relation was observed with regard to xylose formation. When 2% (w/v) sulfuric acid was used, the concentration of released xylose was 1.90 g/L, in comparison to 1.28 g/L for 5% (w/v) acid, which was probably caused by greater hemicellulose decomposition during pretreatment with higher acid concentrations (Table 4). The application of hydrochloric acid showed a similar pattern to H2SO4 for glucose formation, i.e., increasing the concentration of HCl did not cause a significant increase. When 2% (w/v) nitric acid was used, the concentration of glucose was significantly higher than for other acidic reagents (p < 0.05) and reached 17.87 g/L (54% yield), after 72 h of enzymatic hydrolysis. However, the use of a higher concentration of HNO3 (i.e., 5% w/v) resulted in a more than two-fold increase in the amount of released glucose, up to 38.47 g/L with 89% cellulose hydrolysis efficiency. Acid treatment converted most hemicelluloses into monomeric sugars, leading to a higher rate of cellulose bioconversion. Martin et al. [51] achieved almost 60% cellulose conversion after enzymatic hydrolysis of Jatropha curcas shells, pretreated with 1.5% sulfuric acid at 110 °C for 60 min.
Alkali treatment leads to the degradation of side ester and glycoside chains, as well as to cellulose swelling and decrystalization [52,53]. This enables better access by cellulolytic enzymes. In the present study, two alkaline reagents, sodium and potassium hydroxide, were used. The results showed that the application of NaOH resulted in higher glucose concentrations (18.85 g/L and 23.63 g/L, respectively, for 2% and 5% (w/v) NaOH), when compared with KOH (16.33 g/L and 20.67 g/L) (Table 4). However, after pretreatment using potassium hydroxide, the maximum level of glucose was obtained in a shorter time. The amount of cellulose converted to glucose was also significantly higher (p < 0.05) after NaOH treatment, than after pretreatment with KOH. Moreover, a significant amount of xylose, ranging from 4.99 g/L to 8.47 g/L, was released via enzymatic saccharification of JAS after alkali pretreatment. NaOH was found to be an effective method, for the pretreatment of Coastal Bermuda grass, at 121 °C with 0.75% NaOH for 15 min [54]. Under these conditions, conversion efficiencies for glucan and xylan, were 90.43% and 65.11%, respectively.

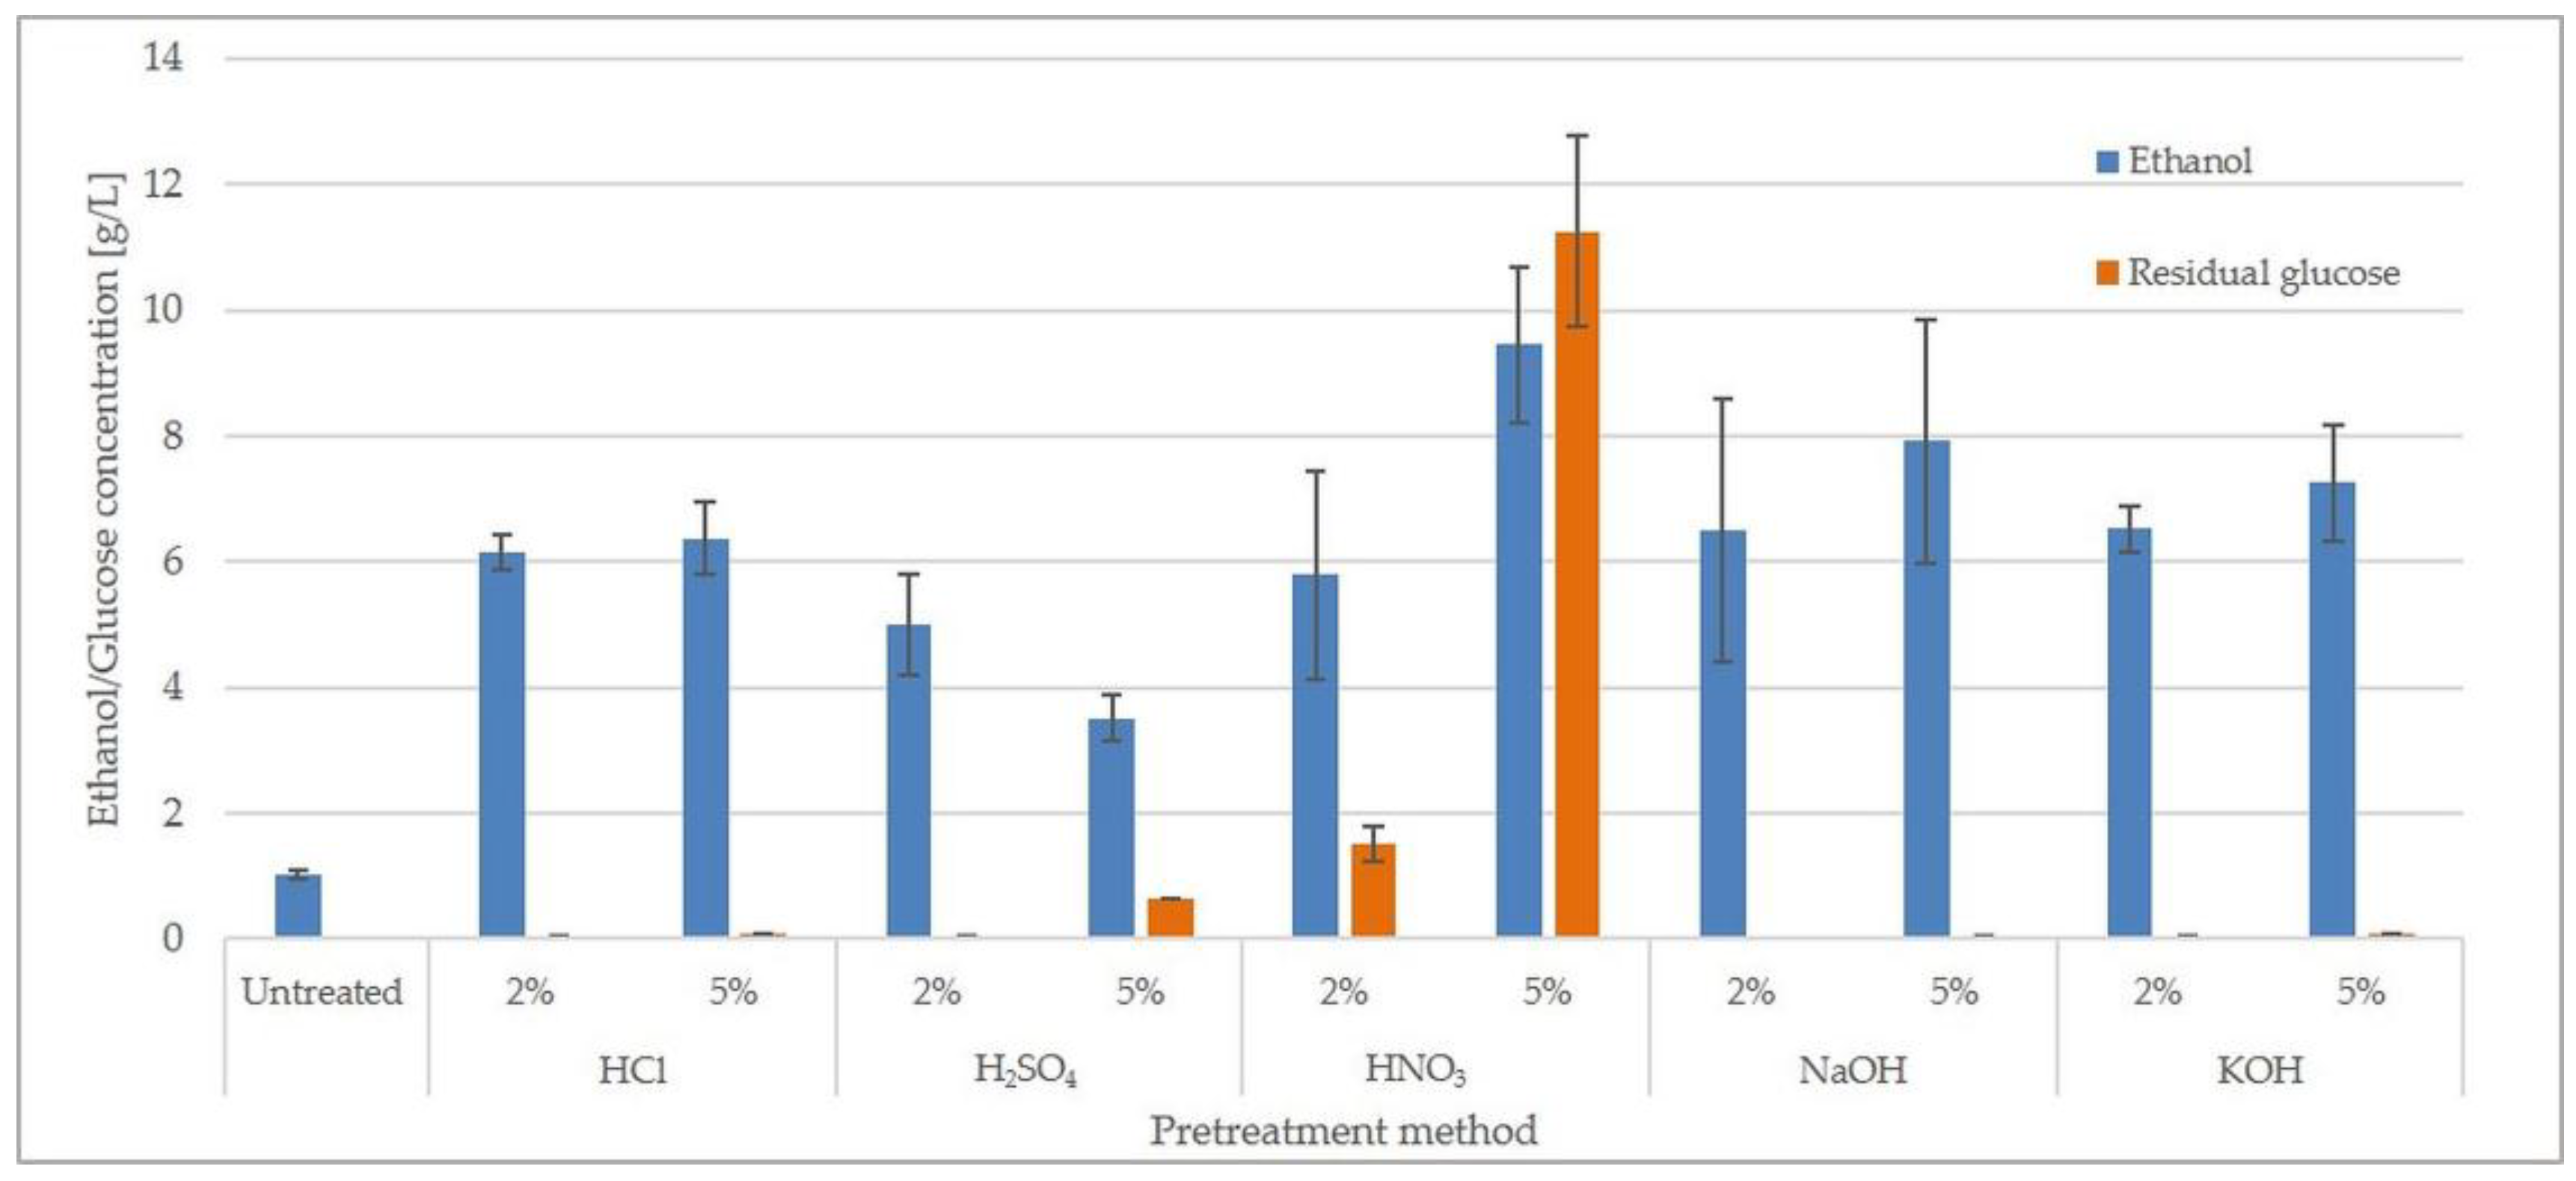
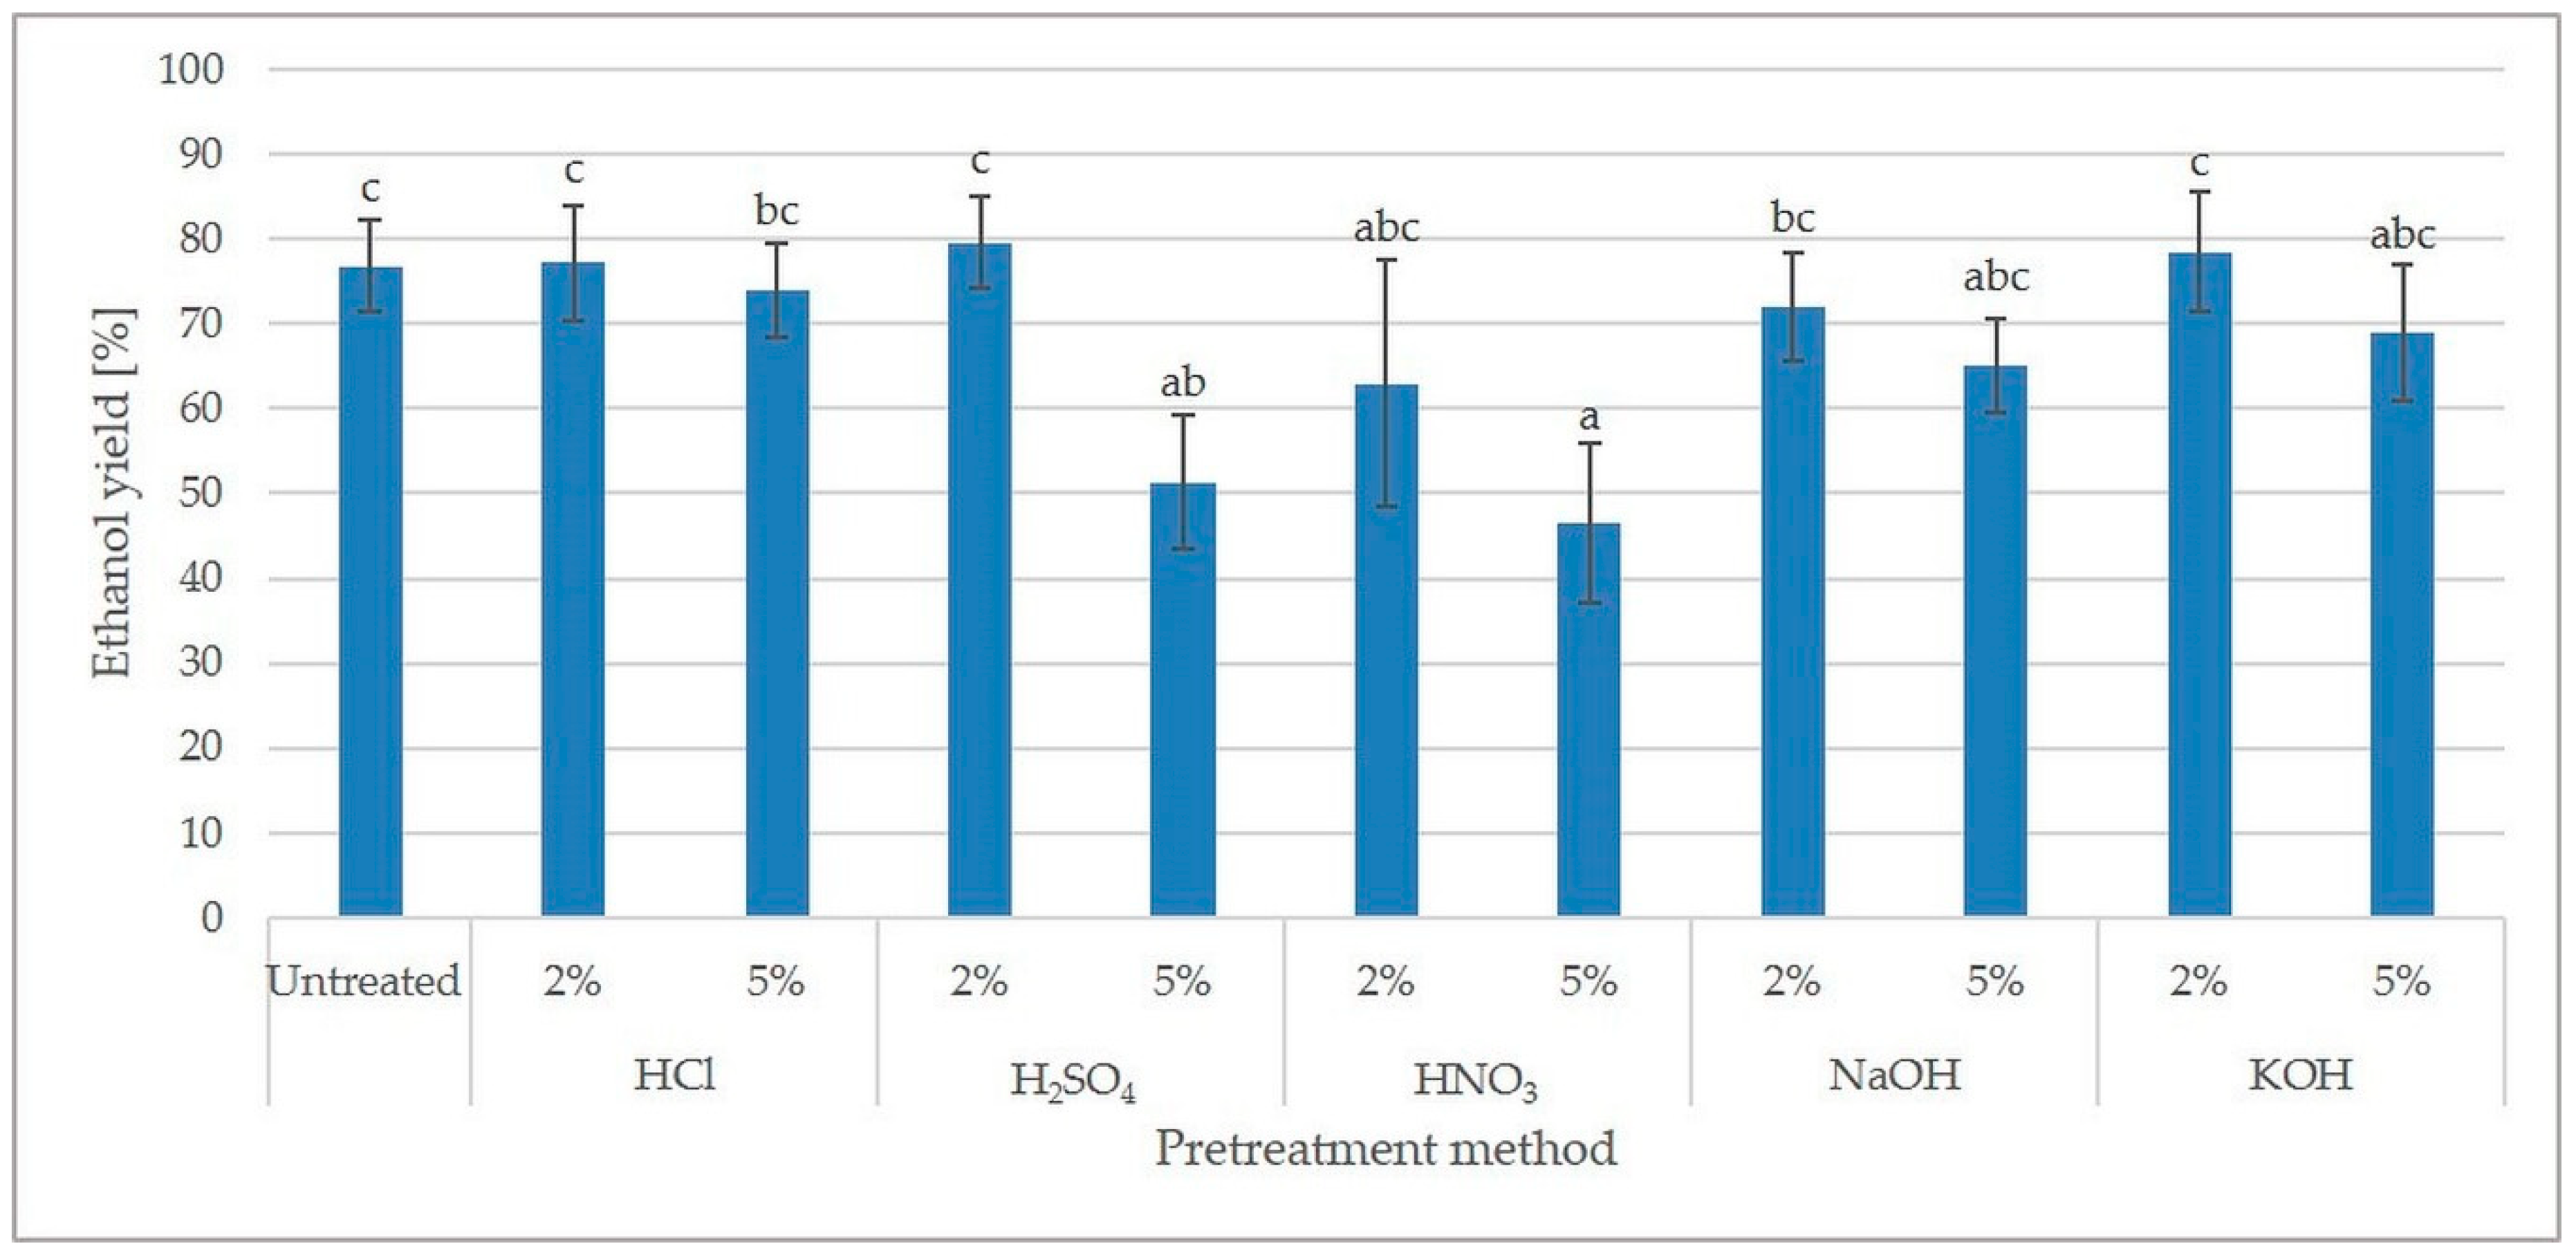
2.3. Concentration of Inhibitors and Fermentation of Hydrolysates

The next step in the process of obtaining bioethanol, after enzymatic hydrolysis of cellulose, is microbial fermentation of the released glucose to ethanol, conducted mainly by Saccharomyces cerevisiae (S. cerevisiae) yeasts. Unfortunately, these microbes are very sensitive to the presence in the hydrolysates, of products from the degradation of lignocellulose. These products include a wide range of substances formed either from the decomposition of sugars, i.e., furan derivatives and aliphatic carboxylic acids, or from lignin, i.e., phenolic compounds [45]. The furan derivatives (furfural and HMF), are formed by the dehydration of pentose and hexose sugars, respectively, and are responsible for reducing yeast growth, as well as ethanol yield and productivity. Acetic acid is formed because of the hydrolysis of the acetyl groups in hemicellulose, whilst formic acid is a product of the degradation of furan aldehydes [45,55]. A variety of phenolic compounds are formed from lignin, when pretreatment is applied. They can affect the growth of microorganisms, as well as fermentation efficiency, and their toxicity is most probably related with specific functional groups [55].
After pretreatment, the biomass was washed thoroughly with water to remove inhibiting compounds. However, there was a risk that small amounts of inhibiting compounds could remain bound to solid fractions and affect downstream processes. To determine the concentration of inhibitors in the hydrolysates, HPLC analysis was performed. The results are summarized in Table 5. In the raw JAS hydrolysates, only acetic acid was present, at a concentration of 1.11 mg/L. No formic acid, furan derivatives, or phenolic compounds were detected. The concentration of aliphatic carboxylic acids in hydrolysates obtained from pretreated biomass was in the range of 2.57–22.23 mg/L and 8.31–37.44 mg/L, respectively, for formic and acetic acids. The only exceptions were the hydrolysates obtained from HNO3-pretreated biomass, in which the concentration of acetic acid was significantly higher (p < 0.05) than in hydrolysates of JAS treated with other chemicals, reaching 128.58 mg/L (2 mM). However, this concentration is still not considered to be toxic to S. cerevisiae. In fact, according to Larsson et al. [56], below 100 mM acetic acid can have a stimulatory effect on ethanol fermentation. Furan compounds, are the other large group of inhibitory compounds present in lignocellulosic hydrolysates. It has been reported that, as with carboxylic aliphatic acids, moderate amounts of furan aldehydes in fermented media can enhance the fermentation efficiency of recombinant xylose-utilizing S. cerevisiae [55]. In our study, the concentrations of HMF and furfural in hydrolysates, were in the ranges of 1.68–12.29 mg/L and 2.83–7.78 mg/L, respectively.
The concentration of phenolic compounds ranged from 80.63 to 196.91 g/L, respectively, when 5% w/v and 2% w/v HNO3 were applied. In hydrolysates obtained with the use of other reagents, the TPC value was between 128 and 178 mg/L. Despite the significant differences between the samples prepared using different pretreatment methods, no direct correlation was observed between the concentrations of furan or phenolic compounds, and the initial pretreatment methods used. This implied that washing the solids before enzymatic hydrolysis, had successfully removed all analyzed inhibitors which had formed during the pretreatment step.
To evaluate the susceptibility of the hydrolysates to be converted into bioethanol, fermentations were performed using commercial distiller’s yeast at a dose of 0.5 g/L of hydrolysate, supplemented with ammonium phosphate (0.3 g/L) as a nutrient. The results are presented in Figure 2 and Figure 3. The application of dilute sulfuric acid, resulted in the formation at most of 5 g/L of ethanol (Figure 2). It was also observed that when a higher concentration of acid was used, the yield of ethanol decreased, from 80% to 51% respectively, for 2% and 5% (w/v) H2SO4 (Figure 3). This was despite the fact that the initial level of sugars in the hydrolysates was at a similar level. Moreover, not all the available glucose was converted by the yeast, following pretreatment with 5% (w/v) H2SO4. Pretreatment with HCl or KOH (at concentrations of both 2% and 5%), as well as 2% NaOH, resulted in similar ethanol concentrations (p > 0.05), ranging from 6.2 g/L to 7.2 g/L, with corresponding ethanol yields in the rage of 68–78% of the theoretical yield. The utilization of glucose during fermentation in these samples was almost complete. Pretreatment with nitric acid had a significantly different impact on the fermentation process, compared with the other tested chemicals. The application of 5% (w/v) HNO3, led to the formation of 38.5 g/L of glucose during saccharification. However, only 9.5 g/L of ethanol was obtained after fermentation, which was only 46% of the theoretical yield. Moreover, the amount of glucose that remained in the medium after fermentation was significant (11.5 g/L), which may imply that there were still some unidentified inhibitors present in hydrolysate.
As shown in Table 5, the concentrations of acetic and formic acids, as well as of furfural and HMF, were not at levels considered toxic to yeasts. The concentration of phenolic compounds was also relatively low. However, the low yield of ethanol may have been caused by the presence of inhibitory compounds, which were released from the pretreated biomass when the ethanol was produced, or due to synergic interactions between inhibitors. In addition, the exact composition of phenolic compounds in tested hydrolysates is unknown. Despite the low TPC level, the concentration of individual phenols can be close to inhibitory to the yeast fermentation process. Nitric acid is a strong oxidizing agent, and for that reason, some compounds that are products of the oxidative reactions of commonly found inhibitors may have been present in the medium [57]. Luo et al. [58] found 2-furancarboxylic acid, 2-furanacetic acid, and 5-hydroxymethylfurancarboxylic acid, of which furfural and HMF are precursors, in nitric-acid hydrolysate of aspen chips. Several phenolic compounds are also formed during the degradation of lignin, and some of these could have remained bound to the biomass. Phenolic compounds are much stronger inhibitors of S. cerevisiae than aliphatic acids or furans, so even at low concentrations, they can decrease the ethanol yield significantly. Modelska et al. [59] found the minimal inhibitory concentration (MIC) of vanillin to be 0.25% (2.5 g/L). Adeboye et al. [60] reported that the most toxic inhibitor of S. cerevisiae Ethanol Red, was 4-hydroxy-3-methoxycinnaldehydyde (coniferyl aldehyde), for which the toxicity limit was as low as 1.8 mM (0.32 g/L). The results presented in this paper, are in line with those of other authors working with dilute nitric acid pretreatment. Following the fermentation of wheat straw pretreated with 1% nitric acid at 130 °C, Tutt et al. [61] obtained an ethanol yield of 95 g/kg of biomass, which corresponded to 59.2% fermentation efficiency.

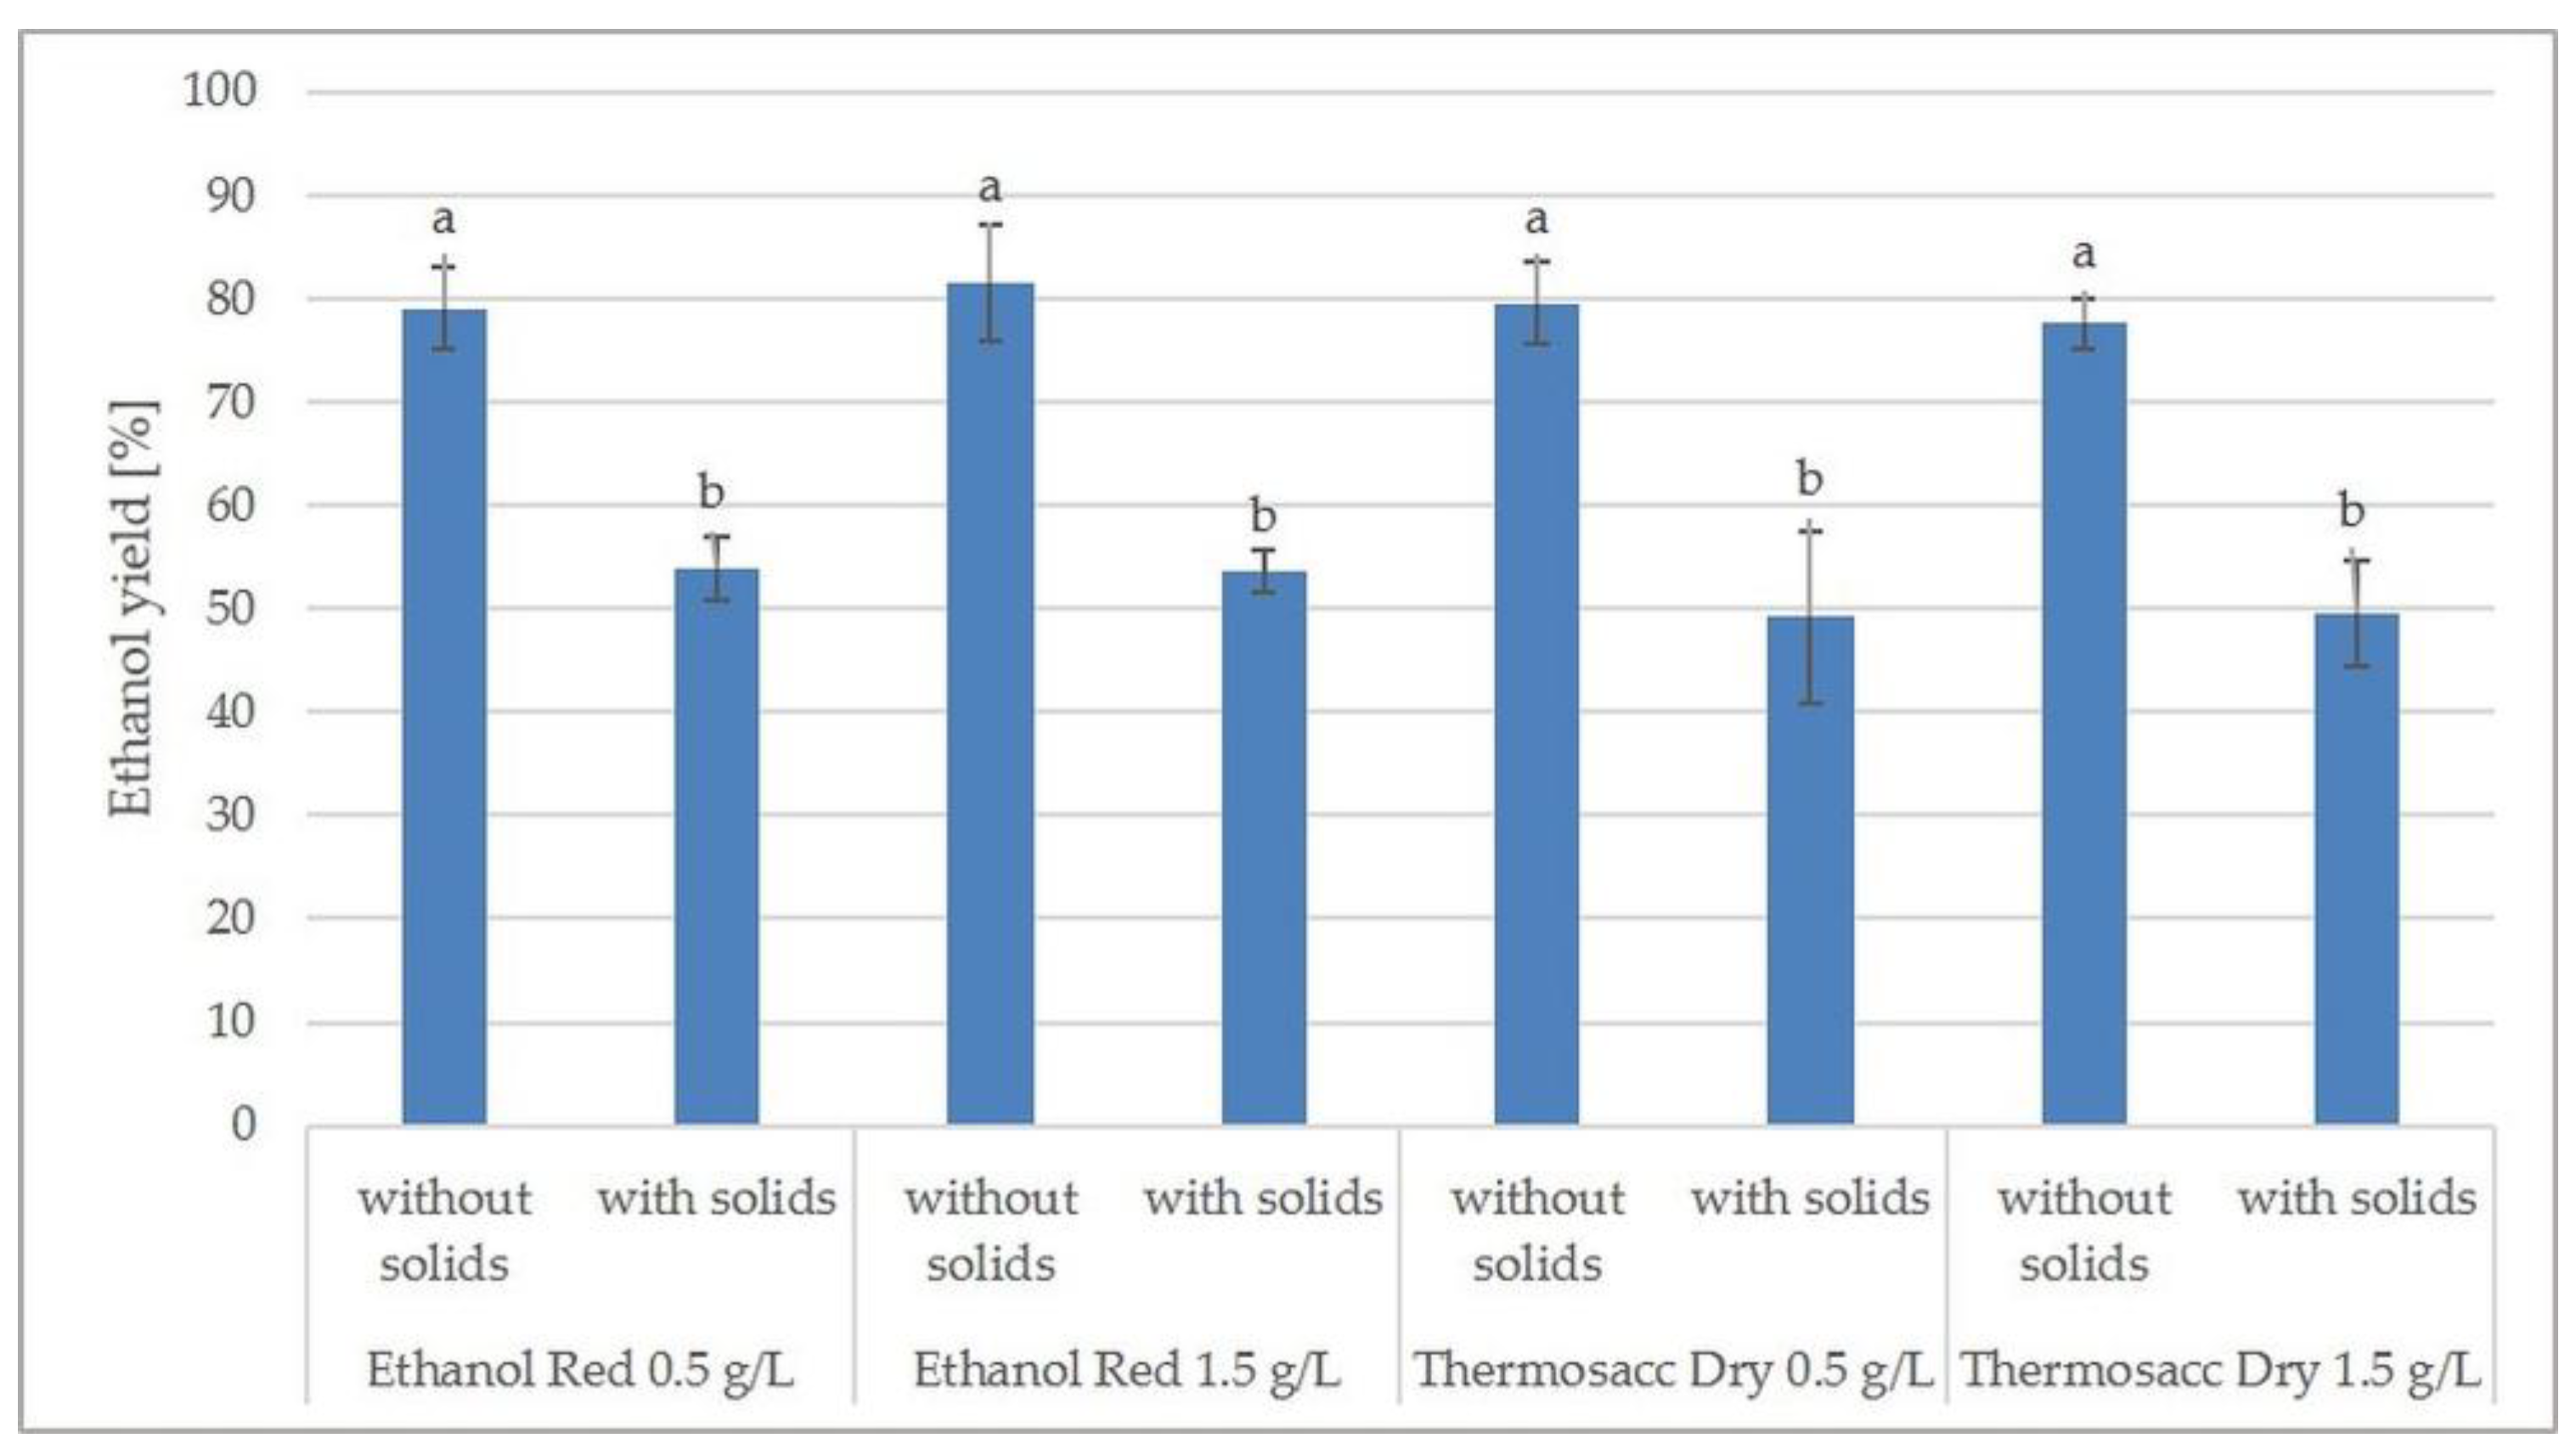
Fermentation of Nitric Acid Pretreated Hydrolysates—The Effect of Yeast Strain, Inoculum Size and Presence of Solids Residues

To increase the ethanol yield in nitric acid pretreated JAS hydrolysates, additional fermentation trials were performed. The impact of a yeast strain (Thermosacc Dry, Ethanol Red), and applied yeast inoculum (0.5 and 1.5 g/L) were assessed. In addition, since all previous experiments were performed with the presence of solid residues during the fermentation process, the effect of separation of unhydrolyzed biomass before fermentation was also evaluated. The results are presented in Figure 4.
The obtained results showed that the ethanol yield was not affected by the yeast strain or the inoculum used. The fermentation trials of hydrolysates in the presence of solids, with use of Thermosacc Dry and Ethanol Red, both at a dose of 0.5 and 1.5 g/L, resulted in similar (p > 0.05) ethanol yield ranging from 49.22% to 53.85% of the theoretical yield. According to Azhar et al. [62], the concentration of inoculum has an impact on sugars consumption rate and ethanol productivity, but not on the final ethanol yield. The separation of unhydrolyzed solids before fermentation, resulted in a significant (p < 0.05) increase in fermentation efficiency, reaching 77.61–81.51% of the theoretical yield. However, the obtained yield was not influenced by yeast strain or inoculum size under applied conditions. Usually, the fermentation of lignocellulosic hydrolysates is carried out in the presence of solids, which contain mostly lignin [63]. Nonetheless, as reported by Monot et al. [64], it is a good practice to remove the solid parts before fermentation, unless hydrolysis and fermentation processes occur simultaneously. As shown in this paper, it is very important when fermentation of nitric acid pretreated biomass is carried out. The separation of solids before the fermentation allowed us to obtain almost 30% higher ethanol yield. This may have been the result of the presence of some toxic compounds, in the unhydrolyzed solid. These compounds may have been released from biomass when ethanol, even at low concentration, appeared in the medium.

3. Materials and Methods

3.1. Materials

3.1.1. Plant Biomass

Jerusalem artichoke (Helianthus tuberosus L.) stalks were harvested from organic ‘Żeń-szeń’ breeding plants (Kalinówka, Poland), towards the end of October 2017, and delivered fresh. The stalks were air dried and chopped into 0.2–0.5 cm lengths before chemical pretreatment.

3.1.2. Enzymes and Chemicals

Enzymatic hydrolysis was carried out with use of Cellic CTec2 (Novozymes A/S, Basgsværd, Denmark), a blend of cellulases, β-glucosidases, and hemicellulases with reported activities of 120 FPU/mL cellulase, 2371 U/g β-glucosidase, and 161 mg/g protein [65].
Hydrochloric acid (38% w/w), nitric acid (65% w/w), sulfuric acid (95% w/w), sodium hydroxide (pellets), and potassium hydroxide (pellets), all from Chempur (Piekary Slaskie, Poland) were used to prepare the pretreatment solutions. Glucose, xylose, arabinose, cellobiose, acetic acid, formic acid, HMF, and furfural from Sigma Aldrich (St. Louis, MO, USA) were used as standards for high-performance liquid chromatography (HPLC) analysis. All the reagents were at least analytical grade, and all the aqueous solutions were prepared using high-purity deionized water (18.2 MΩ·cm, Simplicity Millipore Waters, Milford, MA, USA). Penicillin and streptomycin (Sigma Aldrich, St. Louis, MO, USA) were used to prevent microbial growth during saccharification.

3.1.3. Yeasts

Fermentation was conducted using the commercial dry distiller’s yeasts Saccharomyces cerevisiae strains: Thermosacc Dry (Lallemand Ethanol Technology, Montreal, QC, Canada) and Ethanol Red (Fermentis Ltd., Marcq-en-Baroeul, France). Both selected yeast strains, were declared by the producers to have the average number of live cells of 2 × 10¹⁰ per gram and approx. 95% of dry matter. Depending on experiments (see below), yeast dose was 0.5 or 1.5 g/L of hydrolysate. Before the inoculation of hydrolysates, dry yeast was hydrated in 10 times the volume of water, at approximate 35 °C for 15 min, to ensure higher activity and homogenization [66].

3.2. Pretreatment

The biomass pretreatments were carried out with 10% w/v dry solid loadings. For acid pretreatment, JAS was soaked in 150 mL of a 2% or 5% (w/v) solution of sulfuric acid, hydrochloric acid or nitric acid, whilst for alkali pretreatment, 150 mL of a 2% or 5% (w/v) solution of sodium hydroxide or potassium hydroxide was used. The samples were autoclaved at 121 °C for 60 min. After pretreatment, the samples were filtered, and the liquid fraction was analyzed after neutralization using the HPLC method to determine the individual sugars, as well as the products of lignocellulose degradation. The solid biomass was washed thoroughly with water until a neutral pH (7.0 ± 0.2) value was achieved. The content of cellulose, hemicellulose, and lignin was then measured, before the solid biomass was subjected to enzymatic hydrolysis.

3.3. Enzymatic Hydrolysis and Fermentation

The pretreated material was subjected to enzymatic hydrolysis with 5% w/v solid loading, based on dry matter, in 100 mL of 0.05 M citric buffer solution (pH 4.8). Cellic CTec2 preparation was used with a dose of 10 FPU/g cellulose (15.43 mg protein/g cellulose). A mixture of penicillin and streptomycin (50 U/mL and 50 µg/mL, respectively) was added. Hydrolysis experiments were performed at 50 °C for 72 h. Samples were taken every 24 h, and the supernatant was analyzed for monomeric sugar concentrations and lignocellulose degradation products using HPLC. After hydrolysis, the whole hydrolysate was used in the fermentation stage. The dry distiller’s yeast S. cerevisiae Thermosacc Dry was added to each sample at a dose of 0.5 g/L, along with ammonium phosphate as a source of nutrients (0.3 g/L). Fermentation trials were conducted for 72 h at 32 °C, in 250 mL flat-bottomed flasks equipped with fermentation tubes. At the same time, untreated JAS was enzymatically hydrolyzed and fermented as a reference.
The additional fermentation trials of nitric acid pretreated hydrolysates were conducted with the use of S. cerevisiae Thermosacc Dry and Ethanol Red strains, at a standard dose of 0.5 as well as 1.5 g/L. Fermentations were carried out directly in whole hydrolysate (including solids), or after separation of solid residues (fermentation of liquids only). The other parameters of the fermentation process (nitrogen nutrient, temperature, and time) remained unchanged.

3.4. Analysis and Calculations

The raw and pretreated JAS, were analyzed to determine their content of total solids according to National Renewable Energy Laboratory (NREL) protocol [37]; cellulose according to the Kurschner-Hoffer method [38]; hemicellulose according to the Ermakov method [39]; and lignin according to the NREL protocol [40]. The concentrations of sugars, organic acids, ethanol, and furan aldehydes (HMF, furfural) were analyzed using an HPLC system (Agilent 1260 Infinity, Agilent Technologies, Santa Clara, CA, USA). The compounds were separated using a Hi-Plex H column (7.7 × 300 mm, 8 µm) (Agilent Technologies, Santa Clara, CA, USA), equipped with a refractive index detector (RID). The column and detector temperatures were maintained at 60 °C and 55 °C, respectively. As a mobile phase, 0.05 M H2SO4 was used at a flow rate of 0.7 mL/min, with a sample volume of 20 µL. The samples were filtered through 0.22 µm syringe filters to remove any particulate matter. The total concentration of phenolic compounds was determined using a modified Folin-Ciocalteu method, as described by Antolak et al. [67]. Gallic acid (at concentrations of 0–250 mg/L) was used to prepare a standard curve. Samples of enzymatic hydrolysates were analyzed directly, whilst samples of a liquid fraction after pretreatment were diluted ten times before analysis.
The recovery of solid after pretreatment was calculated based on the following equation:
Solid   recovery = dry   weight   of   biomass   after   pretreatment dry   weight   of   untreated   biomass × 100 %
The hemicellulose solubilization rate was calculated based on the following equation:
Hemicellulose   solubilization = Xylose   concentration   in   liquid   fraction   [ g L ] × 0.88 Hemicellulose   in   untreated   biomass   [ g L ] × 100 %
The cellulose solubilization rate was calculated based on the following equation:
Cellulose   solubilization = Glucose   concentration   in   liquid   fraction   [ g L ] × 0.90 Cellulose   in   untreated   biomass   [ g L ] × 100 %
The glucose yield (cellulose hydrolysis efficiency) after enzymatic hydrolysis, was calculated based on the following equation:
Glucose   yield = Glucose   concentration   in   hydrolysate   [ g L ] × 0.90 Cellulose   in   pretreated   biomass   [ g L ] × 100 %
The ethanol yield, after fermentation, was calculated based on the following equation:
Ethanol   yield = Ethanol   concentration   [ g L ] Glucose   in   hydrolysate   [ g L ] × 0.511 × 100 %
All tests were performed in triplicate. Statistical analysis was performed using Statistica 10 software (Tibco Software, Palo Alto, CA, USA), with the results expressed as a mean ± standard deviation. The data were analyzed using a one-way or two-way ANOVA, followed by the Tukey’s post-hoc test, with a significance level of 0.05.

4. Conclusions

Pretreatment of JAS, using acid and alkaline reagents, successfully enhances the efficiency of enzymatic hydrolysis. The highest concentration of glucose (38.5 g/L, 89% of theoretical yield), after 72 h of enzymatic hydrolysis was obtained from material pretreated with 5% (w/v) HNO3. However, due to the fact that pretreatments were performed under the same conditions (121 °C for 1 h), there is a possibility that other acid (besides HNO3) and alkali reagents can reveal higher efficiency, when optimal conditions for them are used.
The highest ethanol concentration (9.5 g/L) was produced when 5% (w/v) HNO3 was applied. However, almost 30% of the available glucose remained after fermentation, and the yield of ethanol was low (46% of the theoretical yield). Separation of unhydrolyzed solids before fermentation, allows obtaining of significantly higher ethanol yield (77–82% of the theoretical). Regardless of using for fermentation S. cerevisiae yeast strain (Ethanol-Red or Thermosacc Dry), an increase in inoculum size (from 0.5 to 1.5 g/L) did not influence the obtained ethanol yield.

Author Contributions

Conceptualization, U.D.-K., J.B. and P.D.; Formal analysis, U.D.-K. and K.P.-P.; Funding acquisition, J.B. and P.D.; Investigation, U.D.-K., P.P. and K.P.-P.; Methodology, U.D.-K. and P.P.; Project administration, J.B. and P.D.; Resources, J.B. and P.D.; Validation, U.D.-K. and M.B.; Writing—original draft, U.D.-K. and P.P.; Writing—review & editing, U.D.-K. and M.B.

Funding

This research was funded by the Polish National Center for Research and Development under grant number BIOSTRATEG2/296369/5/NCBR/2016.

Conflicts of Interest

The authors declare no conflict of interest.

References

  1. Eyidogan, M.; Kilic, F.C.; Kaya, D.; Coban, V.; Cagman, S. Investigation of Organic Rankine Cycle (ORC) technologies in Turkey from the technical and economic point of view. Renew. Sustain. Energy Rev. 2016, 58, 885–895. [Google Scholar] [CrossRef]
  2. Zecchina, A. Energy sources and carbon dioxide waste. Rend. Fis. Acc. Lincei 2014, 25, 113–117. [Google Scholar] [CrossRef]
  3. Rastogi, M.; Shrivastava, S. Recent advances in second generation bioethanol production: An insight to pretreatment, saccharification and fermentation processes. Renew. Sustain. Energ. Rev. 2017, 80, 330–340. [Google Scholar] [CrossRef]
  4. Wilson, P.; Glithero, N.J.; Ramsden, S.J. Prospects for dedicated energy crop production and attitudes towards agricultural straw use: The case of livestock farmers. Energy Policy 2014, 74, 101–110. [Google Scholar] [CrossRef] [PubMed] [Green Version]
  5. Long, X.H.; Shao, H.B.; Liu, L.; Liu, L.P.; Liu, Z.P. Jerusalem artichoke: A sustainable biomass feedstock for biorefinery. Renew. Sustain. Energ. Rev. 2016, 54, 1382–1388. [Google Scholar] [CrossRef] [Green Version]
  6. Yang, L.; He, Q.S.; Corscadden, K.; Udenigwe, C.C. The prospects of Jerusalem artichoke in functional food ingredients and bioenergy production. Biotechnol. Rep. 2015, 5, 77–88. [Google Scholar] [CrossRef] [PubMed]
  7. Negro, M.J.; Ballesteros, I.; Manzanares, P.; Oliva, J.M.; Sáez, F.; Ballesteros, M. Inulin containing biomass for ethanol production: Carbohydrate extraction and ethanol fermentation. Appl. Biochem. Biotechnol. 2006, 132, 922–932. [Google Scholar] [CrossRef]
  8. Panchev, I.; Delchev, N.; Kovacheva, D.; Slavov, A. Physicochemical characteristics of inulins obtained from Jerusalem artichoke (Helianthus tuberosus L.). Eur. Food Res. Technol. 2011, 233, 889–896. [Google Scholar] [CrossRef]
  9. Roberfroid, M.B. Functional food: Concepts and application to inulin and oligofructose. Br. J. Nutr. 2002, 87, S139–S143. [Google Scholar] [CrossRef] [PubMed]
  10. Wang, Y.Z.; Zou, S.M.; He, M.L.; Wang, C.H. Bioethanol production from the dry powder of Jerusalem artichoke tubers by recombinant Saccharomyces cerevisiae in simultaneous saccharification and fermentation. J. Ind. Microbiol. Biotechnol. 2015, 42, 543–551. [Google Scholar] [CrossRef] [PubMed]
  11. Matías, J.; Encinar, J.M.; González, J.; González, J.F. Optimisation of ethanol fermentation of Jerusalem artichoke tuber juice using simple technology for a decentralised and sustainable ethanol production. Energy Sustain. Dev. 2015, 25, 34–39. [Google Scholar] [CrossRef]
  12. Guan, W.; Xu, G.; Duan, J.; Shi, S. Acetone–Butanol–Ethanol Production from Fermentation of Hot-Water-Extracted Hemicellulose Hydrolysate of Pulping Woods. Ind. Eng. Chem. Res. 2018, 57, 775–783. [Google Scholar] [CrossRef]
  13. Braun, M.; Antonietti, M. A continuous flow process for the production of 2,5-dimethylfuran from fructose using (non-noble metal based) heterogeneous catalysis. Green Chem. 2017, 19, 3813–3819. [Google Scholar] [CrossRef] [Green Version]
  14. Hailong, C.; Qishun, L.; Shuguang, L.; Zhongbao, Z.; Yuguang, D. Helianthus tuberosus—A good kind of biomass source for dimethylfuran production. J. Biotechnol. 2008, 136, 271–272. [Google Scholar] [CrossRef]
  15. Sarchami, T.; Rehmann, L. Optimizing Acid Hydrolysis of Jerusalem Artichoke-Derived Inulin for Fermentative Butanol Production. Bioenergy Res. 2015, 8, 1148. [Google Scholar] [CrossRef]
  16. Kumar, P.; Barrett, D.M.; Delwiche, M.J.; Stroeve, P. Methods for pretreatment of lignocellulosic biomass for efficient hydrolysis and biofuel production. Ind. Eng. Chem. Res. 2009, 48, 3713–3729. [Google Scholar] [CrossRef]
  17. Xiao, W.; Yin, W.; Xia, S.; Ma, P. The study of factors affecting the enzymatic hydrolysis of cellulose after ionic liquid pretreatment. Carbohydr. Polym. 2012, 87, 2019–2023. [Google Scholar] [CrossRef]
  18. Kim, S.; Park, J.M.; Kim, C.H. Ethanol production using whole plant biomass of Jerusalem artichoke by Kluyveromyces marxianus CBS1555. Appl. Biochem. Biotechnol. 2013, 169, 1531–1545. [Google Scholar] [CrossRef] [PubMed]
  19. Kim, S.; Kim, C.H. Evaluation of whole Jerusalem artichoke (Helianthus tuberosus L.) for consolidated bioprocessing ethanol production. Renew. Energy 2014, 65, 83–91. [Google Scholar] [CrossRef]
  20. Khatun, M.M.; Li, Y.H.; Liu, C.G.; Zhao, X.Q.; Bai, F.W. Fed-batch saccharification and ethanol fermentation of Jerusalem artichoke stalks by an inulinase producing Saccharomyces cerevisiae MK01. RSC Adv. 2015, 5, 107112–107118. [Google Scholar] [CrossRef]
  21. Song, Y.; Wi, S.G.; Kim, H.M.; Bae, H.-J. Cellulosic bioethanol production from Jerusalem artichoke (Helianthus Tuberosus L.) using hydrogen peroxide-acetic acid (HPAC) pretreatment. Bioresour. Technol. 2016, 214, 30–36. [Google Scholar] [CrossRef] [PubMed]
  22. Yang, B.; Wyman, C. Pretreatment: The key to Unlocking Low-Cost Cellulosic Ethanol. Biofuels Bioprod. Biorefin. 2008, 2, 26–40. [Google Scholar] [CrossRef]
  23. Mosier, N.; Wyman, C.; Dale, B.; Elander, R.; Lee, Y.Y.; Holtzapple, M.; Ladisch, M. Features of promising technologies for pretreatment of lignocellulosic biomass. Bioresour. Technol. 2005, 96, 673–686. [Google Scholar] [CrossRef]
  24. Sannigrahi, P.; Kim, D.H.; Jung, S.; Ragauskas, A. Pseudo-lignin and pretreatment chemistry. Energy Environ. Sci. 2011, 4, 1306–1310. [Google Scholar] [CrossRef]
  25. Digman, M.F.; Shinners, K.J.; Casler, M.D. Optimizing on-farm pretreatment of perennial grasses for fuel ethanol production. Bioresour. Technol. 2010, 101, 5305–5314. [Google Scholar] [CrossRef] [PubMed]
  26. Karapatsia, A.; Pappas, I.; Penloglou, G.; Kotrotsiou, O.; Kiparissides, C. Optimization of dilute acid pretreatment and enzymatic hydrolysis of Phalaris aquatica L. lignocellulosic biomass in batch and fed-batch processes. Bioenergy Res. 2017, 10, 225–236. [Google Scholar] [CrossRef]
  27. Deshavath, N.N.; Dasu, V.V.; Goud, V.V.; Rao, P.S. Development of dilute sulfuric acid pretreatment method for the enhancement of xylose fermentability. Biocatal. Agric. Biotechnol. 2017, 11, 224–230. [Google Scholar] [CrossRef]
  28. Rodíguez-Chong, A.; Ramírez, J.A.; Garrote, G.; Vázquez, M. Hydrolysis of sugar cane bagasse using nitric acid: A kinetic assessment. J. Food Eng. 2004, 61, 143–152. [Google Scholar] [CrossRef]
  29. Zhang, R.; Lu, X.; Sun, Y.; Wang, X.; Zhang, S. Modeling and optimization of dilute nitric acid hydrolysis on corn stover. J. Chem. Technol. Biotechnol. 2011, 86, 306–314. [Google Scholar] [CrossRef]
  30. Kim, I.; Lee, B.; Park, J.; Choi, S.; Han, J. Effect of nitric acid on pretreatment and fermentation for enhancing ethanol production of rice straw. Carbohydr. Polym. 2014, 99, 563–567. [Google Scholar] [CrossRef] [PubMed]
  31. Maurya, D.P.; Singla, A.; Negi, S. An overview of key pretreatment processes for biological conversion of lignocellulosic biomass to bioethanol. 3 Biotech 2015, 5, 597–609. [Google Scholar] [CrossRef] [PubMed] [Green Version]
  32. Guan, W.; Shi, S.; Blersch, D. Effects of Tween 80 on fermentative butanol production from alkali-pretreated switchgrass. Biochem. Eng. J. 2018, 135, 61–70. [Google Scholar] [CrossRef]
  33. Umagiliyage, A.L.; Choudhary, R.; Liang, Y.; Haddock, J.; Watson, D.G. Laboratory scale optimization of alkali pretreatment for improving enzymatic hydrolysis of sweet sorghum bagasse. Ind. Crops Prod. 2015, 74, 977–986. [Google Scholar] [CrossRef] [Green Version]
  34. Berłowska, J.; Pielech-Przybylska, K.; Balcerek, M.; Dziekońska-Kubczak, U.; Patelski, P.; Dziugan, P.; Kręgiel, D. Simultaneous saccharification and fermentation of sugar beet pulp for efficient bioethanol production. BioMed Res. Int. 2016, 2016, 3154929. [Google Scholar] [CrossRef]
  35. Gonzales, R.R.; Sivagurunathan, P.; Kim, S.H. Effect of severity on dilute acid pretreatment of lignocellulosic biomass and the following hydrogen fermentation. Int. J. Hydrogen Energy 2016, 41, 21678–21684. [Google Scholar] [CrossRef]
  36. McIntosh, S.; Vancov, T. Enhanced enzyme saccharification of Sorghum bicolor straw using dilute alkali pretreatment. Bioresour. Technol. 2010, 101, 6718–6727. [Google Scholar] [CrossRef] [PubMed]
  37. Sluiter, A.; Hames, B.; Hyman, D.; Payne, C.; Ruiz, R.; Scarlata, C.; Sluiter, J.; Templeton, D. Determination of Total Solids in Biomass and Total Dissolved Solids in Liquid Process Samples; Technical Report No. NREL/TP-510-42621; NREL: Golden, CO, USA, 2008.
  38. Kurschner, K.; Hoffer, A. Cellulose and cellulose derivatives. Fresenius J. Anal. Chem. 1993, 92, 145–154. [Google Scholar] [CrossRef]
  39. Arasimovich, V.V.; Ermakov, A.I. Measurement of the total content of hemielluloses. In Methods for Biochemical Studies of Plants; Ermakov, A.I., Ed.; Agropromizdat: Saint Petersburg, Russia, 1987; pp. 164–165. [Google Scholar]
  40. Sluiter, A.; Hames, B.; Ruiz, R.; Scarlata, C.; Sluiter, J.; Templeton, D.; Crocker, D. Determination of Structural Carbohydrates and Lignin in Biomass; Technical Report No. NREL/TP-510-42618; NREL: Golden, CO, USA, 2012.
  41. Ma, S.; Wang, H.; Wang, Y.; Bu, H.; Bai, J. Bio-hydrogen production from cornstalk wastes by orthogonal design method. Renew. Energy 2011, 36, 709–713. [Google Scholar] [CrossRef]
  42. Imman, S.; Arnthong, J.; Burapatana, V.; Champreda, V.; Laosiripojana, N. Fractionation of rice straw by a single-step solvothermal process: Effects of solvents, acid promoters, and microwave treatment. Renew. Energy 2015, 83, 663–673. [Google Scholar] [CrossRef]
  43. Valdez-Vazquez, I.; Pérez-Rangel, M.; Tapia, A.; Buitrón, G.; Molina, C.; Hernández, G.; Amaya-Delgado, L. Hydrogen and butanol production from native wheat straw by synthetic microbial consortia integrated by species of Enterococcus and Clostridium. Fuel 2015, 159, 214–222. [Google Scholar] [CrossRef]
  44. Hendriks, A.T.W.M.; Zeeman, G. Pretreatments to enhance the digestibility of lignocellulosic biomass. Bioresour. Technol. 2009, 100, 10–18. [Google Scholar] [CrossRef] [PubMed]
  45. Jönsson, L.J.; Martín, C. Pretreatment of lignocellulose: formation of inhibitory by-products and strategies for minimizing their effects. Bioresour. Technol. 2016, 199, 103–112. [Google Scholar] [CrossRef] [PubMed]
  46. Herrera, A.; Tellez-Luis, S.J.; Gonzalez-Cabriales, J.J.; Ramírez, J.A.; Vazquez, M. Effect of the hydrochloric acid concentration on the hydrolysis of sorghum straw at atmospheric pressure. J. Food Eng. 2004, 63, 103–109. [Google Scholar] [CrossRef]
  47. Chang, V.S.; Holtzapple, M.T. Fundamental factors affecting biomass enzymatic reactivity. Appl. Biochem. Biotechnol. 2000, 84–86, 5–37. [Google Scholar] [CrossRef]
  48. Kim, D.; Orrego, D.; Ximenes, E.A.; Ladisch, M.R. Cellulose conversion of corn pericarp without pretreatment. Bioresour. Technol. 2017, 245, 511–517. [Google Scholar] [CrossRef] [PubMed]
  49. Ximenes, E.; Kim, Y.; Mosier, N.; Dien, B.; Ladisch, M. Inhibition of cellulases by phenols. Enzym. Microb. Technol. 2010, 46, 170–176. [Google Scholar] [CrossRef]
  50. Ximenes, E.; Kim, Y.; Mosier, N.; Dien, B.; Ladisch, M. Deactivation of cellulases by phenols. Enzym. Microb. Technol. 2011, 48, 54–60. [Google Scholar] [CrossRef] [PubMed]
  51. Martín, C.; García, A.; Schreiber, A.; Puls, J.; Saake, B. Combination of water extraction with dilute-sulphuric acid pretreatment for enhancing the enzymatic hydrolysis of Jatropha curcas shells. Ind. Crop. Prod. 2015, 64, 233–241. [Google Scholar] [CrossRef]
  52. Cheng, Y.S.; Zheng, Y.; Yu, C.W.; Dooley, T.M.; Jenkins, B.M.; Gheynst, J.S.V. Evaluation of high solids alkaline pretreatment of rice straw. Appl. Biochem. Biotechnol. 2010, 162, 1768–1784. [Google Scholar] [CrossRef] [PubMed]
  53. Ibrahim, M.M.; El-Zawawy, W.K.; Abdel-Fattah, Y.R.; Soliman, N.A.; Agblevor, F.A. Comparison of alkaline pulping with steam explosion for glucose production from rice straw. Carbohydr. Polym. 2011, 83, 720–726. [Google Scholar] [CrossRef]
  54. Wang, Z.; Keshwani, D.R.; Redding, A.P.; Cheng, J.J. Sodium hydroxide pretreatment and enzymatic hydrolysis of coastal Bermuda grass. Bioresour. Technol. 2010, 101, 3583–3585. [Google Scholar] [CrossRef] [PubMed] [Green Version]
  55. Jönsson, L.J.; Björn, A.; Nilvebrant, N.O. Bioconversion of Lignocellulose: Inhibitors and Detoxification. Biotechnol. Biofuels 2013, 6, 16. [Google Scholar] [CrossRef] [PubMed]
  56. Larsson, S.; Palmqvist, E.; Hahn-Hägerdal, B.; Tengborg, C.; Stenberg, K.; Zacchi, G.; Nilvebrant, N.O. The generation of fermentation inhibitors during dilute acid hydrolysis of softwood. Enzym. Microb. Technol. 1999, 24, 151–159. [Google Scholar] [CrossRef]
  57. Farías-Sánchez, J.C.; Velázquez-Valadez, U.; Pineda-Pimentel, M.G.; López-Miranda, J.; Castro-Montoya, A.J.; Carrillo-Parra, A.; Vargas-Santillán, A.; Rutiaga-Quiñones, J.G. Simultaneous Saccharification and Fermentation of Pine Sawdust (Pinus pseudostrobus L.) Pretreated with Nitric Acid and Sodium Hydroxide for Bioethanol Production. Bioresources 2016, 12, 1052–1063. [Google Scholar] [CrossRef]
  58. Luo, C.; Brink, D.L.; Blanch, H.W. Identification of potential fermentation inhibitors in conversion of hybrid poplar hydrolysate to ethanol. Biomass Bioenergy 2002, 22, 125–138. [Google Scholar] [CrossRef]
  59. Modelska, M.; Berlowska, J.; Kregiel, D.; Cieciura, W.; Antolak, H.; Tomaszewska, J.; Binczarski, M.; Szubiakiewicz, E.; Witonska, I.A. Concept for Recycling Waste Biomass from the Sugar Industry for Chemical and Biotechnological Purposes. Molecules 2017, 22, 1544. [Google Scholar] [CrossRef] [PubMed]
  60. Adeboye, P.T.; Bettiga, M.; Olsson, L. The chemical nature of phenolic compounds determines their toxicity and induces distinct physiological responses in Saccharomyces cerevisiae in lignocellulose hydrolysates. AMB Express 2014, 4, 46. [Google Scholar] [CrossRef] [PubMed]
  61. Tutt, M.; Kikas, T.; Olt, J. Influence of different pretreatment methods on bioethanol production from wheat straw. Agron. Res. 2012, S1, 269–276. [Google Scholar]
  62. Azhar, S.H.M.; Abdulla, R.; Jambo, S.A.; Marbawi, H.; Gansau, J.A.; Faik, A.A.M.; Rodrigues, K.F. Yeasts in sustainable bioethanol production: A review. Biochem. Biophys. Rep. 2017, 10, 52–61. [Google Scholar] [CrossRef]
  63. Häggström, C.; Rova, U.; Brandberg, T.; Hodge, D. Integration of Ethanol Fermentation with Second Generation Biofuels Technologies. In Biorefineries: Integrated Biochemical Processes for Liquid Biofuels; Qureshi, N., Hodge, D., Vertès, A., Eds.; Elsevier: Amsterdam, The Netherlands, 2014; Chapter 8; pp. 161–187. ISBN 978-0-444-59498-3. [Google Scholar]
  64. Monot, F.; Duplan, J.L.; Alazard-Toux, N.; His, S. Biofuels. In Renewable Energies; Sabonnadière, J.C., Ed.; ISTE Ltd.: London, UK; John Wiley & Sons, Inc.: Hoboken, NY, USA, 2009; Chapter 10; pp. 329–395. ISBN 9781848211353. [Google Scholar]
  65. Cannella, D.; Jørgensen, H. Do new cellulolytic enzyme preparations affect the industrial strategies for high solids lignocellulosic ethanol production? Biotechnol. Bioeng. 2014, 111, 59–68. [Google Scholar] [CrossRef] [PubMed]
  66. Balcerek, M.; Pielech-Przybylska, K.; Dziekońska-Kubczak, U.; Patelski, P.; Strąk, E. Fermentation results and chemical composition of agricultural distillates obtained from rye and barley grains and the corresponding malts as a source of amylolytic enzymes and starch. Molecules 2016, 21, 1320. [Google Scholar] [CrossRef] [PubMed]
  67. Antolak, H.; Czyzowska, A.; Sakač, M.; Mišan, A.; Đuragić, O.; Kregiel, D. Phenolic compounds contained in little-known wild fruits as antiadhesive agents against the beverage-spoiling bacteria Asaia spp. Molecules 2017, 22, 1256. [Google Scholar] [CrossRef] [PubMed]
Figure 1. Formation of glucose during enzymatic hydrolysis of JAS pretreated with (a) hydrochloric acid, (b) sodium hydroxide, (c) sulfuric acid, (d) potassium hydroxide and (e) nitric acid at concentration of 2% (blue square) or 5% (purple triangle), in relation to untreated JAS (orange diamond). The dotted lines indicate the theoretical maximum glucose concentration that can be achieved for 2% (blue) and 5% (purple) acid/alkali concentrations.
Energies 11 02153 g001
Figure 2. Concentration of ethanol in hydrolysates pretreated using different reagents after 72 h of fermentation and concentration of residual glucose after fermentation. Different lower-case letters, indicate significant differences (p < 0.05) between the mean values of the ethanol concentration (Tukey’s post-hoc test). Different capital letters, indicate significant differences (p < 0.05) between the mean values of the residual glucose concentration (Tukey’s post-hoc test).
Energies 11 02153 g002
Figure 3. Yield of ethanol (% of theoretical) from hydrolysates pretreated using different reagents, after 72 h of fermentation. Different lower-case letters, indicate significant differences (p < 0.05) between the mean values of the ethanol yield (Tukey’s post-hoc test).
Energies 11 02153 g003
Figure 4. Yield of ethanol (% of theoretical) from nitric acid pretreated hydrolysates fermented with the use of different yeast strains and inoculum. Different lower-case letters, indicate significant differences (p < 0.05) between the mean values of the ethanol yield (Tukey’s post-hoc test).
Energies 11 02153 g004
Table 1. Solids recovery and chemical composition of pretreated Jerusalem artichoke stalks (JAS).
Pretreatment MethodSolid Recovery (%)CelluloseHemicelluloseLignin
(% d.m.)
2% HCl74.75 ± 2.13e 156.03 ± 1.37bcd5.41 ± 0.41bcd23.66 ± 1.66bcd
5% HCl59.51 ± 2.01ab54.53 ± 1.99bc2.31 ± 0.22abc25.74 ± 1.20d
2% H2SO473.52 ± 1.82d53.09 ± 2.46b4.93 ± 1.02bcd24.98 ± 2.35cd
5% H2SO460.27 ± 1.98ab42.16 ± 1.80a1.91 ± 0.23ab27.41 ± 1.47d
2% HNO356.62 ± 1.18a60.31 ± 1.67cde5.78 ± 0.27cd22.96 ± 1.09bcd
5% HNO366.27 ± 1.42c77.27 ± 1.32f1.31 ± 0.16a20.70 ± 2.02bc
2% NaOH74.83 ± 2.65d59.30 ± 1.97cde9.64 ± 0.66e6.47 ± 1.22a
5% NaOH66.29 ± 2.03c62.75 ± 2.34e8.17 ± 0.70de4.77 ± 0.36a
2% KOH72.48 ± 1.66d56.28 ± 1.98bcd10.43 ± 1.50e6.90 ± 0.93a
5% KOH64.86 ± 2.02bc59.98 ± 2.35de8.70 ± 0.61de5.23 ± 0.64a
1 Different lower-case letters in the columns indicate a significant difference (p < 0.05), as analyzed by the Tukey’s post-hoc test.
Table 2. Concentration of sugars in liquid fraction after acid or alkaline pretreatment of JAS, with hemicellulose and cellulose solubilization rate.
Pretreatment MethodCellobioseGlucoseXyloseArabinoseHemicellulose Solubilization Rate (%)Cellulose Solubilization Rate (%)
(g/L)
2% HCl0.41 ± 0.04bcd 12.20 ± 0.19a9.38 ± 0.81b0.53 ± 0.05ab68.76 ± 5.92b5.64 ± 0.49a
5% HCl0.61 ± 0.12de2.73 ± 0.53a11.96 ± 1.32bc0.84 ± 0.16c87.70 ± 7.04bc7.02 ± 1.36a
2% H2SO40.64 ± 0.09e2.63 ± 0.39a10.84 ± 1.21bc0.47 ± 0.07ab79.52 ± 6.72bc6.76 ± 1.00a
5% H2SO40.54 ± 0.06cde2.80 ± 0.30a11.35 ± 0.90bc0.68 ± 0.07bc83.23 ± 5.81bc7.19 ± 0.76a
2% HNO30.09 ± 0.01a2.45 ± 0.22a9.41 ± 0.85b0.55 ± 005ab69.01 ± 6.26b6.30 ± 0.57a
5% HNO31.12 ± 0.10f5.70 ± 0.52b13.20 ± 1.19c1.29 ± 0.12d96.77 ± 8.75c14.66 ± 1.33b
2% NaOH0.42 ± 0.05bcd2.95 ± 0.36an.d. 20.62 ± 0.07abc0.00 ± 0.00a7.60 ± 0.92a
5% NaOH0.23 ± 0.01ab2.12 ± 0.07a0.29 ± 0.01a0.56 ± 0.02ab2.15 ± 0.07a5.45 ± 0.17a
2% KOH0.37 ± 0.03bc2.51 ± 0.18a0.13 ± 0.01a0.43 ± 0.03a0.95 ± 0.07a6.45 ± 0.47a
5% KOH0.30 ± 0.02abc2.99 ± 0.17a0.31 ± 0.02a0.52 ± 0.03abc2.26 ± 0.13a7.69 ± 0.44a
1 Different lower-case letters in the columns indicate a significant difference (p < 0.05), as analyzed by the Tukey’s post-hoc test. 2 n.d.—not detected.
Table 3. Concentration of inhibitors in liquid fraction after acid or alkaline pretreatment of JAS.
Pretreatment MethodFormic AcidAcetic AcidTPC 1HMF 2Furfural
(g/L)(mg/L)
2% HCl0.19 ± 0.02ab 31.16 ± 0.10a0.69 ± 0.06b201.61 ± 17.34c95.81 ± 8.24a
5% HCl0.32 ± 0.06abc2.92 ± 0.57b0.55 ± 0.05a136.62 ± 26.55bc523.79 ± 81.79c
2% H2SO40.13 ± 0.02a2.80 ± 0.41b0.87 ± 0.12c739.26 ± 108.93d95.49 ± 14.07a
5% H2SO40.36 ± 0.04bc3.25 ± 0.34bc1.08 ± 0.08de220.65 ± 23.36c293.09 ± 31.03b
2% HNO30.48 ± 0.04c1.76 ± 0.16a0.51 ± 0.06a153.95 ± 13.97bc8.33 ± 0.75a
5% HNO31.18 ± 0.11d3.19 ± 0.29bc0.46 ± 0.04a14.00 ± 1.26a41.63 ± 3.76a
2% NaOH1.16 ± 0.14d3.42 ± 0.41bc1.39 ± 0.11f1.42 ± 0.17a0.98 ± 0.12a
5% NaOH2.86 ± 0.09f5.02 ± 0.16de1.12 ± 0.05e2.46 ± 0.07a16.43 ± 0.52a
2% KOH0.97 ± 0.07d4.07 ± 0.30cd1.23 ± 0.10e1.04 ± 0.07a1.94 ± 0.08a
5% KOH1.97 ± 0.11e6.05 ± 0.34e1.25 ± 0.11ef2.92 ± 0.17a10.17 ± 0.57a
1 TPC—total phenolics concentration. 2 HMF—hydroxymethylfurfural. 3 Different lower-case letters in the columns indicate a significant difference (p < 0.05), as analyzed by the Tukey’s post-hoc test.
Table 4. Concentration of monomeric sugars and glucose yield after hydrolysis of acid- or alkali-pretreated JAS.
Pretreatment MethodCellobioseGlucoseXyloseArabinoseGlucose Yield (%)
(g/L)
Untreated0.01 ± 0.001a 12.62 ± 0.36a1.42 ± 0.28ab0.05 ± 0.01c13.27 ± 1.21a
2% HCl0.05 ± 0.01ab15.70 ± 1.84b1.53 ± 0.45ab0.02 ± 0.00ab50.81 ± 1.71c
5% HCl0.05 ± 0.02ab16.99 ± 2.50bc1.54 ± 0.16ab0.01 ± 0.01a55.57 ± 1.81cde
2% H2SO40.02 ± 0.01a12.47 ± 0.88b1.90 ± 0.29abn.d. 241.64 ± 1.48b
5% H2SO40.04 ± 0.01ab13.55 ± 1.99b1.28 ± 0.14a0.01 ± 0.00a57.64 ± 1.55de
2% HNO30.06 ± 0.10ab17.87 ± 1.09bc2.56 ± 0.46bc0.01 ± 0.00a53.90 ± 1.33cd
5% HNO30.21 ± 0.05b38.47 ± 2.97d2.68 ± 0.09cn.d.89.32 ± 2.24g
2% NaOH0.10 ± 0.04ab18.85 ± 2.88bc6.83 ± 0.44e0.04 ± 0.01c57.53 ± 1.67de
5% NaOH0.10 ± 0.03ab23.63 ± 4.07c4.99 ± 0.60dn.d.67.60 ± 1.51f
2% KOH0.01 ± 0.00a16.33 ± 1.64b6.69 ± 0.68e0.02 ± 0.00ab52.14 ± 1.94c
5% KOH0.01 ± 0.00ab20.67 ± 2.52bc8.47 ± 1.03e0.02 ± 0.00ab62.27 ± 1.68ef
1 Different lower-case letters in the columns indicate a significant difference (p < 0.05), as analyzed by the Tukey’s post-hoc test. 2 n.d.—not detected.
Table 5. Fermentation inhibitors in acid and alkali pretreated JAS hydrolysates.
Pretreatment MethodFormic AcidAcetic AcidHMF 1FurfuralTPC 2
(mg/L)
Untreatedn.d. 31.11 ± 0.09an.d.n.d.n.d.
2% HCl6.41 ± 0.65bc 429.99 ± 3.05f2.87 ± 0.22ab7.78 ± 0.48e162.11 ± 19.15cde
5% HCl8.26 ± 0.66cd35.04 ± 2.25g3.40 ± 0.38b6.68 ± 0.44de178.09 ± 13.34ef
2% H2SO412.29 ± 0.66e12.36 ± 0.82bc12.29 ± 1.41d5.40 ± 0.42bcd173.83 ± 12.56de
5% H2SO48.11 ± 0.55cd37.44 ± 1.34g5.26 ± 0.66c6.18 ± 0.72cde155.96 ± 15.42cd
2% HNO314.60 ± 0.76f128.58 ± 2.98i2.54 ± 0.25ab4.53 ± 0.12b196.91 ± 8.27f
5% HNO39.48 ± 1.04d68.76 ± 2.97hn.d.4.93 ± 0.90bc80.63 ± 8.11a
2% NaOH19.62 ± 1.11g14.09 ± 1.27cdn.d.6.39 ± 0.41cde128.04 ± 18.20b
5% NaOH22.23 ± 0.72h8.31 ± 0.65bn.d.2.83 ± 0.31a161.34 ± 14.13cde
2% KOH2.57 ± 0.25a18.56 ± 1.08de2.75 ± 0.35ab7.15 ± 0.73e151.21 ± 19.11c
5% KOH5.37 ± 0.99b20.32 ± 1.68e1.86 ± 0.24a6.86 ± 0.75de170.12 ± 17.15cde
1 HMF—hydroxymethylfurfural. 2 TPC—total phenolics concentration. 3 n.d.—not detected. 4 Different lower-case letters in the columns indicate a significant difference (p < 0.05), as analyzed by the Tukey’s post-hoc test.

