Article

An Experimental and Detailed Kinetics Modeling Study of Norbornadiene in Hydrogen and Methane Mixtures: Ignition Delay Time and Spectroscopic CO Measurements

J. Mike Walker ’66 Department of Mechanical Engineering, Texas A&M University, 3123 TAMU, College Station, TX 77843, USA
*
Author to whom correspondence should be addressed.
Energies 2023, 16(21), 7278; https://doi.org/10.3390/en16217278
Submission received: 11 September 2023 / Revised: 5 October 2023 / Accepted: 19 October 2023 / Published: 26 October 2023
(This article belongs to the Special Issue Advances in Fuels and Combustion)

Abstract

:
High-energy-density compounds such as norbornadiene (NBD) are being considered as potential cost-effective fuel additives, or partial replacements, for high-speed propulsion applications. To assess the ability of NBD to influence basic fuel reactivity enhancement and to build a database for developing future NBD kinetics models, ignition delay times were measured in two shock-tube facilities at Texas A&M University for H2/O2, CH4/O2, H2/NBD/O2, and CH4/NBD/O2 mixtures (ϕ = 1) that were highly diluted in argon. The reflected-shock temperatures ranged from 1014 to 2227 K, and the reflected-shock pressures remained near 1 atm for all of the experiments, apart from the hydrogen mixtures, which were also tested near 7 atm, targeting the second-explosion limit. The molar concentrations of NBD were supplemented to the baseline mixtures representing 1–2% of the fuel by volume. A chemiluminescence diagnostic was used to track the time history of excited hydroxyl radical (OH*) emission, which was used to define the ignition delay time at the sidewall location. Spectroscopic CO data were also obtained using a tunable quantum cascade laser to complement both the ignition and the chemiluminescence data. The CH4/O2 mixtures containing NBD demonstrated reduced ignition delay times, with a pronounced effect at lower temperatures. Conversely, this additive increased the ignition delay time dramatically in the H2/O2 mixture, which was attributed to changes in the fundamental chemistry with the introduction of molecules containing carbon bonds, which require stronger activation energies for ignition. Correlations were developed to predict the ignition delay time, which depends on species concentration, temperature, and pressure. Additionally, one tentative mechanism was tested, combining base chemistry from NUIGMech 1.1 with pyrolysis and oxidation reactions for NBD using the recent efforts from experimental and theoretical literature studies. The numerical predictions show that the rapid decomposition of NBD provides a pool of active H-radicals, significantly increasing the reactivity of methane. This study represents the first set of gas-phase ignition and CO time-history data measured in a shock tube for hydrogen and methane mixtures containing the additive NBD.

1. Introduction

With a heightened interest in long-range commercial propulsion, new high-energy-density fuel additives, or even replacements, are sought after for their ability to promote the ignition kinetics of common liquid rocket fuels. NBD is a colorless liquid with a H/C ratio of 1.14, a considerable energy density, and a relatively low vapor pressure (25 torr at 25 °C) [1]. While sharing the same chemical formula as toluene (C7H8), NBD has a unique structure, characterized by a cage containing two carbon–carbon double bonds, as illustrated in Figure 1. The tendency of this molecule to promote ignition is important for both rocket and air-breathing engines, as the rapid combustion of hydrocarbon fuels causes energy to be released or transferred at a faster rate, resulting in an improved performance. This compound has also seen use in photoisomerization processes by undergoing a transformation into quadricyclane (QC) [2,3]. Through this conversion, 89 kJ of photochemical energy is stored per 1 mol of QC produced, indicating that this photoisomerization process has potential as a method to advance solar energy storage [4,5]. It is also important to understand the combustion behavior of NBD, as it acts as a primary compound in the synthesis of fuels and other important species, such as QC, that play a significant role in energy storage processes.
The fundamental kinetics of this additive alone are generally unexplored and poorly understood, as only a limited temperature range of pyrolysis has been studied. Experiments focusing on the decomposition of NBD date back to 1975, with Walsh and Wells using a Pyrex reaction vessel and a gas chromatograph at temperatures of around 650 K [6]. The NBD C5H6 (cyclopentadiene) + C2H2 and NBD CHT (1,3,5-cycloheptatriene) + C6H5CH3 (toluene) decomposition reactions were investigated, leading to rate expressions from an Arrhenius plot. Li and Anderson examined the pyrolysis of NBD up to 1000 K using a micro-flow tube reactor and mass spectroscopy [7]. It was discovered that pyrolysis takes place at around 600 K, and the primary decomposition pathways are through acetylene elimination and isomerization to toluene. Recently, Jin et al. examined the pyrolysis of norbornadiene in a jet-stirred reactor for temperatures in the range of 560–1100 K at atmospheric pressure [8]. Diagnostics such as spectrometry and gas chromatography allowed 37 products and intermediate species to be identified, ultimately leading to the formation of a kinetics model employing 264 species and 1259 reactions. The Jin et al. model is the most current pyrolysis model for NBD.
NBD oxidation was recently investigated theoretically by Chen et al. [9], focusing on H-atom abstraction and related radical decomposition reactions using ab-initio calculations. No gas-phase ignition data exist in the literature regarding the presence of NBD in hydrogen and methane mixtures. The present study aimed to provide some of the first ignition delay time and spectroscopic CO data for mixtures containing NBD using a shock tube in order to further develop kinetic models for this compound. Combining spectroscopic and chemiluminescence results provides a distinct advantage over the quantitative nature of the previous results, allowing further constraints of the models. Presented first here is an overview of the experimental methodology for both types of shock-tube experiments. A summary of the preliminary chemical kinetics model assembled for this study is then provided, followed by a presentation of the results in the form of model comparisons and data correlations.

2. Experimental Methodology

2.1. Shock-Tube Facilities

The High-Pressure Shock Tube (HPST) and the Aerospace Shock Tube (AST) facilities in the TEES Turbomachinery Laboratory at Texas A&M University (TAMU) were utilized to perform all of the high-temperature experiments for the H2/O2, H2/NBD/O2, CH4/O2, and CH4/NBD/O2 mixtures in this study. The HPST is composed of a 2.51-m long driver section with an internal diameter of 7.62 cm and a 4.92-m long driven section with a 15.24-cm internal diameter. The AST possesses a 3.13-m long driver with an internal diameter of 7.62 cm and a 7.33-m driven section with a 16.20-cm internal diameter. In both apparatuses, the driver and driven sections are separated by a breech assembly, which houses the diaphragm used to initiate the pressure-driven shock waves. Polycarbonate Lexan® (USA) diaphragms, ranging in thickness from 0.25 to 1.0 mm, were used to produce both atmospheric and intermediate test pressures. Ultrahigh purity helium, supplied by Praxair, was used as the primary driver gas for all experiments, due to its low molecular weight and high sound speed, which produces strong, efficient shock waves. In some cases, nitrogen was used to tailor the driver gas in an effort to reduce the shock strength and produce desirable test conditions behind the reflected shock wave.
The incident-shock wave (ISW) velocity was detected using ultra-fast response (<1 μs) PCB P113B22 piezoelectric pressure transducers located at fixed intervals along the last 1.44 m of the driven section. The last pressure transducer is located 1.6 cm from the endwall so that the ISW velocity can be reliably inferred to the endwall [10]. The ISW velocity is calculated by dividing the measured distance between each pressure transducer and the time between each pressure response. The conditions behind the reflected shock wave were calculated using the 1-D normal shock equations, with knowledge of the test gas initial conditions and the measured incident shock speed [11]. A primary advantage of this method is that the uncertainty in calculating the reflected-shock conditions is limited to the uncertainty associated with the velocity measurement. Imposing the ISW velocity to the endwall was shown to reduce the error in calculating T 5 to less than 10 K at 1800 K (<0.56%) and about 20 K at 3500 K (<0.58%) [12]. The typical uncertainties in T5 and P5 in the shock tubes at TAMU are 0.8% and 1.0%, respectively [13]. Pressure-time-history and chemiluminescence signals were sent to an onboard data acquisition system and analyzed through a computer-based oscilloscope from GaGe possessing 16 channels. To ensure purity during each test, both the driver and driven sections are evacuated to pressures of less than 10−8 atm before the start of an experiment.
Fuel-oxidizer mixtures were prepared in separate stainless-steel mixing tanks with volumes of 55.6 L (HPST) and 30.3 L (AST), respectively. Emphasis was placed on mixing tank cleanliness, as the mixing tank can introduce impurities and affect the ignition delay time of highly dilute H2/O2 mixtures [14]. The test gases implemented in this work include ultrahigh purity (UHP) H2 (99.9%), UHP CH4 (99.9%), UHP O2 (99.9%), and UHP Ar (99.9%). The H2, CH4, and Ar were supplied by Praxair, and the O2 was supplied by AirGas. The NBD was supplied by ThermoFischer Scientific, with a purity of 97%, stabilized with 250 ppm Butylated Hydroxytoluene (BHT). In the HPST mixing tank, the partial pressures of each gas were measured using two MKS Baratron capacitance manometers, with ranges of 1–100 torr and 1–1000 torr, respectively, and an ESI transducer for pressures exceeding 1000 torr. In the AST mixing tank, two MKS Baratron capacitance monometers, rated for 1–10 torr and 1–1000 torr, were used. The final mixture pressures were 45–180 psi (2327–9308 torr) to ensure enough mixture was available to complete a set of experiments. Table 1 lists all of the mixtures prepared in this study, with the mole fraction of each species and equivalence ratio included. The remainder of the paper communicates the test gas using the mixture number designation in Table 1. The dilution level (>95%) in this test matrix was chosen in an effort to reduce the pressure and temperature rise associated with the energy release following ignition behind the reflected shock wave.

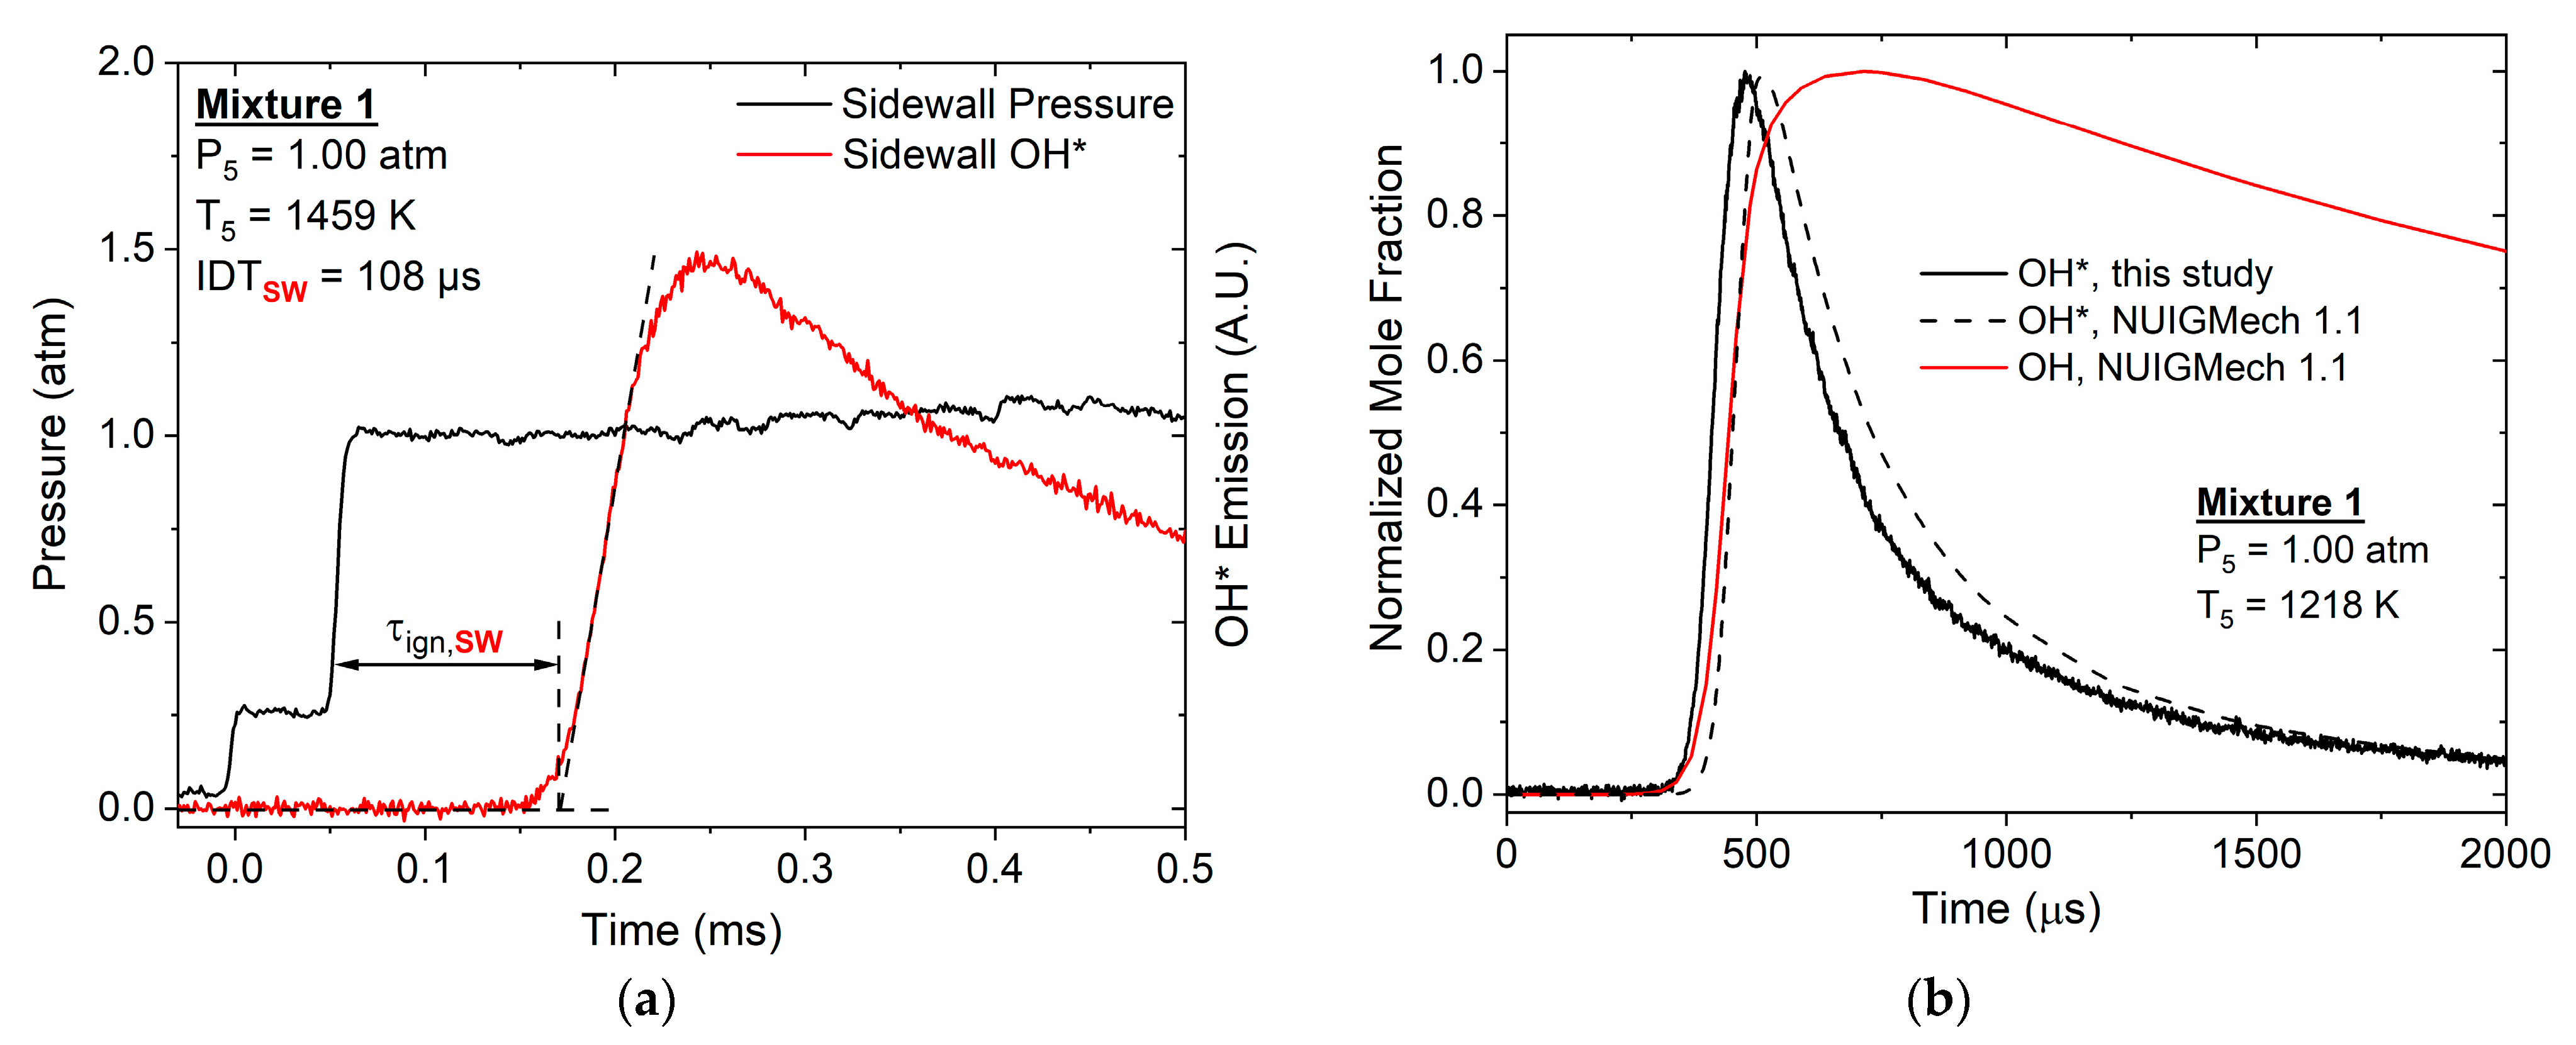
2.2. Chemiluminescnece Emission

During a combustion event, the A2Σ+ → X2Π transition of OH* to its ground state produces light in the ultraviolet band near 307 nm, which is used to define the onset of ignition. Chemiluminescence from the electronically excited hydroxyl radical, OH*, was allowed to pass through ports located at the shock-tube sidewall, which are outfitted with a sapphire window for optical access. A 1-mm (or less) slit was placed directly in front of the windows to enhance the spatial resolution of the emitted light over a smaller area compared to the surface area of the optical window. The emitted light was then focused onto a 307-nm filter with a 10-nm full width at half maximum (FWHM). A Thor Labs concave focusing mirror was used at the sidewall to redirect the OH* beam path to a Hamamatsu photomultiplier tube in custom-made housing where the ultraviolet light was detected, and the signal was sent to the onboard data acquisition system. These data, along with the sidewall pressure time histories, were used to define the ignition delay time in this study (see Figure 2a). The raw OH* emission signal for mixture 1 is compared to the OH* kinetics sub mechanism present in NUIGMech 1.1, as pictured in Figure 2b [15]. Good agreement is observed between the measured and predicted chemiluminescence. NUIGMech 1.1 was used to demonstrate the discrepancy between the time histories of the excited hydroxyl radical (A2Σ+) and the ground state OH (X2Π) [16]. The rise in normalized mole fraction is similar in both species; however, the slopes and peaks occur at different times, while the decline in OH* emission occurs rapidly compared to the ground state.

2.3. CO Laser Diagnostic

The CO time histories were measured using a tunable quantum cascade laser (QCL) producing light near 4.8 μm to probe the P(20) line of the 1 0 fundamental band. The QCL was tuned to the peak of the P(20) transition at 2059.91 cm−1, targeting the following conditions: 30 °C and 196 mA in the thermoelectric controller. A maximum absorption strength was monitored before each experiment by centering the laser wavelength using a removable cell containing a mixture of 10/90% CO/Ar. This CO quantification technique works in relative isolation from H2O and CO2 absorption [17], and the uncertainty of the measurement is estimated to be around 3.8% [18]. The laser light was split into two beams using strategically placed gold mirrors, and their intensities were monitored using infrared, cryogenically cooled photovoltaic detectors. The time-resolved incident intensity (I0) was directed to the first detector as a referenced intensity, while the time-resolved transmitted intensity (It) was allowed to pass through the sapphire windows of the shock tube, and, therefore, the reacting gases, to terminate in the second detector producing CO signals during the experiment. Before the beams approached the bypass filters, irises, and lenses (a direct-absorption setup), and reached the detectors, careful attention was paid to the dark current phenomenon from the detectors themselves, and the associated offsets were collected to correct the CO profiles during the post-processing stage [19]. The CO mole fractions from the experimental time histories were processed with these two intensities based on the Beer–Lambert relation, defined as follows:
I t / I 0 = e x p k ν P L X C O
where k v is the absorption coefficient, P is the partial pressure, L is the path length (distance between the optical sapphire windows from the shock-tube), and X C O is the CO mole fraction.
The absorption coefficient, k v , was characterized for a temperature range of 1200 to 2700 K using separate experiments. A mixture of 2000 ppm CO in 0.2/0.798 He/Ar was studied behind the reflected shock waves at atmospheric pressure to calibrate the absorption coefficient temperature dependence by determining the correlation between the signal (raw voltage) with the known concentration of CO. The initial X C O was then used to obtain the value of k v at T5 within the first few microseconds. Thus, k v can be described with the following temperature-dependent equation, with a goodness-of-fit (R2) value of 0.9984 for the current diluted experimental conditions:
k ν = 23.78   e x p 0.000646   T
To account for the exothermicity of the reactions during the experiments, the increase in temperature T5 was computed using a detailed chemical mechanism (as described in the next section), which was accounted for in Equation (2), using computed time-varying temperatures with the model, creating a time-varying k ν . This correction leads to a minor change in the final CO mole fraction, typically around 5%. Note that the mixtures (2, 4, and 5 in Table 1) were highly diluted to minimize the temperature change due to chemical reactions. Of this diluent, 20% was helium to accelerate the vibrational relaxation of CO [20]. The experimental conditions for the CO time-history profiles correspond to temperatures ranging from 1550 to 2320 K, and pressures from 0.71 to 1.30 atm, as summarized in Table 2.

2.4. Experimental Uncertainty

The method for determining the ignition delay time, as described above, is sensitive to the calculation of the reflected-shock conditions and the instrumentation. A principal advantage of using the normal shock relations is that the reflected-shock temperature and pressure are only a function of the incident-shock velocity and specific heat ratio of the test gas. Since the specific heat ratio of the test gas can be calculated by measuring the initial temperature and pressure, it is only necessary to measure the speed of the shock wave. This simplification limits the uncertainty of the measurement of the incident-shock velocity. Along with errors in the velocity detection procedure, there also exist errors in the ignition delay time measurement. Characteristic times for a given mixture can be shown to vary with temperature and pressure, therefore, the errors in T5 and P5 listed above influence the error in the ignition delay time.
Additionally, the errors in mixture preparation have an effect on the ignition delay time, as characteristic time also depends on species concentration. The partial pressures of each gas species were measured using MKS Baratron capacitance manometers, with ranges of 1–100 torr and 1–1000 torr, and were displayed on an MKS PR4000B. The separate ESI transducer, used primarily for filling the diluent gas, was rated up to 25 bar, but was displayed in pounds per square inch units. The associated error for each of these devices was taken into account, and the changes in mixture composition were recorded. Since the mixtures in this study were highly diluted in argon, the error associated with the experimental devices was not high enough to cause significant changes in fuel or oxidizer mole fraction, resulting in low uncertainties in the ignition delay time of approximately 1%. Therefore, the majority of the uncertainty lies in the variation of T5 and P5. For the hydrogen mixtures, a 0.8% and 1.0% variation in T5 and P5 causes reflected-shock conditions to change by roughly 10 K and 0.01 atm, respectivley, with the exception of the tests completed at intermediate pressures where the error in P5 can climb to roughly 0.07 atm. In the methane mixtures, T5 and P5 can vary by up to 18 K and 0.02 atm, respectively. A temperature disagreement of 10–20 K can produce uncertainties in the ignition delay time of 10%. To be conservative, a total uncertainty of ±20% is placed on the ignition delay time measurements in this study to account for the uncertainty in the post-reflected-shock conditions, mixture preparation, and additional diagnostic uncertainty.

3. Detailed Kinetics Mechanism

The following two chemical kinetics mechanisms are available for NBD pyrolysis in the literature: the Jin et al. [8] model, which contains 263 species and 1255 reactions, and Wang et al. [21], who developed a model for QC that includes NBD in its sub-mechanism (397 species and 1522 reactions). However, the oxidation reactions for NBD have only been studied in Chen et al. [9], which is part of a continuing effort from the pyrolysis mechanism presented in Jin et al. [8]. The NBD H-atom abstraction and related decomposition reactions obtained via ab-initio calculations in Chen et al. are not sufficient to perform numerical simulations on the new CO time-history results herein, since it does not include the reaction pathways between the NBD fragments and CO. To this end, the NUIGMech 1.1 detailed kinetics mechanism from El-Sabor Mohamed et al. [22] was used as a fundamental base for the hydrocarbon fuels (C1–C7), to which the pyrolysis and oxidation reactions for NBD were added [8,9]. The implementation of the NBD pyrolysis sub-mechanism in NUIGMech 1.1 has been carried out carefully, as follows:
(1)
Addition of the NBD decomposition reactions, namely NBD C6H5CH3 (toluene), NBD NCD (norcaradiene), and NBD C5H6 (cyclopentadiene) + C2H2 (acetylene).
(2)
As the chemistry of C6H5CH3, C5H6, and C2H2 is already included in NUIGMech 1.1, only the sub-mechanism of NCD was needed.
(3)
NCD chemistry involves NCD CHT (1,3,5-cycloheptatriene), CHT CHTyl7 (cycloheptatrienyl) + H, and CHTyl7 + H(+M) CHT(+M).
(4)
The CHTyl7 sub-mechanism includes the reactions CHTyl7 C5H5 (cyclopentadienyl) + C2H2, eC7H6 (5-ethynyl-1,3-cyclopentadiene) + H CHTyl7, and eC7H6 + H C7H6 (fulvenallene) + H. The C5H5- and C7H6-related reactions can be found in NUIGMech 1.1.
(5)
Lastly, the cross-reactions between xylene (oC8H10, mC8H10, and pC8H10) and toluene were implemented, as well as the interactions between CHTyl7 with toluene and indene.
Note that the reactions between toluene and indene were also already available in NUIGMech 1.1. Finally, the NBD oxidation reactions from Chen et al. [8] are best represented in Figure 3 and were included in the final version of the mechanism used during this study. The resulting tentative mechanism contains 2767 species and 11,348 reactions.

4. Results and Discussion

As previously mentioned, no ignition delay time data exist in the literature for dilute hydrogen and methane mixtures containing the additive norbornadiene. In this study, over 100 experiments were performed in the HPST and AST to obtain all high-temperature ignition delay time data for the baseline and additive mixtures. The data cover a range of pressures near atmospheric pressure (0.90–1.90 atm), with the exception of hydrogen, which was also tested at intermediate pressures (6–7 atm). A wider temperature range (1014–2227 K) is covered, all in stoichiometric conditions, and highly diluted in argon (>95%). The results are summarized and presented graphically in order to evaluate the relationship between the measured characteristic time and the test temperature behind the reflected shock wave.

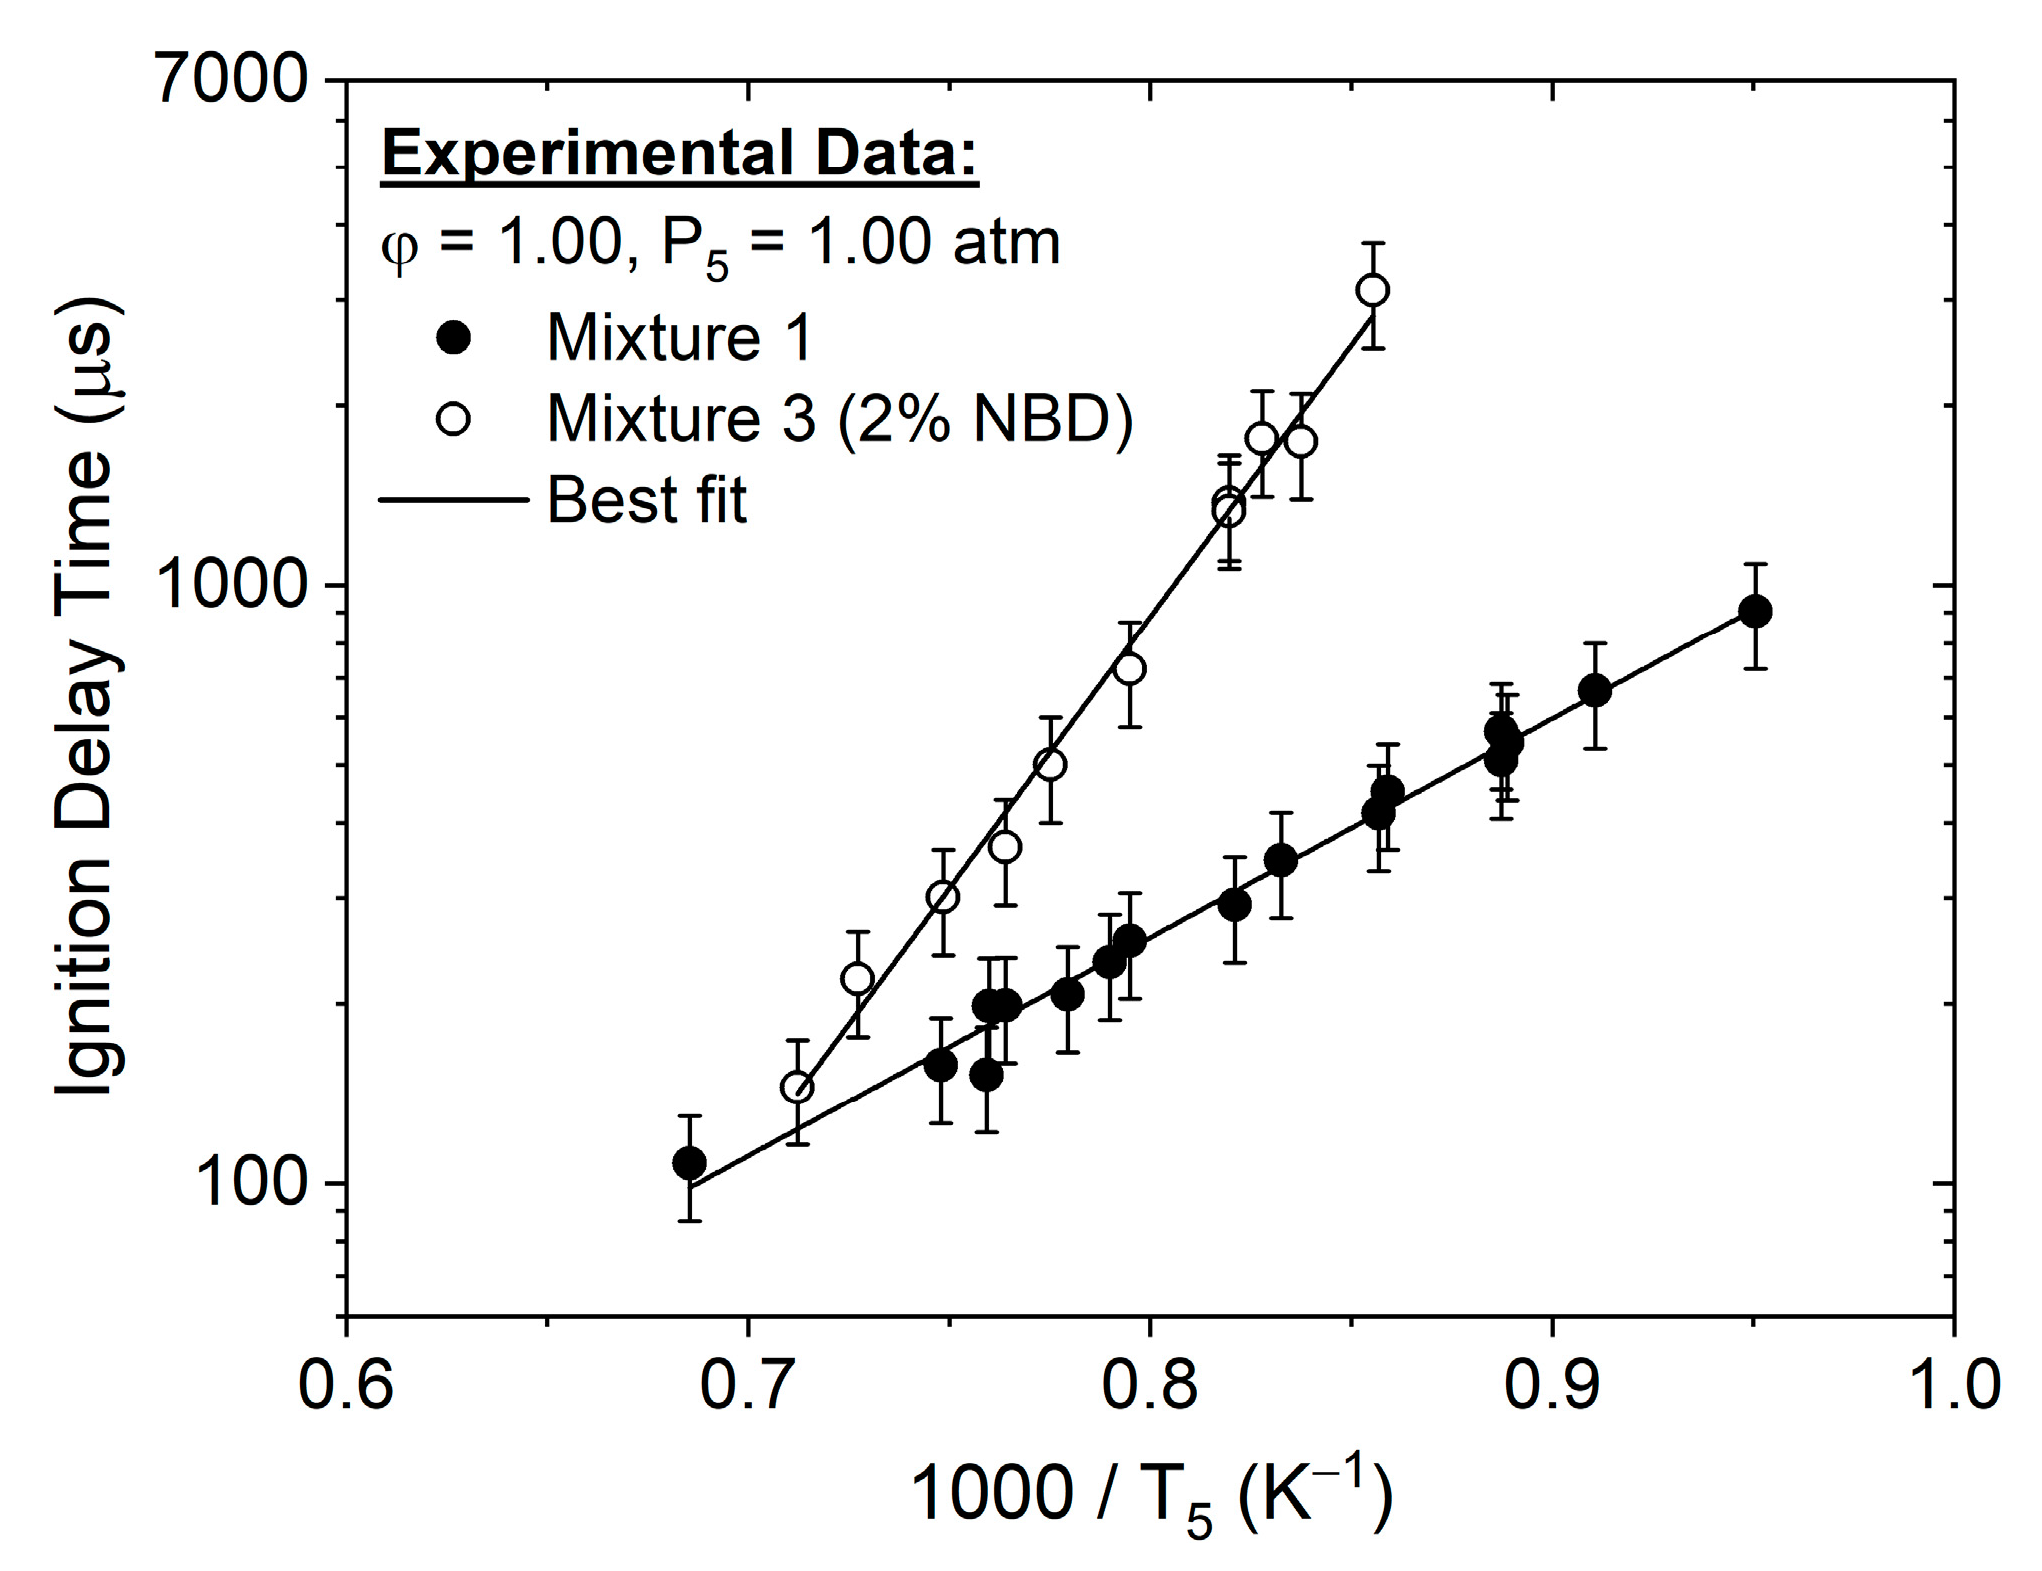
4.1. Ignition Delay Time Correlations

Ignition delay time is sensitive to key parameters such as temperature, pressure, and species concentration. Multiple linear regression analysis and the least squares method can be used to develop a correlation varying any combination of these variables to predict the characteristic time; however, they are typically communicated as an Arrhenius expression by the following relation:
τ i g n = A e x p ( E a / R T )
where   τ i g n is the ignition delay time in μs, A is the pre-exponential factor, E a is the ignition activation energy in kcal/mol, R is the universal gas constant (1.987 × 10⁻³ kcal/mol-K), and T is the test temperature in Kelvins. Table 3 includes the constants and activation energies for the ignition delay time correlations for each mixture investigated in this study. The details and data behind these correlations are presented in the following subsections.
Note that mixture 1 and mixture 3 were tested at both atmospheric and intermediate pressures, but the constants for the correlation (Equation (3)) correspond to the results obtained at 1 atm, as the ignition times (log thereof) of hydrogen at intermediate pressures and low temperatures are not linear, due to the second-explosion limit. The activation energy for the H2/O2 baseline is comparable to the results obtained in the literature, differing from Petersen et al. [23] by 0.5 kcal/mol, although the H2/O2 data in their study was adjusted to 1 atm. Additionally, the activation energy for the baseline methane mixture (mixture 2) is similar to the well-known value of 51.8 kcal/mol [24]. Perhaps the most significant outcome is the change in the activation energy for mixtures with minute quantities of NBD. Mixture 3 contains 529 ppm of NBD, which makes up 2% of the hydrogen content by volume, yet the activation energy experiences a 173% increase. This dramatic increase is due to the additional energy required to oxidize the C–H and C–C bonds in the additive that were not otherwise present in the pure H2/O2 baseline. Conversely, the addition of NBD had the opposite effect in the methane mixtures by decreasing the activation energy. Mixture 4 contained 16 ppm of NBD, representing 1% of the methane by volume, and the activation energy was decreased by just over 3.5%. The additive effect is more pronounced in mixture 5, which contains nearly double the amount of NBD (31 ppm), and the activation energy is reduced by just over 13%. These results demonstrate the ability of NBD to enhance the reactivity of methane at high temperatures and atmospheric pressure.

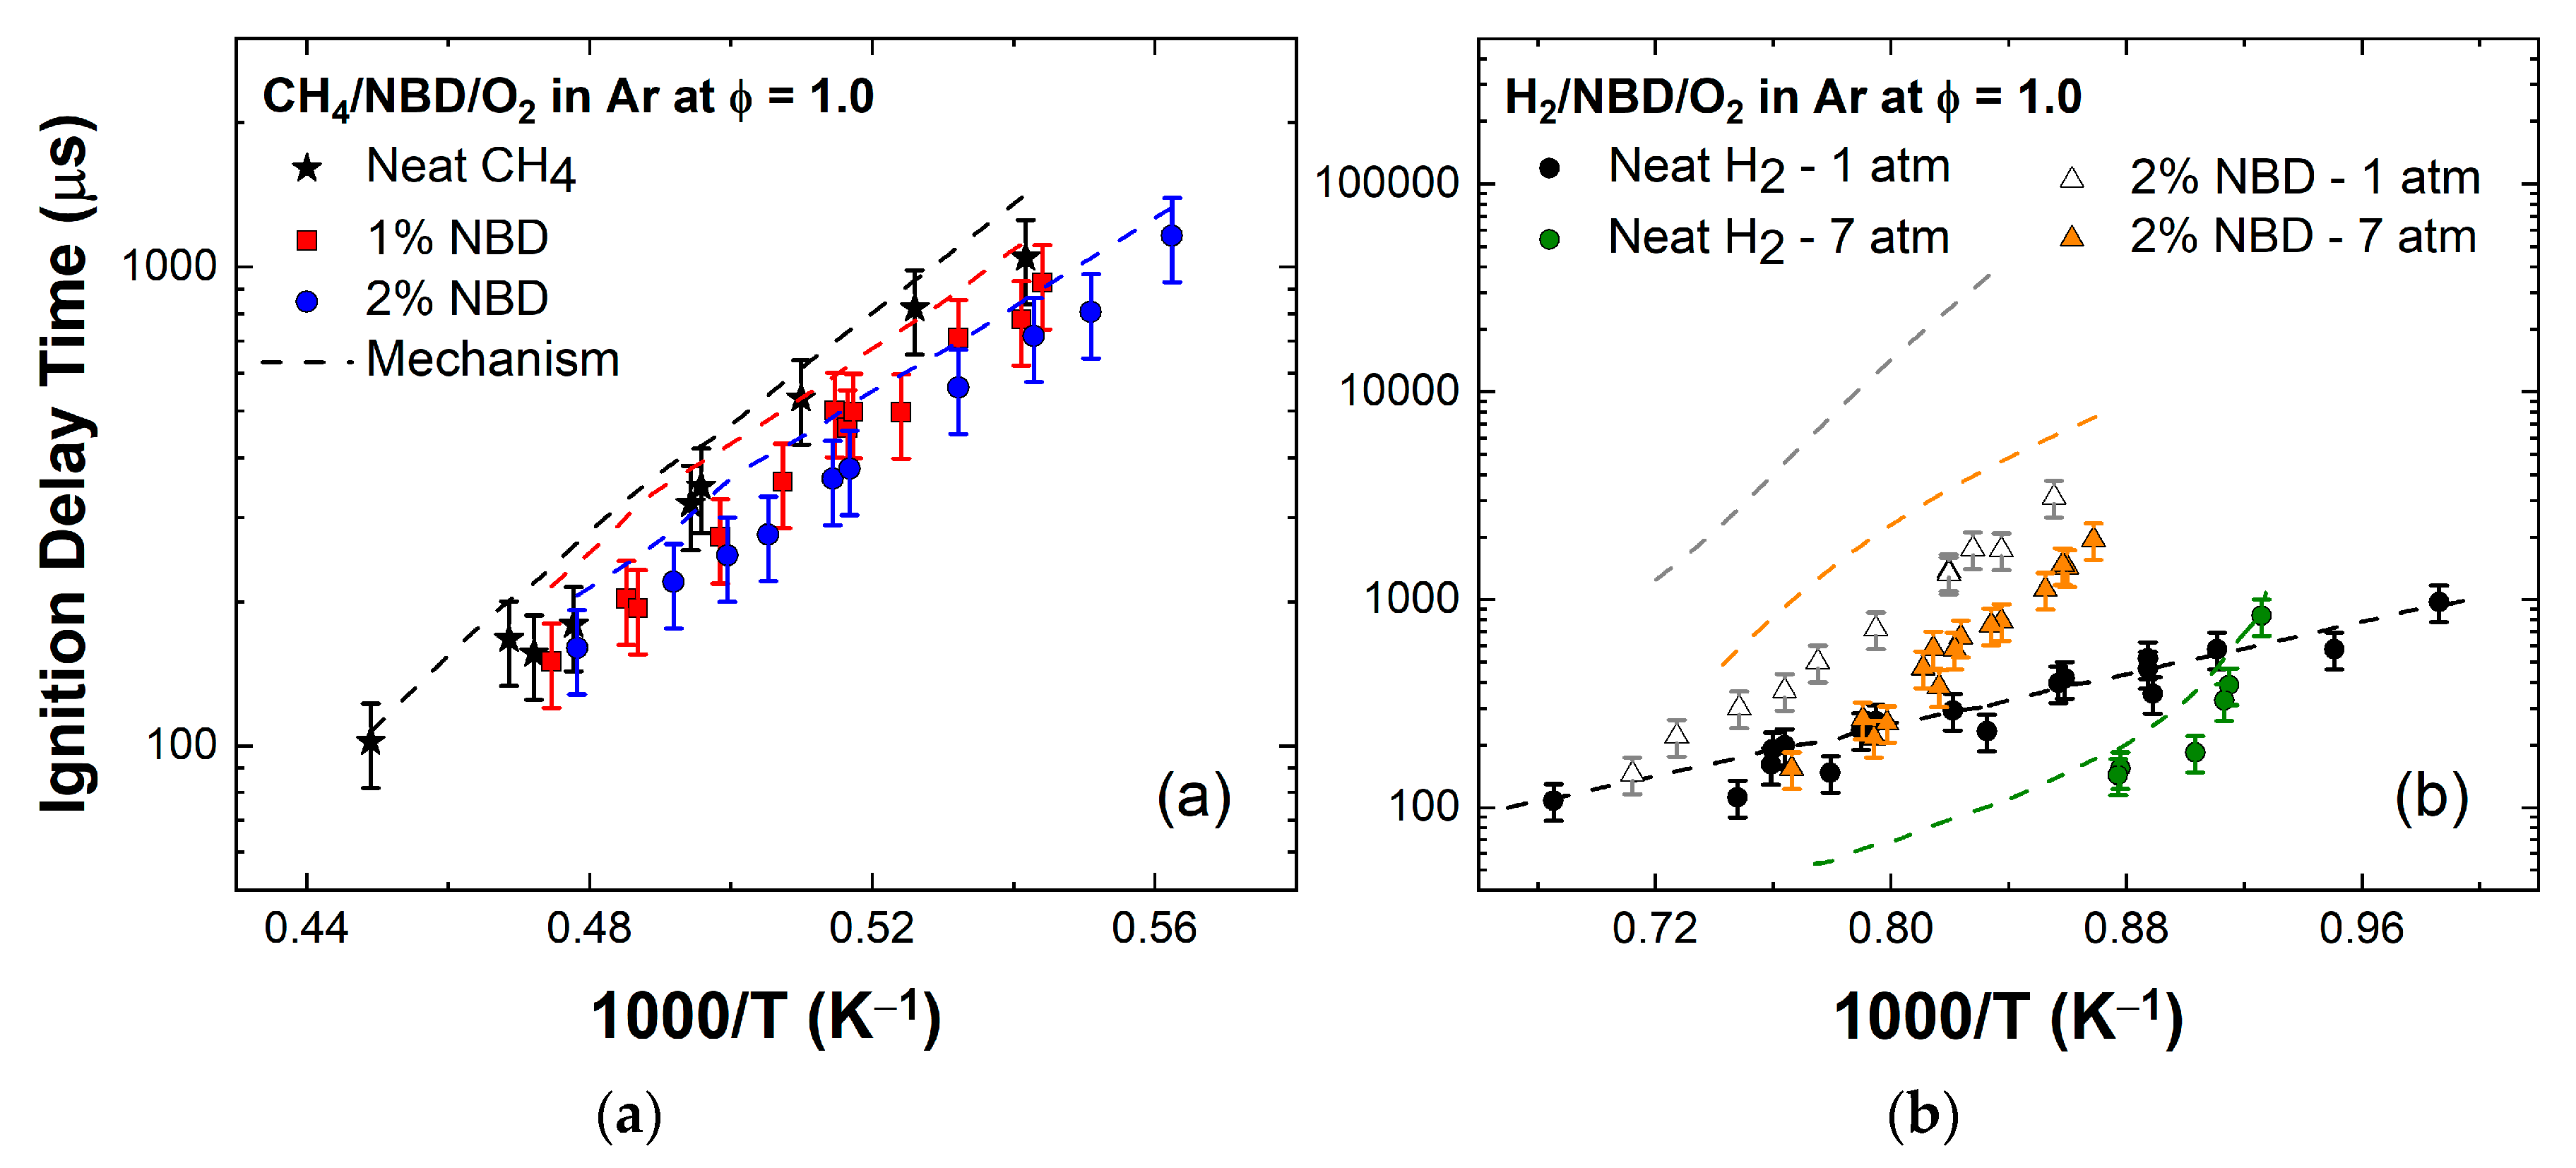
4.2. Hydrogen-Oxygen Mixtures

Seventeen data points were taken for the H2/O2 baseline mixture, ranging in temperatures from 1014 to 1459 K. The results are illustrated in Figure 4a, where good agreement with the H2/O2 experimental data from Petersen et al. can be observed. Note that the data for both baseline mixtures are pressure adjusted to 1 atm using a pressure exponent of −0.79 [23]. All data were compared with GRI-Mech 3.0 and NUIGMech 1.1, which display similar trends to both of the experimental data sets [16,25]. Therefore, it was appropriate to conclude that mixture 1 (and, by extension, the methods employed for τ i g n in this study) yielded reliable data and could serve as a baseline for comparison to mixtures containing NBD.
Multiple regression analysis was used to develop an ignition delay time correlation dependent on species concentration combining both the H2/O2 baseline mixture used in this study and the H2/O2 baseline mixtures from Petersen et al. [23]. In general, reactant concentration-dependent correlations take the following form:
τ i g n = A H 2 a O 2 b N B D c e x p E a / R T
Using this combined data set, the ignition delay time depends on hydrogen and oxygen concentrations, as follows:
τ i g n = 9.38 × 10 7 H 2 0.20 O 2 0.61 e x p 17.3 / R T
where τ i g n is the ignition delay time in microseconds, X is the species concentration in mol/cm3, 17.3 is the activation energy in kcal/mol, R is the universal gas constant in kcal/mol-K, and T is the test temperature in Kelvins. Equation (5) is representative of the data, as it possesses a statistical coefficient of the determination (R2) of 0.973. The pressure dependence for this combined data set was shown to vary as P 0.81 , and was determined by combining the concentration exponents a + b = n as P = M t o t R T . A comparison between the correlation (Equation (5)) to the experimental data in this study and in Petersen et al. is shown in Figure 4b, in which the scatter is relatively contained.
A dilute H2/O2 mixture was prepared containing the additive NBD (mixture 3). To demonstrate the relatively large effect that NBD has on hydrogen ignition, a miniscule amount (529 ppm) was added to the mixture, which made up only 2% of the hydrogen mole fraction present in the mixture. The stoichiometry and diluent amount remained constant. Eleven data points were collected, covering a temperature range of 1169–1404 K, while the pressure remained constant at approximately 1 atm.
The ignition behavior of mixture 3 is visible in Figure 5, where dramatic changes in characteristic time take place as a result of minute quantities of the additive. Note that mixture 1 is adjusted to 1 atm, while mixture 3 is presented using the unadjusted reflected-shock pressures. The ignition delay time is retarded significantly, and changes in the activation energy (slope) are seen due to the additional energy required to break down the C–H and C–C bonds in NBD. These results were of course expected, as the interference from other species is known to delay hydrogen’s reactivity [23,26]. To elaborate further, we did not expect NBD to enhance the ignition of a H2-O2 combination. Rather, the addition of NBD to a fuel with well-known reaction kinetics should serve as a good test for developing and understanding the combustion chemistry of NBD. A best-fit line was included in Figure 5 to illustrate the linear behavior of the data when plotted on a log scale.
The HPST was used to test the same H2/O2 baseline mixture at intermediate pressures (6–7 atm) to target ignition near the famous second-explosion limit. The second-explosion limit occurs as a result of the competition between the primary chain branching and terminating reactions, which causes changes in the ignition behavior at pressures above atmospheric and at lower temperatures [27]. Increasing the pressure also limits the temperature range in which ignition is achievable in highly dilute, stoichiometric, H2/O2 mixtures. Therefore, it is useful to incorporate model predictions into the lower-temperature regions where the ignition results may be extended [23]. Figure 6a illustrates the effect of pressure on the ignition of hydrogen and includes NUIGMech 1.1 and GRI-Mech 3.0 models to extend into temperatures where ignition data were not collected. Note that the data were adjusted to both 1 and 7 atm using a pressure dependence of −0.79.
Here, the data form a near-vertical line in the temperature range of 1080–1140 K. Better agreement with the models is observed at 1 atm, while the models both predict a slower ignition than the measurements at 7 atm. Mixture 3 was tested at pressures near 7 atm and compared to the baseline H2/O2 mixture in Figure 6b. The addition of NBD increased the ignition delay time significantly while also eliminating the non-Arrhenius trend observed in the baseline. Furthermore, the presence of the additive allowed the results to be extended into higher temperatures where the ignition delay times in the baseline mixture would have been less than 100 μs. The overall results indicate that the chain-terminating reactions (described below) were suppressed in mixture 3 as the oxidation of hydrocarbons propagated dominant chain-branching reactions. Figure 7a compares the effect of pressure on the ignition of mixture 3.
Since the H2/NBD/O2 mixtures did not exhibit second-explosion limit characteristics at a higher pressure, the data were represented by an Arrhenius expression and could be correlated with the data at atmospheric pressure. The ignition delay time was shown to vary with reflected-shock pressure, as follows:
τ i g n = 1.13 × 10 5 P 0.53 e x p 45.3 / R T
Equation (6) possesses a coefficient of determination of 0.974. A comparison between the correlation (Equation (6)) to the experimental data obtained at both pressures is shown in Figure 7b, where minor scatter is observed between the two pressures.

4.3. Methane–Oxygen Mixtures

The AST was used to measure the ignition delay times and CO time histories of the CH4/O2/Ar and CH4/NBD/O2/Ar mixtures. The characteristic times were obtained for a stoichiometric methane baseline that was highly diluted in argon (99.5%) in order to compare the results with mixtures including the additive. Similar to the hydrogen baseline, the methane baseline data were compared to the experimental results of Petersen et al. and the kinetic models NUIGMech 1.1 and GRI-Mech 3.0, as shown in Figure 8. Note that both of the data sets were adjusted to a pressure of 1 atm using a pressure exponent of −0.72 [28]. The data from Petersen et al. appear to agree better with the models; however, their baseline data were obtained using a CH* chemiluminescence diagnostic [23]. This difference is within the experimental uncertainty of the ignition delay time measurements; therefore, the present data set can, nonetheless, be verified as reliable baseline data. Unlike the hydrogen baseline, the methane baseline data between Petersen et al. and this study did not differ enough in composition to yield a correlation as a function of species concentration.
To examine the reactivity of NBD in methane, two separate mixtures were prepared containing the additive, which made up 1% and 2% of the methane by volume. When NBD was added to the methane baseline, a reduction in the ignition delay time was observed. Figure 9a combines the results of mixtures 4 and 5 and compares them to the baseline CH4/O2 mixture, where the additive effect can be directly compared. The effect of the additive does not appear to be present at higher temperatures, where grouping with the baseline data takes place. As the reflected-shock temperatures become greater than 2000 K, which is considered the high-temperature reaction pathway limit in methane, the difference in reactivity is less obvious. This temperature dependence suggests that the minor additive amounts are not enough to influence the preferred high-temperature reaction pathway taken during the oxidation of methane. In other words, the kinetics of methane appear to be rate-limiting at these temperatures. Doubling the mole fraction of the additive results in a larger departure from the baseline data and allows measurements to take place at colder temperatures, where ignition was not achievable in mixture 4.
The characteristic time was shown to vary with NBD concentration, as follows:
τ i g n = 5.39 × 10 6 N B D 0.23 e x p 49.8 / R T
Equation (7) possesses a coefficient of determination of 0.99. A comparison between the correlation (Equation (7)) and the experimental data obtained at varying species concentrations is shown in Figure 9b. Note that the concentrations of methane and oxygen did not vary enough between the two mixtures to contribute to changes in the characteristic time, therefore, their respective concentration terms are not included in the overall correlation.

4.4. Chemical Kinetics Modeling

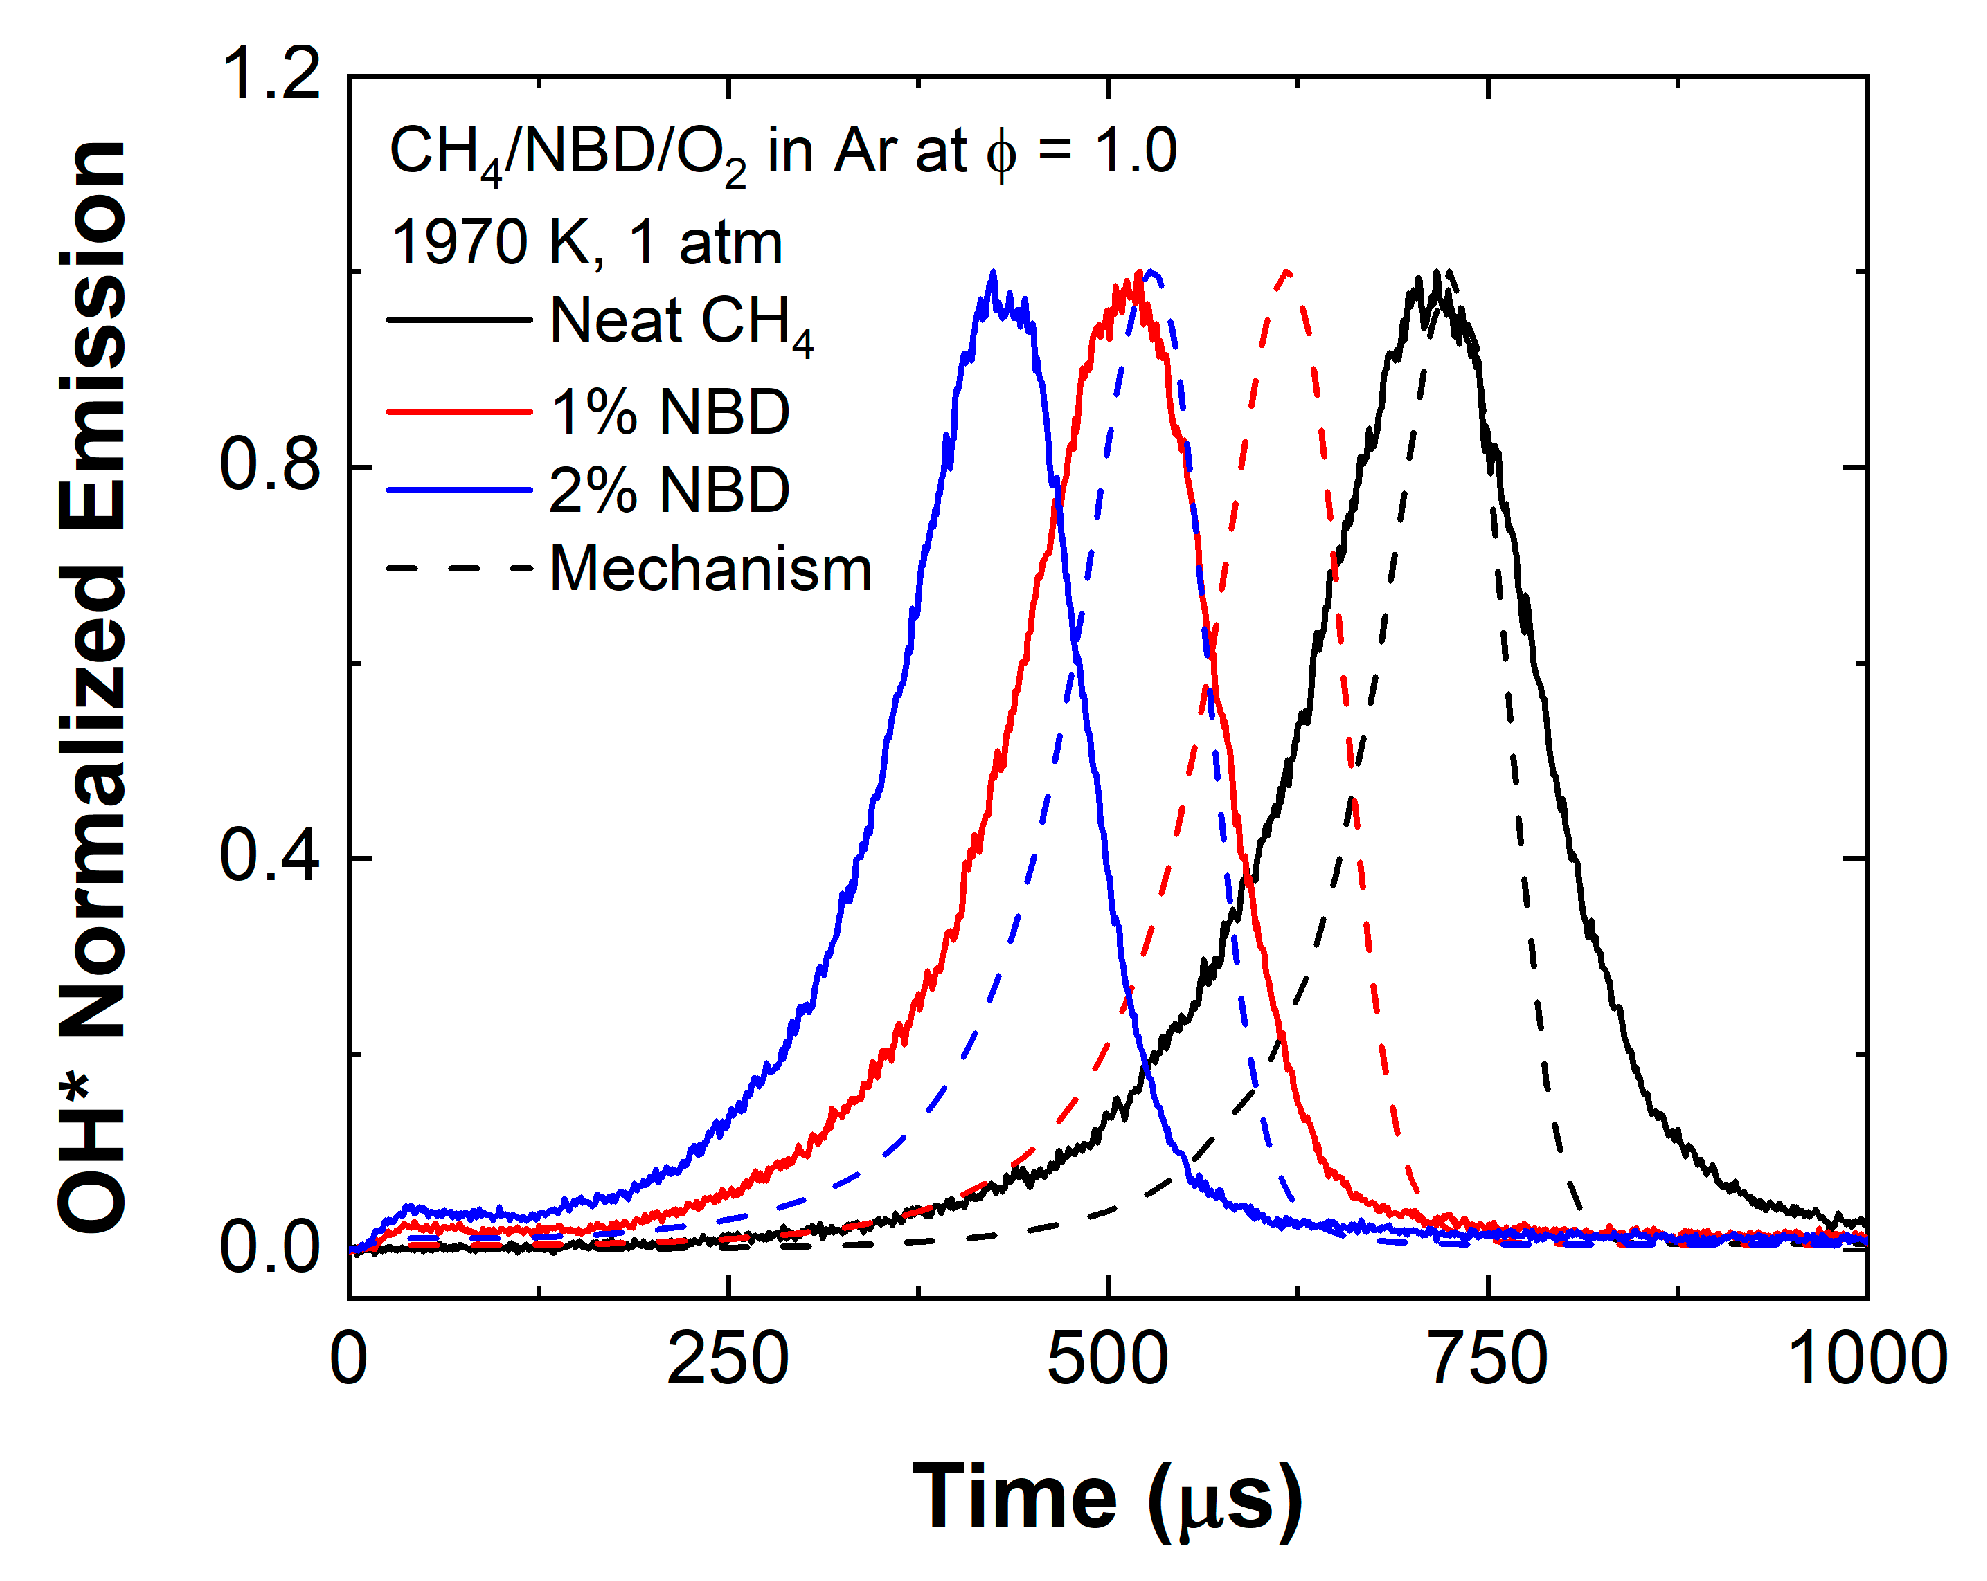
4.4.1. OH* Emission Profiles

The ignition delay times (IDTs) are presented in Figure 10 for the CH4/NBD and H2/NBD mixtures, respectively, along with the predictions of the tentative mechanism of this study. The numerical estimations overpredict the results by 34% for CH4/O2 IDTs in Figure 10a, while the two mixtures with 1% and 2% NBD were also overpredicted by 37% and 30%, respectively. For the H2/O2 mixture in Figure 10b, the model has excellent agreement with the data (due to the NUIGMech 1.1 performance for H2 chemistry), and some discrepancies are visible at 7 atm. However, the model does not reproduce the results with satisfaction for the H2/NBD/O2 mixture, with it being under-reactive by a factor of 6.7 at 7 atm, while the atmospheric results are predicted 17 times higher by the tentative model. It is important to note that the second-explosion limit was suppressed with the NBD additive. At 7 atm, the experimental conditions are at a sufficiently high pressure to generate the reaction between HO2 and H2 that produces hydrogen peroxide (H2O2) in our range of temperatures. This compound subsequently produces two active OH-radicals and increases the system reactivity (change in the slope of the data). The presence of NBD brings a pool of active H-radicals that overcomes the high activation energy required at lower temperatures. A further discussion on these active H-radicals takes place later in this work.
The normalized experimental profiles of OH* emissions are compared with the model in Figure 11 and Figure 12, which both provide a good overview of the NBD addition effect, along with the pressure impact on the shape and timing of these OH* profiles. As one can see, when compared at a similar temperature of 1100 K (see Figure 11a), the time-to-peak is shifted by 500 μs when the pressure difference is around 6 atm. The model is able to predict this decrease in the IDT at a higher pressure, with a 15% inaccuracy at 1.20 atm between the experimental result and the numerical prediction. Figure 11b shows the effect of NBD addition at 1337 K, near atmospheric pressure. While the mechanism is in excellent agreement with the OH*-normalized profile without NBD, the increased IDTs with NBD addition are clearly over-predicted by the model, with a time-to-peak 5.4 times longer than that of the measurement. The augmentation of the IDT is attributed to changes in the fundamental chemistry after the introduction of molecules containing carbon bonds, which require stronger activation energies for ignition. Lastly, the OH* profiles for the H2/NBD/O2 mixture in Figure 11c are not correctly reproduced by the model. At 1300 K, the predictions are 3.4 and 5.8 times larger (time-to-peak) for the pressures of 6.34 atm and 0.96 atm, respectively. As expected, the predicted shapes of the H2/O2/Ar time histories in Figure 11 are in excellent agreement with the data, and the predicted profiles with NBD are thinner than those measured.
Figure 12 shows a comparison for the methane-related mixtures at 1970 K, and 1 atm. The modeling of the OH* profiles for the CH4/O2 mixture is able to match the time-to-peak, whereas the IDT differs by 16%. When the CH4/NBD/O2 profiles are observed (1% and 2% NBD), both the time-to-peak and the IDTs are not well-described by the model, although the basic shape of the profiles and the relative timing with NBD addition are captured. An over-prediction of IDTs by 41% and 46% are depicted for 1% and 2% NBD, respectively, which is in line with the IDT results shown in Figure 10a. It is important to emphasize that both the tentative model and NUIGMech 1.1 show the same responses for the baseline H2/O2 and CH4/O2 mixtures for the new OH* results. All of the IDT values can be found in the Supplementary Material.

4.4.2. CO Time-History Profiles

New CO time-history profiles were obtained for the baseline mixture with CH4, as shown in Figure 13. The current model is tested against these new CO time histories, and the numerical predictions agree fairly well with these experimental results for temperatures higher than 1900 K. At the lower-temperature range (e.g., 1846 K in Figure 13), the model does not produce CO fast enough for us to observe the CO peak at 1420 μs. The mole fraction at the peaks is systematically lower (by 9%) when the temperature goes above 2100 K. Again, the tentative model and NUIGMech 1.1 show the same responses for the CO time histories of the CH4/O2 mixture.
Figure 14 shows representative results of CO time-history profiles for the oxidation of CH4 in addition to profiles doped with 1% and 2% NDB at two temperatures: 2010 ± 8 K and 1970 ± 9 K. As shown, this energetic additive significantly increases the reactivity of CH4 oxidation by shortening the induction time, as follows: 1% NBD accelerates the CO production by 100 μs and 240 μs (time-to-peak) at around 2010 K and 1970 K, respectively. Similarly, the addition of 2% NBD reduces the maximum CO peak times by 24% and 42% (see Figure 14a,b), respectively. The impact of NBD is, therefore, more noticeable at lower temperatures, as noted above when analyzing the IDT results. However, the small amount of NBD, which represents 10 to 30 ppm in the two different mixtures studied, seems to rapidly increase the CO levels by 145 ppm and between 170 and 270 ppm for 1% and 2% initial concentrations, respectively. All of the CO profiles can be found in the Supplementary Material.
In the literature, the augmentation of methane reactivity by incorporating another fuel was also investigated [29]. He et al. carried out dual-fuel experiments of CH4/O2 in 96% Ar with the addition of n-hexane and observed the effects of active H-radicals [29]. Two compositions were tested: 10% n-hexane and 20% n-hexane (relative to methane). Interestingly, no further reduction could be achieved when increasing the addition of n-hexane from 10% to 20%. The new results in Figure 14 are relevant in terms of the appropriate NBD proportions. While 1% NBD promotes the reactivity of CH4, 2% NBD addition does not scale dramatically in its influence over the reactivity as much as 1% NBD, relatively speaking.
The detailed chemical kinetics mechanism was tested against high, intermediate, and low temperatures in order to cover the wide span of temperatures obtained during the experimental measurements of mixture 4 and 5, as shown in Figure 15. As one can see, the tentative model is significantly under-reactive and approaches errors up to 15%. The performance of the model is influenced by both the methane and the NBD chemistries; however, the main objective of this initial mechanism is to be able to conduct a sensitivity analysis in order to understand the NBD chemistry and its effect on methane, progressing toward an improved NBD mechanism in the future. It has been observed with the model that the NBD decomposes extremely fast in the present conditions, to the point that the oxidation reactions implemented in the model (e.g., H-abstraction reactions for NBD) are not involved in the reaction pathway analysis, as suggested in Figure 16. In fact, the numerical predictions including only the pyrolysis reaction mechanism for NBD show the same results as those shown in Figure 15. More details regarding the reaction pathways for NBD are discussed later in the paper.
The NBD chemistry was investigated by carrying out numerical analyses (sensitivity, rate-of-production, and reaction pathways). First, a sensitivity analysis was performed at 1970 K and 1 atm and is presented in Figure 17. The sensitivity coefficients have been normalized using the two most sensitive reactions of (R1) and (R2) for the CH4/O2 and CH4/NBD/O2 mixtures, respectively.
O 2 + H O + OH
CH 3 + H + ( M ) CH 4   ( + M )
The sensitivity results also show that, among the three reactions of NBD decomposition ((R3), (R4), and (R5)), key Reaction (R5) is the most sensitive, as follows:
NBD NCD
NBD C 6 H 5 CH 3
NBD C 5 H 6 + C 2 H 2
while the main reaction responsible for CO production is (R6): HCO + M H + CO + M, and the CO-to-CO2 conversion is mainly completed via Reaction (R7): CO + OH CO2 + H.
HCO + M H + CO + M
CO + OH CO 2 + H
As one can see, the addition of NBD impacts the chemistry of methane in a significant manner (Figure 17 and Figure 18). The rate-of-production analysis shows that the addition of NBD does not modify the reactions required for the production of CO. However, all of these reactions are systematically activated earlier, as shown in Figure 18a–c. Additional analyses were carried out at 1800 K and 2000 K to examine the effect of temperature on the reaction sensitivity, resulting in an observed consistency among the reaction pathways for this mixture. However, a change in temperature did influence the mixture reactivity by causing the reactions included in Figure 18 to occur earlier at 2000 K, as expected.
The efficiency of NBD in enhancing methane reactivity can be observed in the reaction pathways provided in Figure 19, where multiple reactions were favored as the H-radical concentration increased. It is noteworthy to clarify that this analysis was carried out at 10% methane consumption. Reaction (R7) shows a drastic change in its percentage in Figure 19, preferred by 29.5% for the methane alone, by 70.8% with 1% NBD, and by 79.7% with 2% NBD.
CH 4 + H CH 3 + H 2
The decomposition of NBD is extremely fast in the present conditions and involves the release of active radicals that permit the acceleration of the ignition of much more stable methane. More importantly, the presence of NBD positively impacts the production of CO from the well-known reaction pathway in methane via CH4  CH3  CH2O HCO CO by promoting Reactions (R8) and (R9), with highly reactive H radicals.
CH 2 O + H HCO + H 2
The following three reactions related to the NBD chemistry are also denoted and promoted in the sensitivity analysis, as they provide additional chemical pathways that are not available for methane oxidation:
C 2 H 2 + O 2 2   HCO
C 2 H 2 ( + M ) H 2 CC ( + M )
H 2 CC + O 2 2   HCO
Consequently, the addition of NBD in the CH4/O2 mixtures proves the efficiency of this molecule in ameliorating the combustion behavior of stable methane. Lastly, the NBD reaction pathway reveals that the decomposition of this additive produces NCD via the less-sensitive Reaction (R3), then CHT, and releases more H-radicals, but also produces toluene, which is often used as a radical trap, therefore, not providing reactivity enhancement in the present conditions. More details on the toluene chemistry in similar experimental conditions using a shock tube can be found in Grégoire et al. [30].

5. Conclusions

Ignition delay time measurements for stoichiometric H2/O2/Ar, H2/NBD/O2/Ar, CH4/O2/Ar, and CH4/NBD/O2/Ar mixtures were obtained over a wide temperature range using the High-Pressure Shock Tube and Aerospace Shock Tube Facilities at Texas A&M University. Additionally, new CO time-history profiles were measured for the CH4 baseline and CH4–NBD mixtures. The high-temperature experiments were completed at atmospheric pressure, and the hydrogen mixtures were also tested at a higher pressure, exhibiting changes in ignition behavior due to the dominant chain-terminating reaction pathways, otherwise recognized as the second-explosion limit. Excellent agreement was observed between the ignition delay times measured in this study and those obtained in the literature for the highly dilute, stoichiometric H2/O2/Ar and CH4/O2/Ar baseline mixtures. Those mixtures containing NBD produced distinct changes in the activation energies of the baseline mixtures. Notably, small amounts of NBD (~10–30 ppm) enhanced the reactivity of methane. Conversely, NBD reduced the reactivity of hydrogen due to the additional energy required to break the C–H and C–C bonds in NBD. However, NBD-doped hydrogen mixtures suppressed the chain-terminating reactions present when hydrogen is oxidized at higher pressures. This behavior allowed the ignition of hydrogen to be extended to higher temperatures and to be modeled using an Arrhenius expression.
Ignition delay time correlations were developed for each mixture (1–5), which allowed the prediction of characteristic times for high temperatures to be executed accurately. These relations, obtained from a multiple regression analysis, depend on temperature and, in some cases, either species concentration or pressure. The scaling factors for species concentration are provided for the baseline H2/O2/Ar mixture, the CH4/NBD/O2/Ar mixtures, and for the pressure in H2/NBD/O2/Ar mixtures. The species concentration did not vary enough for a correlation to be established in the baseline CH4/O2/Ar mixture. The performance of these correlations was tested and directly compared to the measured values in this study and from the literature. A relatively small scatter was observed in the prediction of the characteristic time.
A kinetic mechanism for NBD was assembled and tested against the new data herein, and the NBD effect on methane oxidation chemistry was investigated via CO time-history analyses (e.g., sensitivity, rate-of-production, and reaction pathways). The rapid NBD decomposition significantly increased the pool of H-active radicals and augmented the methane reactivity drastically. Future efforts should focus on studying these mixtures at both lean and rich equivalence ratios with diverse diluent amounts in order to determine the effect on reactivity. Additionally, testing pressures above the atmospheric level in the CH4–NBD mixtures may be beneficial in accurately representing applications where combustion takes place at these conditions. Last, laminar flame speed data would complement both the ignition delay time and the spectroscopic data presented in an effort to support the future development towards a global kinetic mechanism for the oxidation of norbornadiene. The ignition delay time and spectroscopic CO data herein represent the first experimental gas-phase data obtained for norbornadiene in both hydrogen and methane mixtures, leading to the development of a kinetics model and demonstrating the potential of this compound to accelerate the oxidation process in common hydrocarbon fuels such as methane.

Supplementary Materials

The following supporting information can be downloaded at: https://www.mdpi.com/article/10.3390/en16217278/s1, Figure S1. Experimental CO time-history profiles for the oxidation of CH4 at ϕ = 1.0 in 99.25% He/Ar. Figure S2. Experimental CO time-history profiles for the oxidation of CH4 + 1% NBD at ϕ = 1.0 in 99.25% He/Ar. Figure S3. Experimental CO time-history profiles for the oxidation of CH4 + 2% NBD at ϕ = 1.0 in 99.25% He/Ar.

Author Contributions

Conceptualization, M.G.S., C.M.G. and E.L.P.; methodology, M.G.S., C.M.G. and E.L.P.; validation, M.G.S., C.M.G., O.M. and E.L.P.; formal analysis, M.G.S. and C.M.G.; investigation, M.G.S., C.M.G. and D.J.M.; resources, E.L.P.; data curation, M.G.S. and C.M.G.; writing—original draft preparation, M.G.S. and C.M.G.; writing—review and editing, M.G.S., C.M.G., O.M. and E.L.P.; visualization, M.G.S.; supervision, E.L.P.; project administration, E.L.P.; funding acquisition, E.L.P. All authors have read and agreed to the published version of the manuscript.

Funding

This research was funded in part by the Ralph-James Fellowship for C.M.G. through the Texas A&M Engineering Experiment Station (TEES) Turbomachinery Laboratory.

Data Availability Statement

Data presented herein are available in Supplementary Materials.

Conflicts of Interest

The authors declare no conflict of interest.

References

  1. Walsh, R.; Wells, J.M. The enthalpy of formation of bicyclo[2,2,1]hepta-2,5-diene thermodynamic functions of bicyclo[2,2,1]heptane and bicyclo[2,2,1]hepta-2,5-diene. J. Chem. Thermodyn. 1975, 7, 149–154. [Google Scholar] [CrossRef]
  2. Zou, J.-J.; Zhang, M.-Y.; Zhu, B.; Wang, L.; Zhang, X.; Mi, Z. Isomerization of norbornadiene to quadricyclane using Ti-containing MCM-41 as photocatalysts. Catal. Lett. 2008, 124, 139–145. [Google Scholar] [CrossRef]
  3. Pan, L.; Zou, J.-J.; Zhang, X.; Wang, L. Photoisomerization of norbornadiene to quadricyclane using transition metal doped TiO2. Ind. Eng. Chem. Res. 2010, 49, 8526–8531. [Google Scholar] [CrossRef]
  4. Bach, R.D.; Schilke, I.L.; Schlegel, H.B. The energetics of valence isomerization in the norbornadiene−quadricyclane system. J. Org. Chem. 1996, 61, 4845–4847. [Google Scholar] [CrossRef]
  5. Fan, H.-F.; Chin, T.-L.; Lin, K.-C. Kinetics of catalytic isomerization of quadricyclane to norbornadiene using near infrared absorption spectroscopy:  Conversion rate and diffusion motion in heterogeneous reaction. J. Phys. Chem. B 2004, 108, 9364–9370. [Google Scholar] [CrossRef]
  6. Walsh, R.; Wells, J.M. The kinetics of the Diels–Alder addition of cyclopentadiene to acetylene and the decomposition of norbornadiene. Int. J. Chem. Kinet. 1975, 7, 319–329. [Google Scholar] [CrossRef]
  7. Li, Z.; Anderson, S.L. Pyrolysis and isomerization of quadricyclane, norbornadiene, and toluene. J. Phys. Chem. A 1998, 102, 9202–9212. [Google Scholar] [CrossRef]
  8. Jin, K.-R.; Zheng, Z.-H.; Wu, L.-N.; Xu, Q.; Liu, B.-Z.; Wang, Z.-D.; Tian, Z.-Y. Pyrolysis of norbornadiene: An experimental and kinetic modeling study. Combust. Flame 2022, 242, 112155. [Google Scholar] [CrossRef]
  9. Chen, J.; Liu, M.; Zhu, Y.; Jin, K.; Tian, Z.; Yang, L.; Zhou, C.-W. Oxidation of norbornadiene: Theoretical investigation on H-atom abstraction and related radical decomposition reactions. Propuls. Power Res. 2023, 12, 104–113. [Google Scholar] [CrossRef]
  10. Petersen, E.L. Interpreting endwall and sidewall measurements in shock-tube ignition studies. Combust. Sci. Technol. 2009, 181, 1123–1144. [Google Scholar] [CrossRef]
  11. Gaydon, A.; Hurle, I. The shock tube in high-temperature chemical physics. Reinhold 1963. [Google Scholar]
  12. Petersen, E.L.; Rickard, M.J.A.; Crofton, M.W.; Abbey, E.D.; Traum, M.J.; Kalitan, D.M. A facility for gas- and condensed-phase measurements behind shock waves. Meas. Sci. Technol. 2005, 16, 1716. [Google Scholar] [CrossRef]
  13. Cooper, S.P.; Mathieu, O.; Schoegl, I.; Petersen, E.L. High-pressure ignition delay time measurements of a four-component gasoline surrogate and its high-level blends with ethanol and methyl acetate. Fuel 2020, 275, 118016. [Google Scholar] [CrossRef]
  14. Mulvihill, C.R.; Petersen, E.L. Concerning shock-tube ignition delay times: An experimental investigation of impurities in the H2/O2 system and beyond. Proc. Combust. Inst. 2019, 37, 259–266. [Google Scholar] [CrossRef]
  15. Hall, J.M.; Petersen, E.L. An optimized kinetics model for OH chemiluminescence at high temperatures and atmospheric pressures. Int. J. Chem. Kinet. 2006, 38, 714–724. [Google Scholar] [CrossRef]
  16. Smith, G.P.; Golden, D.M.; Frenklach, M.; Moriarty, N.W.; Eiteneer, B.; Goldenberg, M.; Bowman, C.T.; Hanson, R.K.; Song, S.; Gardiner, W.C.; et al. GRI-Mech 3.0. 1999. Available online: http://www.me.berkeley.edu/gri_mech/ (accessed on 10 September 2023).
  17. Spearrin, R.M.; Goldenstein, C.S.; Jeffries, J.B.; Hanson, R.K. Quantum cascade laser absorption sensor for carbon monoxide in high-pressure gases using wavelength modulation spectroscopy. Appl. Opt. 2014, 53, 1938–1946. [Google Scholar] [CrossRef]
  18. Mathieu, O.; Mulvihill, C.R.; Petersen, E.L. Assessment of modern detailed kinetics mechanisms to predict CO formation from methane combustion using shock-tube laser-absorption measurements. Fuel 2019, 236, 1164–1180. [Google Scholar] [CrossRef]
  19. Hanson, R.K.; Spearrin, R.M.; Goldenstein, C.S. Spectroscopy and Optical Diagnostics for Gases; Springer: Cham, Switzerland, 2016. [Google Scholar]
  20. He, D.; Nativel, D.; Herzler, J.; Jeffries, J.B.; Fikri, M.; Schulz, C. Laser-based CO concentration and temperature measurements in high-pressure shock-tube studies of n-heptane partial oxidation. Appl. Phys. B 2020, 126, 142. [Google Scholar] [CrossRef]
  21. Wang, H.; Zhang, B.; Gong, S.; Wang, L.; Zhang, X.; Liu, G. Experimental and modeling studies of quadricyclane and 2-ethylnorbornane pyrolysis from atmospheric to high pressure. Combust. Flame 2021, 226, 163–181. [Google Scholar] [CrossRef]
  22. El-Sabor Mohamed, A.A.; Panigrahy, S.; Sahu, A.B.; Bourque, G.; Curran, H.J. An experimental and kinetic modeling study of the auto-ignition of natural gas blends containing C1–C7 alkanes. Proc. Combust. Inst. 2021, 38, 365–373. [Google Scholar] [CrossRef]
  23. Petersen, E.L.; Kalitan, D.M.; Rickard, M.J. Reflected shock ignition of SiH4/H2/O2/Ar and SiH4/CH4/O2/Ar mixtures. J. Propuls. Power 2004, 20, 665–674. [Google Scholar] [CrossRef]
  24. Petersen, E.L.; Röhrig, M.; Davidson, D.F.; Hanson, R.K.; Bowman, C.T. High-pressure methane oxidation behind reflected shock waves. In Symposium (International) on Combustion; Elsevier: Amsterdam, The Netherlands, 1996; Volume 26, pp. 799–806. [Google Scholar] [CrossRef]
  25. Baigmohammadi, M.; Patel, V.; Martinez, S.; Panigrahy, S.; Ramalingam, A.; Burke, U.; Somers, K.P.; Heufer, K.A.; Pekalski, A.; Curran, H.J. A comprehensive experimental and simulation study of ignition delay time characteristics of single fuel C1–C2 hydrocarbons over a wide range of temperatures, pressures, equivalence ratios, and dilutions. Energ. Fuel 2020, 34, 3755–3771. [Google Scholar] [CrossRef]
  26. Krejci, M.C.; Mathieu, O.; Vissotski, A.J.; Ravi, S.; Sikes, T.G.; Petersen, E.L.; Kérmonès, A.; Metcalfe, W.; Curran, H.J. Laminar flame speed and ignition delay time data for the kinetic modeling of hydrogen and syngas fuel blends. J. Eng. Gas Turbines Power 2013, 135, 021503. [Google Scholar] [CrossRef]
  27. Glassman, I. Combustion, 2nd ed.; Academic Press: Cambridge, MA, USA, 1987. [Google Scholar]
  28. Petersen, E.L. A Shock Tube and Diagnostics for Chemistry Measurements at Elevated Pressures with Application to Methane Ignition; Stanford University: Stanford, CA, USA, 1998. [Google Scholar]
  29. He, Y.; Wang, Y.; Grégoire, C.; Niedzielska, U.; Mével, R.; Shepherd, J.E. Ignition characteristics of dual-fuel methane-n-hexane-oxygen-diluent mixtures in a rapid compression machine and a shock tube. Fuel 2019, 249, 379–391. [Google Scholar] [CrossRef]
  30. Grégoire, C.M.; Cooper, S.P.; Petersen, E.L. Chemical kinetics investigation of toluene combustion in a shock tube using spectroscopic CO and H2O laser absorption. Fuel 2023, 332, 126234. [Google Scholar] [CrossRef]
Figure 1. Chemical structure for the compound norbornadiene.
Energies 16 07278 g001
Figure 2. (a) Representative pressure and OH* chemiluminescence traces for mixture 1 where ignition is defined at the sidewall; (b) representative OH* chemiluminescence and calculated OH* and OH time histories for H2/O2 (mixture 1).
Energies 16 07278 g002
Figure 3. Illustration of the chemical kinetics mechanism adapted from Chen et al. [9] for NBD oxidation, H-atm abstraction, and related radical decomposition reactions.
Energies 16 07278 g003
Figure 4. (a) Stoichiometric H2/O2 baseline mixture data from this study and Petersen et al. [23], pressure adjusted to 1 atm; (b) comparison of the ignition delay time correlation (Equation (5)) to the measured ignition delay times for the varying species concentrations.
Energies 16 07278 g004
Figure 5. Ignition delay times for the stoichiometric H2/O2 mixtures with and without NBD at reflected-shock pressures of 1 atm.
Energies 16 07278 g005
Figure 6. (a) Ignition delay time data for mixture 1 at reflected-shock pressures of 1 and 7 atm; (b) ignition delay time data for H2/O2 mixtures with and without NBD at reflected-shock pressures near 7 atm.
Energies 16 07278 g006
Figure 7. (a) The effect of pressure on characteristic time for mixture 3; (b) comparison of the ignition delay time correlation (Equation (6)) to the measured ignition delay times for the varying reflected-shock pressures in mixture 3.
Energies 16 07278 g007
Figure 8. Stoichiometric CH4/O2 baseline mixture data from this study and Petersen et al. [23] with pressure adjusted to 1 atm.
Energies 16 07278 g008
Figure 9. (a) Comparison of ignition delay times for CH4/O2 mixtures with varying amounts of NBD; (b) comparison of the measured and correlated ignition delay times for methane mixtures containing dissimilar amounts of NBD.
Energies 16 07278 g009
Figure 10. Comparison of measured ignition delay times from OH* emission profiles to the current mechanism at ϕ = 1.00 for (a) CH4/NBD/O2 in Ar; (b) H2/NBD/O2 in Ar.
Energies 16 07278 g010
Figure 11. Representative OH*-normalized emission profiles for H2/NBD oxidation in Ar compared to the current mechanism. Mixtures presented are (a) H2/O2/Ar near 1100 K at 1.20 atm and 7.08 atm; (b) H2/O2/Ar and H2/NBD/O2/Ar at 1337 K near atmospheric pressure; (c) H2/NBD/O2/Ar near 1300 K at 0.96 atm and 6.34 atm.
Energies 16 07278 g011
Figure 12. Representative OH*-normalized emission profiles for CH4/NBD oxidation in Ar compared to the current mechanism. Neat CH4 and addition of 1% and 2% NBD are presented at 1970 K and 1 atm.
Energies 16 07278 g012
Figure 13. CO time-history profiles for CH4 oxidation in 0.995 Ar for three different temperatures (2134 K, 0.96 atm; 1961 K, 1.05 atm; and 1846 K, 1.04 atm) compared to the NUIGMech 1.1 model.
Energies 16 07278 g013
Figure 14. Experimental time-history profiles for the oxidation of methane and the effect of 1% and 2% NBD addition near 1 atm at ϕ = 1.0 for (a) ~2010 K; (b) ~1970 K.
Energies 16 07278 g014
Figure 15. Comparison of experimental CO time-history profiles and the mechanism at different temperatures for the oxidation of (a) CH4 + 1% NBD in 0.995 Ar; (b) CH4 + 2% NBD in 0.995 Ar.
Energies 16 07278 g015
Figure 16. Numerical predictions of CH4 and NBD mole fraction for mixture 5 using the current mechanism.
Energies 16 07278 g016
Figure 17. CO sensitivity analysis for the oxidation of CH4/NBD/O2 in 0.995 Ar at 1970 K and 1 atm for neat CH4, CH4 + 1% NBD, and CH4 + 2% NBD using the current model.
Energies 16 07278 g017
Figure 18. CO rate-of-production analysis for the oxidation of CH4/NBD/O2 in 0.995 Ar at 1970 K and 1 atm for key reactions, separated for clarity in (ac).
Energies 16 07278 g018
Figure 19. Reaction pathway analyses for CH4/NBD/O2 mixtures in 0.995 Ar at 10% consumption of CH4 for 1970 K and 1 atm, focusing on the chemistry of NBD and CH4. The blue text indicates H-atom formation pathways.
Energies 16 07278 g019
Table 1. Species compositions and equivalence ratios for the mixtures prepared in this study.
MixtureFuel BlendXNBDXH2XCH4XO2XArϕ
1100% H2-0.029993-0.0149970.9550101.00
2100% CH4--0.0016870.0034180.9948950.99
398/2% H2/NBD0.0005290.026457-0.0180050.9550091.00
499/1% CH4/NBD0.000016-0.0016250.0033660.9949931.01
598/2% CH4/NBD0.000031-0.0015670.0034080.9949941.00
Table 2. Experimental conditions covered in this study (ϕ = 1.0).
MixtureTemperature (K)Pressure (atm)Diagnostics
11014–14590.93–1.87OH*
1080–11406.95–7.51
21846–23160.90–1.05CO and OH*
31169–14040.96–1.24OH*
1151–13056.32–7.08
41838–21740.95–1.05CO and OH*
51778–20910.97–1.08CO and OH*
Table 3. Constants (A) and activation energies (Ea) for ignition delay time correlations for mixtures 1–5 in this study using Equation (3).
MixtureAEa (kcal/mol)
10.5615.2
25.23 × 10−453.6
34.87 × 10−541.5
46.51 × 10−451.7
52.14 × 10−346.5
Disclaimer/Publisher’s Note: The statements, opinions and data contained in all publications are solely those of the individual author(s) and contributor(s) and not of MDPI and/or the editor(s). MDPI and/or the editor(s) disclaim responsibility for any injury to people or property resulting from any ideas, methods, instructions or products referred to in the content.

