Article

An S-Transform and Support Vector Machine (SVM)-Based Online Method for Diagnosing Broken Strands in Transmission Lines

State Key Laboratory of Power Transmission Equipment & System Security and New Technology, College of Electrical Engineering, Chongqing University, Chongqing 400030, China
*
Author to whom correspondence should be addressed.
Energies 2011, 4(9), 1278-1300; https://doi.org/10.3390/en4091278
Submission received: 13 July 2011 / Revised: 8 August 2011 / Accepted: 23 August 2011 / Published: 29 August 2011

Abstract

:
During their long-term outdoor field service, overhead transmission lines will be exposed to strikes by lightning, corrosion by chemical contaminants, ice-shedding, wind vibration of conductors, line galloping, external destructive forces and so on, which will generally cause a series of latent faults such as aluminum strand fracture. This may lead to broken transmission lines which will have a very strong impact on the safe operation of power grids that if the latent faults cannot be recognized and fixed as soon as possible. The detection of broken strands in transmission lines using inspection robots equipped with suitable detectors is a method with good prospects. In this paper, a method for detecting broken strands in transmission lines using an eddy current transducer (ECT) carried by a robot is developed, and an approach for identifying broken strands in transmission lines based on an S-transform is proposed. The proposed approach utilizes the S-transform to extract the module and phase information at each frequency point from detection signals. Through module phase and comparison, the characteristic frequency points are ascertained, and the fault information of the detection signal is constructed. The degree of confidence of broken strand identification is defined by the Shannon fuzzy entropy (SFE-BSICD). The proposed approach combines module information while utilizing phase information, SFE-BSICD, and the energy, so the reliability is greatly improved. These characteristic qualities of broken strands in transmission lines are used as the input of a multi-classification SVM, allowing the number of broken strands to be determined. Through experimental field verification, it can be shown that the proposed approach displays high accuracy and the SFE-BSICD is defined reasonably.

Graphical Abstract

1. Instruction

Electrical conductors composed of twisted aluminum wires are the most widely used as transmission lines in power grids. During their long-term outdoor field service, overhead transmission lines may be damaged by lightning strikes, corrosion by chemical contaminants, ice-shedding, wind vibration of conductors, line galloping, destructive external forces and so forth [1,2,3,4,5]. Faults occurring in transmission lines such as broken strands must be detected as early as possible to avoid fatal breakdowns. To ensure the safe operation of a power system, transmission lines need be inspected in a timely fashion. The common means used for inspection of latent faults in transmission lines is manual examination with hand-held devices such as telescopes. This method is not only labor-intensive, but also low precision. Aerial maintenance of transmission lines by helicopter is efficient, but dangerous [6,7]. Recently, with the development of artificial intelligence technologies and smart grids, the development of methods for transmission line inspection by robots have become a hot research topic [8,9].
In practice, transmission lines are usually inspected by robots carrying video sensors [10]. This method can directly detect any breakages on the surface of cables, but has limited capability for finding the inner flaws in the cables. It is known that thermal radiation can be produced by in service transmission lines. Based on the differences in the heat dissipation ability and the intensity of infrared radiation between the cables’ broken and normal unbroken states, broken strands in cables can be detected by passive infrared (PIR) sensors made of artificial pyroelectric materials [11]. The method based on the PIR sensors is however very sensitive to the ambient temperature and currently limited to inspecting transmission lines when out of service. An approach for detecting broken strands in transmission lines using ultrasonic sensors was presented in [12]. This method uses sending/receiving sensors to generate/receive ultrasonic waves in cables. Defects in the cable cause a portion of the incident ultrasonic wave to be reflected back to the transducer, where when received, it can be used to identify the presence of a defect. Piezoelectric ceramic ultrasonic sensors are generally installed in the transmission lines and need ultrasonic coupling agents to decrease acoustic resistance. In [13] a non-destructive monitoring system for diagnosis of the mechanical integrity of electric conductors based on inspection robots and electro-magnetic-acoustic transducers (EMAT) was described. In [14,15], a high temperature superconductor (HTS) superconducting quantum interference device (SQUID) with unsurpassed high magnetic sensitivity is applied to detect single wire breakage in transmission lines. While applying an AC current of 2.6 mA at 200 Hz to the electrical conductor, the magnetic field gradient distribution above the conductor was scanned two-dimensionally by a HTS-SQUID gradiometer. A periodic pattern can be detected along the locus of the broken wire in the distribution from a conductor with a wire breakage, while such a pattern cannot be observed in that from normal conductors without such breakages. In practice, however, the HTS-SQUID equipment is too large and heavy to be carried by an inspection robot. The authors of [16] proposed that the acoustic signal generated as a result of corona effects can be used as a damage symptom, as its intensity usually increases after the occurrence of damage or after contamination of the surface of a conductor. Signals generated as results of damage and contamination can be distinguished by methods based on radio frequency (RF) signal interference or by classical acoustic signal analysis methods. In [17] it is proposed that the broken steel strands in transmission lines can be detected by magnetizing the steel strands with coils around the cable or a permanent magnet, but the developed transducer scan will not detect broken aluminum strands in transmission lines. The research described in [18] suggests that an electromagnetic induction method for detecting flaws might be very feasible. Consequently, a kind of ECT with an absolute probe was developed to provide information to evaluate the serious deterioration in ACSR cables due to forest fires. The excitation coil and detection coil of the absolute probe are the same coil. The probe changes its impedance with changes in the electromagnetic properties and structure of test conductors [19]. As the ECT with a differential probe is very sensitive to defects yet relatively insensitive to ambient magnetic field and temperature variations, the differential probe composed of differential coils based on the concept of electromagnetic induction was developed to detect flaws in transmission lines by [20]. The excitation coil and detection coil of the differential probe are also the same coil.
Feature extraction, which is a mapping process from the measured signal space to the feature space, can be regarded as the most important step for intelligent fault diagnosis systems. Representative features associated with the conditions of tested components should be extracted by using appropriate signal processing and calculation techniques. Over the past few years, many techniques including Fourier Transform (FT), envelope analysis, wavelet analysis, empirical mode decomposition (EMD) and time-frequency distributions were employed to process detection signals [21,22,23]. Based on these processing techniques, statistic calculation methods, autoregressive model (AR), singular value decomposition (SVD), principal component analysis (PCA) and independent component analysis (ICA) have been adopted to extract representative features for fault diagnosis [24,25,26]. Among the algorithms suitable for non-stationary time-series data such as the case of signal processing for detecting broken strands in transmission lines, the wavelet is found to be most efficient since its multi-resolution decomposition contains time domain information of the signal at different scales. Although wavelets are a promising tool for detecting and extracting relevant features of various types of non-stationary time series data, they are still not optimal since they are a set of band pass filters with no exact cut-off frequency. Besides, wavelet-based methods require more examples for training a large number of neural networks for pattern classification, so even though several techniques have been proposed in the literature for feature extraction, implementation of a diagnostic tool for real-world monitoring applications still remains a challenge because of the complexity of machinery structures and operating conditions. The S-transform, introduced by Stockwell et al. [27,28], which combines the separate strengths of the STFT and wavelet transforms, has provided an alternative approach to process the non-stationary signals. It employs a variable window length. The frequency-dependent window function produces higher frequency resolution at lower frequencies, while at higher frequencies, sharper time localization can be achieved. Furthermore, the S-transform has an advantage in that it provides multi-resolution analysis while retaining the absolute phase of each frequency. This has led to its application for detection and interpretation of time series events in a variety of disciplines. Some examples are analysis of the time variation in the amplitude and phases of sea level data in oceanography, analysis of seismic waveforms and electrocardiogram data in cardiology, power quality disturbance data, etc. Thus, the S-transform has become a valuable tool for the analysis of signals in many applications [29,30,31,32,33]. Approaches for automated detection and classification of time-series data, proposed recently based on K-nearest neighbor classifiers, fuzzy logic-based pattern recognition system, artificial neural networks, (ANN), support vector machine (SVM), fuzzy logic and evolving algorithms (EA) have all been successfully applied to automated detection and diagnosis of the conditions of different kinds of components [30,31,32,33,34]. They have largely improved the reliability and automation of fault diagnosis systems for facilities.
In this study, a method for detecting broken strands in transmission lines using an ECT carried by an inspection robot is proposed. The ECT is composed of an excitation coil and differential detection coils, which are composed in turn of the same two coils connected in subtractive series. The differential detection coils are separated from the excitation coil, and only used to receive the magnetic field variation information. This paper also presents a novel feature extraction scheme that incorporates the S-transform and a multi-classification SVM for quantitatively identifying broken strands in transmission lines. The proposed approach utilizes the S-transform to extract the module and phase information at each frequency point from detection signals. Through module and phase comparison, the characteristic frequency points are ascertained. The degree of confidence of broken strands identification is defined by SFE-BSICD. The proposed approach combines module information while utilizing phase information, SFE-BSICD and energy of detection signal, so the reliability is greatly improved. These feature qualities of broken strands in transmission line is extracted and used as the input of an SVM with multi-classification, then the number of broken strands can be determined. To further improve the accuracy of classification, a penalty parameter of the error term kernel parameter for the SVM is optimized by a genetic algorithm (GA) technique. The possibility of detecting defects in transmission lines is then studied in field experiments.

2. Feature Extraction from Detection Signals Employing an S-Transform

2.1. S-Transform

2.1.1. The Continuous S-Transform

The STFT is commonly used in time-frequency signal processing. One of its drawbacks is the fixed width and height of the analysis window, which causes misinterpretation of signal components with periods longer than the window width, and the finite width limits the time resolution of high-frequency signal components. One solution is to scale the dimensions of the analysis window to accommodate a similar number of cycles for each spectral component, as in wavelets [21]. This leads to the S-transform introduced by Stockwell et al. [27]. Like the STFT, it is a time-localized Fourier spectrum which maintains the absolute phase of each localized frequency component. Unlike the STFT, the S-transform has a window whose height and width are frequency-varying. The S-transform is originally defined with a Gaussian window whose standard deviation is scaled to be equal to one wavelength of the complex Fourier spectrum. The S-transform of a time signal h(t) as defined in [27,28] is:
Energies 04 01278 i002
where σ is scale factor and σ = 1/| f |; A is an amplitude factor and A = (τ,f); e(τ,f) is a phase factor. The normalizing factor | f | / 2 , in (1) ensures that, when integrated over all τ, S(τ,f) converges to H(f), the Fourier transform of h(t):
+ S ( τ , f ) d τ = + h ( t ) e 2 π i f t d t = H ( f )
It is clear that (2) can be obtained from S(τ,f), therefore, the S-transform is invertible. The S-transform can be derived from the continuous wavelet transform (CWT) [28]. Precisely, as it is presented in the literature [21], the CWT W(τ,f) of a signal h(t) can be defined as a series of correlations of the time series with a function called mother wavelet:
Energies 04 01278 i003
where ω(τ,d) is a scaled replica of the fundamental mother wavelet. The dilatation parameter d determines the width of the wavelet ω(τ,d) and, thus controls the resolution. Some conditions as admissibility and zero mean [21] are imposed on the mother wavelet ω(τ,d). The S-transform S(τ,f) of a signal h(t) is defined as a CWT with a particular wavelet multiplied by the phase factor:
S ( τ , f ) = e i 2 π f τ W ( τ , d )
where the mother wavelet is defined as:
ω ( t , f ) = f 2 π e t 2 f 2 2 e i 2 π f t
The factor d is the inverse of the frequency f. The mother wavelet in (5) does not satisfy the zero mean condition for an admissible wavelet (which is a restriction of wavelet transforms); therefore, (4) is not strictly a CWT.
From the two last equations, the S-transform is defined as by the same equation as (1). If the S-transform is indeed a representation of the local spectrum, one would expect a simple operation of averaging the local spectra over time to give the Fourier transform. This shows that the S-transform is a generalization of the Fourier transform to non-stationary time series and, therefore, it is adapted in our case with the signal of detecting broken strands in transmission line.

2.1.2. The Discrete S-Transform

Let h[kT], k = 0,1,…,N − 1 denote a discrete time series, corresponding to x(t), with a time sampling interval of T. The discrete Fourier transform is given by:
Energies 04 01278 i004
where n = 0,1,…,N − 1. In the discrete case, the S-transform is the projection of the vector defined by the time series h[kT] on to a spanning set of vectors [21]. The spanning vectors are not orthogonal, and the elements of the S-transform are not independent. Each basis vector (of the Fourier transform) is divided into N localized vectors by an element-by-element product with N shifted Gaussians, such that the sum of these N localized vectors is the original basis vector. Letting fn/NT and τkT, the discrete version of S-transform is given in [28] as follows:
S [ k T , n N T ] = k = 0 N 1 H [ m + n N T ] e 2 π 2 m 2 n 2 e i 2 π m k N = A [ k T , n N T ] e ( k T , n N T )
where A(kT,n/(NT)) is magnitude factor of discrete S-transform. e(−kT,n/(NT)) is phase factor of discrete S-transform. The multi-resolution S-transform output is a complex matrix, the rows of which are the frequencies and the columns are the time complex values, the complex values can be converted to magnitude and phase angle values.

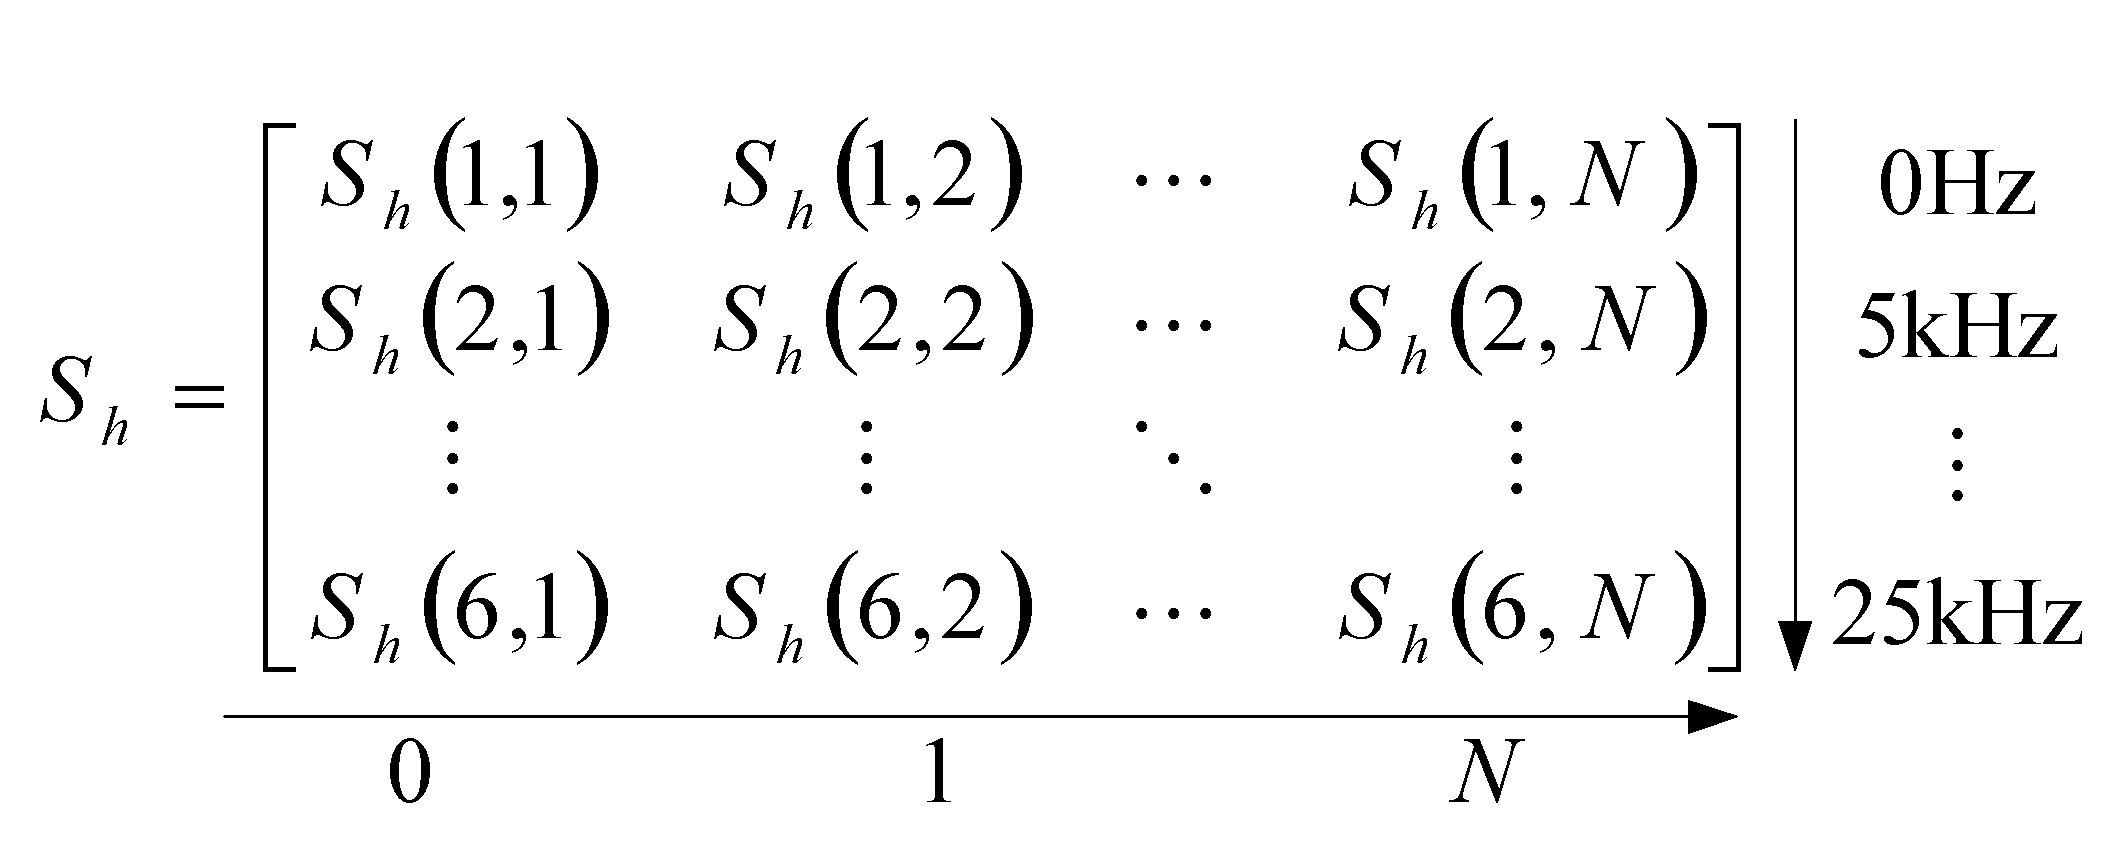
2.2. Feature Extraction Based on the S-Transform

Papers [31,32] study the superior performance of S-transform in detecting frequency components and the showing-up time of high frequency components compared with other methods. Paper [28] studies the magnitude-frequency and phase-frequency characteristic extracted by the S-transform. Four simulated ideal synthetic signals were used to evaluate the performance of magnitude-frequency and phase-frequency characteristic extraction by [35], which proposed that the larger of the amplitude of the frequency point, the more reliable the phase angle of the frequency point. It was also proposed that the amplitude-frequency and phase-frequency characteristics of the sampling point can be correctly calculated by the S-transform.
In this study, the sampling rate is 1 Ms/s, h(t) can be denoted as h(k) after sampling, so k = N, and N is the number of sampling points, h(k) can be denoted as:
h ( k ) = [ h ( 1 ) h ( 2 ) h ( N ) ]
The time-frequency matrix Sh can be calculated by h(k) based on the S-transform. According to the principle of the S-transform, each row of the matrix Sh corresponds to a frequency component of the detection signal, and each column of the matrix corresponds to a sampling point, so the rows of the matrix Sh represent the frequency components of 0 Hz to 25 kHz with interval of 5 kHz and the size of the matrix Sh is 6 × N, and can be denoted as shown in Figure 1.
The module and phase of each element in the matrix Sh can be calculated by:
ρ ( S h ( m , k ) ) = x n ( m , k ) 2 + y n ( m , k ) 2
θ ( S h ( m , k ) ) = arctan ( y n ( m , k ) / x n ( m , k ) )
where Sh(m,k) = xn(m,k) + jxn(m,k), j is the imaginary unit; m = 1,2,…,301, k = 1,2,…,N, ρ(·) represents the calculation of module, and θ(·) the calculation of phase. Then the module matrix ρ_Sh and phase matrix θ_Sh of the detection signal can be obtained.
Figure 1. Shape of Sh.
Energies 04 01278 g001
The columns of the matrix ρ_Sh can be ranked in order of size, the frequency component with maximum amplitude and maximum frequency is called the feature frequency component, whose module and phase are ρ_Shmax and θ_Shmax, respectively.
It is considered that the accuracy of the phase can be verified by the module [35], then broken strands identification confidence degree (BSICD) at the can be defined as:
λ n ( k 0 ) = ρ _ S h max ( k 0 ) ρ 1 _ S h ( k 0 ) + ρ 2 _ S h ( k 0 ) + + ρ 6 _ S h ( k 0 )
where, k0 is the sampling point, and the larger of λ (k), more number of broken strands in cable.
It is proposed by [35,36] that Shannon fuzzy entropy (SFE) can characterize the uncertainty and fuzzy property of an event. The SFE can be expressed as:
S ( x ) = n = 1 N [ x n log 2 x n + ( 1 x n ) log 2 ( 1 x n ) ] x = [ x 1 , x 2 , , x n ] T [ 0 , 1 ] N
Two-dimensional SFE is shown in Figure 2. It can be seen from the figure that SFE is a non-monotonic function, so λn(k) can be mapped from the interval [0,1] to the interval [0.5,1], in which SFE shows a decreasing monotonic. The mapped function λ*n(k) in the interval of [0.5,1] can be expressed as:
λ n ( k ) = ( λ n ( k ) + 1 ) 2
Then BSICD can be fused by SFE, and SFE-BSICD can be defined as:
α n = 1 S ( λ n ) / N
where S(λ*n) can be expressed as:
S ( λ n ) = k = 1 N { λ n ( k ) log 2 λ n ( k ) + [ 1 λ n ( k ) ] log 2 ( 1 λ n ( k ) ) }
So the larger of BSICD, the more number of broken strands in transmission line, whereas the smaller SFE and SFE-BSICD will be.
At the same time the energy of the signal can be calculated and as a quality feature, the energy E of the detection signals is defined as:
E j = k = 1 N S ( j , k ) 2
Figure 2. Two-dimensional Shannon fuzzy entropy.
Energies 04 01278 g002

3. Multi-Classification Support Vector Machine

Support Vector Machine (SVM) is a useful technique for data classification [37]. A classification task usually involves training and testing data which consist of some data instances. Each instance in the training set contains one “target value” (class labels) and several “attributes” (features). The goal of SVM is to produce a model which predicts the target value of data instances in the testing set when given only the attributes.
Given a training set of instance-label pairs (xi, yi), i = 1,2,…,N, where xi Rn and y {−1,+1}N, the SVM requires the solution of the following optimization problem:
min ω , b , ξ      1 2 ω T ω + C i = 1 N ξ i
Subject to      y i ( ω T ϕ ( x i ) + b ) 1 ξ i
ξ i 0
Here training vectors xi are mapped into a higher (maybe infinite) dimensional space by the function ϕ ( x ) = [ ϕ 1 ( x ) , ϕ 2 ( x ) , ... , ϕ N ( x ) ] T . The SVM finds a linear separating hyper plane with the maximal margin in this higher dimensional space. ω = [ω1,ω2,…,ωN]T is the linear weight vector which link the feature space to output space, b is the threshold. C > 0 is the penalty parameter of the error term. Furthermore, K(xi, yi) = ϕ (xi)·(xi, yj) is called the kernel function. In this study, Gaussian radial basis function is used as kernel function:
K ( x i , x j ) = exp ( γ x i x j 2 )
where γ is kernel parameter, and γ > 0.
The optimization problem can be solved by the Lagrange method of multipliers. A Lagrange function can be created:
L = 1 2 ω T ω + C i = 1 N ξ i i = 1 N β i ξ i i = 1 N α i { y i [ ω T ϕ ( x i ) + b ] 1 + ξ i }
Putting L / ω = 0 , L / b = 0 , L / ξ = 0 , then the following are obtained: ω = i = 1 N α i y i ϕ ( x i ) , i = 1 N α i y i = 0 , C = αi + βi, and plugging them into formula (19), then the problem of finding the minimum of L can be transferred to its dual:
min α      1 2 α T Q α e T α
Subject to     y T α = 0
0 α i C      i = 1 , 2
Given the C and γ, α results from solving the expression (20), then ω comes correspondingly. The classification threshold can be calculated based on the Karush-Kuhn-Tucker (KKT) conditions, so the decision function is:
y = sgn [ i = 1 N α i y i K ( x i , x j ) + b ]
The SVM is a binary classifier, whereas detecting broken strands in cables is a multi-classification problem. To detect the different number of broken strands in cable, a multi-classification machine is constructed based on “one-against-one” to solve the multi-classification problem [38]. The basic principle of “one-against-one” is that (N − 1)/2 SVM can be constructed to solve an N class discrimination problem. Every two classes can be distinguished by the trained SVM. It is supposed that the training data belong to the kth and the lth class, the binary classifier can be transferred to the multi-classifier:
min ω , b , ξ      1 2 ( ω k l ) T ( ω k l ) + C i = 1 N ( ξ i k l )      ξ i 0
where if ( ω k l ) T ( ω k l ) + b k l 1 ξ k l , xi belongs to the kth class; If ( ω k l ) T ( ω k l ) + b k l 1 + ξ k l , xi belongs to the lth class. A Genetic Algorithm (GA) is an optimization algorithm simulating biological inheritance and evolutionary processes, which possesses characteristics such as high parallelism, random, global search and self-adaptation, and the solving process of an optimization problem is turned into an adaptive assessment of individuals of the population every generation, and forming a new offspring population by making a choice, crossover and mutation of the parent individuals. By the evolution of eugenic competitions, it finally converges to the individual with best fitness, and thus obtains the optimal solution [39]. In this study, the best parameters of C and γ for SVM are determined by a GA. The goal of the GA is to seek the highest accuracy of classification, so the fitness of the GA is defined as follows:
F i t n e s s = A B A × 100 %
where A is the number of the training data, and B is the number of misclassifications. After being trained with the feature quality of the historic training data, the best parameters C and γ for SVM can be determined.

4. Diagnosis of Broken Strands in Transmission Lines by the Developed ECT

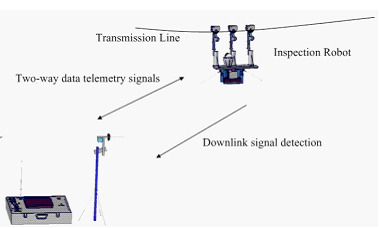
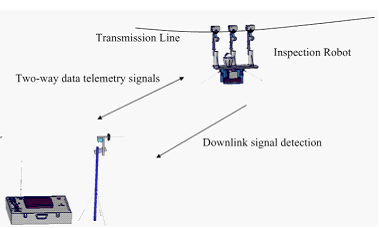
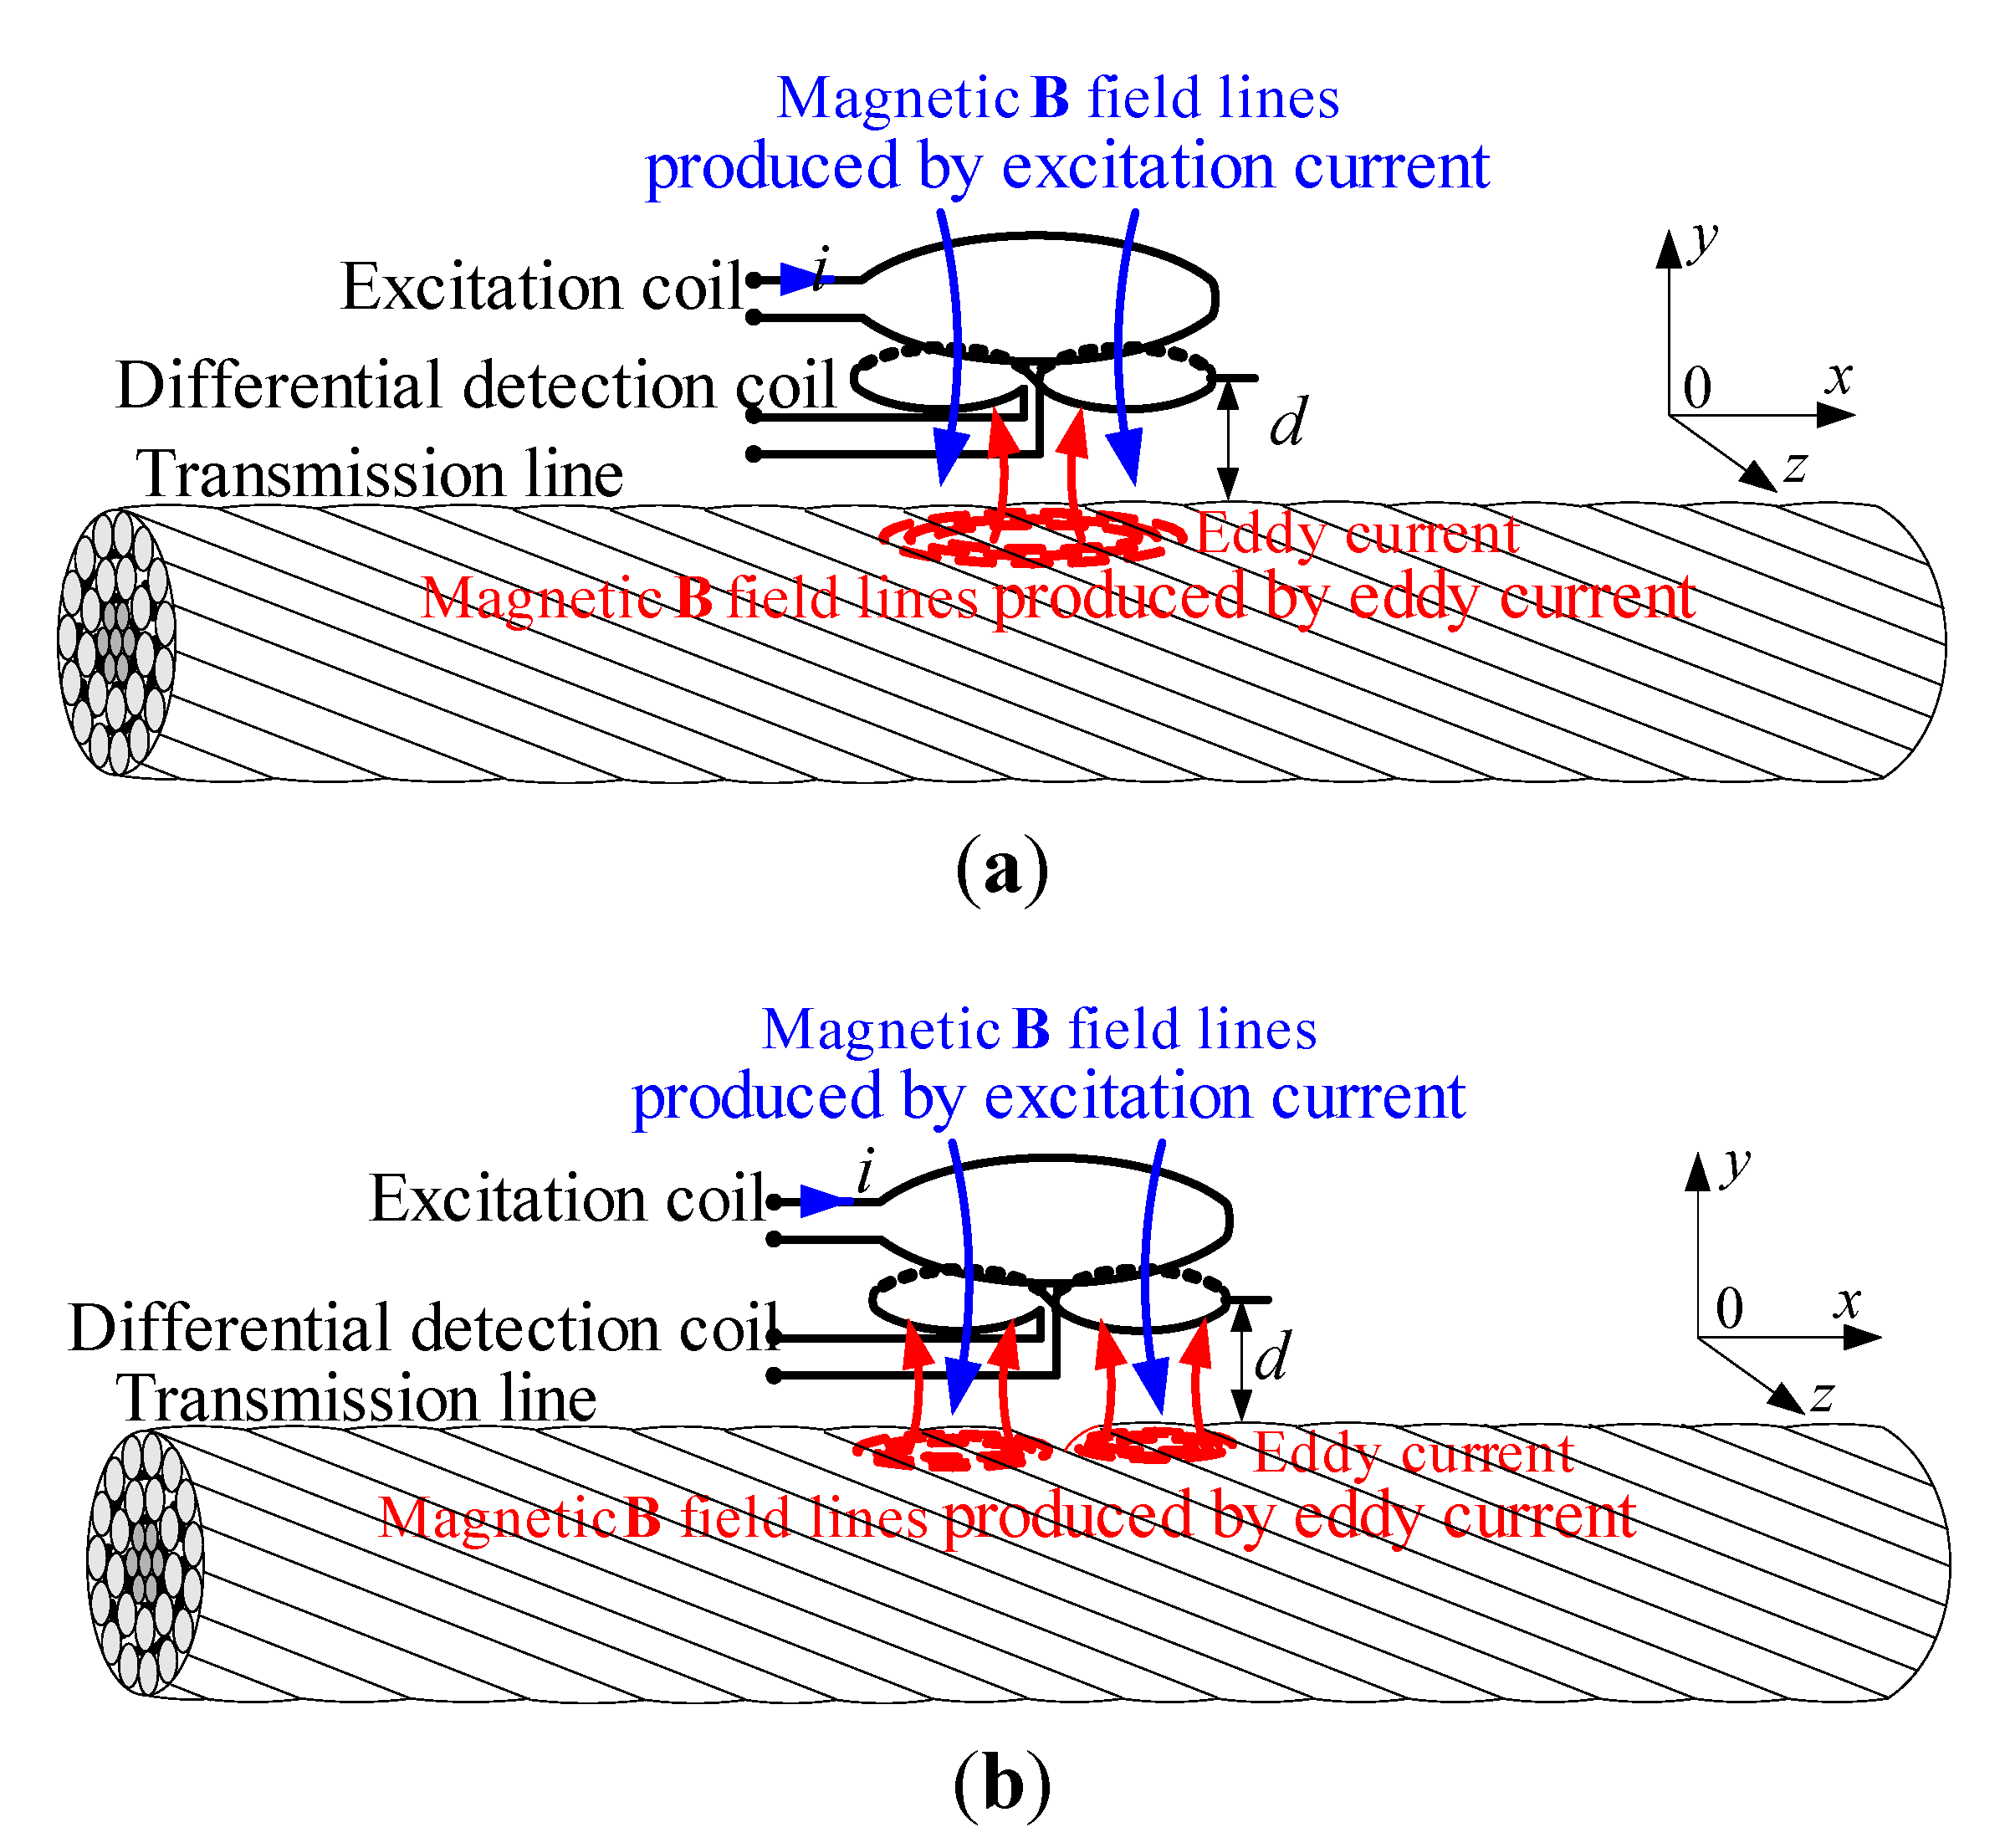
4.1. The Principle for Detecting Broken Strands in Transmission Lines by ECT

The excitation coil and detection coil of the absolute probe developed by [19] and the differential probe developed by [20] are the same coil, while reflection probes have two independent coils, that is the detection coil is separated from the excitation coil, and only used to receive the magnetic field variation information. Thanks to the electrostatic shield effect between the excitation coil and detection coil, the noise of the reflection probe resulting from electrostatic induction is much smaller than that of absolute or traditional differential probe [40] and the reflection probe is more sensitive to defects than an absolute probe [40]. In this study, a kind of ECT with a reflection probe was developed. The detection coil is composed of the same two coils connected in subtractive series.
As we all know, the electrical conductors used as overhead transmission lines are twisted from aluminum wires, such as aluminum conductor steel reinforced (ACSR) cable, so there are small gaps between the single aluminum wires. To avoid disturbance signal results from the gaps between the single wires in cables, the detection coil has two active coils wound in opposition. The principle for detecting broken strands in cable by the developed ECT is shown in Figure 3a,b. When the excitation coil with an AC energized current is over a test sample, an eddy current is induced on the surface of the conductor. The amplitude, phase and flow direction of this eddy current vary with the performance of the cable. If the test cable is flaw-free, the amount of magnetic flux that passes through the two sub-detection coils is the same, and there is no differential signal developed between these two sub-detection coils, which are both inspecting an identical material. However, when one detection coil is over a defect and the other is over good material, the amount of magnetic flux that passes through the two sub-detection coils is different, and a differential signal is produced correspondingly.
Figure 3. Principle of detecting broken strands in transmission line by ECT; (a) perfect transmission line; (b) broken strands in the transmission line.
Energies 04 01278 g003

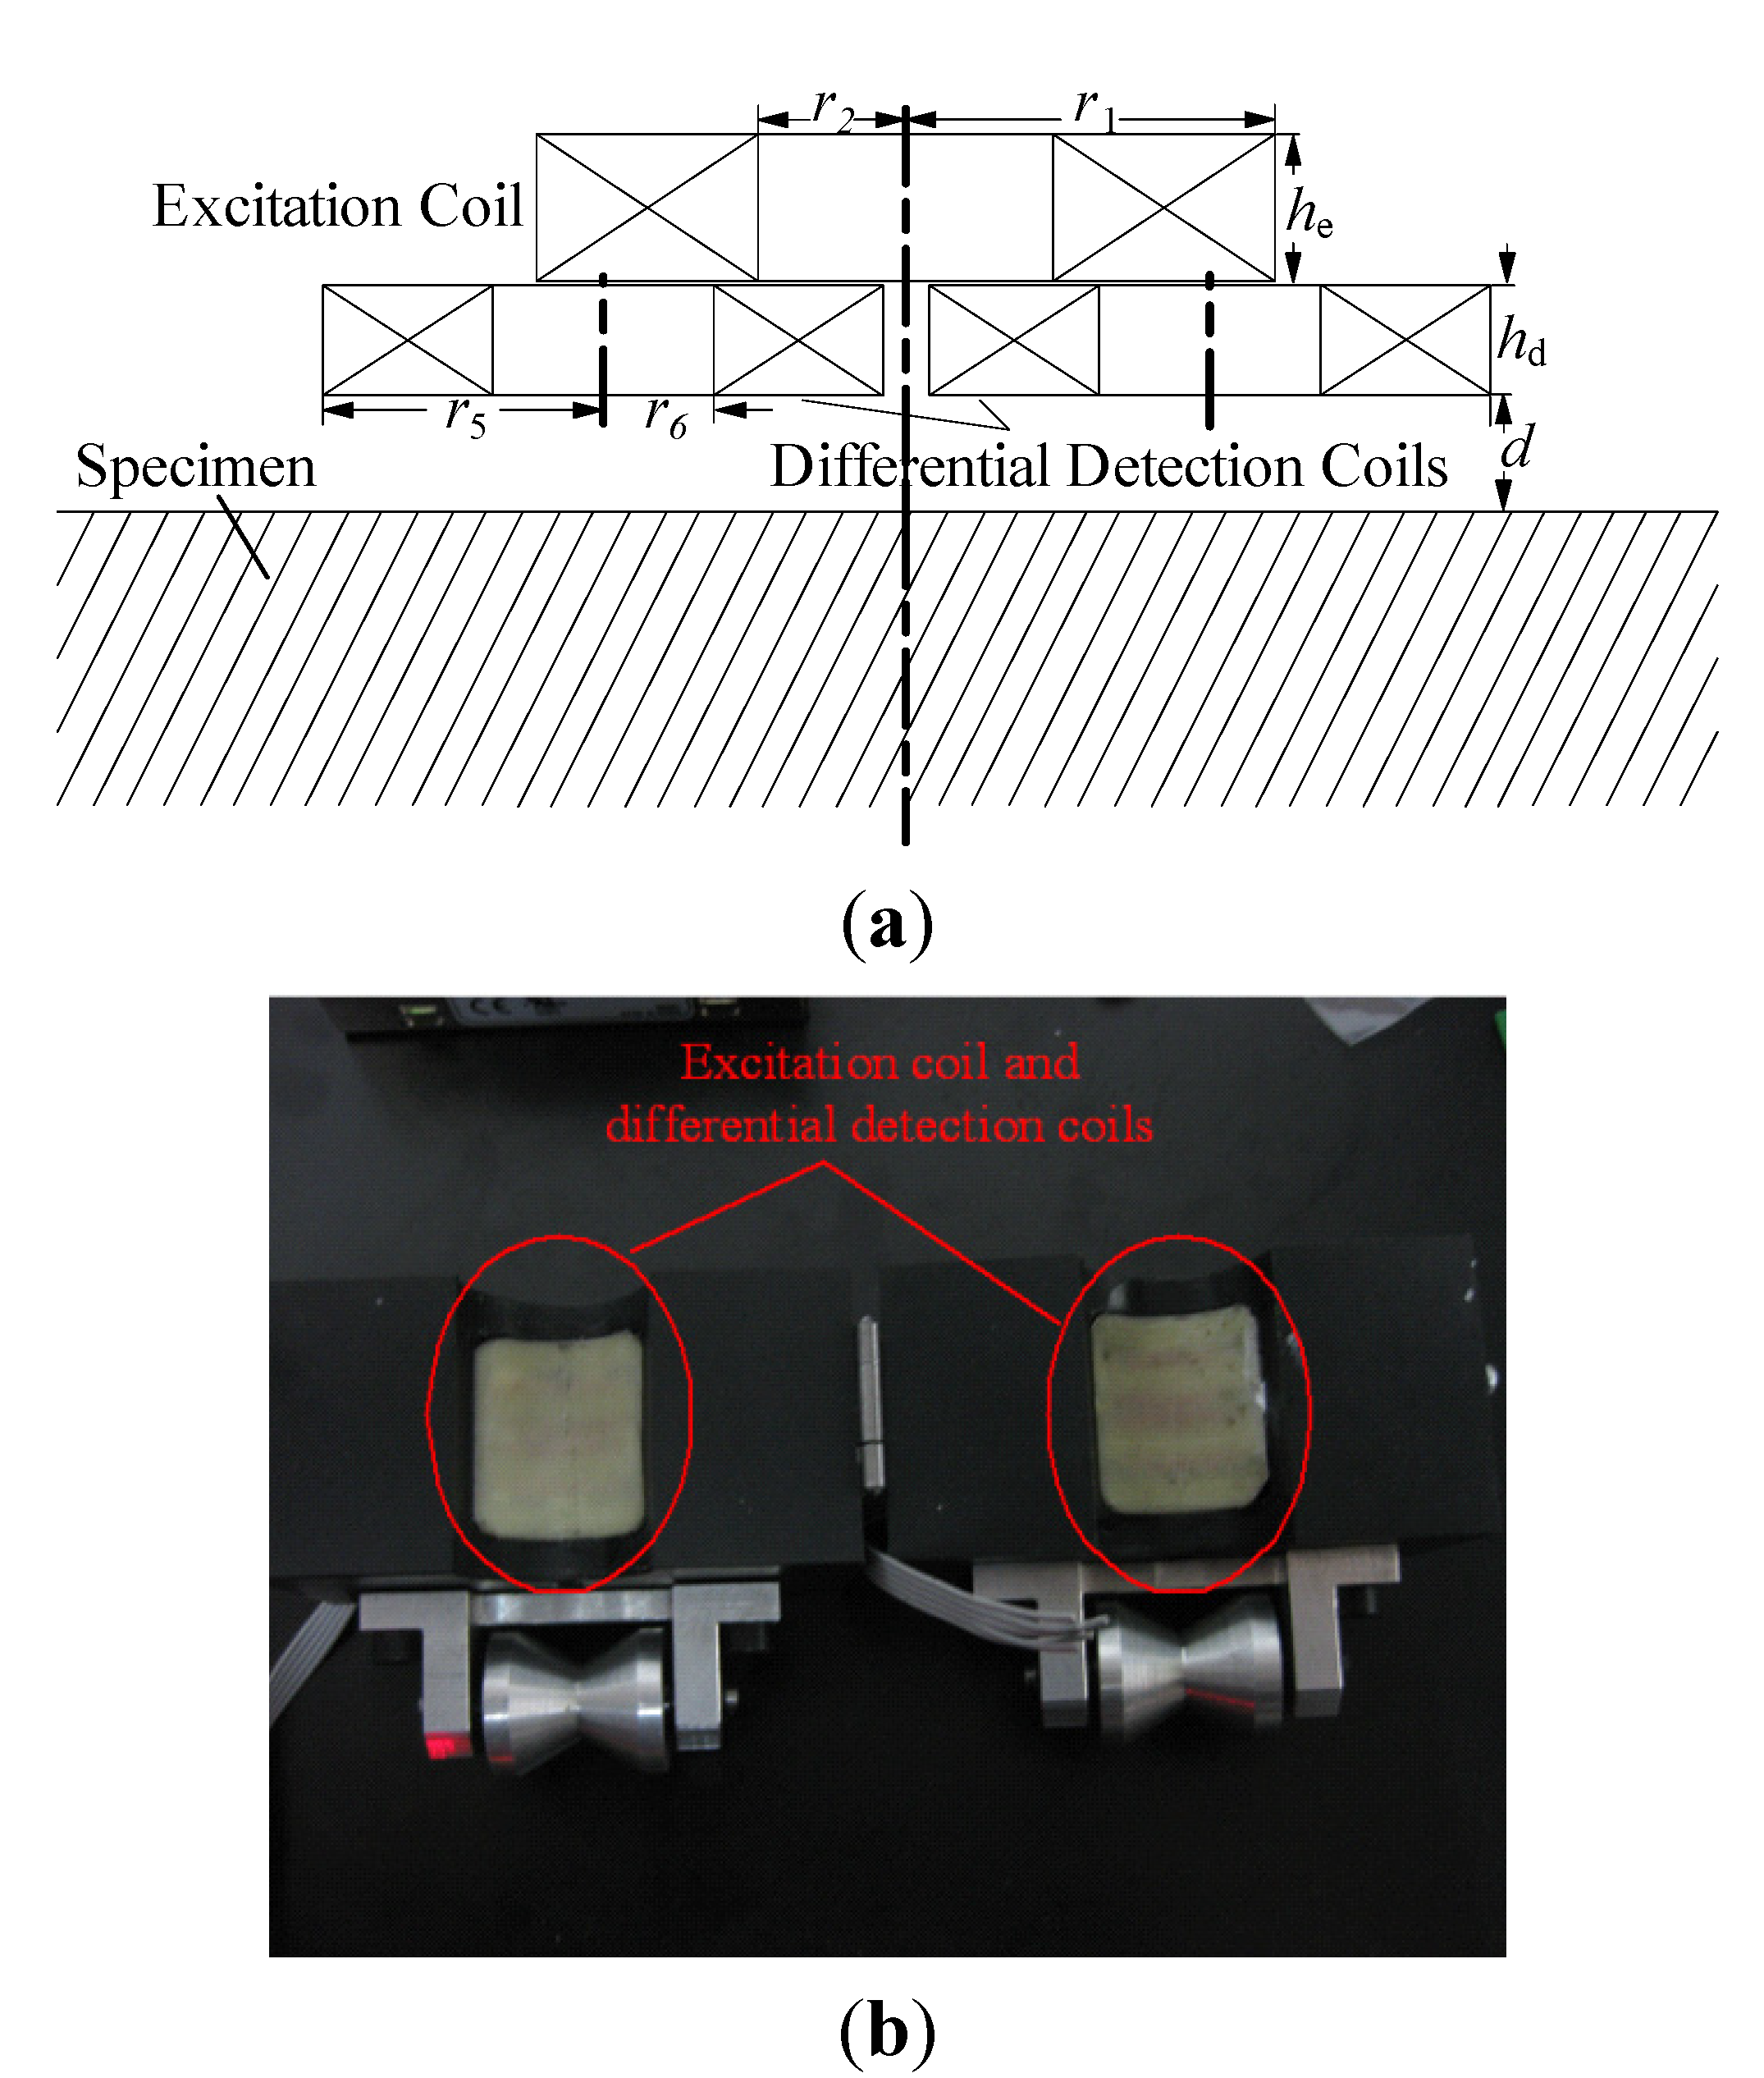
4.2. Structure of the ECT

In this study, a prototype of the ECT probe has been developed for LGJ-240 lines, which are widely used as overhead transmission lines of 220 kV to 500 kV current. The profile and parameters of LGJ-240 are shown in Table 1. The design parameters of the excitation coil and detection coils are shown in Table 2 and Figure 4a, while the developed ECT probe prototype is shown in Figure 4b. The excitation coil is applied with 100 mA AC energized current of 20 kHz.
Table 1. Specimen parameters.
Type of SampleLGJ-240
Material: aluminum Energies 04 01278 i001
Diameter: Dc = 21.6 mm
Diameter of single wire: da = 3.6 mm
Number of aluminum stranded wires: 24
Table 2. Parameters of the ECT probe.
External RadiusInner RadiusHeightTurns
Excitation Coilr5 = 8 mmr1 = 6 mmhe = 6 mm400
Detection Coilr2 = 4 mmr6 = 5 mmhd = 2 mm600
Figure 4. Structure of the ECT probe for detecting broken strands in cable; (a) structure of the ECT probe; (b) prototype of two ECT probes.
Energies 04 01278 g004
The hardware structure of the ECT for detecting broken strands in transmission lines is shown in Figure 5. Figure 5a is the hardware framework of the ECT, and Figure 2b is the hardware prototype of the ECT.
Figure 5. Hardware structure of the ECT for detecting broken strands in transmission lines; (a) hardware framework of the ECT; (b) hardware prototype.
Energies 04 01278 g005
The ECT hardware is mainly composed of a direct digital synthesis source (DDS), signal conditioning circuit (SCC), signal offset circuit (SOC), controller circuit (CC), data acquisition card (DAC), difference amplifier (DA), relay switch array (RSA) and inspection channels switch array (ICSA). The principle and function of each circuit in Figure 5 is described as follows:
(1)
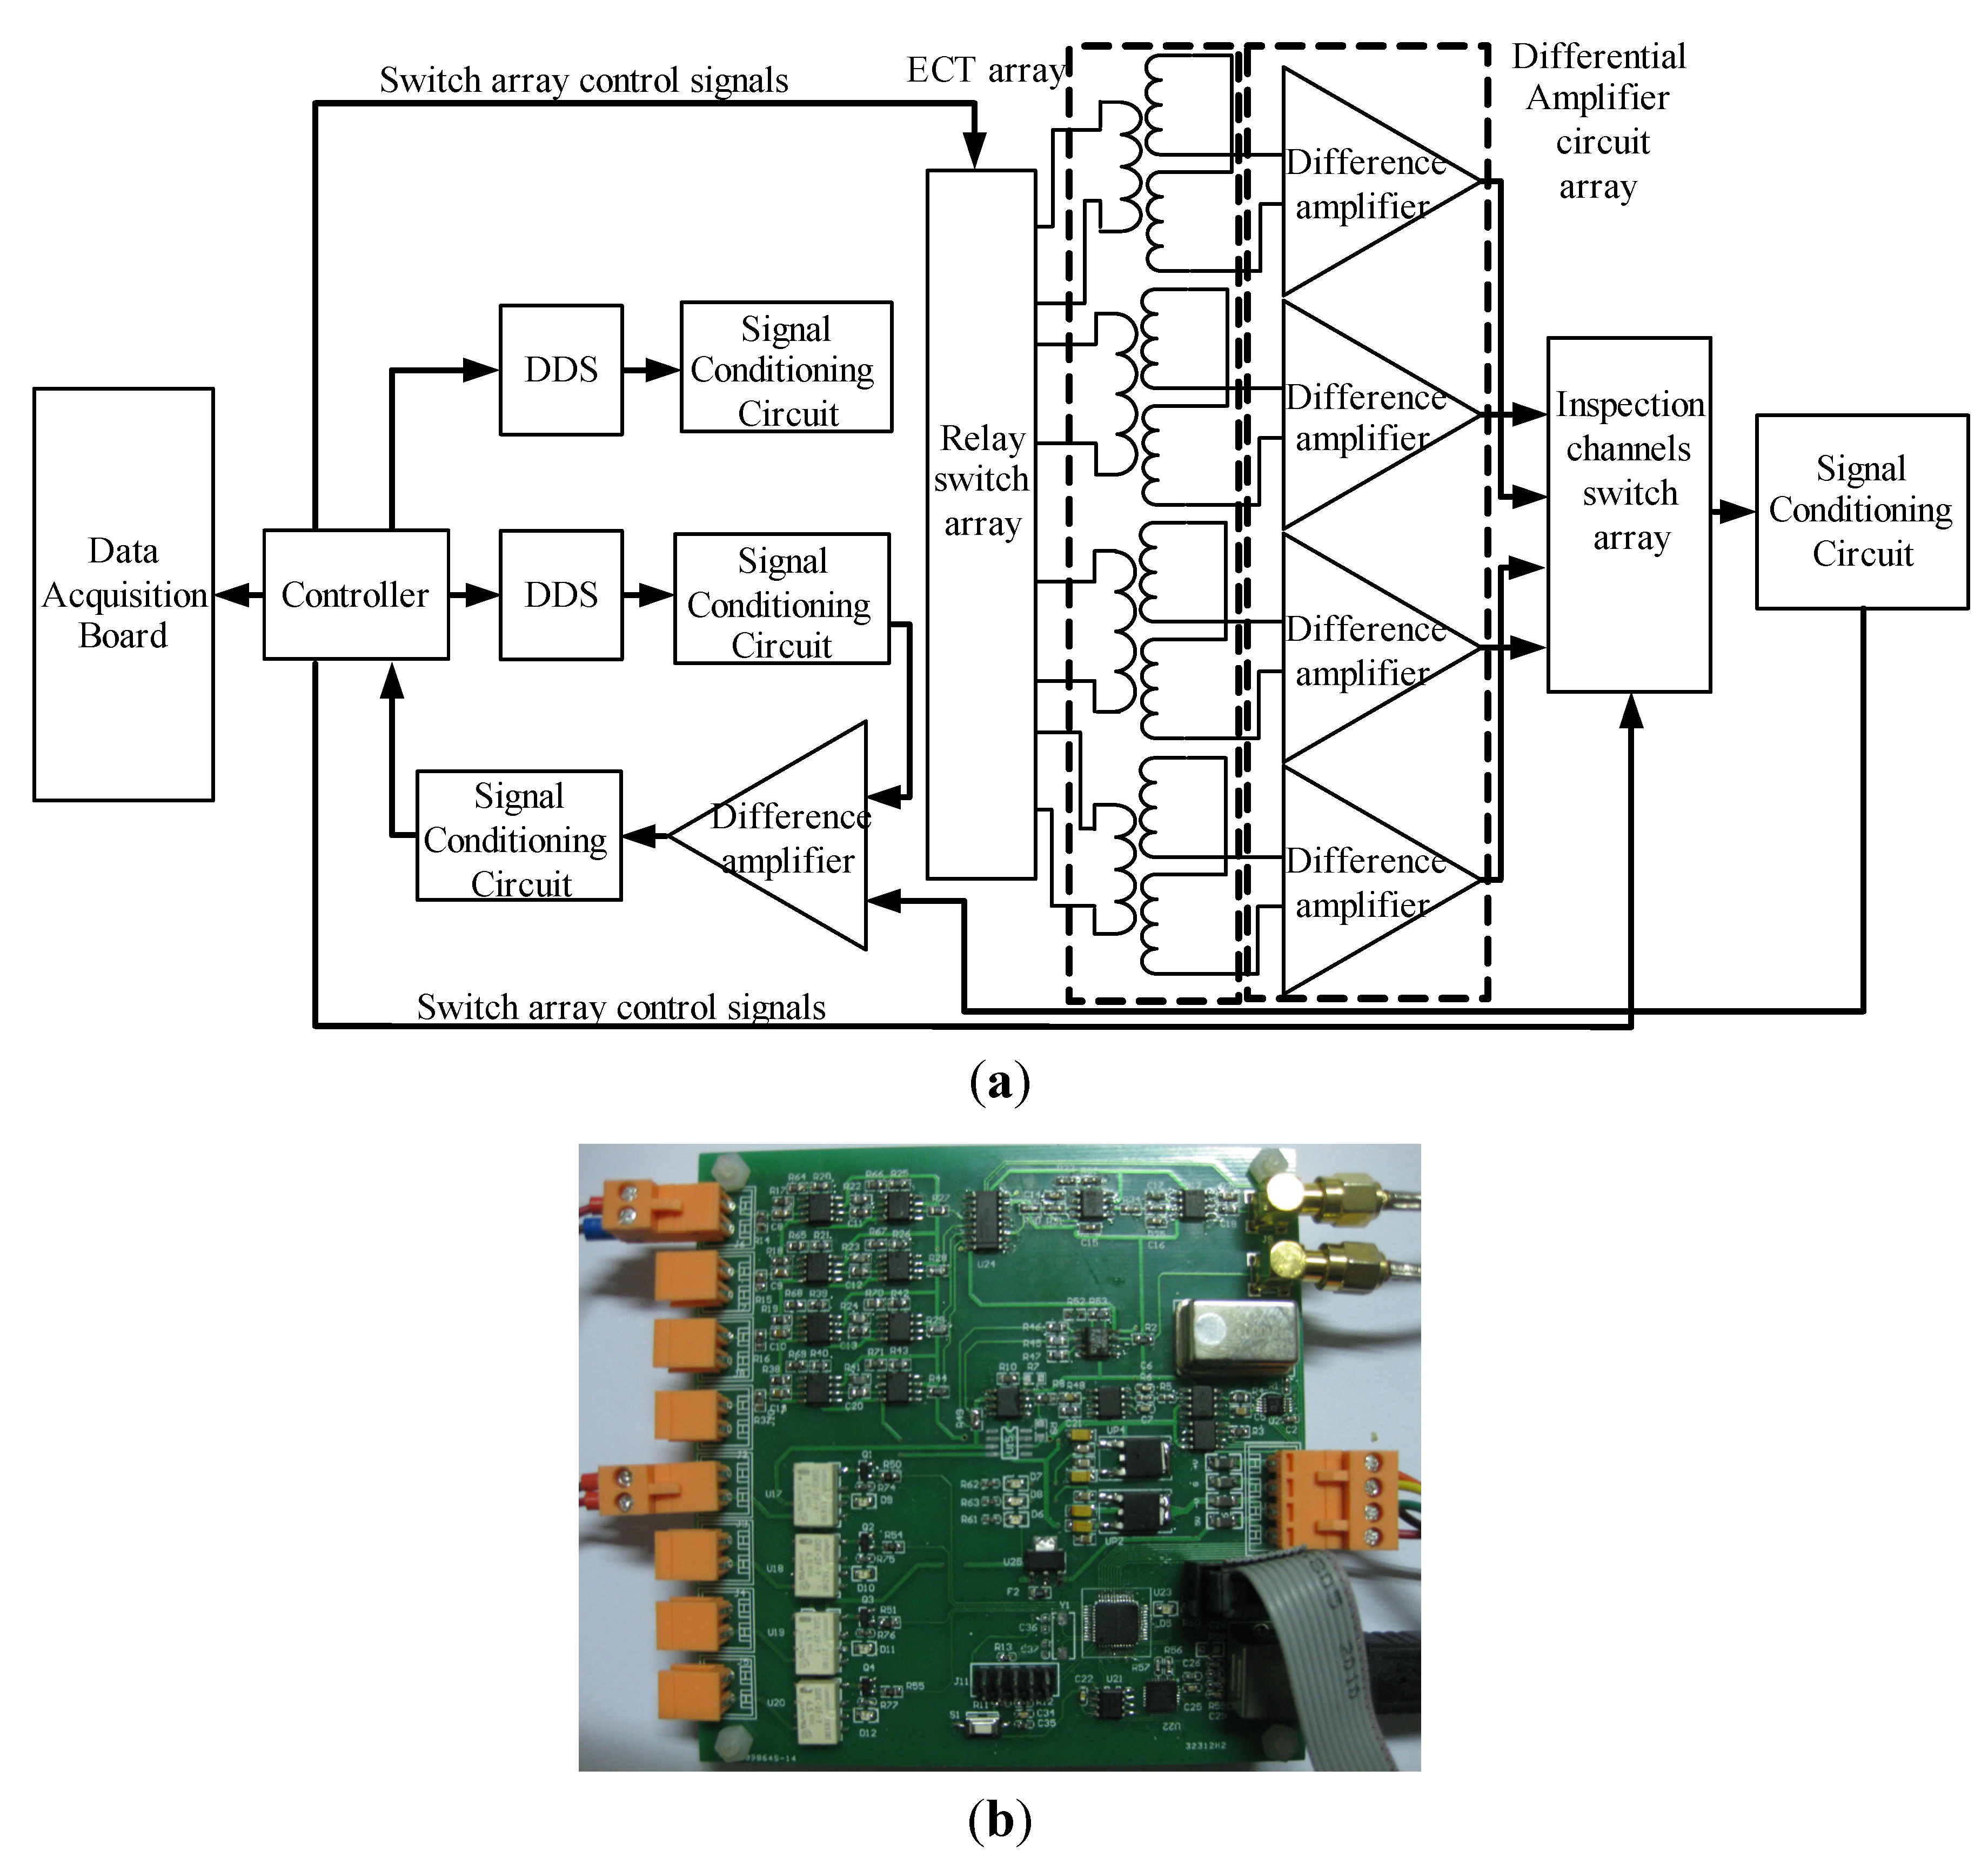
DDS—To detect broken strands in cables, a highly stable energized signal is needed. As we know, the DDS technique involves changing digital signals into analogue signals using a digital-to-analog converter. Compared with other techniques, DDS has the advantages of shorter conversion time consumed, higher frequency resolution, and easier integration. The AD9833 DDS chip is a programmable signal generator, and communicates with the CPU by a serial peripheral interface (SPI).The frequency and phase can be adjusted on-line by the program. Superior signal source performance can be achieved by the AD9833 and a low pass filter, so DDS is applied in this study to produce a highly stable sinusoidal wave energized signal.
(2)
SCC—The SCC includes a filter circuit (FC), amplitude adjustment circuit (AAC) and power amplifier circuit (PAC). The amplitude of the energized signal generated by the DDS can be adjusted by the AAC. In this study, a 100 mA energized current can be obtained after being processed by the AAC. To drive the excitation coil, the energized current needs to be processed by the PAC before being applied to the excitation coil.
(3)
SOC—The induced main field of the differential detection coils can be offset by the SOC, which is composed of the DDS 2, and signal conditioning circuit 2. Then the sensitivity of the detection system can be enhanced.
(4)
CC—The controller circuit is composed of the C8051F340 CPU and the EP2C8Q208 field programmable gate array (FPGA). The FPGA is responsible for the logical control of the whole circuit, such as switching of multi-way switches. The CPU is in charge of controlling the DAC, communicating with the upper computer by SPI or universal serial bus (USB), and changing the frequency and phase of the energized current.
(5)
DAC—In this study, the detection signal is collected by a PCI-5153 DAC developed by National Instruments Inc. The sampling rate is 1 M/s.
(6)
DA—The DA can amplify the detection signals coming from the sub-differential detection coils, which are used to receive the magnetic field variation information.
(7)
RSA—The excitation coils of ECT probes can be energized with the AC current selectively by an RSA under the control of the CC.
(8)
ICSA—The amplified detection signal is sent to the next SCC through the ICSA under the control of the CC.

4.3. Flow of Identifying Broken Strands in Transmission Line
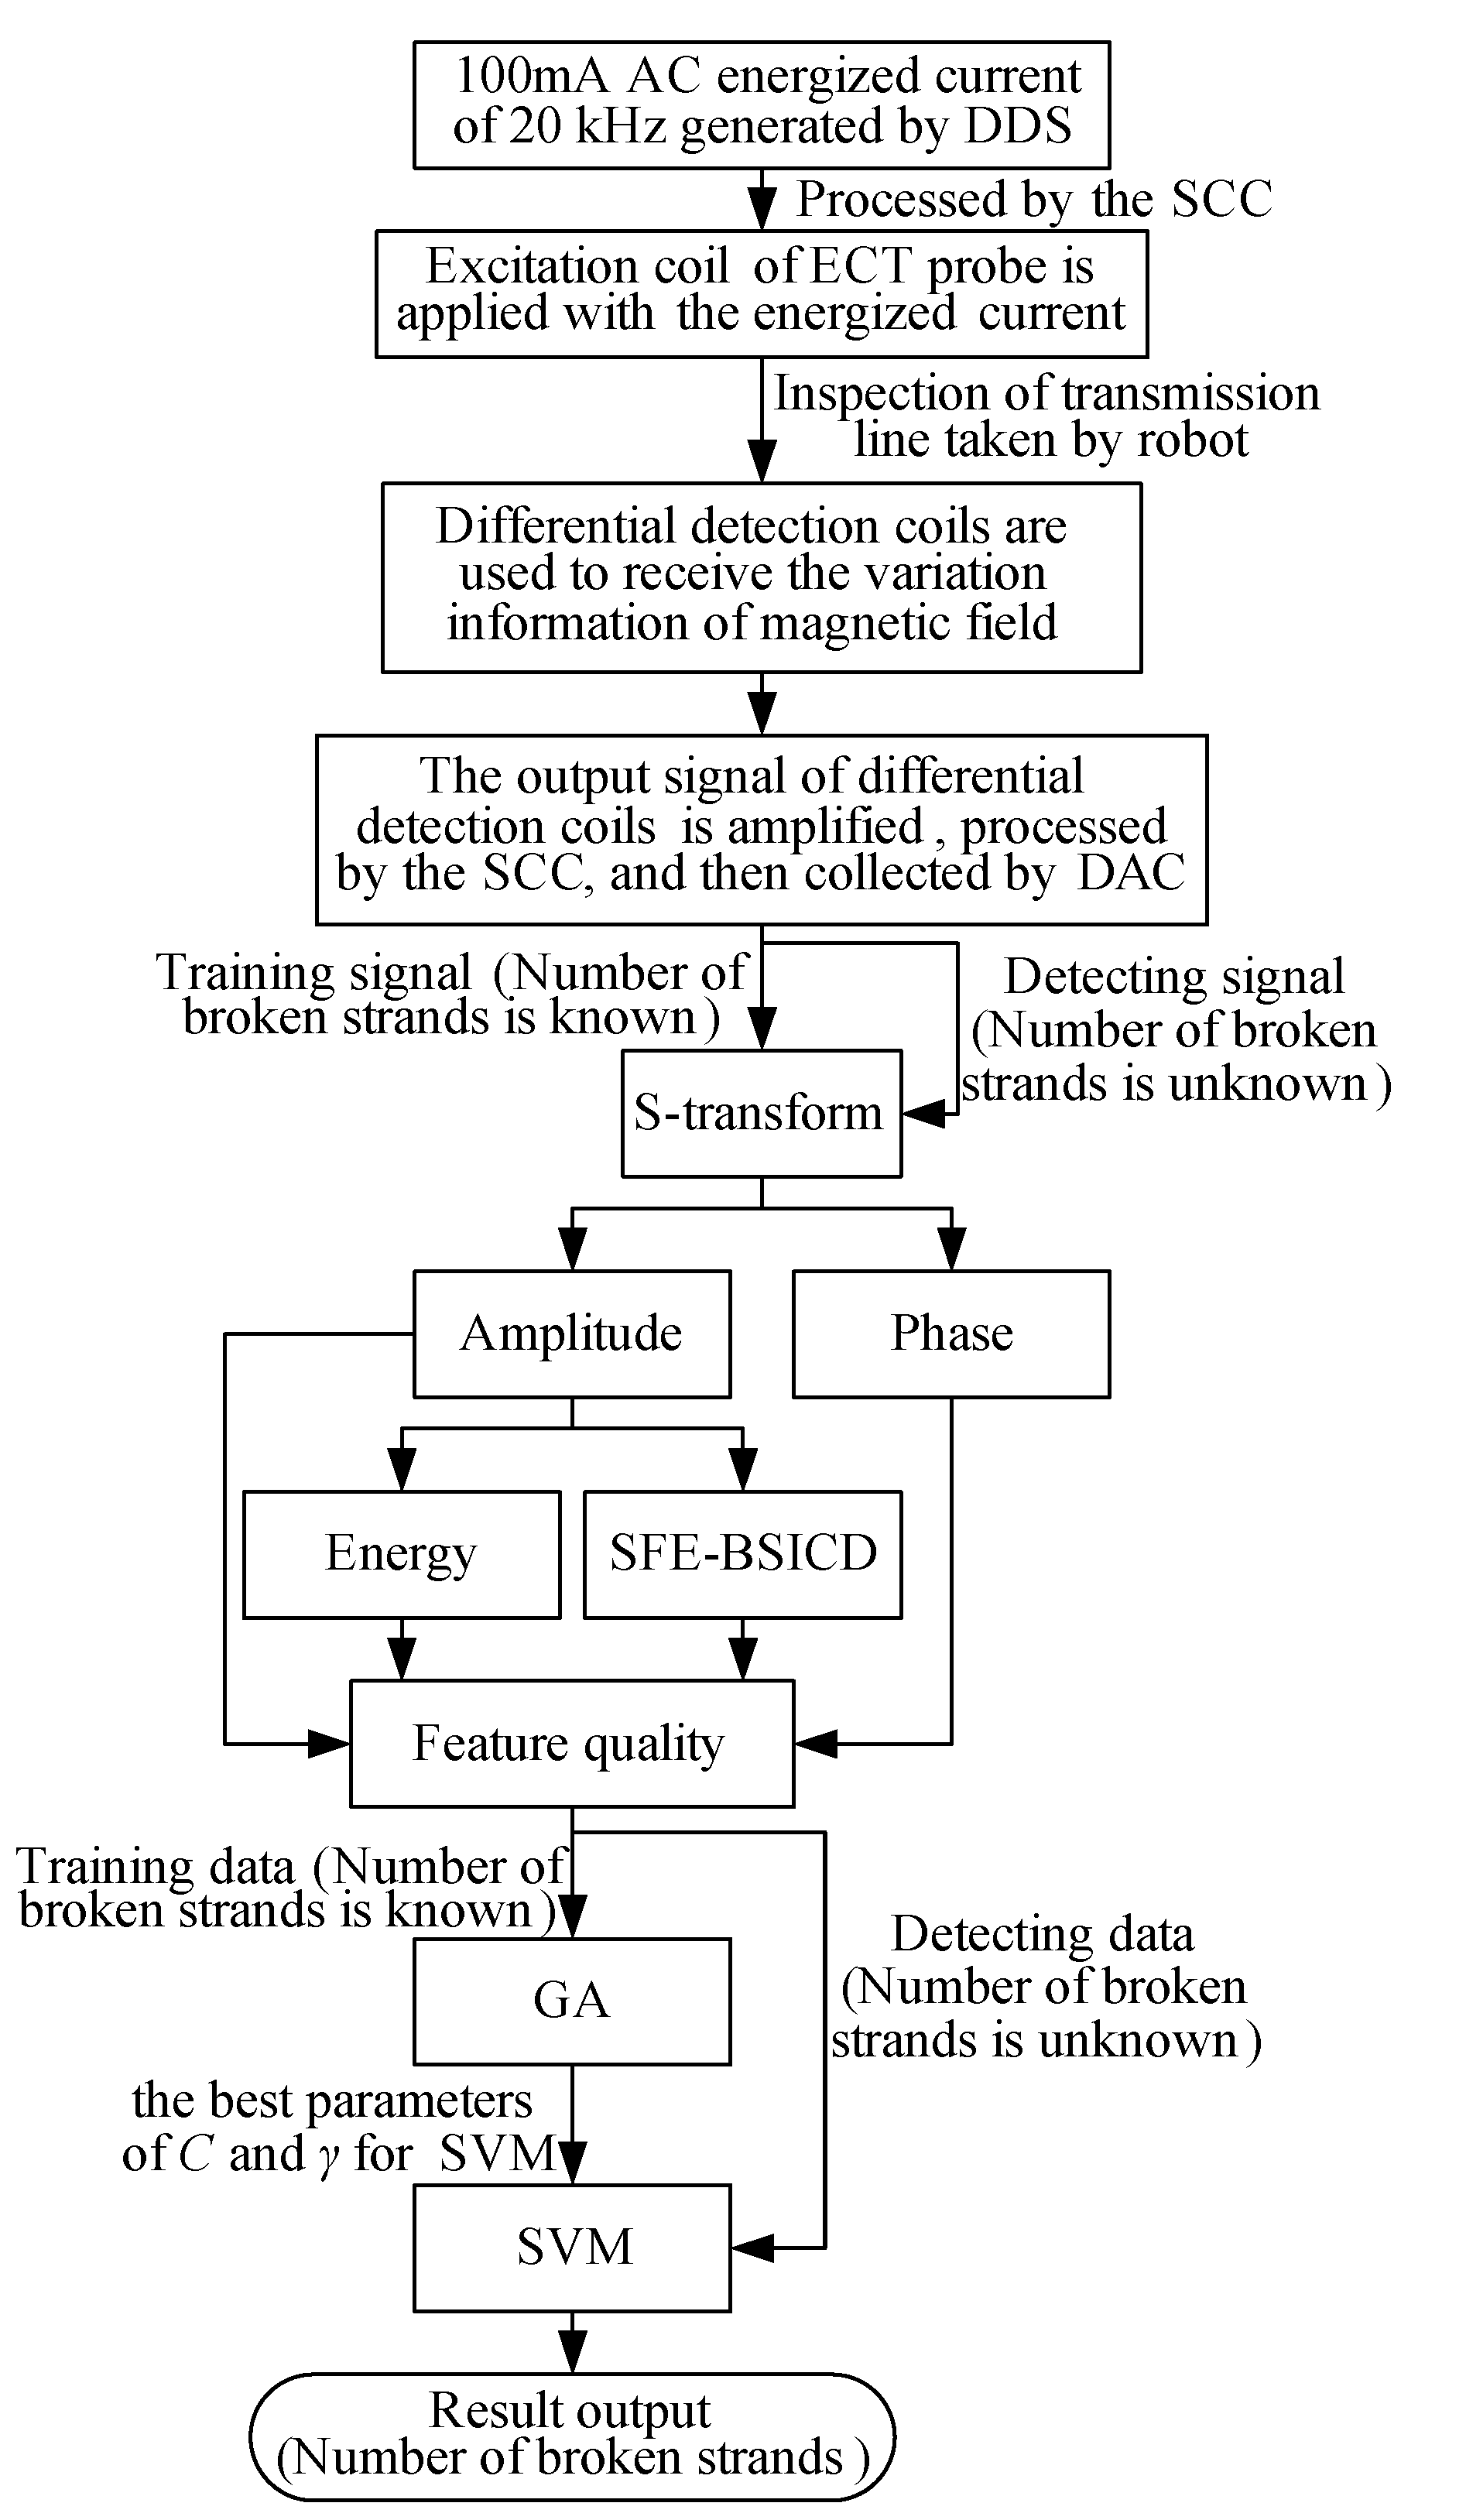
The flowchart of the broken strands identification system is shown in Figure 6. The whole flow for determining the number of broken strands in a transmission line with the ECT based on an S-transform and SVM is as follows:
(1)
The ECT parameters are first determined according to the specific type of transmission line. The 100 mA AC energized current of 20 kHz is generated by the DDS.
(2)
The energized current after being processed by the SCC is then applied to the excitation coil. When the excitation coil with the AC energized current carried by robot is over an inspected transmission line, an eddy current is induced on the surface of conductor. The amplitude, phase and flow direction of this eddy current varies with the performance of the cable.
(3)
The differential detection coils are separated from the excitation coil, and only used to receive the magnetic field variation information. If the inspected transmission line is flaw-free, the amount of magnetic flux passes through two sub-detection coils is the same, and there is no differential signal developed between two sub-detection coils. However, when one coil for detection is over a defect and the other is over good material, the amount of magnetic flux passes through two sub-detection coils is different, and a differential signal is produced correspondingly.
(4)
The output signal of the differential detection coils is amplified by the DA, processed by the SCC, and then collected by the DAC.
(5)
The amplitude and phase of the detection signals can be calculated by the S-transform. Then the energy E and the defined SFE-BSICD of the detection signals can be calculated correspondingly. Thus the amplitude, phase, energy E and defined SFE-BSICD of the detection signals are extracted as feature qualities for indentifying the broken strands in the transmission line.
(6)
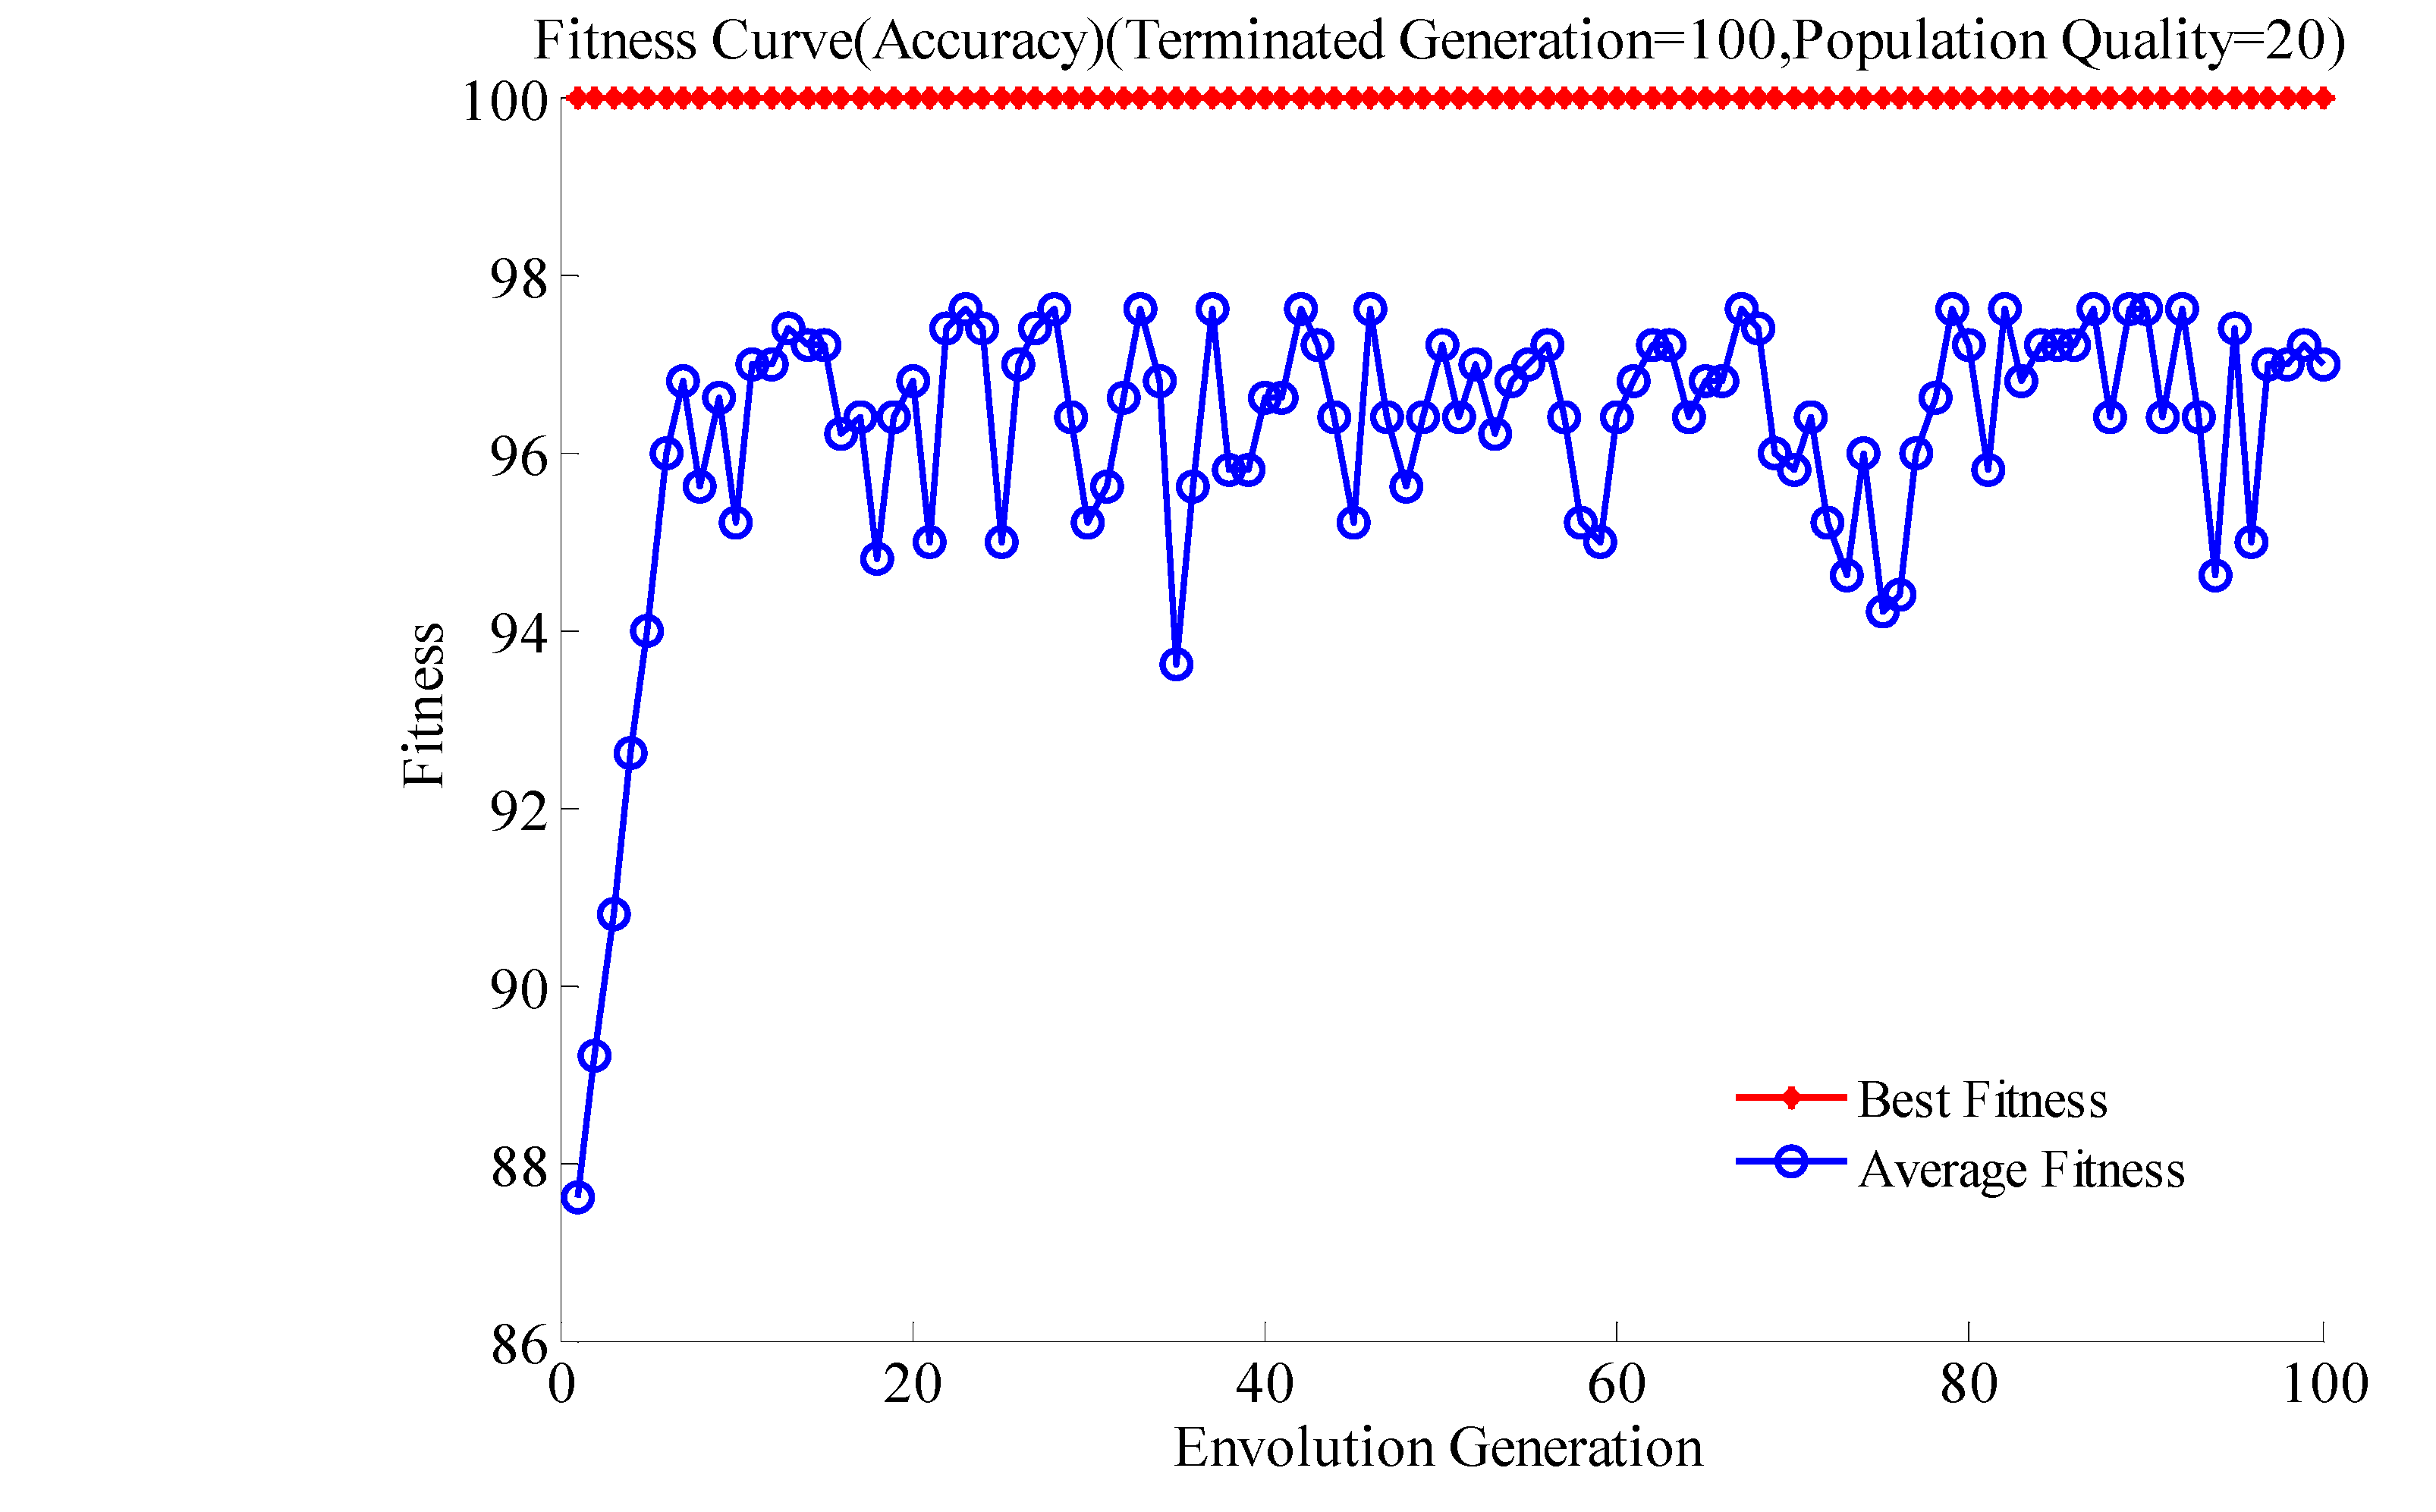
Before detecting broken strands in an inspected transmission line, large amounts of experiments have been taken on the same type of transmission lines, and the number of broken strands in these experiments is known. The four feature qualities of the detection signals are extracted from the detection signals. A group of feature qualities are used to train the SVM. The best parameters of C and γ for SVM are determined by the GA, then the decision function for identifying the number of broken strands can be determined according to the formulas (21) and (22) and the SVM for identifying the number of broken strands is determined.
(7)
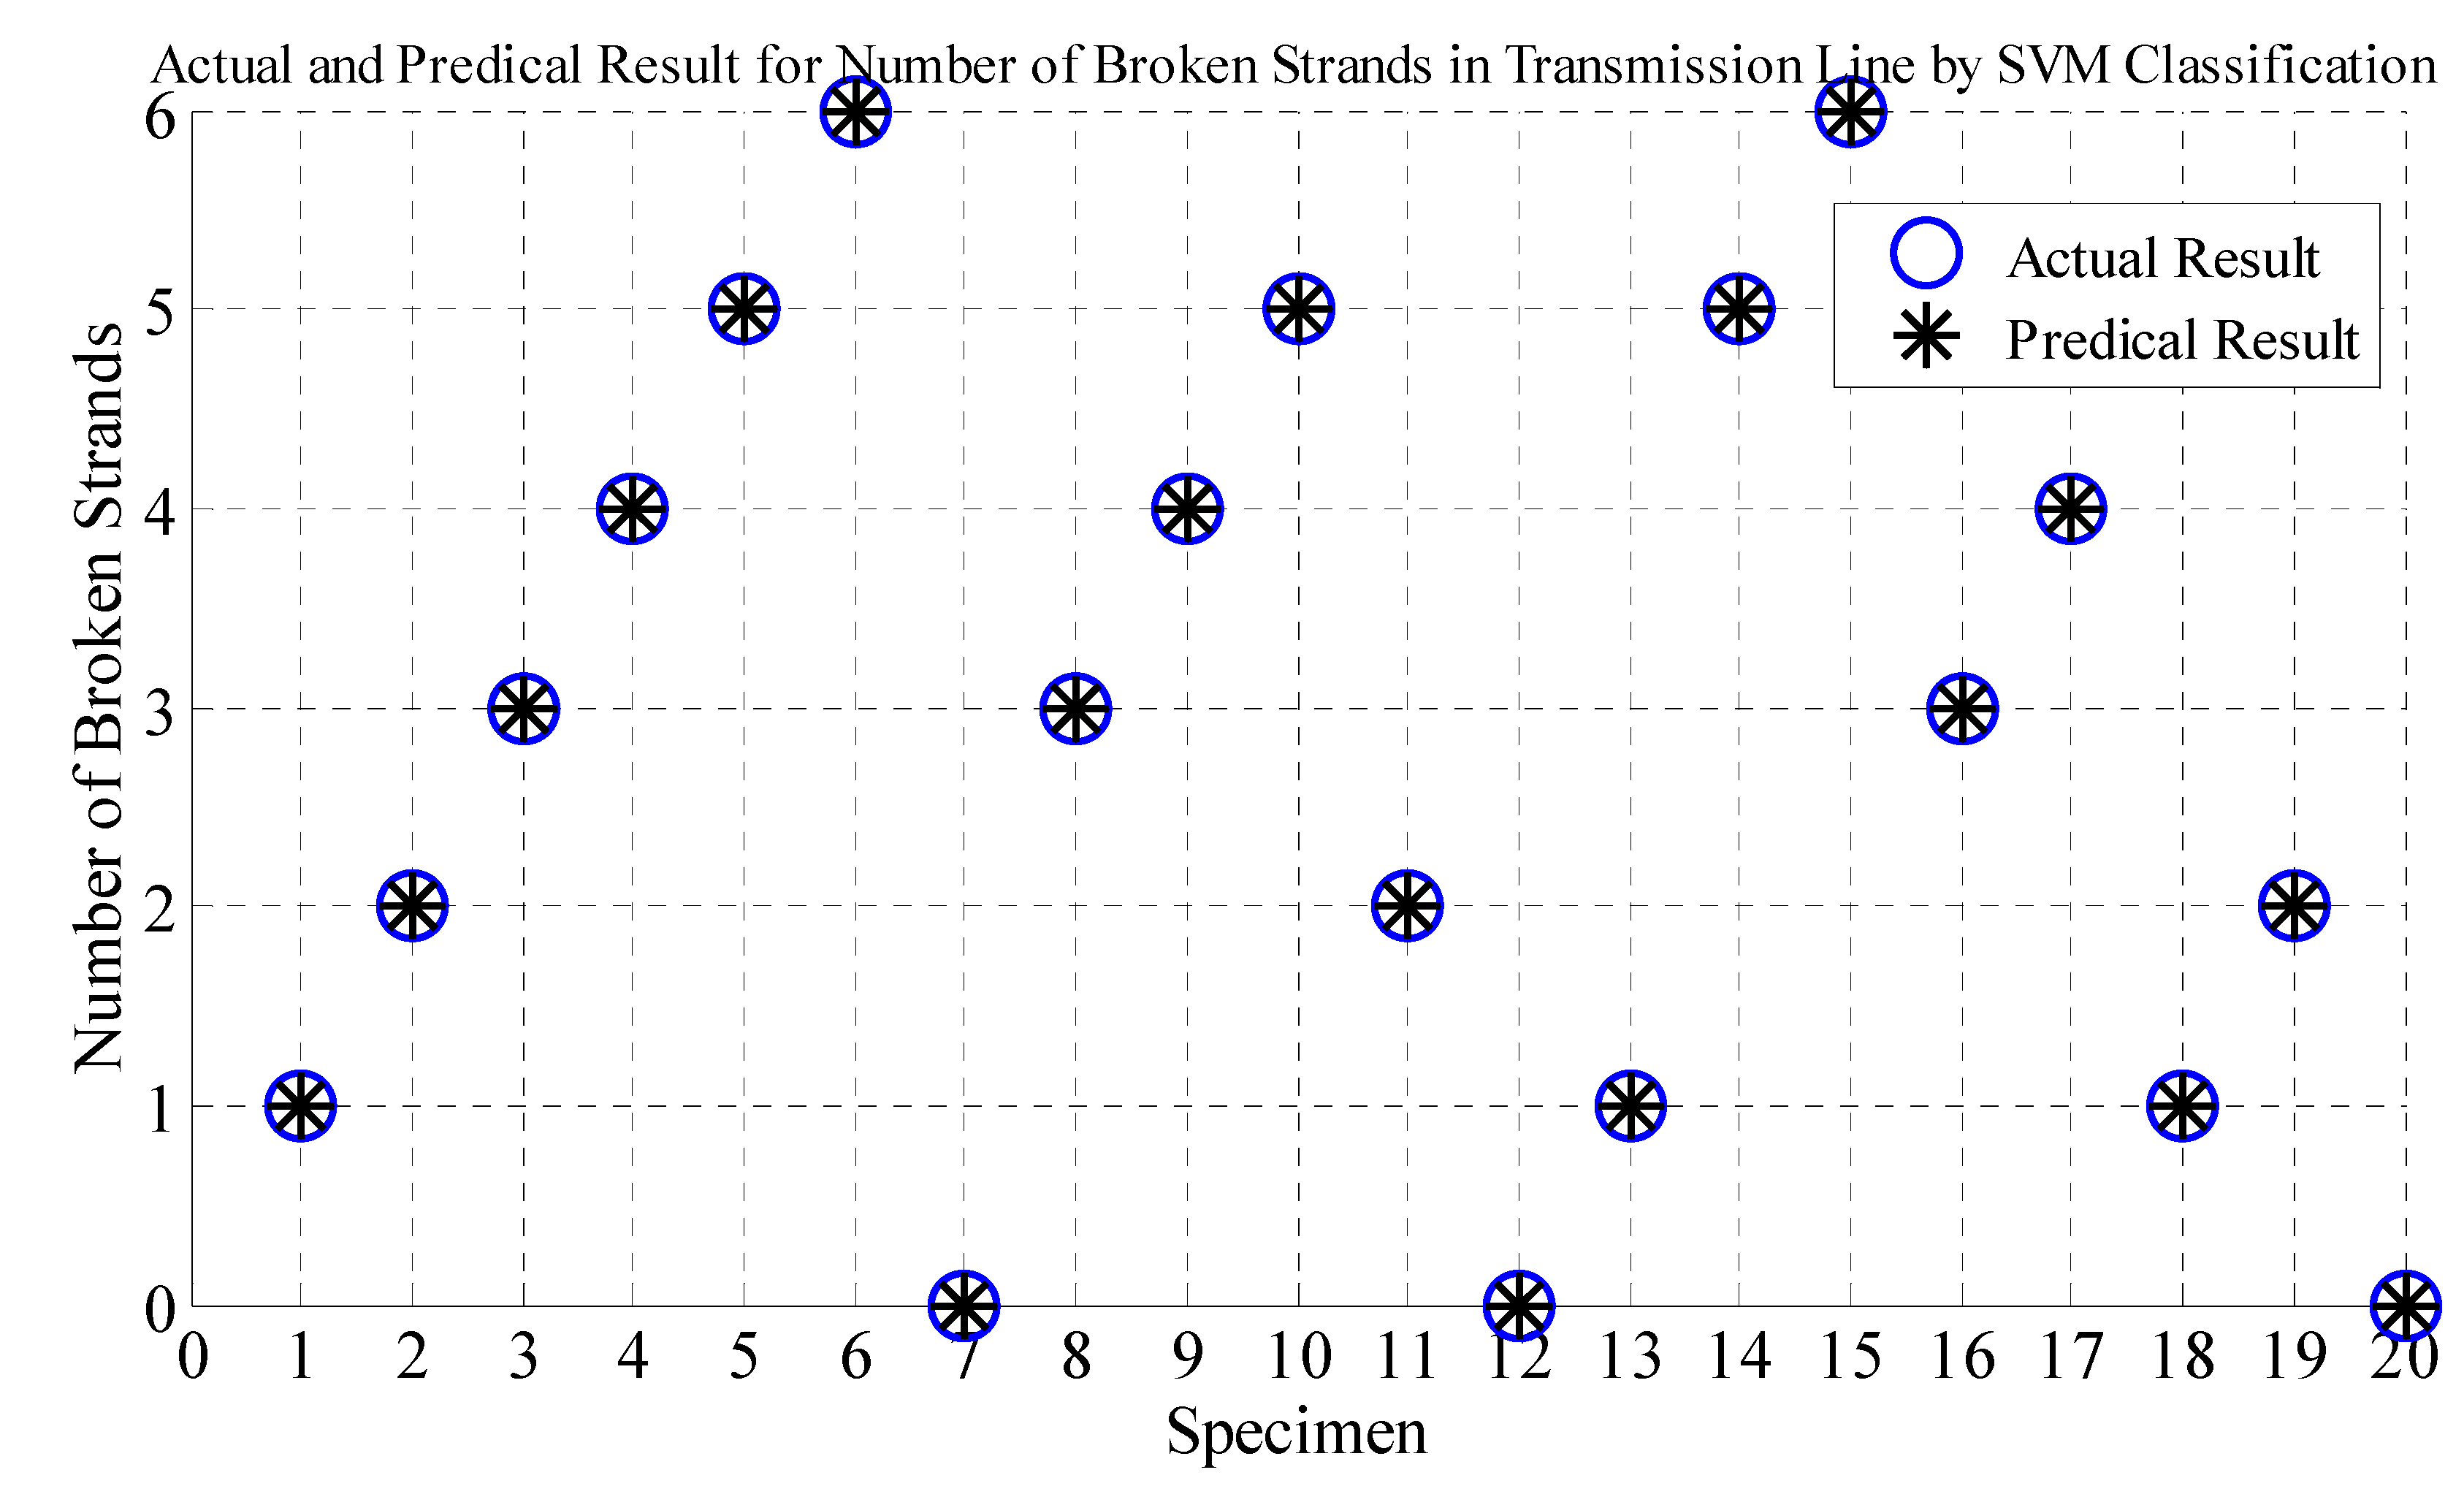
After the SVM for identifying the number of broken strands has been trained, the ECT is taken by robot to detect broken strands in the tested transmission lines. A group of feature qualities of detection signals extracted from the detection signals are used to test the SVM. Then the number of broken strands in the inspected transmission line can then be determined.
Figure 6. Flowchart of the broken strands identification system.
Energies 04 01278 g006

5. Experimental Setup and Performance Evaluation

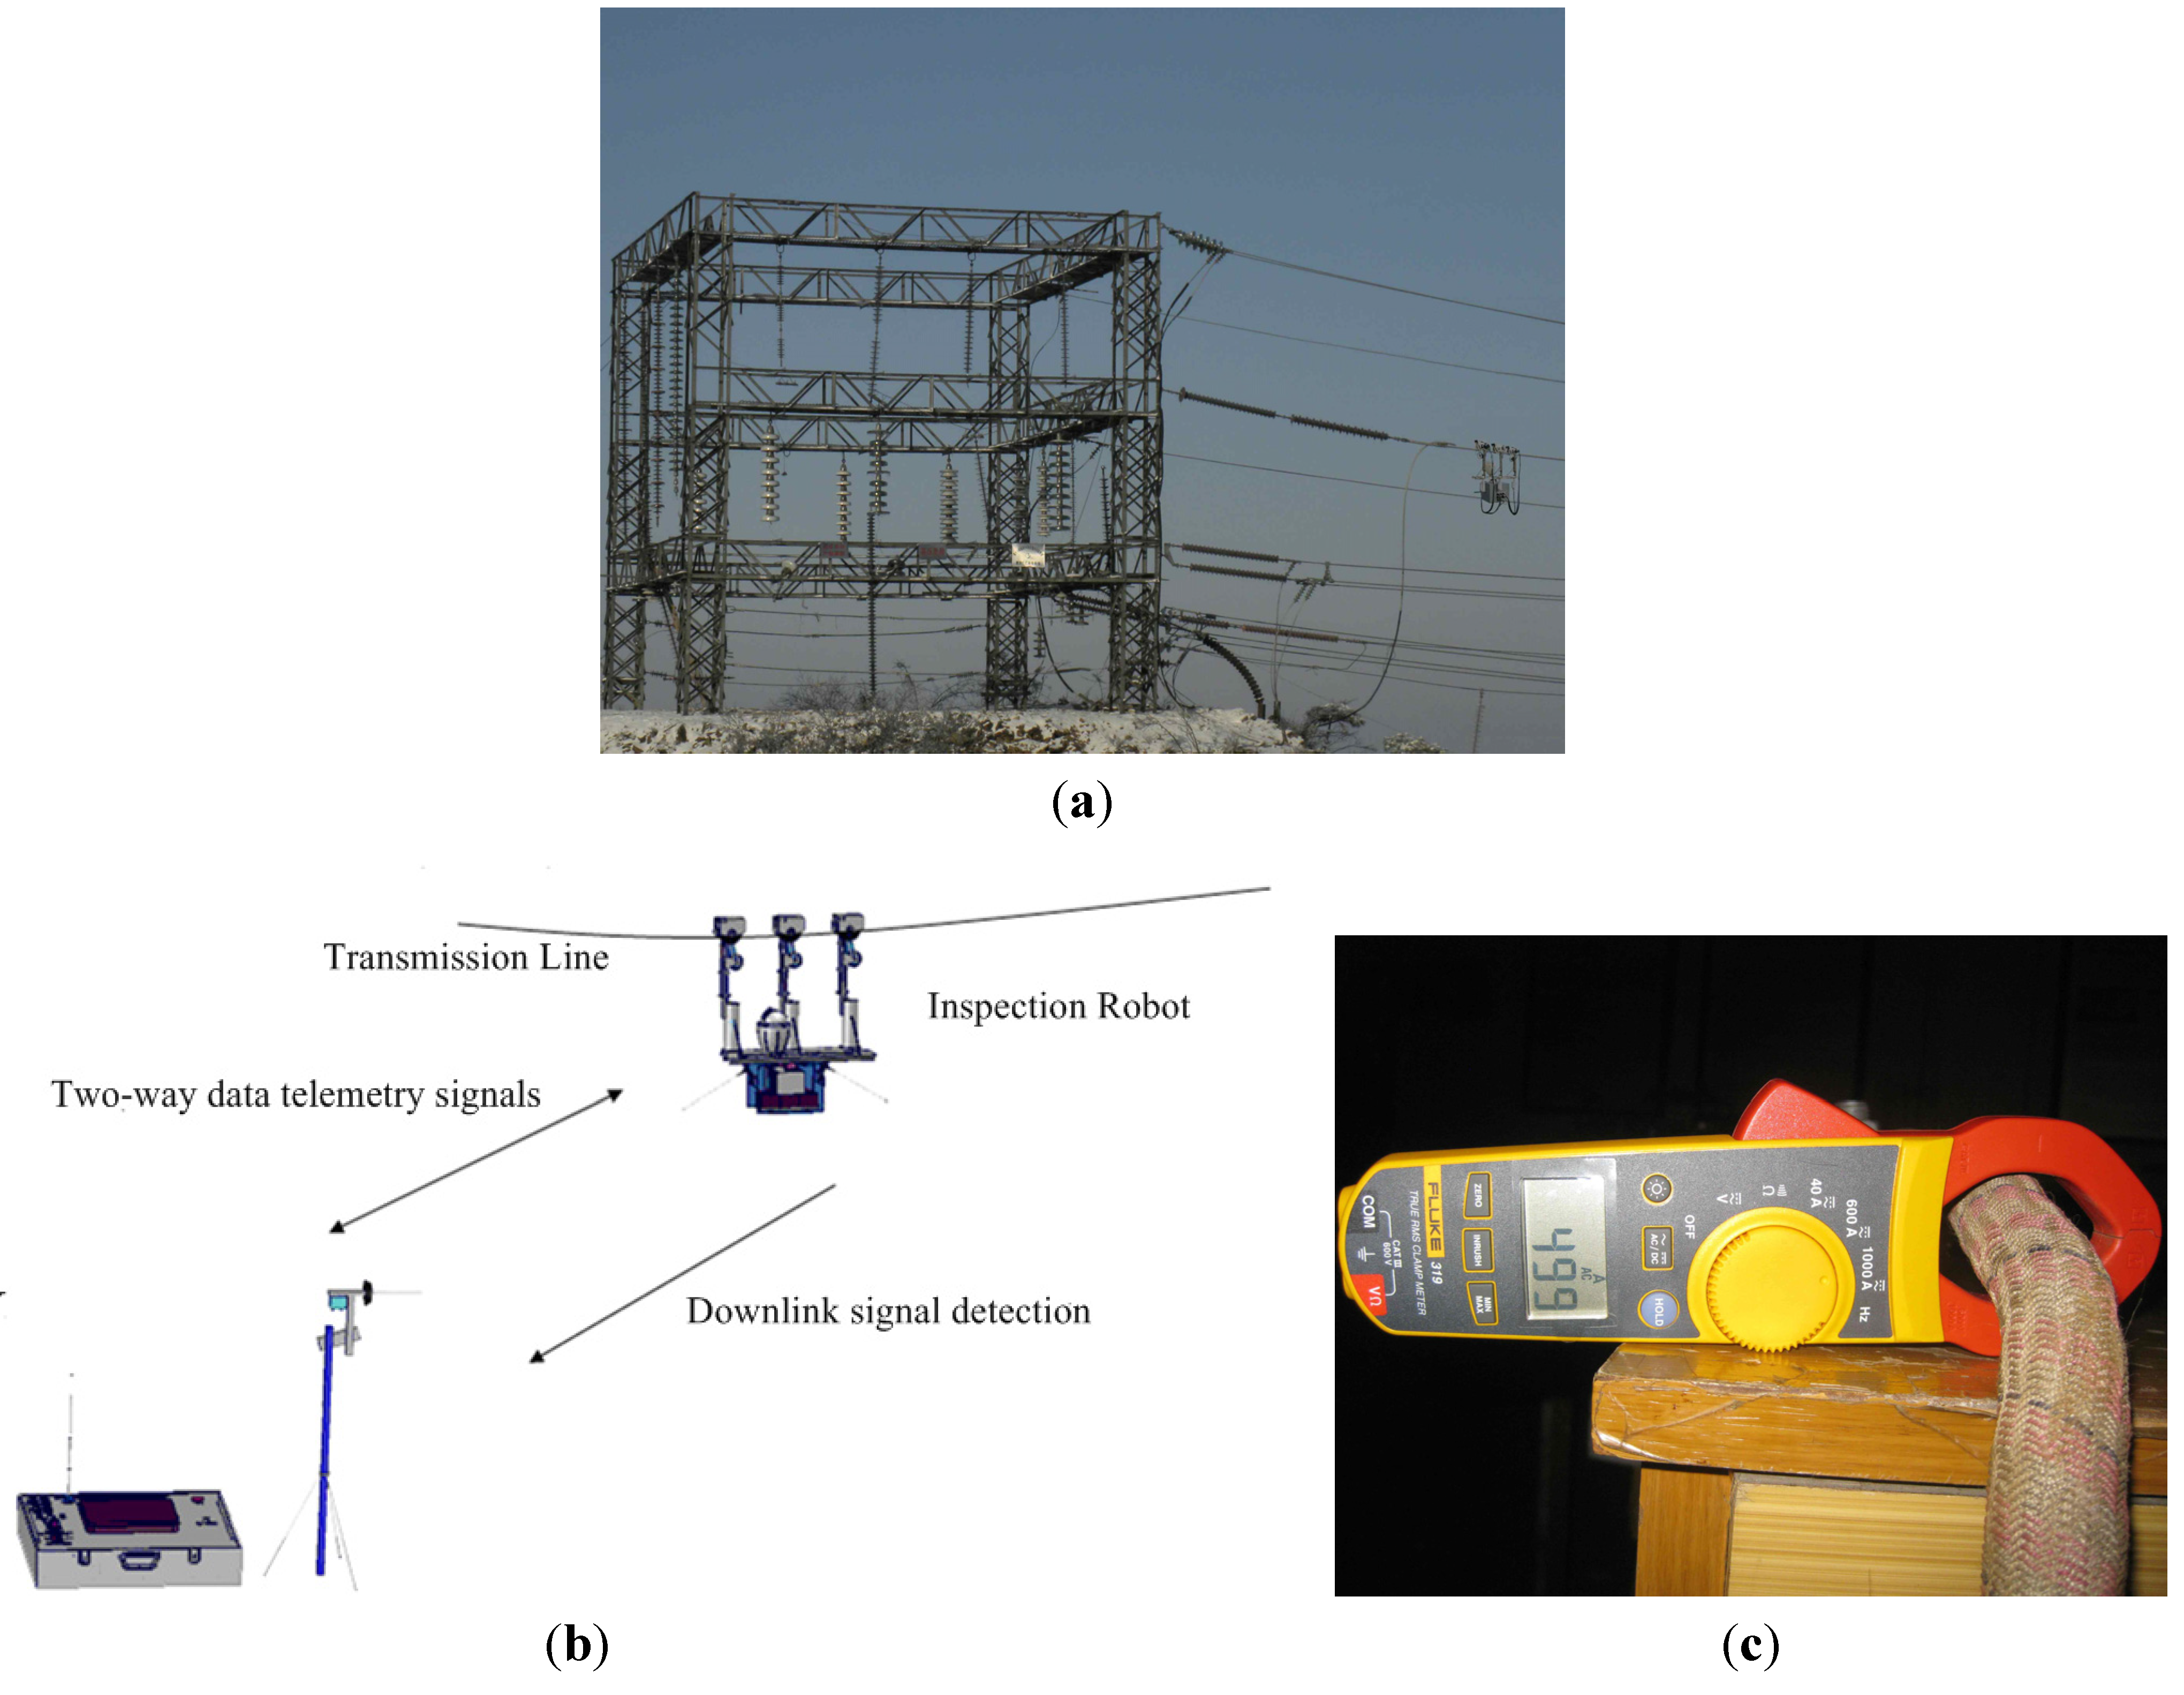
5.1. Field Experiment Platform

The field experiment set-up is shown in Figure 7. The ECT is integrated with the transmission line inspection robot. The specimen of LGJ-240 is inspected by the robot with ECT and other detectors. LGJ-240, which is a kind of cable widely used in China as overhead transmission lines for 220 kV to 500 kV current, is composed of 24 twisted aluminum wires and seven twisted steel wires in the centre. In this study, a single transmission line is used with an AC current of 500 A at 50 Hz.
Figure 7. Field Experiment; (a) field test of the inspection robot with ECT; (b) inspection robot system; (c) AC current in the transmission line.
Energies 04 01278 g007

5.2. Performance Evaluation

As the eddy current induced by only one excitation coil cannot cover the whole cable circumference, four ECT probes are arranged evenly around the cable in this study. The arrangement of the ECT probe array is shown in Figure 8a to Figure 13a. The detection signal of only one ECT probe is analyzed in this study to show the validity and feasibility of the detection scheme based on the S-transform and multi-classification SVM.
Figure 8 to Figure 13 show the original detection signals, amplitude and phase of the detection signals when there are different broken strands in the transmission line, where U is the amplitude of the detection signal in volts, θ is the phase of the detection signal in degrees, ΔU is the difference between the maximum and minimum amplitude of the detection signal, Δθ is the difference between the maximum and minimum phase of the detection signal. It can be seen from Figure 8 to Figure 13 that:
(1)
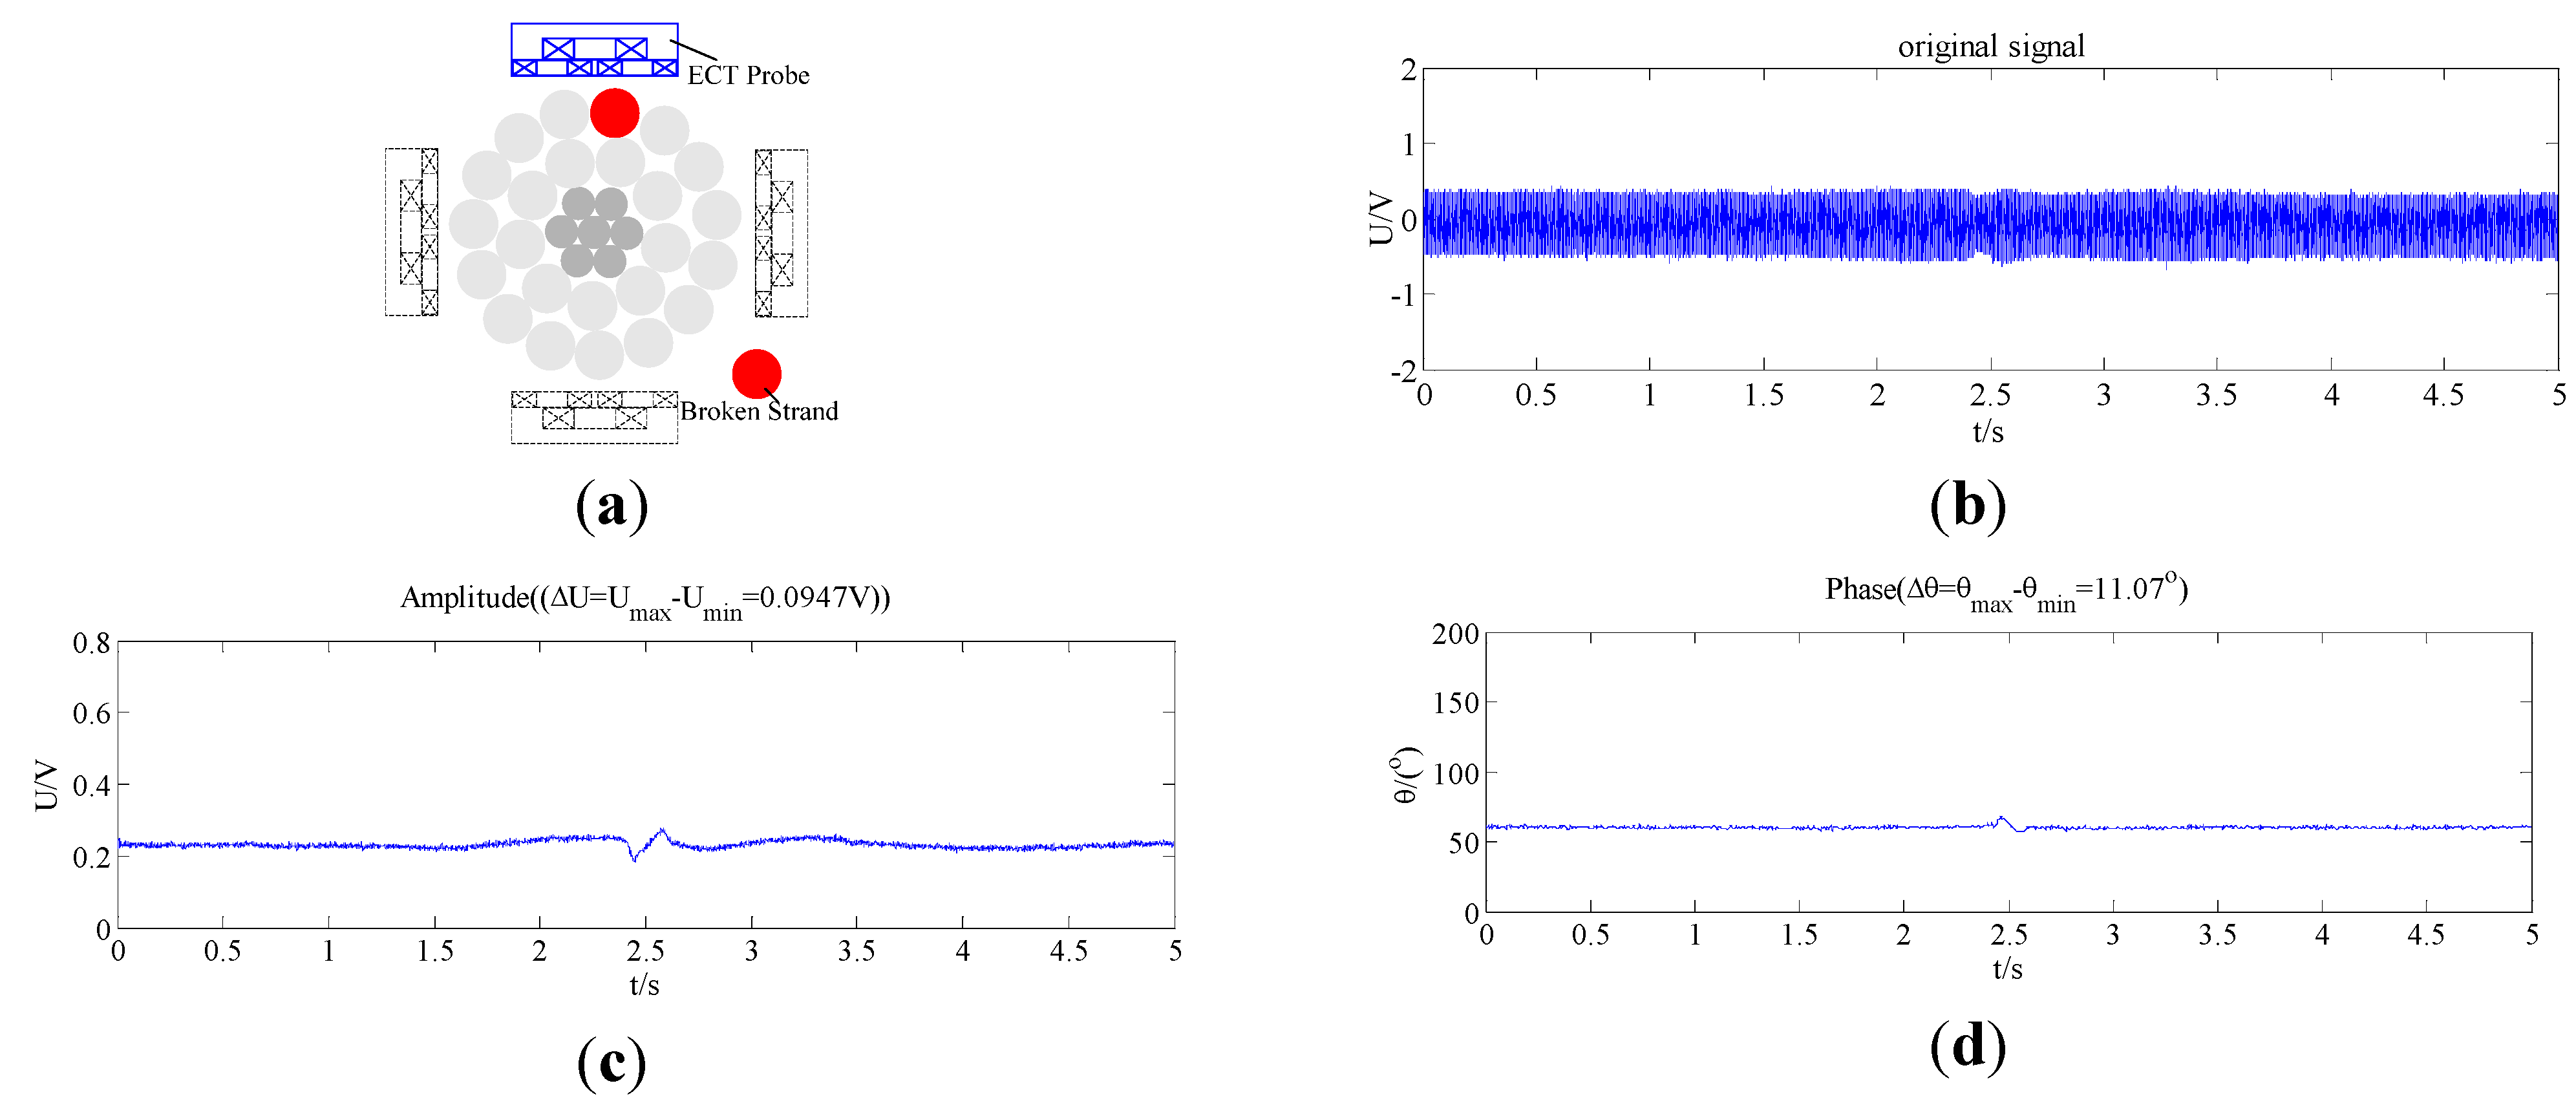
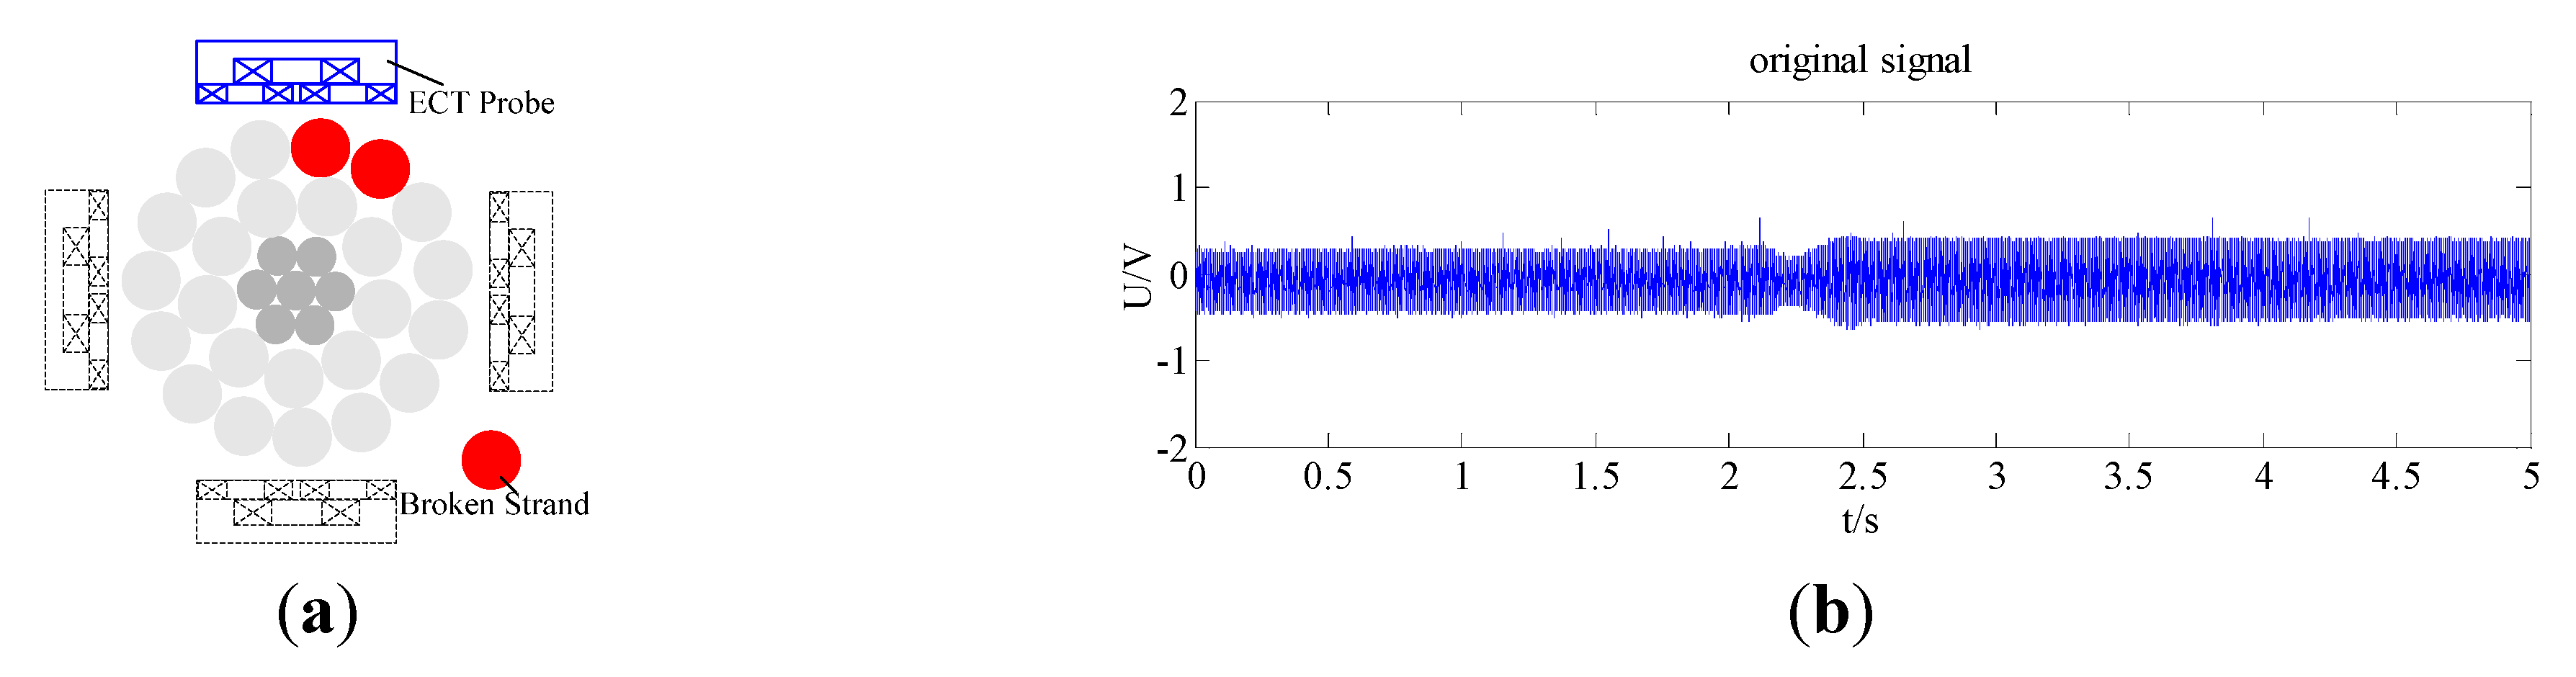
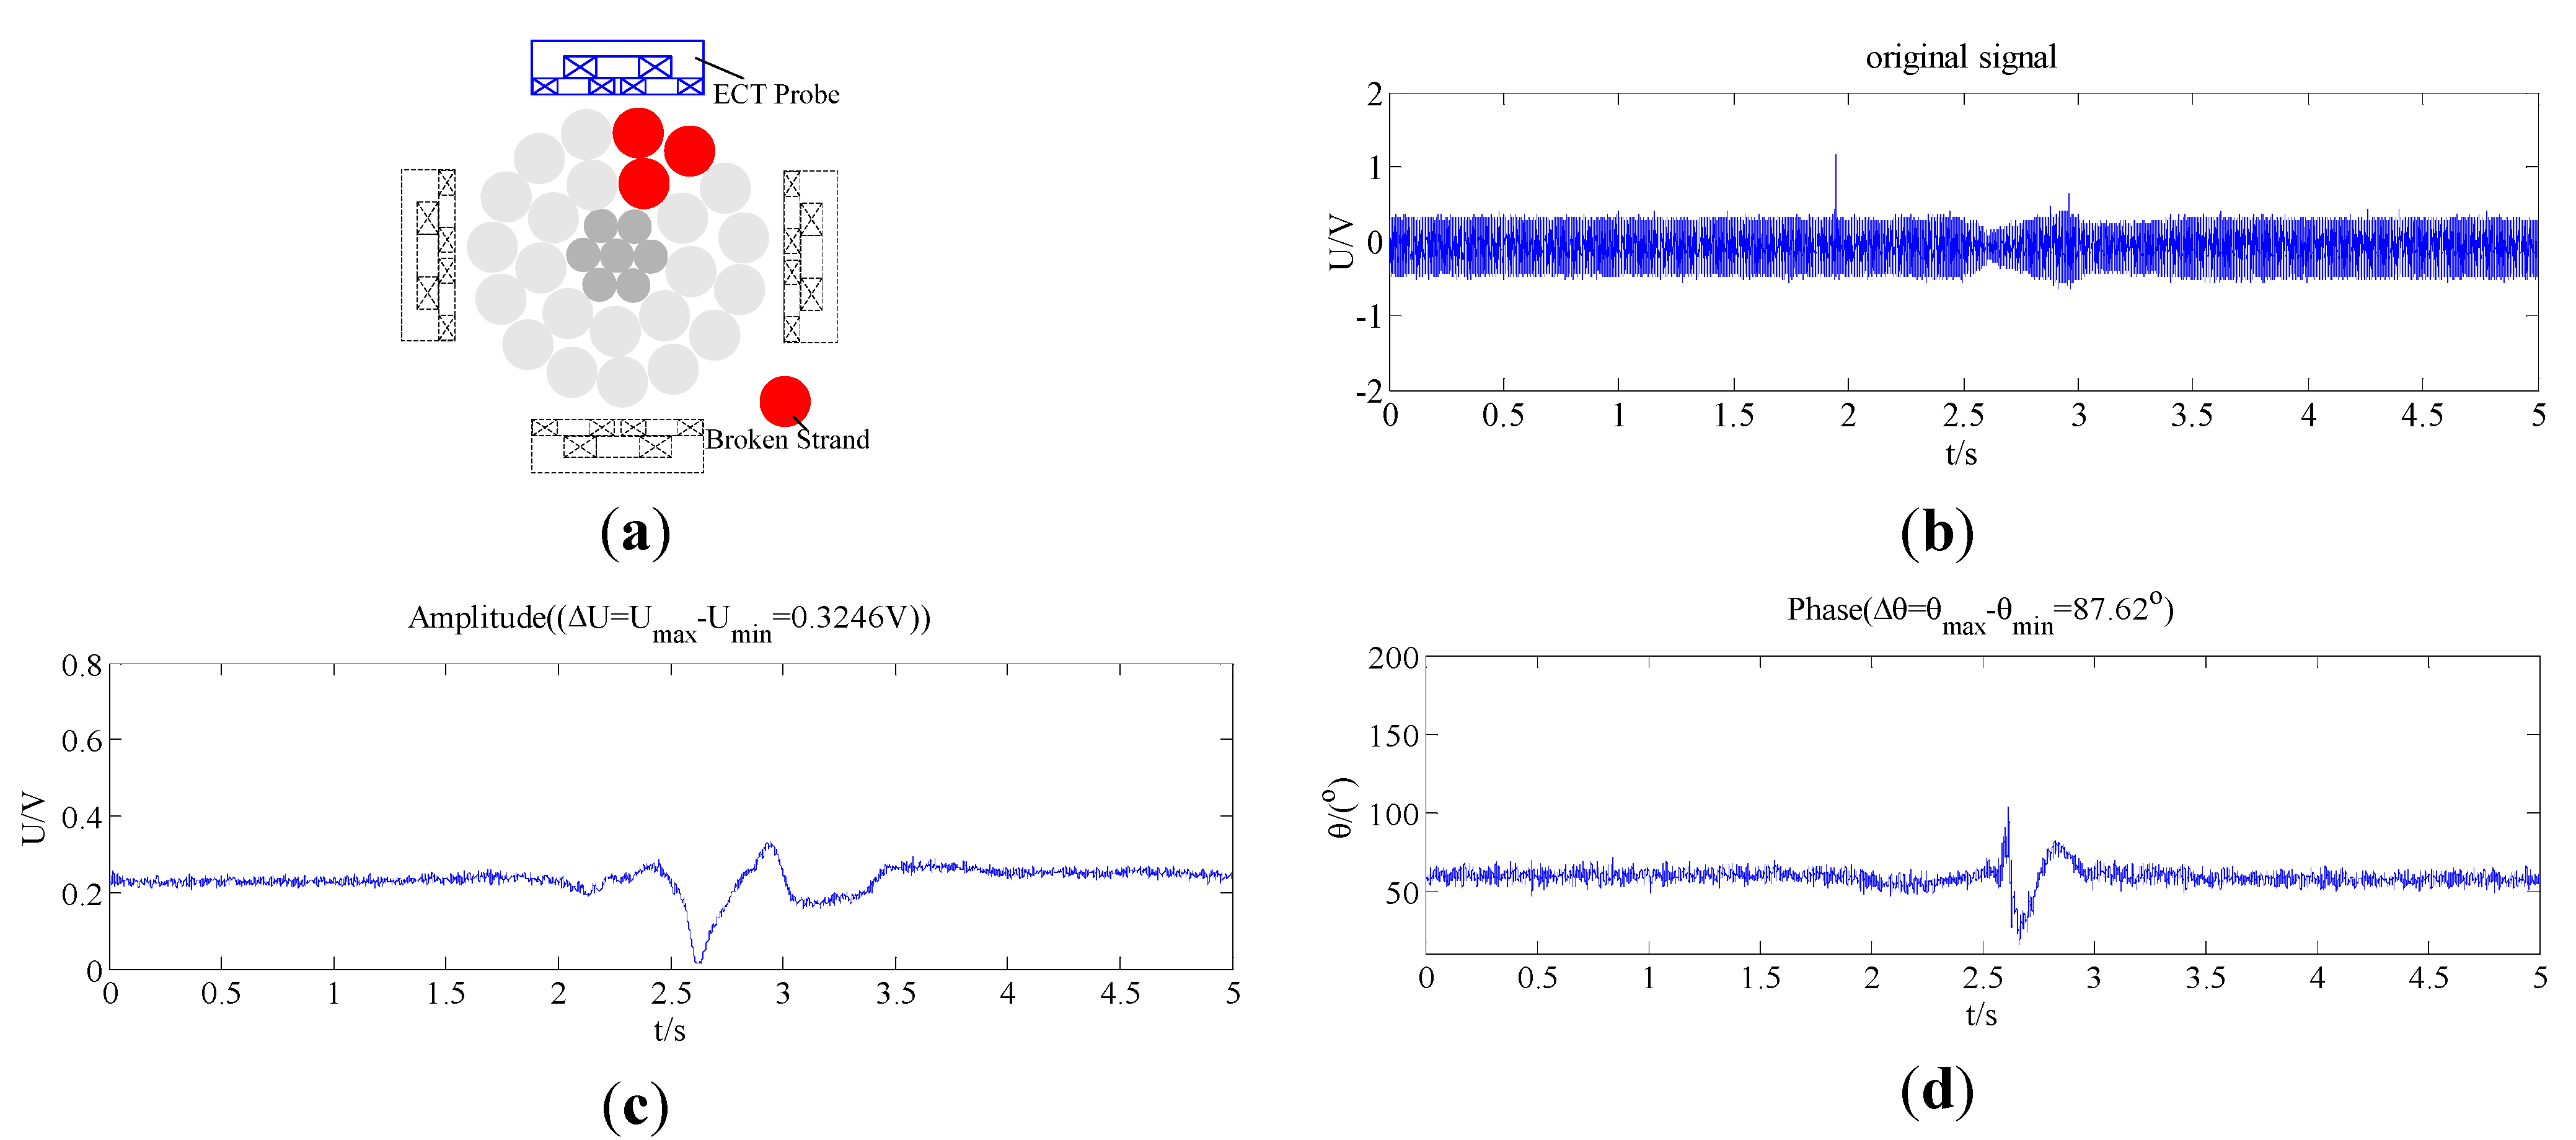
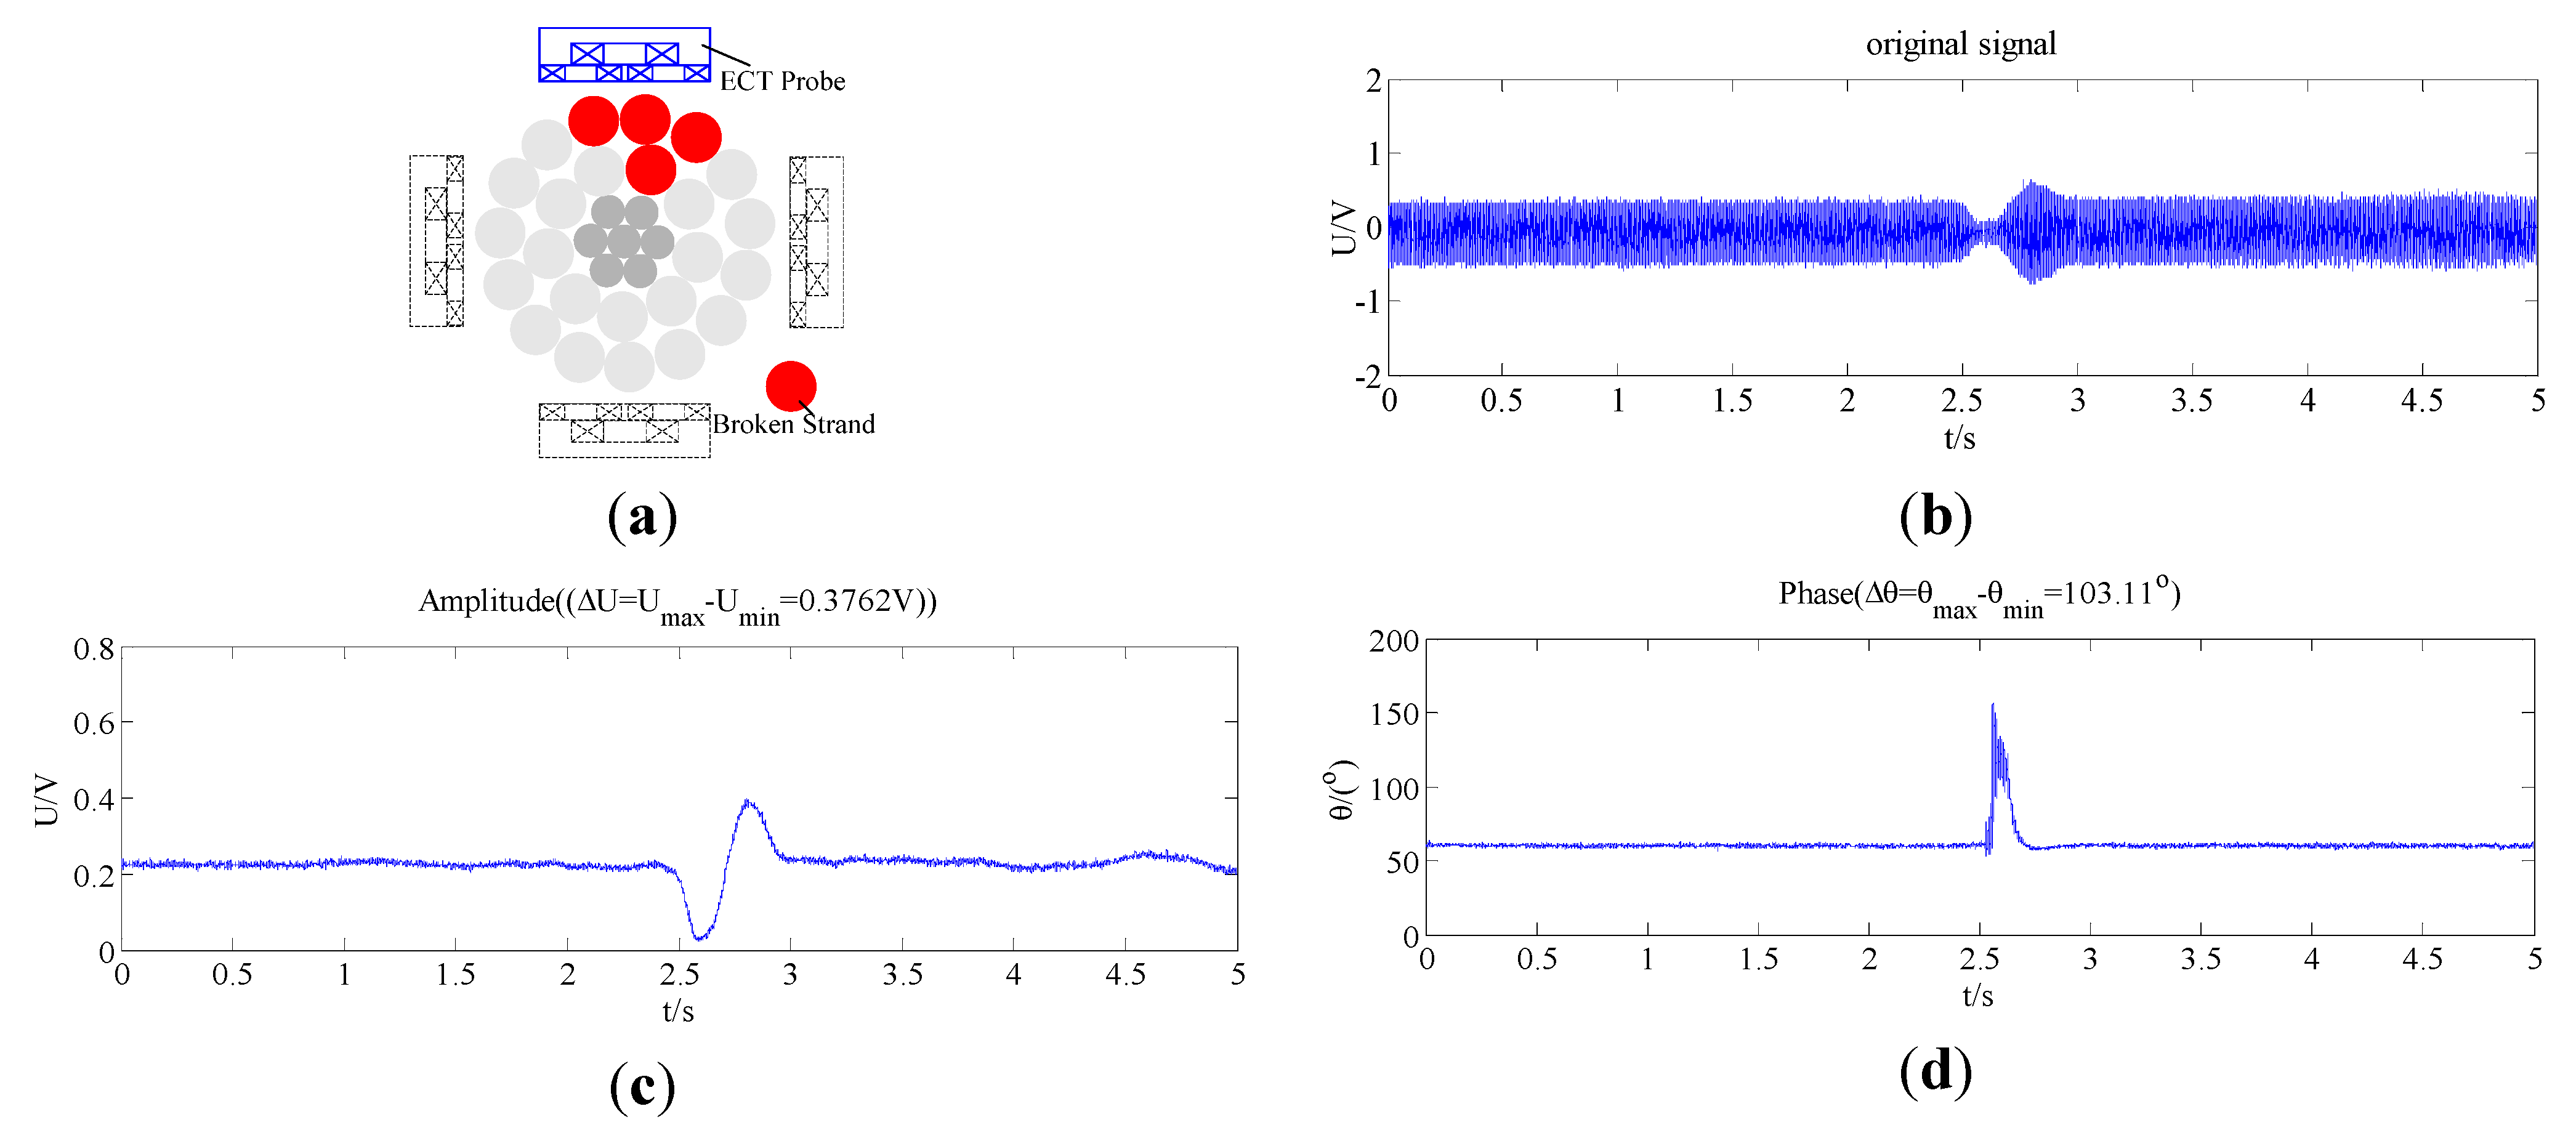
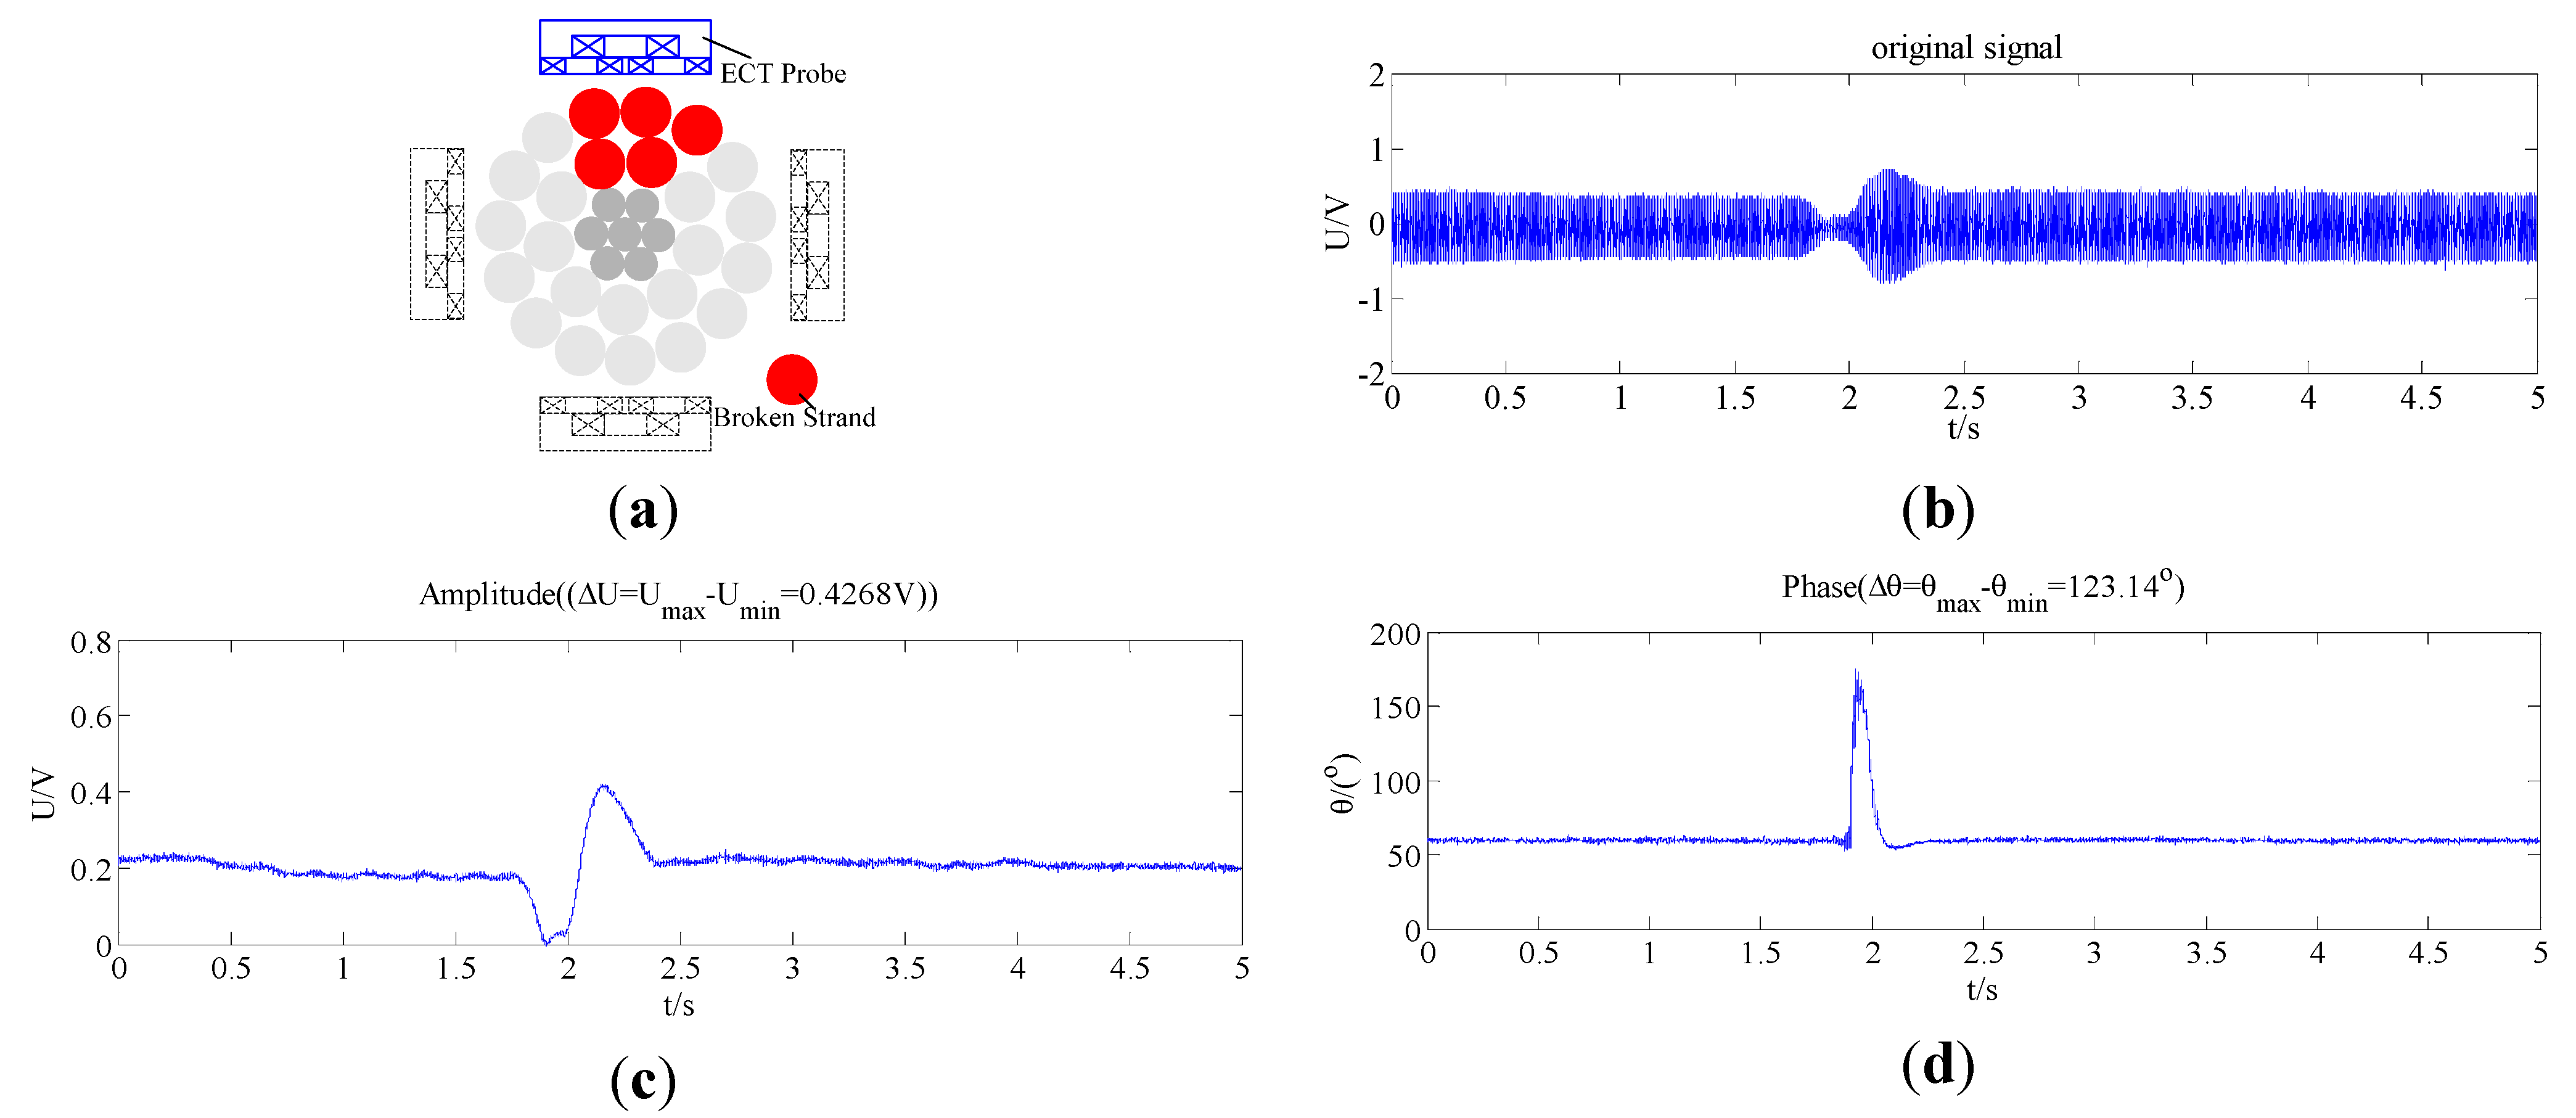
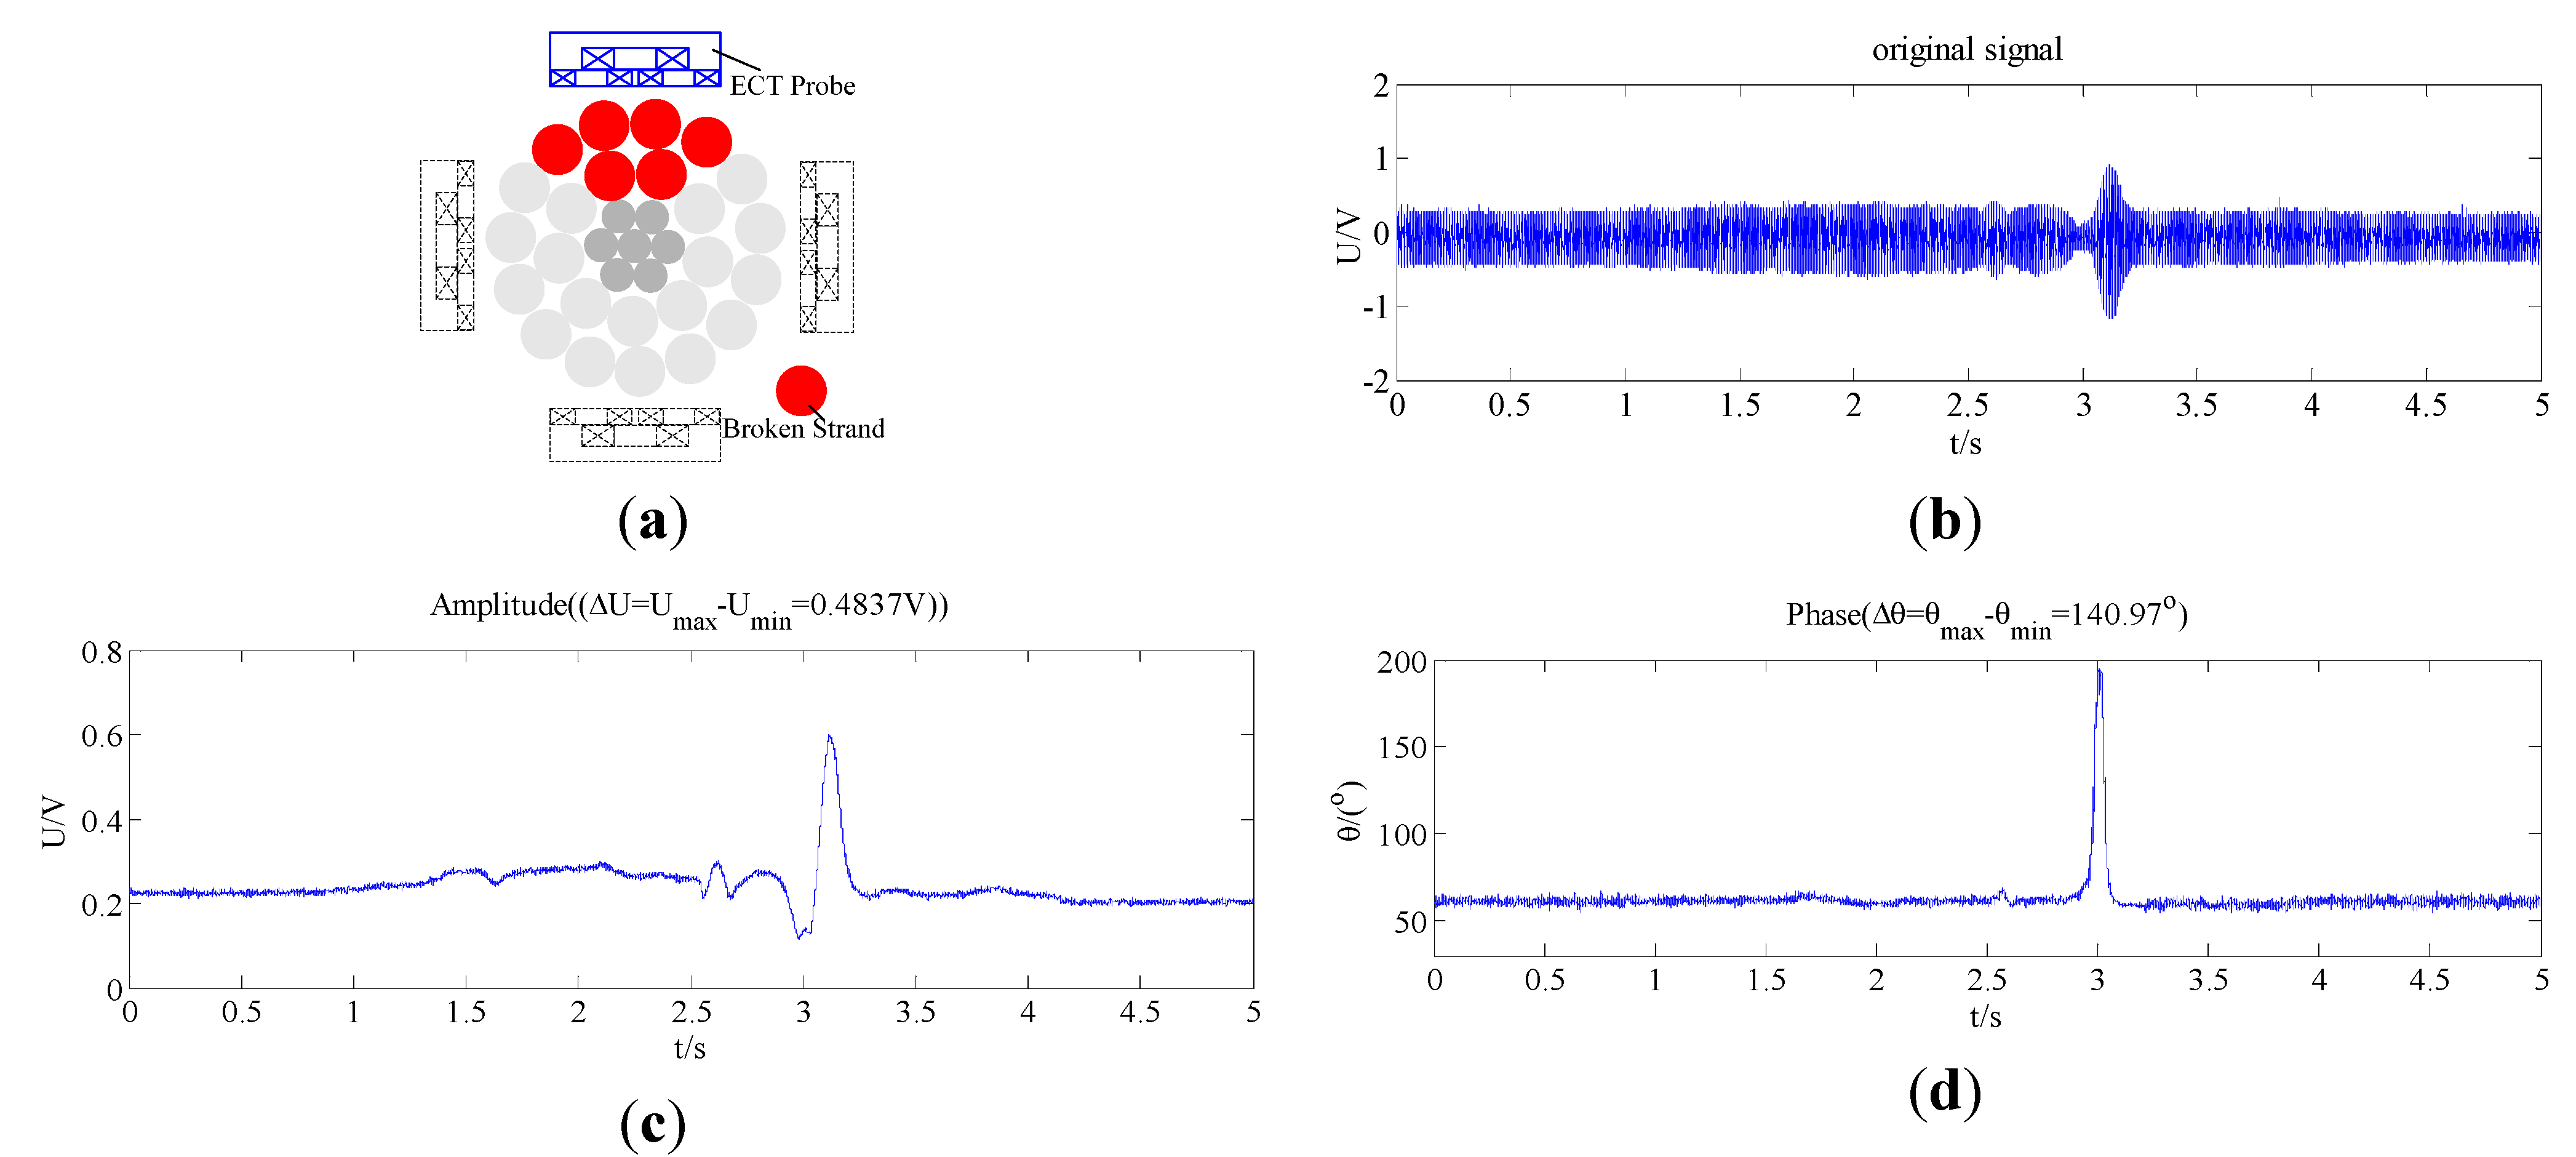
The amplitude U and phase θ obviously change when there are broken strands in the transmission line, so the developed ECT can detect broken strands with high sensitivity, reliability and stability. An algorithm for detecting broken strands in transmission lines can be proposed based on the amplitude U and phase θ.
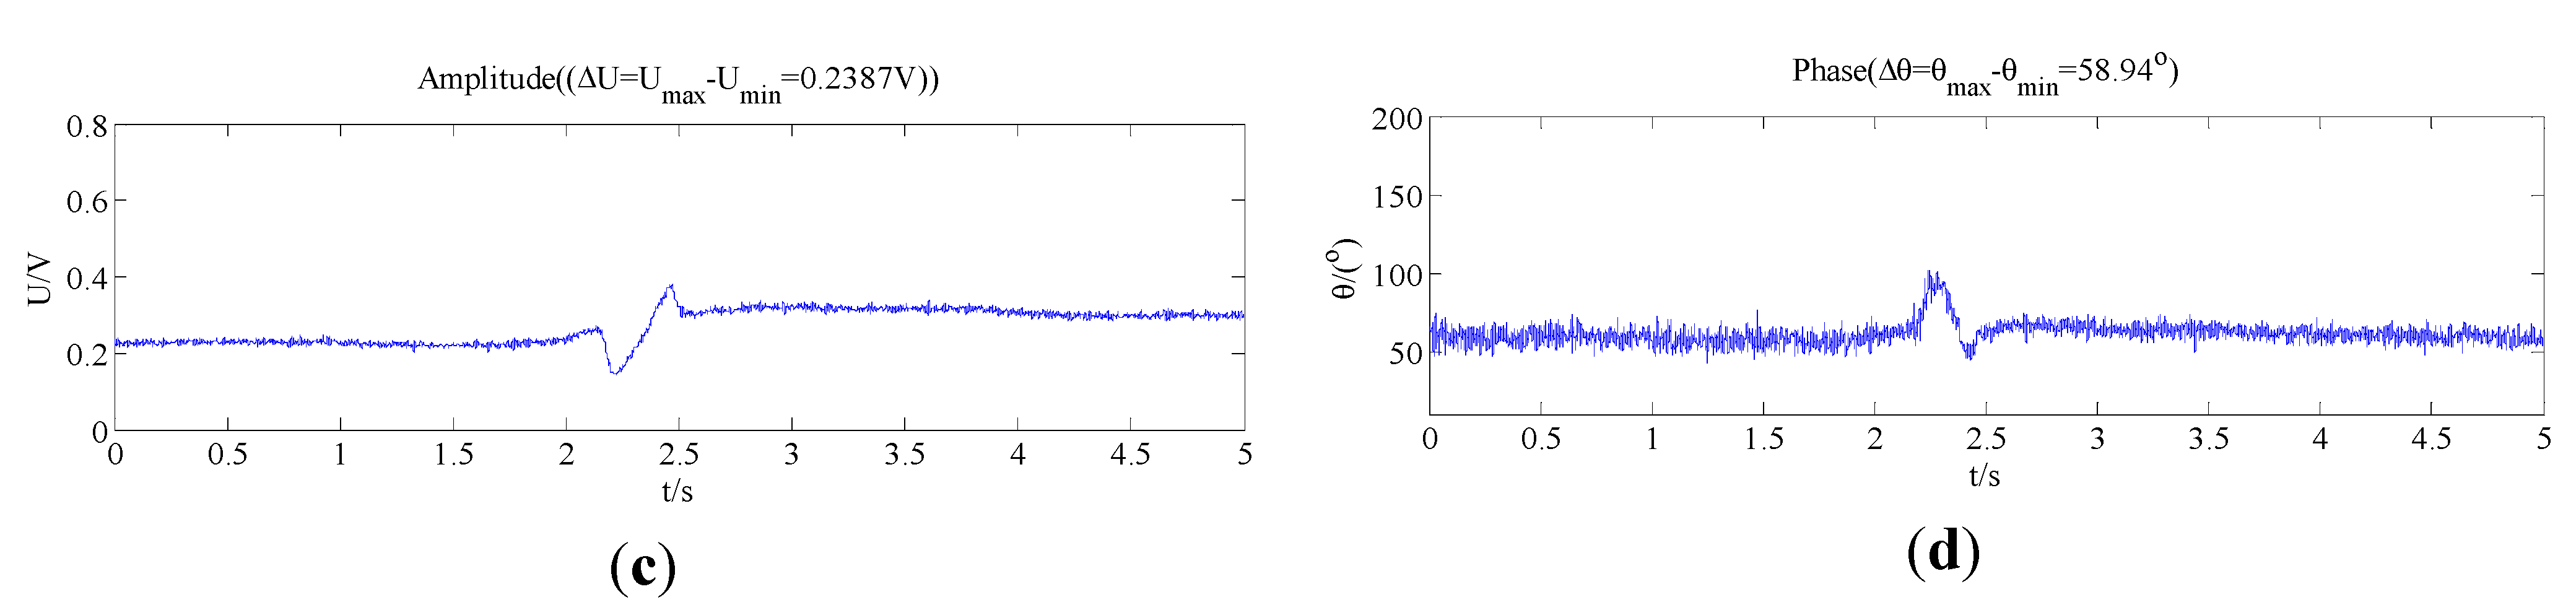
(2)
The amplitude difference ΔU and phase difference Δθ vary with the number of broken strands. The more broken strands in a transmission line, the larger value the of ΔU and Δθ, so the amplitude difference ΔU and phase difference Δθ can be used as characteristic parameters for detecting broken strands in transmission lines.
(3)
The amplitude U and phase θ calculated by the S-transform change more obviously than the original detection signal. It can be seen from Figure 8a that only one broken strand in a transmission line cannot be detected only by the original signal, whereas the one broken strand can be detected easily by the amplitude U and phase θ variation shown in Figure 8c,d.
Figure 8. Detection signal of one broken strand; (a) one broken strand; (b) original signal; (c) amplitude difference ΔU; (d) phase difference Δθ.
Energies 04 01278 g008
Figure 9. Detection signal of two broken strands; (a) two broken strands; (b) original signal; (c) amplitude difference ΔU; (d) phase difference Δθ.
Energies 04 01278 g009aEnergies 04 01278 g009b
Figure 10. Detection signal of three broken strands; (a) three broken strands; (b) original signal; (c) amplitude difference ΔU; (d)phase difference Δθ.
Energies 04 01278 g010
Figure 11. Detection signal of four broken strands; (a) four broken strands; (b) original signal; (c) amplitude difference ΔU; (d)phase difference Δθ.
Energies 04 01278 g011
Figure 12. Detection signal of five broken strands; (a) five broken strands; (b) original signal; (c) amplitude difference ΔU; (d) phase difference Δθ.
Energies 04 01278 g012
Figure 13. Detection signal of six broken strands; (a) six broken strands; (b) original signal; (c) amplitude difference ΔU; (d) phase difference Δθ.
Energies 04 01278 g013
In this study, the fitness (classification accuracy) cure of seeking for best C and γ of SVM by GA is shown in Figure 14. The fitness of the GA is the classification accuracy. The best C and γ are 0.327 and 30.03, respectively. Fifty groups of detection signals were used to train the multi-classification SVM, and another 20 groups of detection signals were used to test the SVM. The feature qualities of the tested signal are shown in Table 3. It can be seen from Figure 15 and Table 3 that the multi-classification accuracy is 100%. The diagnosis results are accordance with the actual results, so the number of broken strands in a transmission line can be determined by the developed ECT and the proposed algorithm.
It is proposed by [11] that broken strands in transmission lines in service can be detected by the passive infrared (PIR) sensors. The feature qualities extracted from the detection signal are input to a BP network (BPN) for classification to determine the number of broken strands in the transmission line. In order to compare the performance of identifying the number of broken strands by SVM and BPN, the feature qualities extracted by this study are also input to the BPN. It can be seen from Table 3 that the number of broken strands in the 6th, 10th and 12th specimen are wrongly determined. The accuracy of BPN is nearly 85%, so the proposed SVM with the best C and γ parameters has better capability of diagnosing broken strands in transmission lines.
Figure 14. The fitness (classification accuracy) cure of seeking for best C and γ by GA.
Energies 04 01278 g014
Figure 15. Classification results of the tested data.
Energies 04 01278 g015
Table 3. Feature quality of the detection signal and classification results by SVM.
SpecimenFeature QualityDiagnosis Result by SVM with best C and γDiagnosis Result by BPNActual Result
Amplitude ΔU (V)Phase Δθ (Degree)SFE-BSICDEnergy E (J)
10.094711.070.17077987111
20.238758.940.16379433222
30.324687.620.155810626333
40.3762103.110.146212102444
50.4268123.140.13613727555
60.4837140.970.128315442656
70.00230.690.18537162000
80.330186.980.156711007333
90.3921102.860.145111899444
100.4302119.980.136714102545
110.250359.010.15989387222
120.00971.230.18397303010
130.112313.670.6988103111
140.4197119.670.135213673555
150.4968146.370.126715633666
160.327186.980.154910897333
170.369799.670.149712203444
180.120714.670.16898066111
190.231155.360.16419221222
200.01022.270.18477221000

6. Conclusions

(1)
A kind of ECT for detecting broken strands in transmission lines has been developed in this paper. The ECT probe is designed for LGJ-240 transmission lines. At the same time, the structural style and design method of the ECT can be applied to the design of ECTs for other types of transmission line. The specific parameters of the ECT probe can be determined by the type of transmission line.
(2)
The ECT probe is composed of an excitation coil and a differential detection coil, which is composed of the same two coils connected in subtractive series. The detection signal is processed by an S-transform to extract relevant features such as module, phase, energy and the corresponding defined SFE-BSICD. Then not only broken strands in cable can be detected with high reliability and sensitivity, but also the hardware circuit of the ECT is simplified.
(3)
Energized current of sinusoidal wave in ECT is generated by a DDS in this study, so the accuracy and stability of the detection signal is improved correspondingly.
(4)
Experimental results show that the magnetic field produced by the current in a transmission line has no impact on the performance of the ECT for detecting broken strands in the transmission line, so the developed method for detecting broken strands is suitable for on-line real time inspection.
(5)
A novel feature extraction scheme incorporates an S-transform and multi-classification SVM for quantitatively identifying broken strands in transmission lines is proposed by this paper, the penalty parameter of the error term kernel parameter for the SVM is optimized by GA, so the classification accuracy is very high. The detection accuracy is sufficient to locate flaws of one half the size of one strand, which is adequate for industrial requirements, so the developed ECT and proposed detection scheme for detecting broken strands in transmission lines make an important contribution for insuring the safe operation of transmission lines.

Acknowledgement

This work was supported by Key Project of Chinese National Programs for Fundamental Research and Development (973 program) (2009CB724501); Project supported by the Funds for Innovative Research Groups of China (51021005).

References

  1. Lings, R.; Cannon, D.; Hill, L.; Gaudry, M.; Stone, R.; Shoureshi, R. Inspection & Assessment of Overhead Line Conductors; A State-of-the Science Report, EPRI Technical Progress 1000258; Electric Power Research Institute: Palo Alto, CA, USA, 2000. [Google Scholar]
  2. Goda, Y.; Yokoyama, S.; Watanabe, S.; Kawano, T.; Kanda, S. Melting and breaking characteristics of OPGW strands by lightning. IEEE Trans. Power Deliv. 2004, 19, 1734–1740. [Google Scholar] [CrossRef]
  3. Kudzys, W. Safety of power transmission line structures under wind and ice storms. Eng. Struct. 2006, 28, 682–689. [Google Scholar] [CrossRef]
  4. Isozaki, M.; Adachi, K.; Hita, T.; Asano, Y. Study of corrosion resistance improvement by metallic coating for overhead transmission line conductor. Electr. Eng. Jpn. 2008, 163, 41–47. [Google Scholar] [CrossRef]
  5. Raupp, D.; Vogel, W.; Wehking, K.H. Fatigue behaviour of open spiral strand cables. Bautechnik 2007, 84, 41–46. (in German). [Google Scholar] [CrossRef]
  6. Cameron, G.W.; Bodger, P.S.; Woudberg, J.J. Incomplete faraday cage effect of helicopters used in platform live-line maintenance. IEE Proc. Gener. Transm. Distrib. 1998, 145, 145–148. [Google Scholar] [CrossRef]
  7. Ashidater, S.; Murashima, S.; Fujii, N. Development of a helicopter-mounted eye-safe laser radar system for distance measurement between power transmission lines and nearby trees. IEEE Trans. Power Deliv. 2002, 17, 644–648. [Google Scholar] [CrossRef]
  8. Sawada, J.; Kusumoto, K.; Maikawa, Y.; Munakata, T.; Ishikawa, Y. A mobile robot for inspection of power transmission lines. IEEE Trans. Power Delivery 1991, 6, 309–315. [Google Scholar] [CrossRef]
  9. Toussaint, K.; Pouliot, N.; Montambault, S. Transmission line maintenance robots capable of crossing obstacles: Stage-of-the-art review and challenges ahead. J. Field Rob. 2009, 26, 477–499. [Google Scholar] [CrossRef]
  10. Li, W.H.; Tajbakhsh, A.; Rathbone, C.; Vashishtha, Y. Image Processing to Automate Condition Assessment of Overhead Line Components. In Proceedings of the 2010 1stInternational Conference on Applied Robotics for the Power Industry, Montréal, Canada, 5–7 October 2010; pp. 1–6.
  11. Zhou, F.Y.; Li, Y.B.; Feng, G.R. A real-time method for detecting and diagnosing broken strand of high voltage transmission line with inspect robot. Trans. China Electrortech. Soc. 2010, 25, 185–191. (in Chinese). [Google Scholar]
  12. Haag, T.; Beadle, B.M.; Sprenger, H.; Gaul, L. Wave-based defect detection and inter-wire friction modeling for overhead transmission lines. Arch. Appl. Mech. 2009, 79, 517–528. [Google Scholar] [CrossRef]
  13. Shoureshi, R.A.; Lim, S.-W.; Dolev, E.; Sarusi, B. Electro-magnetic-acoustic transducers for automatic monitoring and health assessment of transmission lines. J. Dyn. Syst. Meas. Control 2004, 126, 303–308. [Google Scholar] [CrossRef]
  14. Hatsukade, Y.; Miyazaki, A.; Matsuura, H.; Suzuki, A.; Tanaka, S. Study of inspection of wire breakage in aluminum transmission line using SQUID. NDT&E Int. 2009, 42, 170–173. [Google Scholar] [CrossRef]
  15. Miyazaki, A.; Hatsukade, Y.; Matsuura, H.; Maeda, T.; Suzuki, A.; Tanaka, S. Detection of wire element breakage in power transmission line using HTS-SQUID. J. Phys. C 2009, 469, 1643–1648. [Google Scholar] [CrossRef]
  16. Tadeusiewicz, R.; Wszolek, T.; Izworski, A.; Wszolek, W. Recognition of Defects in High voltage Transmission Lines Using the Acoustic Signal of Corona Effect. In Proceedings of the 2000 IEEE Signal Processing Society Workshop, Sydney, Australia, 11–13 December 2000; pp. 869–875.
  17. Moreira, P.L.F.; Lourenco, P.M.; Lourenco, C.R.S.H.; Sebrao, M.Z.; Sant’anna, I.; Wavrik, J.F.A.G. Internal Corrosion in conductor Cables of Power Transmission Lines: Characterization of the Atmosphere and Techniques for Faults Detection. In Proceedings of the 2nd International Multi-Conference on Engineering and Technological Innovation, Orlando, FL, USA, 10–13 July 2009; pp. 1–6.
  18. Kim, S.D.; Morcos, M.M. An application of solenoid sensor for inspecting deterioration of ACSR conductors due to forest fires. IEEE Power Eng. Rev. 2001, 21, 50–53. [Google Scholar]
  19. Dalpé, C.; Goudreau, S.; Cloutier, L.; Cardou, A. Use of eddy current technology to assist in the evaluation of the fatigue damage of electrical conductors. Res. Nondestr. Eval. 2008, 19, 181–201. [Google Scholar] [CrossRef]
  20. Komoda, M.; Kawashima, T.; Minemura, M.; Aihara, M.; Ebinuma, T.; Kanno, T.; Kiuchi, M. Electromagnetic induction method for detecting and locating flaws on overhead transmission lines. IEEE Trans. Power Deliv. 1990, 5, 1484–1489. [Google Scholar] [CrossRef]
  21. Daubechies, I. The wavelet transform, time-frequency localization and signal analysis. IEEE Trans. Inf. Theory 1990, 961, 1005–1036. [Google Scholar]
  22. Cheng, J.S.; Yu, D.J.; Yang, Y. A fault diagnosis approach for roller bearings based on EMD method and AR model. Mech. Syst. Signal Process. 2006, 20, 350–362. [Google Scholar] [CrossRef]
  23. Dash, P.K.; Samantaray, S.R.; Panda, G.; Panigrahi, B.K. Time-frequency transform approach for protection of parallel transmission lines. IET Proc. Gener. Transm. Distrib. 2007, 1, 30–38. [Google Scholar] [CrossRef]
  24. Su, Z.Y.; Zhang, Y.M.; Jia, M.P.; Xu, F.Y.; Hu, J.Z. Gear fault identification and classification of singular value decomposition based on hilbert-huang transform. J. Mech. Sci. Technol. 2011, 25, 267–272. [Google Scholar] [CrossRef]
  25. Li, Z.X.; Yan, X.P.; Yuan, C.Q.; Peng, Z.X.; Li, L. Feature extraction and classification of gear faults using principal component analysis. J. Qual. Maint. Eng. 2003, 9, 132–143. [Google Scholar] [CrossRef]
  26. Widodo, A.; Yang, B.-S.; Han, T. Combination of independent component analysis and support vector machines for intelligent faults diagnosis of induction motors. Expert Syst. Appl. 2007, 32, 299–312. [Google Scholar] [CrossRef]
  27. Stockwell, R.G.; Mansinha, L.; Lowe, R.P. Localization of the complex spectrum: The S-transform. IEEE Trans. Signal Process. 1996, 44, 998–1001. [Google Scholar] [CrossRef]
  28. Stockwell, R.G. S-transform Analysis of Gravity Wave Activity from a Small Scale Network of Airglow Imagers. Ph.D. Thesis, Western Ontario University, Ontario, Canada, 1999. [Google Scholar]
  29. Assous, S.; Humeau, A.; Tartas, M.; Abraham, M.P.; L’Huillier, J.P. S-transform applied to laser doppler flowmetry reactive hyperemia signals. IEEE Trans. Biomed. Eng. 2006, 53, 1032–1037. [Google Scholar] [CrossRef] [PubMed]
  30. Wang, J.; Yang, Q.; Sima, W.X.; Yuan, T.; Zahn, M. A smart online over-voltage monitoring and identification system. Energies 2011, 4, 599–615. [Google Scholar] [CrossRef] [Green Version]
  31. Chilukuri, M.V.; Dash, P.K. Multi-resolution S-transform-based fuzzy recognition system for power quality events. IEEE Trans. Power Deliv. 2004, 19, 323–330. [Google Scholar] [CrossRef]
  32. Bhende, C.N.; Mishra, S.; Panigrahi, B.K. Detection and classification of power quality disturbances using S-transform and modular neural network. Electr. Power Syst. Res. 2008, 78, 122–128. [Google Scholar] [CrossRef]
  33. Mokryani, G.; Siano, P.; Piccolo, A. Identification of ferroresonance based on S-transform and support vector machine. Simul. Model. Pract. Theory 2010, 18, 1412–1424. [Google Scholar] [CrossRef]
  34. Lei, Y.G.; He, Z.J.; Zi, Y.Y.; Hu, Q. Fault diagnosis of rotating machinery based on multiple ANFIS combination with gas. Mech. Syst. Signal Process. 2007, 21, 2280–2294. [Google Scholar] [CrossRef]
  35. Zhang, J.; He, Z.Y.; Jia, Y. Fault line identification approach based on S-transform. Proc. CSEE 2011, 31, 109–115. (in Chinese). [Google Scholar]
  36. Stefanoiu, D.; Ionescu, F. A Fuzzy-Statistical Reasoning Model for Bearings Fault Diagnosis. In Proceedings of the 2002 IEEE International Conference on Systems, Man and Cybernetics, Hammamet, Tunisia, 6–9 October 2002.
  37. Cristianini, N.; Shawe-Taylor, J. An Introduction to Support Vector Machines and Other Kernel-Based Learning Methods, 1st ed.; Cambridge University Press: Cambridge, UK, 2000; pp. 93–111. [Google Scholar]
  38. Hsu, C.W.; Lin, C.J. A comparison of methods for multi-class support vector machines. IEEE Trans. Neural Netw. 2002, 13, 415–525. [Google Scholar] [CrossRef] [PubMed]
  39. Gen, M.; Cheng, R.W. Genetic Algorithms and Engineering Optimization, 1st ed.; John Wiley: New York, NY, USA, 2000; pp. 97–141. [Google Scholar]
  40. Zhang, W.P.; Shi, L.T.; Zhao, X.S. The principle and design for long distance electric eddy current sensor with double coils. Acta Electron. Sin. 1998, 26, 61–65. (in Chinese). [Google Scholar]

