1. Introduction
Condensate gas is a gas mixture which is mainly composed of methane, and also contains more C
7+ fractions than regular natural gas [
1]. In condensate gas fields, surface chokes may be installed to control pressures and to protect equipment from unusual high pressures. Many researchers have studied gases flow through chokes. Many empirical correlations and theoretical models have been proposed. The empirical models, such as those from Elgibaly [
2] and Attar [
3], were all developed for specific ranges of data and should not be extended beyond those ranges. The theoretical models such as the Perkins model [
4] and Hydro model [
5] are basically derived from mass, momentum, and energy balances. The theoretical models are used more often by the industry because of their ability to simulate the phase transition of gas and the other physical phenomena. For example, the Perkins model [
4] describes the multiphase flow across a choke for critical and subcritical flows. It assumes the gas compressibility factor is constant. The Hydro model [
5] is derived from the local cross-sectional averaged balance equations of mass, momentum and energy for steady-state flow of a multiphase mixture, which is adopted by the multiphase flow simulation software SPT OLGA. Compared to Perkins model, the significant improvement of the model lies in that it accounts for slippage between the phases.
The models above were mainly used to predict the relationship between pressures, total mass flow rates of the mixture and orifices of the choke throat. However, while flowing through a choke valve, the temperature of the condensate gas will also change along with the pressure drop because of the Joule-Thompson effect [
6], and the temperature downstream of the choke, which is not essential for mass flow rate prediction, is very important for the surface gathering and processing systems of condensate gas [
7].
A study of temperatures downstream of chokes was done for the condensate gas with pressures over 70 MPa and temperatures over 70 °C in the Tarim Oil Field, China. The study simulated the temperatures by some commercial software (such as the Aspen HYSYS which is a process modeling and simulation tool for the oil and gas industry and SPT Group OLGA) whose accuracy has been recognized by the industry. However, the results obtained by the software are about 10 °C lower than those actually measured.
There are two possible reasons that contribute to the problem. First, the Hydro model adopted by the OLGA software might not be valid for the downstream temperature because it was mainly developed to predict the total mass flow rates of mixtures [
5]. Second, these two software packages might not accurately predict the physical properties related with the temperature prediction, such as the compressibility factor, density, enthalpy, under high pressure high temperature (HTHP) conditions. Many literatures have proven that special methods should be used for predicting the physical parameters at HTHP. Otherwise, there would be large errors between the calculated and experimental data [
8,
9].
The purpose of this paper is to develop a theoretical model for accurate prediction of the downstream temperatures of HTHP condensate gas as well as its relative physic parameters using in the model.
2. Model Establishment
2.1. Iso-Enthalpy Model
While the condensate gas flows though a choke valve, its velocity will increase and pressure will fall. The choke energy model can be derived from the continuity equation and energy conservation equation of fluid. On the basis of one kilogram of flowing mixtures, the model can be written as follows [
6]:
where,
p is the pressure;
v is the specific volume;
e is the internal energy;
Z is the elevation;
H is the total specific enthalpy;
C is the flow velocity of gas;
Q is the heat transferred to the flowing stream;
W is the work done by the flowing system. The subscript 1 is the upstream of the choke; 2 is the downstream of the choke.
According to the definition of enthalpy:
Equation (1) also can be written as:
If the mixture is in single phase, the total specific enthalpy equals the enthalpy of the single phase. However, if the mixture is in two-phase, the total specific enthalpy should be calculated from the weight average of each phase enthalpy:
where,
m is the mass fraction;
h is the specific enthalpy. The subscript
l is the liquid phase;
g is the vapor phase. Beginning with Equation (3) and Equation (4), the choke energy model is simplified based on the following assumptions [
4]:
(1) The kinetic energy of the mixture is usually negligible compared with its total energy;
(2) The elevation changes across the choke are negligible;
(3) Each phase has the same temperature and pressure if phase changes occur;
(4) The flow process is frictionless;
(5) The flow process is adiabatic because the time for heat transfer is very limited;
(6) The external work done is zero.
Then, the general energy equation reduces to Equation (5):
For mixtures, the enthalpy is the function of temperatures, pressures and composition, which means:
where,
T is temperatures;
Com is the composition of the mixtures. Equations (5) and (6) indicate the choke process of condensate gas satisfies the iso-enthalpy theory. That means the enthalpies upstream of the choke equals those downstream. The critical parameters in the model are the pressure, temperature, composition and mass fraction of each phase. Besides, the model is independent of the throat areas of chokes as well as flow patterns. Thus it is valid for both the critical and subcritical flows [
6] through different kinds of choke valves.
Based on the iso-enthalpy choke model, downstream temperatures of the choke can be obtained if the other parameters of the mixture, which are composition and mass fraction of each phase, upstream temperatures, upstream and downstream pressures, are all known. It also should be noted that appropriate calculation methods for both liquid-vapor phase equilibrium and enthalpies are essential for accurate prediction of downstream temperatures.
2.2. Liquid-Vapor Phase Equilibrium Model
Liquid-vapor phase changes combined with the composition changes of each phase may occur when the condensate gas mixture flows through the choke. For example, in the Tarim Oil Field, the upstream mixtures of the HTHP condensate gas are often in the supercritical state which is normally treated as a single-phase [
10], but the downstream mixtures are generally in the two-phase state due to the pressure drop, and liquid condensation occurs. This process can be simulated by equation of states (EoS), such as the Peng-Robison EoS, Soave-Redlich-Kwong (SRK) EoS and Bennedict-Webb-Rubin EoS. This paper adopts the SRK EoS which is recommended by the API (American Petroleum Institute) Databook [
11]. Its general form and solution method are illustrated in [
11].
2.3. Enthalpy Model
Enthalpy of a vapor or liquid is dependent on the composition, pressure and temperature. It can be calculated with EoSs. For enthalpy, the Lee-Kesler (LK) EoS is considered to be one of the most accurate EoSs [
11]. The LK EoS was developed by Lee and Kesler in 1975, and its general form is:
where,
pr is the reduced pressure,
p/
pc;
p is the pressure;
pc is the critical pressure;
Vr =
pcV/
RTc;
V is the mole volume for simple fluid or heavy reference fluid (
n-Octane);
R is the gas constant;
Tr is the reduced temperature,
T/
Tc;
Tc is the critical temperature;
T is the temperature;
b1,
b2,
b3,
b4,
c1,
c2,
c3,
c4,
d1,
d2,
β,
γ are constants that are listed in API Databook [
11].
The general method for predicting the total vapor or liquid enthalpy based on the LK EoS is to calculate the weighted average of the ideal gas properties and correct the entire mixture for pressure using a pseudocritical approach. With the term for dimensionless pressure effect on enthalpy, the total enthalpy for the vapor and liquid may be found from the following equation:
where,
H is the total enthalpy of gas or liquid mixture;
M is molecular weight of the gas or liquid mixture;
H0 is the enthalpy of an ideal gas, which is calculated from a polynomial correlation [
11].
G is the dimensionless effect of pressure on enthalpy of interest fluid, and it is computed by Equation (9):
where,
ω is the acentric factor of the fluid. The superscripts (0) is the simple fluid; (
h) is the heavy reference fluid (
n-octane).
ω(h) is 0.3978.
G(0) and
G(h) are to be calculated from Equation (10):
where,
z is the compressibility factor; the superscripts:
i = 0 when the equation is applied to the simple fluid;
i =
h when the equation is applied to the heavy reference fluid.
2.4. Mixing Rules for Enthalpy Model
Application of the enthalpy calculation method is straightforward; the critical temperatures and pressures are used directly to calculate reduced conditions. It is reported that the enthalpy calculation method is valid between the reduced temperatures of 0.3 and 4.0 and between reduced pressures of 0 and 10.0 for pure hydrocarbon liquids and gases.
For mixtures, an imaginary critical point (pseudocritical point) is postulated to exist such that the mixture corresponds in behavior to a pure substance having an identical critical point, so the pseudocritical temperature and pressure are applied to calculate reduced conditions instead of the true critical temperature and pressure. There are a number of mixing rules to calculate the pseudocritical properties. However, different mixing rules may give different results for a specific mixture, and for high pressure and high temperature (P > 15 MPa, T > 70) mixtures, the result differences among mixing rules always cannot be ignored. This paper researched the Lee-Kesler, Plocker-Knapp, Wong-Sandler and Prausnitz-Gunn mixing rules.
Lee-Kesler mixing rule [
12]:
where,
Tcm is the mixture pseudocritical temperature;
vcm is the mixture pseudocritical specific volume;
pcm is the mixture pseudocritical pressure;
x is the mole fraction. The superscripts
i is component
i.
Plocker-Knapp mixing rule [
13]:
where,
kij is the binary interaction coefficient between component
i and
j.
Wong-Sandler mixing rule [
14]:
Prausnitz-Gunn mixing rule [
15]: Prausnitz and Gunn proposed a mixing rule for the pseudoctitical pressure calculation under the condition of supercritical temperatures (
Tr > 1) and high pressures (
Pr > 5):
It should be noted that the Prausnitz and Gunn mixing rule is valid for a limited temperature and pressure region. In addition, it only refers to the calculation method of pcm, and the Tcm corresponding to the pcm should be calculated by other mixing rules. The accuracies of the four mixing rules at different pressures and temperatures are researched in the following work.
3. Model Solution
The temperature prediction model for condensate gas through chokes is composed of three parts:
- (1)
The iso-enthalpy choke model;
- (2)
The liquid-vapor phase equilibrium model;
- (3)
The enthalpy calculation model with mixing rules.
The model can be solved by the following procedures:
Step 1: Input the composition of condensate gas and temperatures of upstream and downstream of the choke as well as the corresponding pressures. Notice that the downstream temperature is unknown, and its appropriate initial value should be set 20 °C lower than the upstream temperature.
Step 2: Calculate both the upstream and downstream compositions of the liquid phase as well as the vapor phase of the condensate gas by phase equilibrium model.
Step 3: Calculate the upstream and downstream enthalpies of liquid phase as well as vapor phase of the condensate gas by LK EoS and certain mixing rules.
Step 4: Calculate the upstream and downstream total enthalpies of the condensate gas with Equation (5).
Step 5: Check the enthalpies: if the upstream enthalpy is larger than the downstream one, increase the downstream temperature and go back to step 2; otherwise, decrease the estimated temperature; and if the difference between the upstream and downstream enthalpies is less than 0.2 kJ/kg, stop the solution procedures and output the downstream temperature.
4. Results and Discussions
4.1. Mixing Rule for Pr < 5
Aspen HYSYS is regarded as one of the most accurate software packages for simulating chokes with pressures less than 15 MPa. The downstream temperatures can also be calculated by substituting the mixing rules into the temperature prediction model, so we set the HYSYS values of downstream temperatures as the standard values for selecting the mixing rule with
Pr < 5, and the accuracy of each mixing rule is evaluated by comparing the temperatures calculated by the model and HYSYS. The absolute error (
AE) and average absolute error (
AAE) between the calculated and standard values are defined as:
where,
N is the total number of data points,
Tcal is values calculated with different mixing rules,
Tst is standard values which are HYSYS values when
Pr < 5 or measured values when
Pr > 5 and
Tr > 1. The basic parameters are obtained by the Tarim fluid system named DINA24, as shown in
Table 1. The comparison results are shown in
Table 2 and
Figure 1.
Table 1.
Composition of DINA24 condensate gas.
Table 1.
Composition of DINA24 condensate gas.
| Component | Mole Fraction | Component | Mole Fraction | Component | Mole Fraction |
|---|
| CO2 | 0.0031 | iC5H12 | 0.0011 | C13H28 | 0.0007 |
| H2S | 0.0030 | nC5H12 | 0.0008 | C14H30 | 0.0008 |
| H2O | 0.0060 | C6H14 | 0.0013 | C15H32 | 0.0005 |
| N2 | 0.0119 | C7H16 | 0.0019 | C16H34 | 0.0004 |
| C1H4 | 0.8720 | C8H18 | 0.0020 | C17H36 | 0.0003 |
| C2H6 | 0.0716 | C9H20 | 0.0014 | C18H38 | 0.0002 |
| C3H8 | 0.0119 | C10H22 | 0.0011 | C19H40 | 0.0002 |
| iC4H10 | 0.0023 | C11H24 | 0.0008 | C20H42 | 0.0012 |
| nC4H10 | 0.0024 | C12H26 | 0.0010 | | |
Table 2.
Calculated downstream temperatures for DINA24 condensate gas.
Table 2.
Calculated downstream temperatures for DINA24 condensate gas.
| No. | Pressure/MPa | | Temperature/°C |
|---|
| Upstream | Downstream | Upstream | Downstream |
|---|
| HYSYS 2006 | Lee-Kesler | Plocker-Knapp | Wong-Sandler |
|---|
| 1 | 14.00 | 9.00 | 85.00 | 73.96 | 75.21 | 75.97 | 75.29 |
| 2 | 12.00 | 7.00 | 80.00 | 67.79 | 69.10 | 69.87 | 69.73 |
| 3 | 11.00 | 6.50 | 75.00 | 63.44 | 64.62 | 65.34 | 64.66 |
| 4 | 10.00 | 6.00 | 70.00 | 59.17 | 60.21 | 60.88 | 60.49 |
| 5 | 9.00 | 5.50 | 65.00 | 55.01 | 55.87 | 56.48 | 56.39 |
| 6 | 8.50 | 5.00 | 60.00 | 49.55 | 50.25 | 51.16 | 50.50 |
| 7 | 8.00 | 4.50 | 55.00 | 44.05 | 44.86 | 45.23 | 45.12 |
| 8 | 7.00 | 3.00 | 50.00 | 36.33 | 37.26 | 38.28 | 38.12 |
| 9 | 6.00 | 1.00 | 40.00 | 19.50 | 20.83 | 22.50 | 21.64 |
| | Absolute Average Error (°C) | --- | 1.05 | 1.88 | 1.46 |
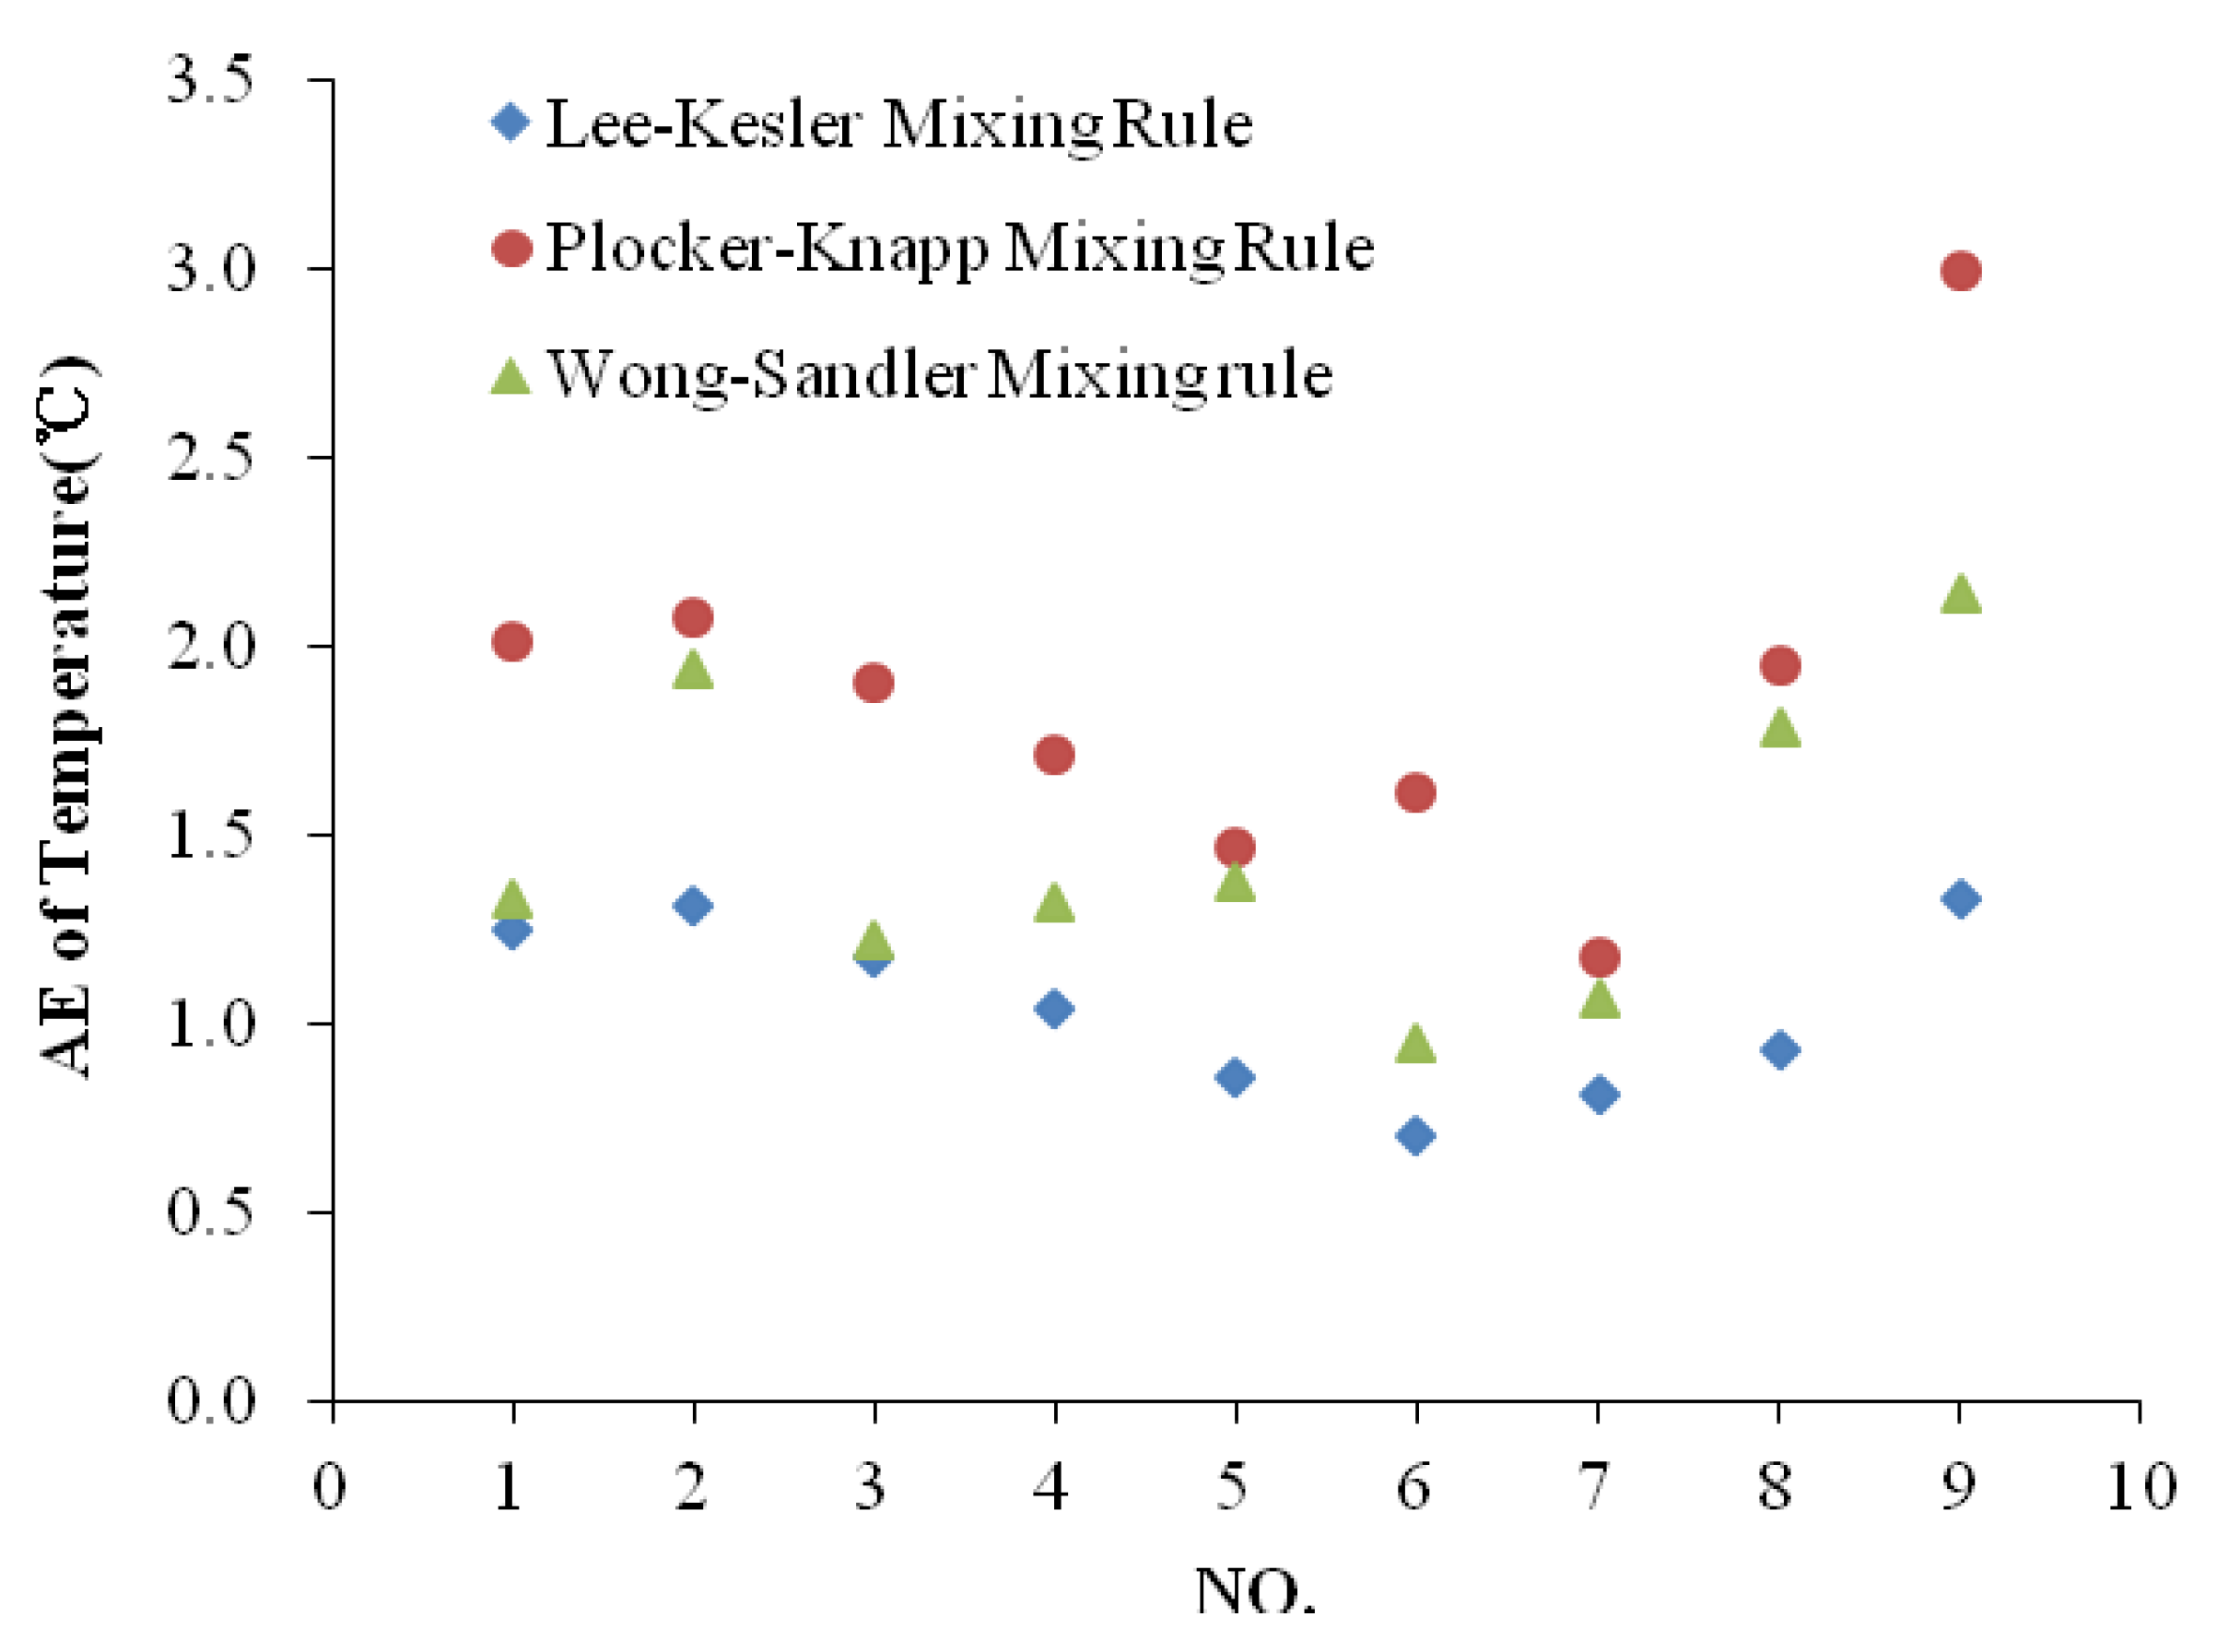
Figure 1.
Absolute errors of temperatures between HYSYS and the prediciton model with different mixing rules.
Figure 1.
Absolute errors of temperatures between HYSYS and the prediciton model with different mixing rules.
As shown in
Table 2 and
Figure 1, the Lee-Kesler mixing rule gives more accurate downstream temperatures than the other mixing rules, and its
AAE is 1.05 °C.
4.2. Mixing Rule for Pr > 5 and Tr > 1
Because the pseudocritical temperature of Prausnitz-Gunn mixing rule must be calculated from the other mixing rules, there are six available mixing rules for condensate gas with
Pr > 5 and
Tr > 1, as listed in
Table 3.
The iso-enthalpy theory commands that the condensate gas’ enthalpy upstream of the choke should be equal to the downstream one, and this paper has proven above that the temperature prediction model with LK mixing rule gives accurate downstream temperatures in the downstream pressure ranges so there is no doubt of the accuracy of the downstream enthalpies obtained by the LK mixing rule and measured values of corresponding temperatures and pressures.
Table 3.
Mixing rules for Pr > 5 and Tr > 1.
Table 3.
Mixing rules for Pr > 5 and Tr > 1.
| No. | Pseudocritical Temperature | Pseudocritical Pressure |
|---|
| 1 | Lee-Kesler | Lee-Kesler |
| 2 | Plocker-Knapp | Plocker-Knapp |
| 3 | Wong-Sandler | Wong-Sandler |
| 4 | Lee-Kesler | Prausnitz-Gunn |
| 5 | Plocker-Knapp | Prausnitz-Gunn |
| 6 | Wong-Sandler | Prausnitz-Gunn |
We set those downstream enthalpies as the selection basis to evaluate the accuracy of each mixing rule for condensate gas with
Pr > 5 and
Tr > 1. The measured parameters at DINA24’s wellhead are shown in
Table 4.
Table 4.
Measured upstream and downstream parameters of DINA24.
Table 4.
Measured upstream and downstream parameters of DINA24.
| Measured No. | Pressure (MPa) | Temperature (°C) |
|---|
| Upstream | Downstream | Upstream | Downstream |
|---|
| 1 | 74.05 | 12.07 | 89.37 | 73.98 |
| 2 | 82.95 | 11.17 | 79.87 | 66.71 |
| 3 | 73.34 | 11.66 | 93.23 | 74.50 |
| 4 | 79.50 | 10.68 | 84.25 | 69.00 |
| 5 | 85.30 | 10.83 | 90.21 | 72.98 |
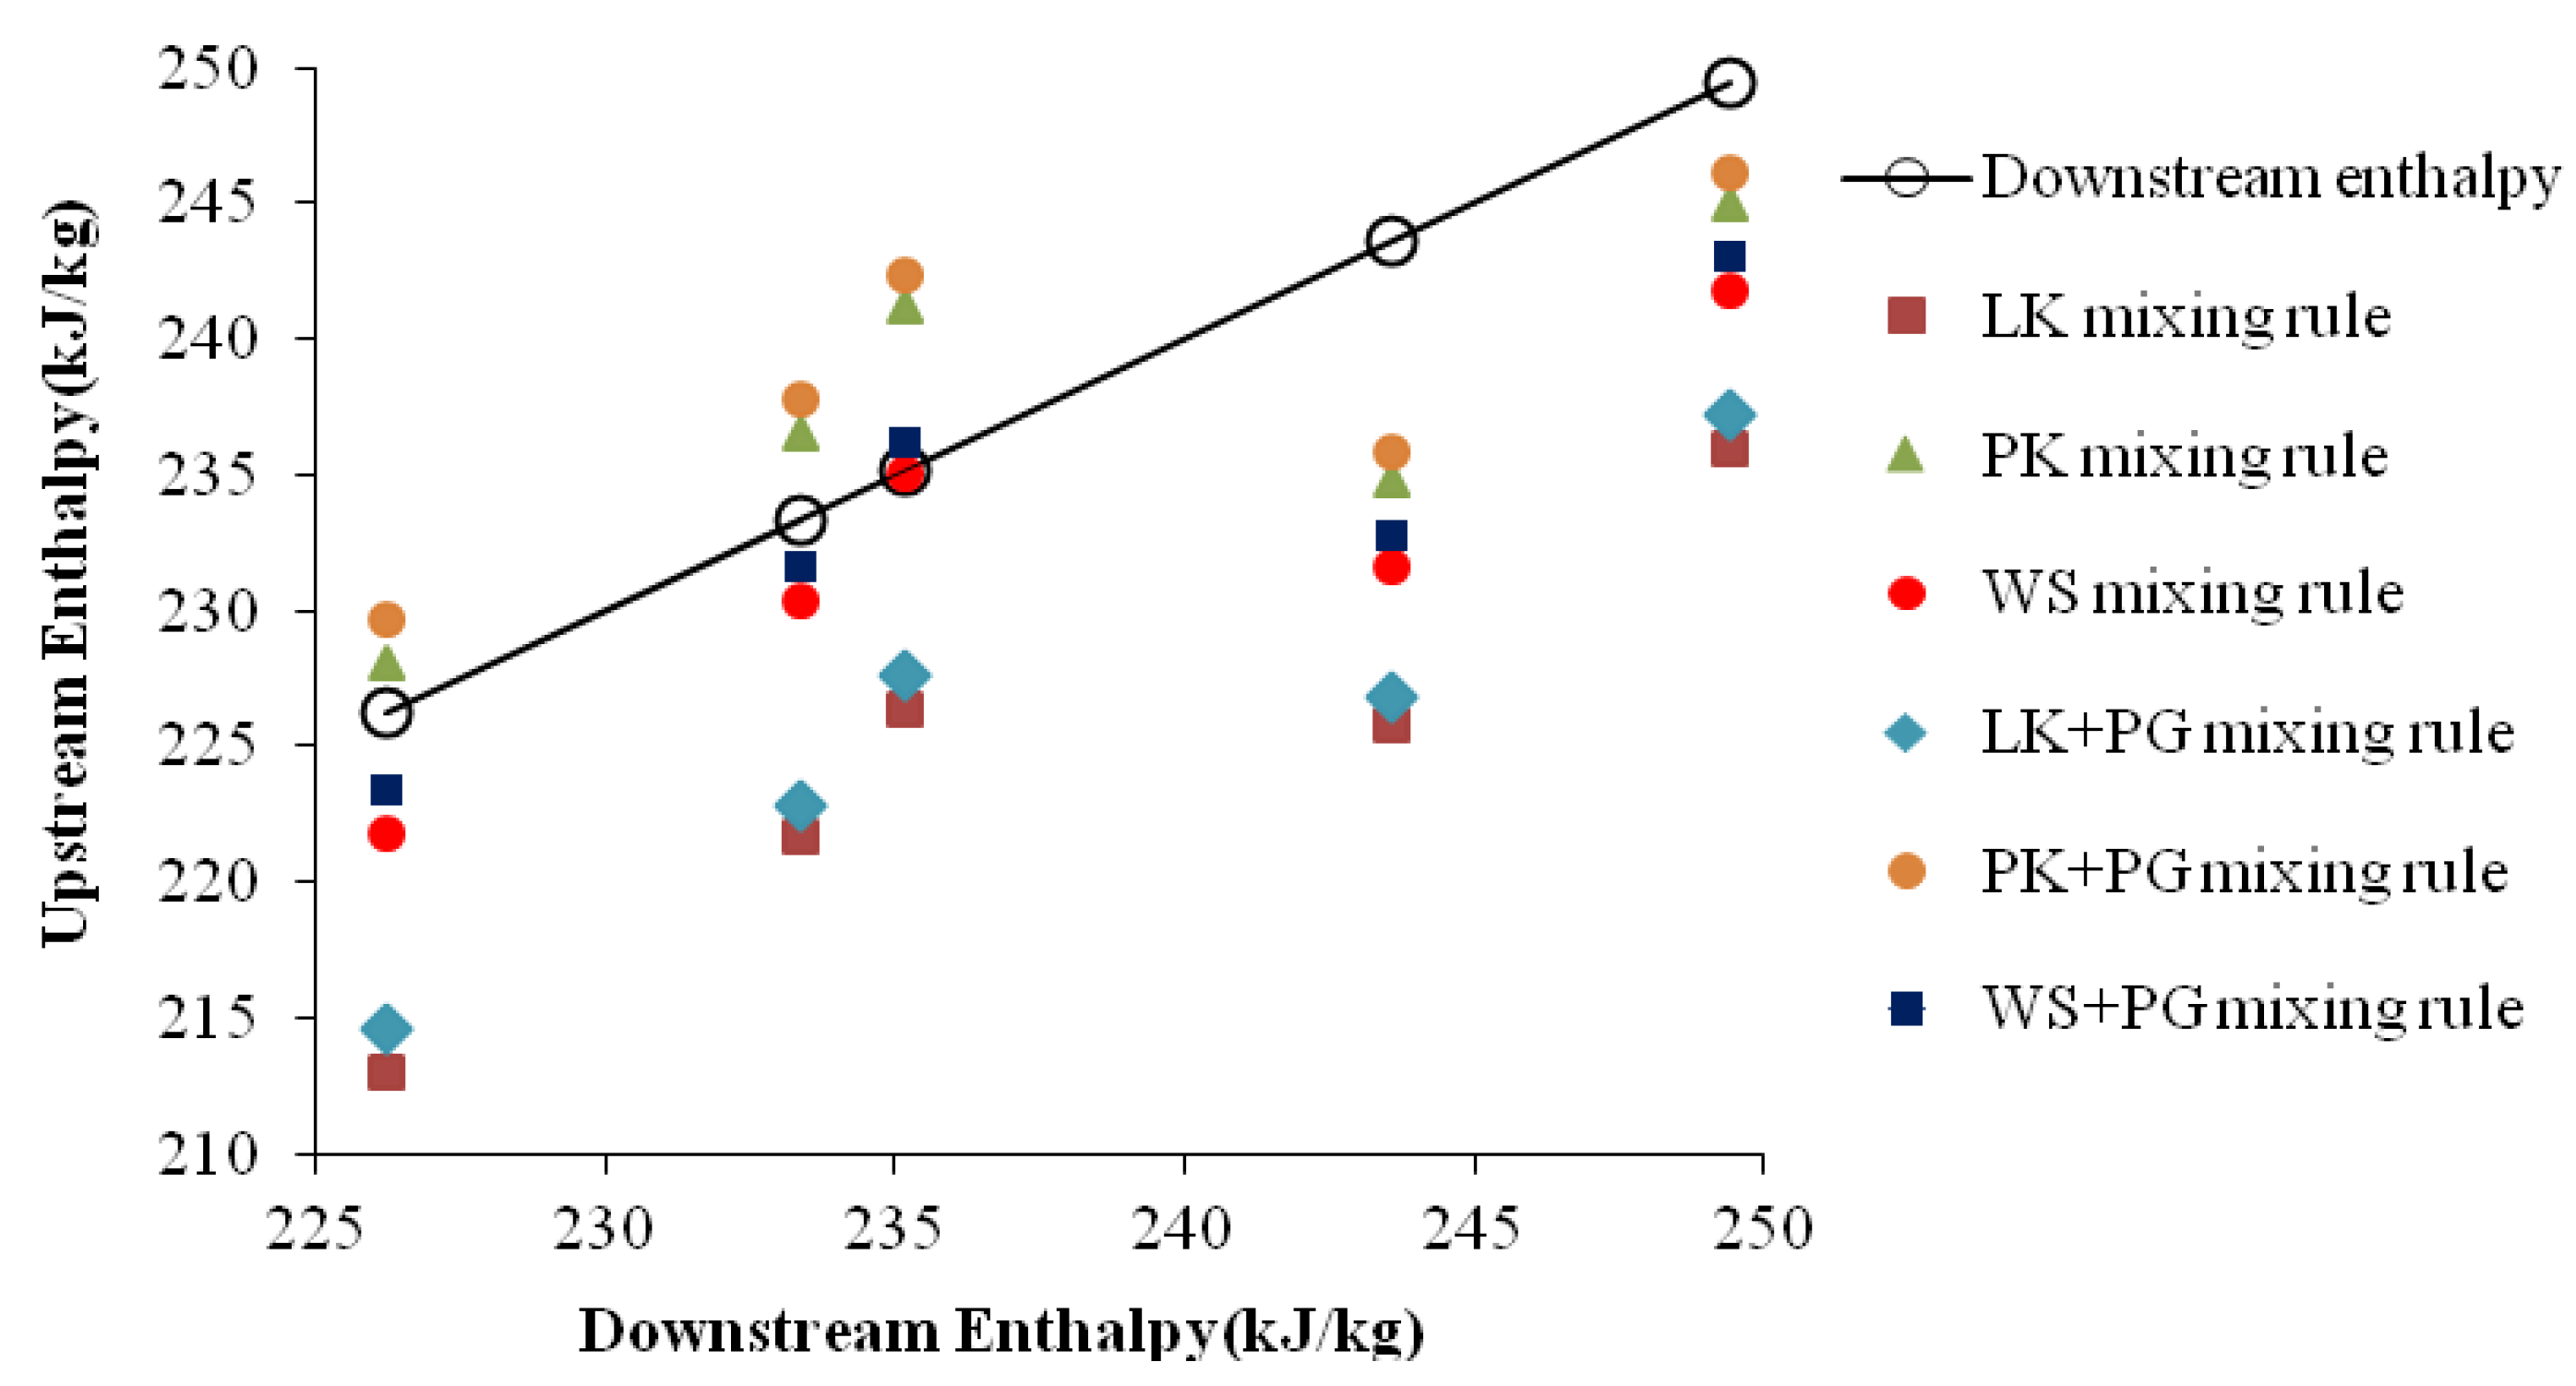
Figure 2.
Comparison between the upstream and downstream enthalpies.
Figure 2.
Comparison between the upstream and downstream enthalpies.
Figure 2 shows the cross-plot of downstream enthalpies versus upstream enthalpies obtained by LK EoS with six mixing rules. It presents the degree of agreements between the downstream and upstream values. If the agreement is perfect, then all the points should lie on the oblique line on the plot. The scattered data points obtained by WS+PG mixing rule are the closest to oblique line, while the data obtained by LK mixing rule is the worst one. The
AAE of WS+PG mixing rule is 4.56 kJ/kg, and that of LK mixing rule is 12.98 kJ/kg.
In summary, the accurate prediction model of downstream temperatures should use the enthalpy model with a combination mixing rule: the WS+PG mixing rule for condensate gas with Pr > 5 and Tr > 1; the LK mixing rule for condensate gas with Pr < 5.
4.3. Applications of the Temperature Prediction Model with the Combination Mixing Rule
There are four samples of condensate gas with different compositions shown in
Table 5.
Table 5.
Compositions of four condensate gases.
Table 5.
Compositions of four condensate gases.
| Component | Mole Fraction |
|---|
| DINA22 | DINA2B | DINA25 | DINA2B1 |
|---|
| CO2 | 0.0031 | 0.0036 | 0.0104 | 0.0034 |
| N2 | 0.0119 | 0.0105 | 0.0039 | 0.0095 |
| C1H4 | 0.8796 | 0.8768 | 0.8794 | 0.8797 |
| C2H6 | 0.0715 | 0.0743 | 0.0748 | 0.0743 |
| C3H8 | 0.0119 | 0.0129 | 0.0113 | 0.0127 |
| iC4H10 | 0.0023 | 0.0027 | 0.0024 | 0.0026 |
| nC4H10 | 0.0024 | 0.0028 | 0.0025 | 0.0027 |
| iC5H12 | 0.0011 | 0.0013 | 0.0012 | 0.0013 |
| nC5H12 | 0.0008 | 0.0009 | 0.0008 | 0.0009 |
| C6H14 | 0.0013 | 0.0018 | 0.0017 | 0.0017 |
| C7H16 | 0.0019 | 0.0030 | 0.0028 | 0.0025 |
| C8H18 | 0.0020 | 0.0037 | 0.0035 | 0.0033 |
| C9H20 | 0.0015 | 0.0015 | 0.0015 | 0.0013 |
| C10H22+ | 0.0086 | 0.0042 | 0.0040 | 0.0042 |
Table 6.
Upstream and downstream parameters of 4 condensate gases.
Table 6.
Upstream and downstream parameters of 4 condensate gases.
| No. | Pressure (MPa) | | Temperature (°C) | Composition |
|---|
| Downstream | Upstream | Upstream | Downstream |
|---|
| Measured | HYSYS | Model |
|---|
| 1 | 74.05 | 12.07 | | 89.37 | 73.98 | 64.43 | 71.76 | DINA22 |
| 2 | 82.95 | 11.17 | 79.87 | 66.71 | 56.80 | 63.97 | DINA22 |
| 3 | 73.34 | 11.66 | 93.23 | 74.50 | 62.98 | 74.09 | DINA22 |
| 4 | 85.51 | 11.52 | 79.50 | 65.78 | 56.03 | 64.17 | DINA2B |
| 5 | 82.51 | 11.41 | 87.69 | 73.25 | 62.95 | 70.86 | DINA2B |
| 6 | 85.54 | 11.51 | 80.71 | 65.85 | 58.23 | 65.04 | DINA2B |
| 7 | 79.62 | 11.78 | 74.18 | 57.53 | 49.37 | 59.65 | DINA25 |
| 8 | 78.84 | 11.79 | 76.96 | 56.07 | 50.20 | 58.57 | DINA25 |
| 9 | 78.48 | 11.71 | 78.59 | 57.08 | 51.39 | 59.42 | DINA25 |
| 10 | 80.14 | 12.26 | 84.30 | 68.97 | 59.05 | 67.94 | DINA2B1 |
| 11 | 82.14 | 11.92 | 82.35 | 67.79 | 56.94 | 66.03 | DINA2B1 |
| 12 | 80.14 | 12.24 | 83.71 | 61.80 | 58.43 | 60.44 | DINA2B1 |
| | Average Absolute Error | --- | 8.54 | 1.77 | |
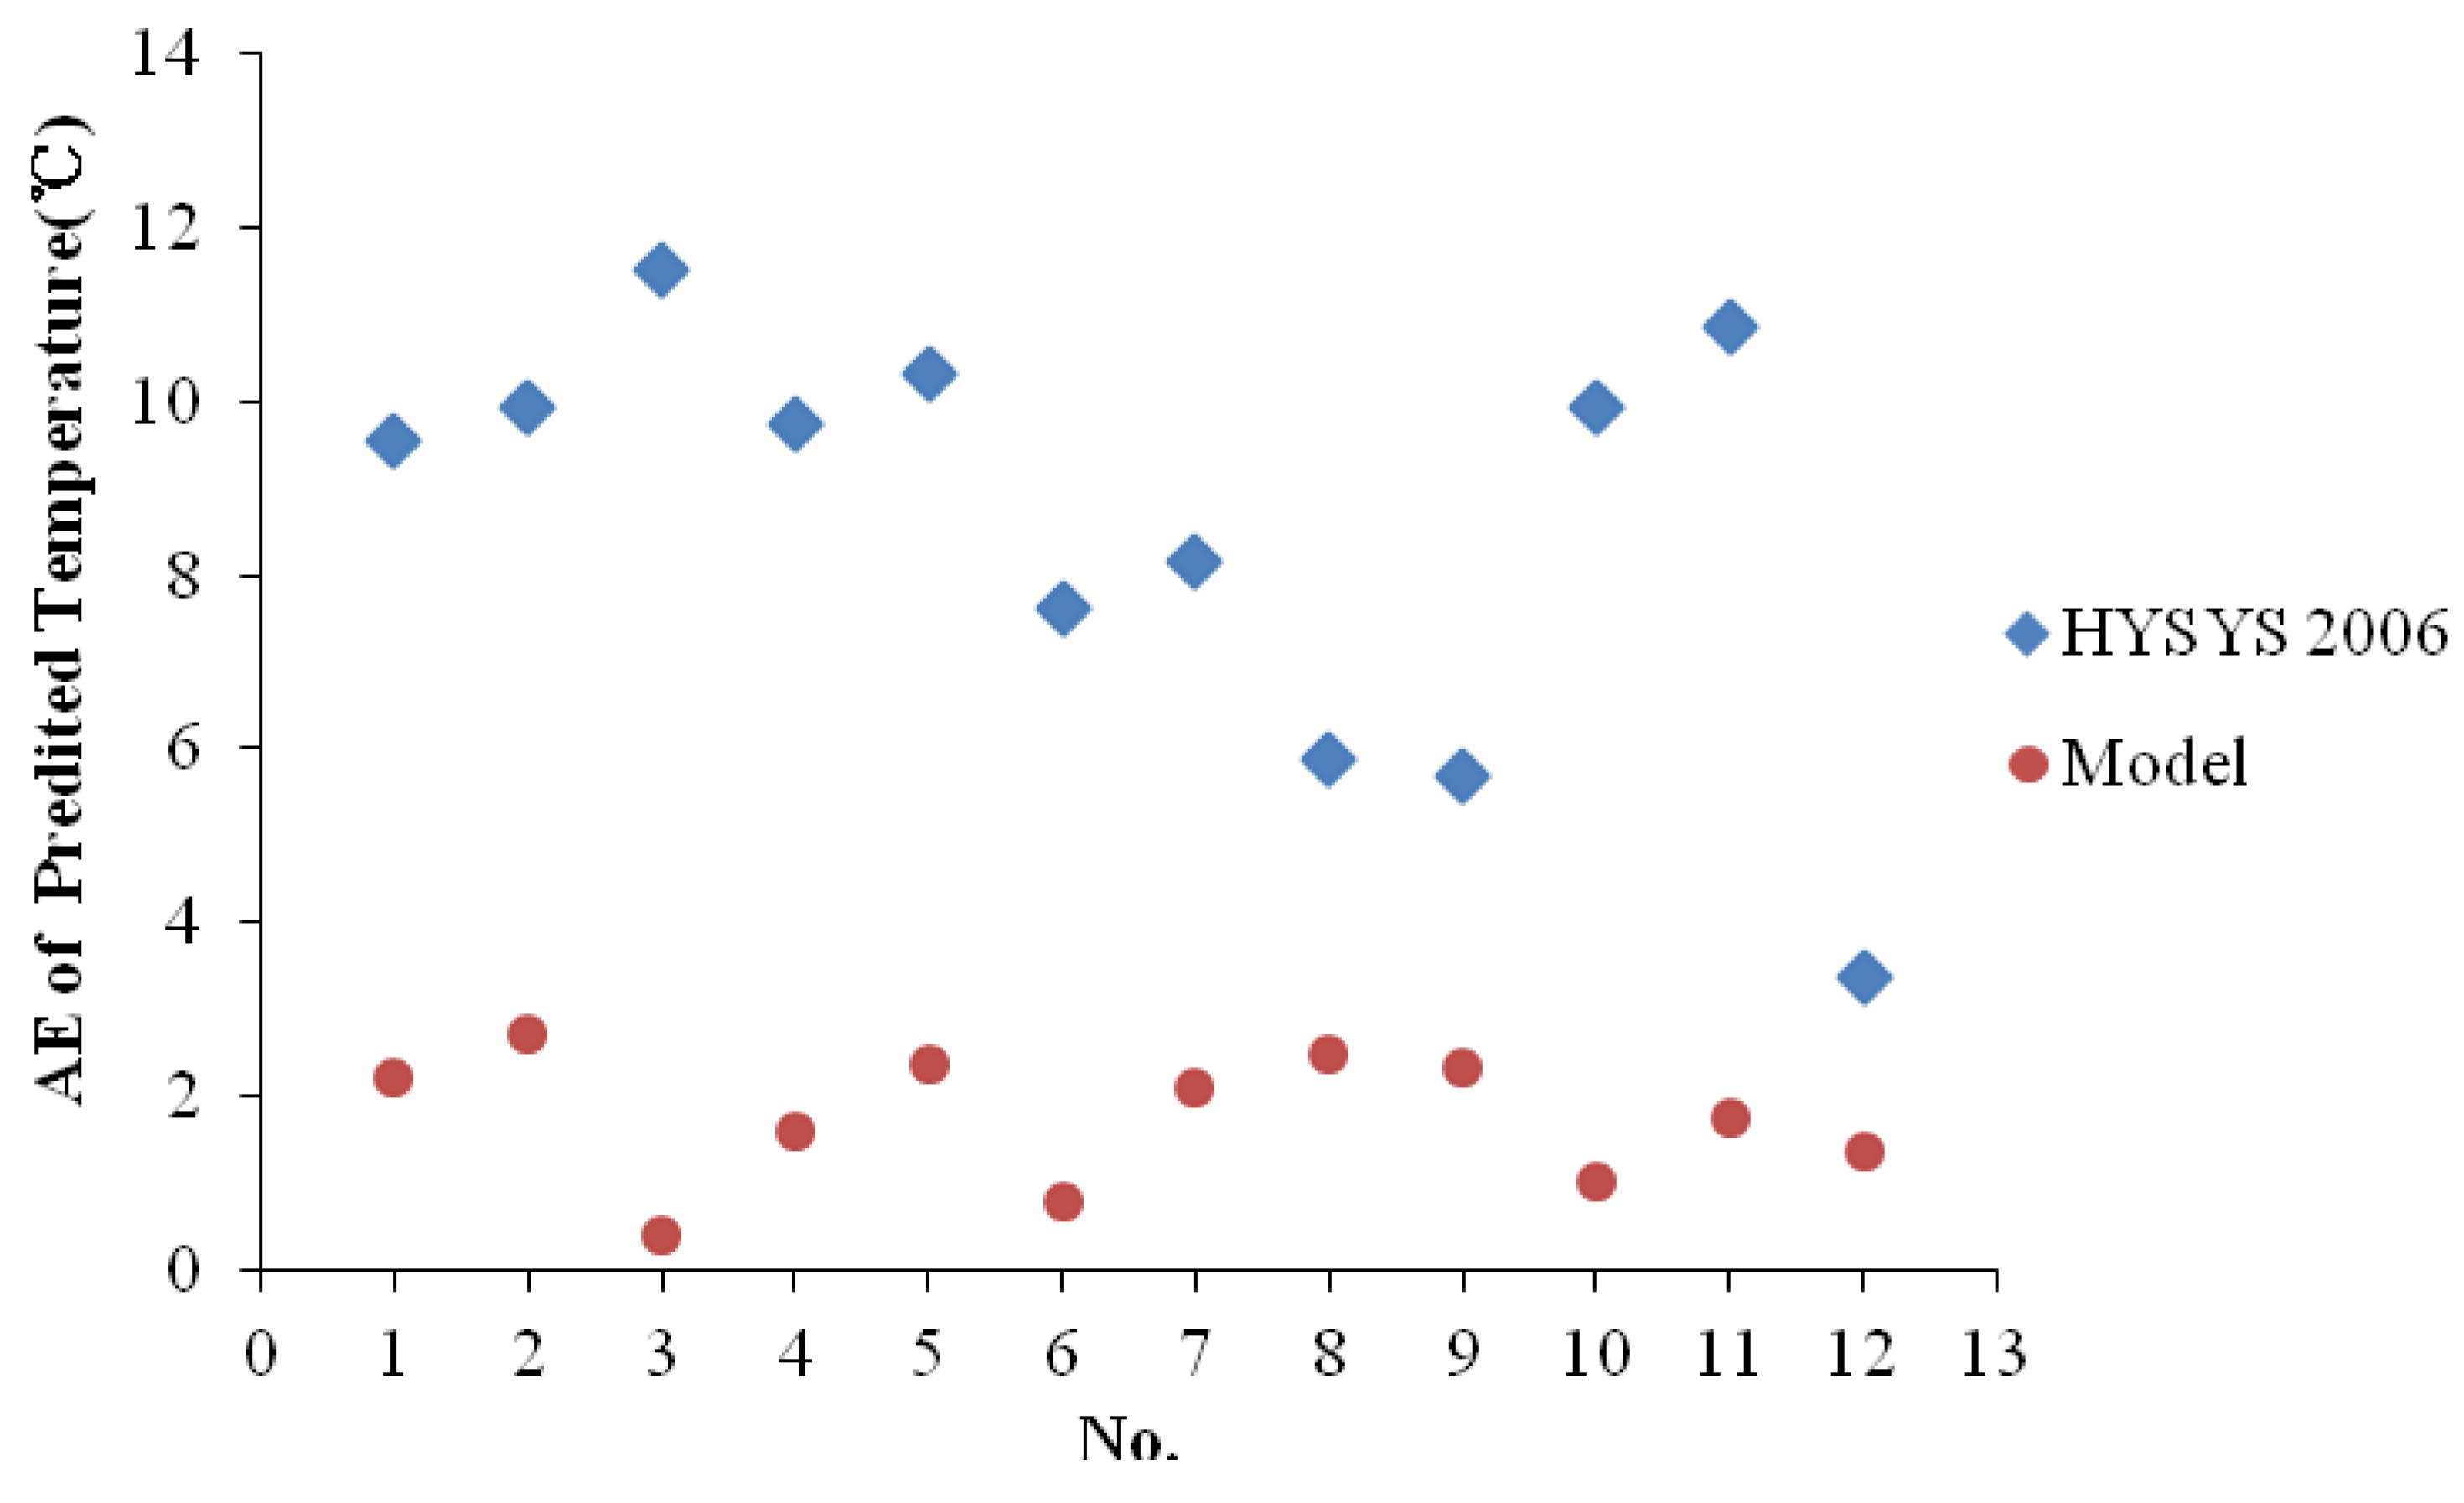
These four samples are all HPHT gas since their upstream pressures ranged from 73.34 MPa to 85.54 MPa and upstream temperatures ranged from 74.18 °C to 93.23 °C. The measured upstream temperatures, pressures, downstream pressures and temperatures as well as the calculated downstream temperatures are shown in
Table 6. As shown in this Table and
Figure 3,
AEs of the prediction model with the combination mixing rule are significant lower than those of HYSYS 2006. The
AAE of the prediction model is 1.77 °C, while that of HYSYS 2006 is 8.54 °C. The comparison among the model, HYSYS and measured values reveals that the temperature prediction model with the combination mixing rule is effective for predicting the temperatures downstream of the chokes for HPHT condensate gas.
Figure 3.
Absolute errors of temperautres between HYSYS and the prediction model with the combination mixing rule.
Figure 3.
Absolute errors of temperautres between HYSYS and the prediction model with the combination mixing rule.
Besides, with an amount of applications, we can conclude that the average absolute errors between the measured and calculated temperatures downstream of the chokes are expected for less than 2 °C.
5. Conclusions
This study developed a theoretical model for predicting the downstream temperatures of high pressure high temperature condensate gas flowing through chokes based on the iso-enthalpy choke model, the liquid-vapor equilibrium model and the enthalpy model.
The use of Lee-Kesler EoS in the enthalpy model makes the pseudocritical properties of great importance. Those properties should be obtained by mixing rules, therefore the Lee-Kesler, Plocker-Knapp, Wong-Sandler and Prausnitz-Gunn mixing rules were all researched. The results show the accurate enthalpy model should use a combination mixing rule: when Pr > 5 and Tr > 1, the pseudocritical temperature should be calculated by the Wong-Sandler mixing rule, and the pseudocritical pressure should be calculated by Prausnitz-Gunn mixing rule; when Pr < 5, both the pseudocritical temperature and pressure should be calculated by the Lee-Kesler mixing rule.
According to the applications, the model is valid for predicting the downstream temperatures of condensate gases with upstream pressures up to 85.54 MPa and temperatures up to 93.23 °C. The average absolute errors between the measured and calculated downstream temperatures are expected to be less than 2 °C when using the model.


