Field Measurements of Residential Energy Consumption and Indoor Thermal Environment in Six Chinese Cities

Abstract
:1. Introduction
2. Outline of the Survey
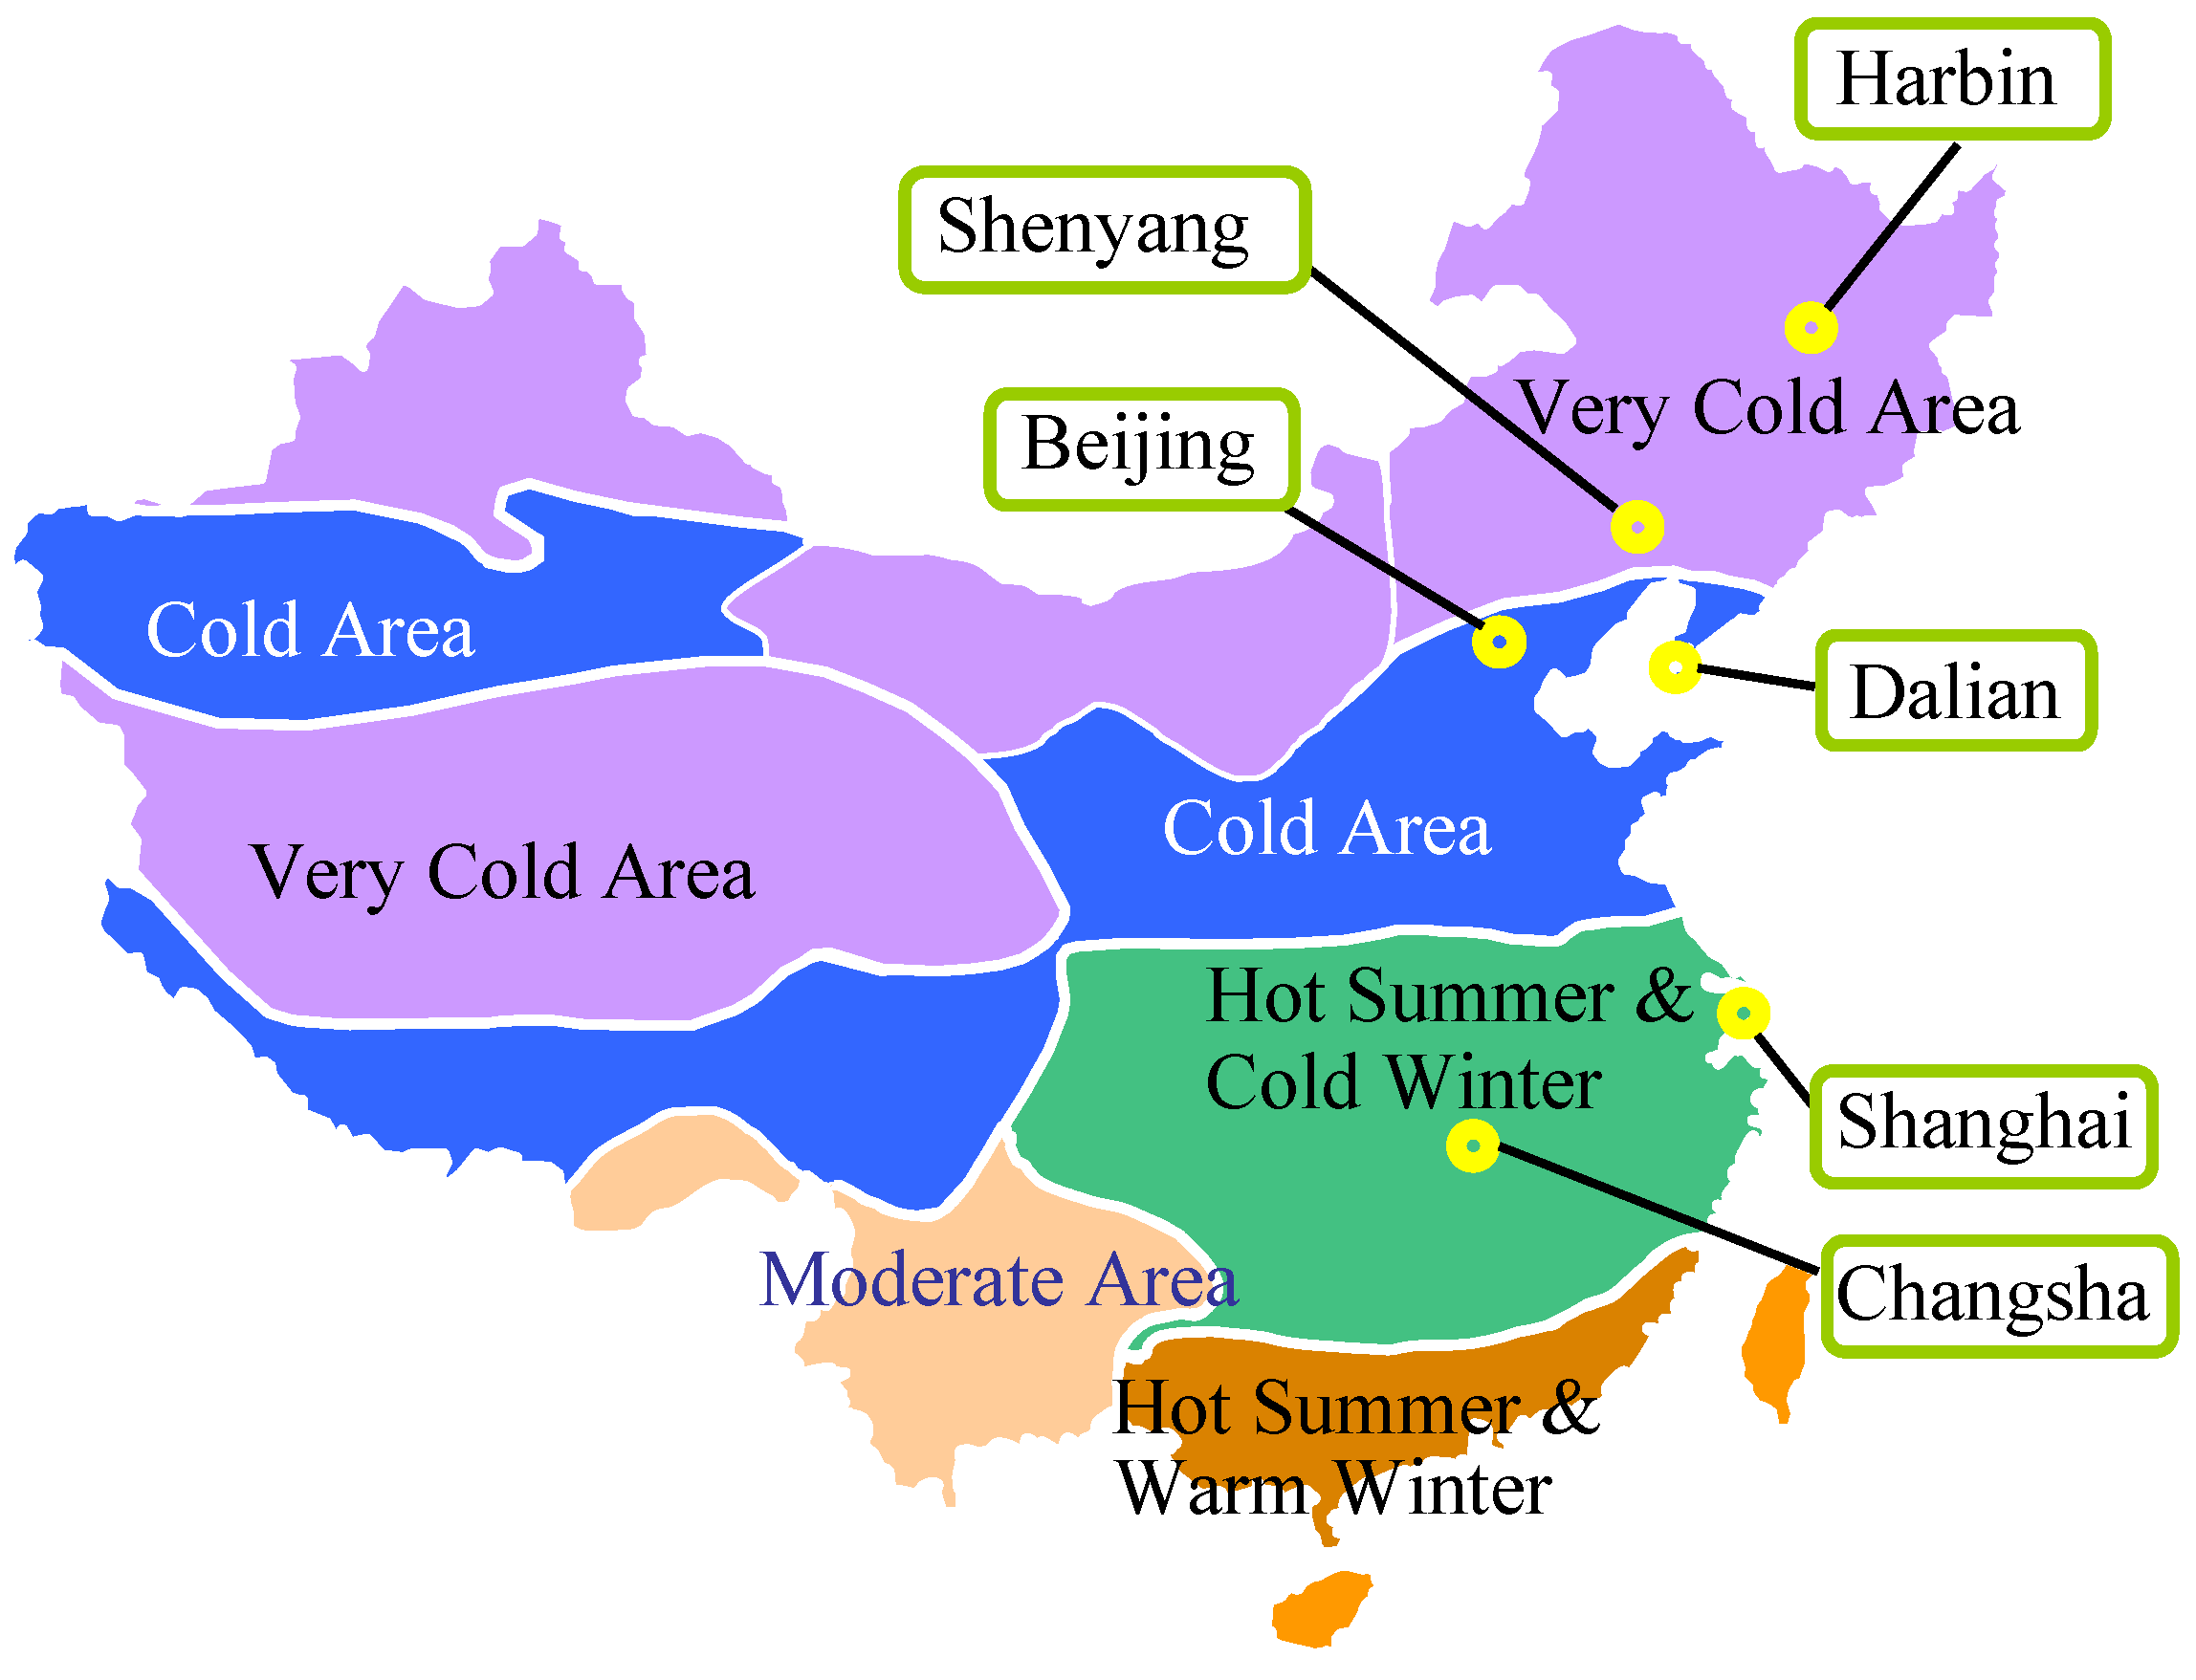
2.1. Object of the Survey


| Group | House No. | City | Floor area (m2) | Family members | Energy source | Measured period | |||
|---|---|---|---|---|---|---|---|---|---|
| Heating | Cooling | Hot water | Cooking | ||||||
| Group 1 | 01 | Shanghai | 129.6 | 4 | Electricity | Electricity | Gas | Gas | 2006.12–2007.12 |
| 02 | Shanghai | 130.0 | 3 | Electricity | Electricity | District | Gas | 2006.12–2007.12 | |
| 03 | Changsha | 106.0 | 4 | Electricity | Electricity | Electricity | Gas | 2006.12–2007.12 | |
| 04 | Changsha | 103.0 | 3 | Electricity | Electricity | Gas | Gas | 2006.12–2007.12 | |
| 05 | Beijing | 80.5 | 3 | Gas | Electricity | Gas | Gas | 2008.1–2009.1 | |
| Group 2 | 06 | Beijing | 90.0 | 3 | District | Electricity | Gas | Gas | 2008.1–2009.1 |
| 07 | Dalian | 101.4 | 2 | District | No use | Solar | Gas | 2008.1–2009.1 | |
| 08 | Dalian | 89.0 | 4 | District | No use | Electricity | Gas | 2008.1–2009.1 | |
| 09 | Shenyang | 110.0 | 5 | District | No use | Electricity | Gas | 2008.2–2009.2 | |
| 10 | Shenyang | 100 | 3 | District | No use | Electricity | Gas | 2008.2–2009.2 | |
| 11 | Harbin | 180.5 | 3 | District | No use | District | Gas | 2007.1–2008.1 | |
| 12 | Harbin | 104.0 | 3 | District | No use | Electricity | Gas | 2007.1–2008.1 | |
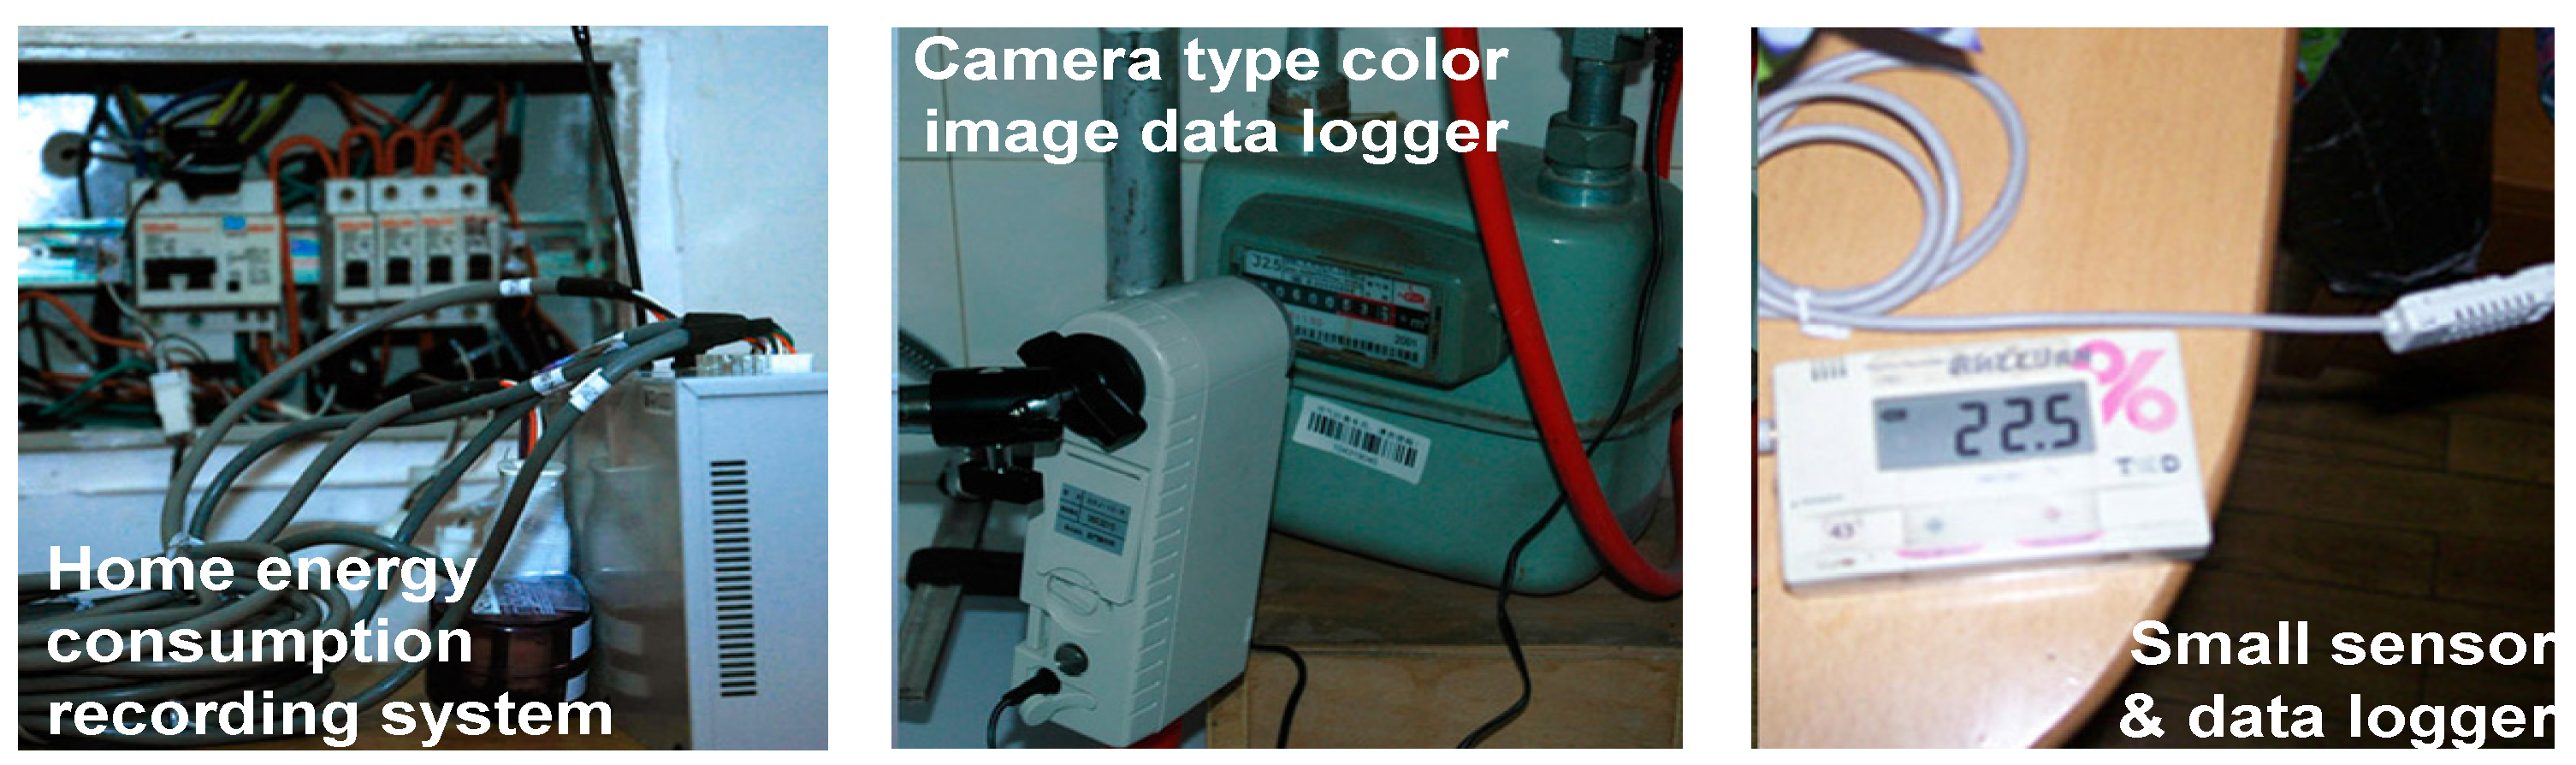
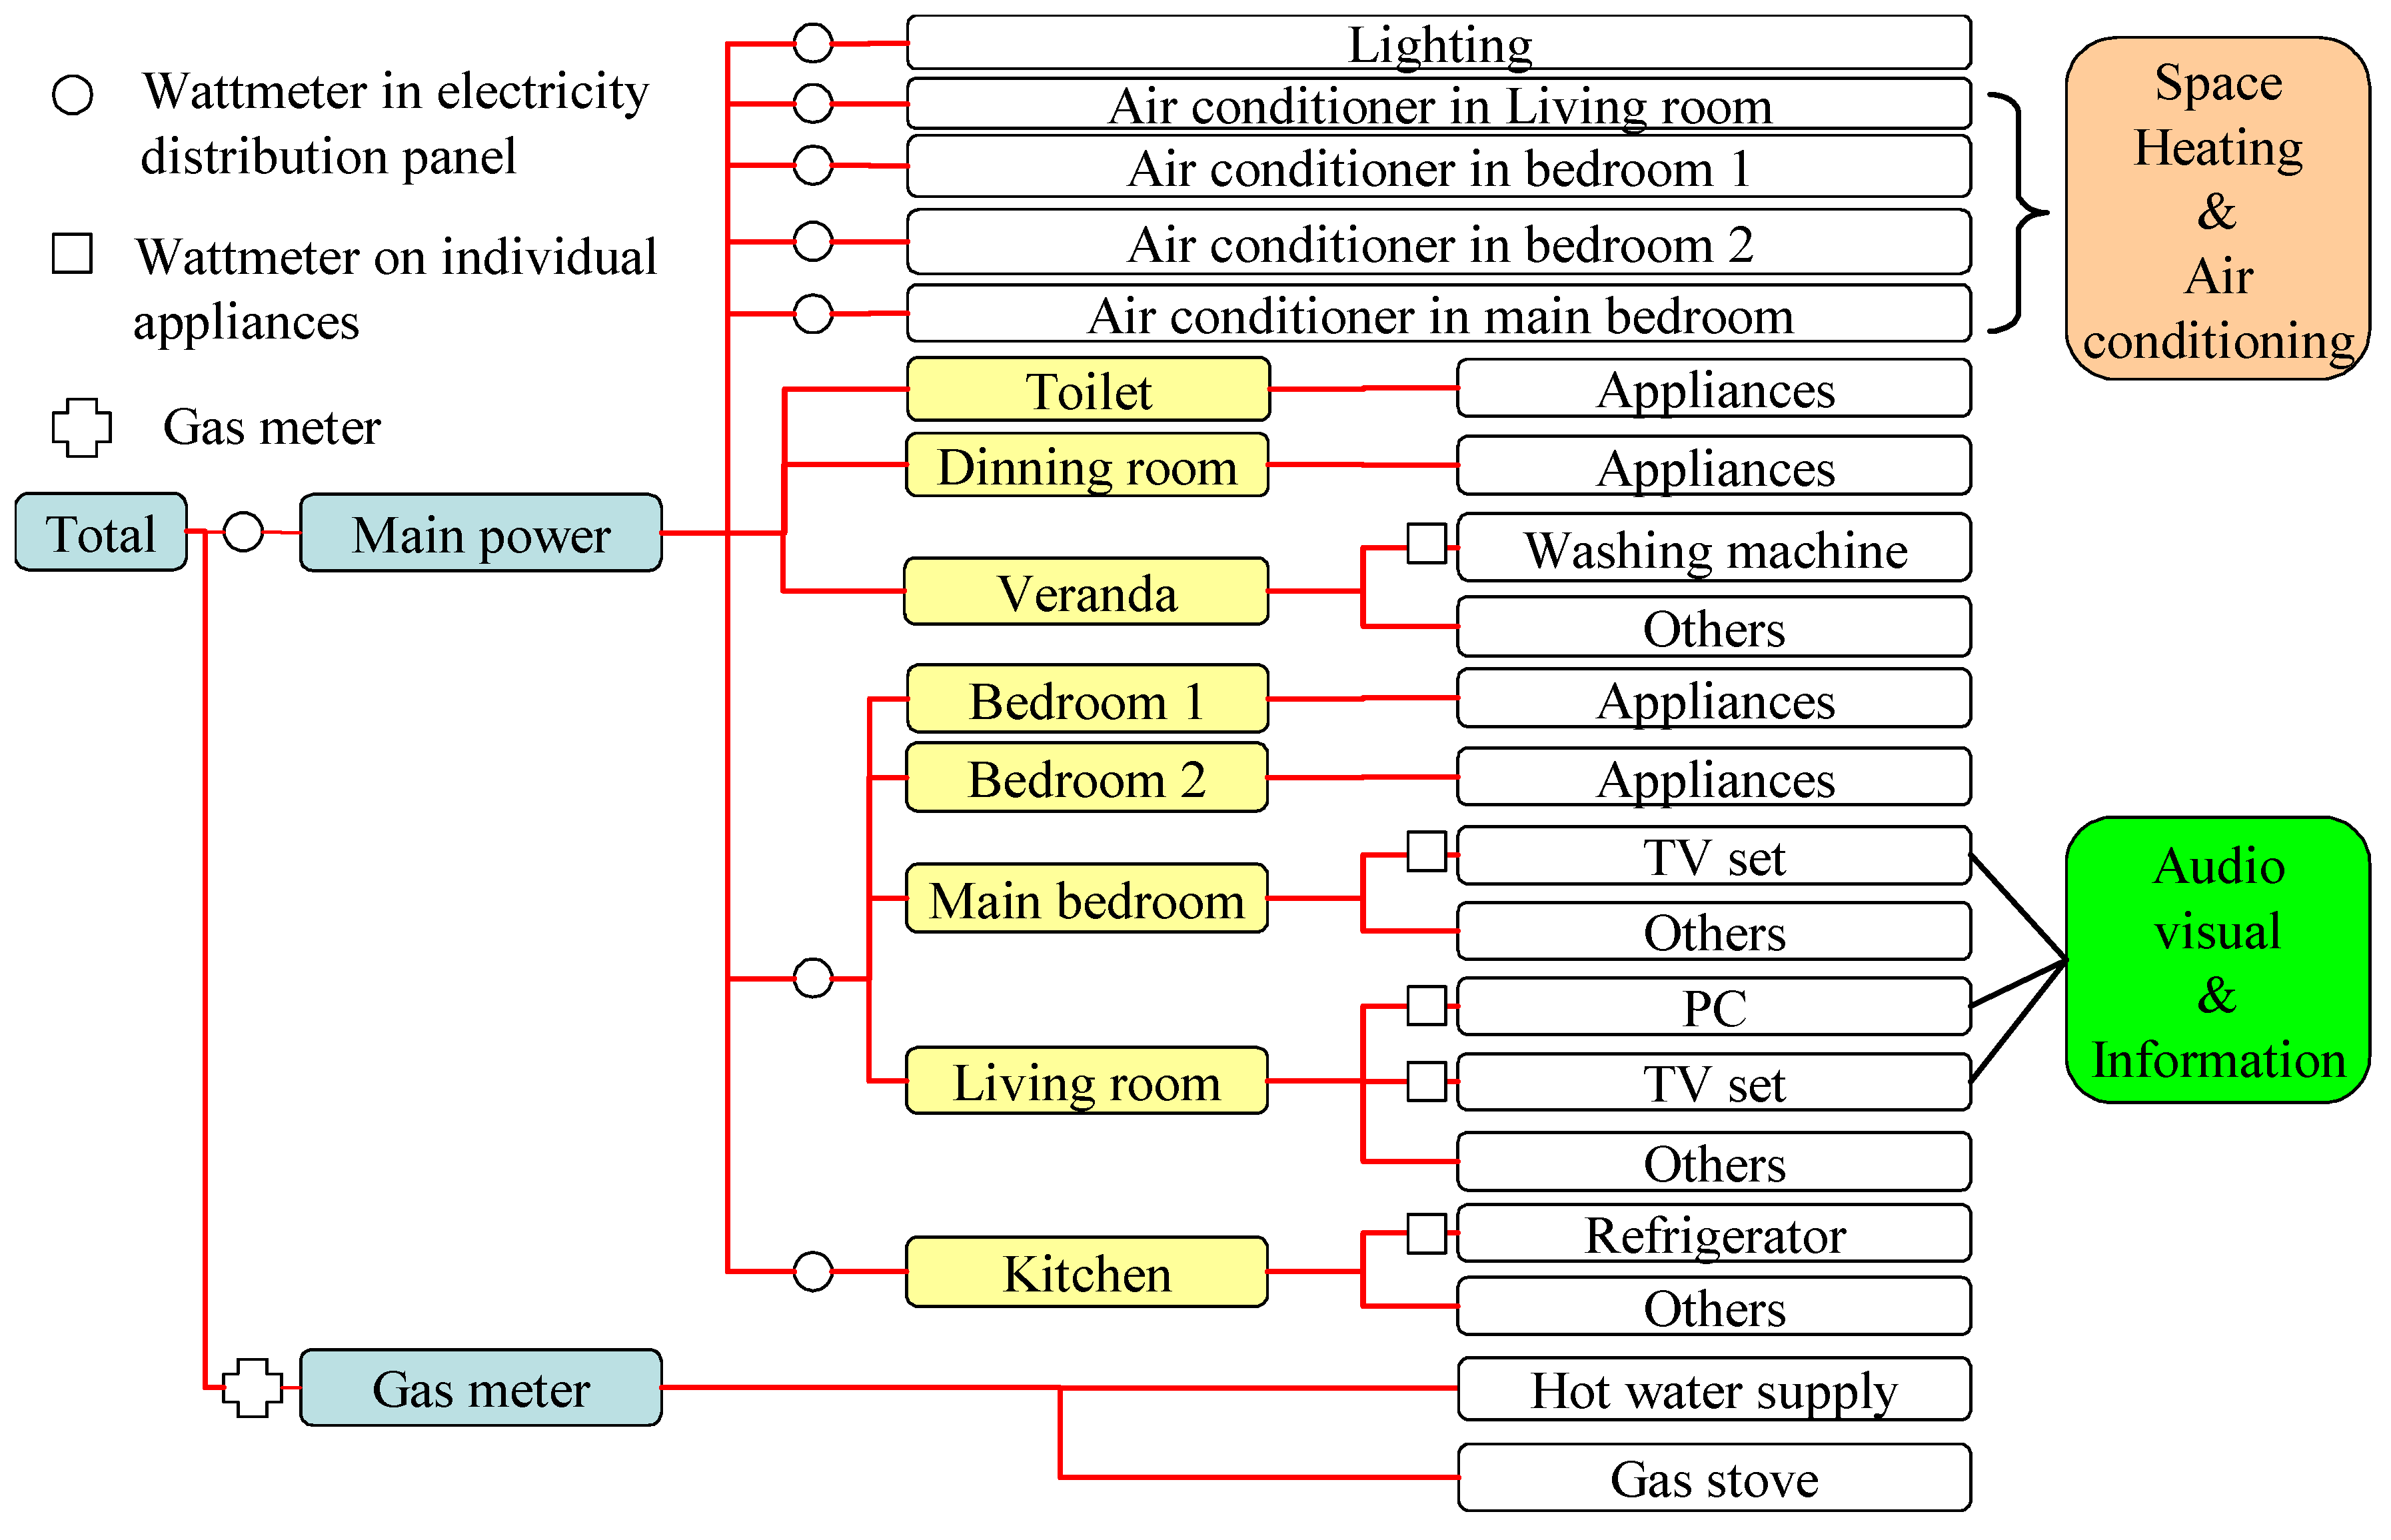
2.2. Method of Measurement
| Methods | Measurement | Time interval | Location |
|---|---|---|---|
| Home energy consumption recording system | Electricity consumption | 1 min | |
| Camera type color image data | Gas consumption | 5 min | Kitchen |
| Small sensor & data logger | Temperature & relative humidity | 30 min | Outdoors & Living room & Bedroom |

| Energy source | City | Calorific values of units |
|---|---|---|
| Electricity | All | 3.6 MJ/kWh |
| Gas | Shanghai | 14.5 MJ/m3 |
| Changsha | 36.0 MJ/m3 | |
| Harbin | 16.8 MJ/m3 | |
| Beijing | 38.6 MJ/m3 | |
| Dalian | 16.2 MJ/m3 | |
| Shenyang | 27.3 MJ/m3 |
3. Results and Discussion
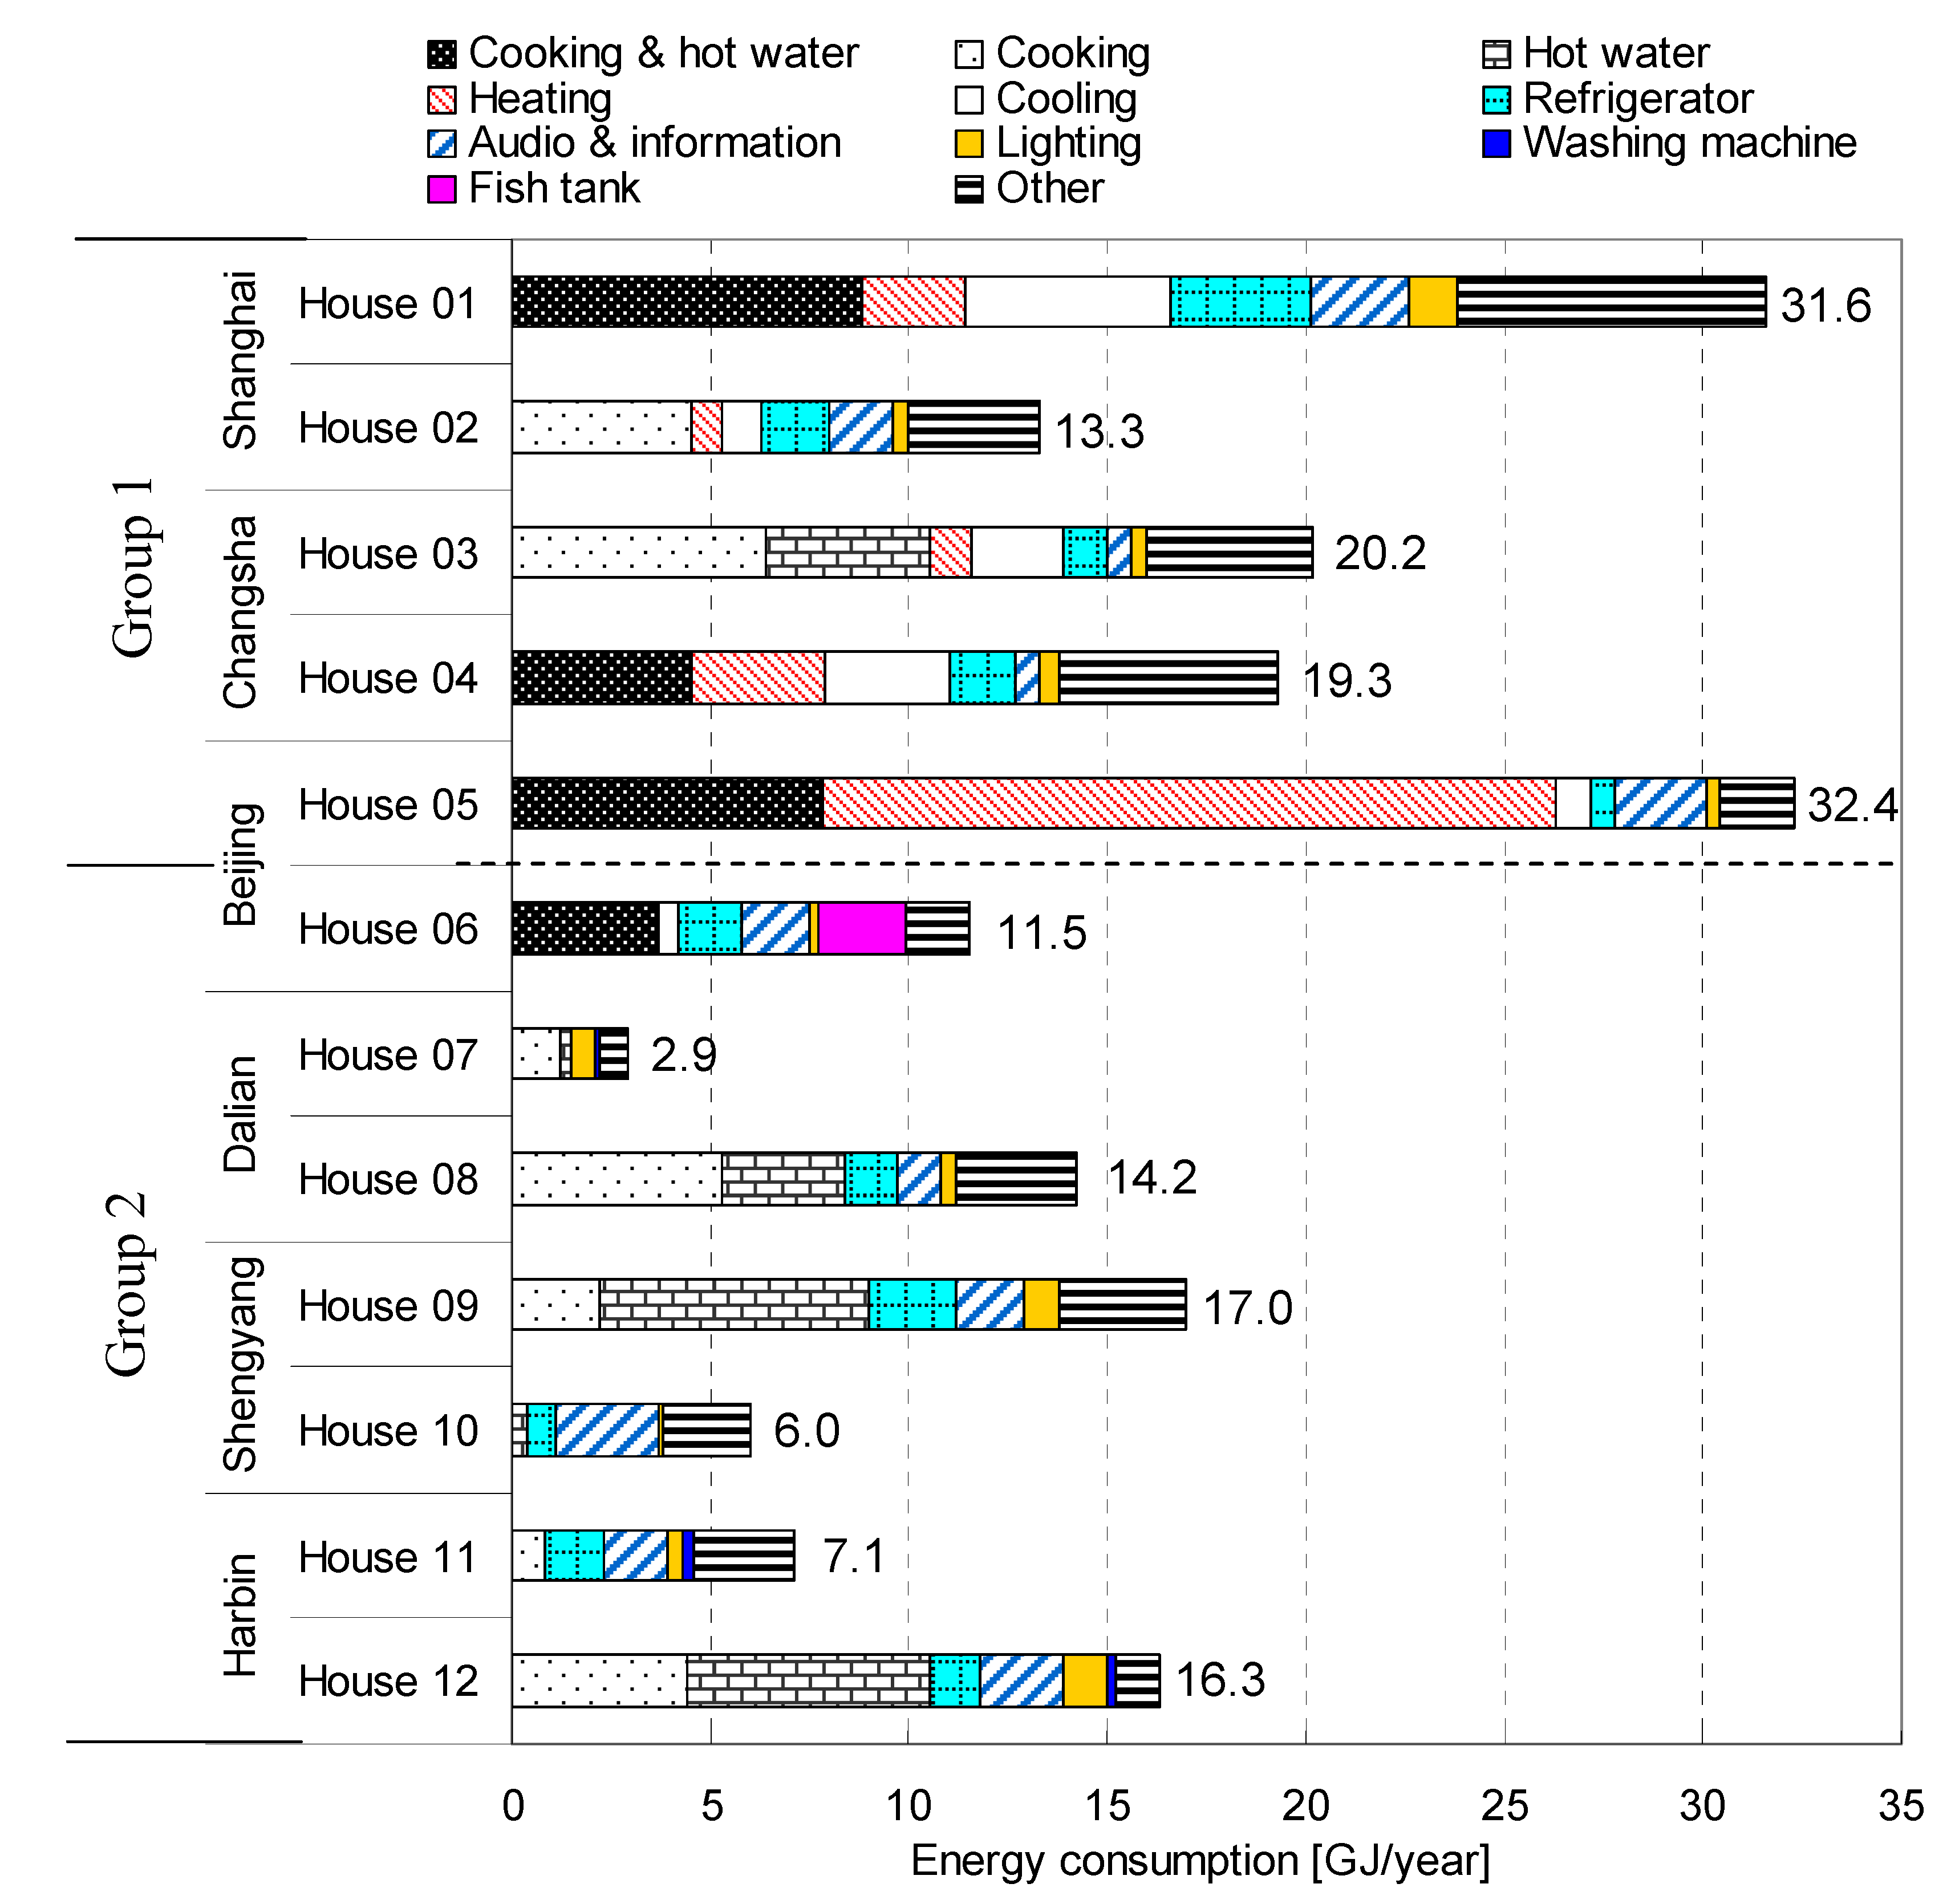
3.1. Annual Energy Consumption

3.2. Daily Year-Round Energy Consumption and Temperature
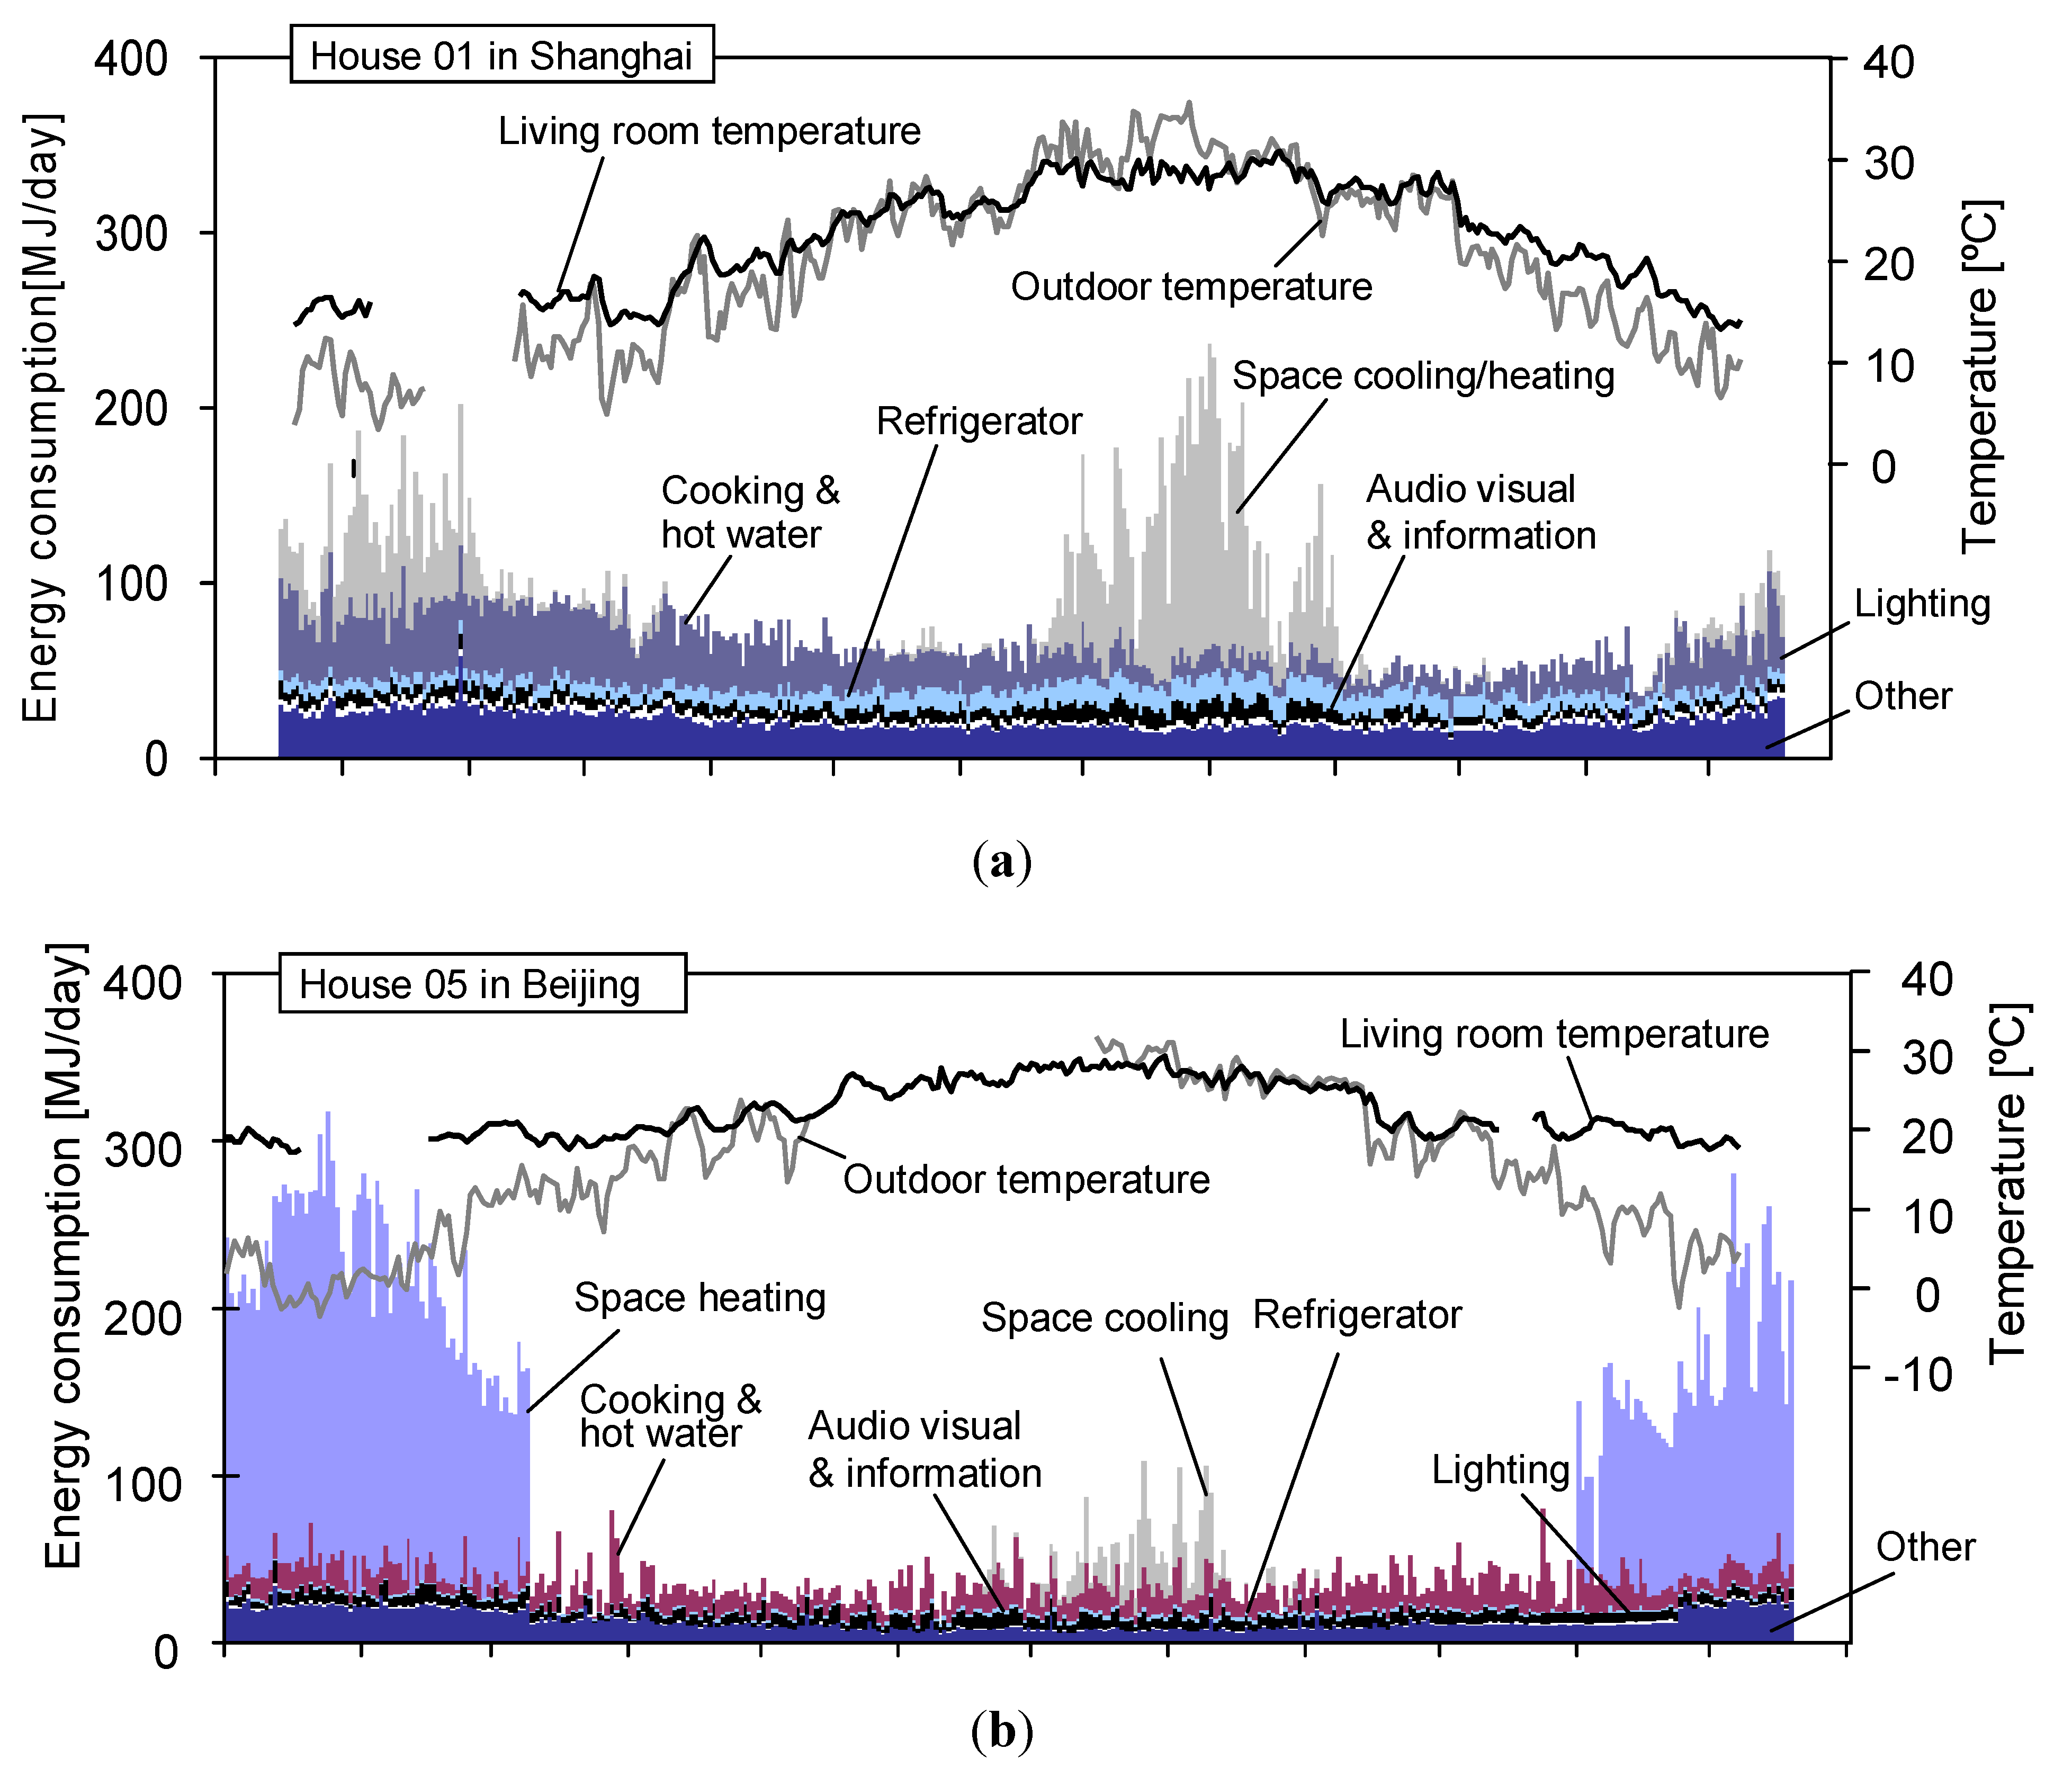
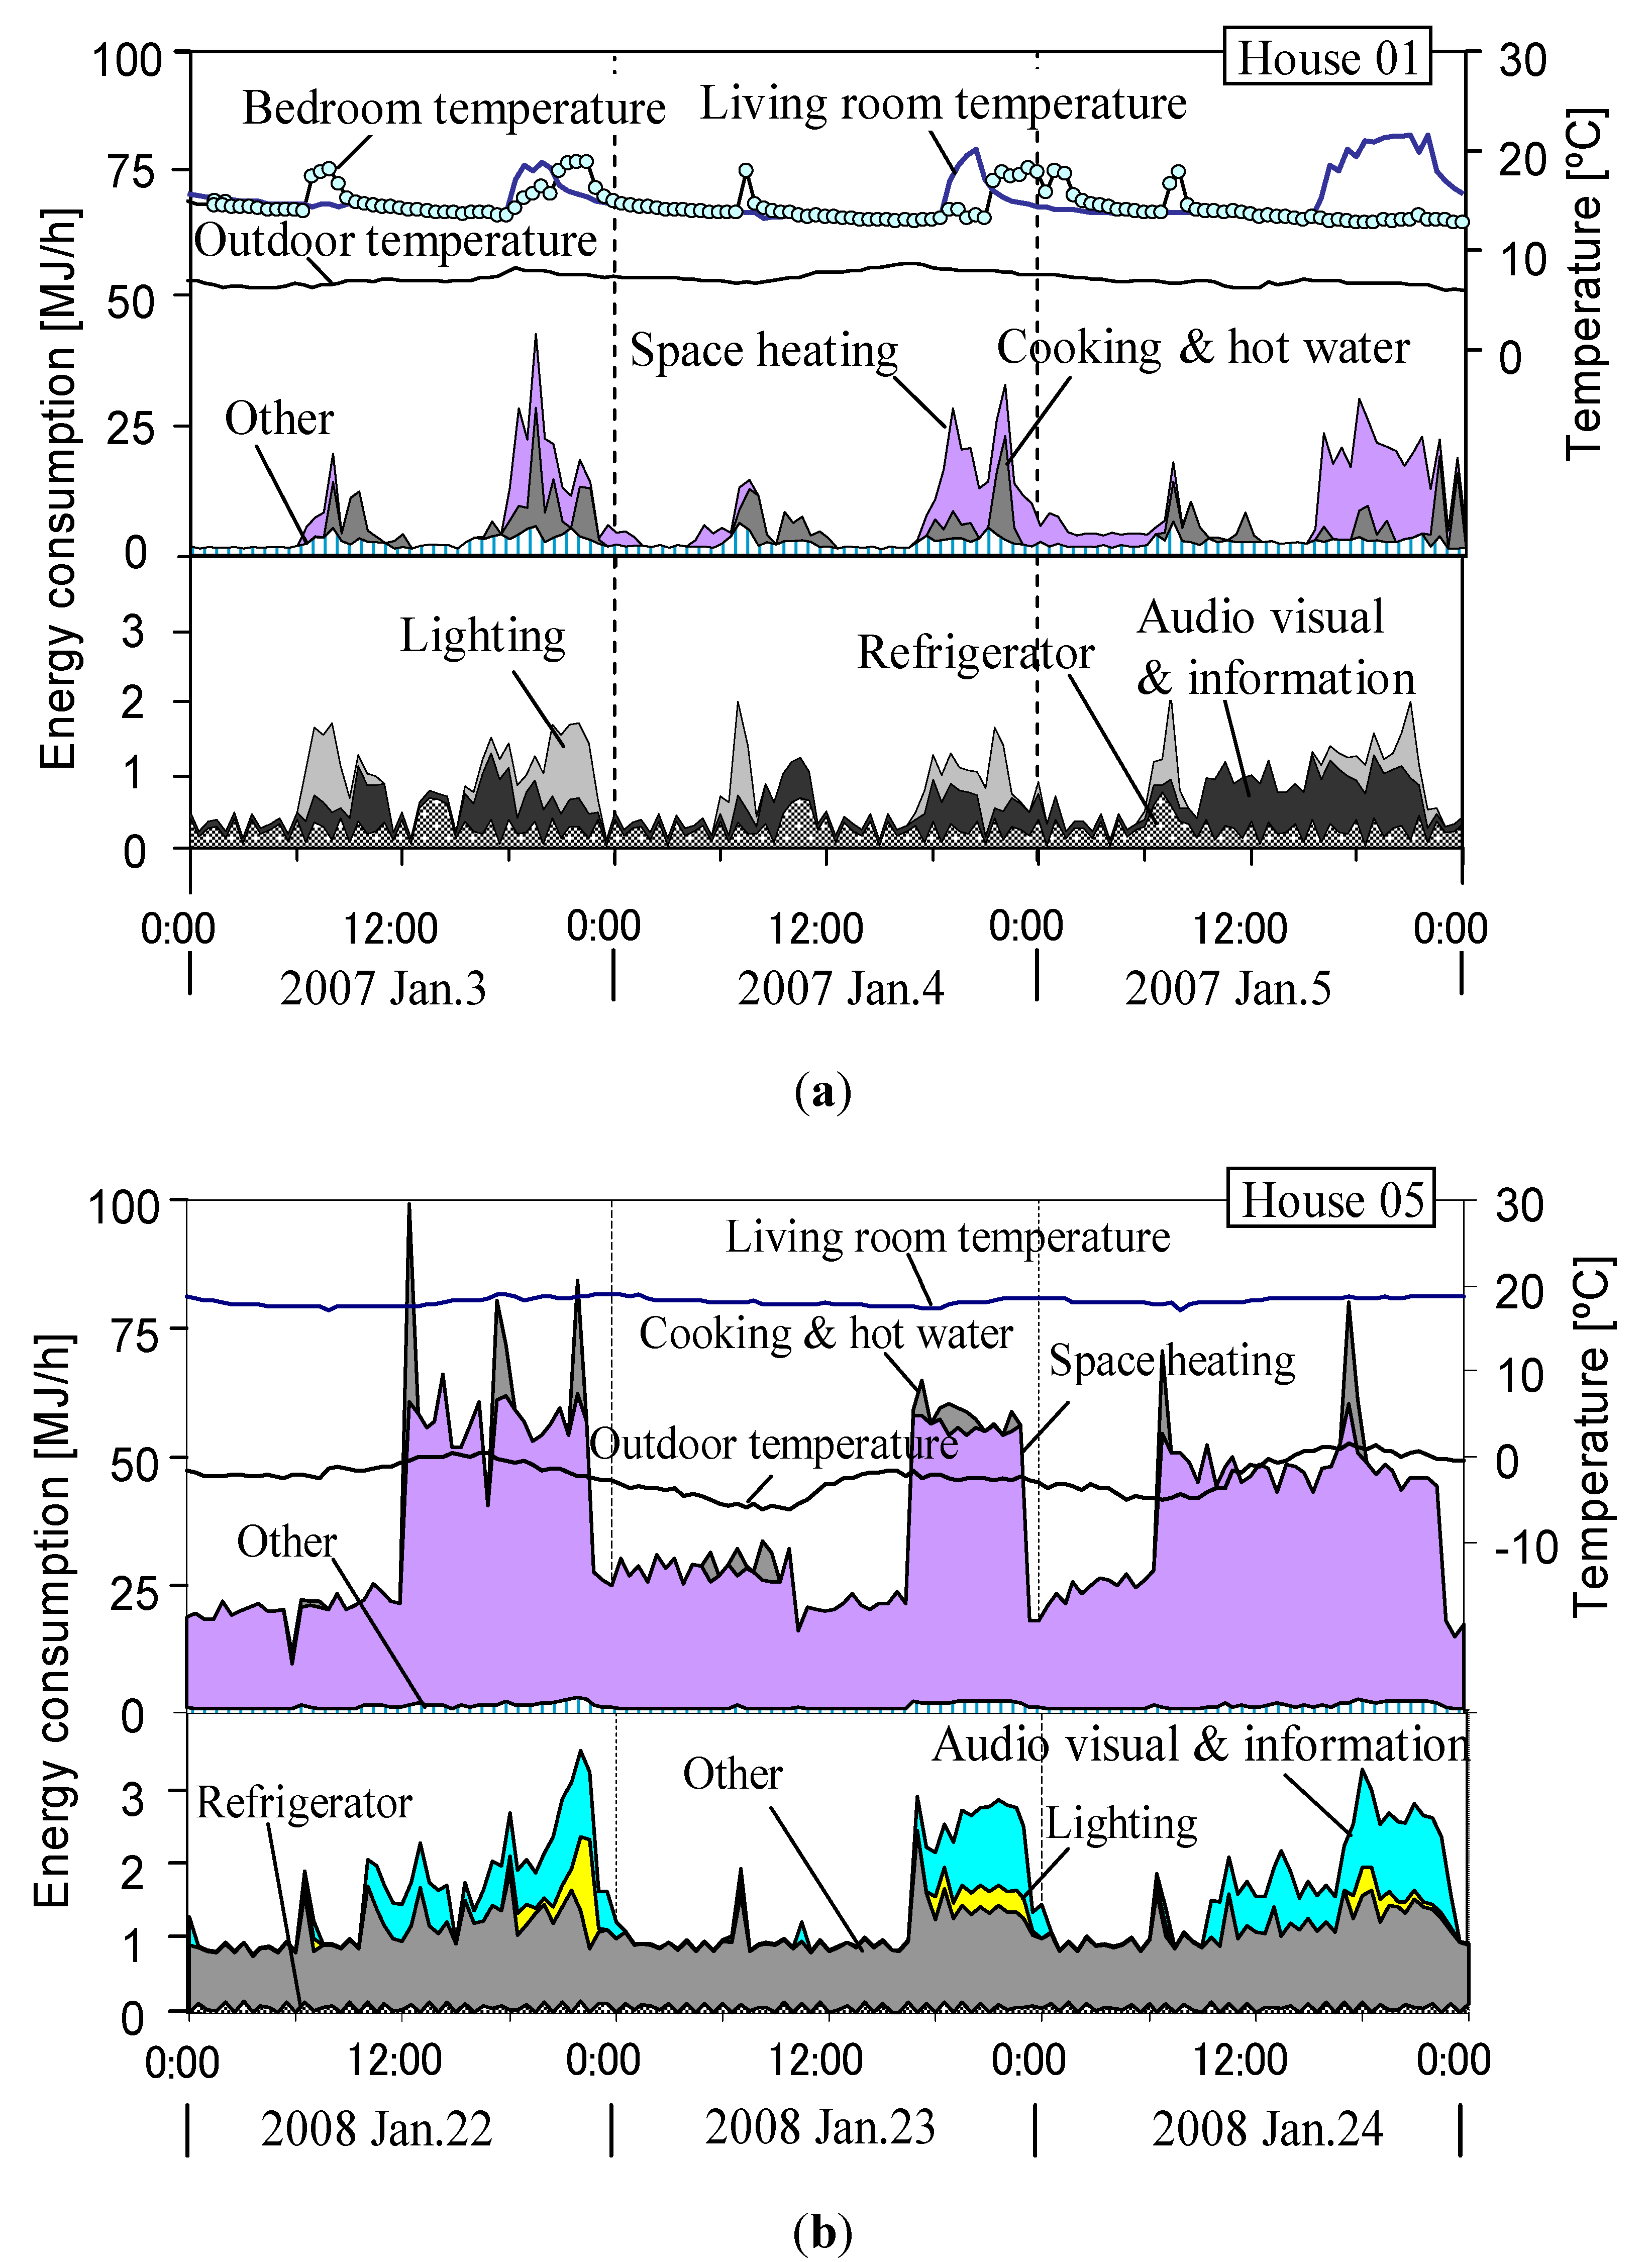
3.2.1. House 01
3.2.2. House 05
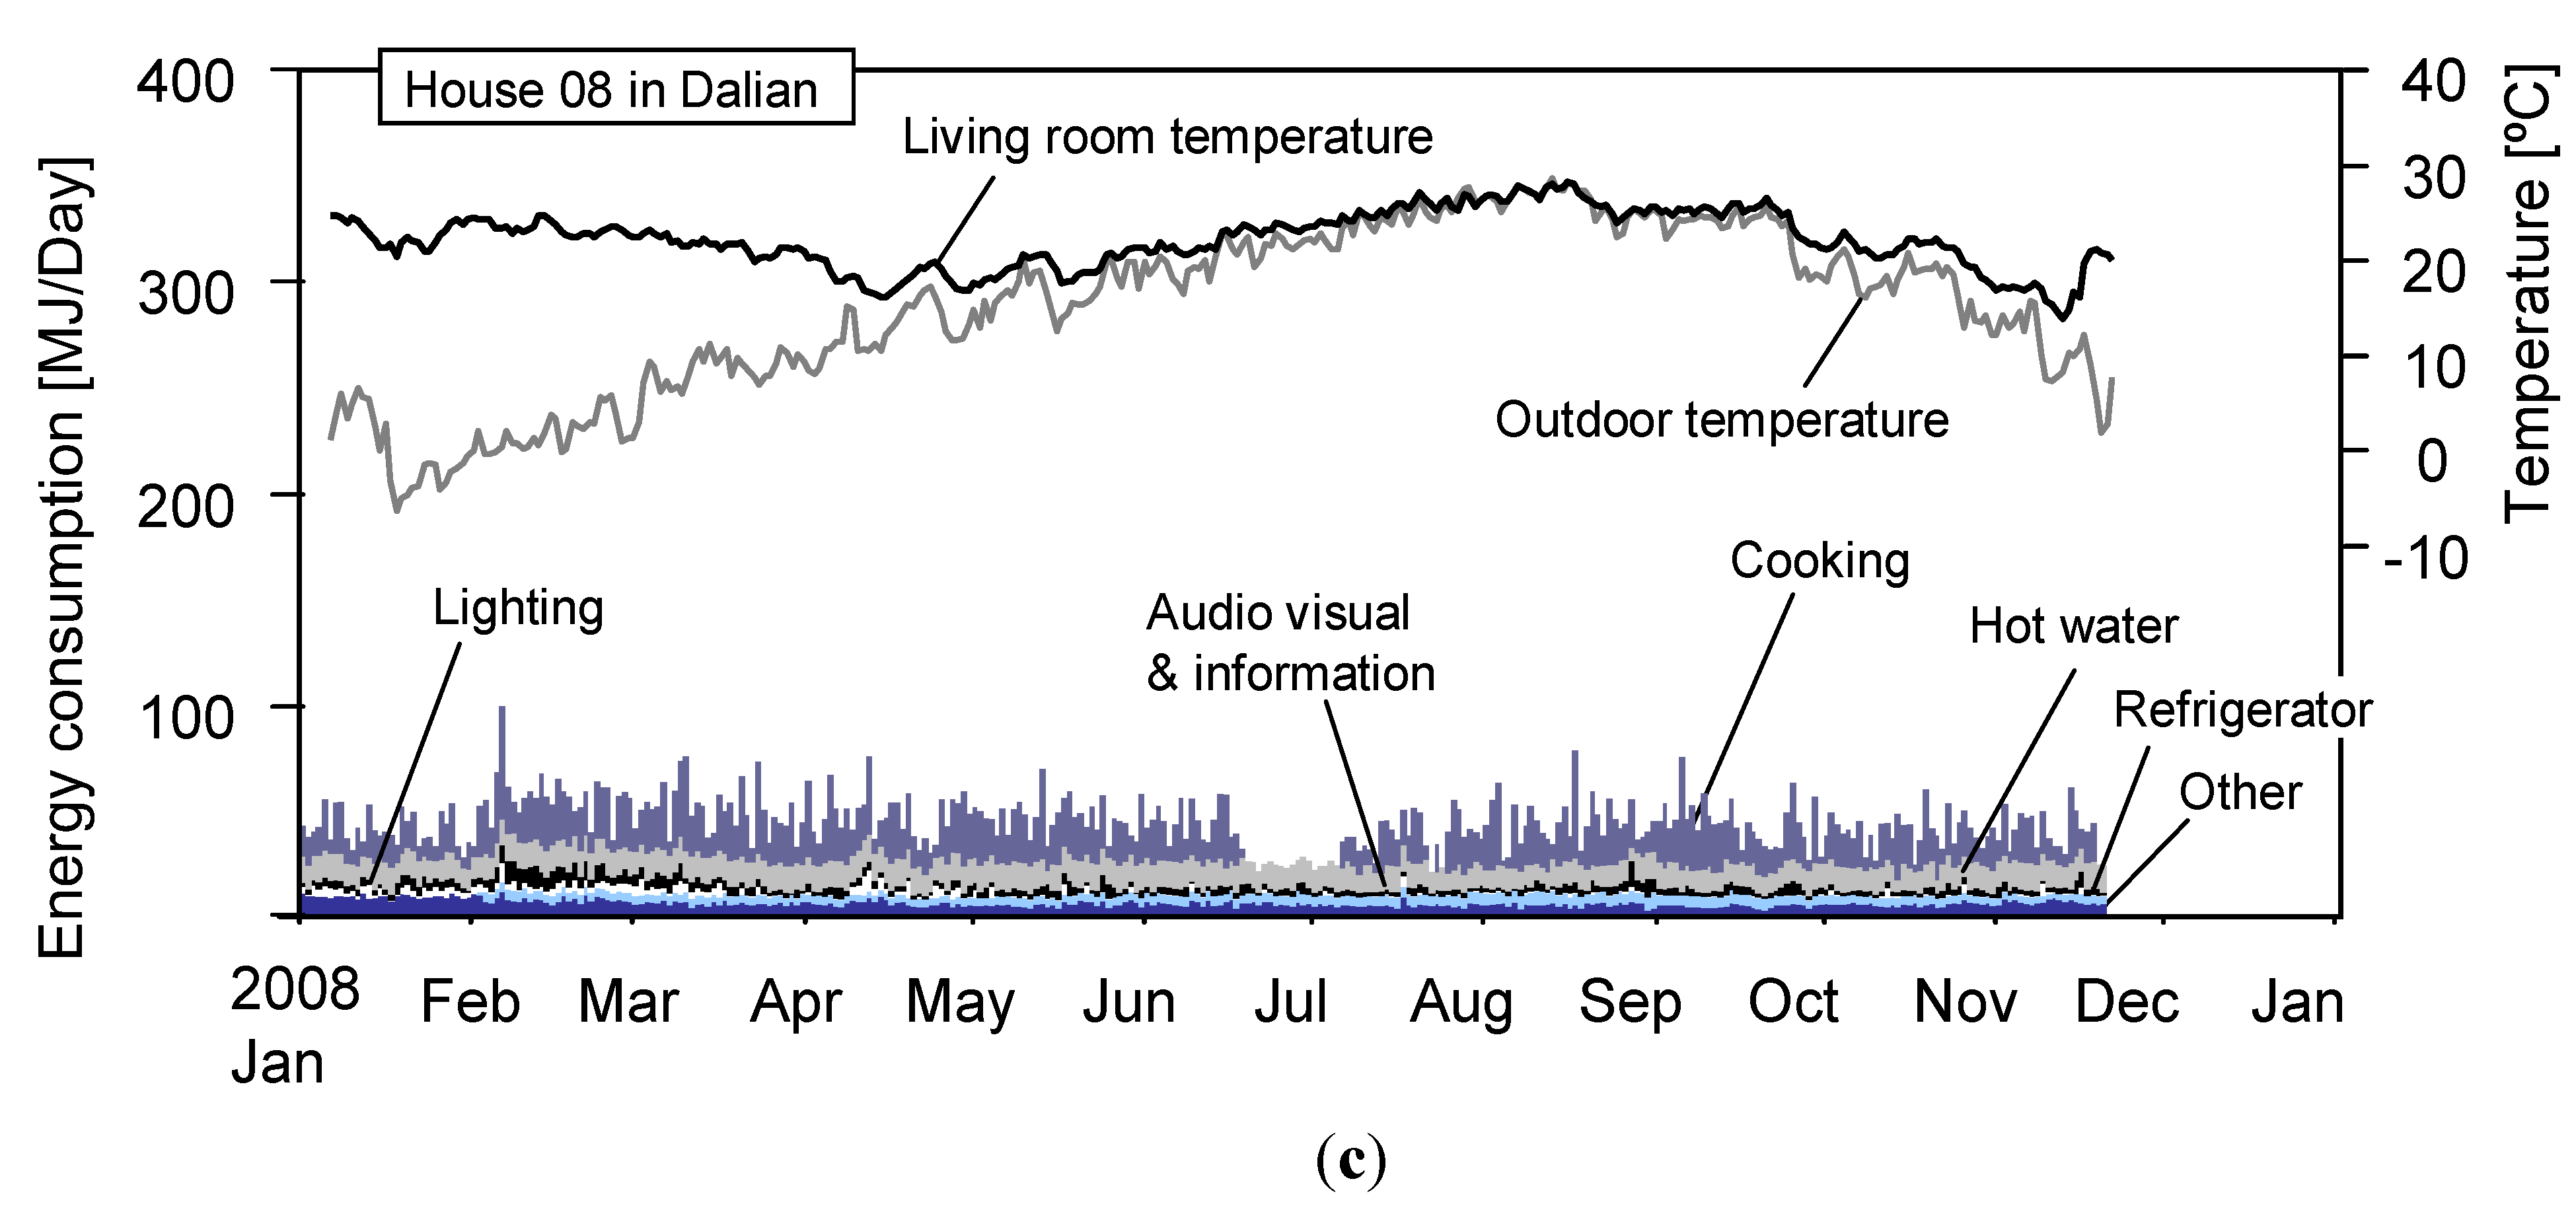
3.2.3. House 08
3.3. Energy Use in the Coldest Month, Hottest Month and the Month of Mild Season
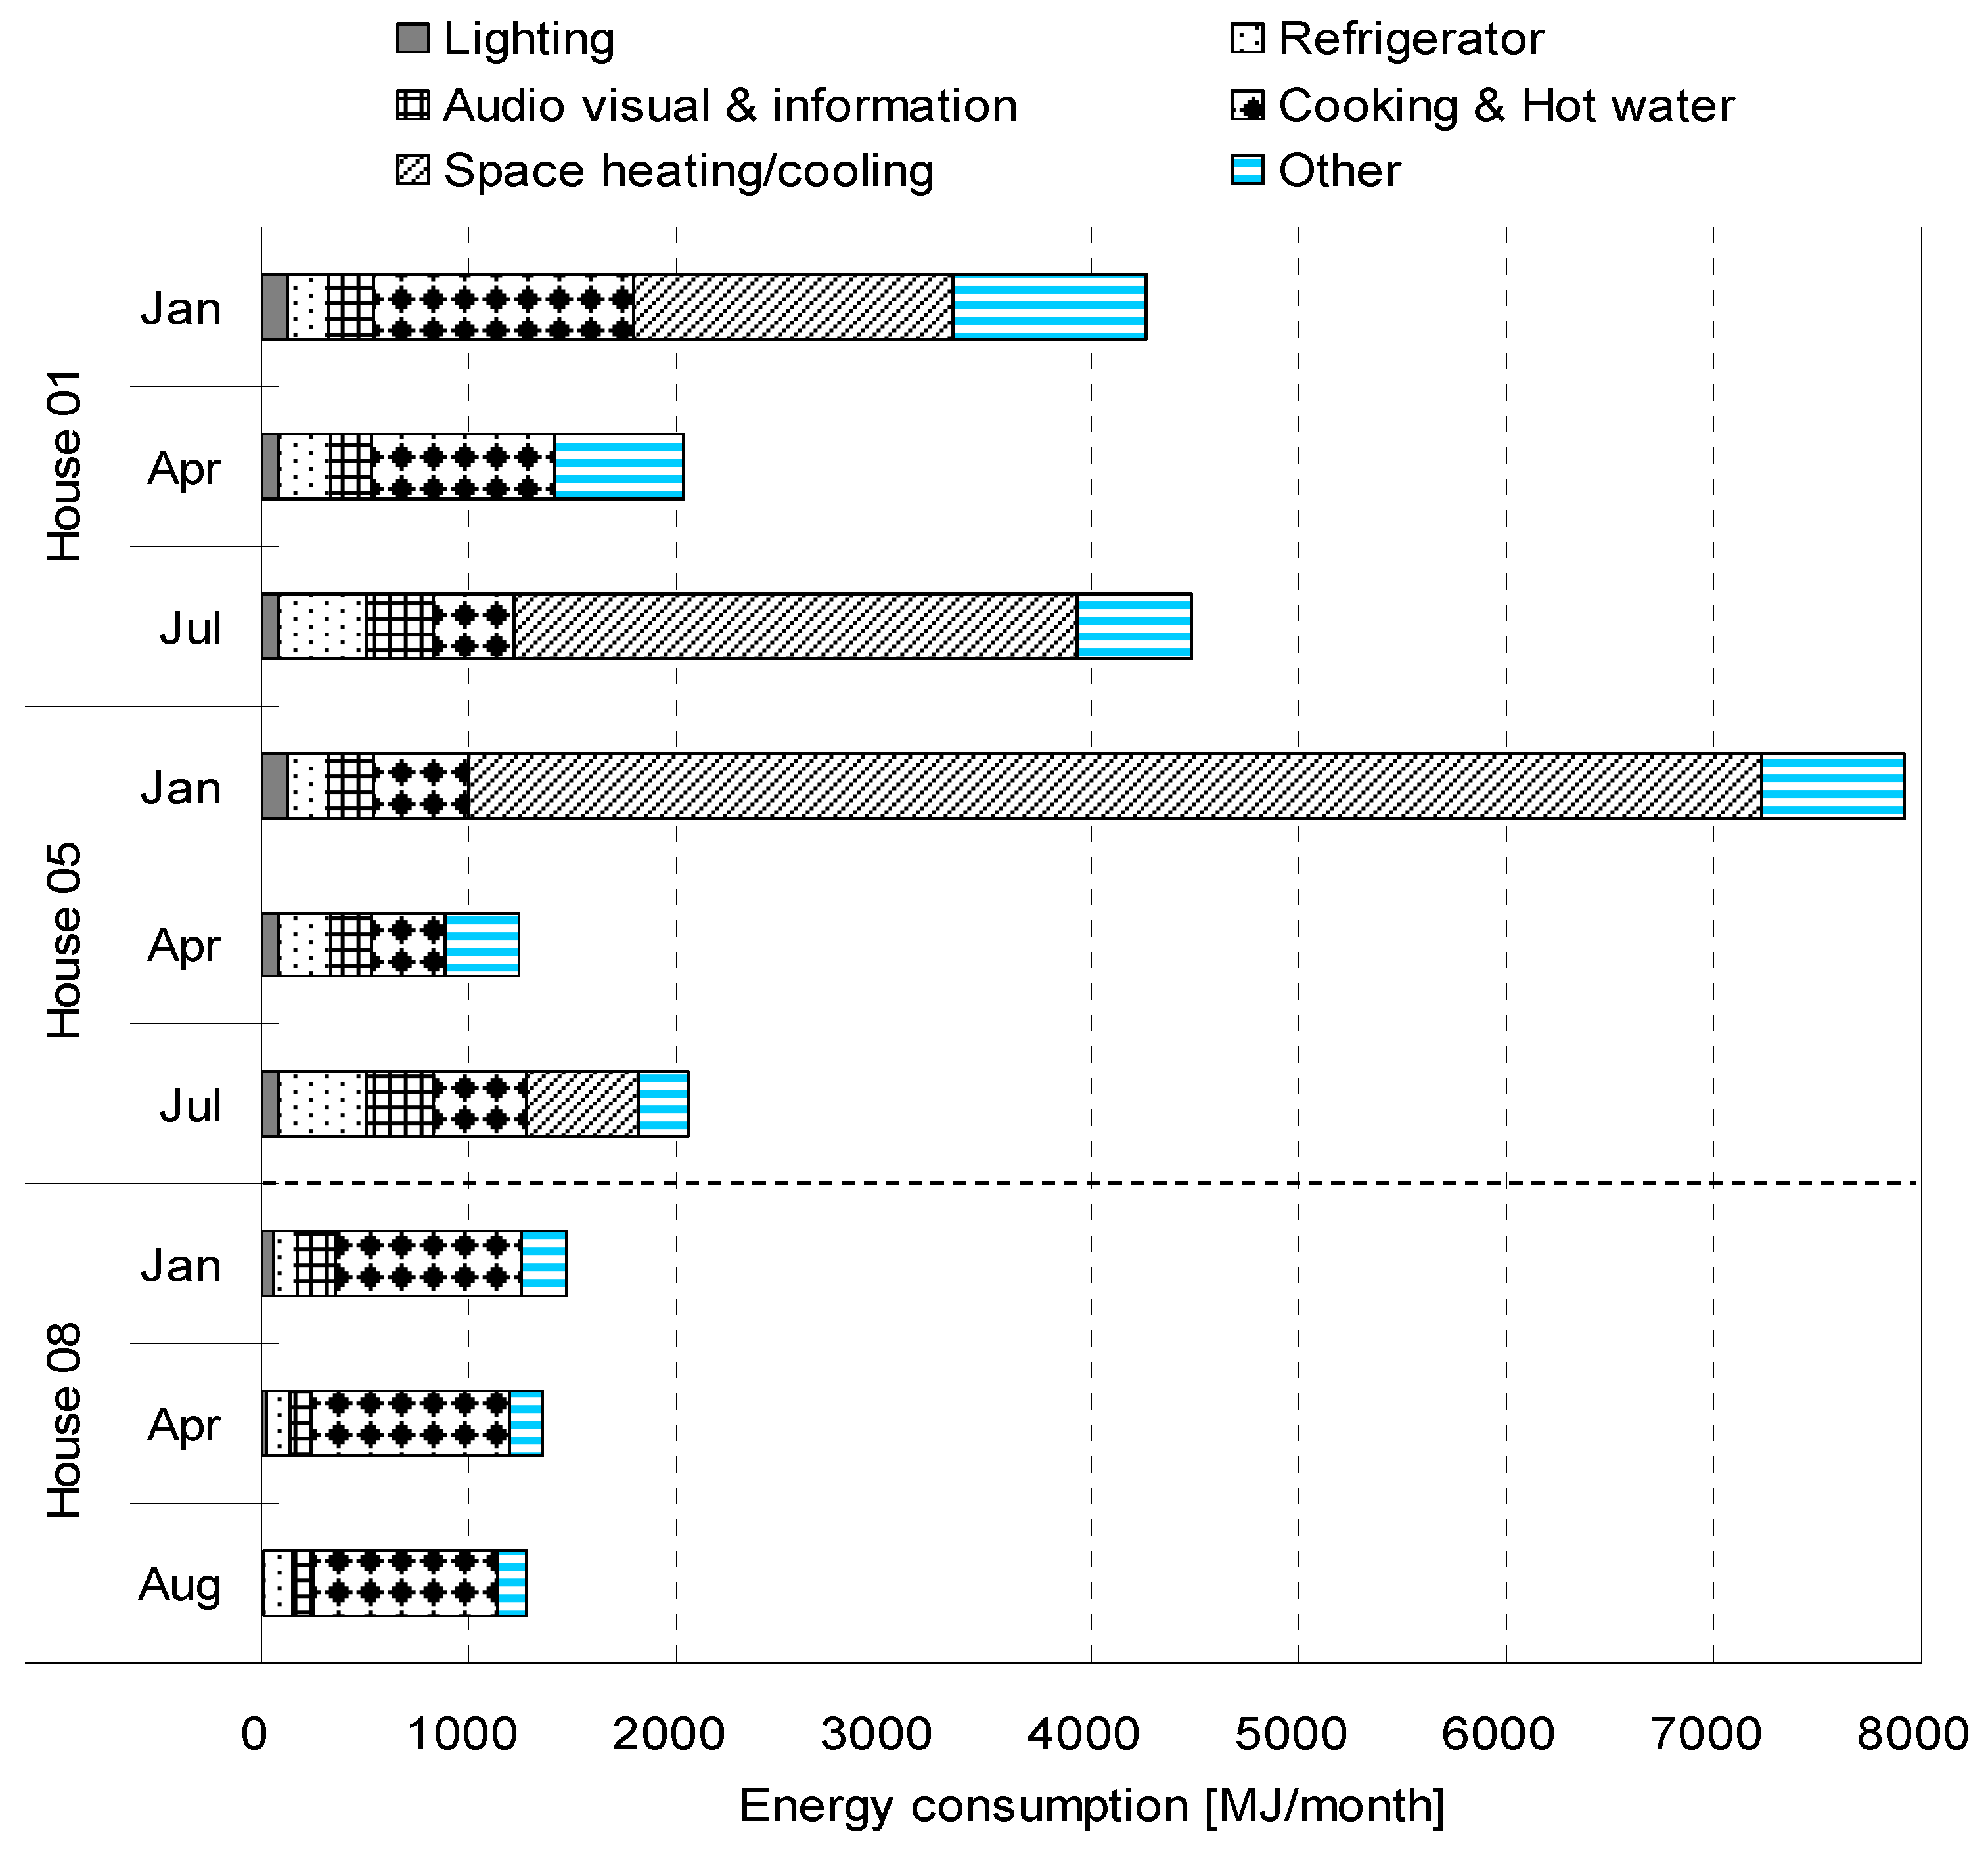
3.3.1. House 01
3.3.2. House 05
3.3.3. House 08
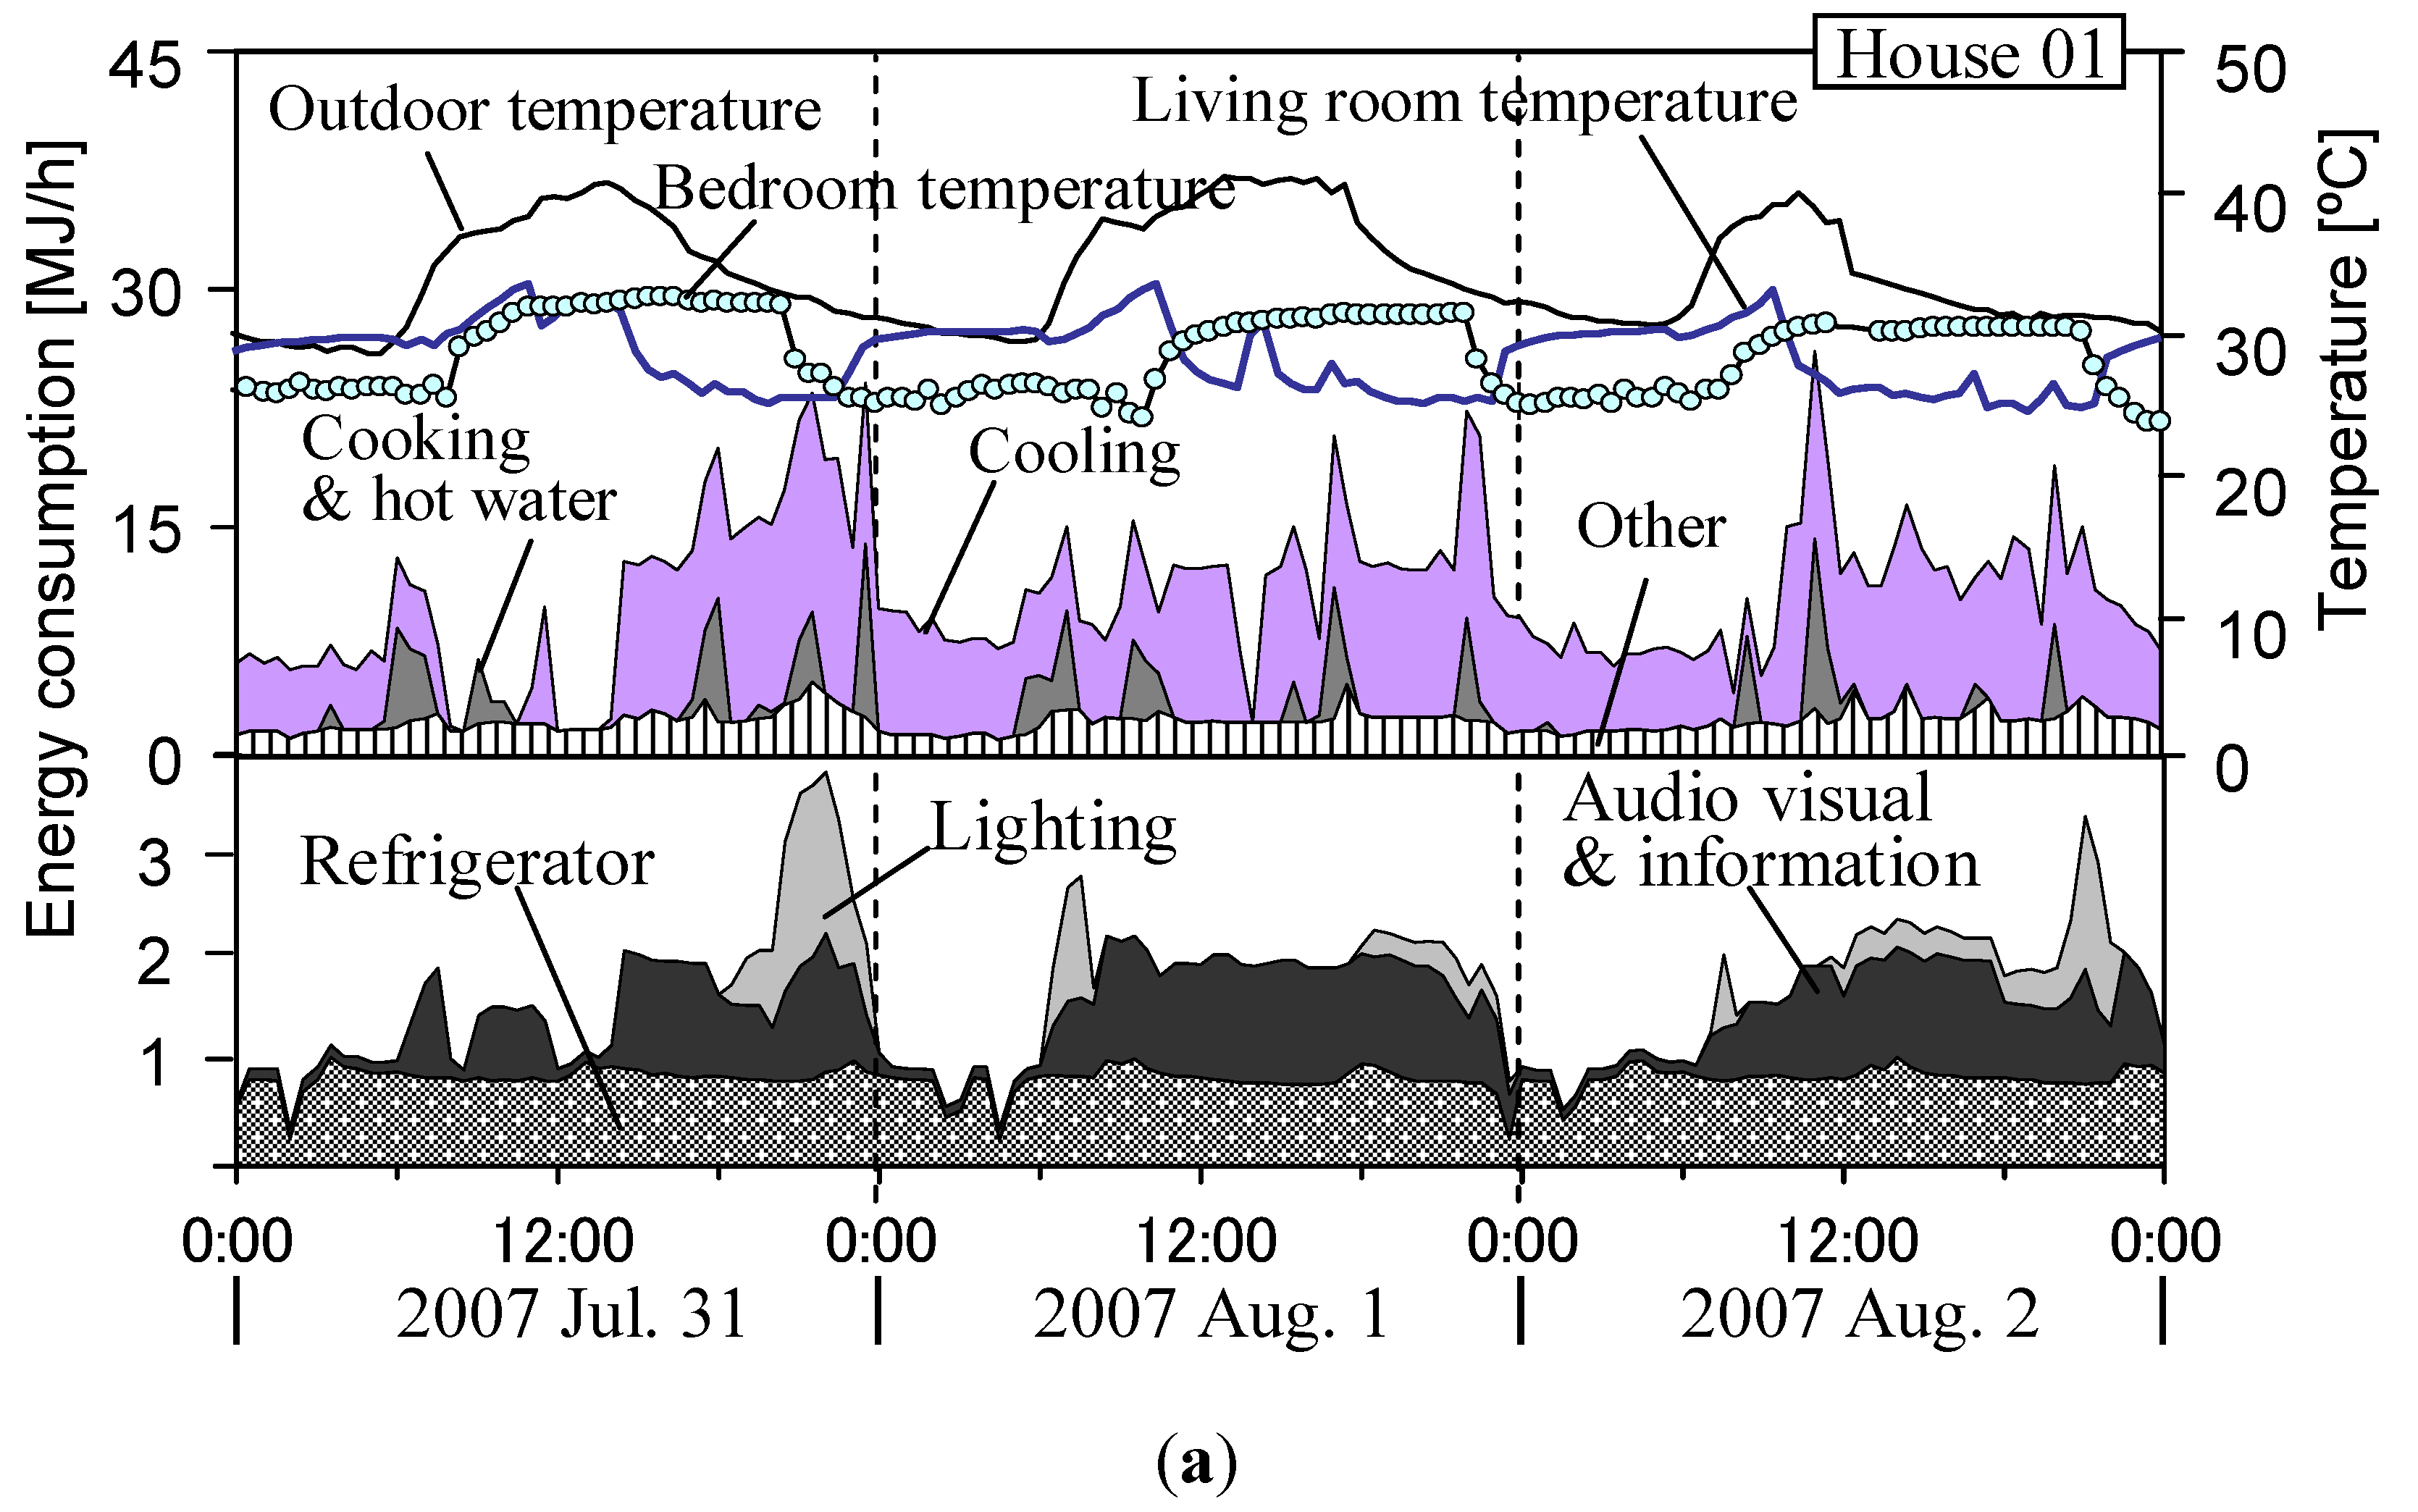
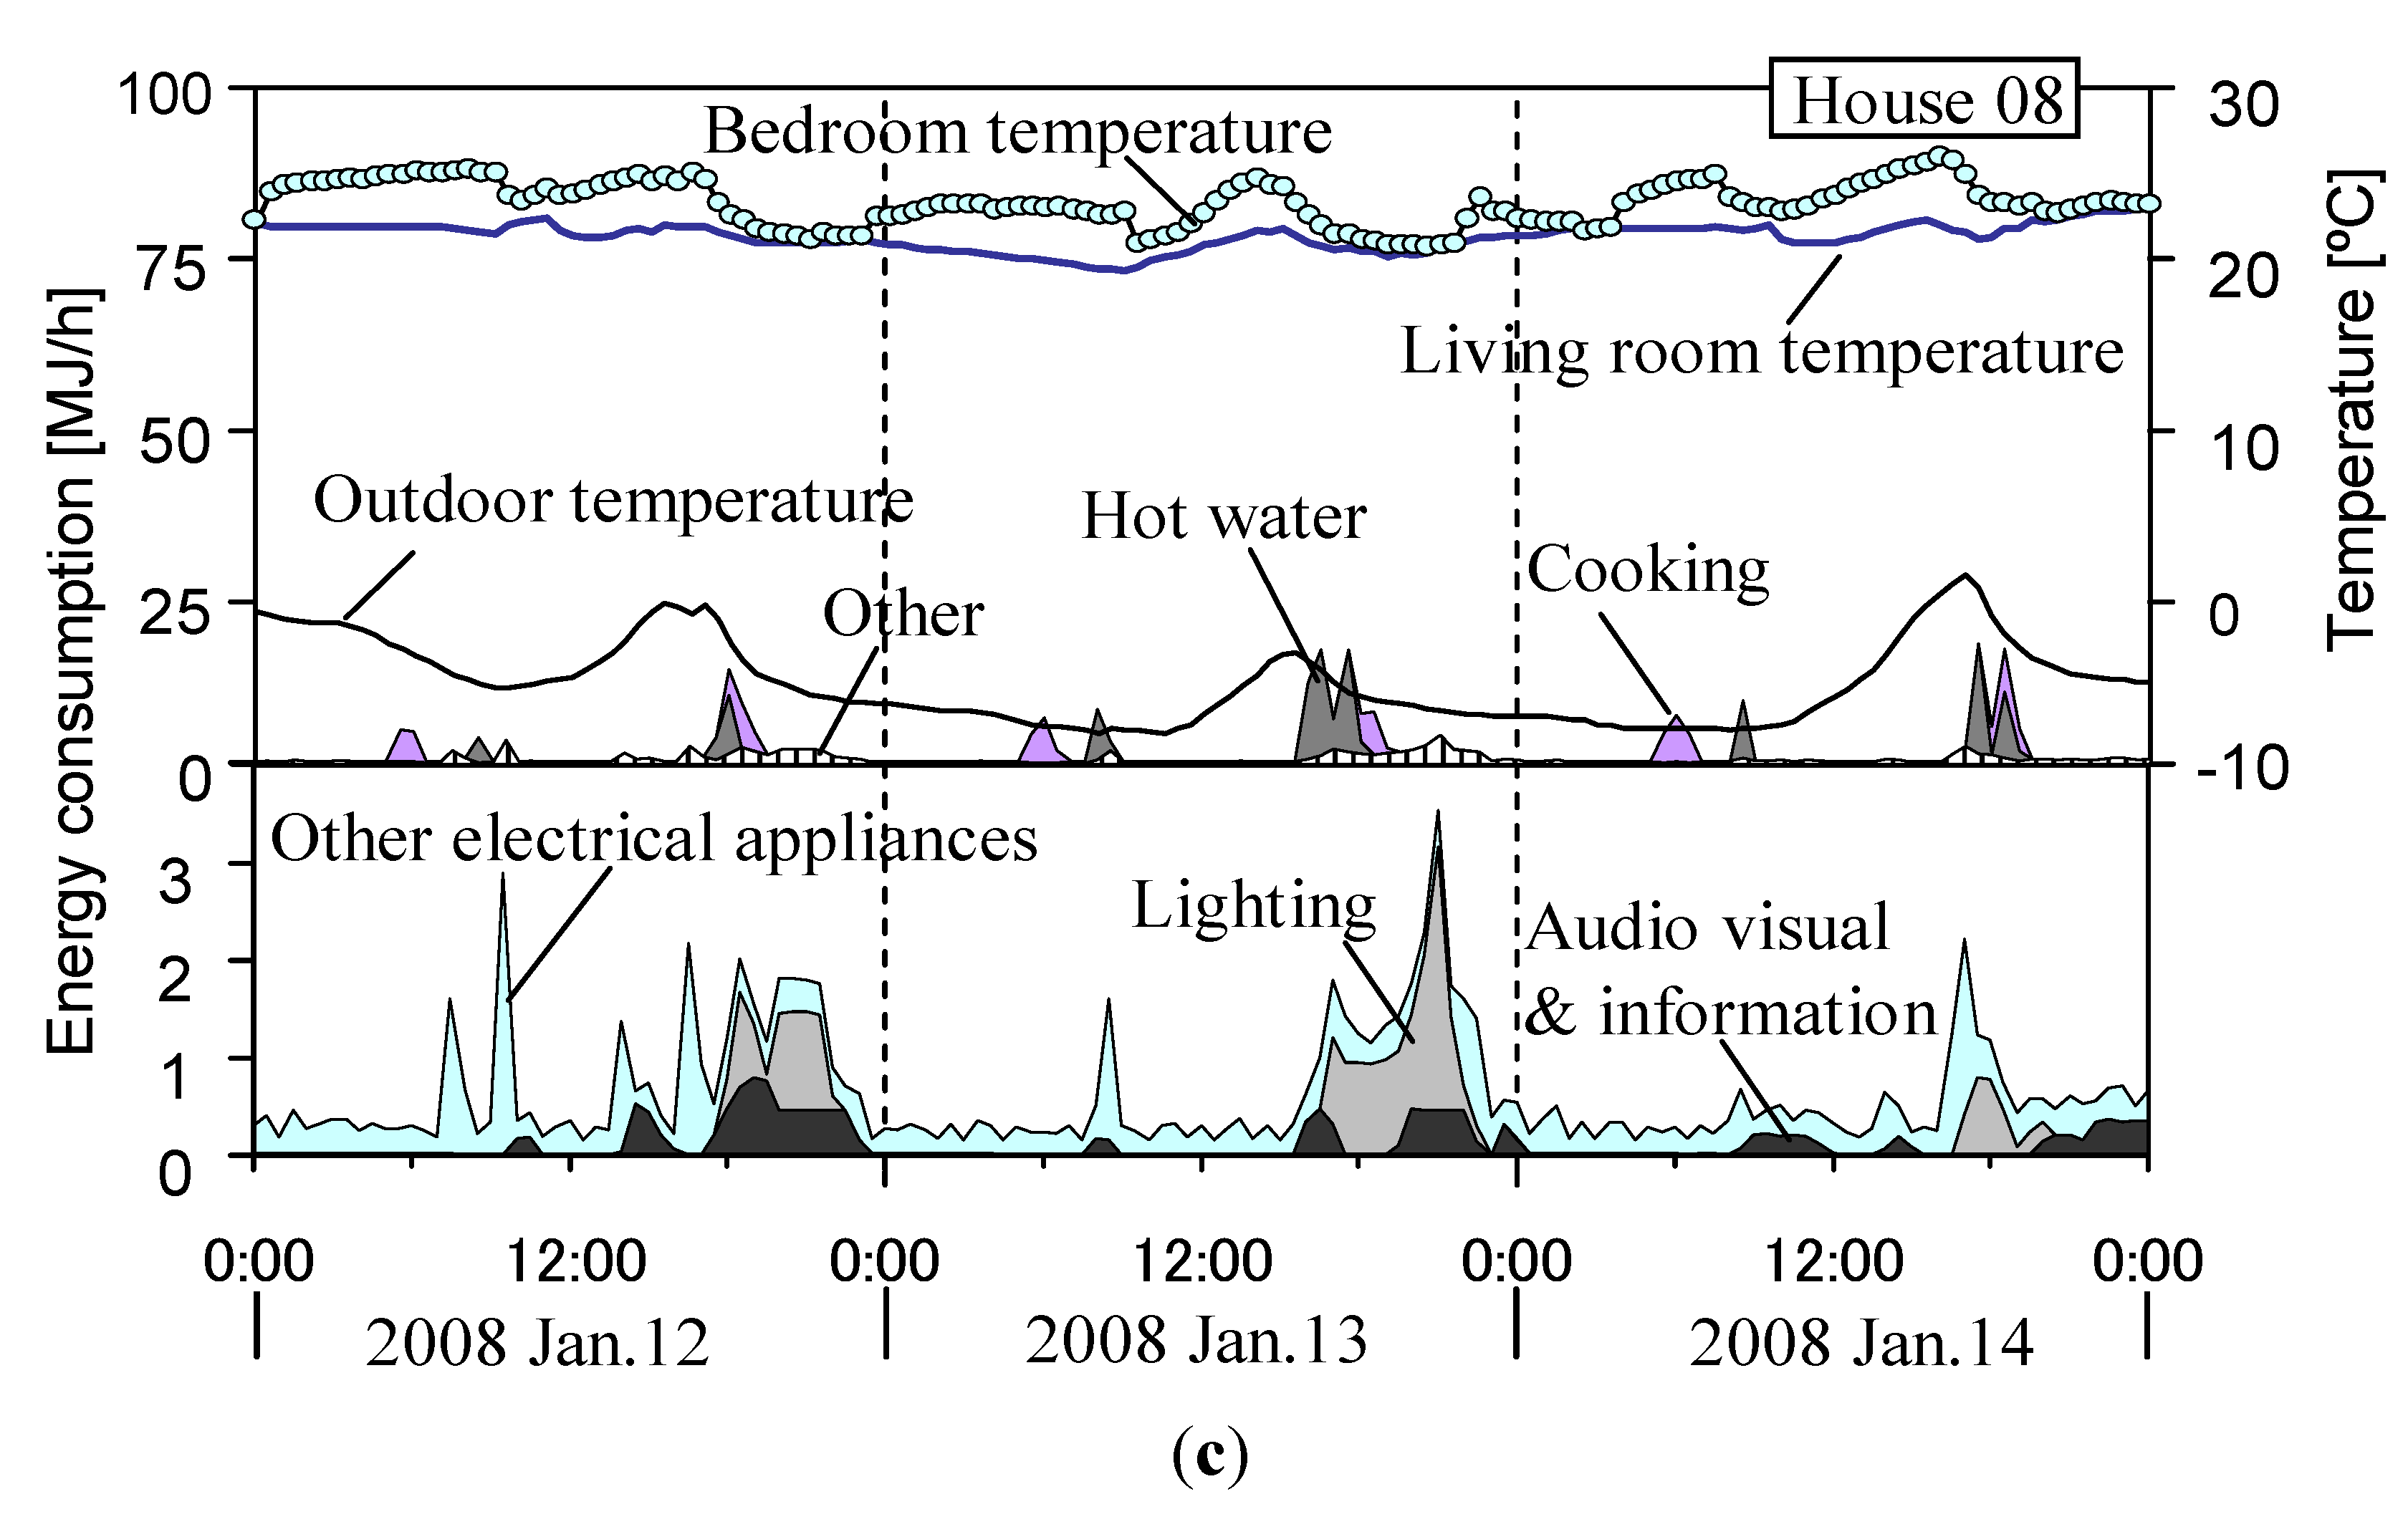
3.4. Energy Consumption and Thermal Environment in Typical Days
3.4.1. Energy Use and Temperature in the Coldest Day

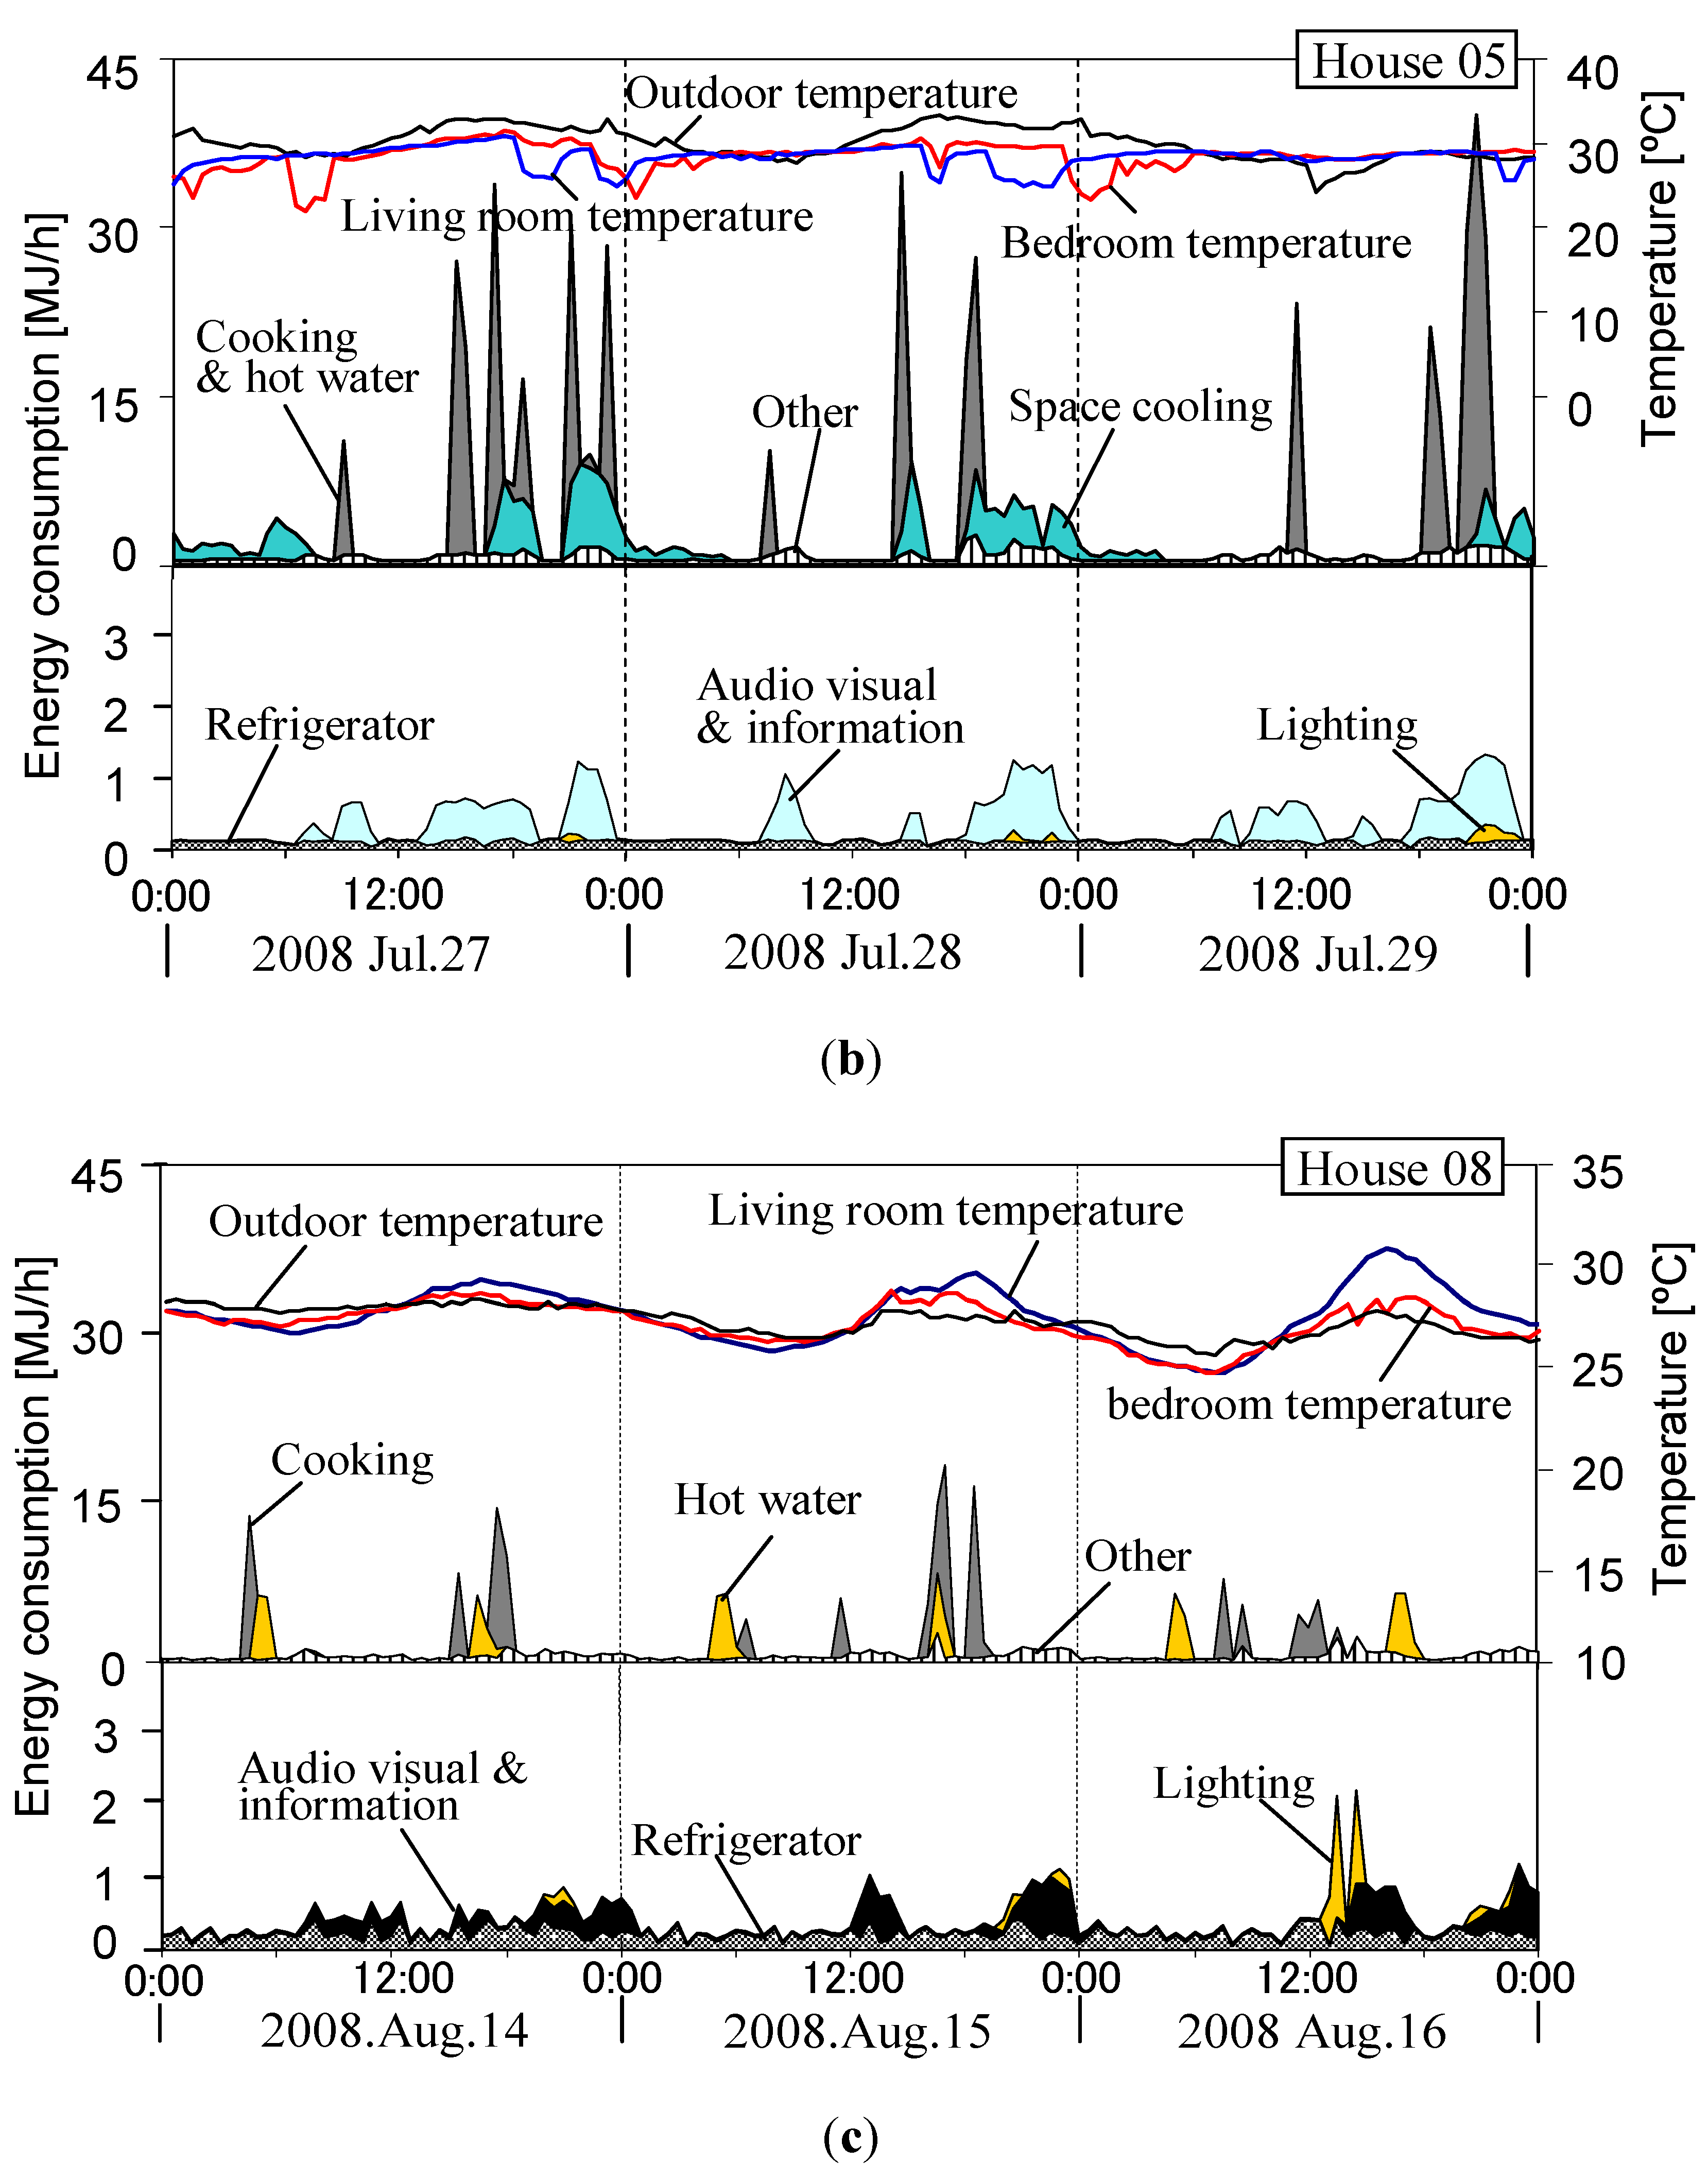
3.4.2. Energy Consumption and Temperature in the Hottest Day

3.5. Discussion
4. Conclusions
- (1)
- Detailed information of energy use and indoor environment in twelve houses are obtained. There is a big difference of energy use between houses due to different kind of housing equipment used and different occupant behavior of energy use.
- (2)
- Energy use of houses in Group 1 increased in winter and summer. This is attributed to the use of heating in winter and cooling in summer. House 05 in Beijing used 32.4 GJ in a year (the largest in Group 1), in which the heating reached 18.5 GJ, accounting for 57% of the total consumption.
- (3)
- In Group 2, energy use for district heating can not be measured. House 09 consumed 17.0 GJ, which is the largest in Group 2. It was estimated that the total energy use (including energy used for district heating) will be 104.5 GJ.
- (4)
- There are no significant changes of Lighting, Audio visual & information, and other energy use among the four seasons.
- (5)
- A big difference of average indoor temperature was found in the coldest days between Group 1 and Group 2. Indoor temperature of Group 1 and Group 2 was around 10 °C and 20 °C, respectively.
Acknowledgements
References
- National Bureau of Statistics. China Statistical Yearbook 2010; China Statistics Press: Beijing, China, 2011.
- Zhao, L.; Li, N.; Ma, C. Residential energy consumption in urban China: A decomposition analysis. Energy Policy 2012, 41. [Google Scholar] [CrossRef]
- Zhou, N.; Nishida, M.; Gao, W. Current Status and Future Scenarios of Residential Building Energy Consumption in China; Lawrence Berkeley National Laboratory: Berkeley, CA, USA, 2008; 2416E. [Google Scholar]
- Chen, S.; Yoshino, H.; Li, N. Statistical analyses on summer energy consumption characteristics of residential buildings in some cities of China. Energy Build. 2010, 42, 136–146. [Google Scholar] [CrossRef]
- Yoshino, H.; Yoshino, Y.; Zhang, Q.; Mochida, A.; Li, N.; Li, Z.; Miyasaka, H. Indoor thermal environment and energy saving for urban residential buildings in China. Energy Build. 2006, 38, 1308–1319. [Google Scholar] [CrossRef]
- Yoshino, H.; Lou, H. Indoor thermal environment of residential buildings in three cities of China. J. Asian Archit. Build. Eng. 2002, 1, 129–136. [Google Scholar] [CrossRef]
- Yoshino, H.; Jiang, Z.; Li, Z.; Li, N.; Liu, J.; Lu, W.; Pei, Q.; Zhen, J.; Zhu, Y. Investigation of Urban Residential Energy Consumption in China. In Proceedings of the First International Conference on Building Energy and Environment, Dalian, China, 4–6 August 2008; pp. 284–291.
- Lam, J.C. An analysis of residential sector energy use in Hong Kong. Energy 1996, 21, 1–8. [Google Scholar] [CrossRef]
- Yoshino, H.; Guan, S.; Lun, Y.; Shigeno, T.; Yoshino, Y.; Zhang, Q. Summer survey on indoor thermal environment of urban residential buildings in China. J. Asian Archit. Build. Eng. 2002, 1, 65–72. [Google Scholar]
- Zhang, H.; Yoshino, H. Analysis of indoor humidity environment in residential buildings. Build. Environ. 2010, 45, 2132–2140. [Google Scholar] [CrossRef]
- Department of Construction of the PRC. Thermal Design Code for Civil Buildings; China Plan Press: Beijing, China, 1993; GB50176-93. [Google Scholar]
- Yu, Liang; Watanabe, T.; Yoshino, H.; Gao, W. Research on energy consumption of urban apartment buildings in China [In Japanese]. J. Environ. Eng. 2008, 73, 183–190. [Google Scholar] [CrossRef]
- The Energy Data and Modeling Center Handbook of Energy & Economic Statistics in Japan; The Energy Conservation Center: Tokyo, Japan, 2006.
- Jiang, Y. Current building energy consumption in China and effective energy efficiency measures. Heat. Vent. Air Cond. 2005, 35, 30–40. [Google Scholar]
© 2012 by the authors; licensee MDPI, Basel, Switzerland. This article is an open access article distributed under the terms and conditions of the Creative Commons Attribution license (http://creativecommons.org/licenses/by/3.0/).
Share and Cite
Hu, T.; Yoshino, H.; Zhou, J. Field Measurements of Residential Energy Consumption and Indoor Thermal Environment in Six Chinese Cities. Energies 2012, 5, 1927-1942. https://doi.org/10.3390/en5061927
Hu T, Yoshino H, Zhou J. Field Measurements of Residential Energy Consumption and Indoor Thermal Environment in Six Chinese Cities. Energies. 2012; 5(6):1927-1942. https://doi.org/10.3390/en5061927
Chicago/Turabian StyleHu, Tianchi, Hiroshi Yoshino, and Jie Zhou. 2012. "Field Measurements of Residential Energy Consumption and Indoor Thermal Environment in Six Chinese Cities" Energies 5, no. 6: 1927-1942. https://doi.org/10.3390/en5061927