1. Introduction
The first references to modern energy production from sea waves date back to the 1940s with a wave-powered navigation buoy developed by Yoshio Matsuda, but extensive research activities in the field only provided the first fundamental results in the 70s when, boosted by the oil crisis, the British government established a major wave energy development program [
1]. Important progress was also made in Norway through the pioneering contributions of Budal and Falnes [
2] and the construction of two full-sized prototypes concluded in 1985.
Even though some important conclusions were drawn from these and other projects, activity in Europe remained mainly at an academic level until the decision made by the European Commission to include wave energy in the R&D program on renewable energies. Since then, many projects have been funded involving a large number of companies in many countries. The number of wave energy concepts currently being developed is very large and the reader is advised to consult the recent review by Falcão [
3] to grasp a clear picture of all of them.
Most wave energy technologies are still at an early stage and only a few companies have managed to test their devices in the open sea. Among them, one should remember the Pelamis [
4] as the world’s first wave energy, grid connected, commercial array of WECs and one of the most advanced concepts, according to a recent state of the art report [
5]; and OPT Power Buoys, whose prototypes have been installed in Spain (40 kW) and Scotland (150 kW) [
6].
OCEANTEC Energías Marinas S.L. is a Spanish company involved in the development of a WEC. The developed device can be described as a WEC based on the relative inertial movement caused by waves on a gyroscopic device. It is a totally enclosed floating hull, moored off-shore and thus moving simultaneously with the waves (see [
7,
8,
9]). The promising results of the simulations led to an international patent application [
10]. All the WECs based on wave activated bodies comprise the following main parts:
- (a)
A reaction mechanism moved by wave action called an Energy Capture Device (ECD).
- (b)
A PTO system to convert the incoming power, oscillating at low frequency and high torque, into a continuous and relatively high frequency signal usable by alternators.
- (c)
A control system to adjust the dynamic behaviour of the WEC to the incident wave conditions.
A novel hydraulic PTO device was designed with the aim of coupling it to a gyroscopic energy absorber, as part of the OCEANTEC WEC [
8]. The first specific conceptual design was further developed and modified to achieve a universal design of a PTO [
11], which could be coupled to any kind of absorber whose output motion fulfils some basic requirements: oscillating (translational or rotational), low frequency, high torque and fluctuating power.
After a detailed design was carried out and the device was numerically modeled, results from the simulations generated very positive expectations, concluding in the construction of this new PTO concept.
The actual PTO dynamic performance is verified through tests carried out on a test bench specifically designed for this purpose. Moreover, the validation tests results are used to verify the results of the simulations carried out with the Matlab/Simulink model.
The current article summarizes the design, simulation, construction, testing and mathematical model verification of the new PTO concept developed, and it is of significant relevance for practical implementation.
2. Hydraulic PTO
The adaptability of WECs to different sea-states and to each wave within each sea state is fundamental for maximizing power capture, due to the great variability of wave power across the whole range of interesting sea states. Moreover, a WEC should respond in resonance with the waves, with exciting force and response velocity being in phase to optimize power absorption [
12].
WECs use large bodies moved by the action of the waves (energy capture devices, ECDs) to drive the PTOs, which convert this mechanical energy into usable electric energy. The PTOs usually transform the alternative motion of low frequency high torque and fluctuating power into a continuous unidirectional rotation of high frequency and low torque, which feeds a conventional electric generator.
The problem of the selection and control of an adequate PTO system has been covered by many during recent years with an extensive range of solutions proposed, some of which have proved to be quite effective. The definition of an energy extraction mechanism is clearly coupled with the elaboration and implementation of an efficient control strategy, whose theoretical advantage must be transferred to practical and economical convenience.
It could be argued that the most successful kinds of PTO concepts in wave energy are represented by air turbines, electrical direct-drive energy conversion and hydraulic systems based on the pressurization of a liquid flow. Energy conversion through hydraulic systems has been studied extensively in recent decades. Salter suggested the adoption of hydraulic machines for the Duck device while Budal and Falnes defined a conversion mechanism similar to the one presented in this study to be applied to a point-absorber [
13]. Hydraulic PTOs have also been introduced and tested on many other devices. A key example of their application can be seen in the Pelamis [
14] but many other developers are seeking to adapt this concept to their own technology.
These systems offer the advantage of storing large quantities of energy through the use of gas accumulators which allow a smoother power output. Moreover they can be assembled in many cases with components adapted from standard commercial applications and are suitable for control implementation. A general treatment of a case similar to the one shown in this paper has been proposed by Falcão, [
15,
16], with an extensive analysis of a possible phase control strategy.
Other relevant references in this field are represented by the work of Eidsmoen [
17,
18], where detailed modelling of a hydraulic PTO has been applied to a heaving converter with the introduction of a phase control mechanism based on a control valve. A hydraulic extraction mechanism has also been conceived for the SEAREV concept [
19,
20], showing how this type of conversion system is fitted to several kinds of devices.
Application of adequate control strategies is one of the most important issues to be addressed in future developments. Indeed, a previous study carried out by Ricci
et al. [
21] has clearly shown the validity of some proposed strategies in terms of power performance. The present paper constitutes the preliminary design and testing of a hydraulic PTO solution. The testing presented here involves mainly the validation and assessment of the concept, but future work will probably include the implementation of some type of control.
3. Conceptual Design
This PTO allows power capture to be optimised across a range of sea states and individual waves by applying a controlled restraining torque in a flexible and precise way to the output mechanical transmission means of the energy capture device (ECD). The PTO comprises the following main parts:
- (a)
Hydraulic cylinder array.
- (b)
A group of valve blocks, each one commanding one of the hydraulic cylinders of the array. They enable the activation of cylinders and the selection of the working areas in each cylinder.
- (c)
A group of high and low pressure accumulators.
- (d)
A control valve, which allows adjustment of the hydraulic motor entrance pressure/flow.
- (e)
One or more hydraulic motors.
Moreover, this PTO includes mobile electro-hydraulic fixing systems at both ends of each hydraulic cylinder. Each of these fixing systems consists of two main parts: an activation system, which allows displacement along linear guides to one end of the cylinder, and an interlock system, which fixes the position of the same end of the cylinder hydraulically.
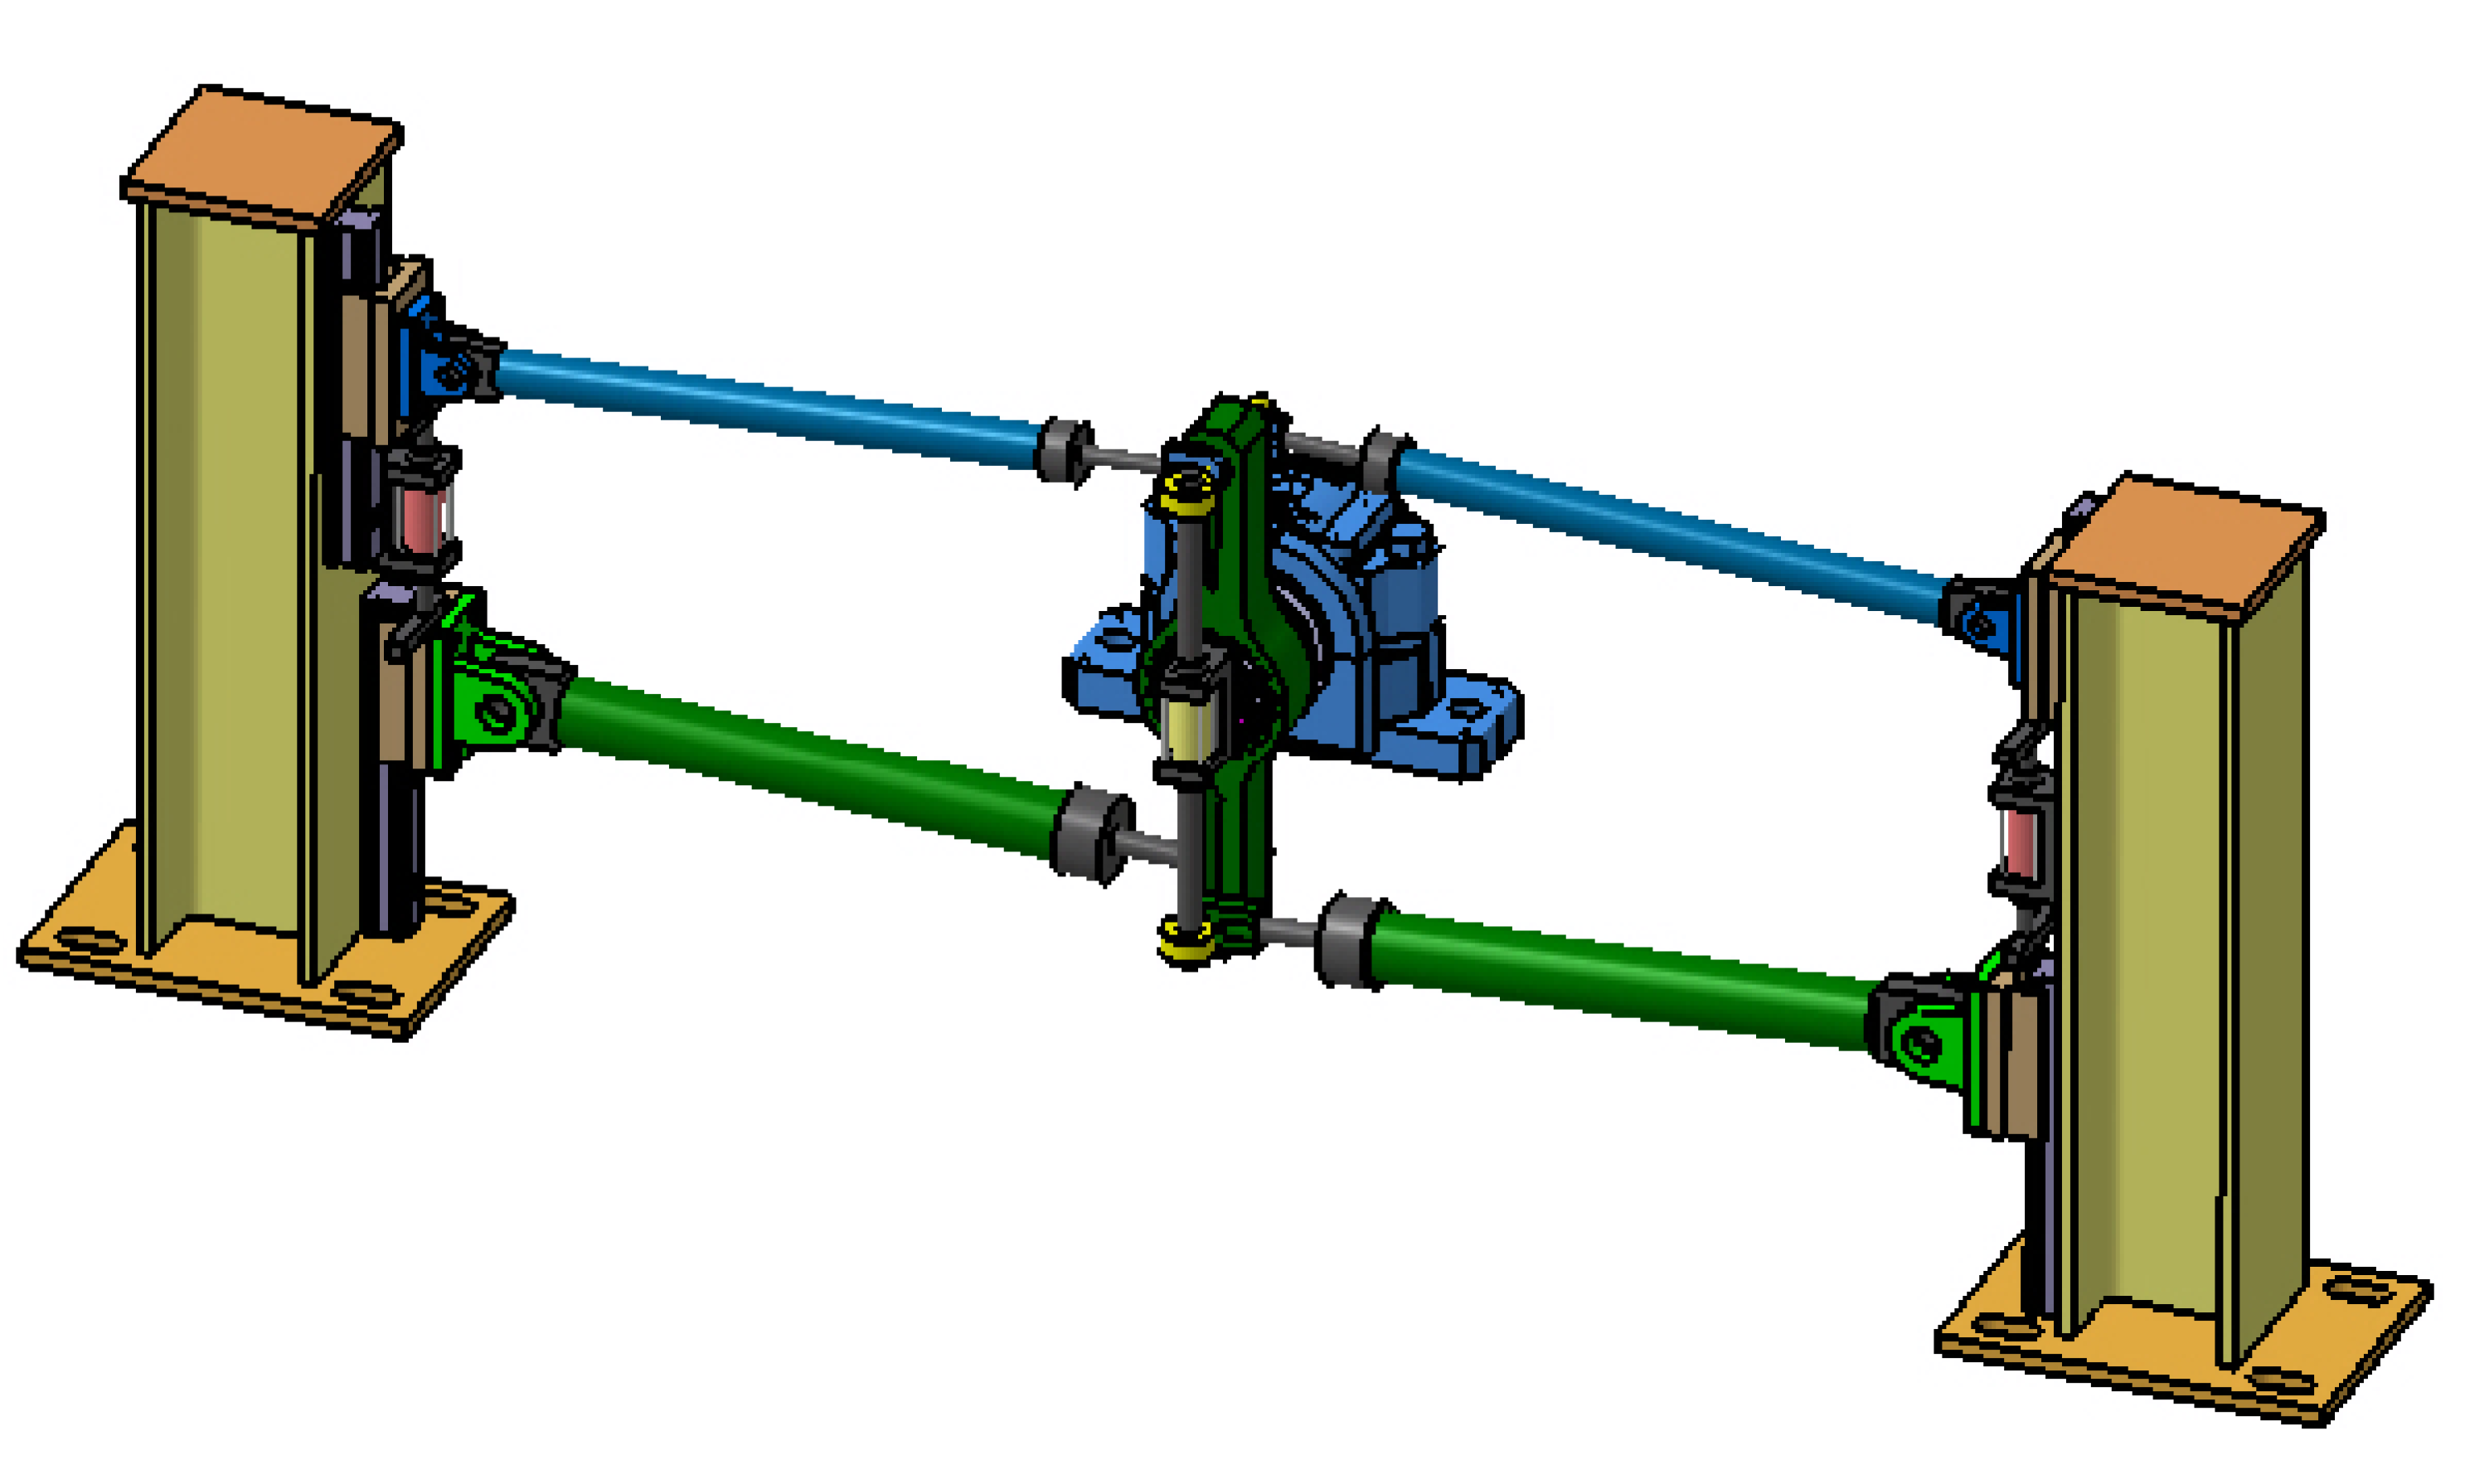
Figure 1 shows the layout of the cylinders and the fixing systems.
Figure 1.
Array of cylinders and the electro-hydraulic fixing systems.
Figure 1.
Array of cylinders and the electro-hydraulic fixing systems.
The hydraulic circuit is divided in two main parts: the input components absorb the energy of waves and control ECD movement, and the output components provide the steady energy that feeds the electric generator. The cylinders, their fixing systems, the valve blocks and the high pressure accumulator apply the torque control to the output shaft of the ECD and constitute the first part of the circuit. In addition, the high pressure accumulator, the control valve, the hydraulic motor and the electric generator constitute the second part of the system, whose control permits continuous rotation in the generator, minimizing power fluctuations within each sea state.
The cylinder array is coupled to the Energy Capture Device (ECD) output shaft and is responsible for applying the torque to brake ECD motion. The braking torque applied is governed by the expression:
where
P is the pressure inside the cylinder chamber in service (directly related to the pressure in the high pressure accumulator);
A is the equivalent area of the hydraulic cylinders on duty;
r is the minimum distance between the longitudinal axis of the hydraulic cylinder and the pivoting axis of the output shaft of the ECD. So, the braking force applied by the PTO can be adjusted by changing
r,
P and
A.
The variable
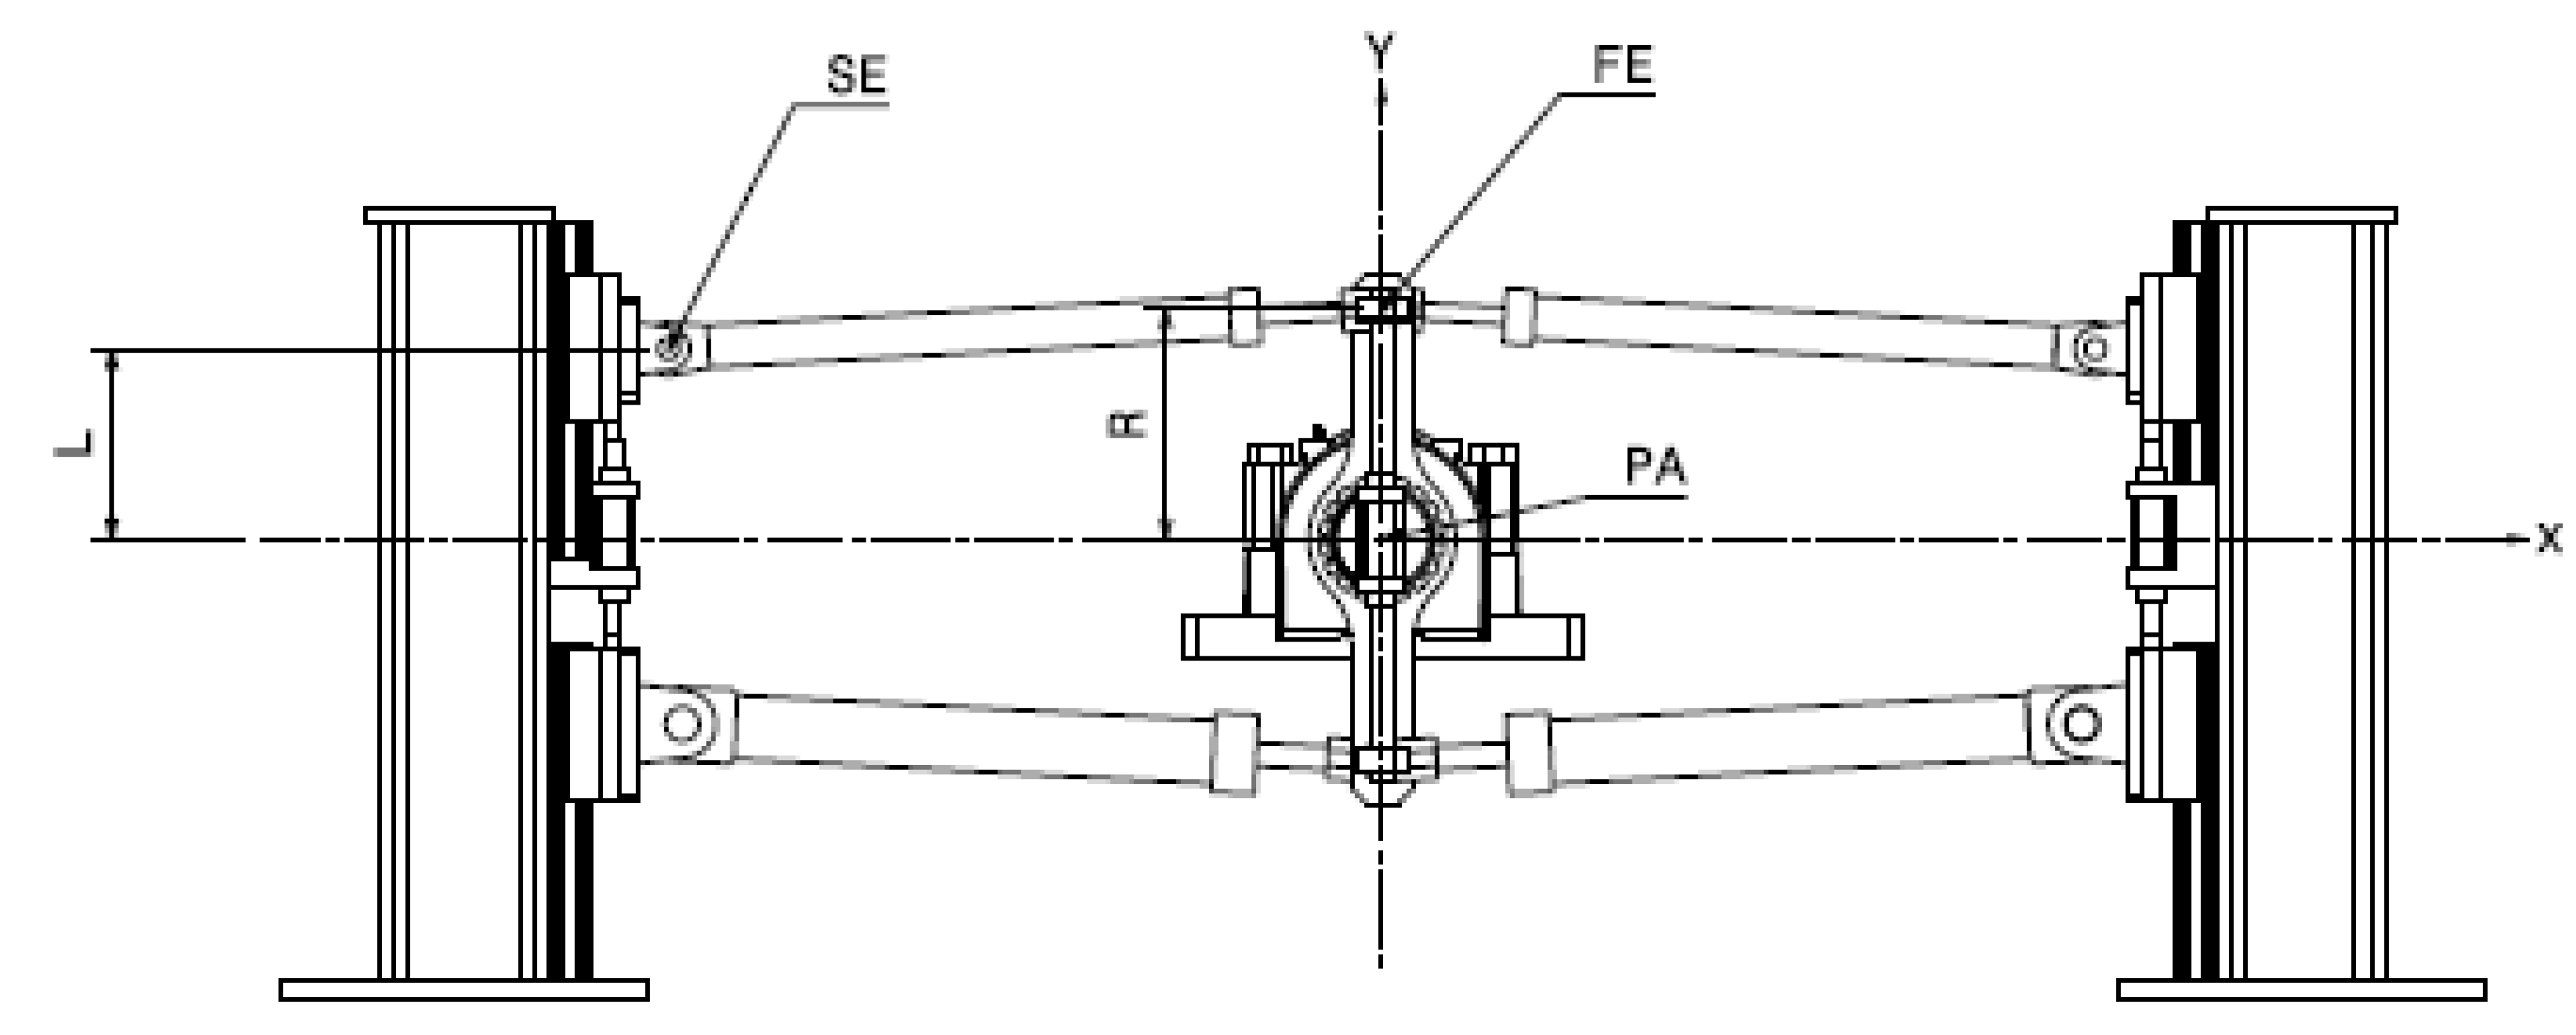
r is a function of two variables
R and
L, where
R is the distance between the pivoting axis of the output mechanical transmission means of the ECD and the rod end and
L is half the distance between the anchor bases of the cylinder bodies, as shown in
Figure 2.
Both distances R and L can be varied by means of the first and second fixing systems mentioned above for each cylinder. The pressure in the accumulators can be adjusted by varying the volume of oil inside them. The equivalent area is defined by the areas of the hydraulic cylinders selected at each instant. This selection is commanded by the valve blocks.
The braking torque applied by the PTO to the ECD is adapted to different sea states by modifying parameters
P,
R and
L, unlike the solution of [
22] in which only
P is varied. The PTO allows the amplitude and shape of the braking torque curve to be modified, while [
22] only allows the amplitude of the braking torque to be changed. In this way, it allows greater flexibility for keeping speed and torque in phase. Moreover, the response time is greatly reduced, because the reaction time necessary to vary the
R and
L parameters is much shorter than the time necessary to vary
P.
Figure 2.
R and L parameters.
Figure 2.
R and L parameters.
Additionally, it is possible to select the working area (bore area, annulus area or rod area) of each enabled hydraulic cylinder by means of three electro-valves (integrated in the corresponding valve block), adapting the braking torque applied to the ECD to each wave within a given sea state.
Once the curve of the restraining torque is set, the displacement of each cylinder rod generates a flow to the high pressure accumulator and the control valve. The flow curve is rectified before entering the hydraulic motor, which is coupled to a conventional electric generator.
4. Matlab/Simulink Model
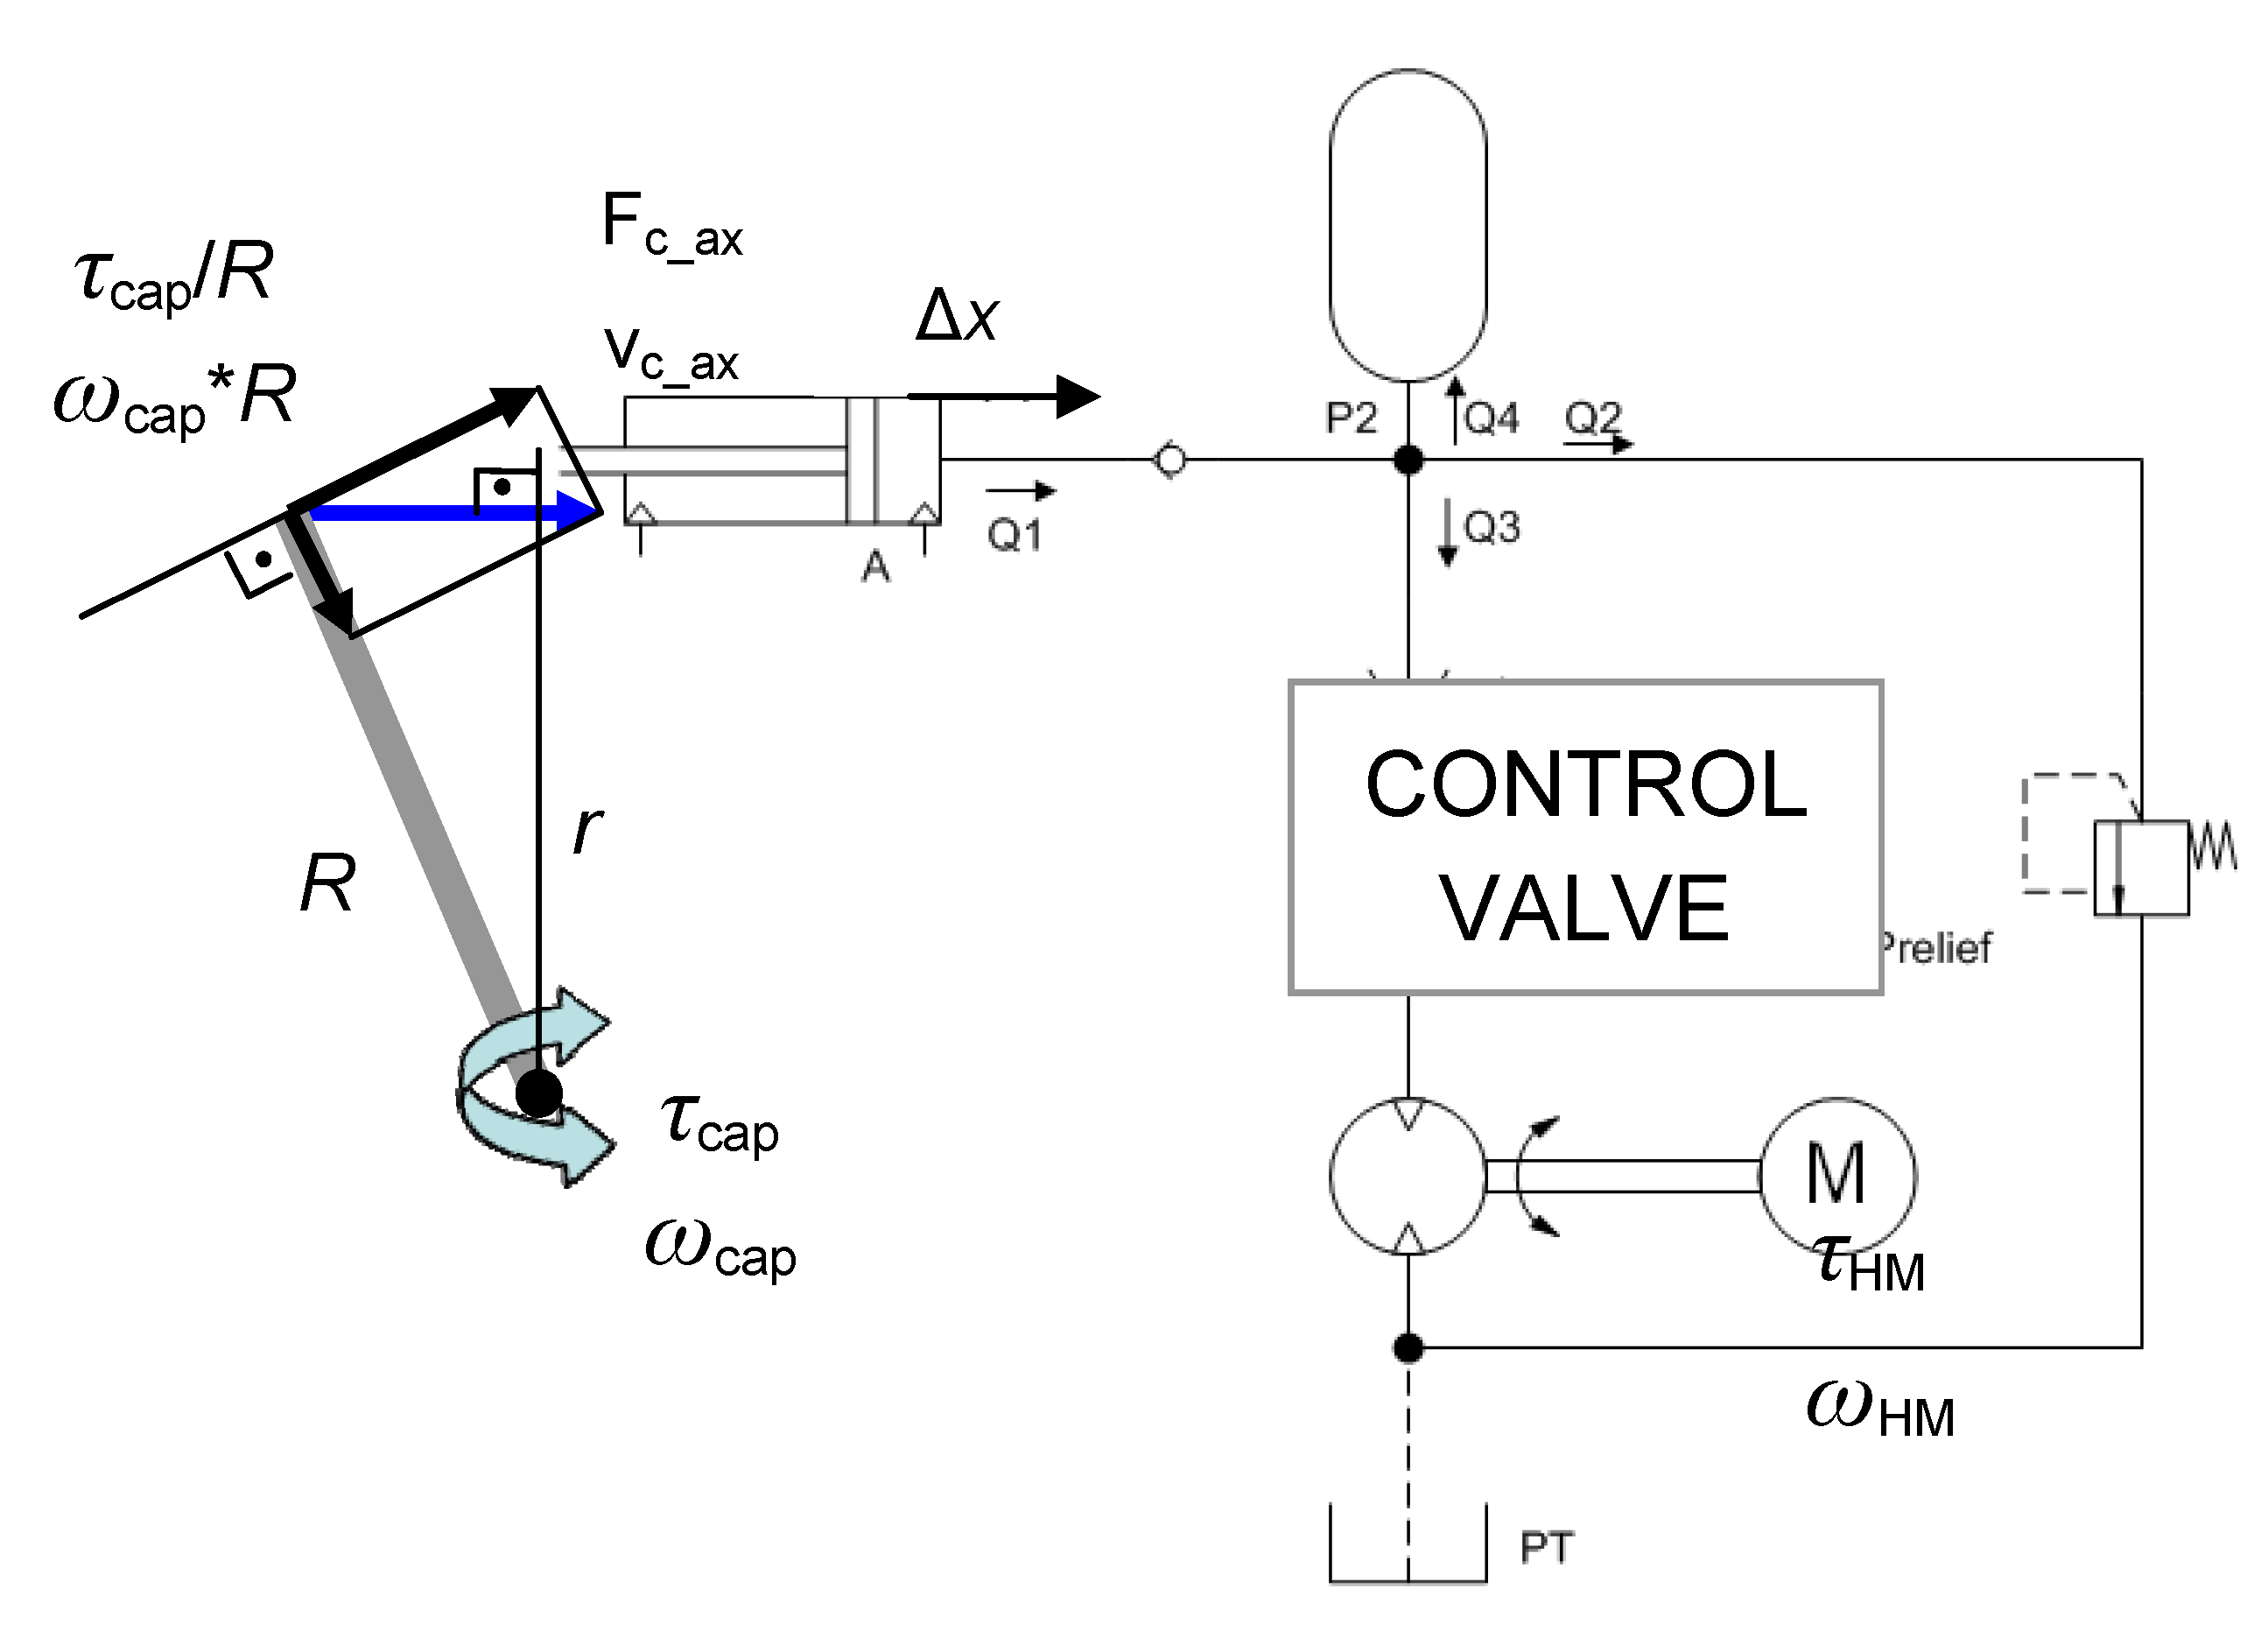
Regarding the model used, the nomenclature has been implemented. The model corresponds to the simplified hydraulic diagram depicted in
Figure 3. The hydraulic circuit of the PTO is modelled using conditional statements and functions relating pressure and flow [
23].
Figure 3.
Simplified hydraulic diagram of the PTO.
Figure 3.
Simplified hydraulic diagram of the PTO.
The compressibility of the oil is simulated by means of Equation (2), which determines the difference of pressure between two consecutive simulated times, with
β = 1.8 × 10
9 N/m
2 being the bulk modulus:
The flow pumped by the cylinder can be calculated by (3), and is distributed along the circuit following the continuity Equation (4):
As defined by the check valve Equation (5a,b), the oil pumped by the cylinder,
Q1, flows only when the pressure on the cylinder is higher than the pressure in the high pressure accumulator:
The relief valve Equation (6a,b) sets the flow through it,
Q2:
The high pressure accumulator equation corresponds to an isentropic process, whose
γ coefficient is considered to be 1.4, due to the use of nitrogen gas:
where:
Hydraulic motor generated torque (9) and rotational speed (10) are calculated:
where
P3 depends on the pressure drop in the control valve.
The mechanical power on the hydraulic motor shaft can be determined with inlet and outlet pressure values and the flow across it. This mechanical power is used to select the generator:
The Matlab/Simulink model of the PTO has been implemented with all these equations.
5. PTO Construction
The main purpose of the construction and testing of the PTO is the analysis of its dynamic performance to ensure that the output motion of the PTO can be coupled to a conventional generator. Furthermore, the tests should allow the efficiency of the PTO device to be determined.
Figure 4 shows the layout of the complete PTO separated into two main structures: the cylinder array subassembly and the rest of the main hydraulic components subassembly. The sizing of the hydraulic model is based on the Matlab/Simulink simulations performed.
The PTO was initially designed to be coupled to a scaled wave energy capture device with an oscillating motion of low speed (0–5 rad/s), high torque (up to 16,000 Nm) and great power fluctuations (from 0 to 80 kW). Any energy capture device (ECD) that fulfils these requirements can be coupled to this PTO, provided that its scale is adequately defined depending on the rated power of the full scale prototype.
Figure 4.
Layout of the complete PTO.
Figure 4.
Layout of the complete PTO.
The simulations carried out with the energy capture device model allow defining a matrix with PTO entrance torque and speed values for each sea state. The variation of the
P,
R,
L and
A values should enable the PTO to brake entrance motion in all sea states. The variables
P,
R and
L must allow braking of the maximum torque developed by the energy capture device in all sea states. The value of the variable
A for braking the maximum torque in each sea state should be high enough to guarantee that the range of lower
A values will brake the movement of the energy capture device in small waves within each sea state, maximizing energy extraction.
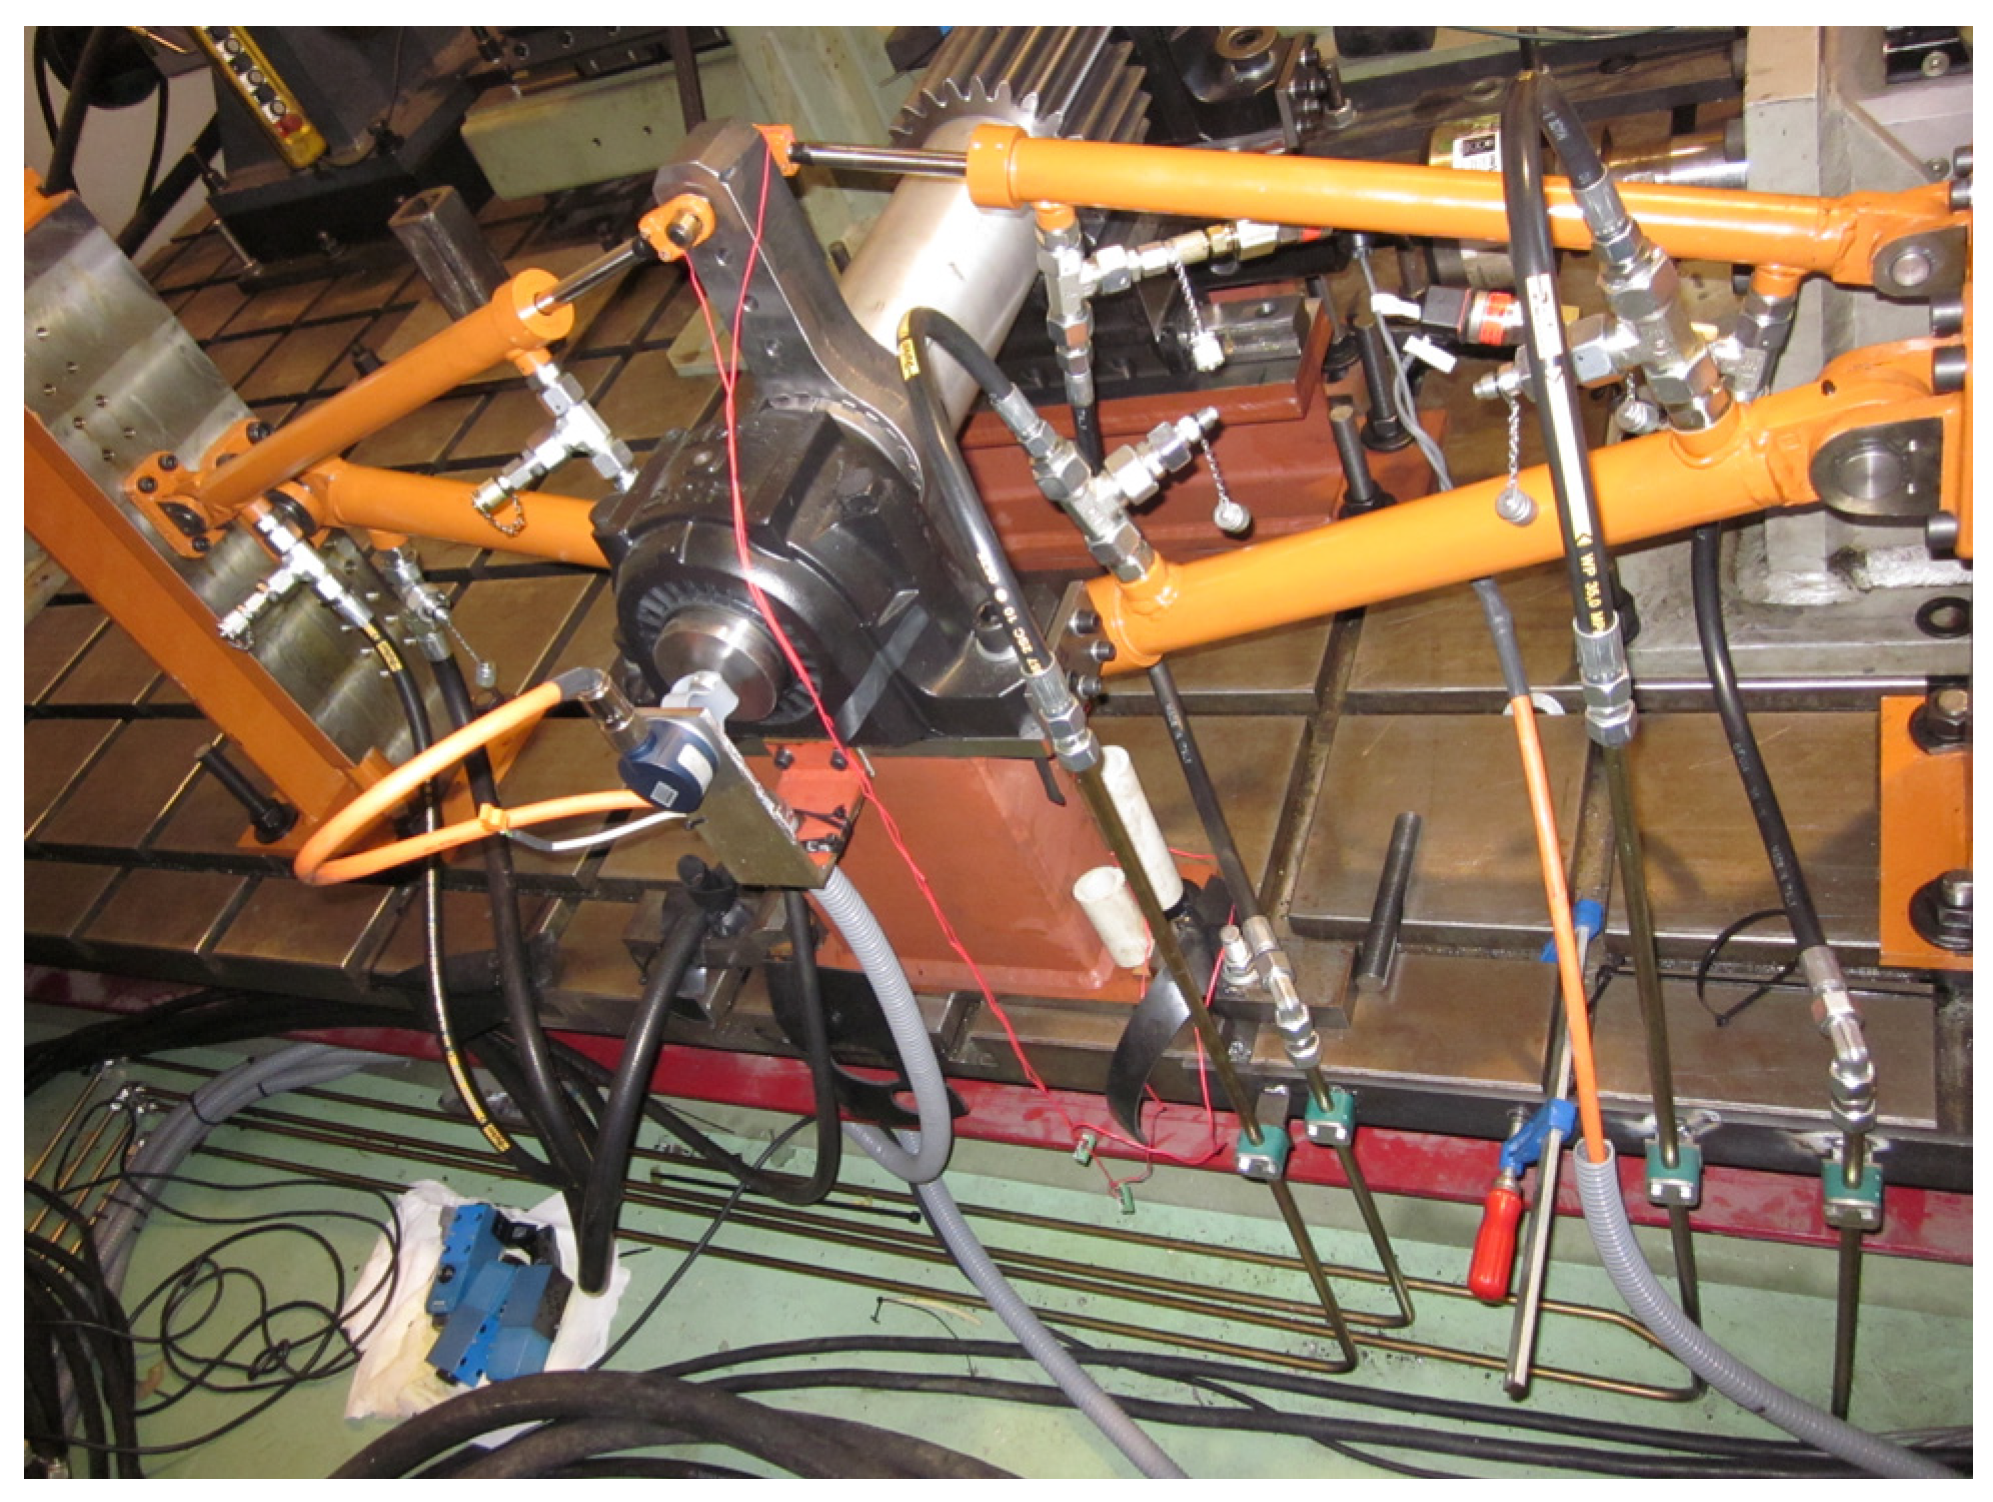
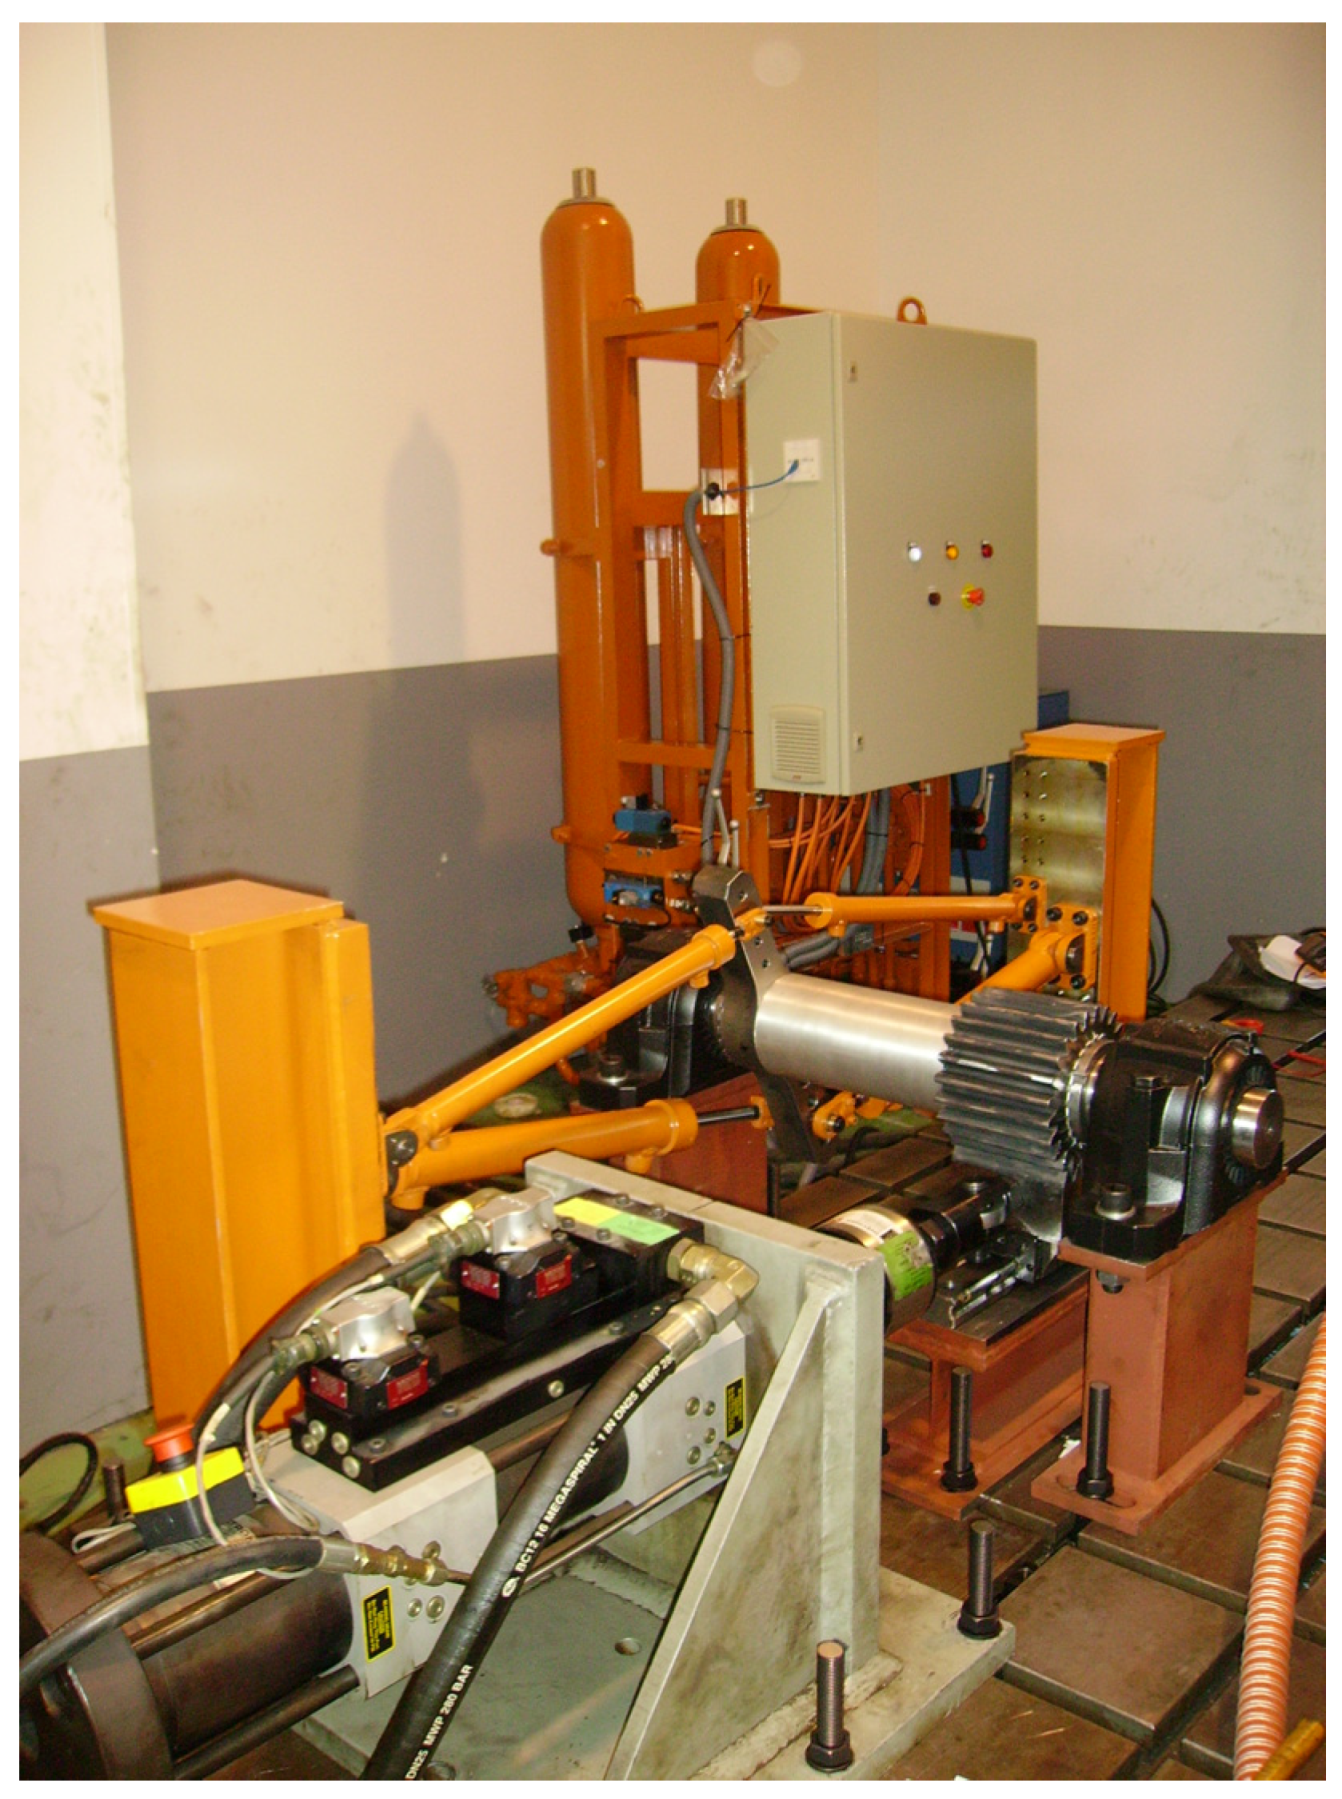
Figure 5 shows the cylinder array structure assembled. One of the ends of each cylinder is fastened to the I-beam, which simulates the WEC structure and is fixed to a test rig. The other end of each cylinder is fastened to a torque arm fixed to a shaft, which is the means of PTO input transmission.
Figure 5.
Cylinder array structure.
Figure 5.
Cylinder array structure.
Two different references of cylinders have been implemented:
- (a)
Bore diameter 32 mm, rod diameter 16 mm, stroke 420 mm and articulated at both ends.
- (b)
Bore diameter 50 mm, rod diameter 22 mm, stroke 420 mm and articulated at both ends.
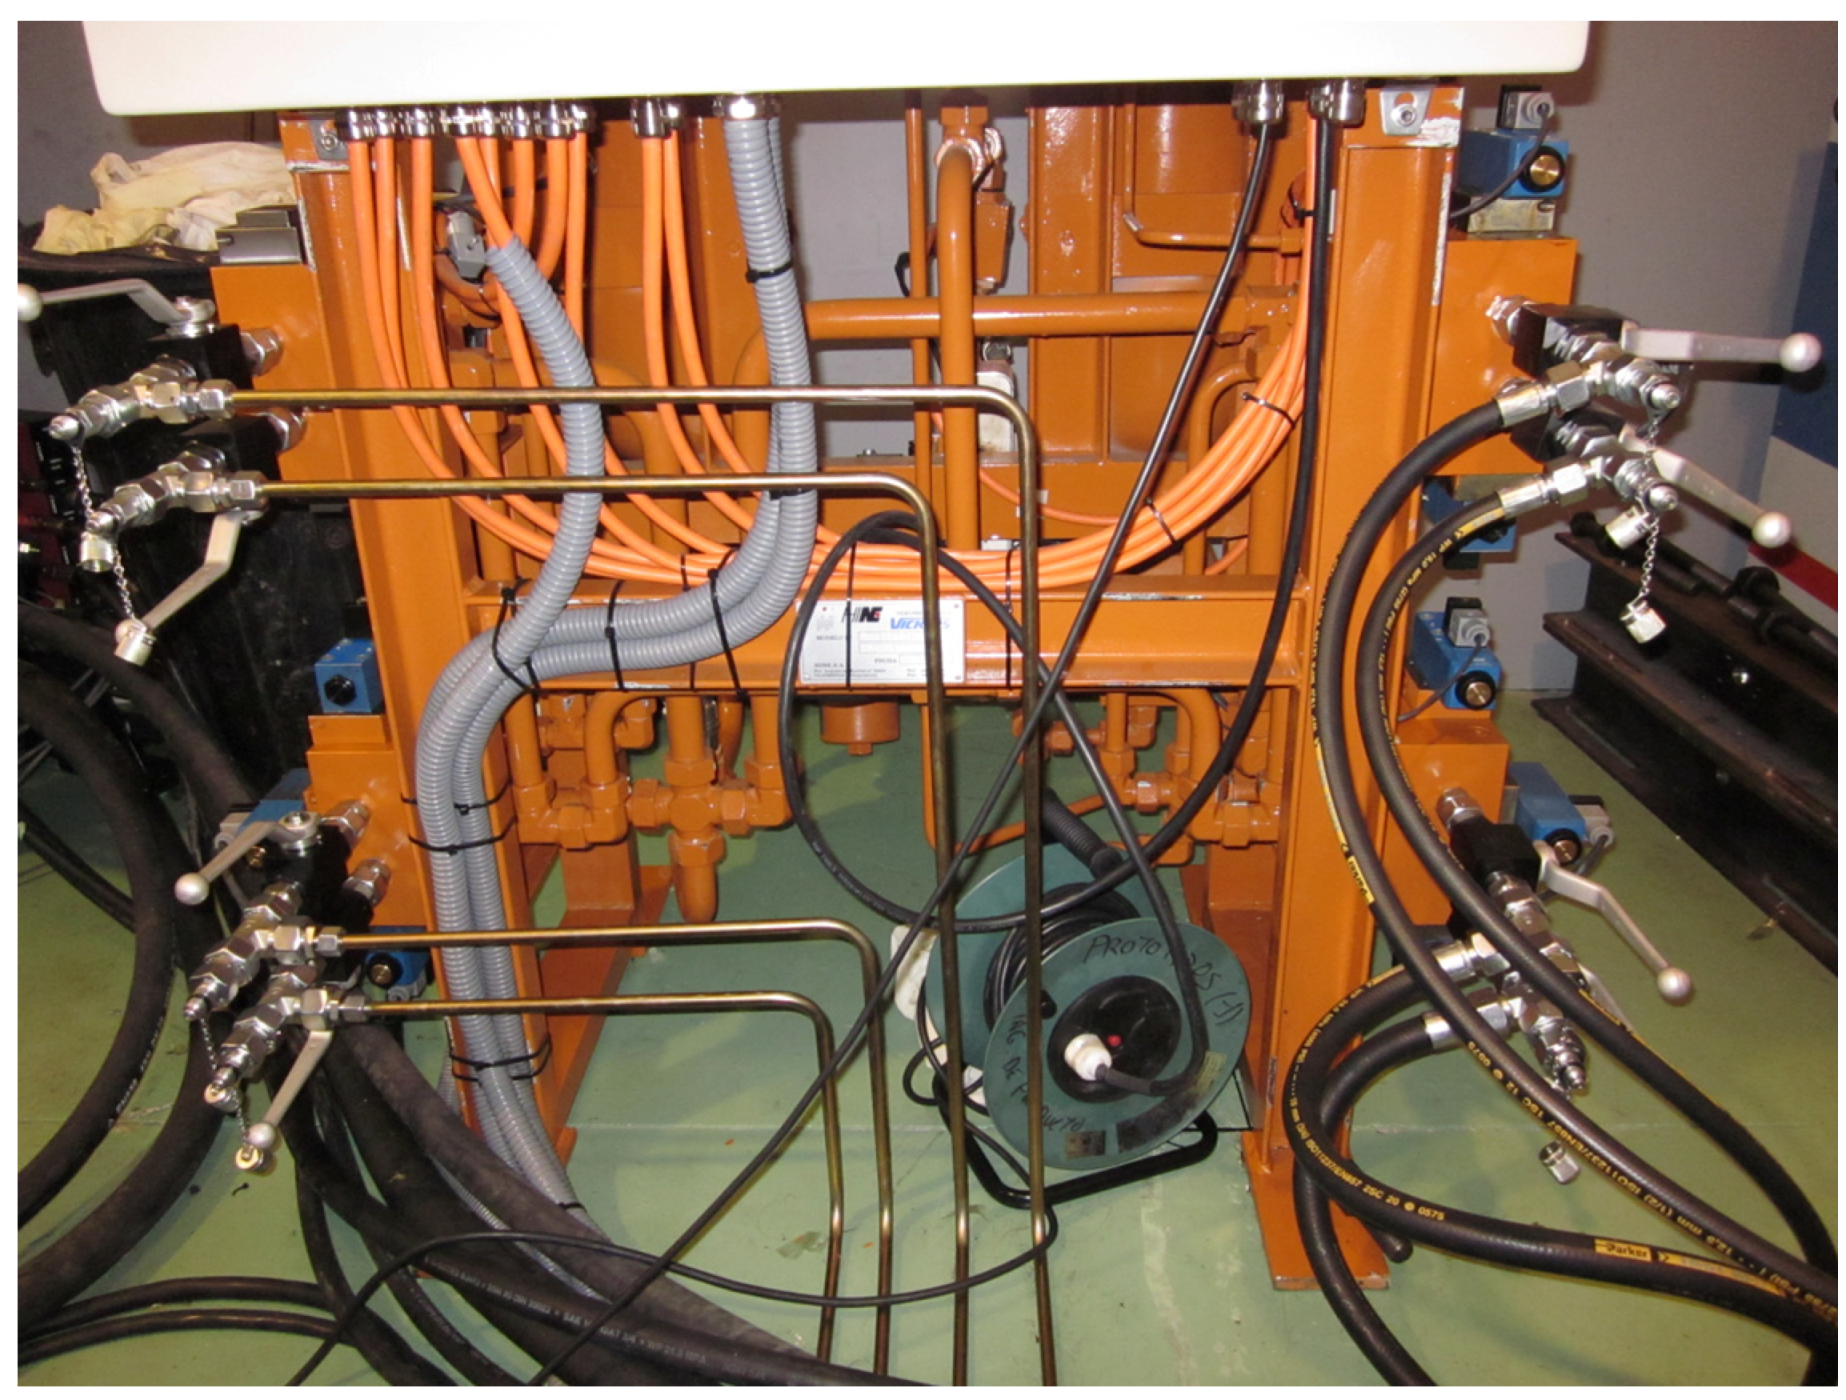
The hydraulic hoses that connect the cylinders to the corresponding valve blocks are also shown in
Figure 5. Each valve block contains the required electrovalves and check valves for the proper behaviour of the hydraulic circuit. Four valve blocks have been installed, each of them controlling each of the cylinders of the array, see
Figure 6.
Figure 6.
Valve blocks installed.
Figure 6.
Valve blocks installed.
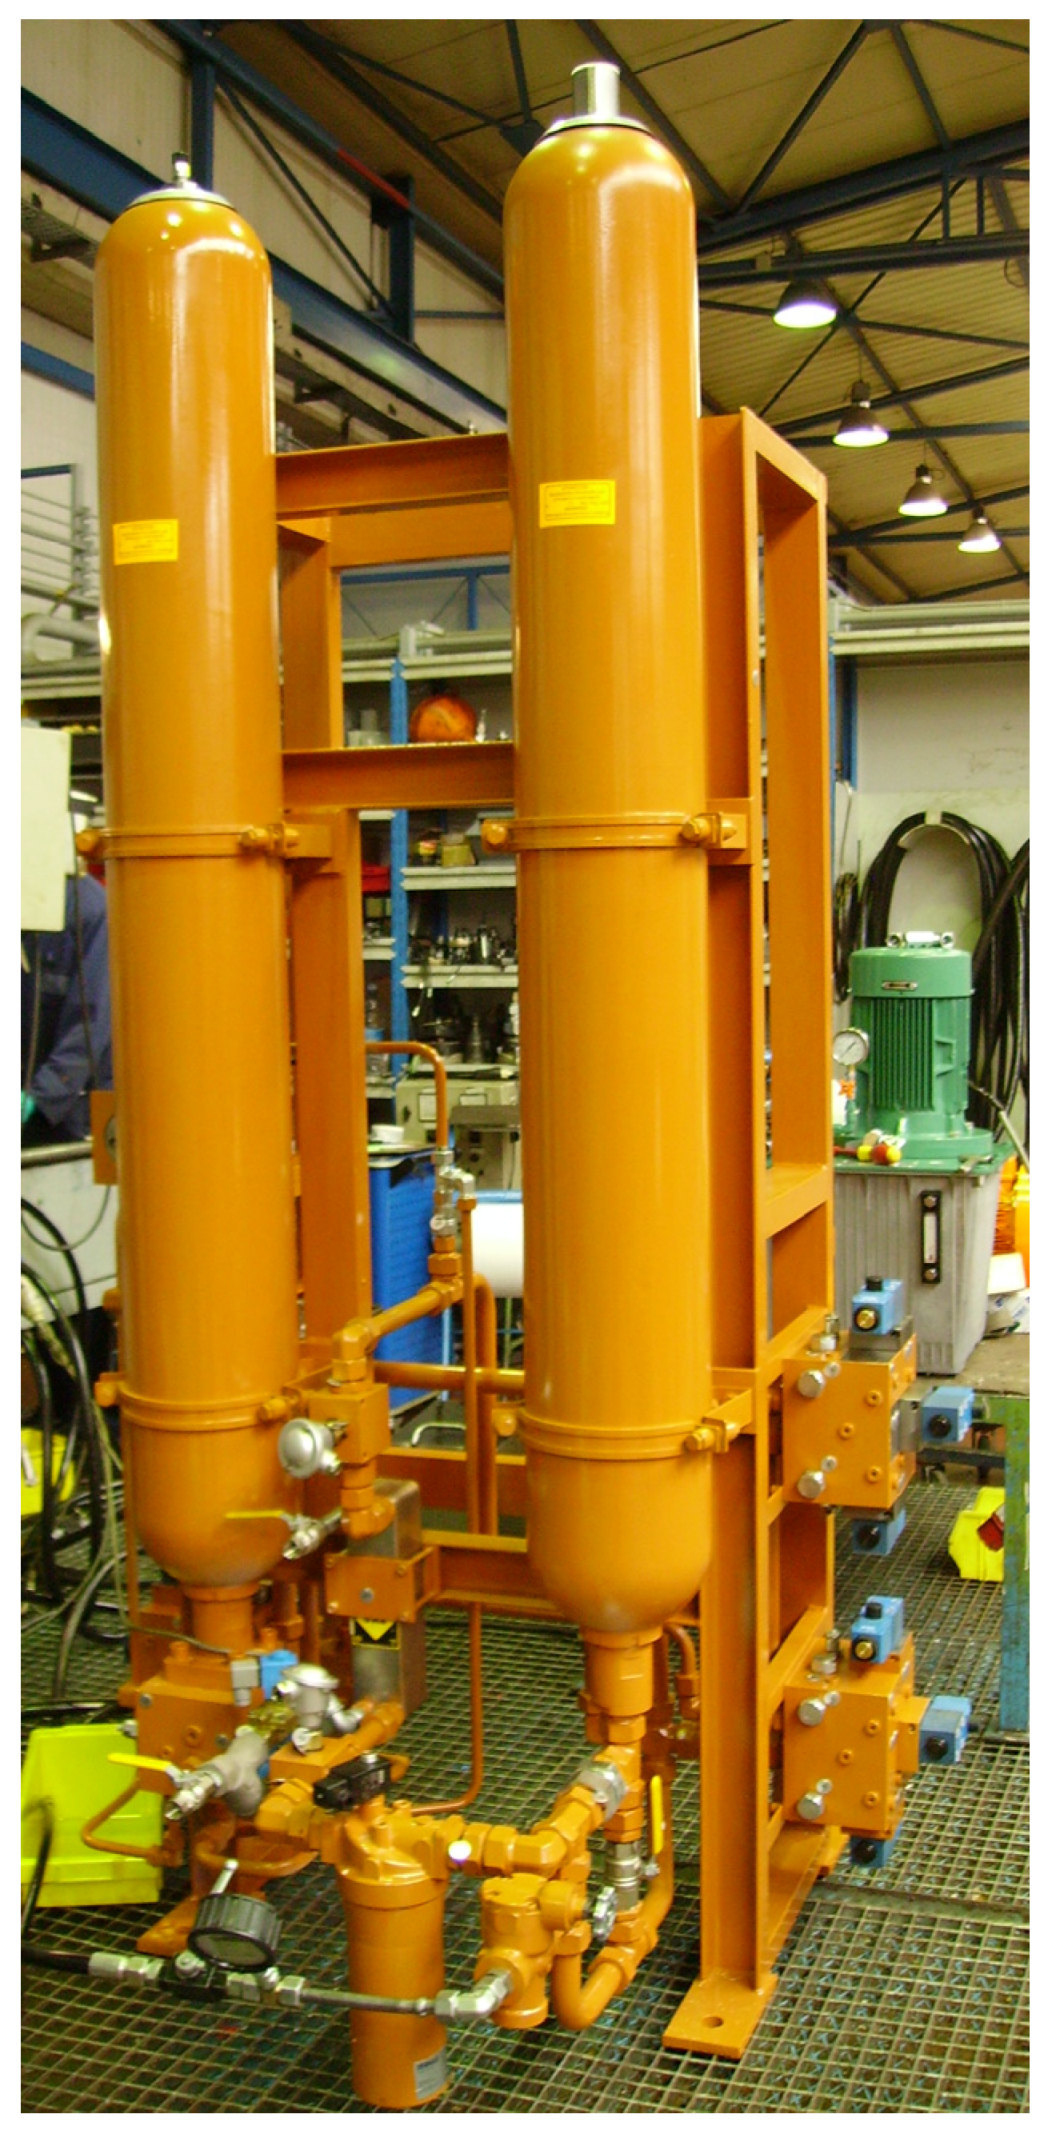
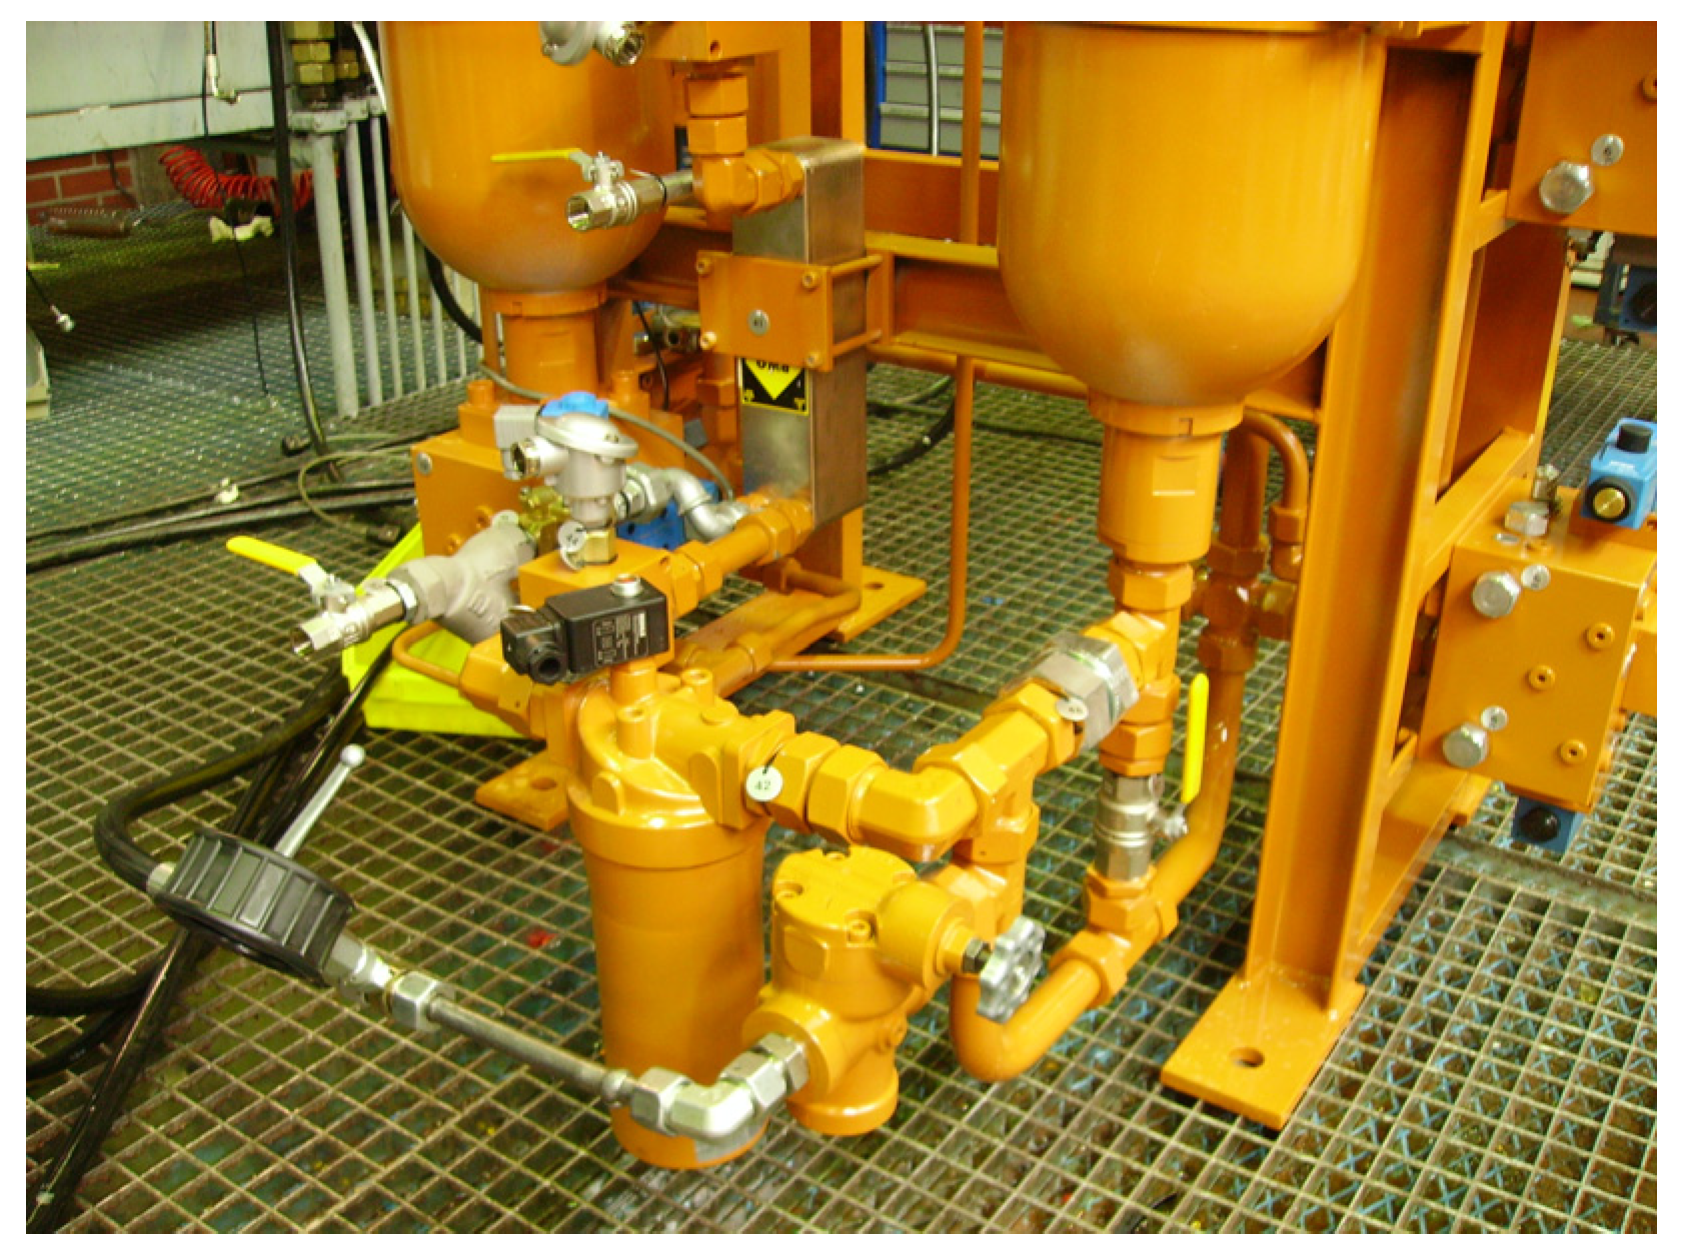
Figure 7 shows the location of the high pressure (HP) and low pressure (LP) accumulators, hydraulically connected with the valve blocks and the control valve.
Figure 7.
HP and LP accumulators.
Figure 7.
HP and LP accumulators.
Of the different types of accumulators, diaphragm, bladder and piston, bladders have been chosen due to their oil volume range, efficiency and the characteristics of this application. The high pressure accumulator is pre-charged at 60 bar and it has a capacity of 50 L, its maximum working pressure being 200 bar. The low pressure accumulator is pre-charged at 1.5 bar and it has a capacity of 50 L, its maximum working pressure being 6 bar. The bladder accumulator optimum working mode requires a ratio between
Pmax and
Pmin lower than 4. Auxiliary systems are situated under the accumulators, as can be seen in
Figure 8. The heat exchanger, the oil filter and the manual valve for oil charging/discharging comprise the auxiliary systems subpart.
Figure 8.
Auxiliary systems.
Figure 8.
Auxiliary systems.
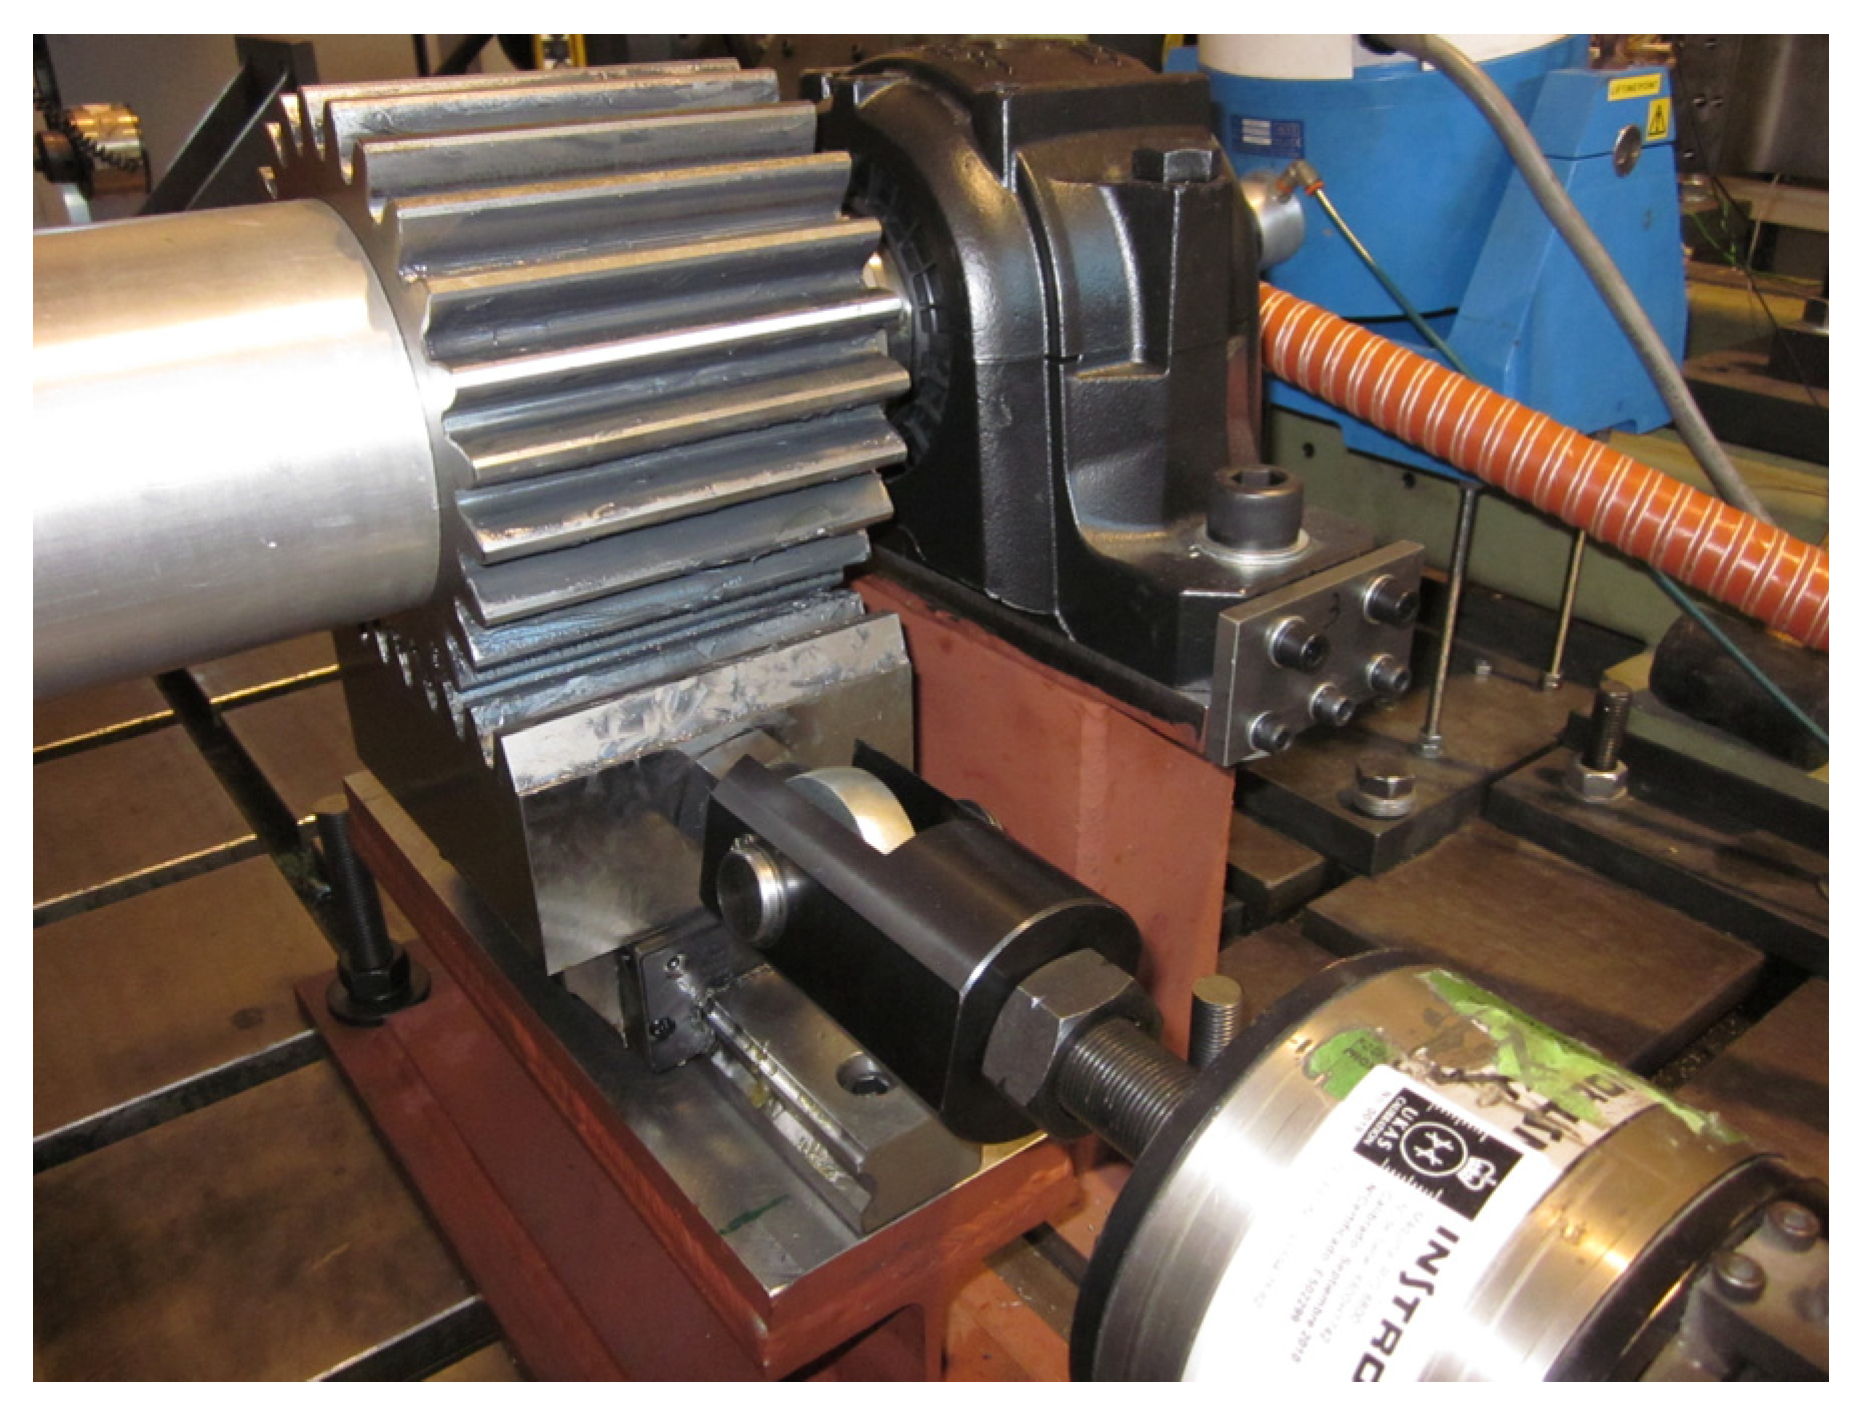
The hydraulic motor chosen is a 4.9 cm
3 gear motor. The small capacity of the motor is related to the scale factor of the power (e
3.5). Furthermore, power extraction must be optimized for the most predominant sea states, where 2 m waves are the most repetitive ones (in this case on the Basque coastline). The smaller motor units give better power absorption due to improved efficiency. As the smaller waves are likely to be more common, a smaller motor is preferable. Systems designed to extract power from large waves, are likely to be unable to generate any power in more prevalent calmer conditions [
24].
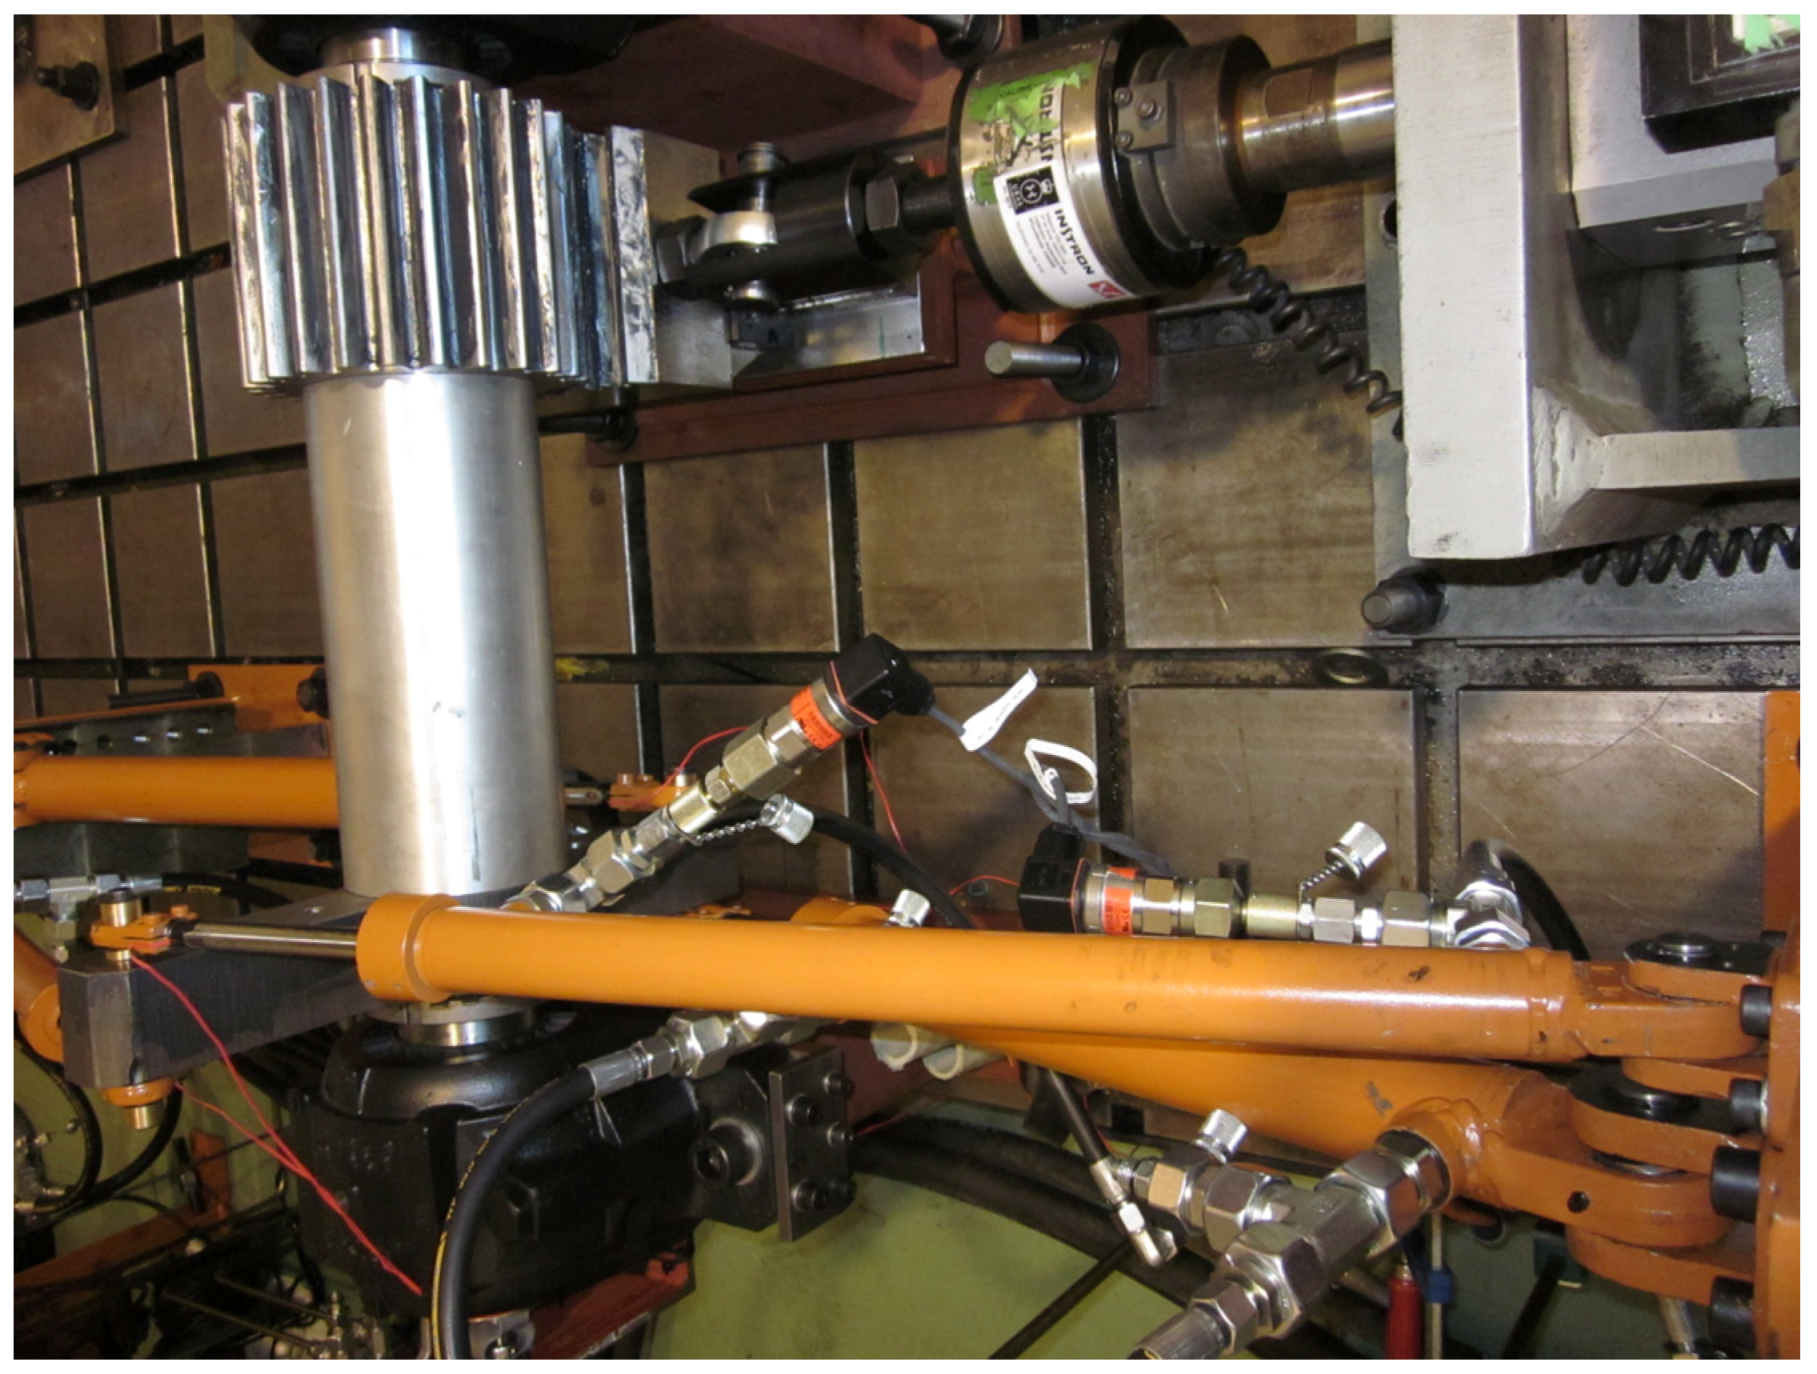
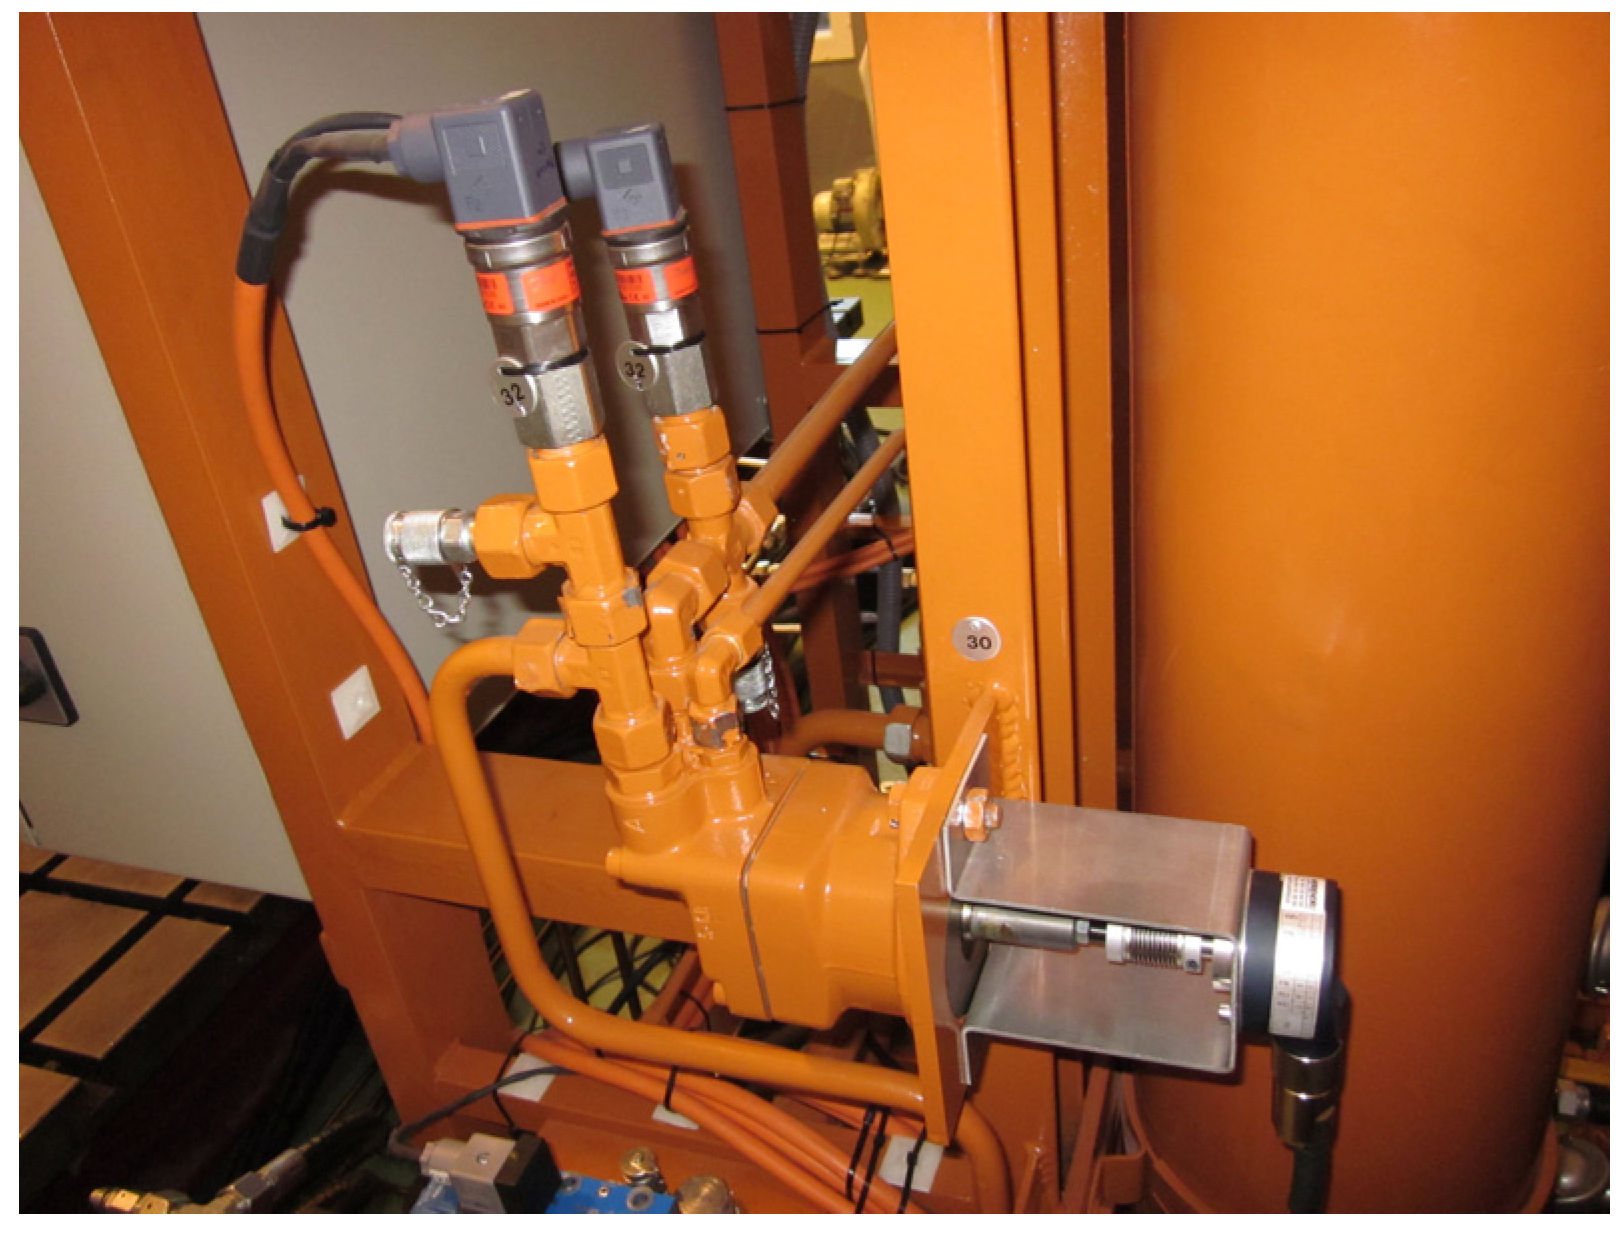
Figure 9 shows how the output shaft is coupled to an encoder, which measures the output speed of the motor.
Figure 9.
Hydraulic motor, input and output pressure transducers and the encoder coupled to the shaft.
Figure 9.
Hydraulic motor, input and output pressure transducers and the encoder coupled to the shaft.
The control valve located between the HP accumulator and the hydraulic motor regulates the entrance flow of the hydraulic motor and the pressure in the HP accumulator.
8. Mathematical Model Verification and Adjustment
8.1. Pressure Drop
The pressure drop along the circuit is one of the key factors that must be analysed to determine the overall efficiency of the PTO. Each one of the components that comprise the first part of the circuit introduces a pressure drop: cylinders, hoses, valve blocks, electrovalves, check valves and hoses.
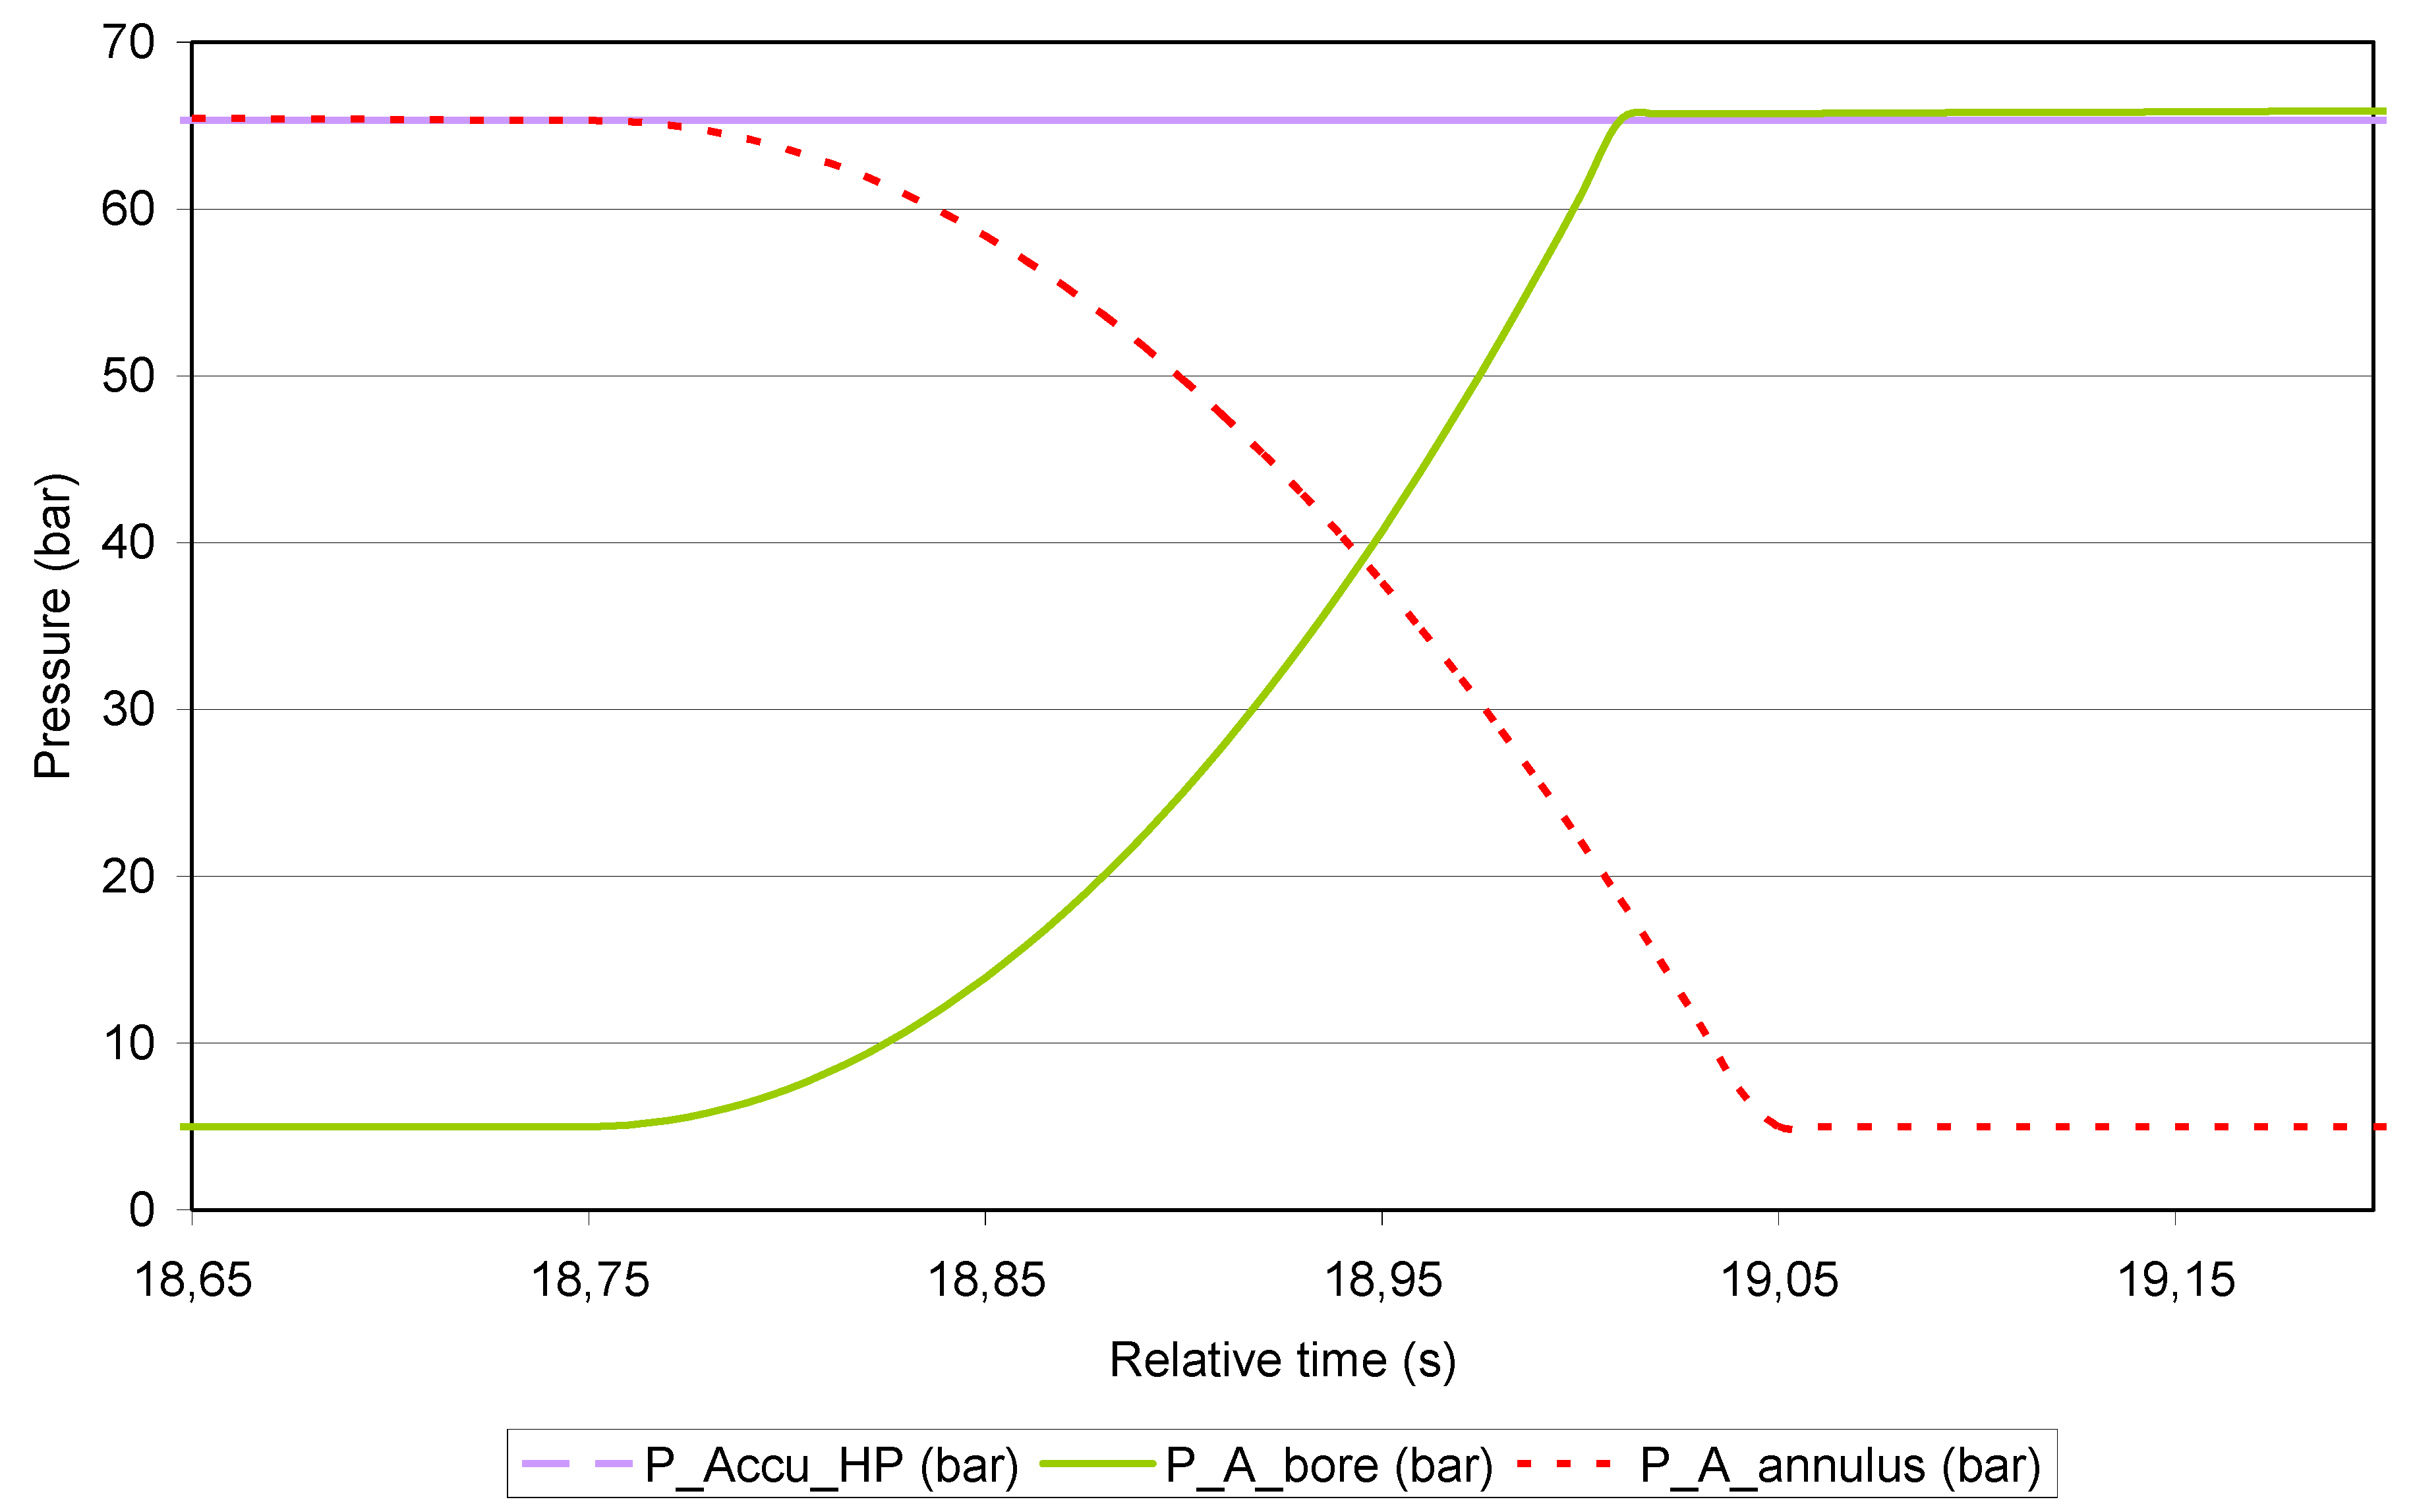
Figure 13 shows pressure values (bar) in the bore chamber of cylinder 3 (green solid line), in the annulus chamber of the cylinder (red dotted line) and in the HP accumulator (purple dash line) extracted from the simulations performed with the model developed in Matlab/Simulink. From the graph shown in
Figure 13, values of pressure drop between the bore chamber of the cylinder and the HP accumulator, and between the annulus chamber and the HP accumulator can be extracted. In the first case, the maximum pressure drop between the bore chamber and the HP accumulator is close to 0.9 bar, while the maximum pressure drop between the annulus chamber and the HP accumulator is approximately 0.7 bar.
Figure 13.
Both chambers of cylinder 3 and HP accumulator pressure values (bar) in the simulations.
Figure 13.
Both chambers of cylinder 3 and HP accumulator pressure values (bar) in the simulations.
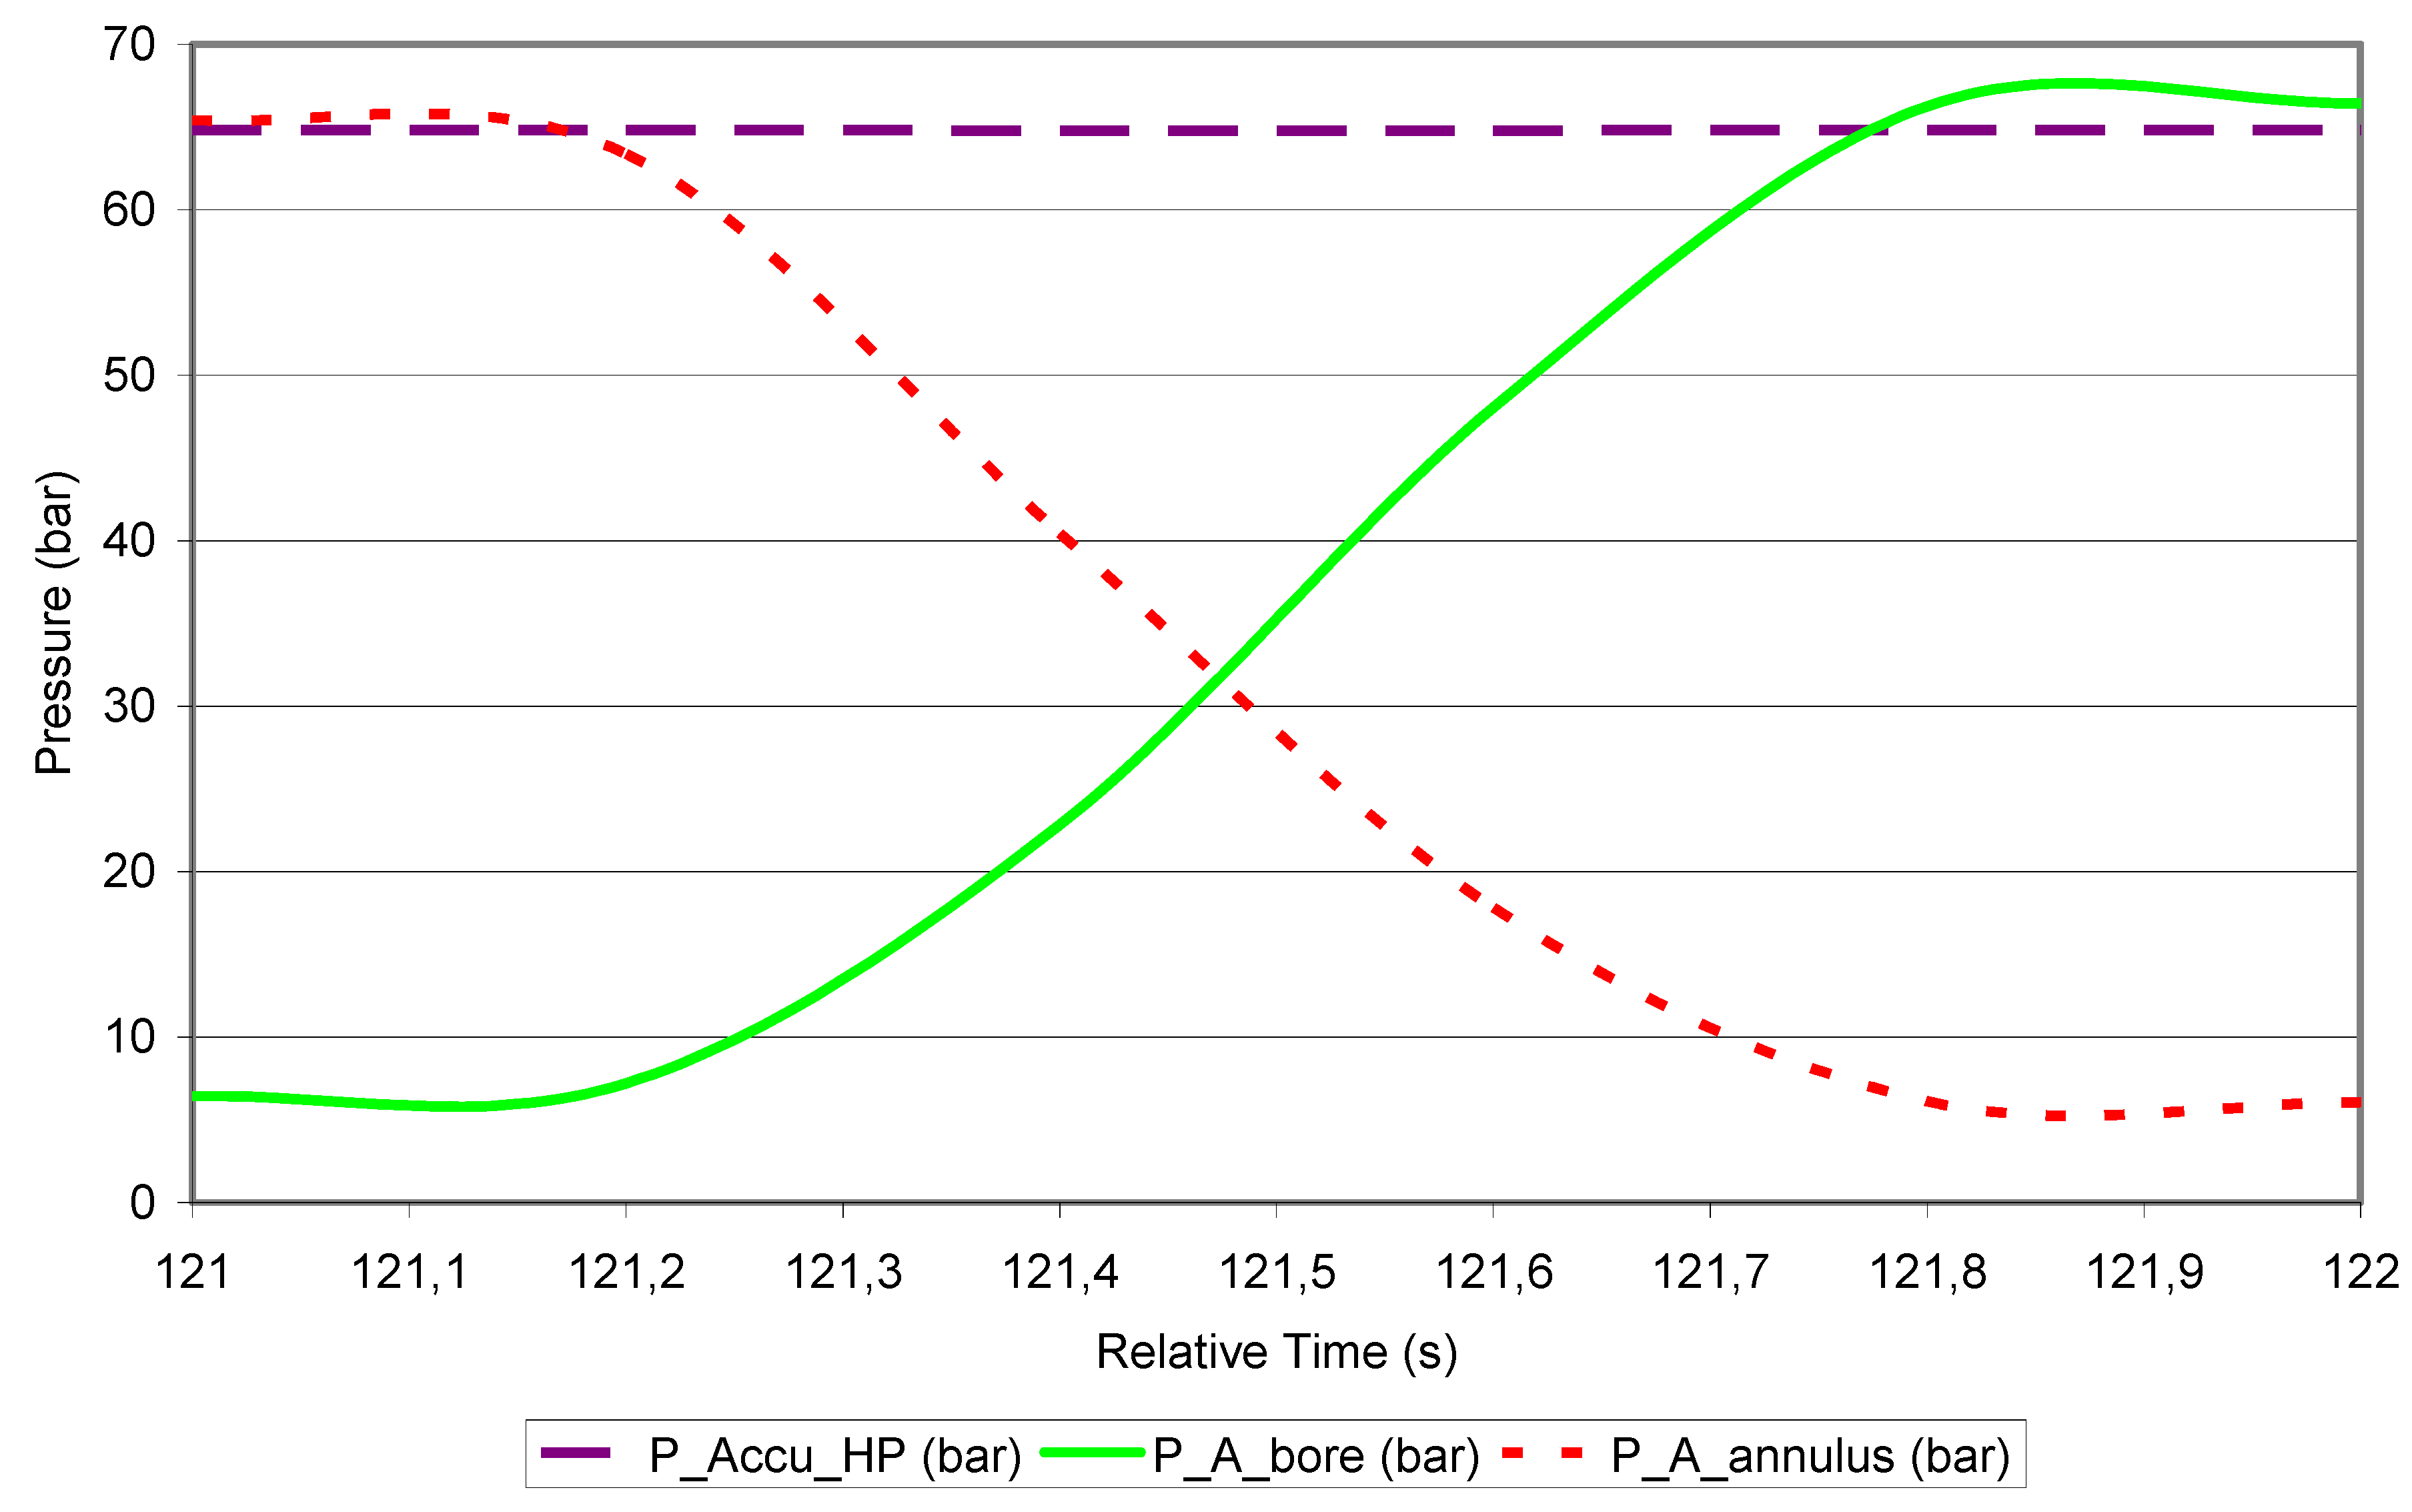
Figure 14 shows the actual pressure values measured on the test bench by means of the pressure transducers installed. They measure pressure in the cylinder bore chamber (green solid line), in the annulus chamber of the cylinder (red dotted line) and in the HP accumulator (purple dash line). The pressure drop measured in this case is 1.7 bar between bore chamber and HP accumulator, and 1.3 bar between annulus chamber and HP accumulator.
Figure 14.
Pressure values measured in the cylinder and HP accumulator (bar).
Figure 14.
Pressure values measured in the cylinder and HP accumulator (bar).
The values differ considerably from simulations to experimental results, with the pressure drop being very low in both cases. The difference must be related to the pressure drops in the electrovalves, check valves and hoses, which are difficult to detail accurately in such a low range with the mathematical equations implemented in the model. The theoretical pressure drop values are adjusted to the new values measured
8.2. Hydraulic Cylinder Pressurization Time
Figure 15 and
Figure 16 analyse the lap of time required by the oil inside the cylinder chambers to reach the pressure in the HP accumulators (added to the pressure drop in the components between both of them) and in this way the cylinder rod start moving. Every lap of time in which the cylinders do not pump oil to the HP accumulator indicates that the rods of the cylinders are not displacing and hence, energy efficiency falls. The graph colours in
Figure 15 and
Figure 16 follow the same criteria as in
Figure 13 and
Figure 14.
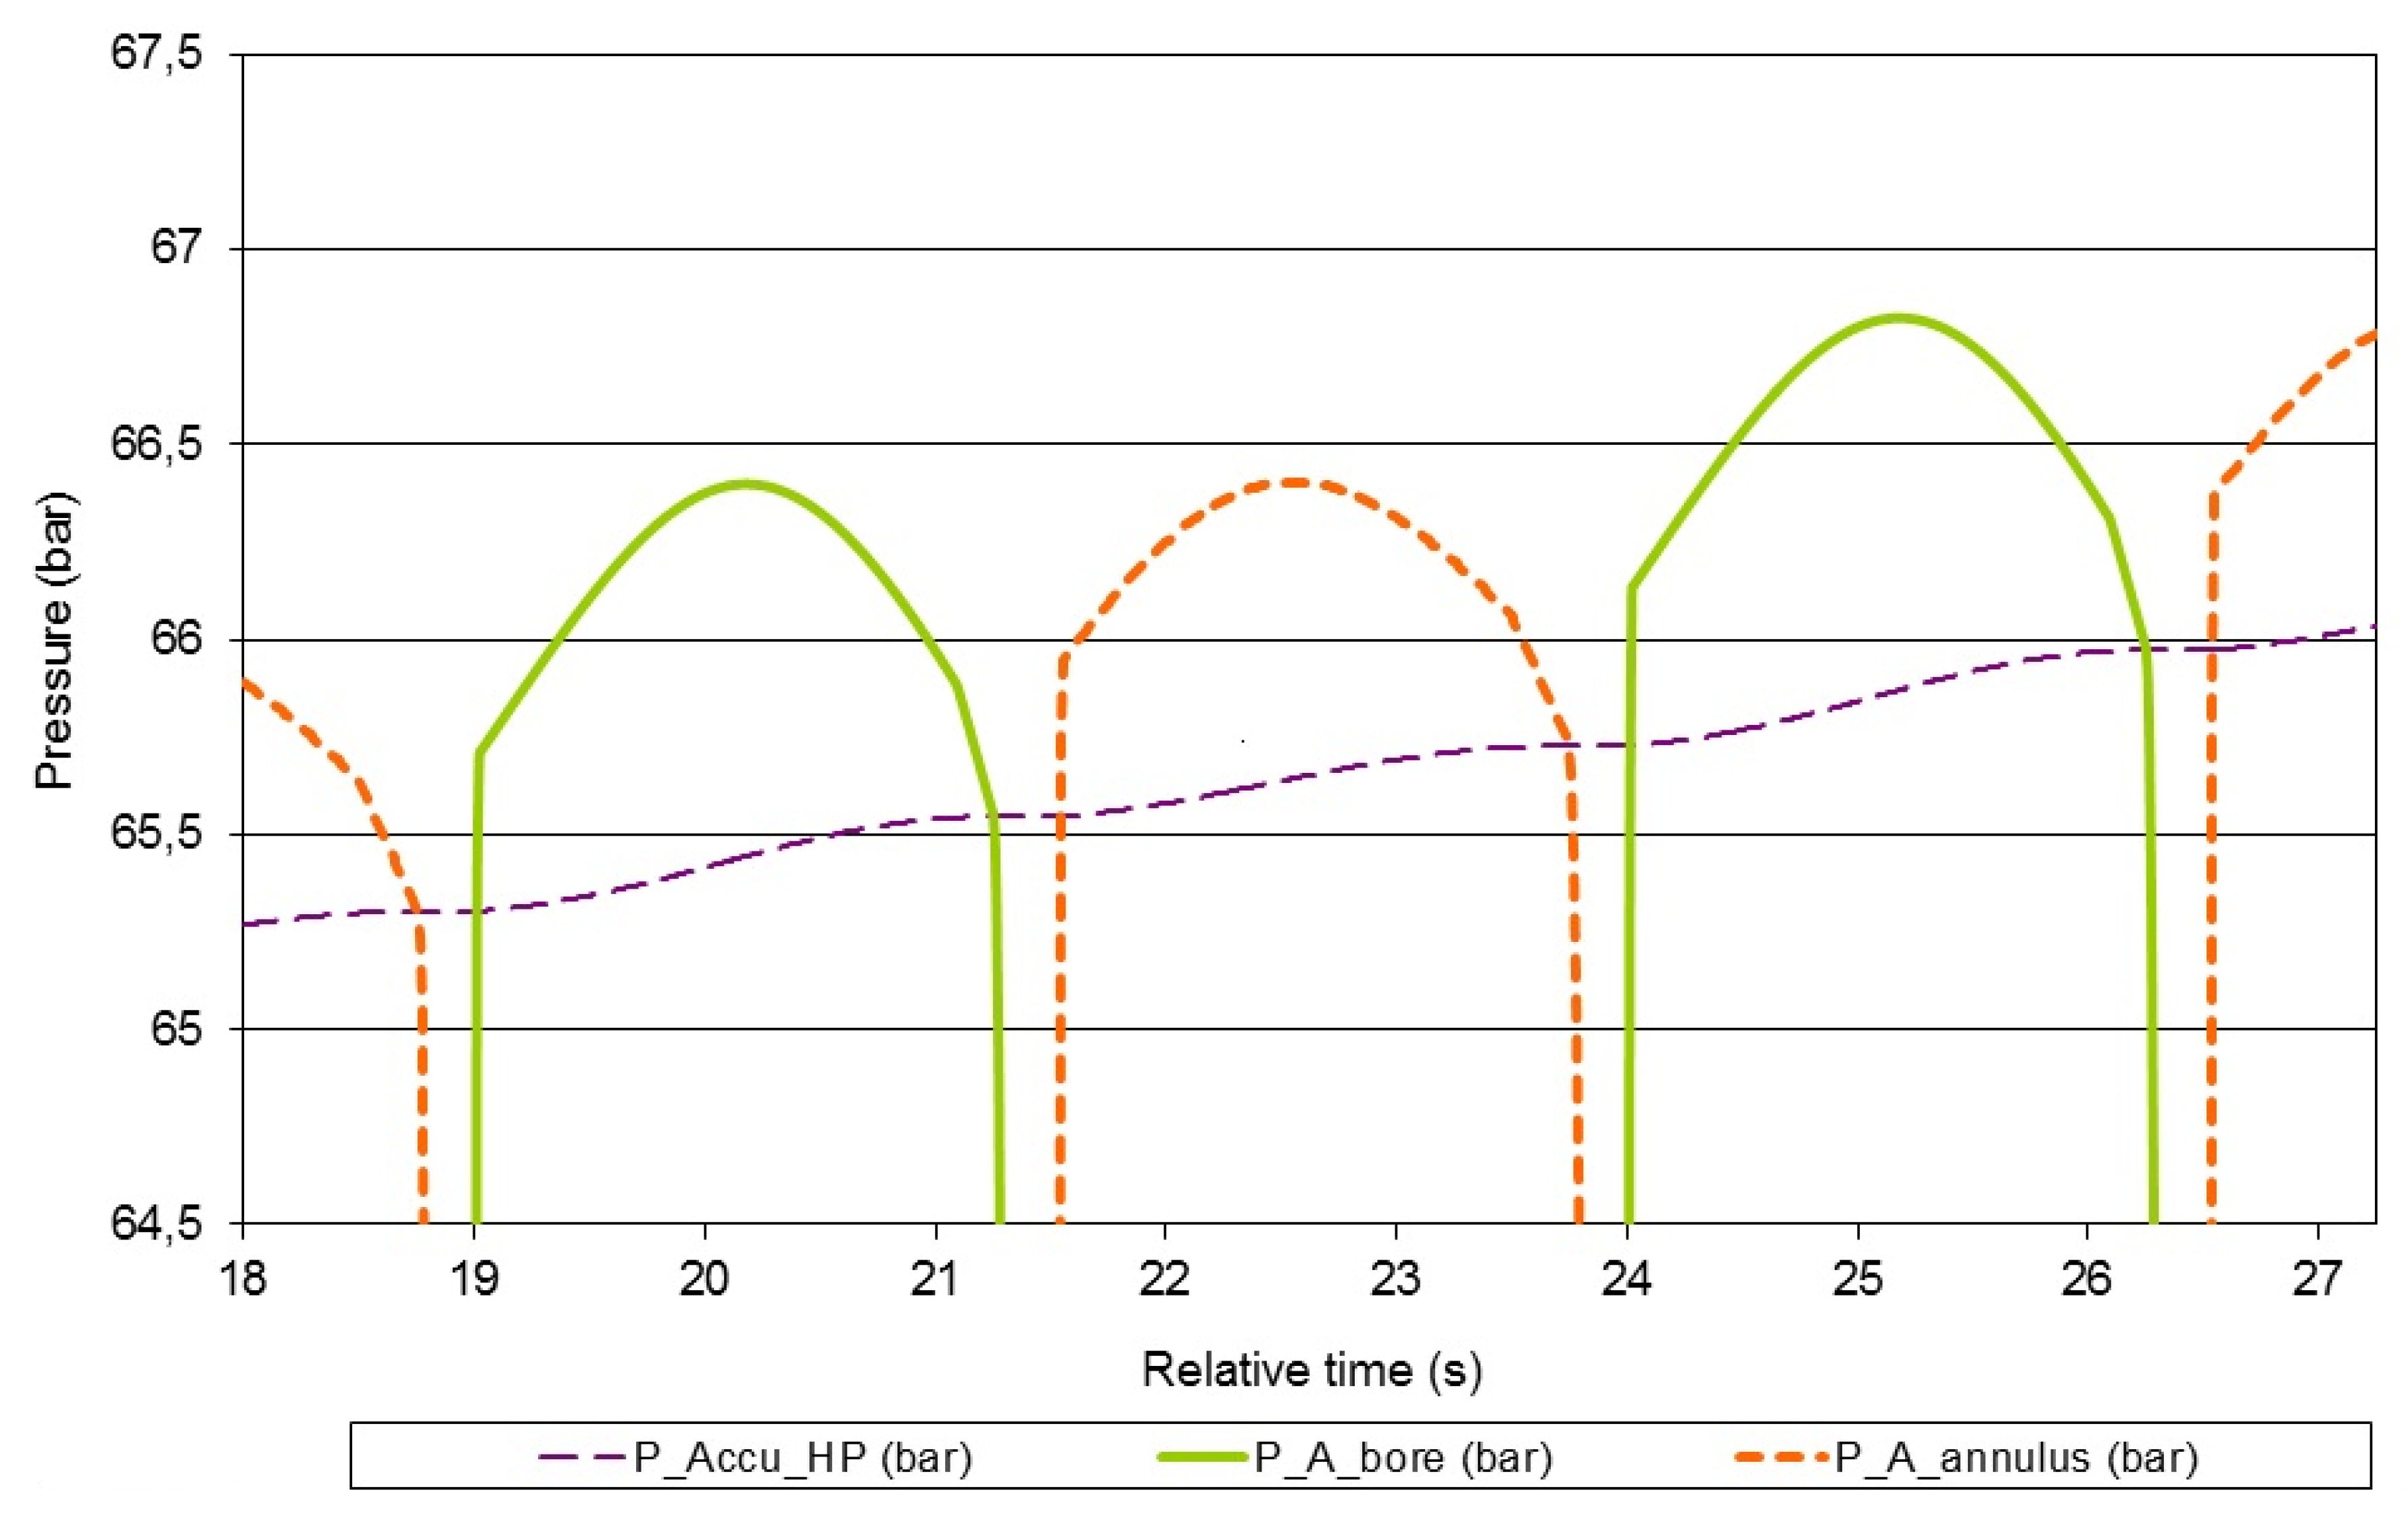
Figure 16 shows that the lap of time required is really important, as it reaches values up to 0.6 and 0.8 seconds, depending on the working chamber of the cylinder. It is very important to determine the cause of this energy loss. Some possible causes could be: the insufficient air draining in the HP circuit and its influence on fluid compressibility, the oil leaks in the electrovalves and/or the pipe wall flexibility.
Figure 15.
Time required in the simulations by the oil in the cylinder chambers to reach the pressure in the HP accumulator.
Figure 15.
Time required in the simulations by the oil in the cylinder chambers to reach the pressure in the HP accumulator.
Figure 16.
Measured lap of time necessary by the oil in the cylinder chambers to reach the pressure in the HP accumulator.
Figure 16.
Measured lap of time necessary by the oil in the cylinder chambers to reach the pressure in the HP accumulator.
Some trials were planned to evaluate the influence of each one of these possible causes on pressurization time.
First of all, the influence of the flexibility of the pipe walls and of the oil leaks in the electrovalves is checked. The flexible pipes that connect cylinder 3 of the array with its corresponding valve block are changed for rigid pipes and the electrovalves of the same valve block are removed for this purpose.
The pressure measurements in cylinders 1(D32/16) and 3 are compared and the conclusion is that power efficiency is higher with flexible pipe installation and the influence of oil leaks in the electrovalves is considered to be negligible. In the case of study, the length of the pipelines between the control valves and the cylinder are 3 meters due to practical (space/layout) reasons. In a real WEC they will be as short as possible in order to reduce pressure losses in the pipeline [
25].
Therefore, the analysis concentrates in the first cause. The drain in closed hydraulic circuits is much more complicated to carry out, especially when the cylinders do not complete full strokes in their usual mode of operation, as in this case. The only way to improve the lead time needed to compress the fluid inside the chambers is to move the rods from one end to the other, driven by an external oil pump, installing draining hoses in the highest points of the circuit. It is necessary to improve the PTO system for removing the residual air in the hydraulic cylinder. As it is measured by Choi [
26], the residual air captured in a hydraulic cylinder can reach up to 15.7% of its volume, which is a considerable quantity.
Oil compressibility is simulated by means of the Equation (2), where the value of the Bulk modulus for oil is 1.8 × 10⁹ N/m2. This value decreases as the percentage of air dissolved in the oil increases. In the simulation, the time required by the oil to reach the pressure in the accumulator is 0.3 seconds. Therefore, it is concluded that the remainder of the time must be due to the presence of air in the circuit and the β modulus is adjusted.
8.3. Adjustment of Volumetric Efficiency Values
The volumetric efficiency of the circuit is calculated with the input flow (of the cylinders) and the output flow (across the hydraulic motor). The mathematical model only takes into account the volumetric efficiency of the hydraulic motor, considering the rest of the components ideal and free of leaks. The electrovalves, HP accumulator, proportional valve and the rest of pipes and hoses are considered to be ideal. The volumetric efficiency of the hydraulic motor is extracted from the curves detailed in the component data sheets. This efficiency is always higher than 0.95. In the model the value of 0.95 is fixed.
The output flow of the cylinders is calculated with the speed signal of the first encoder situated on the entrance shaft of the PTO, while the flow across the hydraulic motor is calculated with the speed signal of the encoder located in the shaft of the hydraulic motor. These two values establish the volumetric efficiency of the complete circuit. With the sensors implemented it is not possible to adjust only the volumetric efficiency of the hydraulic motor, but it is more interesting to introduce the global volumetric efficiency of the circuit in the model.
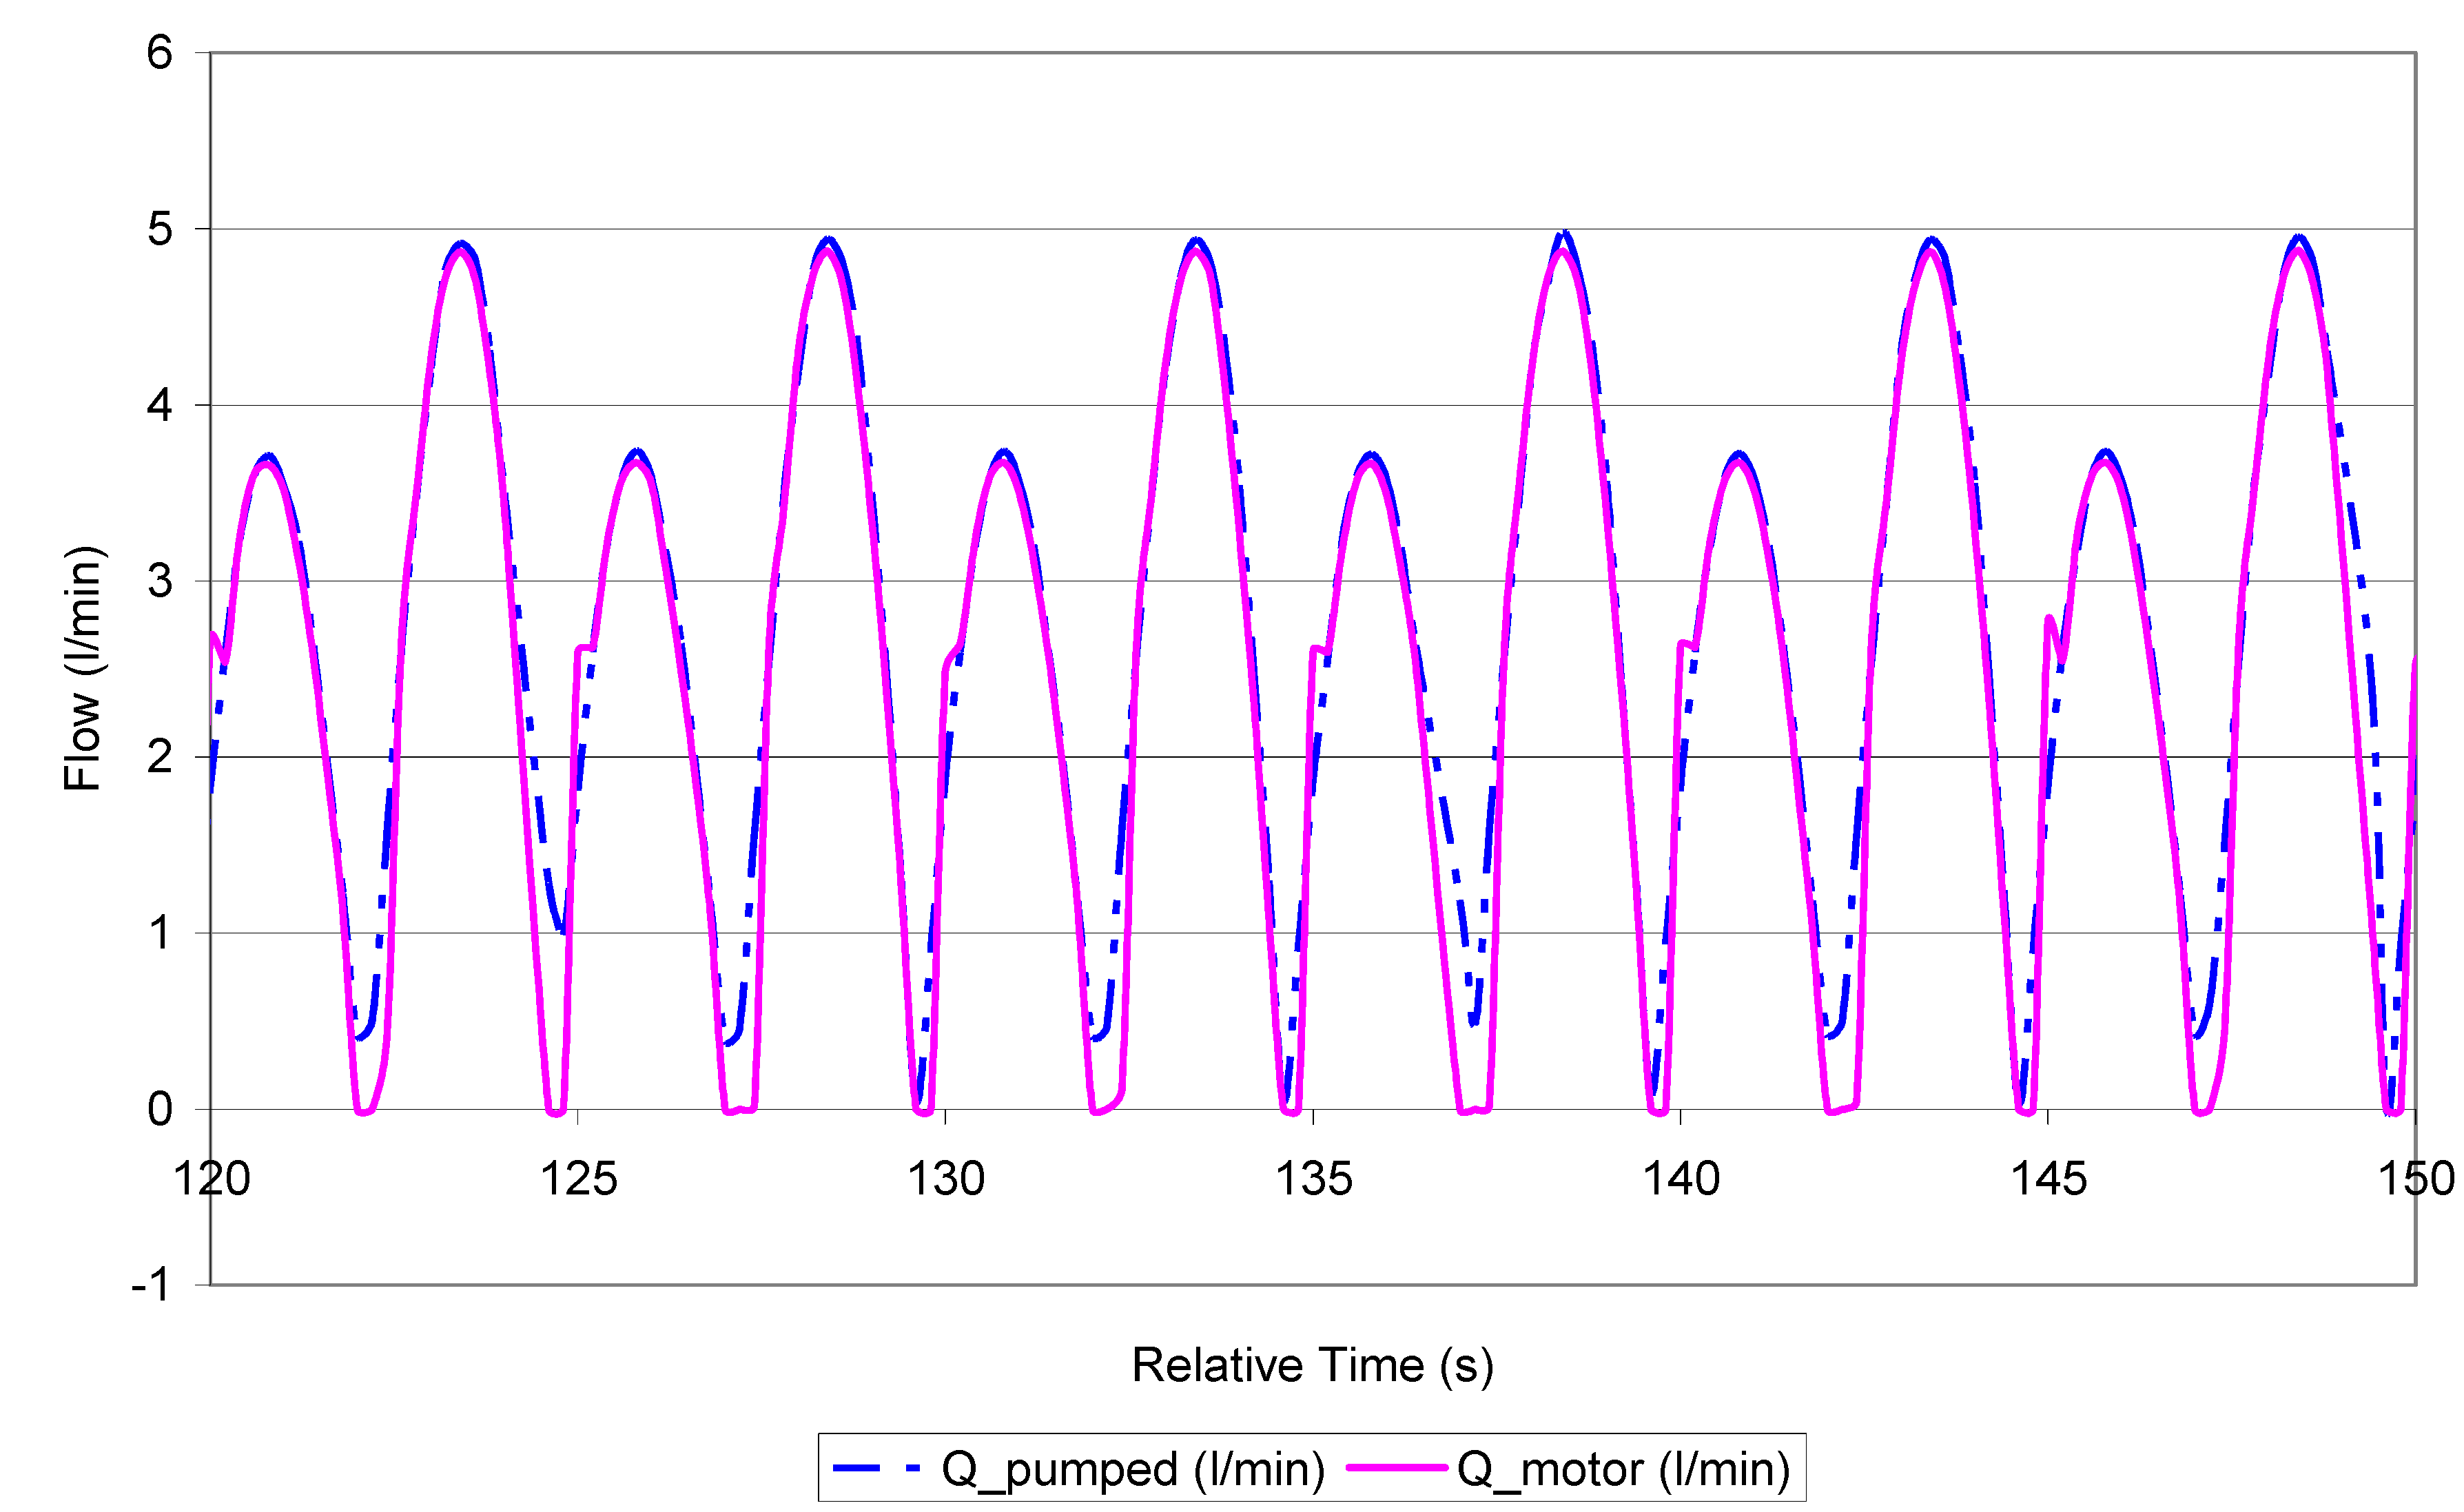
Figure 17 shows the measured input and output flow values, which allow calculation of real volumetric efficiency: 0.94.
Figure 17.
Measured input and output flow values.
Figure 17.
Measured input and output flow values.
9. Power Efficiency Measurements
The difficulty of measuring power efficiency at this stage of the project concentrates on the high pressure drop that is generated in the proportional valve, due to the lack of an electric generator and reactive load coupled to the motor. The electric generator and the reactive load have not been installed yet, so it is not possible to apply closed loop control with pressure feedback to the proportional valve.
This means that the hydraulic motor is working without any restraining torque on its output shaft. So the pressure drop in the proportional valve is approximately the difference between the pressures in the HP and LP accumulators. Depending on the case, this represents a great energy loss. The only way of calculating the global efficiency of the PTO at this stage of the project is to extract all the oil inside the HP accumulator and thus avoid high pressure differences between the HP and LP accumulators.
Table 1 summarizes some power efficiency values achieved by varying the scaled entrance motion conditions and cylinder areas selection for
R 180 mm and
L 30 mm.
Table 1.
Power Efficiency values.
Table 1.
Power Efficiency values.
| η | PTO ENTRANCE MOTION CONDITIONS |
|---|
| Amplitude | ±30 mm |
|---|
| A (cm2) | Frequency | 0.033 | 0.066 | 0.1 |
|---|
| CYLINDERS WORKING AREAS | CASE 1 | Amin | 6.03 | 0.696 | 0.692 | 0.69 |
| Amax | 8.04 |
| CASE 2 | Amin | 15.83 | 0.772 | 0.799 | 0.766 |
| Amax | 19.53 |
| CASE 3 | Amin | 21.86 | 0.729 | 0.751 | 0.725 |
| Amax | 27.57 |
| CYLINDERS WORKING AREAS | CASE 4 | Amin | 29.9 | 0.718 | 0.693 | 0.715 |
| Amax | 33.6 |
| CASE 5 | Amin | 35.36 | 0.775 | 0.737 | 0.718 |
| Amax | 35.36 |
| CASE 6 | Amin | 41.39 | 0.768 | 0.694 | 0.729 |
| Amax | 43.4 |
| CASE 7 | Amin | 49.43 | 0.738 | 0.691 | 0.698 |
| Amax | 49.43 |
The mean power efficiency value is 0.728 and the minimum and maximum values are 0.69 and 0.799 respectively.
10. Flow Rectification Validation Tests Results
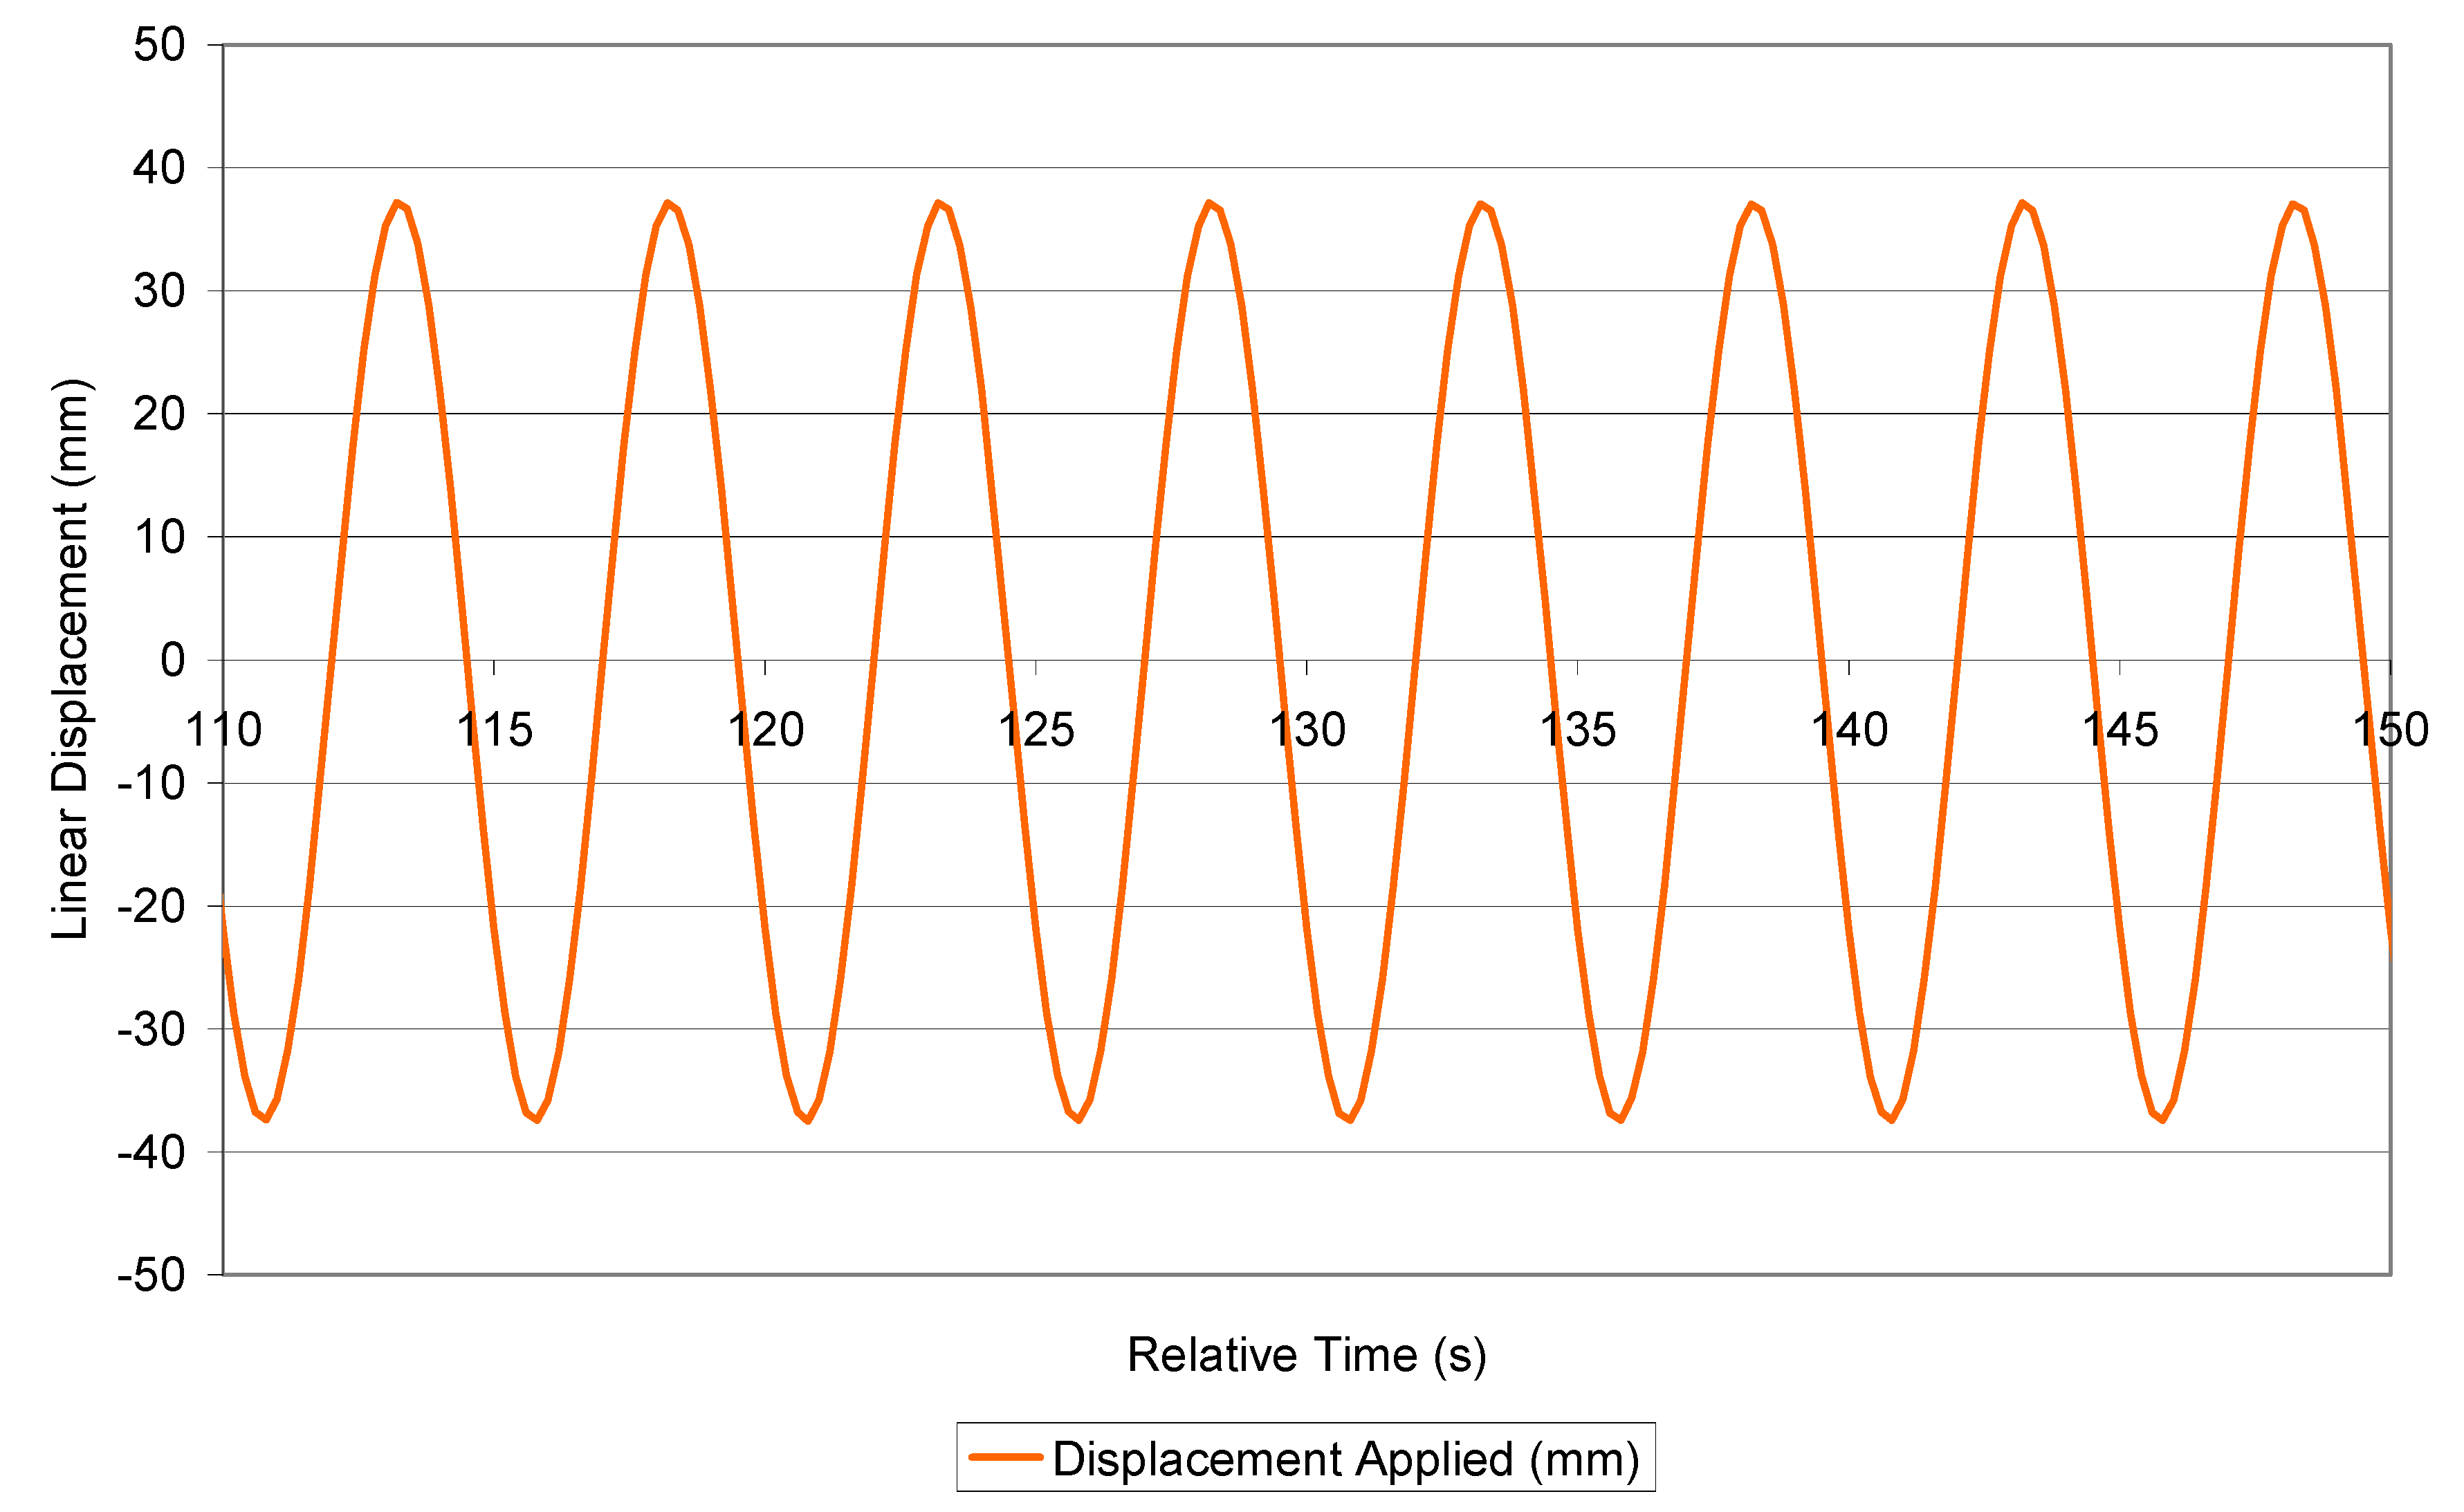
The input signal of the test bench, which drives the PTO, is achieved by applying a closed loop control with position feedback. The servocylinder reproduces the curve shown in
Figure 18, a sine-wave motion with an amplitude of 37 mm and a frequency of 0.2 Hz.
Figure 18.
Input signal of the hydraulic cylinder of the test RIG.
Figure 18.
Input signal of the hydraulic cylinder of the test RIG.
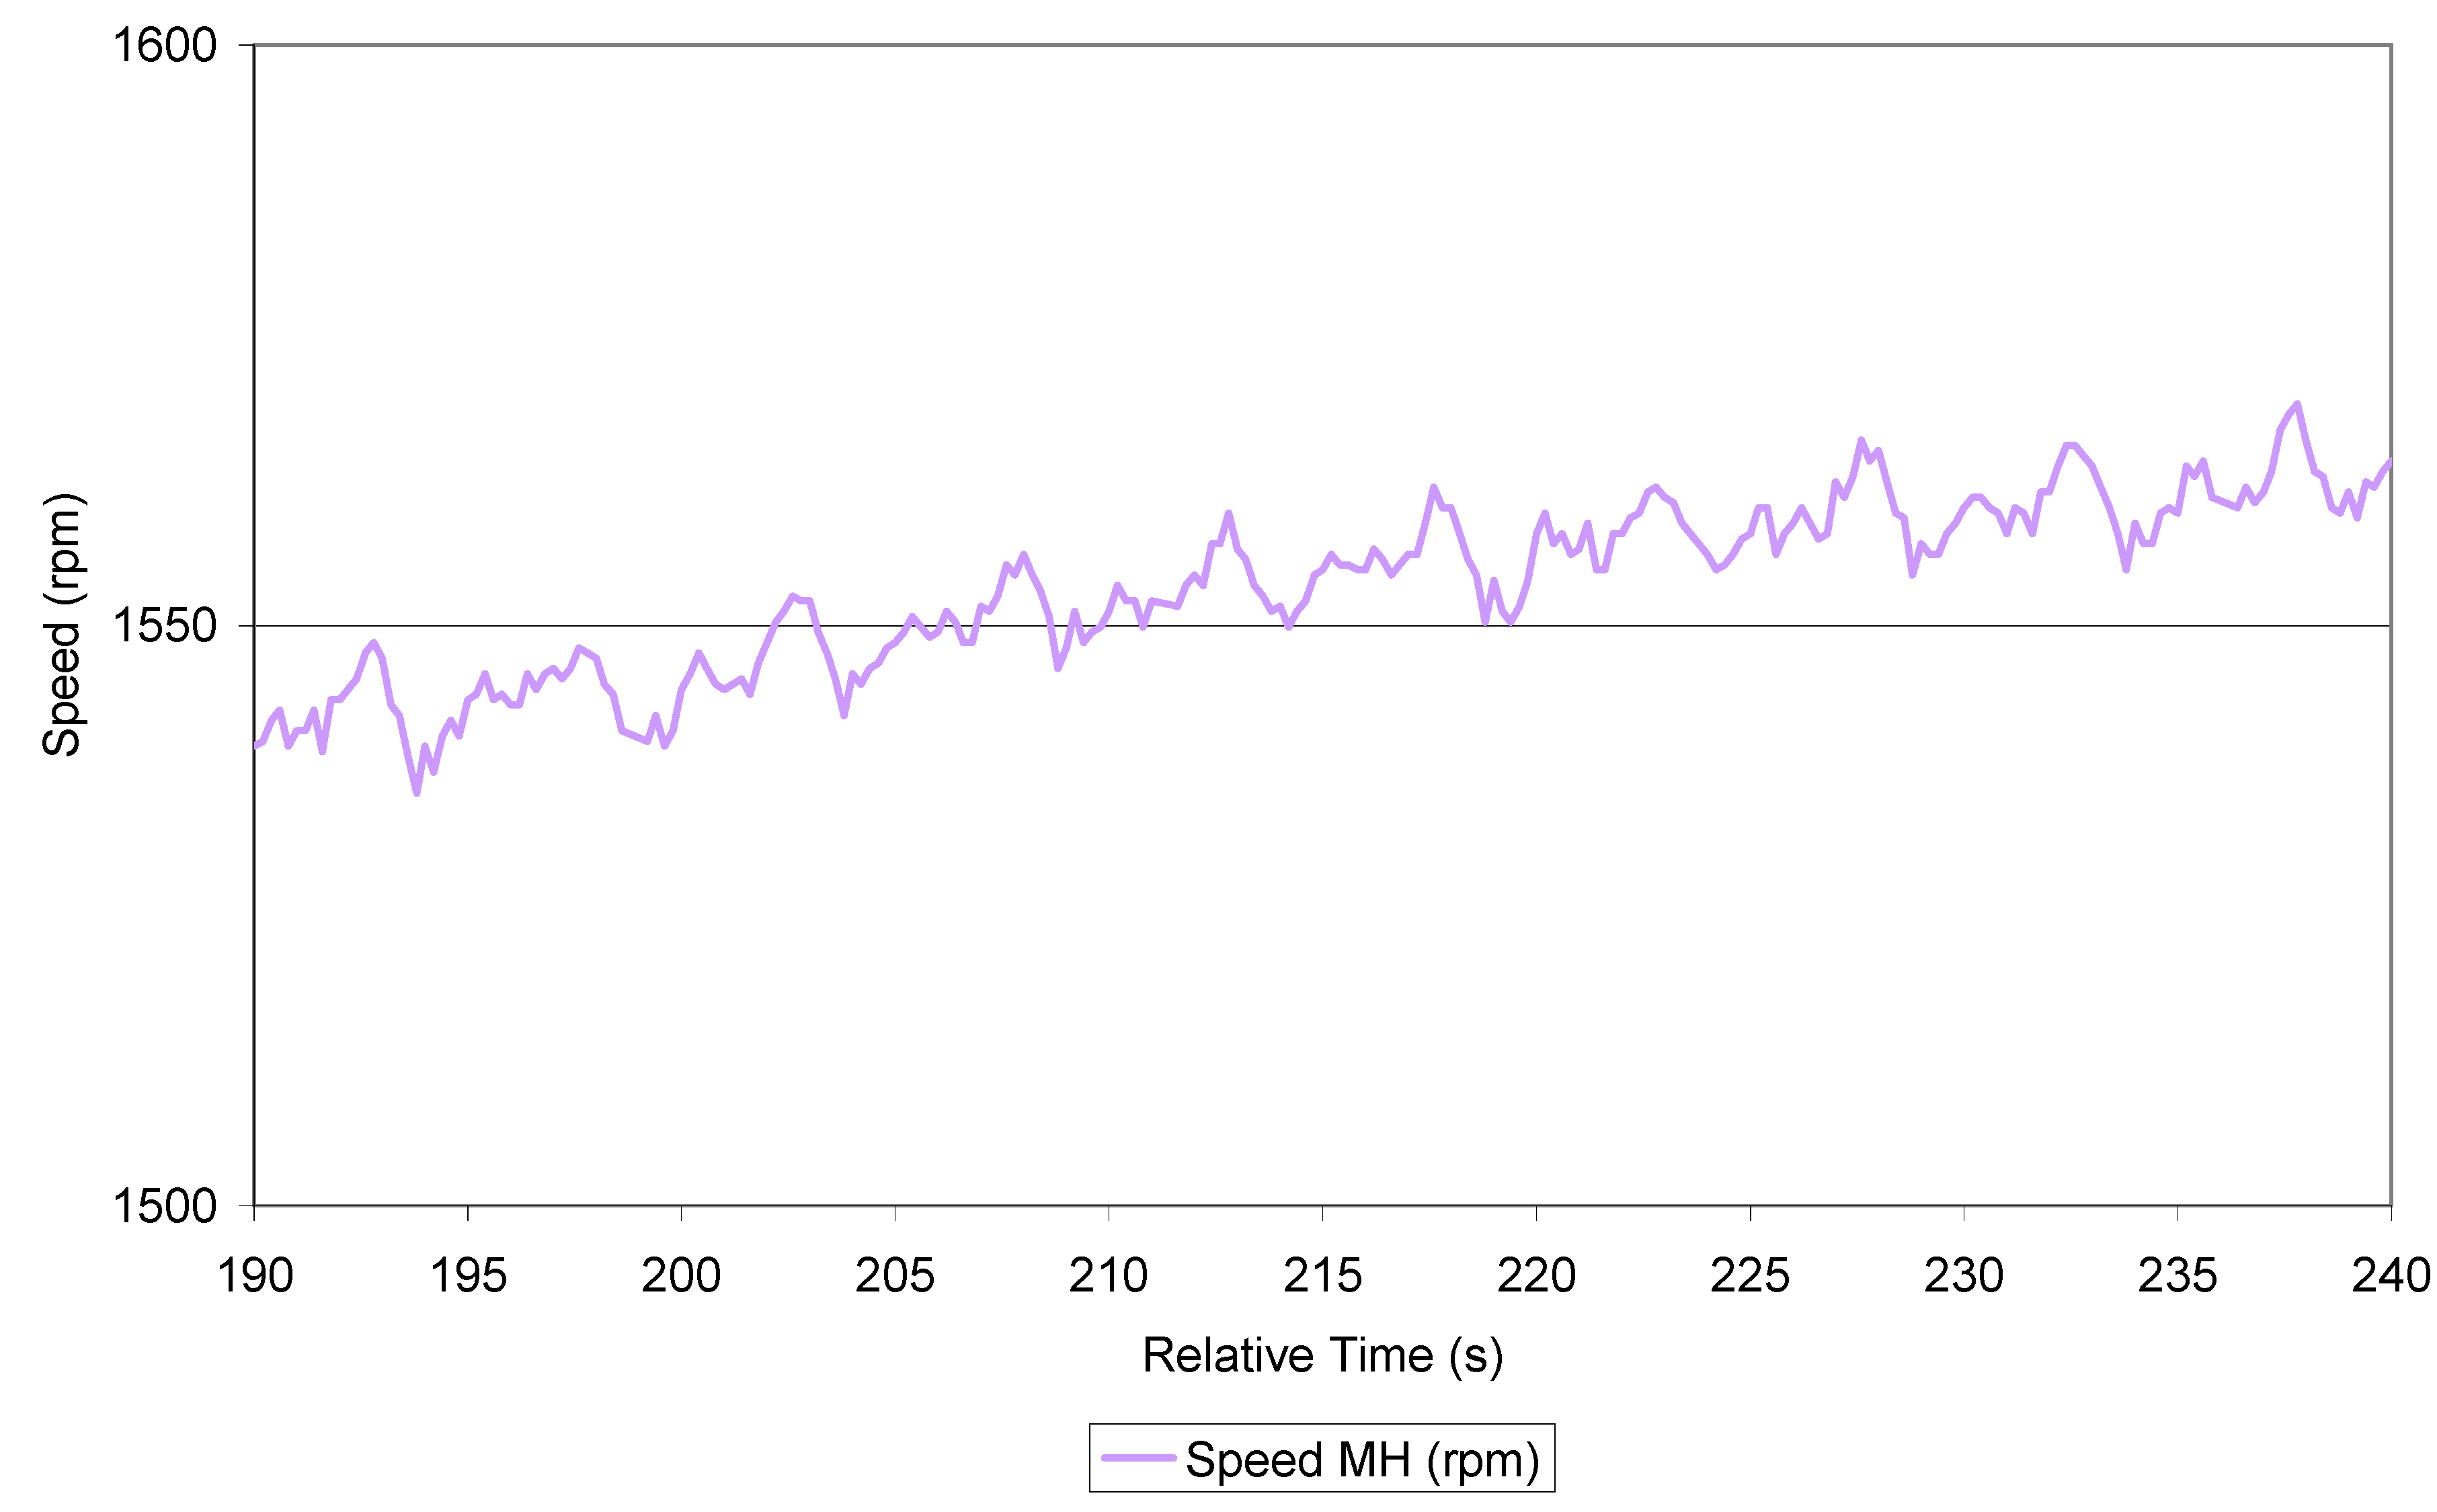
The output speed measured with the encoder is rectified, with a very low ripple. Speed rectification can be described as really satisfactory. Moreover, the low oscillating entrance speed becomes a high output rotation speed, which can be coupled to a conventional generator perfectly. The output speed is shown in
Figure 19.
Figure 19.
Hydraulic motor output speed ripple.
Figure 19.
Hydraulic motor output speed ripple.
11. Conclusions
In the following lines, the main goals achieved during the development of the project are summarized. A universal PTO was designed, which led to an international patent application. With the aim of dimensioning the main components and analyzing the dynamic behavior of the device, a mathematical model of the PTO was performed with Matlab/Simulink. After the promising results of the simulations, a first prototype of this PTO was built and assembled on the Tecnalia test rig, where different ECD motions can be simulated. The test rig is enabled to carry out dynamic tests of the PTO and the results of these tests have been used to calibrate the mathematical model. The efficiency values of the PTO are promising and the dynamic performance test results are very positive.
12. Future Steps
According to the tasks already carried out, a list of milestones within the project have been identified. The generator and the reactive load have not yet been installed but they will be included in future testing phases. The reactive load should be adjusted according to the pressure in the HP accumulator to achieve optimum behaviour of the proportional valve, in order to achieve this goal the control strategy should be developed and implemented.
On the other hand, some flowmeters will be installed in the circuit to determine the behaviour of the circuit and the volumetric efficiency values more precisely. Once the above tasks have been executed, a test matrix should be projected to analyse the different alternatives of the variation of the P, R, L and A parameters with the main purpose of optimizing power conversion. Furthermore, the system should be adapted to the requirements of a specific energy capture device (for example, a gyroscope), for modeling and testing and to observe in this way its dynamic performance in a real application.


