Article

Cost and CO2 Emission Optimization of Steel Reinforced Concrete Columns in High-Rise Buildings

1
Department of Architectural Engineering, Yonsei University, 50 Yonsei-ro, Seodaemun-gu, Seoul 120-749, Korea
2
Center for Structural Health Care Technology in Buildings, Yonsei University, 50 Yonsei-ro, Seodaemun-gu, Seoul 120-749, Korea
3
Library, Yonsei University, 50 Yonsei-ro, Seodaemun-gu, Seoul 120-749, Korea
*
Author to whom correspondence should be addressed.
Energies 2013, 6(11), 5609-5624; https://doi.org/10.3390/en6115609
Submission received: 29 August 2013 / Revised: 3 October 2013 / Accepted: 14 October 2013 / Published: 25 October 2013
(This article belongs to the Special Issue Energy Efficient Building Design 2013)

Abstract

:
The construction industry is a representative industry that consumes large amounts of energy and produces substantial pollution. The operation of a building accounts for a large portion of its total CO2 emissions. Most efforts are focused on improving the energy efficiency related to the operation of a building. The relative importance of the energy and CO2 emissions from the construction materials increases with the increasing number of low-energy buildings. To minimize the life-cycle energy use of a building, the energy consumed from both materials in the construction phase as well as the energy consumed from the operation of the building must be reduced. In this study, an optimal design method for composite columns in high-rise buildings using a genetic algorithm is proposed to reduce cost and CO2 emissions from the structural materials in the construction phase. The proposed optimal method minimizes the total cost, including the additional cost calculated based on CO2 emissions from composite columns, while satisfying the structural design criteria and constructability conditions. The proposed optimal method is applied to an actual 35-story building, and the effective use of structural materials for the sustainable design of composite columns is investigated. It is shown that using more concrete than steel section and using high-strength materials are economically and environmentally effective methods.

1. Introduction

According to the International Energy Agency (IEA), CO2 emissions due to the energy consumed by buildings account for approximately 24% of all CO2 emissions [1], and in the United States, approximately 54% of that energy consumption is directly or indirectly linked to buildings and their construction. Commercial and office buildings account for a large portion of this figure [2]. Accordingly, in the construction industry, various studies to reduce CO2 emissions have been actively conducted since the 2000s. These studies have included the development of the Life-Cycle Assessment (LCA) model [3], the development of environmentally friendly facilities and materials [4,5,6], and green building design [7]. Most of these studies have focused on the CO2 emissions generated during building operation because the largest amount of CO2 is generated in the operation stage [8].
The Intergovernmental Panel on Climate Change (IPCC) stated that CO2 emissions should be reduced in all stages where reduction is possible, regardless of the amount of emissions [9]. Furthermore, the need to consider the embodied energy of building materials increases with the increasing number of low-energy buildings [10,11,12]. To enable environmentally friendly construction, buildings should be designed to reduce their CO2 emissions from the earliest design stages. CO2 emissions can be reduced in the early stages by using novel building materials, such as low-carbon materials, and by recycling [6,8,13,14,15]. Additionally, CO2 emissions can be reduced by reflecting the unit CO2 emission of each structural material in the design stage [16,17,18,19,20].
Previous studies that considered environmental impacts in the structural design stage have typically used optimal design methods [16,17,18,19,20]. Moon [16] proposed an optimal design method for steel frame structures that minimizes the total weight of steel material to produce sustainable structural designs. However, in contrast to steel frames, the total amount of CO2 emissions for reinforced concrete (RC) and composite structures, composed of different materials (steel and concrete), can vary depending on the ratio of each material though the total weights are same. This is because the unit price and CO2 emissions for two structural materials are different, respectively. Thus, to reduce the CO2 emissions of RC or composite buildings, it is necessary to establish correlations between different materials and minimize the total amount of CO2 emissions from all materials. Yeo and Gabbai [17] suggested an optimal design method to reduce either the embodied energy or structural cost of a RC beam, and they investigated the contributions of concrete and steel reinforcements to the embodied energy and cost for a given loading condition. Yeo and Potra [18] suggested an optimal design method to reduce either the CO2 emissions or structural cost of a RC moment frame. It was found that the optimization with respect to the CO2 emissions resulted in an increase in the relative amount of steel within the RC members. Paya-Zaforteza et al. [19] proposed an optimal design method to reduce either the CO2 emissions or structural cost of RC frame structures by using a simulated annealing (SA) method, and they confirmed that a more efficient structural design can be produced by using the various material strengths for both steel reinforcement and concrete. Paya et al. [20] suggested a multi-objective design methodology with the four objective functions for RC-frame structure design: structural cost, environmental impact, constructability, and overall safety.
As the building increases in height, vertical columns in a high-rise building are subjected to large axial loads because of the effect of gravity on a large number of floors. In general, the size of a column in a high-rise building tends to increase with the increasing height of the building. However, the size of a column section is generally limited by the architectural plan, which tends to maximize the working or residential space. To increase the strength of a column without increasing its cross-sectional size in a high-rise building, composite columns can be used in place of RC columns [21]. In medium- and high-rise buildings, hot-rolled or welded steel sections are combined with concretes such that the structural and economic advantages of the two materials are efficiently used for construction. Although previous research [17,18,19,20] has demonstrated that the suggested optimal design methods can effectively reduce CO2 emissions, there are limitations that should be overcome before the methods are applied to composite columns in actual buildings because most of the studies were performed with RC structures. The optimization methods for composite members are required because the mechanical mechanism and structural design criteria of composite members are different from those of RC members.
In most optimization research on the structural designs of buildings, the total cost or weight are typically minimized. However, for the sustainable design of buildings, the embodied energy or CO2 emissions should also be considered and minimized during the structural design phase of a building [17]. According to the Kyoto Protocol, CO2 emissions can be transformed to cost. In fact, the certified emissions reductions (CERs) that comprise the carbon credits issued by the Clean Development Mechanism (CDM) Executive Board for emission reductions can be traded in emission trade markets, such as the European Union Emissions Trading Scheme [22]. Therefore, the additional costs from CO2 emissions must be considered when evaluating the cost of building design and producing a cost-effective building during the structural design phase. However, existing studies [16,17,18,19,20] have not considered such costs including the additional cost from CO2 emissions.
In this study, an optimal design method for composite columns in high-rise buildings to minimize the CO2 emissions and cost of a structural design is presented. To consider the CO2 emissions and cost simultaneously, the total amount of CO2 emissions is converted to cost using the concept of CERs. Then, the proposed optimization method minimizes the total cost, including the additional cost generated from CO2 emissions, while satisfying the stress constraint and constructability constraints. The cross-sections of members are used as the design variables in the proposed optimal design method. The proposed optimal design method employs a genetic algorithm (GA) as an optimization tool and considers the unit prices and CO2 emissions for the various strengths of concretes and steel sections. To reduce the computation time and improve the searching capability of optimal solutions, the constraint conditions on the constructability are considered as the side-constraint conditions. Thus, the candidate designs generated in the optimization process are automatically modified to satisfy the constraint conditions on the constructability. The proposed optimization method can be applied to the structural design of composite columns in a building frame structural system. In the proposed optimization method, the constraint on the lateral drift is not considered because the structural design of columns in the building frame system is determined based on the assumption that the columns support only the gravity load. And the assumption that the internal forces of column members are constant is employed to simplify the optimization process. At the final step in the proposed optimization process, the structural design check for the optimum design obtained from the simplified optimization process is performed to overcome the limit of optimization process due to the simplification. The condition on the lateral drift is checked at this final step. The optimal design method is applied to the structural design of composite columns in an actual 35-story building. The effects on the relative weight ratios of concretes and steel sections in the composite columns are investigated in terms of the environmental friendliness and economic feasibility of the structure.
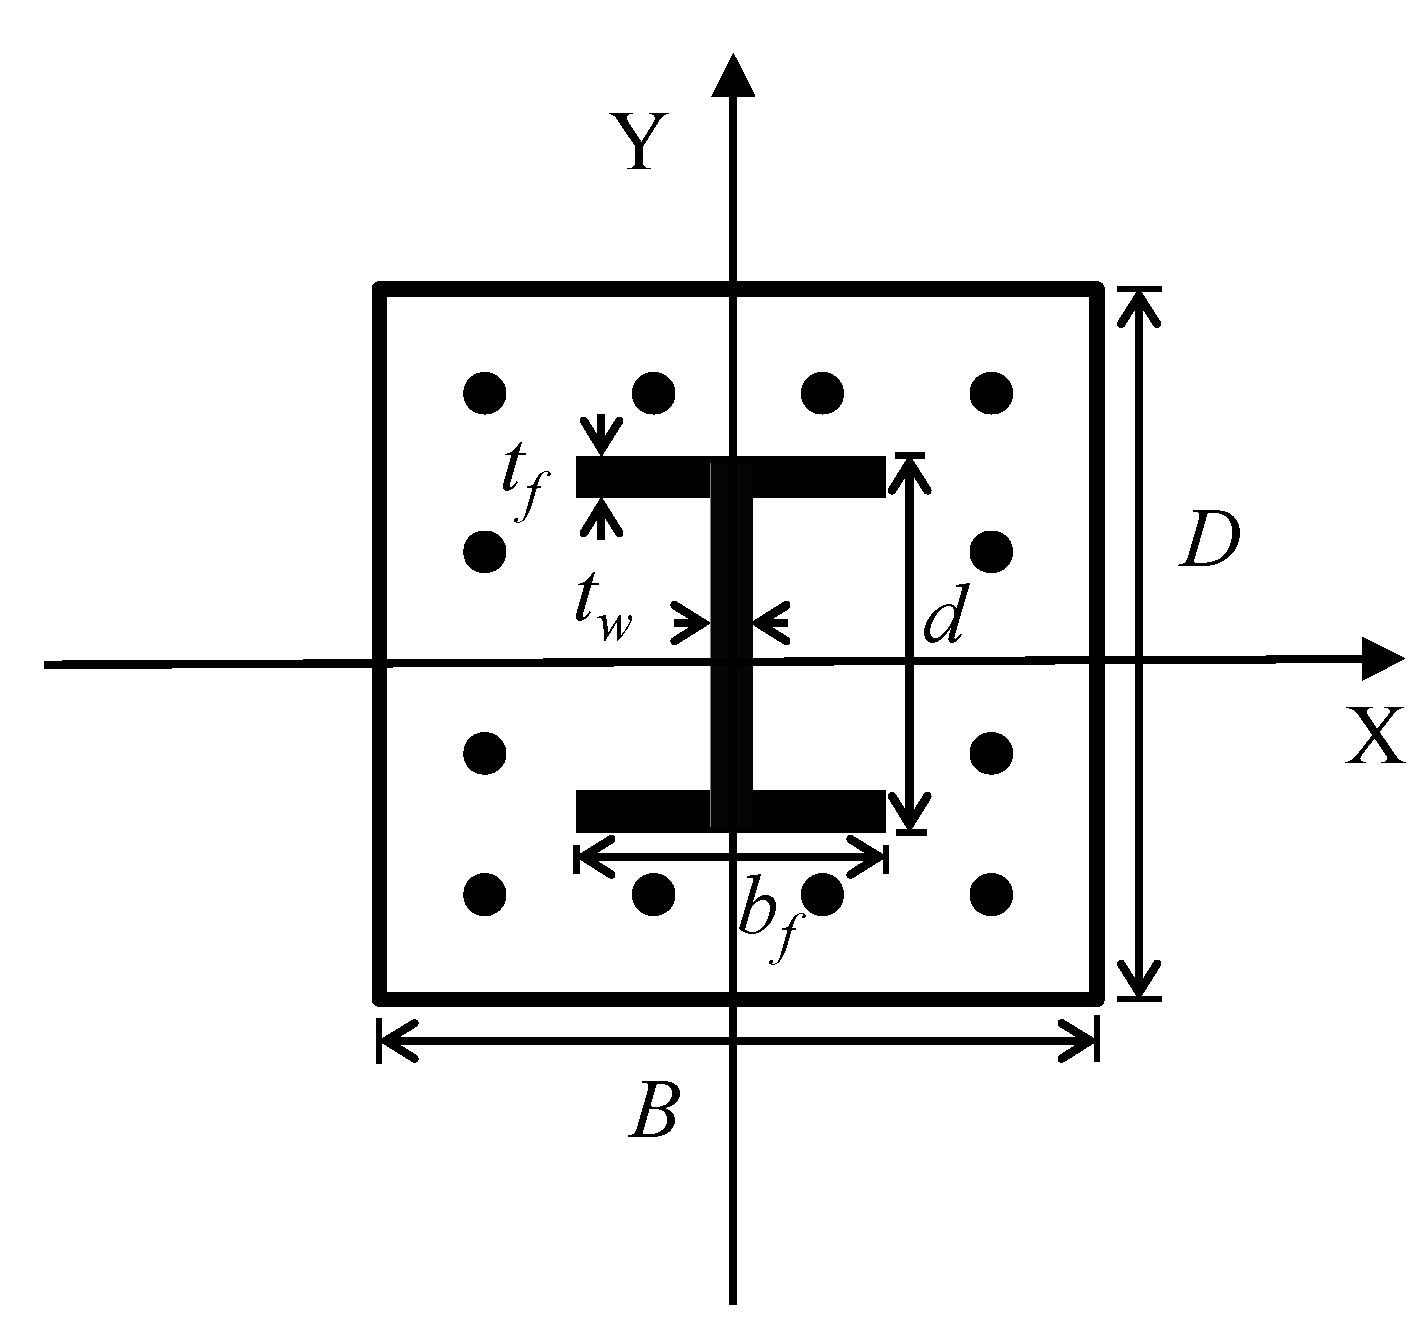
2. Steel Reinforced Concrete (SRC) Columns in a Building Frame System

The optimization subject of this study is SRC columns, which are composed of concrete with an embedded steel section, as shown in Figure 1, to increase the strength of the column. SRC columns are often employed as the vertical columns in the building frame system to carry axial loads. The building frame system is limited to cases in which more than 75% of the horizontal force is shared by the core shear walls [23]. All of the horizontal force is supported by the core shear walls, and the gravity load is supported by the moment frames. Because the columns support only the gravity load in the building frame system, the variation of the load applied to the column cross-section in the optimization process is the variation of the weight of the columns themselves. Because the variation is relatively minor when compared to the total gravity load supported by the columns, the load on the columns and the axial force of the members can be considered constant during the optimization process. Thus, the suggested optimization technique does not require a repetitive structural analysis, and it can be practically applicable even for high-rise buildings containing many members. Generally, for high-rise buildings, a building frame system is frequently applied as the structural system to control roof drift. Therefore, the proposed optimization technique can be applied to the design of many high-rise buildings.
Figure 1. Typical cross-section of steel reinforced concrete (SRC) columns.
Energies 06 05609 g001

3. Optimization Methodology

3.1. Formulation of the Optimization Problem

The objective function of this study is to minimize the structural cost and CO2 emissions of SRC columns. To consider the structural cost and CO2 emissions simultaneously, CO2 emissions are converted to cost by using the unit carbon price, and then the total cost including the additional cost from CO2 emissions is minimized. The structural cost and CO2 emissions are calculated based on the cross sectional properties of each member, as shown in Equation (1) [17,24]. The costs and CO2 emissions generated from concrete and steel section at each member are calculated based on the volumes of concrete and steel section used at each member. The total costs and CO2 emissions generated from concrete and steel section at the column line are the sum of costs and CO2 emissions generated from concrete and steel section at all member. The factors influencing on the costs and CO2 emissions generated from concrete and steel section at each member are the unit price and CO2 emissions of structural materials, the cross-sectional areas of concrete and steel section:
M i n i m i z e     f = f 1 + f 2 = i = 1 M { A s t l i L i C s t l + A c o n i L i C c o n } + C P i = 1 M { A s t l i L i E s t l + A c o n i L i E c o n }
where f1 and f2 are the structural cost and the CO2 emissions for each column line, respectively; A and L are the cross-sectional area and length of each member, respectively; C and E are the cost and CO2 emissions per unit volume, respectively; M is the number of members; the subscripts stl and con represent steel section and concrete, respectively; CP is the carbon unit price, which was assumed to be 13.97 USD/ton-CO2; and the concrete cross-sectional area Acon of the SRC column is the area obtained by subtracting the areas of the steel section and steel reinforcements from the gross area of the member. In the proposed optimization process, only the depth and width of the cross section of the member, the cross-sectional properties of the steel section, and the strengths of the concrete and steel section are allowed to vary. The costs and CO2 emissions of steel reinforcement are excluded in the proposed optimization process.
The stress condition and constructability conditions for SRC columns are employed as the constraint conditions, as shown in Equations (2)–(5):
σ a c t u a l i σ a l l o w i 1.0 , i = 1   to   M
A g i + 1 A g i 1.0 , i = 1   to   M 1
S s t l i + 1 S s t l i 1.0 , i = 1   to   M 1
F y i + 1 F y i 1.0 , i = 1   to   M 1
where σallow and σactual are the allowable and actual stresses of each SRC column member, respectively; Ag is the gross cross-sectional area for each member; Sstl is the inner dimensions of the steel section; and Fy is the yield strength of the steel section. The superscripts i and i + 1 represent two neighboring floors. Equation (2) represents the stress constraint, which must not exceed 1.0 [25]. Equation (2) is evaluated by using Equation (6) according to the reference [25]. The interaction of axial force and bending moments is considered:
( f a F a ) 2 + C m x ( 1 f a F e x ' ) f b x F b x + C m y ( 1 f a F e y ' ) f b y F b y 1.0
where fa and fb are the computed axial stress and the computed bending stress, respectively; Fa, Fb and F e y ' are the axial stress permitted in the absence of bending moment, the bending stress permitted in the absence of axial force, and Euler stress divided by factor of safety, respectively; and Cm is the coefficient applied to bending term in interaction formula.

3.2. Proposed Optimization Technique

If the optimization problem proposed in Section 3.1 is applied to a 60-story building, and the steel sections comprising the SRC column line are divided into three floor groups (as is generally performed in steel-framed structures), the number of design variable for the steel section of each column is 20. Each design variable selects one section from the available section list for a member. If the available section list has a total section number of 3584, the number of design alternatives for one column line is 203584. The design alternative must satisfy the stress and constructability constraints. Furthermore, because the cross-sectional properties of steel sections are discrete, the structural optimization must be formulated using discrete design variables. Therefore, a heuristic technique that does not require a differential is appropriate when the search of such a space of solutions and characteristics of design variables are considered. In this study, the GA is employed.
GA is a heuristic technique that finds an optimal solution by using genetic operators, regardless of the possible differentials of the objective function and constraints. The excellent solution-searching capability has been applied to various engineering solutions [26,27,28,29,30,31,32,33]. The population of individuals (candidate designs) evolves by genetic operators, such as crossover, mutation, and selection, so that the algorithms find an optimum solution.
The cross-sectional properties of the structural members are used as design variables. Table 1 defines the cross-sectional properties for each design variable. In total, there are 512 cross sections comprising 23 SM490 rolled, 31 SM490 built-up, 132 SM490 TMCP, 163 SM520 TMCP, and 163 SM570 TMCP. For each cross section in Table 1, one of seven different concretes (21, 24, 27, 30, 35, 40 and 50 MPa) can be used as the strength of concrete. Thus, the total number of available sections for SRC columns is 3584 (=512 × 7). The yield strength of the SM490 rolled and SM490 built-up is 325 MPa when the thickness of the web (tw) and flange (tf) are less than 40 mm; the yield strength is 295 MPa when the tw and tf are thicker than 40 mm. The yield strengths of SM490 TMCP, SM520 TMCP, and SM570 TMCP are 325, 355 and 440 MPa, respectively, regardless of thickness. The concrete covers are set to be within a range of 150–230 mm.
To evaluate the objective function, the unit cost and CO2 emissions of the steel section and concrete must be determined. However, the CO2 emissions per unit differ for each country, so each country’s index must be used for accurate evaluation [34]. The CO2 emissions per unit listed in Table 1 and Table 2 are based on an input-output analysis from the Korea LCI Database Information Network [35,36].
Table 1. Available section list for SRC columns.
No.Member sizeType of steel sectionCost (USD/m)CO2 (kg-CO2/m)
D (mm)B (mm)d (mm)bf (mm)tw (mm)tf (mm)
1450450200200812SM490 rolled33.02251.15
237007004284072035SM490 rolled191.421456.02
246006003003001015SM490 built-up76.78583.99
406506503503503030SM490 built-up196.791496.82
548008004404003535SM490 built-up271.332063.80
558008004504002040SM490 TMCP268.952045.71
1109009005304007080SM490 TMCP621.914,730.36
186110011007306008080SM490 TMCP979.557450.72
1876006003003001015SM520 TMCP79.46604.37
2809509505905005060SM520 TMCP581.104,419.98
349110011007306008080SM520 TMCP987.747,512.96
3506006003003001015SM570 TMCP88.80675.46
4208508505104006070SM570 TMCP598.064548.96
512110011007306008080SM570 TMCP1082.938236.99
Four constraints are considered in this study. The computation time for convergence increases with an increasing number of constraints. To reduce the computation time, the constructability constraints shown in Equations (3)–(5) are considered as side constraints. In other words, because the constructability constraints can be checked using only the values of design variables, the values of design variables of each individual are checked to determine whether the constructability constraints are satisfied. If constructability constraints are not satisfied, the values of the design variables are modified to satisfy the constraints. Thus, when the gross cross-sectional area of a member and the inner size of a steel section do not satisfy Equations (3) and (4), a smaller section for the member on the upper floor is selected from the list, and the strength of the steel section is fixed. This process is repeated until the constraint is satisfied. When the strength of the steel section does not satisfy Equation (5), the material strength of the member on the upper floor is changed to that of the member on the lower floor.
Table 2. Unit price and CO2 emissions according to the strength of concrete and steel section.
Structural materialsUnit priceUnit CO2 emission
ConcreteStrength21 MPa48.23 USD/m3472.61 kg-CO2/m3
24 MPa50.55 USD/m3495.42 kg-CO2/m3
27 MPa52.88 USD/m3518.23 kg-CO2/m3
30 MPa55.58 USD/m3544.69 kg-CO2/m3
35 MPa57.54 USD/m3563.85 kg-CO2/m3
40 MPa68.24 USD/m3668.78 kg-CO2/m3
50 MPa48.23 USD/m3793.77 kg-CO2/m3
Steel sectionSM490 rolled0 < thickness ≤ 250.68 USD/kg5.15 kg-CO2/kg
25 < thickness ≤ 380.69 USD/kg5.21 kg-CO2/kg
38 < thickness ≤ 500.69 USD/kg5.27 kg-CO2/kg
50 < thickness ≤ 1000.70 USD/kg5.33 kg-CO2/kg
SM490 built-up0 < thickness ≤ 250.84 USD/kg6.35 kg-CO2/kg
25 < thickness ≤ 380.84 USD/kg6.41 kg-CO2/kg
38 < thickness ≤ 500.85 USD/kg6.47 kg-CO2/kg
0 < thickness ≤ 250.86 USD/kg6.54 kg-CO2/kg
SM490 TMCP0 < thickness ≤ 250.86 USD/kg6.51 kg-CO2/kg
25 < thickness ≤ 380.86 USD/kg6.57 kg-CO2/kg
38 < thickness ≤ 500.87 USD/kg6.63 kg-CO2/kg
50 < thickness ≤ 1000.88 USD/kg6.70 kg-CO2/kg
SM520 TMCP0 < thickness ≤ 250.86 USD/kg6.57 kg-CO2/kg
25 < thickness ≤ 380.87 USD/kg6.64 kg-CO2/kg
38 < thickness ≤ 500.88 USD/kg6.70 kg-CO2/kg
50 < thickness ≤ 1000.89 USD/kg6.75 kg-CO2/kg
SM570 TMCP0 < thickness ≤ 500.97 USD/kg7.35 kg-CO2/kg
50 < thickness ≤ 1000.97 USD/kg7.40 kg-CO2/kg
The procedure of the proposed optimization technique is shown in Figure 2. At the step 1, the proposed optimization technique first assumes an initial design, and then it obtains the axial forces of the members through structural analysis. This step is followed by collecting data for the building model, listing cross sections of members, and determining the parameters for the GA (Step 2). The population consisting of individuals is then initialized by using a random generator (Step 3), and each individual is checked to determine whether it satisfies the side constraints (Step 4). The assumed cross section is then applied together with the strengths of the seven concretes to determine the minimum concrete strength that satisfies the stress constraint (Step 5). If no concrete strength is found to satisfy the stress constraint with the assumed cross section, the concrete strength with the smallest violation ratio is selected. Then, the objective function of each individual is evaluated (Step 6). Once the evaluations of the objective function and violation ratio are completed, the termination condition is checked (Step 7). Once the termination condition is satisfied, an optimum solution is acquired (Step 8). If the termination condition is not satisfied, the individuals in the population are evolved by selection, crossover, and mutation (Step 7-1), and then the above processes (Step 4 to Step 7-1) are repeated until the termination condition is satisfied.
Figure 2. Flowchart of the proposed optimization technique.
Energies 06 05609 g002
Because the cross sections of the optimum solution differ from those of the initial design, the axial forces on the members differ from the assumed values used when the algorithm is started. For accurate evaluation, a structural analysis is performed on the optimum design to determine whether the constraints are satisfied (Step 9). If the constraints are not satisfied, the cross section and properties of the members are manually modified to satisfy the constraints.
In this study, the ratios of crossover and mutation are set to 0.6 and 0.03, respectively, reflecting the standard values suggested by De Jong [37]. The size of the population is set to 20. The GA is terminated when the generation number reaches 1,000. However, the GA can also be terminated if the best solution from each generation is repeated at least 50 times and more than 15% of the individuals in the population satisfied all of the constraints.

4. Application

4.1. Introduction of the Example Structure

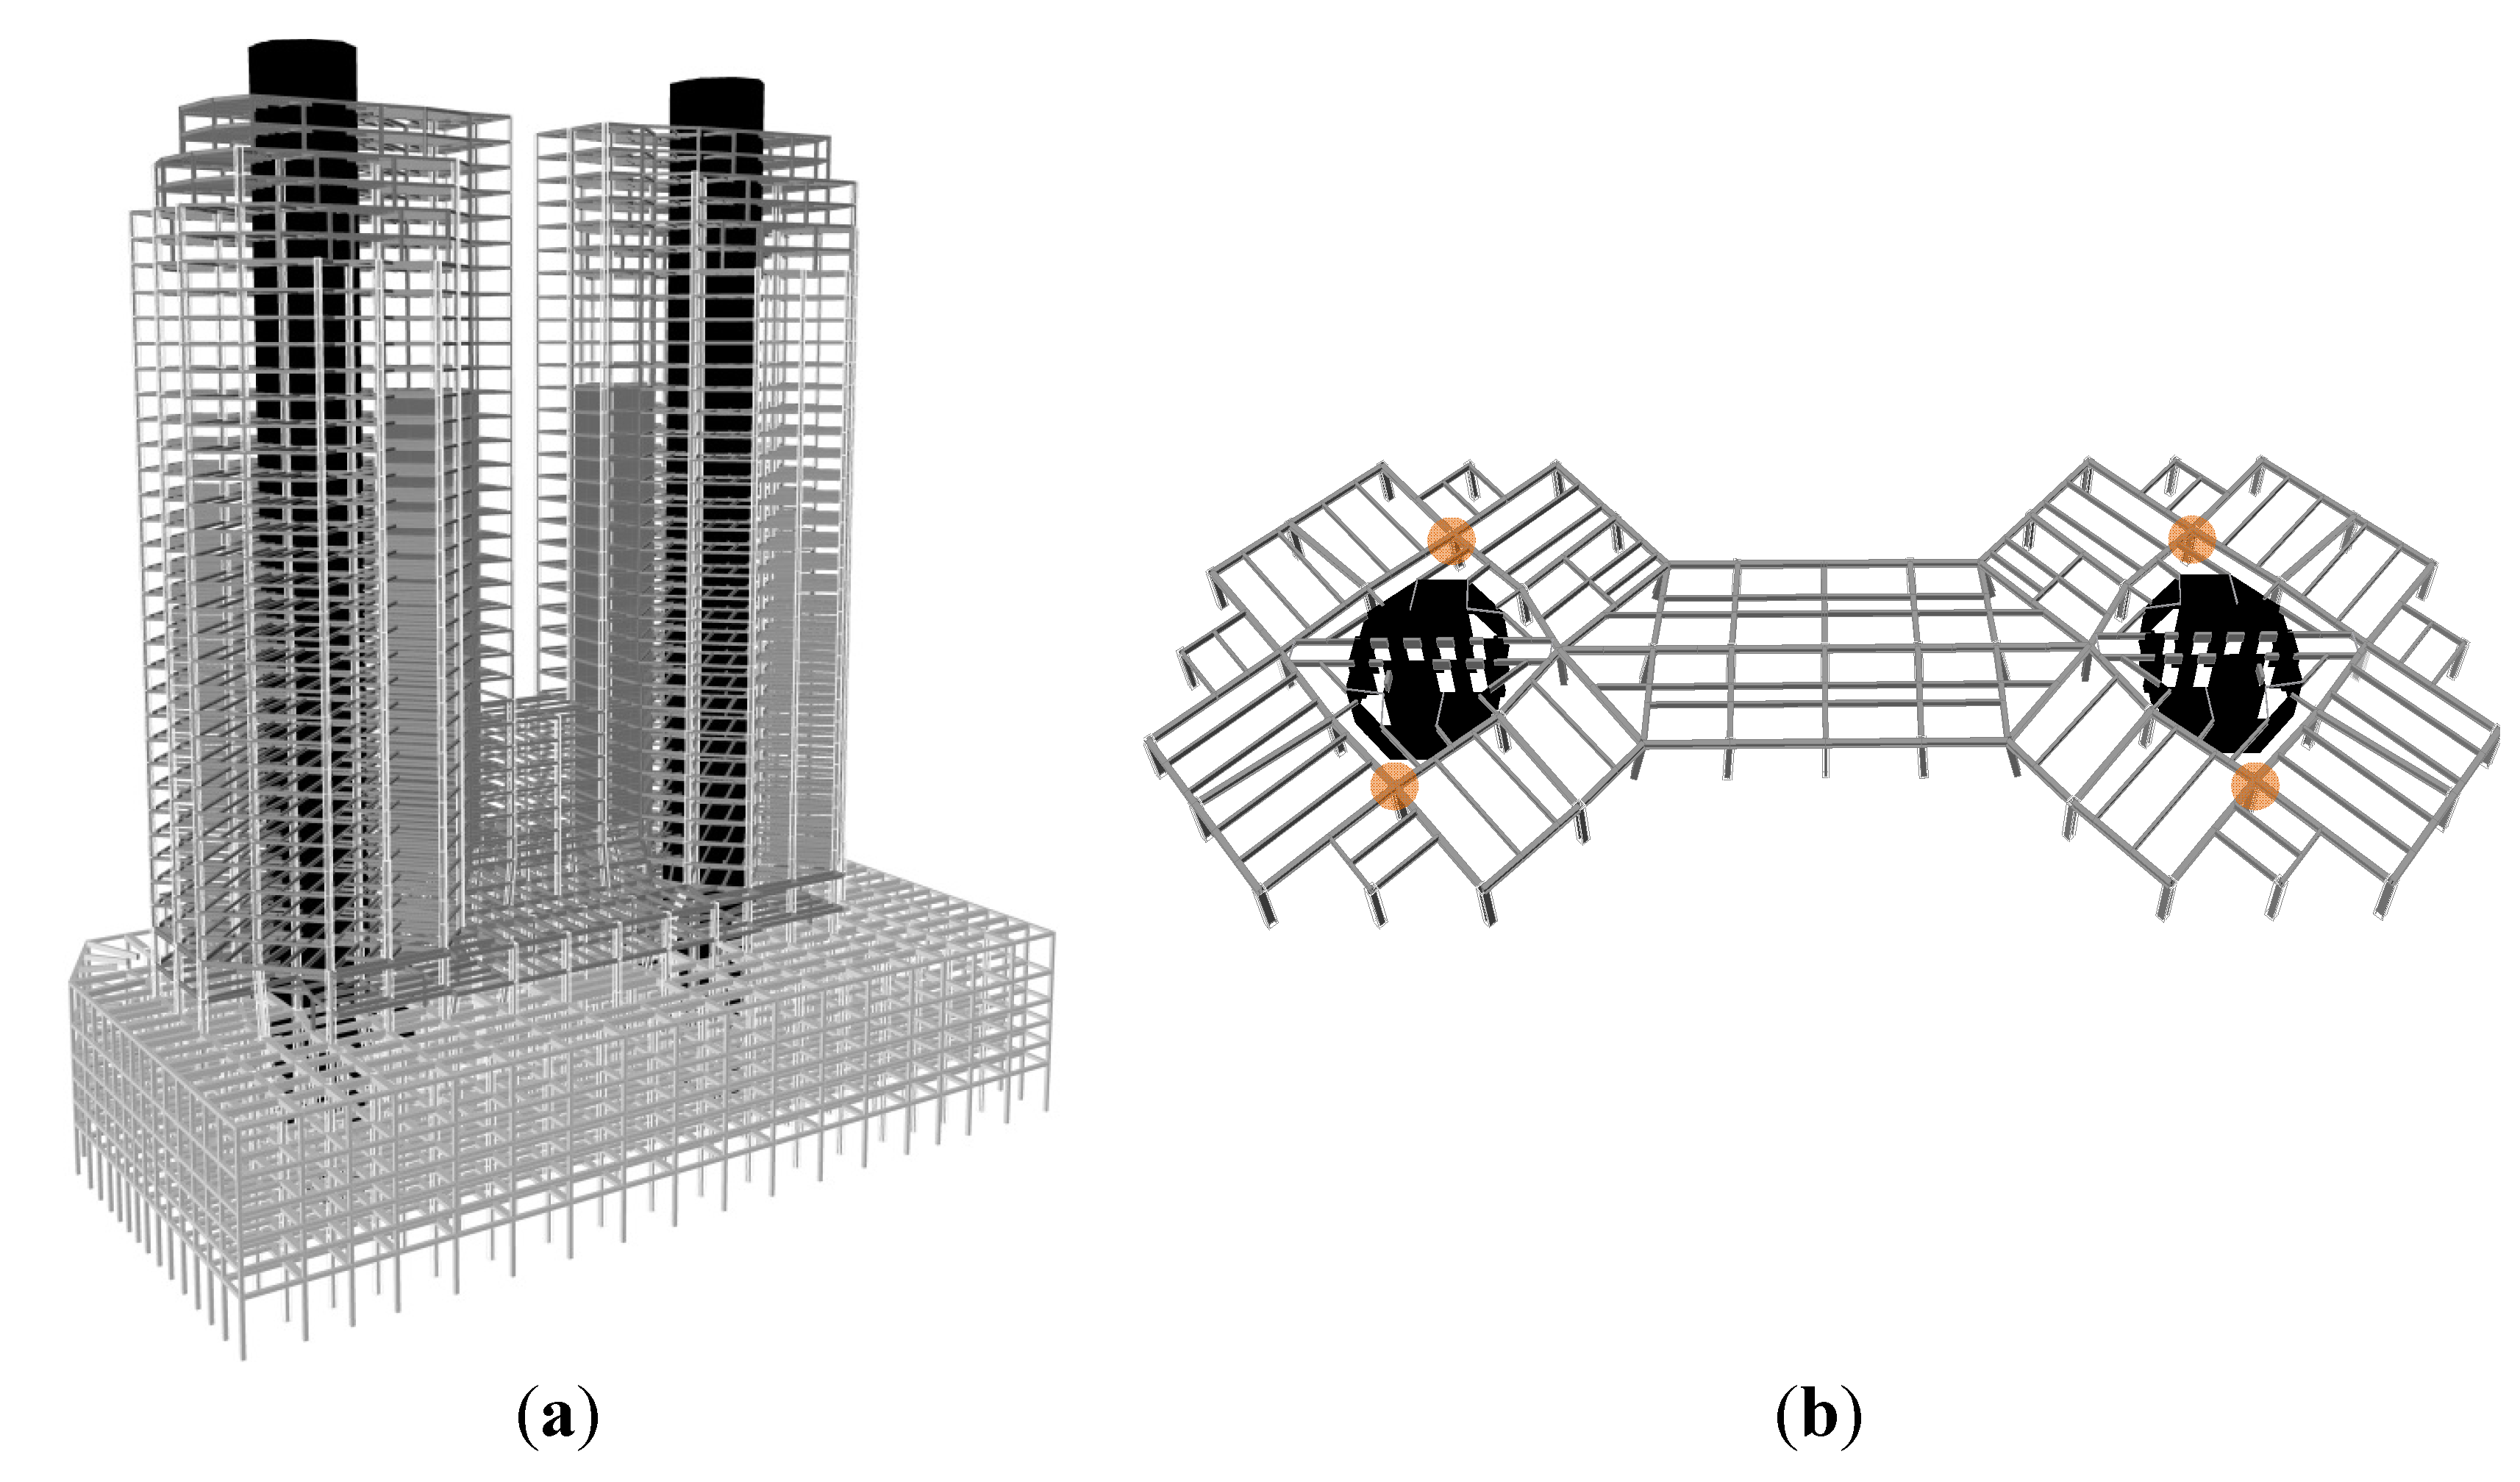
The example structure used in this study is a residential and commercial building with 35 floors above ground and six floors underground, as shown in Figure 3. It has a height of 119 m, width of 38.12 m, and depth of 38.93 m. As the lateral load-resisting structural system, a building frame system consisting of shear walls and a frame is employed. The wind load is calculated based on the result from a wind tunnel test, and the seismic load is calculated by AIK [23]. The example building consists of 57 column lines with 19 different types as determined by plane location and sharing load. The proposed optimal method is applied to column line C1, which is marked by the circles in Figure 3b.
Figure 3. Example structure: (a) perspective view; and (b) plan view.
Energies 06 05609 g003
In the proposed optimal method, the number of groups in a column line becomes the number of design variables. By grouping column members by every two or three floors, we obtain a total of 13 design variables in this study. A cross section for each design variable can be selected from the available section list for SRC columns (Table 1).

4.2. Results

For this example, it took 13.32 s to complete the optimization process (from Step 2 to Step 8) on Intel Core i7-2600 processor of 3.40 GHz. Table 3 summarizes the results from the proposed optimal method. The initial design in Table 3 is the structural design proposed by the structural engineering company. Compared to the initial design, the cost, additional cost from CO2, and total cost of the optimum design are reduced by 31.51%, 30.30% and 31.39%, respectively. The cost of steel sections comprises a substantial amount of the total cost, whereas the additional cost from CO2 of both initial and optimum designs comprises approximately 10% of the total cost.
Table 3. Comparison of costs from the initial design and optimum design.
Design typeCost (USD)Additional cost by CO2 (USD)Total cost (USD)
RebarSteel sectionConcreteSumRebarSteel sectionConcreteSumRebarSteel sectionConcreteSum
Initial design1,40559,7023,24664,3531496,3424446,9351,55466,0443,69071,288
(1.97%)(83.75%)(4.55%)(90.27%)(0.21%)(8.90%)(0.62%)(9.73%)(2.18%)(92.64%)(5.18%)(100.00%)
Optimum design1,42837,6704,97544,0741524,0016814,8341,58041,6725,65648,908
(2.92%)(77.02%)(10.17%)(90.12%)(0.31%)(8.18%)(1.39%)(9.88%)(3.23%)(85.20%)(11.57%)(100.00%)
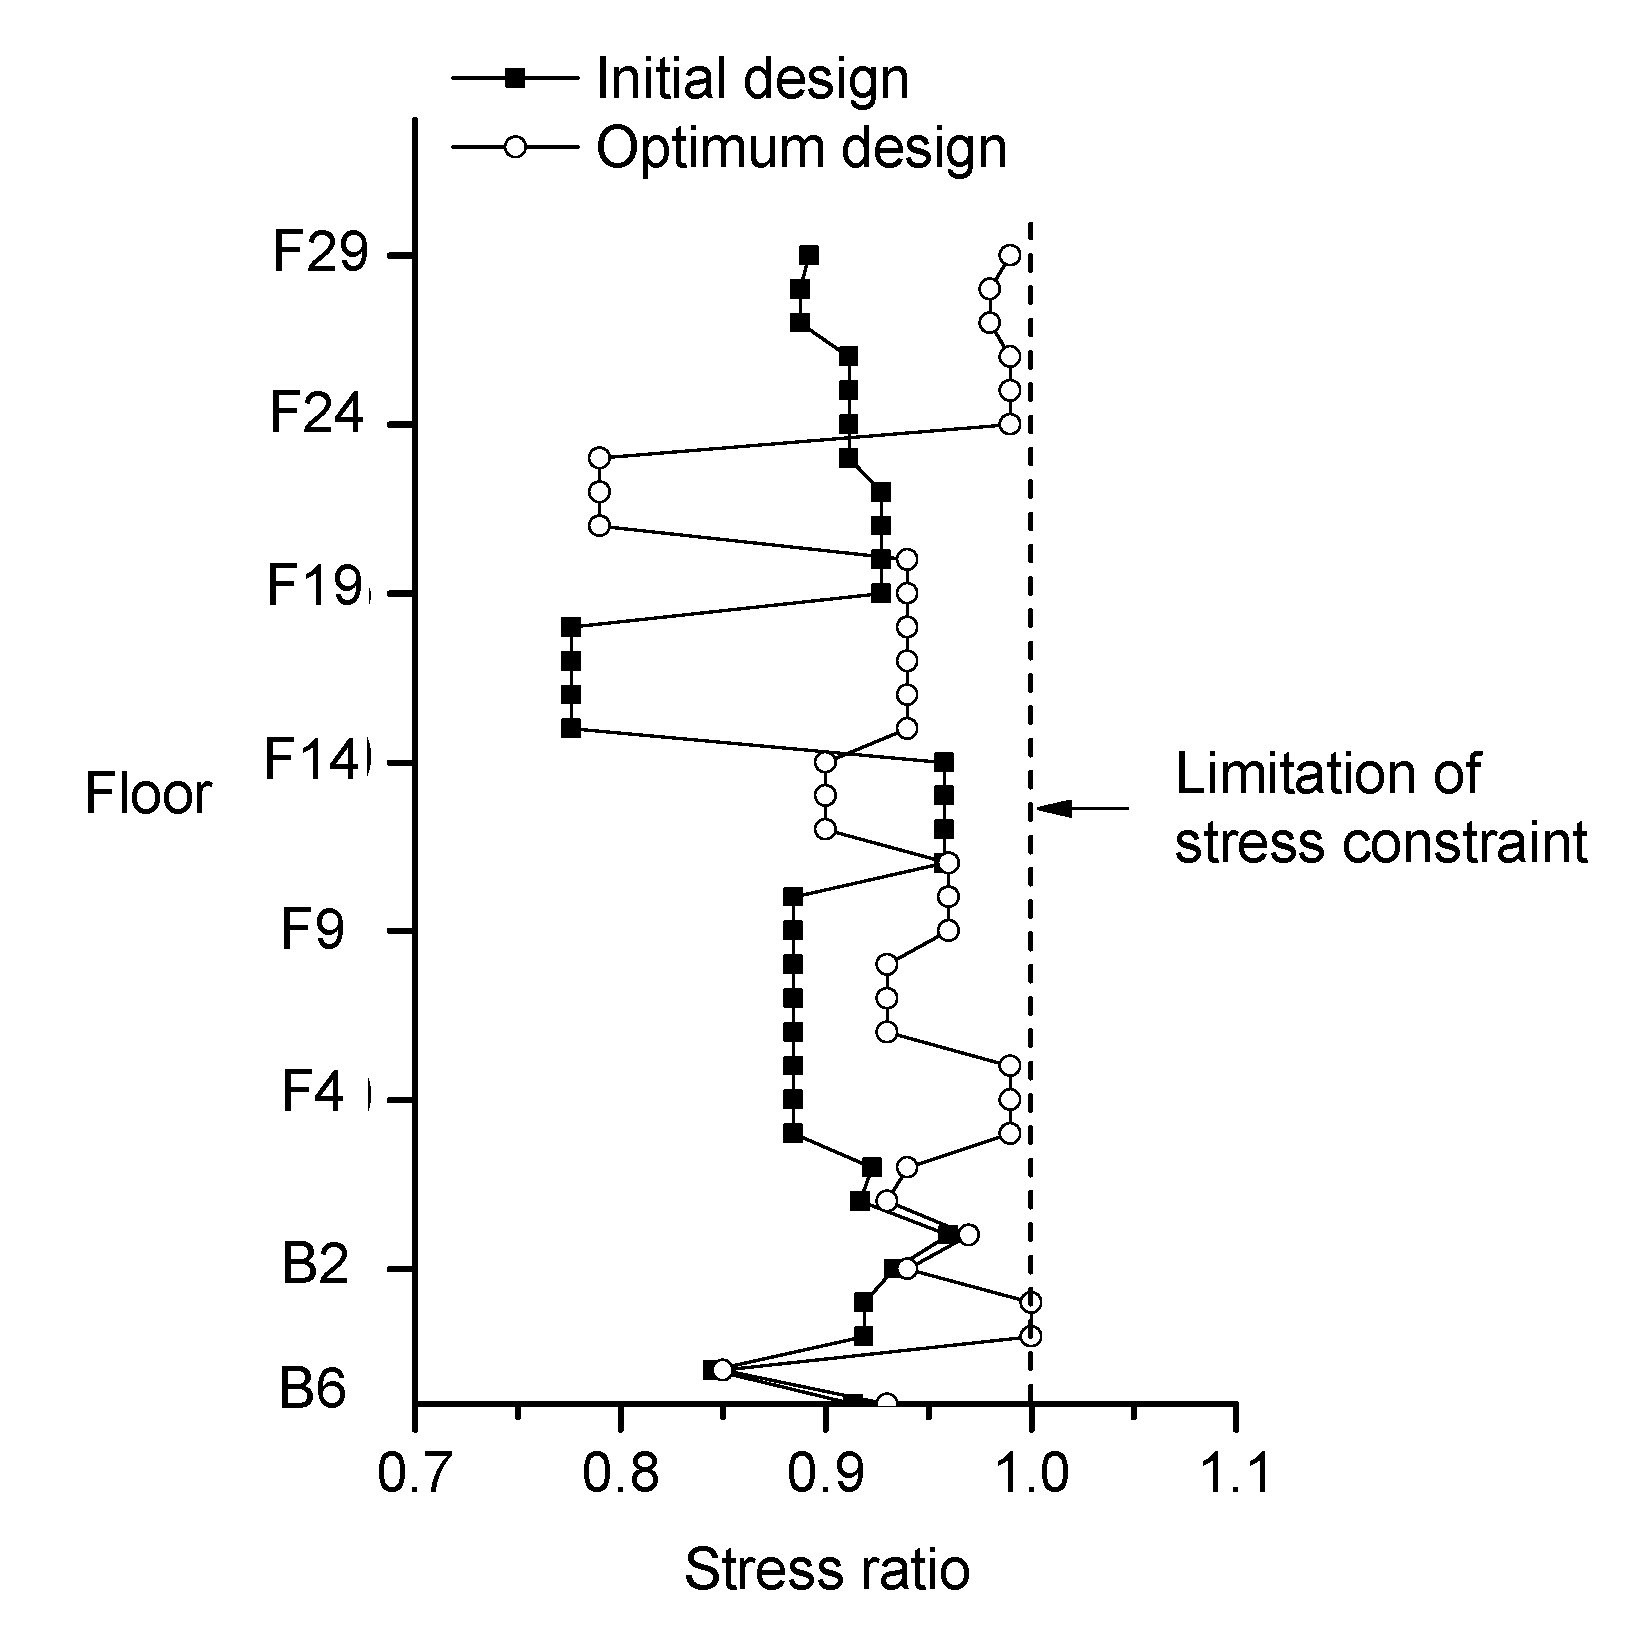
The stress constraint ratios of the optimum design are shown in Figure 4. The constraint ratios of the optimum design along the floor are closer to the allowable threshold of 1.0 than those of the initial design.
Figure 4. Comparison of the distributions of stress ratios for the initial design and optimum design.
Energies 06 05609 g004
Table 4 lists the weights of the initial and optimum designs. Compared to the initial design, the total weight of the optimum solution is reduced by 7.79%, which is a smaller reduction ratio than the cost reduction ratio (32.13%). This is because the concrete weight, which comprises a large part of the total weight, increased by 7.24%, whereas the steel section weight was reduced by 39.14%. The concrete weight increases to 78.60% of the total weight (optimum design) from 67.59% (initial design).
Table 4. Comparison of the weights in the initial and optimum designs.
Design typeWeight (kN)
Steel sectionConcreteSum
Initial design670.401398.292068.69
(32.41%)(67.59%)(100.00%)
Optimum design408.031499.381907.51
(21.39%)(78.60%)(100.00%)
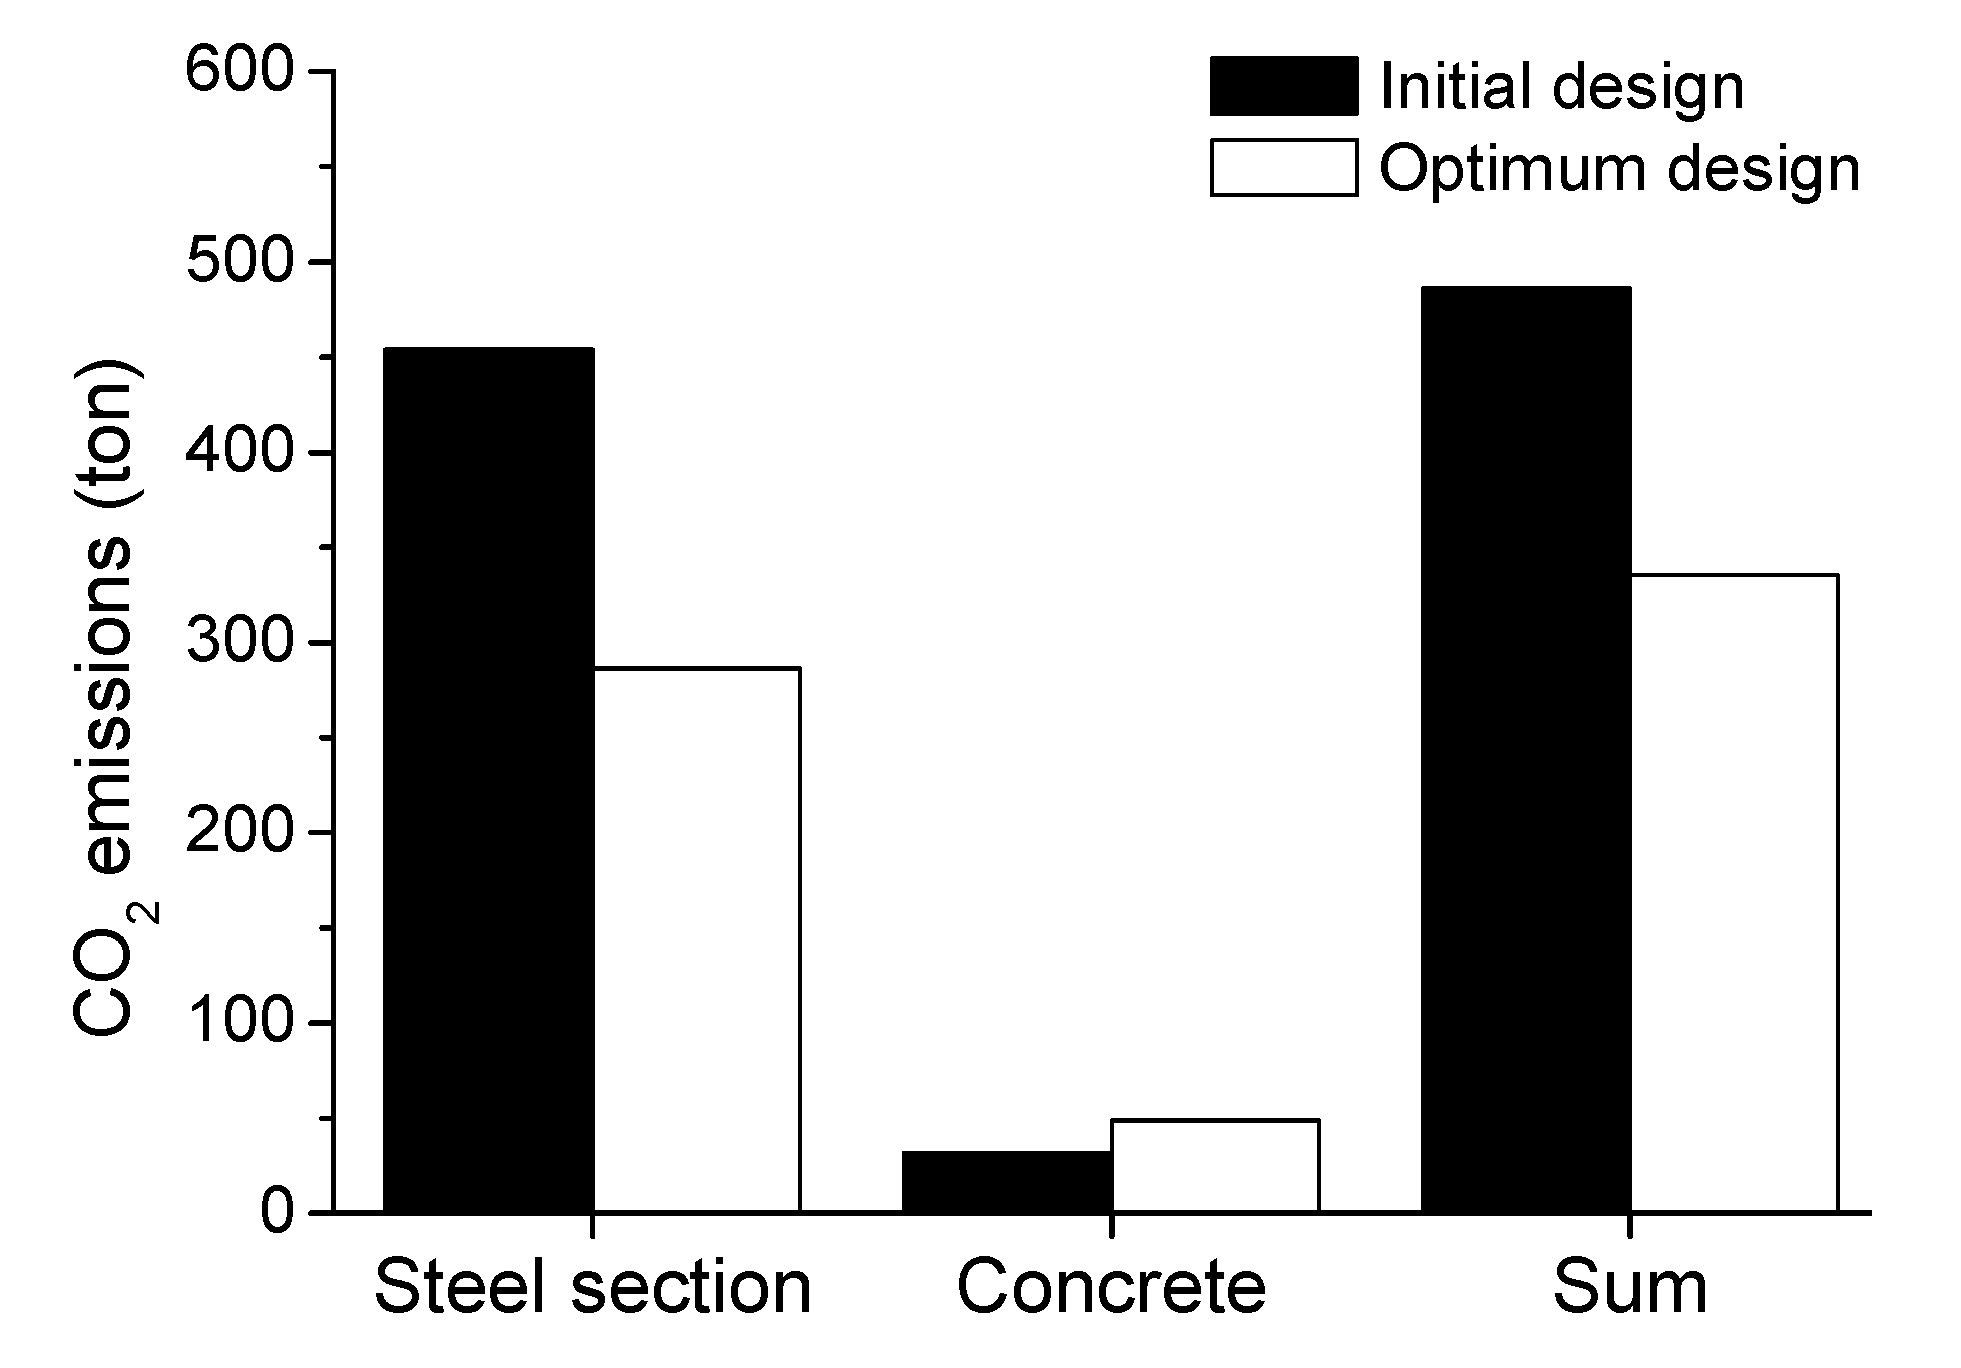
As shown in Figure 5, the CO2 emission of the optimum design is reduced by 31.00% compared to that of the initial design. For SRC columns, reducing the amount of steel section while increasing the amount of concrete are found to be more effective at reducing the costs and CO2 emissions. This is the different result when comparing with the RC results (for RC structures, the optimization with respect to the CO2 footprint results in an increase in the relative amount of steel within the member’s cross section) presented by Yeo and Gabbai [17] and Yeo and Potra [18]. It is thought that the different result is shown because the CO2 footprint of steel section (5.15 kg-CO2/kg to 7.40 kg-CO2/kg) in this study are much larger than the CO2 footprint of reinforcing steel bar (0.35 kg-CO2/kg) in Yeo and Potra [18].
Figure 5. Comparison of CO2 emissions from the initial and optimum designs.
Energies 06 05609 g005
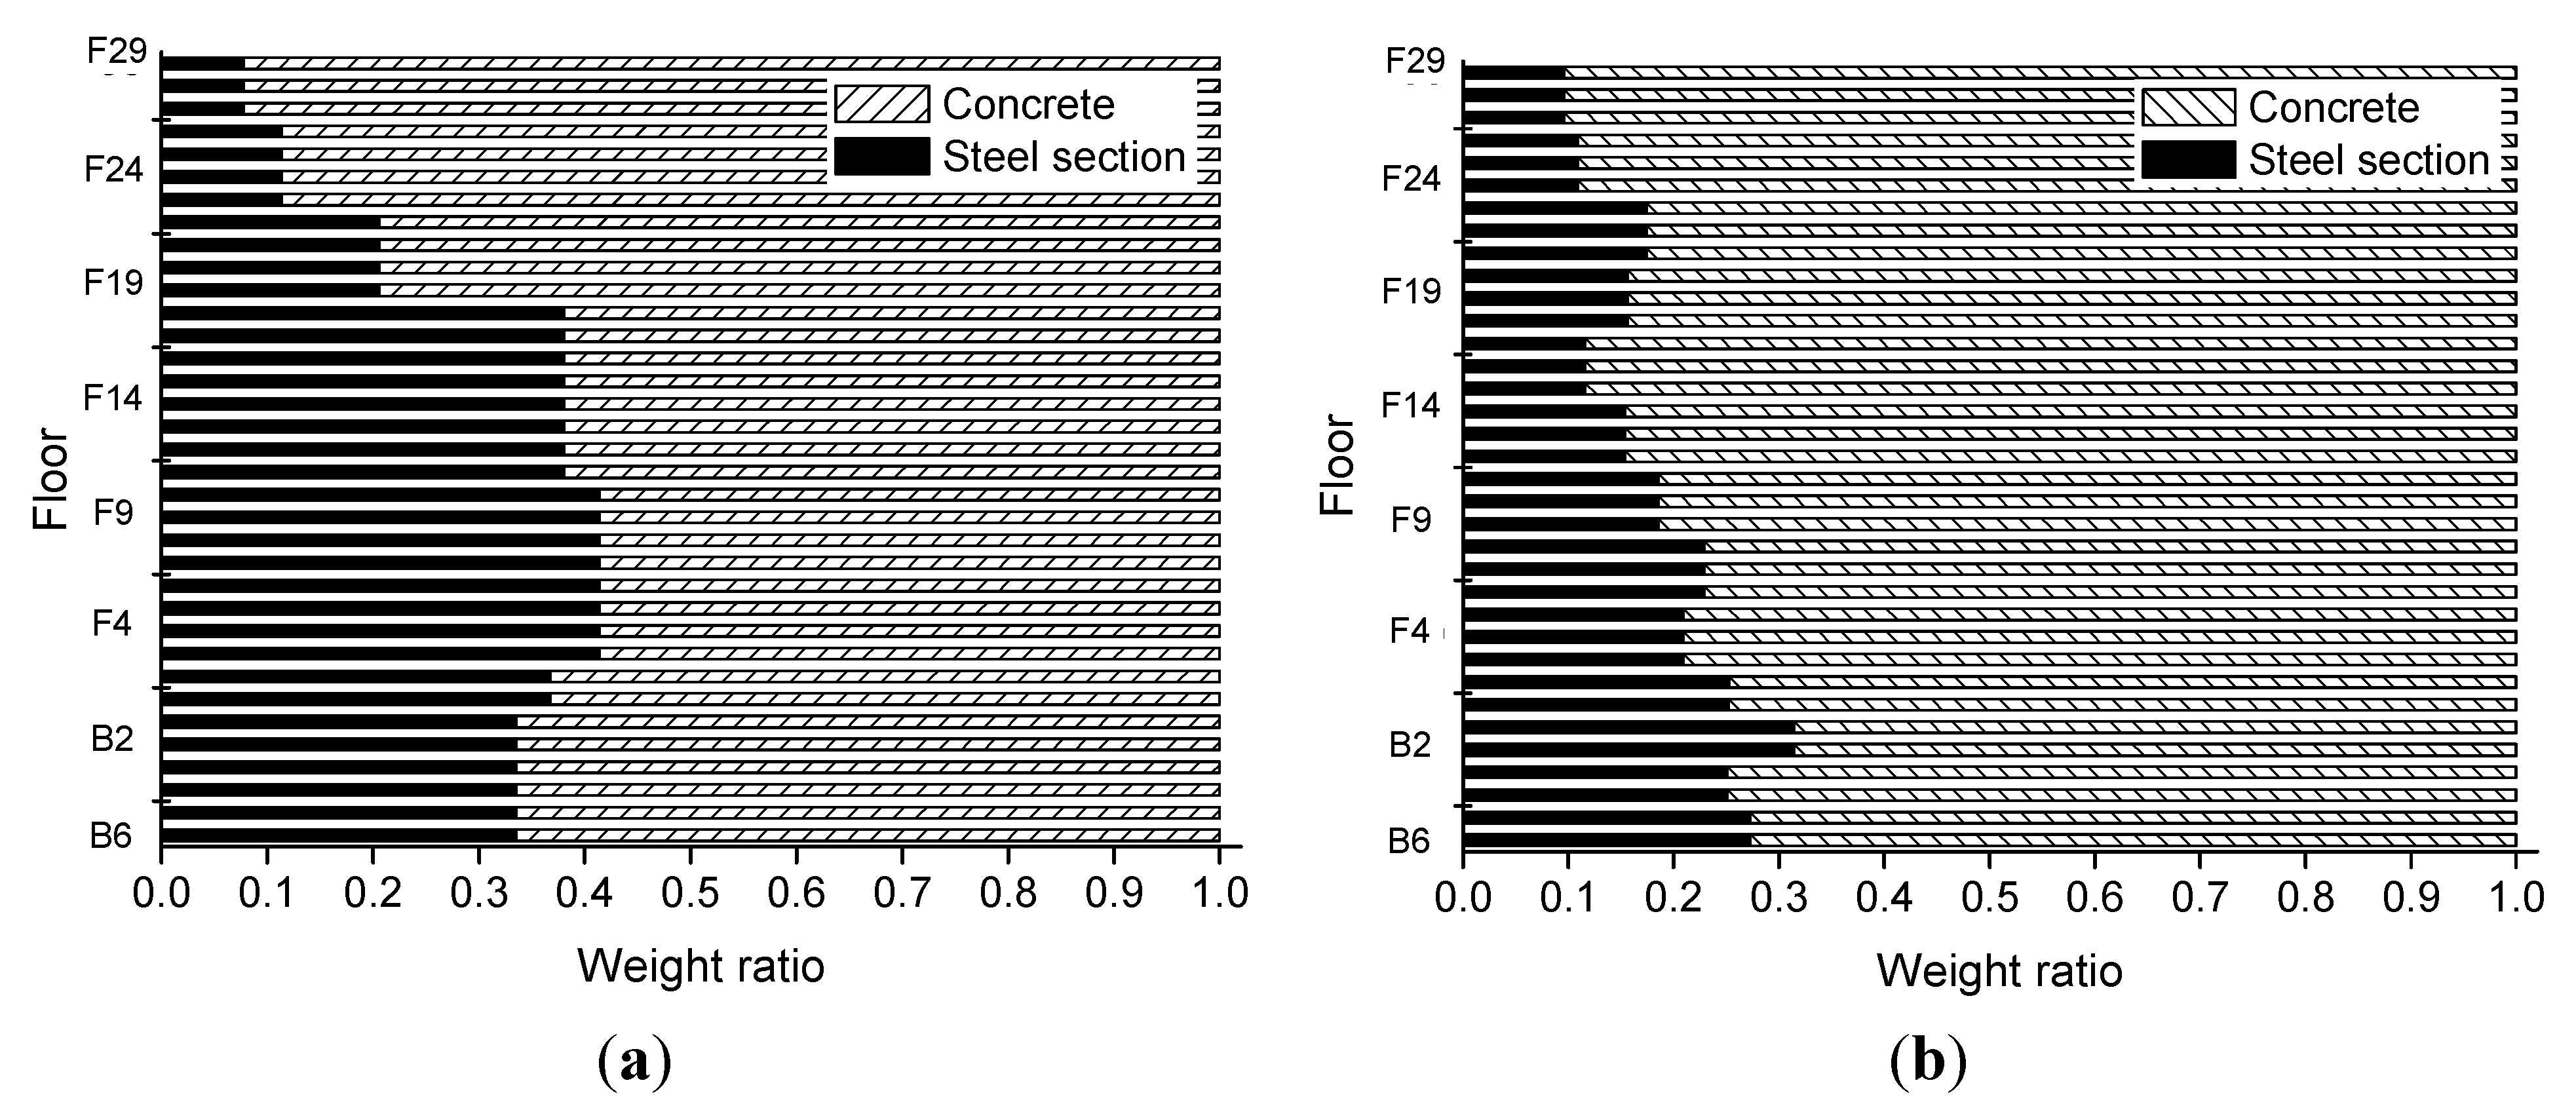
Figure 6 presents the weight ratios of steel section and concrete along the floor. For both the initial and optimum designs, the weight ratio of concrete is larger than that of steel section. The weight ratios of steel section are greater on lower floors.
Figure 6. Distributions of weight ratios of concrete and steel section along the floors: (a) initial design; and (b) optimum design.
Energies 06 05609 g006
Table 5 lists the strength distribution of the structural materials along the floor. The initial design uses the general-strength concretes of 24 and 27 MPa, whereas the optimum design uses the high-strength concretes of 40 and 50 MPa. High-strength steel (SM 570 TMCP) is used up to the 10th above-ground floor in the initial design, whereas high-strength steels (SM 520 TMCP and SM 570 TMCP) are used up to the 8th above-ground floor in the optimal solution.
Table 5. Distribution of structural materials for the initial and optimum designs.
FloorInitial designOptimum design
Strength of concrete (MPa)Type of steel sectionStrength of concrete (MPa)Type of steel section
F2924SM490 rolled40SM490 rolled
F2824SM490 rolled40SM490 rolled
F2724SM490 rolled40SM490 rolled
F2624SM490 rolled40SM490 rolled
F2524SM490 rolled40SM490 rolled
F2424SM490 rolled40SM490 rolled
F2324SM490 rolled40SM490 built-up
F2224SM490 rolled40SM490 built-up
F2124SM490 rolled40SM490 built-up
F2024SM490 rolled50SM490 built-up
F1924SM490 rolled50SM490 built-up
F1824SM490 rolled50SM490 built-up
F1724SM490 rolled50SM490 built-up
F1624SM490 rolled50SM490 built-up
F1524SM490 rolled50SM490 built-up
F1424SM490 rolled50SM490 built-up
F1324SM490 rolled50SM490 built-up
F1224SM490 rolled50SM490 built-up
F1124SM490 rolled50SM490 built-up
F1024SM570 TMCP50SM490 built-up
F924SM570 TMCP50SM490 built-up
F824SM570 TMCP50SM520 TMCP
F724SM570 TMCP50SM520 TMCP
F624SM570 TMCP50SM520 TMCP
F524SM570 TMCP50SM570 TMCP
F424SM570 TMCP50SM570 TMCP
F324SM570 TMCP50SM570 TMCP
F227SM570 TMCP50SM570 TMCP
F127SM570 TMCP50SM570 TMCP
B127SM570 TMCP50SM570 TMCP
B227SM570 TMCP50SM570 TMCP
B327SM570 TMCP50SM570 TMCP
B427SM570 TMCP50SM570 TMCP
B527SM570 TMCP50SM570 TMCP
B627SM570 TMCP50SM570 TMCP
Although high-strength steel is used up to the higher floors in the initial design, as listed in Table 6, the optimum design uses more high-strength steels (71.48%) than the initial design (69.04%). Thus, it is shown that using high-strength structural materials can reduce the cost and CO2 emissions in this study [38].
Table 6. Comparison of weights according to the type of steel sections.
Type of steel sectionInitial designOptimum design
Weight (kN)Ratio (%)Weight (kN)Ratio (%)
SM490 rolled207.5530.9612.363.03
SM490 built-up--104.0225.49
SM490 TMCP---0.00
SM520 TMCP--38.269.38
SM570 TMCP462.8569.04253.3862.10
Total670.40100.00408.03100.00%

5. Conclusions

We present an optimization technique for SRC columns in a high-rise building that simultaneously considers the structural cost and CO2 emissions at the structural design phase, and we apply the technique to an actual 35-floor building to evaluate its effectiveness. The optimum design obtained from the proposed technique reduced the cost, CO2 emissions, and sum of weights of steel section and concrete used by 31.51%, 30.30% and 7.79%, respectively. The weight of steel section in the optimum design was reduced by 39.14%, whereas the weight of concrete was increased by 7.23%. We confirmed that reducing the amount of steel but increasing the amount of concrete can be an effective way to reduce the structural costs and CO2 emissions of SRC columns.
The optimum design also included an increased use of high-strength materials (concrete and steel) compared to the initial design. Thus, it is shown that the use of high-strength materials for SRC columns effectively reduces CO2 emissions. The unit cost and CO2 emission of high-strength materials are greater than those of general-strength materials, but lower amounts of the former materials are required because of their increased strength, which in turn reduces the overall costs and CO2 emissions.

Acknowledgments

This work was supported by the National Research Foundation of Korea (NRF) grant funded by the Korea government (MSIP) (No. 2011-0018360).

Conflicts of Interest

The authors declare no conflict of interest.

References

  1. T’Serclaes, P. Financing Energy Efficient Homes: Existing Policy Responses to Financial Barriers; International Energy Agency: Paris, France, 2007. [Google Scholar]
  2. Guggemos, A.A.; Horvath, A. Comparison of environmental effects of steel- and concrete-framed buildings. J. Infrastruct. Syst. 2008, 11, 93–101. [Google Scholar] [CrossRef]
  3. Zhang, Z.; Wu, X.; Yang, X.; Zhu, Y. BEPAS—A life cycle building environmental performance assessment model. Build. Environ. 2006, 51, 669–675. [Google Scholar] [CrossRef]
  4. Yang, L.; Zmeureanu, R.; Rivard, H. Comparison of environmental impacts of two residential heating systems. Build. Environ. 2008, 43, 1072–1081. [Google Scholar] [CrossRef]
  5. Radhi, H. On the optimal selection of wall cladding system to reduce direct and indirect CO2 emissions. Energy 2010, 35, 1412–1424. [Google Scholar] [CrossRef]
  6. Gartner, E. Industrially interesting approaches to “low-CO2” cements. Cem. Concr. Res. 2004, 34, 1489–1498. [Google Scholar] [CrossRef]
  7. Wang, W.; Zmeureanu, R.; Rivard, H. Applying multi-objective genetic algorithms in green building design optimization. Build. Environ. 2005, 40, 1512–1525. [Google Scholar] [CrossRef]
  8. Sartori, I.; Hestnes, A.G. Energy use in the life cycle of conventional and low-energy buildings: A review article. Energy Build. 2007, 39, 249–257. [Google Scholar] [CrossRef]
  9. Pachauari, R.K.; Reisinger, A. Climate Change 2007: Synthesis Report. Contribution of Working Groups I, II and III to the Fourth Assessment Report on Intergovernmental Panel on Climate Change; Intergovernmental Panel on Climate Change (IPCC): Geneva, Switzerland, 2007. [Google Scholar]
  10. Thiel, C.L.; Campion, N.; Landis, A.E.; Jones, A.K.; Schaefer, L.A.; Bilec, M.M. A materials life cycle assessment of a net-zero energy building. Energies 2013, 6, 1125–1141. [Google Scholar] [CrossRef]
  11. Airaksinen, M.; Matilainen, P. A carbon footprint of an office building. Energies 2011, 4, 1197–1210. [Google Scholar] [CrossRef]
  12. Dixit, M.K.; Fernández-Solís, J.L.; Lavy, S.; Culp, C.H. Identification of parameters for embodied energy measurement: A literature review. Energy Build. 2010, 42, 1238–1247. [Google Scholar] [CrossRef]
  13. Thormark, C. A low energy building in a life cycle—Its embodied energy, energy need for operation and recycling potential. Build. Environ. 2002, 37, 429–435. [Google Scholar] [CrossRef]
  14. Reddy, B.V.V.; Jagadish, K.S. Embodied energy of common and alternative building materials and technologies. Energy Build. 2003, 35, 129–137. [Google Scholar] [CrossRef]
  15. Liu, K.S.; Hsueh, S.L.; Wu, W.C.; Chen, Y.L. A DFuzzy-DAHP decision-making model for evaluating energy-saving design strategies for residential buildings. Energies 2012, 5, 4462–4480. [Google Scholar] [CrossRef]
  16. Moon, K.S. Sustainable structural engineering strategies for tall building. Struct. Des. Tall Spec. Build. 2008, 17, 895–914. [Google Scholar] [CrossRef]
  17. Yeo, D.; Gabbai, R.D. Sustainable design of reinforced concrete structures through embodied energy optimization. Energy Build. 2011, 43, 2028–2033. [Google Scholar] [CrossRef]
  18. Yeo, D.; Potra, F.A. Sustainable design of reinforced concrete structures through CO2 emission optimization. J. Struct. Eng. 2013. [Google Scholar] [CrossRef]
  19. Paya-Zaforteza, I.; Yepes, V.; Hospitaler, A.; González-Vidosa, F. CO2-Optimization of reinforced concrete frames by simulated annealing. Eng. Struct. 2009, 31, 1501–1508. [Google Scholar] [CrossRef]
  20. Paya, I.; Yepes, V.; González-Vidosa, F.; Hospitaler, A. Multiobjective optimization of concrete frames by simulated annealing. Comput.-Aided Civ. Infrastruct. Eng. 2008, 23, 596–610. [Google Scholar] [CrossRef]
  21. Saw, H.S.; Liew, J.Y.R. Assessment of current methods for the design of composite columns in buildings. J. Constr. Steel Res. 2000, 53, 121–147. [Google Scholar] [CrossRef]
  22. Lu, Y.; Zhu, X.; Cui, Q. Effectiveness and equity implications of carbon policies in the United States construction industry. Build. Environ. 2012, 49, 259–269. [Google Scholar] [CrossRef]
  23. Architectural Institute of Korea (AIK). Korean Building Code and Commentary (in Korean); Architectural Institute of Korea: Seoul, Korea, 2009. [Google Scholar]
  24. Cheng, L.; Chan, C.M. Optimal lateral stiffness design of composite steel and concrete tall frameworks. Eng. Struct. 2009, 31, 523–533. [Google Scholar] [CrossRef]
  25. Structural Stability Research Council. A specification for the design of steel-concrete composite columns. Eng. J. 1979, 4, 101–115. [Google Scholar]
  26. Goldberg, D.E. Genetic Algorithms in Optimization, Search and Machine Learning; Addison Wesley: New York, NY, USA, 1989. [Google Scholar]
  27. Zhu, B. A novel multiscale ensemble carbon price prediction model integrating empirical mode decomposition, genetic algorithm and artificial neural network. Energies 2012, 5, 355–370. [Google Scholar] [CrossRef]
  28. Tomoiagă, B.; Chindriş, M.; Sumper, A.; Sudria-Andreu, A.; Villafafila-Robles, R. Pareto optimal reconfiguration of power distribution systems using a genetic algorithm based on NSGA-II. Energies 2013, 6, 1439–1455. [Google Scholar] [CrossRef] [Green Version]
  29. Fang, L.; Qin, S.; Xu, G.; Li, T.; Zhu, K. Simultaneous optimization for hybrid electric vehicle parameters based on multi-objective genetic algorithms. Energies 2011, 4, 532–544. [Google Scholar] [CrossRef]
  30. Choi, S.W.; Park, H.S. Multi-objective seismic design method for ensuring beam-hinging mechanism in steel frames. J. Constr. Steel Res. 2012, 74, 17–25. [Google Scholar] [CrossRef]
  31. Choi, S.W.; Kim, Y.; Lee, J.; Hong, K.; Park, H.S. Minimum column-to-beam strength ratios for beam-hinge mechanisms based on multi-objective seismic design. J. Constr. Steel Res. 2013, 88, 53–62. [Google Scholar] [CrossRef]
  32. Cha, Y.J.; Agrawal, A.K.; Kim, Y.; Raich, A.M. Multi-objective genetic algorithms for cost-effective distributions of actuators and sensors in large structures. Expert Syst. Appl. 2012, 39, 7822–7833. [Google Scholar] [CrossRef]
  33. Cha, Y.J.; Kim, Y.; Raich, A.M.; Agrawal, A.K. Multi-objective optimization for actuator and sensor layouts of actively controlled 3D buildings. J. Vib. Control 2013, 19, 942–960. [Google Scholar] [CrossRef]
  34. Goggins, J.; Keane, T.; Kelly, A. The assessment of embodied energy in typical reinforced concrete building structures in Ireland. Energy Build. 2010, 42, 735–744. [Google Scholar] [CrossRef]
  35. Korea LCI Database Information Network (in Korean). Available online: http://www.edp.or.kr/lcidb/english/main/main.asp (accessed on 16 August 2013).
  36. Hong, T.; Ji, C.; Jang, M. An analysis on CO2 emission of structural steel materials by strength using input-output LCA. Korea J. Constr. Eng. Manag. 2012, 13, 132–140. (in Korean). [Google Scholar] [CrossRef]
  37. De Jong, K.A. Analysis of the Behavior of a Class of Genetic Adaptive Systems. Ph.D. Thesis, University of Michigan, Ann Arbor, MI, USA, 1975. [Google Scholar]
  38. Tae, S.; Baek, C.; Shin, S. Life cycle CO2 evaluation on reinforced concrete structures with high-strength concrete. Environ. Impact Assess. Rev. 2011, 31, 253–260. [Google Scholar] [CrossRef]