1. Introduction
Metal-ammonia (M-NH
3) solution, which is a solution of alkali metals and alkaline earth metals in liquid ammonia (NH
3), is able to produce solvated electrons at low metal concentrations as well as release free electrons by decomposing the solvated electrons at high metal concentrations. Recently, with the growth of high-tech equipment, many developments have been achieved such that the material structures of these solutions and the distribution of electrons, conductivities and distances between atoms have been measured [
1,
2,
3,
4,
5,
6]. Ever since Dewald and Lepoutre [
7] announced the thermoelectric phenomenon in 1953, various thermoelectric experiments on these solutions have been recognized [
8,
9,
10,
11,
12,
13,
14,
15,
16,
17]. Nevertheless, because thermoelectric experiments on these solutions have to be carried out under restricted conditions, it is very hard to determine the accurate values for the thermoelectric power of these solutions, indispensable in the analysis of the electronic conduction mechanism [
8,
9,
10,
11,
12,
13]. These solutions, if not freshly prepared, become unstable (
i.e., instantly jump to a new high-conducting regime before a critical degree of decomposition is reached). Because solution decomposition is catalyzed primarily by water, oxygen and most electrode metals, it proceeds aberrantly and rapidly under the given conditions; only after a few minutes does the solution easily become unstable, apparently independent of whether or not thermoelectric power is driven through the solution. This is due to the fact that it is very difficult to prepare a dilute solution of metal in liquid ammonia at the normal boiling point without contamination [
18]. Most thermoelectric experiments so far have focused on measuring the thermoelectric power of these solutions; however, there has been no effort to improve the efficiency of thermoelectric power generation through the use of M-NH
3 solutions.
In general, it is well known that potassium-ammonia (K-NH
3) solution is harder to deal with than lithium-ammonia (Li-NH
3) and sodium-ammonia (Na-NH
3) solutions. This is because potassium (K) is an extremely active alkali metal that oxidizes rapidly in air and is very reactive with water, generating sufficient heat to ignite the hydrogen emitted in the reaction. For this reason, the preparation and decomposition of K-NH
3 solutions is much more difficult than those of Li-NH
3 or Na-NH
3 solutions. Hahne
et al. [
14], Damay
et al. [
15] and Niibe
et al. [
16] have reported the thermoelectric experimental results of these solutions in the temperature range from −65 °C to −50 °C. Unfortunately, these thermoelectric experimental data are not in agreement with each other and thus, are not available and reliable. Such a problem is caused by the fact that during decomposition, NH
3 gasification takes place rapidly on the heating side, consequently leading to a low conversion efficiency of thermoelectric power generation. Thus, a new device is needed to effectively generate the thermoelectric power of K-NH
3 solutions as well as to improve the thermoelectric conversion efficiency of these solutions.
The objective of this paper is to design high-efficiency reversible thermoelectric conversion devices for thermoelectric power generation through liquid potassium-ammonia (K-NH3) solutions. For this purpose, we propose a novel method using a new vacuum cell for the preparation and decomposition of these solutions. The proposed cell is so arranged that a gas passageway (“Ʉ”) connecting both legs of the “U” helps to provide equal inner pressure to both the end sides; further, it also has a narrow waist in the middle in order to improve the electrical conductivity. To show the effectiveness of the proposed method, two kinds of thermoelectric experiments are carried out with the liquid K-NH3 solutions, which are within the concentration range of 0.5–3.0 MPM (mole percent metal). The first one is to demonstrate that the gas passageway (“Ʉ”) connecting both legs of the cell provides an NH3 gas-pressure equilibrium (inside both the cell’s ends) for stably reversible thermoelectric conversion during decomposition. The second is to verify that the narrow waist in the middle of the cell improves thermoelectric conversion efficiency. All thermoelectric experiments are performed in an anhydrous and deoxidized (vacuum) state for the preparation and decomposition of pure liquid K-NH3 solutions; the temperature range of thermoelectric power measurements ranges from −45 °C to −25 °C. Moreover, all generating data (temperature, current and voltage) during solution decomposition is simultaneously and exactly measured in real time. Through this new approach, the design of a high-efficiency reversible thermoelectric conversion cell provides an additional insight into the physical significance for the development of thermoelectric cells using liquid M-NH3 solutions.
2. K-NH3 Solutions
K-NH
3 solutions are well known to undergo much more violent and rapid decomposition on heating; however, they generate higher thermoelectric power compared to Li-NH
3 solutions [
9,
10,
11,
12] or Na-NH
3 solutions [
13,
14]. The dissolution process in K-NH
3 solutions results in the potassium’s valence electron being spontaneously ionized into a solvent. Because the reactivity is higher than that of Li-NH
3 solutions, the preparation of pure liquid K-NH
3 solutions requires a very difficult process of anaerobic and anhydrous environments. At low metal concentrations, this leads to the formation [
16] of solvated potassium cations (K
s+) as well as solvated electrons (e
s−),
i.e.,
Note that e
s− is a free electron solvated in liquid ammonia, which releases free electrons at high metal concentrations. The chemical formulas of K
s+ and e
s− are expressed, respectively, as:
It is likely that most free K(NH
3)
4+ will form hydrogen bonds with ammonia molecules. Also, the “isolated electron in a cavity” species, e
−(NH
3)
n, with
n = 4–8 are likely to be found, where a number of species contain two or more solvated electrons. The generally accepted (and probably correct) view is that a further increase in the potassium metal concentration induces a phase transition to yield a blue/bronze/copper/gold-colored liquid within which the solvated electrons are genuinely delocalized,
i.e.,
where the symbol “⇒” means an increase in the potassium metal concentration; and
r denotes the number of hydrogen bonds with ammonia molecules.
From the above chemical and physical properties of liquid K-NH
3 solutions, we can figure out the fact that at intermediately concentration, the various species containing two or more solvated electrons, have thermoelectric capacity and can also store or release free electrons by a liquid-liquid phase transition between low- and high-density concentrations. More specifically, the spin-paired species having solvated-electrons releases the free electrons by “a phase transition to metallic state” when the concentration of sodium is increased in the cooling solution. On the other hand, when adding liquid ammonia to the concentrated solution or when increasing the solution temperature (in a sealed vacuum vessel), the solution undergoes a phase transition to a non-metallic state (
i.e., a transition from concentrated to dilute solution); then, the released free electrons are solvated again in various species (
i.e., the solvated-electrons and the spin-paired species having solvated-electrons). In particular, the concentration increase in the cooling solution causes a liquid-liquid phase transition, which is likely to maximize the released electron density at the critical temperature. In general, this liquid-liquid phase separation is likely to occur when a 4 MPM M-NH
3 solution is cooled below a critical consolute temperature within the range from −33 °C to −45 °C [
18]. The solution initially synthesized, if freshly prepared in a closed-vacuum cell, separates physically into a bronze metallic phase and a blue nonmetallic phase in hot and cool regions, respectively.
3. Experimental Method
In the previous paper [
18], we have reported an exploratory thermoelectric experiment method using a “U”-shaped vacuum cell for the preparation and decomposition of liquid Li-NH
3 solutions. It has been shown that the vacuum-cell arrangement provides advantages of not only producing a pure liquid Li-NH
3 solution that is in a desired concentration, but also avoids unstable decomposition (
i.e., during decomposition of the solution, never jumps from the normal-conducting state to a new high-conducting regime [
1,
9,
10]). Furthermore, the experimental results have demonstrated that the temperature difference on both sides of the cell engenders two separate liquid-liquid phase transitions due to the concentration changes in both the hot and cool sides—
i.e., the substance in the high temperature region of the cell has a concentration below 0.1 MPM, and its color becomes nearly transparent, whereas the substance in the low temperature region has a concentration that is nearly twice the initial MPM, and the color becomes darker. Nevertheless, in order to drive the thermoelectric power of K-NH
3 solutions that is harder to deal with (
i.e., has higher activity on heating) than Li-NH
3 solutions, special care needs to be taken to provide equal ammonia-gas pressure to the inside (both sides) of the cell (
i.e., the violent decomposition in the hot side of the sealed cell rapidly produces a lot of NH
3 gasification, thereby causing an unbalance of pressures inside both the legs of the “U”).
In order to carry out thermoelectric experiments demonstrating the effect of the NH
3 gas-pressure equilibrium in a vacuum cell of decomposing K-NH
3 solution along with the improvement of the current efficiency according to a liquid flow increase in the middle, we use two kinds of cells, both of which is a “Ʉ” shaped Pyrex vacuum cell type with and without the narrow waist in the middle.
Figure 1 shows the narrow-waisted and the no-waisted cells used in this work, where the passage control valve “C” is used to monitor and control gas flow passing through the passageway. The inside of these cells is kept at a vacuum state for the preparation and decomposition of pure liquid K-NH
3 solutions, and the thermoelectric power data (current, voltage and temperature) are simultaneously measured at the electrodes (B
1, B
2) and thermocouples (A
1, A
2) on both closed ends. Pure liquid K-NH
3 solutions which are in the concentration range of 0.5–3.0 MPM are initially prepared in the cell: during decomposition of these solutions, the concentration range in the cool-side region is increased up to 1.0–6.0 MPM (normal conducting state) [
18].
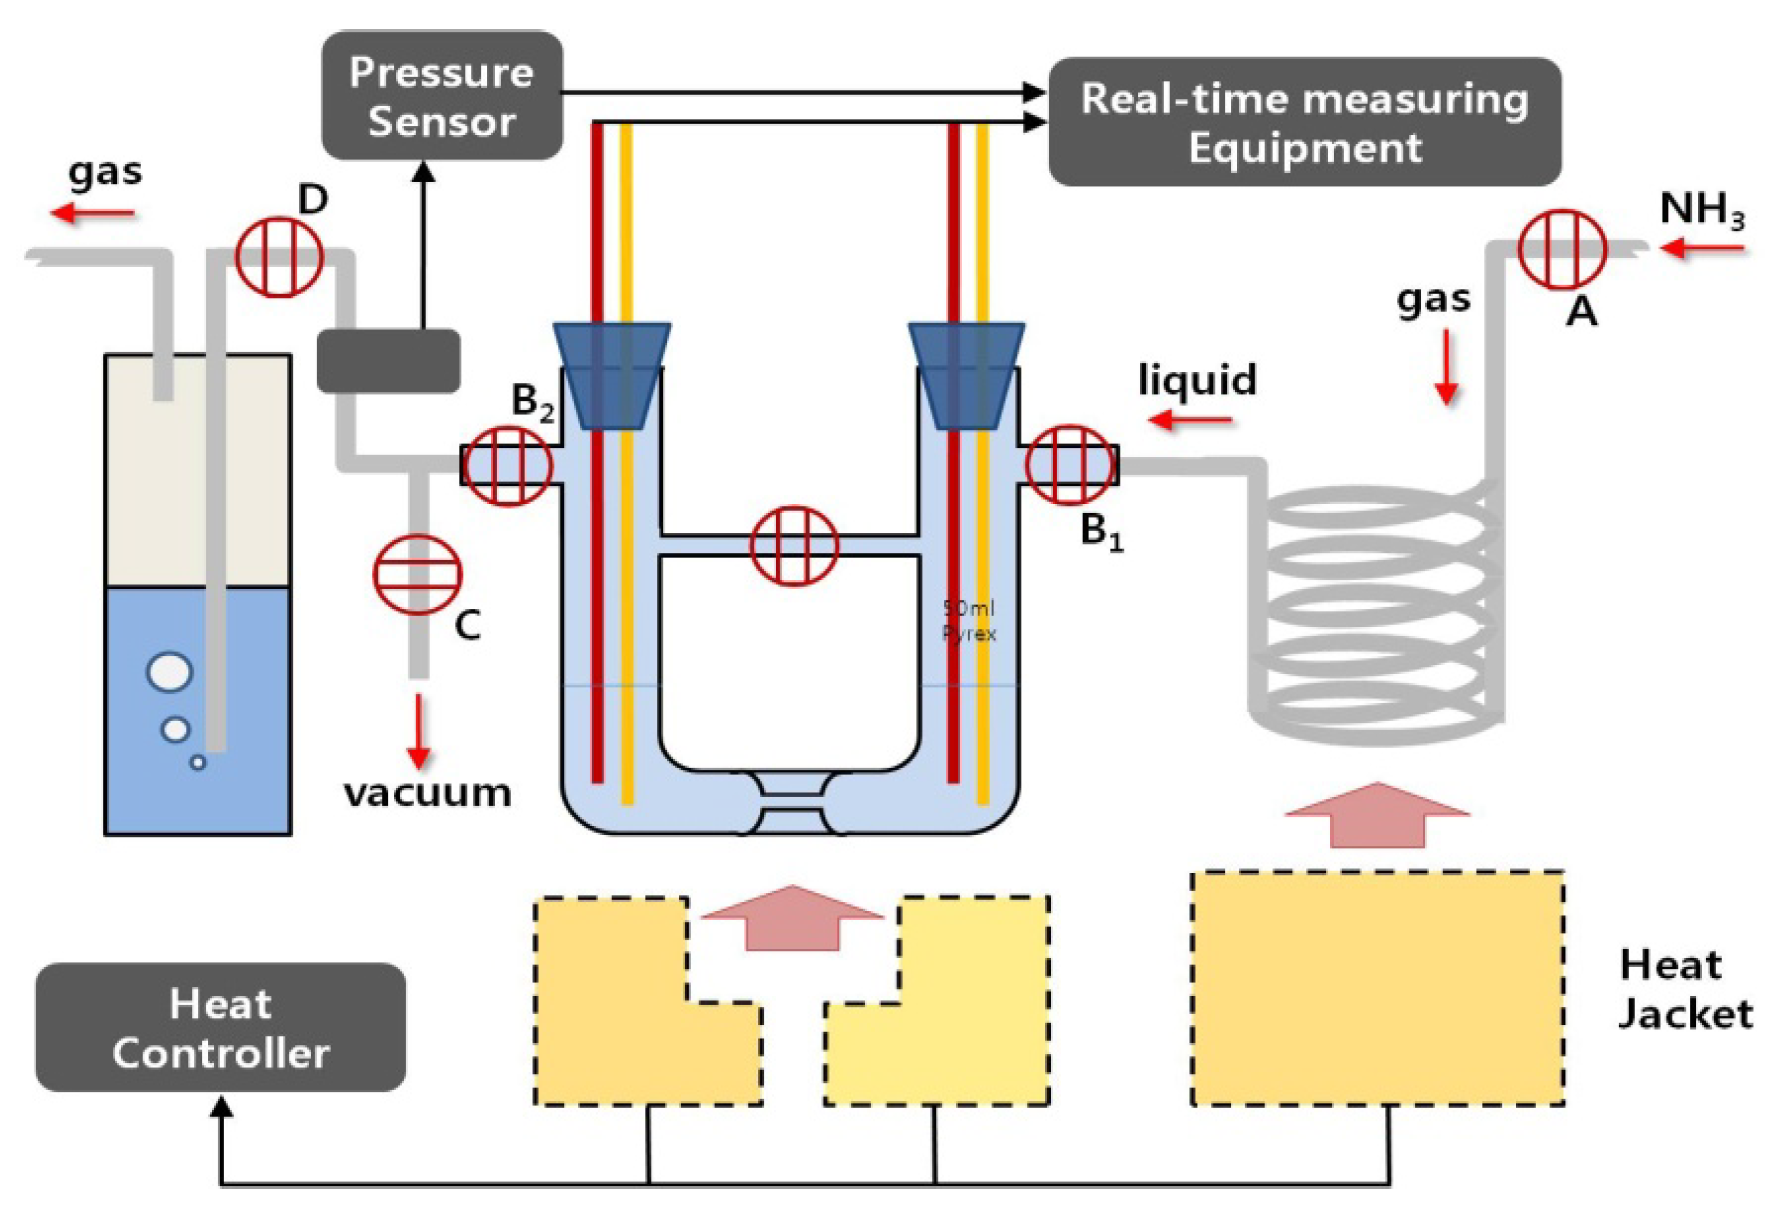
Figure 2 shows an overall thermoelectric experiment system used for this purpose, and the related specifications are also indicated in
Table 1.
Figure 1.
“Ʉ” shaped Pyrex cells: (a) no-waisted cell and (b) waisted cell.
Figure 1.
“Ʉ” shaped Pyrex cells: (a) no-waisted cell and (b) waisted cell.
Figure 2.
Overall thermoelectric experiment system used in this study for the preparation and decomposition of pure potassium-ammonia (K-NH3) solutions: injection of pure potassium into the cell is carried out in the glove box with an anhydrous and deoxidized inside. After that, both preparation and decomposition of the solutions proceed in the cell’s inside, in which a vacuum is recreated after the cell is connected to this system. A: NH3 gas input valve; B1: Liquid NH3 input valves; B2: NH3 gas exhausting valves; C: Vacuum control valve; and D: silicon oil exhausting trap.
Table 1.
The related specifications of Figure 1 and Figure 2.
| Device | Parameter | Unit | Value | Remarks |
|---|
| “Ʉ”-shaped cell | Gas passage diameter | mm | 2.0 | Pyrex |
| Diameter | mm | 15 |
| Height | mm | 240 |
| Volume | mL | 120 |
| Waist | mm | <1.5 |
| Electrode | Diameter | mm | 0.40 | Copper |
| Dipping length | mm | 10.0 |
| Electrode surface | mm2 | 1.38 |
| Resistance | Ω | 0.14 |
| Thermo-couple | Type | T type |
| Vacuum pump | Model | Kodivac, GHP-150 K |
| Specification | 181 L/min, 1.0 × 10⁻³ Torr |
| Multi-meter | Model | Keithley, 2700 |
| Specification | Range: 100 nV–1000 V/10 nA–3 A; Temperature: −200~1820 °C |
The process for the preparation of pure liquid K-NH
3 solutions, based on this system, is similar to the case of Li-NH
3 solutions [
18]. The cell is housed in a thermostatic container, which is set to keep the temperature at −45 °C. In addition, a vacuum is created inside the cell until the pressure in the 10
−3 Torr range is reached. This is to deoxidize the inside of the cell and to make a pure solution in an anhydrous state. Subsequently, a desired amount of pure potassium (99.999%) is injected into the vacuum cell, and liquid NH
3 is also injected into the cell until 50 mL of liquid NH
3 is filled. During the solution preparation, the pressure in the vacuum cell is about 760 Torr. To induce two separate phase transitions in the inside of the cell, a temperature difference between both sides is created. To do so, as shown in
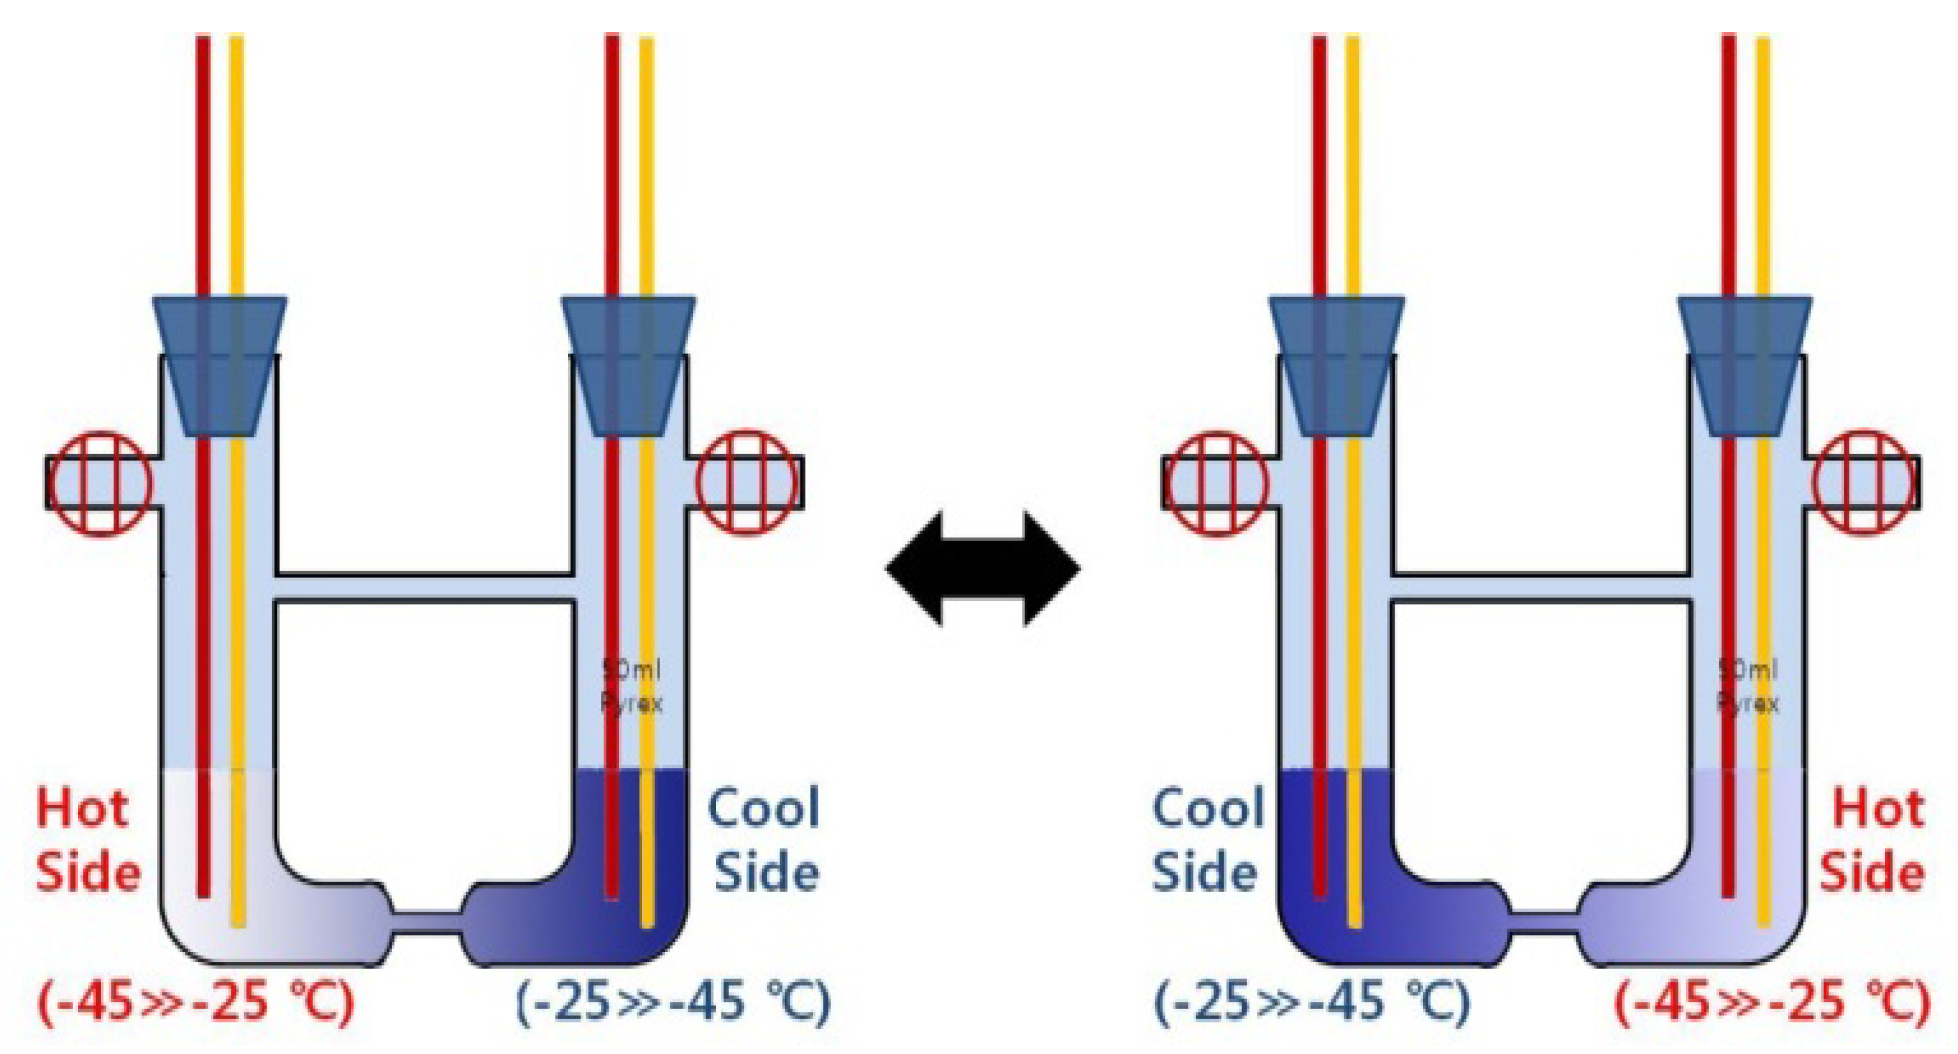
Figure 2, two heat generators are integrated on both sides of the cell and are housed (together with the cell) in a thermostatic container, which is set to keep the ambient temperature at −45 °C. Two heat sources increase or decrease in the temperature range from −45 °C to −25 °C, and are controlled within the accuracy of ±0.02 °C. To induce reversible reactions in the cell (for long-time thermoelectric power generation), the two heat sources are switched on both sides of the cell (
Figure 3)—
i.e., the hot-side heat source on either side is controlled so that the temperature is increased from −45 °C to −25 °C, whereas the cool-side heat source on the opposite side is controlled so that the temperature is decreased from −25 °C to −45 °C. This switching of the two heat sources is automatically carried out when the temperature difference between type-T thermocouples on both the end sides is approximately ±20 °C (the minus sign is due to the switching between the two heat sources). As aforementioned, this switching of the two heat sources on both sides of the cell will induce the decomposition of concentrated solutions, which are at a concentration range of 1.0–6.0 MPM, nearly two times the initial MPM.
Figure 3.
Control of the two heat sources on both sides of the cell: high and low temperatures induce “a phase transition to the dilute density” and “a phase transition to the concentrated density” in both sides of the cell, respectively.
Figure 3.
Control of the two heat sources on both sides of the cell: high and low temperatures induce “a phase transition to the dilute density” and “a phase transition to the concentrated density” in both sides of the cell, respectively.
4. Results and Discussion
Two kinds of thermoelectric experiments are performed with six kinds of pure liquid K-NH
3 solutions, which are at the concentrations of 0.5, 1.0, 1.5, 2.0, 2.5 and 3.0 MPM. The first thermoelectric experiment is to show the effectiveness of the gas passageway (“Ʉ”) for the NH
3 gas-pressure equilibrium in a cell of decomposing K-NH
3 solution, and the no-waisted cell (
Figure 1a) is used for this purpose. Next, to verify the effect of the narrow waist for the improvement of the current efficiency, according to a liquid flow increase in the middle, the waisted cell (
Figure 1b) is compared to the no-waisted cell of the same size. Then, each solution of the desired concentration is made by synthesizing a small piece of pure potassium (such as 0.3933, 0.7906, 1.1919, 1.5974, 2.0070 and 2.4210 g) upon the injection of liquid NH
3 50 mL (34.16 g) into the cell. A single decomposition run under a given concentration is carried out for about 1.2 h.
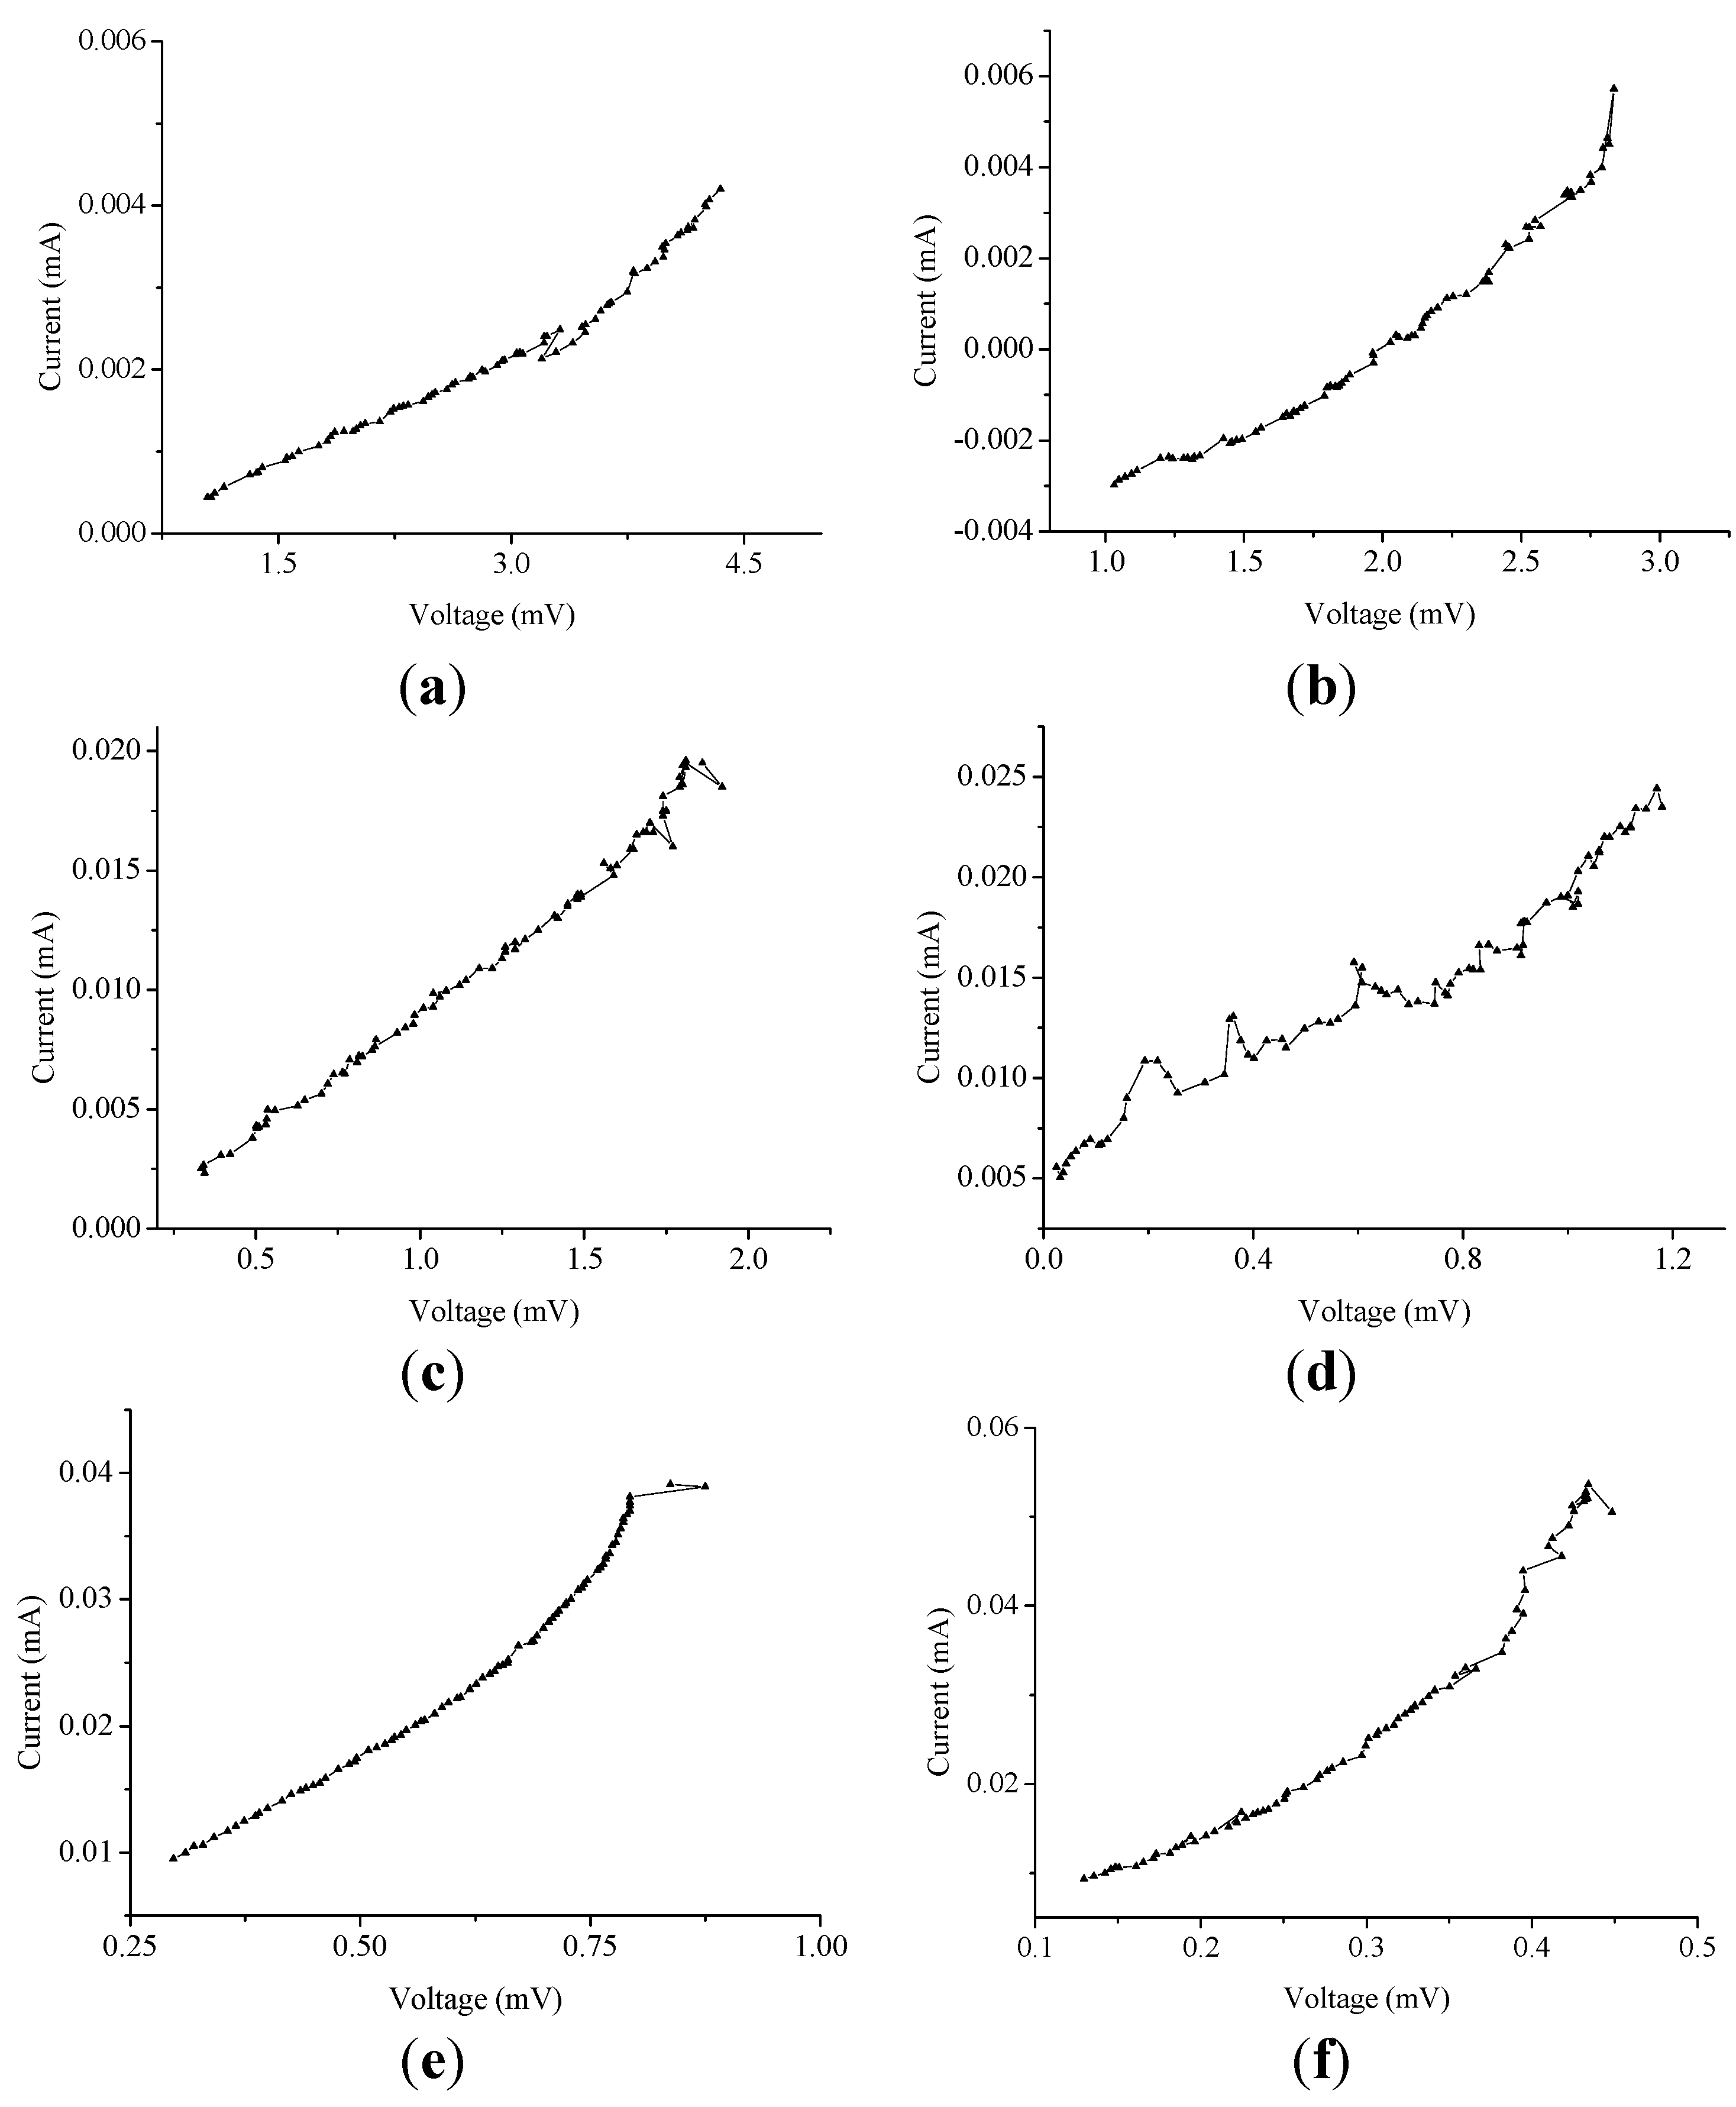
Figure 4 and
Figure 5 show the experimental results of measuring, in real time, the generating current and voltage due to the temperature difference (Δ
T) on both sides of the no-waisted cell during solution decomposition, where Δ
T is controlled in the range of −20 °C ≤ Δ
T ≤ 20 °C for a given 1.2 h. The related data of
Figure 4 and
Figure 5 are also indicated in
Table 2, where the resistance and the pressure are, respectively, the electrical resistance of liquid and the vapor pressure of gas that are in the cell of the decomposing K-NH
3 solution. From
Figure 4, it can be observed that the cell provided with the gas passageway can effectively derive an improved thermoelectric power cycles, as compared to
Figure 4 in reference [
18], by using a vacuum cell without the gas passageway.
Figure 4.
Thermoelectric characteristics due to ΔT variation for (a) 0.5; (b) 1.0; (c) 1.5; (d) 2.0; (e) 2.5; and (f) 3.0 MPM (mole percent metal).
Figure 4.
Thermoelectric characteristics due to ΔT variation for (a) 0.5; (b) 1.0; (c) 1.5; (d) 2.0; (e) 2.5; and (f) 3.0 MPM (mole percent metal).
In particular, the proposed device provides excellent stable linearity for reversible reaction—
i.e., both voltage and current increase or decrease simultaneously as Δ
T increases or decreases with the change of time from 0 h to 1.2 h. This linearity between the voltage and current is also shown in
Figure 5, where the slope of a line represents the reciprocal of an electrical resistance which is constant within an error tolerance range (see
Table 2).
Figure 5.
The current vs. voltage characteristics (for 1.2 h) due to (a) 0.5; (b) 1.0; (c) 1.5; (d) 2.0; (e) 2.5; and (f) 3.0 MPM.
Figure 5.
The current vs. voltage characteristics (for 1.2 h) due to (a) 0.5; (b) 1.0; (c) 1.5; (d) 2.0; (e) 2.5; and (f) 3.0 MPM.
This electrical resistance is an important factor in determining the electrical conductivity of decomposing K-NH
3 solution in a cell. In addition, as indicated in
Table 2, an increase in the potassium concentration shows that the peak-to-peak voltage decreases with an average of 31% per 0.5 MPM; however, the peak-to-peak current increases with a higher average of 57% per 0.5 MPM. This result is due to the improved electrical conductivity of liquids,
i.e., the average 655.458 Ω in 0.5 MPM is reduced considerably to 9.798 Ω in 3.0 MPM. Remarkably, during decomposition, the vapor pressure (due to NH
3 gasification) inside the cell is shown to be within the acceptable limits (a maximum variation of 9%) and appears to be perfectly controlled by the gate passageway, which helps to provide equal inner pressure to both the end sides. From these results, we can figure out that the gas passageway provides an improved reversibility for reliable and stable thermoelectric power conversion through K-NH
3 solutions. Consequently, it can play a critical role in realizing thermoelectric devices for deriving long-time, high-efficiency thermoelectric power.
Table 2.
Related data of Figure 4 and Figure 5.
| MPM | K (g) | NH3 (mL) | Peak-to-peak voltage (mV) | Peak-to-peak current (mA) | Voltage range (mV) | Current range (mA) | Resistance (Ω) | Pressure (Bar) |
|---|
| 0.5 | 0.3933 | 50 | 5.224 | 0.00797 | −0.644~4.580 | −0.0031~0.0048 | 655.458 ± 61.284 | 1.33 ± 0.17 |
| 1.0 | 0.7906 | 50 | 3.700 | 0.02458 | −0.520~3.180 | −0.0175~0.0070 | 150.528 ± 24.256 | 1.55 ± 0.16 |
| 1.5 | 1.1919 | 50 | 2.797 | 0.03730 | −0.827~1.970 | −0.0129~0.0244 | 74.987 ± 4.577 | 1.73 ± 0.17 |
| 2.0 | 1.5974 | 50 | 2.161 | 0.04690 | −0.801~1.360 | −0.0169~0.0300 | 46.077 ± 14.008 | 1.82 ± 0.17 |
| 2.5 | 2.0070 | 50 | 1.316 | 0.06920 | −0.441~0.875 | −0.0245~0.0447 | 19.017 ± 1.964 | 1.87 ± 0.15 |
| 3.0 | 2.4210 | 50 | 0.714 | 0.07287 | −0.266~0.448 | −0.0192~0.0537 | 9.798 ± 1.387 | 1.89 ± 0.13 |
It is known that the electric resistivity of a liquid may be deduced by measuring the value of the electrically conductive resistance between two electrodes immersed in the liquid. The resistivity
r (that is the inverse of the conductivity) will be, in that case, theoretically provided with the formula:
r = resistance/(liquid volume) in Ω cm
−3,
i.e., it will be equal to the measured resistance divided by the volume between the electrodes. Based on this theoretical work,
Figure 6 illustrates the electrical conductivity results of the liquids, according to the concentration for the performance comparison of the waisted and the no-waisted cells (see
Figure 2).
Figure 6.
Performance comparison of the waisted and no-waisted cells due to potassium concentration (the current and voltage data for each given MPM is to average the measured data with about 1.2 h): (a) current; (b) voltage; (c) resistivity; and (d) conductivity.
Figure 6.
Performance comparison of the waisted and no-waisted cells due to potassium concentration (the current and voltage data for each given MPM is to average the measured data with about 1.2 h): (a) current; (b) voltage; (c) resistivity; and (d) conductivity.
The related data is also indicated in
Table 3, where all current and voltage data are time average values calculated from the measured data for about 1.2 h. From these results, it can be found that the waisted cell generates an average of 0.5 times lower voltage, but an average of 1.8 times higher current than the no-waisted cell—
i.e., the waisted cell amplifies current, not voltage. This is due to the fact that the resistance reduction (
Figure 6c) engenders electrical conductivity improvement (
Figure 6d) of decomposing liquid solutions. In addition, in the low concentration range below 1.5 MPM (corresponding to about 3.0 MPM in the cool side region during decomposition), the waisted cell’s current amplification is slightly high, but the voltage drop is relatively much higher, whereas in the high concentration range beyond 2.0 MPM (corresponding to about 4.0 MPM in the cool side region), the current amplification is much higher, but the voltage drop is relatively slightly higher.
Table 3.
Related data of Figure 6.
| MPM | Potassium (g) | Average Voltage (mV) | Average Current (mA) | Resistance (Ω) | Resistivity (Ω cm−3) | Conductivity (Ω −1 cm3) |
|---|
| 0.5 | 0.3933 | 1.1310 (2.6130) | 0.0184 (0.0040) | 61.4674 (653.2500) | 1.2293 (13.0650) | 0.8134 (0.0765) |
| 1.0 | 0.7906 | 0.9240 (1.8490) | 0.0335 (0.0123) | 27.5821 (150.3252) | 0.5516 (3.0065) | 1.8128 (0.3326) |
| 1.5 | 1.1919 | 0.7580 (1.3880) | 0.0415 (0.0187) | 18.2651 (74.2246) | 0.3653 (1.4845) | 2.7375 (0.6736) |
| 2.0 | 1.5974 | 0.5270 (0.9810) | 0.0518 (0.0234) | 10.1737 (41.9231) | 0.2035 (0.8385) | 4.9146 (1.1927) |
| 2.5 | 2.0070 | 0.3200 (0.6580) | 0.0699 (0.0346) | 4.5780 (22.3051) | 0.0916 (0.4461) | 10.9219 (2.2416) |
| 3.0 | 2.4210 | 0.1530 (0.3570) | 0.0976 (0.0365) | 1.5676 (9.7808) | 0.0314 (0.1956) | 31.8954 (5.1120) |
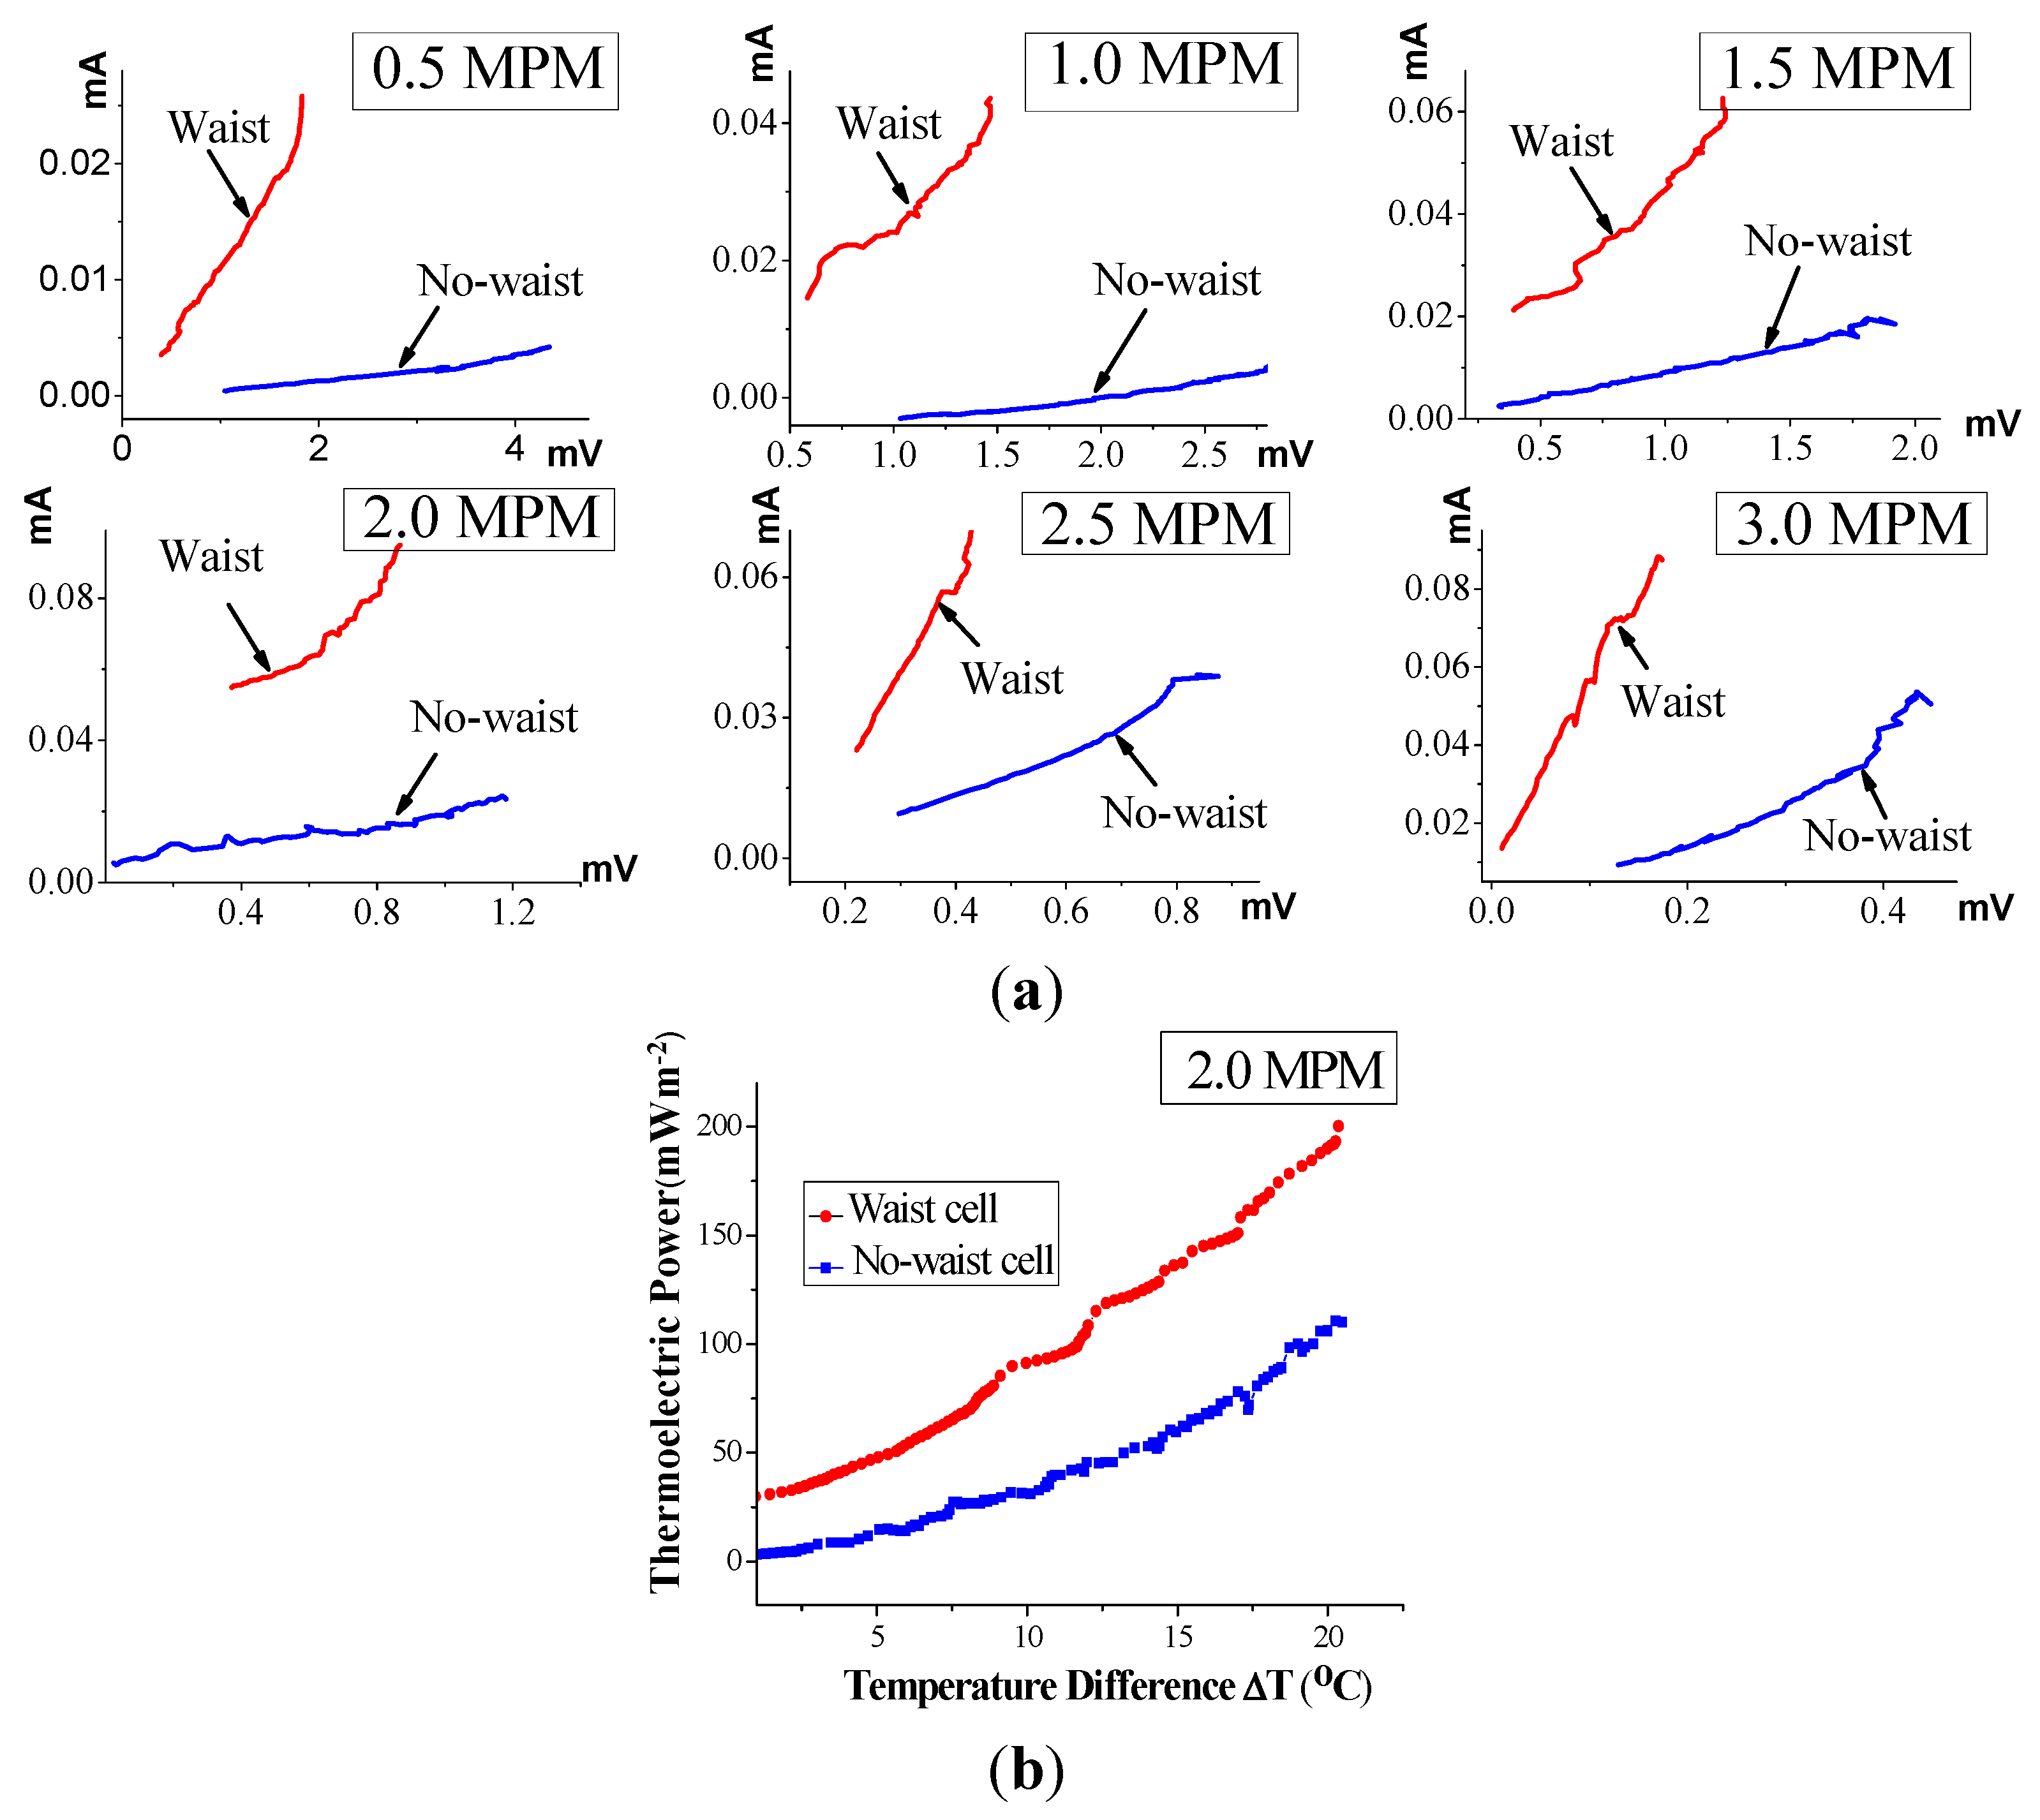
Figure 7, which uses the waisted and the no-waisted cells, shows the current
vs. voltage (
i.e., the inverse of an electrical resistance) characteristics and 2.0 MPM thermoelectric conversion efficiency over the Δ
T interval of 0–20 °C (corresponding to the time interval from 2400 s to 3200 s in the case of
Figure 4), where all data is determined by simultaneously measuring the generating current and voltage in cells of decomposing K-NH
3 solutions, as mentioned above.
From
Figure 7a, the electrical conductivity of liquid in the waisted cell is verified to be vastly improved, much more markedly than in the no-waisted cell. In particular, the average thermoelectric power increase per degree, calculated with the electrode surface, is approximately 10.0 mW m
−2/°C in the case of the waste cell, whereas it is 5.5 mW m
−2/°C in the case of the no-waste cell (
Figure 7b). This corresponds to a performance increase by approximately 81%. Consequently, the waisted cell leads to much higher electrical conductivity of liquid than the no-waisted cell, and thereby, can drive higher-efficiency thermoelectric power. From these results, we can figure out that during solution decomposition, the narrow waist in the cell’s middle leads to increasing the flow of free electrons from the high- to low-temperature regions. Consequently, this produces an avalanche amplification of electrical current in the middle, resulting in a situation comparable to the Venturi effect in hydrodynamics [
19,
20].
Figure 7.
Thermoelectric comparison of the waisted and no-waisted cells over the ΔT interval of 0–20 °C (the time interval from 2400 s to 3200 s): (a) real-time current vs. voltage characteristics; and (b) 2.0 MPM thermoelectric power density.
Figure 7.
Thermoelectric comparison of the waisted and no-waisted cells over the ΔT interval of 0–20 °C (the time interval from 2400 s to 3200 s): (a) real-time current vs. voltage characteristics; and (b) 2.0 MPM thermoelectric power density.


