2.2. The Path of Steepest Ascent
The path of steepest ascent was used in order to approach the proper direction of the changing variable. Results indicated that an increase in substrate concentration from 20 to 25 g-total sugar/L resulted in an increase in
Ps and SHPR by 22.74% and 22.71% (
Table 2), respectively. An increase in substrate concentration greater than 25 g-total sugar/L caused a decrease in
Ps and SHPR by 13.18% and 13.16%, respectively. Based on these results, the selected range of substrate concentration of 20–30 g-total sugar/L was used in the optimization step through RSM with CCD.
Ps and SHPR were increased with a decrease in initial pH from 6.0 to 5.5. A further decrease in the initial pH to less than 5.5 resulted in a decrease in
Ps and SHPR (
Table 2). The highest
Ps and SHPR of 4680 mL H
2/L and 65.87 mL H
2/g-VSS h, respectively, were achieved at the initial pH of 5.5. Therefore the selected range of initial pH used in the optimization experiment was chosen to be between 6.0 and 5.0 g/L.
The effect of FeSO4 concentration on Ps and SHPR was also investigated. The highest Ps and SHPR of 4680 mL H2/L and 65.87 mL H2/g-VSS h were obtained at 0.8 g/L FeSO4. Based on this result, the FeSO4 concentration that ranged between 1.0 to 0.6 g/L was used in the optimization experiment. The results from the path of steepest ascent indicated that the selected ranges of substrate concentration, initial pH and FeSO4 concentration to be used in the optimization study were 20–30 g-total sugar/L, 6.0–5.0 g/L, and 1.0–0.6 g/L, respectively.
Table 2.
Results and experimental design of the path of steepest ascent.
Table 2.
Results and experimental design of the path of steepest ascent.
| Run | Substrate concentration (g-total sugar/L) | Initial pH | FeSO4 concentration (g/L) | Ps (mL H2/L) | SHPR (mL H2/g-VSS h) |
|---|
| 1 | 20 | 6.0 | 1.0 | 3616 | 50.91 |
| 2 | 25 | 5.5 | 0.8 | 4680 | 65.87 |
| 3 | 30 | 5.0 | 0.6 | 4063 | 57.20 |
| 4 | 35 | 4.5 | 0.4 | 3033 | 42.70 |
| 5 | 40 | 4.0 | 0.2 | 2702 | 38.03 |
2.3. Optimization of Substrate Concentration, Initial pH, and FeSO4 Concentration on Ps Using RSM with CCD
CCD was used to optimize substrate concentration, initial pH, and FeSO
4 concentration on
Ps. Regression analysis of the data from
Table 3 resulted in the quadratic equation [Equation (1)] as follows:
where
Ps is the hydrogen production potential; and
X1,
X2 and
X3 are the substrate concentration, initial pH, and FeSO
4 concentration, respectively. The model showed a high determination coefficient (
R2 = 0.99), explaining 99% of the variability in the response. A very low probability (
p < 0.0001) obtained from the regression analysis of variance (ANOVA) demonstrated that the model was significant (
Table 4).
The significance of the variables was determined by the probability values (
Table 4). Results showed that substrate concentration (
X1), initial pH (
X2), and FeSO
4 concentration (
X3) had a significant individual effect on
Ps (
p ≤ 0.05). The quadratic model terms of all variables (
X12,
X22 and
X32) are highly significant (
p ≤ 0.0001). A significant interaction effect on
Ps was found between substrate concentration and initial pH (
X1X2), substrate concentration and FeSO
4 concentration (
X1X3), and initial pH and FeSO
4 concentration (
X2X3) (
p ≤ 0.05). Based on the regression analysis of the model [Equation (1)], the maximum
Ps of 5425 mL H
2/L could be predicted at the substrate concentration of 25 g-total sugar/L, initial pH of 5.56 and FeSO
4 concentration of 0.78 g/L. The response surface plots based on Equation (1), with one variable kept constant at their optimum values and variations of the other two variables within the experimental range are depicted in
Figure 1. Results indicated that the optimum conditions for maximum
Ps fell well inside the design boundaries.
Table 3.
Central composite experimental design matrix defining pH, substrate concentration and FeSO4 concentration for optimizing the fermentative hydrogen production process and the corresponding experimental results.
Table 3.
Central composite experimental design matrix defining pH, substrate concentration and FeSO4 concentration for optimizing the fermentative hydrogen production process and the corresponding experimental results.
| Run | Substrate concentration (X1) (g-total sugar/L) | Initial pH (X2) | FeSO4 concentration (X3) (g/L) | Ps (mL H2/L) | SHPR (mL H2/g-VSS h) |
|---|
| Code value | Actual value | Code value | Actual value | Code value | Actual value | Observed | Predicted | Observed | Predicted |
|---|
| 1 | 0.00 | 25.00 | 0.00 | 5.50 | 0.00 | 0.80 | 5332 | 5317 | 75.05 | 74.85 |
| 2 | 0.00 | 25.00 | 0.00 | 5.50 | 0.00 | 0.80 | 5306 | 5317 | 74.68 | 74.85 |
| 3 | 1.00 | 30.00 | 1.00 | 6.00 | 1.00 | 1.00 | 4137 | 4139 | 58.23 | 58.21 |
| 4 | −1.00 | 20.00 | −1.00 | 5.00 | 1.00 | 1.00 | 3875 | 3695 | 54.54 | 52.27 |
| 5 | 0.00 | 25.00 | 0.00 | 5.50 | 0.00 | 0.80 | 5337 | 5317 | 75.13 | 74.85 |
| 6 | 1.00 | 30.00 | −1.00 | 5.00 | −1.00 | 0.60 | 4237 | 4200 | 59.64 | 59.07 |
| 7 | 1.68 | 33.41 | 0.00 | 5.50 | 0.00 | 0.80 | 4464 | 4391 | 62.84 | 61.79 |
| 8 | −1.00 | 20.00 | −1.00 | 5.00 | −1.00 | 0.60 | 3562 | 3483 | 50.14 | 49.03 |
| 9 | 0.00 | 25.00 | 0.00 | 5.50 | −1.68 | 0.46 | 3606 | 3651 | 50.76 | 51.36 |
| 10 | 0.00 | 25.00 | −1.68 | 4.66 | 0.00 | 0.80 | 3815 | 3926 | 53.7 | 55.33 |
| 11 | 0.00 | 25.00 | 0.00 | 5.50 | 1.68 | 1.14 | 3853 | 3919 | 54.24 | 55.24 |
| 12 | 1.00 | 30.00 | 1.00 | 6.00 | −1.00 | 0.60 | 3957 | 4032 | 55.7 | 56.85 |
| 13 | −1.00 | 20.00 | 1.00 | 6.00 | 1.00 | 1.00 | 4317 | 4276 | 60.77 | 60.21 |
| 14 | 1.00 | 30.00 | −1.00 | 5.00 | 1.00 | 1.00 | 3916 | 3935 | 55.12 | 55.39 |
| 15 | 0.00 | 25.00 | 0.00 | 5.50 | 0.00 | 0.80 | 5194 | 5317 | 73.12 | 74.85 |
| 16 | −1.68 | 16.59 | 0.00 | 5.50 | 0.00 | 0.80 | 3721 | 3904 | 52.38 | 55.04 |
| 17 | 0.00 | 25.00 | 0.00 | 5.50 | 0.00 | 0.80 | 5340 | 5317 | 75.17 | 74.85 |
| 18 | −1.00 | 20.00 | 1.00 | 6.00 | −1.00 | 0.60 | 3789 | 3692 | 53.33 | 51.93 |
| 19 | 0.00 | 25.00 | 1.68 | 6.34 | 0.00 | 0.80 | 4275 | 4274 | 60.18 | 60.14 |
| 20 | 0.00 | 25.00 | 0.00 | 5.50 | 0.00 | 0.80 | 5413 | 5317 | 76.2 | 74.85 |
Table 4.
Model coefficients estimated by multiple linear regressions.
Table 4.
Model coefficients estimated by multiple linear regressions.
| Factor | Ps (mL H2/L) | SHPR (mL H2/g-VSS h) |
|---|
| Coefficient estimate | Probability | Coefficient estimate | Probability |
|---|
| Model | 5317.17 | <0.0001 | 74.85 | <0.0001 |
| X1 | 145 | 0.0009 | 2.01 | 0.0012 |
| X2 | 103.31 | 0.0076 | 1.43 | 0.0101 |
| X3 | 79.71 | 0.0278 | 1.15 | 0.0286 |
| X1X2 | −94.42 | 0.0419 | −1.28 | 0.0543 |
| X1X3 | −119.46 | 0.0145 | −1.73 | 0.0148 |
| X2X3 | 93 | 0.0445 | 1.26 | 0.0576 |
| X12 | −413.53 | <0.0001 | −5.81 | <0.0001 |
| X22 | −430.37 | <0.0001 | −6.05 | <0.0001 |
| X32 | −541.86 | <0.0001 | −7.62 | <0.0001 |
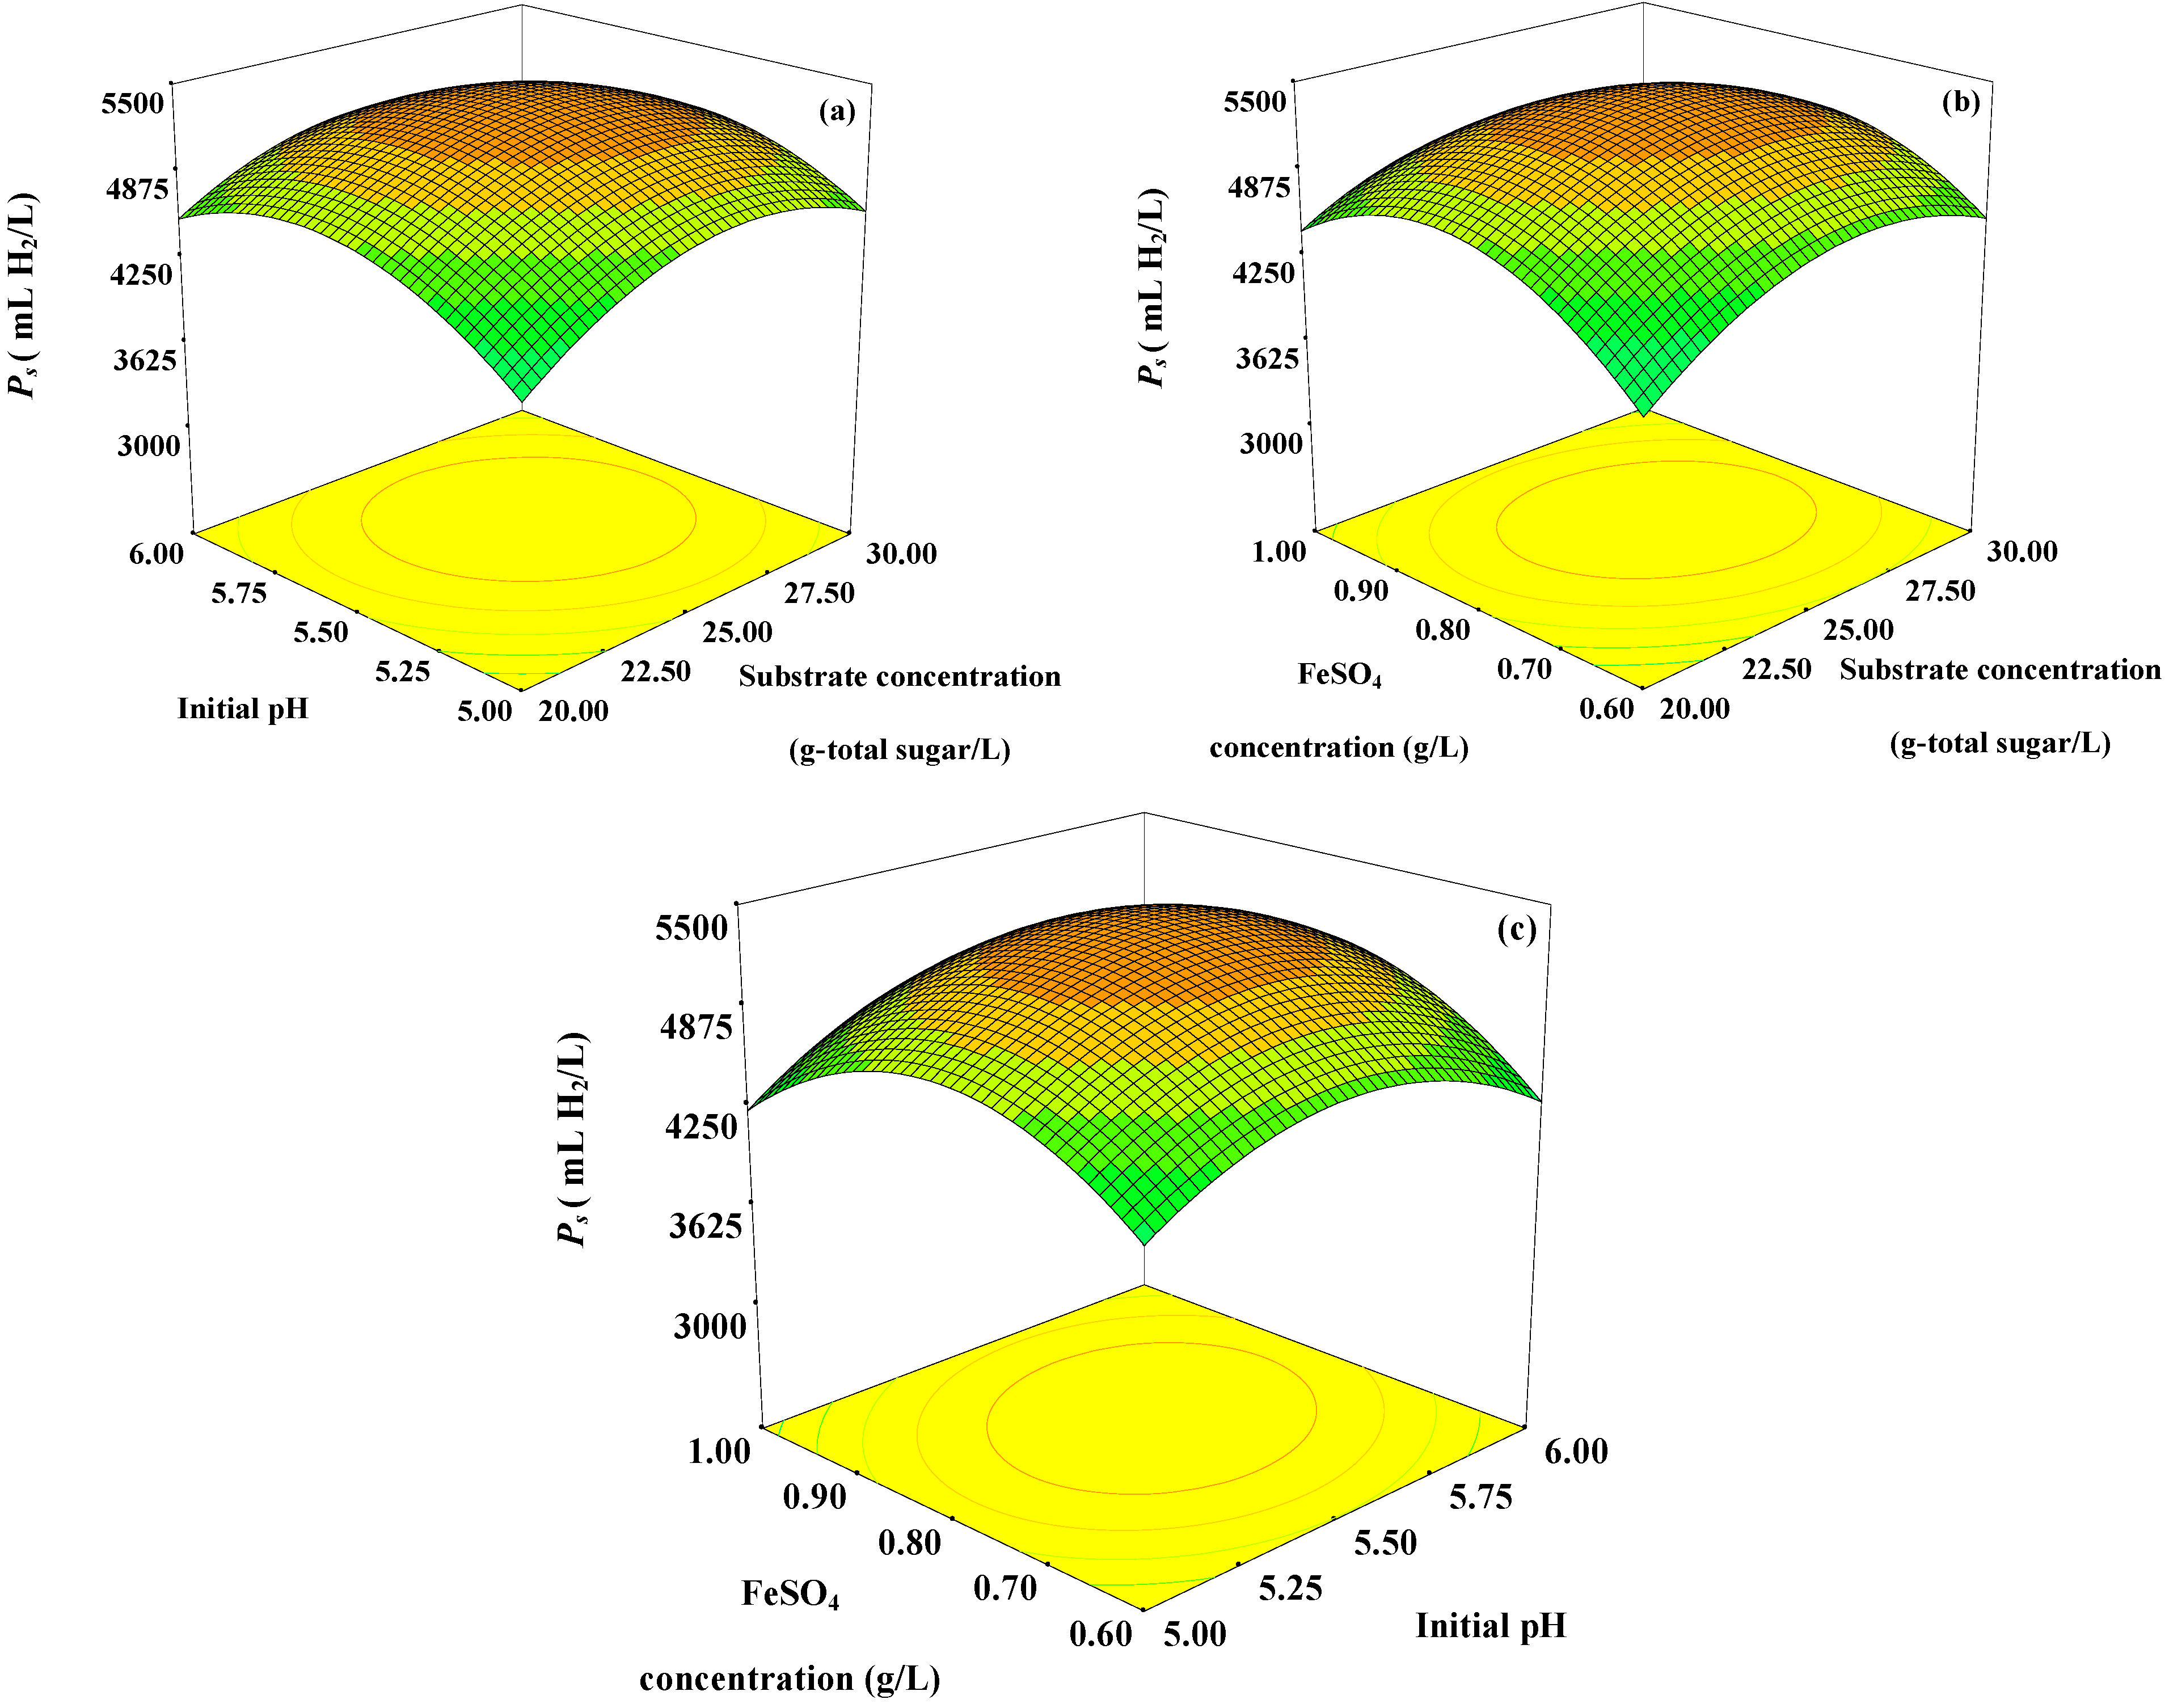
Figure 1.
Response surface plots showing (a) the effects of initial pH, substrate concentration, and their mutual interaction on Ps with optimum level of FeSO4 concentration (0.78 g/L); (b) the effects of FeSO4 concentration, substrate concentration and their mutual interaction on Ps with optimum level of initial pH (5.56); and (c) the effects of FeSO4 concentration, initial pH and their mutual interaction on Ps with optimum level of substrate concentration (25 g-total sugar/L).
The
Ps increased with increasing substrate concentration up to 25 g-total sugar/L. Further increase in substrate concentration greater than 25 g-total sugar/L resulted in lower
Ps (
Figure 1a,b). This might be due to substrate and product (VFAs) inhibitions. A high substrate concentration, not exceeding the substrate inhibition level, in the fermentation broth resulted in a high
Ps because substrate was used to produce hydrogen. An increase in the substrate concentration higher than optimum level might develop osmotic pressure inside the microbial cells, which can cause cell damage due to the permeation of water molecules out of the cells [
12]; hence a reduction of hydrogen production occurred. In addition, an increase in substrate concentration could have led to a partial pressure of hydrogen build-up in the fermentation system. When the partial pressure accumulates in the headspace of the serum bottle to a certain level, hydrogen production will be switched to solvent production, thus hydrogen production was inhibited [
13]. Therefore, the substrate concentration should be optimized in order to prevent the shock loads of the system [
14].
The
Ps increased when the initial pH increased from pH 5.00 to 5.56. However, a further increase in initial pH to levels greater than pH 5.56 resulted in a decrease in
Ps (
Figure 1a,c). The initial pH is an important factor in hydrogen production because it affects metabolic pathways, iron (Fe)-hydrogenase activity and the duration of the lag phase [
13,
14,
15,
16,
17,
18]. When the initial pH was high, the metabolic pathway will have shifted from acidogenesis to solventogenesis [
13,
14,
15,
16,
17,
18]. The low initial pH value of pH 4.0–4.5 was reported to cause a long lag period [
13]. In contrast, a high initial pH value, for example pH 9.0 could decrease the lag time but it would result in a low level of hydrogen production [
13,
14,
15,
16,
17,
18,
19].
An increase in the FeSO
4 concentration from 0.60 to 0.78 g/L increased the
Ps (
Figure 1a,c). However, the results indicated that
Ps was decreased when the FeSO
4 concentration was greater than 0.78 g/L. Iron is needed in hydrogen production by anaerobic fermentation because it forms ferredoxin and hydrogenase, which is directly related to the hydrogen production process. Iron can affect the fermentative production of hydrogen by influencing the activity of hydrogenases [
20,
21,
22,
23]. The optimum iron concentration could enhance fermentative hydrogen production by mixed cultures, while lower or higher iron concentrations than optimum range could reduce the activity of hydrogenases [
20,
21,
22,
23].
2.4. Optimization of Substrate Concentration, Initial pH, and FeSO4 Concentration on SHPR Using RSM with CCD
Optimization of substrate concentration, initial pH, and FeSO
4 concentration on SHPR was conducted using RSM with CCD. The observed and predicted values of SHPR are presented in
Table 3. Multiple regression analysis was applied to the data in
Table 3 and the second-order polynomial equation [Equation (2)] obtained could well explain the SHPR values:
where SHPR is the specific hydrogen production rate and
X1,
X2 and
X3 are the codes of substrate concentration, initial pH, and FeSO
4 concentration, respectively. The quadratic regression model indicated that the model was significant with a low probability (
p < 0.0001). All variables,
i.e., substrate concentration, initial pH, and FeSO
4 concentration showed probability values of less than 0.05, which indicated their significant individual effect on SHPR (
Table 4). The quadratic model terms of all variables (
X12,
X22 and
X32) are highly significant (
p ≤ 0.0001). A significant interactive effect on SHPR was found between substrate concentration and FeSO
4 concentration (
X1X3) (
Table 4). Based on the regression analysis of the model [Equation (2)], the maximum SHPR of 75.27 mL H
2/g-VSS h could be predicted at the substrate concentration of 25.06 g-total sugar/L, initial pH of 5.50 and FeSO
4 concentration of 0.81 g/L.
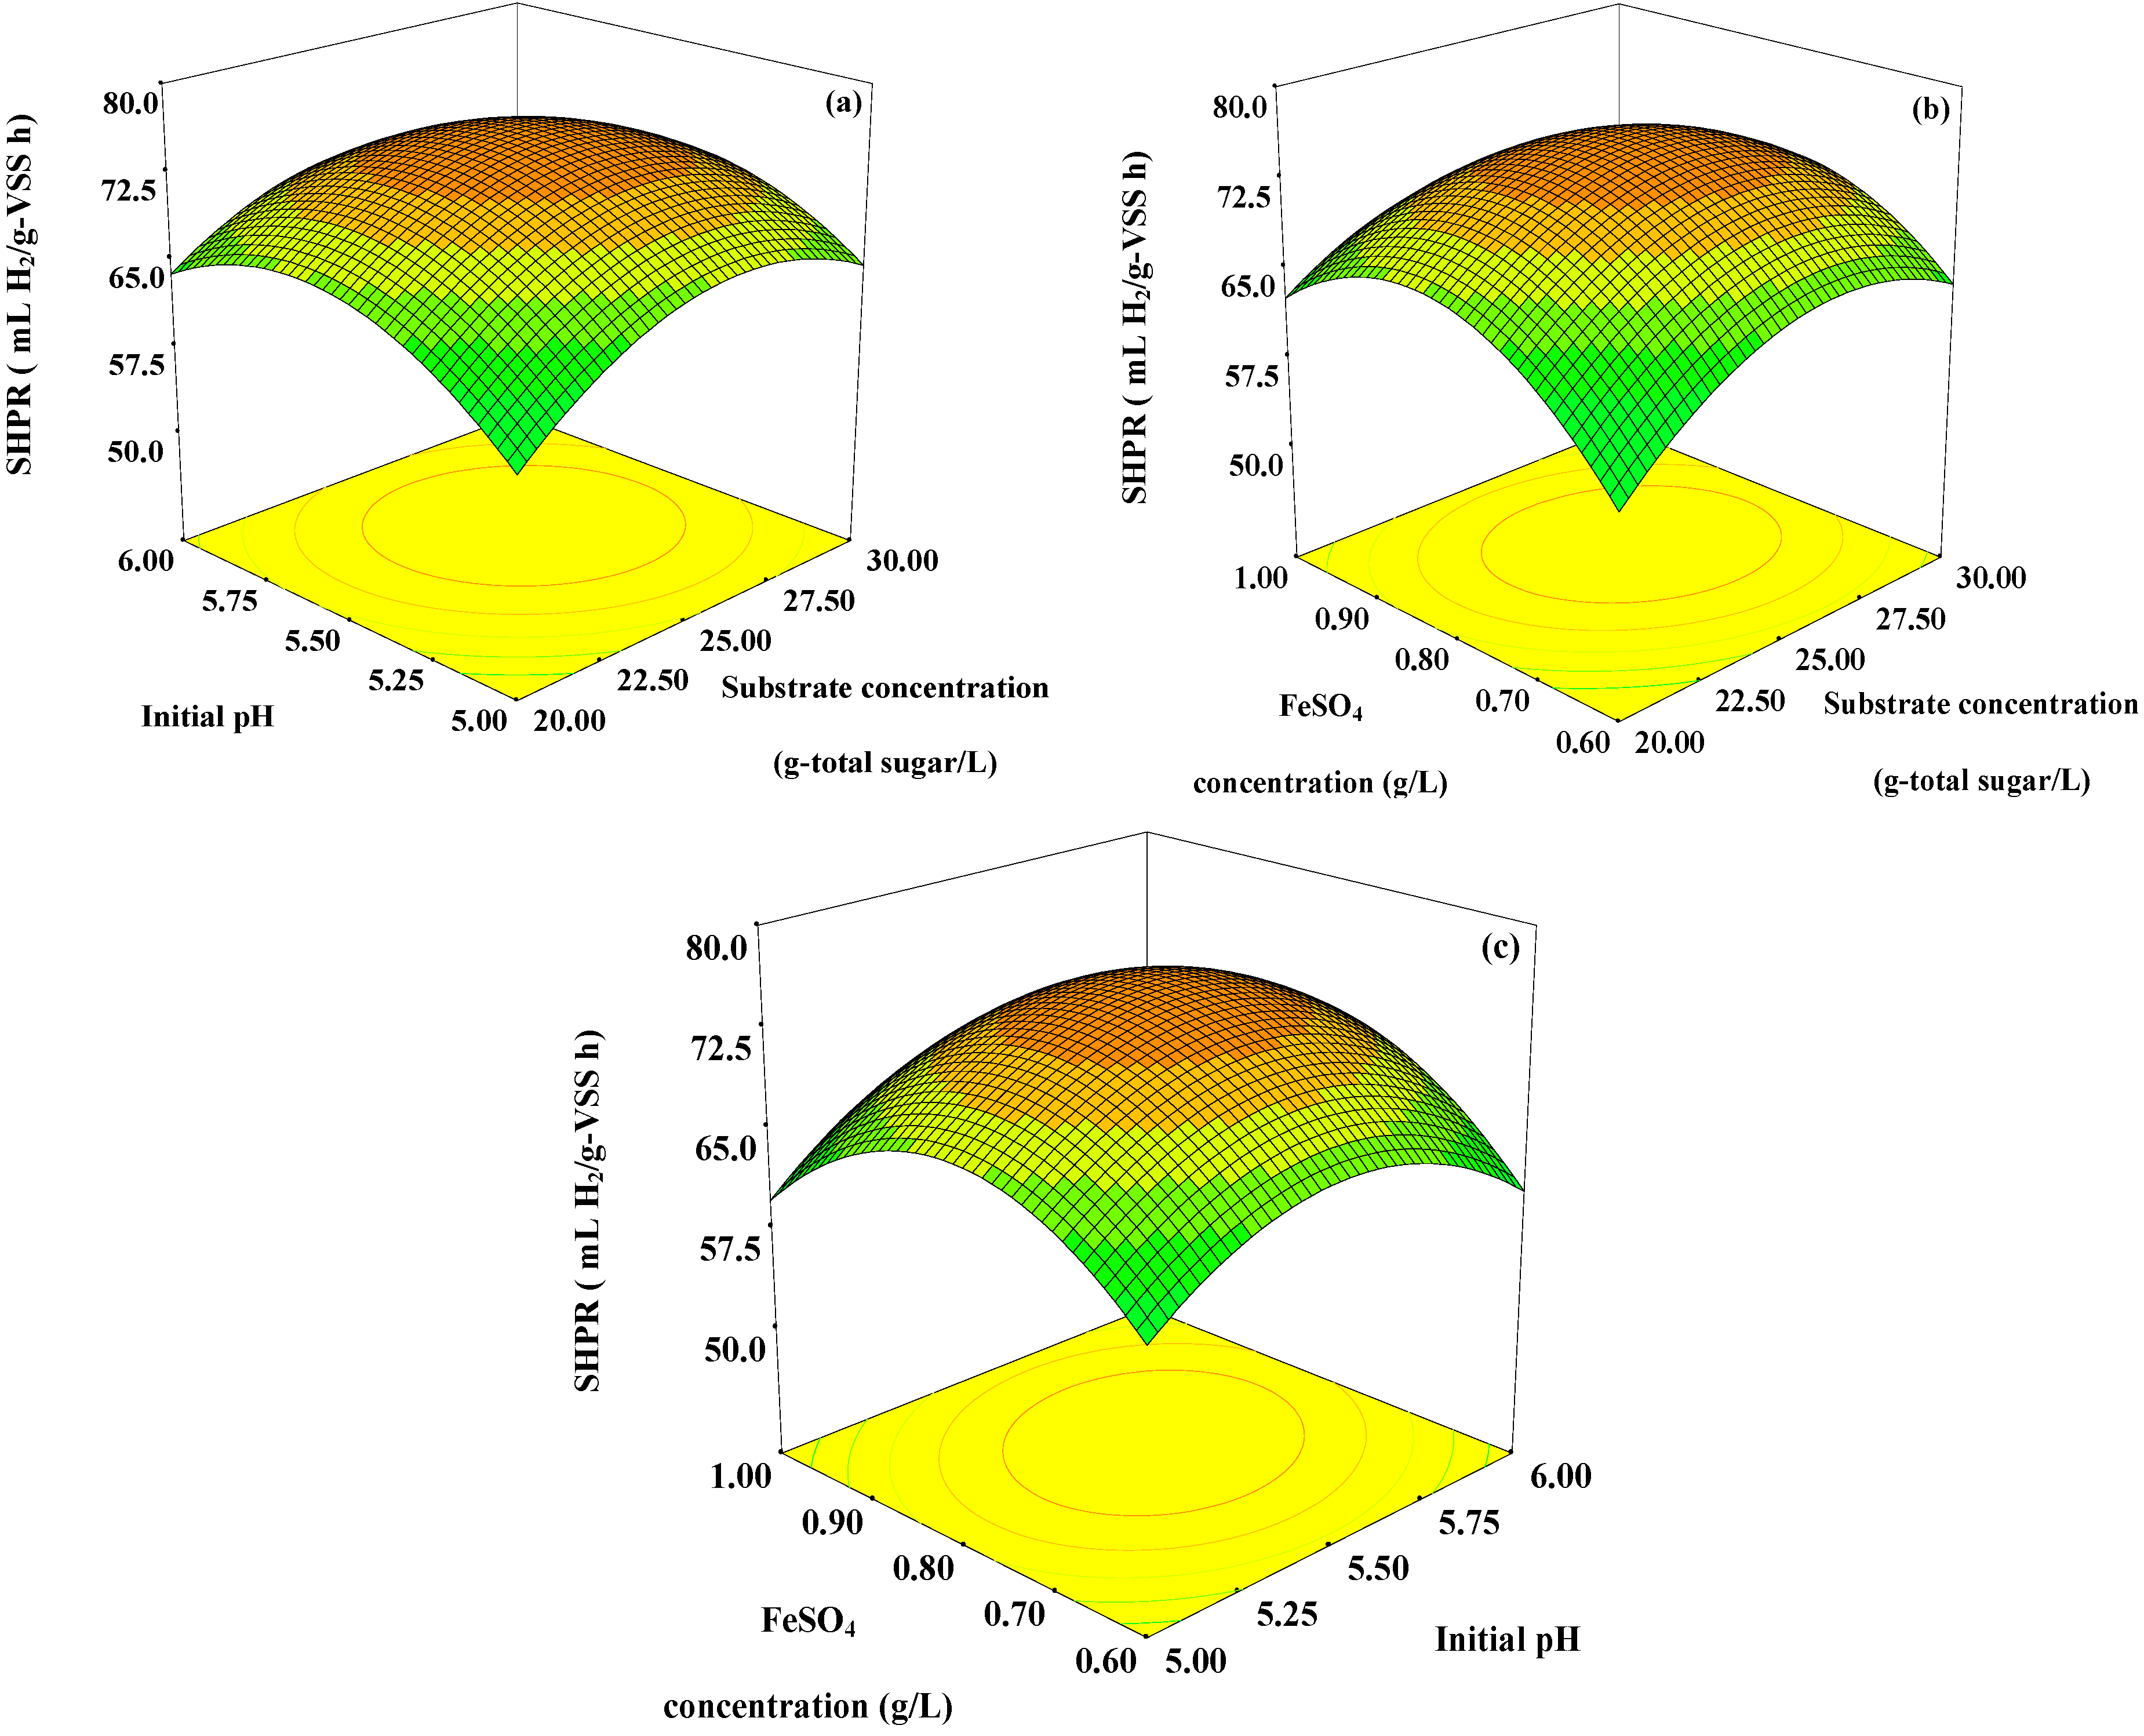
The response surface plots based on Equation (2), with one variable kept constant at their optimum values and variations of the other two variables within the experimental range, are depicted in
Figure 2. SHPR increased when the substrate concentration increased from 20 to 25 g-total sugar/L and then SHPR slightly decreased with a further increase in substrate concentration (
Figure 2a,b). The substrate limitation and substrate inhibition effects might be responsible for our findings [
19,
24,
25]. Within the appropriate range, an increase in substrate concentration could improve the ability of hydrogen producing bacteria to produce hydrogen during the fermentation process [
19,
24,
25]. However, a high substrate concentration could result in a high concentration of the short chain organic acid contained in pineapple waste extract and a low pH of the fermentation broth, which might be toxic to the growth of hydrogen producing bacteria.
Figure 2.
Response surface plots showing: (a) the effects of initial pH, substrate concentration, and their mutual interaction on SHPR with optimum level of FeSO4 concentration (0.81 g/L); (b) the effects of FeSO4 concentration, substrate concentration and their mutual interaction on SHPR with optimum level of initial pH (5.50); and (c) the effects of FeSO4 concentration, initial pH and their mutual interaction on SHPR with optimum level of substrate concentration (25.06 g-total sugar/L).
SHPR increased with an increase in initial pH from 5.00 to 5.50 and decreased with an increase in initial pH greater than 5.50 (
Figure 2a,c). Thus, a high initial pH causes low SHPR due to the activity of hydrogenase enzyme being inhibited at a strong basidic condition [
15,
17]. Our results showed that a suitable initial pH is important to maximize hydrogen production from pineapple waste extract. However, the appropriate range of initial pH for hydrogen production and microbial growth is varied according to the cultivation conditions, such as the inocula used, substrate concentration, and incubation temperature [
18,
19].
SHPR rapidly increased when the FeSO
4 concentration was increased up to 0.81 g/L, then the SHPR gradually decreased when the FeSO
4 concentration was higher than 0.81 g/L (
Figure 2b,c). Iron is an important factor affecting hydrogen production as previously described in the introduction. Thus in the optimal range, an increase in iron concentration not exceeding the optimum level could enhance the SHPR from pineapple waste extract.
2.5. Confirmation Experiment
The analysis of the
Ps and SHPR [Equations (1) and (2)] model suggested that in order to obtain the maximum
Ps and SHPR, substrate concentration, initial pH, and FeSO
4 concentration should be optimized at 25.76 g-total sugar/L, 5.56 and 0.81 g/L, respectively (
Table 5). A
Ps and SHPR of 5489 mL H
2/L and 77.31 mL H
2/g-VSS h were predicted under the optimum conditions.
In order to confirm the validity of the statistics based experimental strategy, three replicates of each batch experiment were performed under the optimum conditions. The Ps and SHPR results indicated that the observed Ps and SHPR (5427 mL H2/L and 76.43 mL H2/g-VSS h) are in close agreement with the predicted values of Ps and SHPR with only 1.13% and 1.14% differences. Results suggested that the model obtained from the CCD experiment is valid.
Table 5.
Results and experimental design of confirmation test.
Table 5.
Results and experimental design of confirmation test.
| Condition | Substrate concentration (g-total sugar /L) | Initial pH | FeSO4 concentration (g/L) | Ps (mL H2/L) | Hydrogen yield (HY) (mol H2/mol glucose) | SHPR (mL H2/g-VSS h) |
|---|
| Optimum | 25.76 | 5.56 | 0.81 | 5489 | 1.83 | 77.31 |
| High | 30 | 6 | 1 | 4172 | 1.30 | 58.73 |
| Worst | 20 | 4 | 0.6 | 3442 | 1.71 | 48.45 |
| Endo a | 20 | 5.56 | - | 2014 | 1.08 | 28.35 |
| Control b | 20 | 5.56 | - | 1874 | 1.04 | 26.37 |
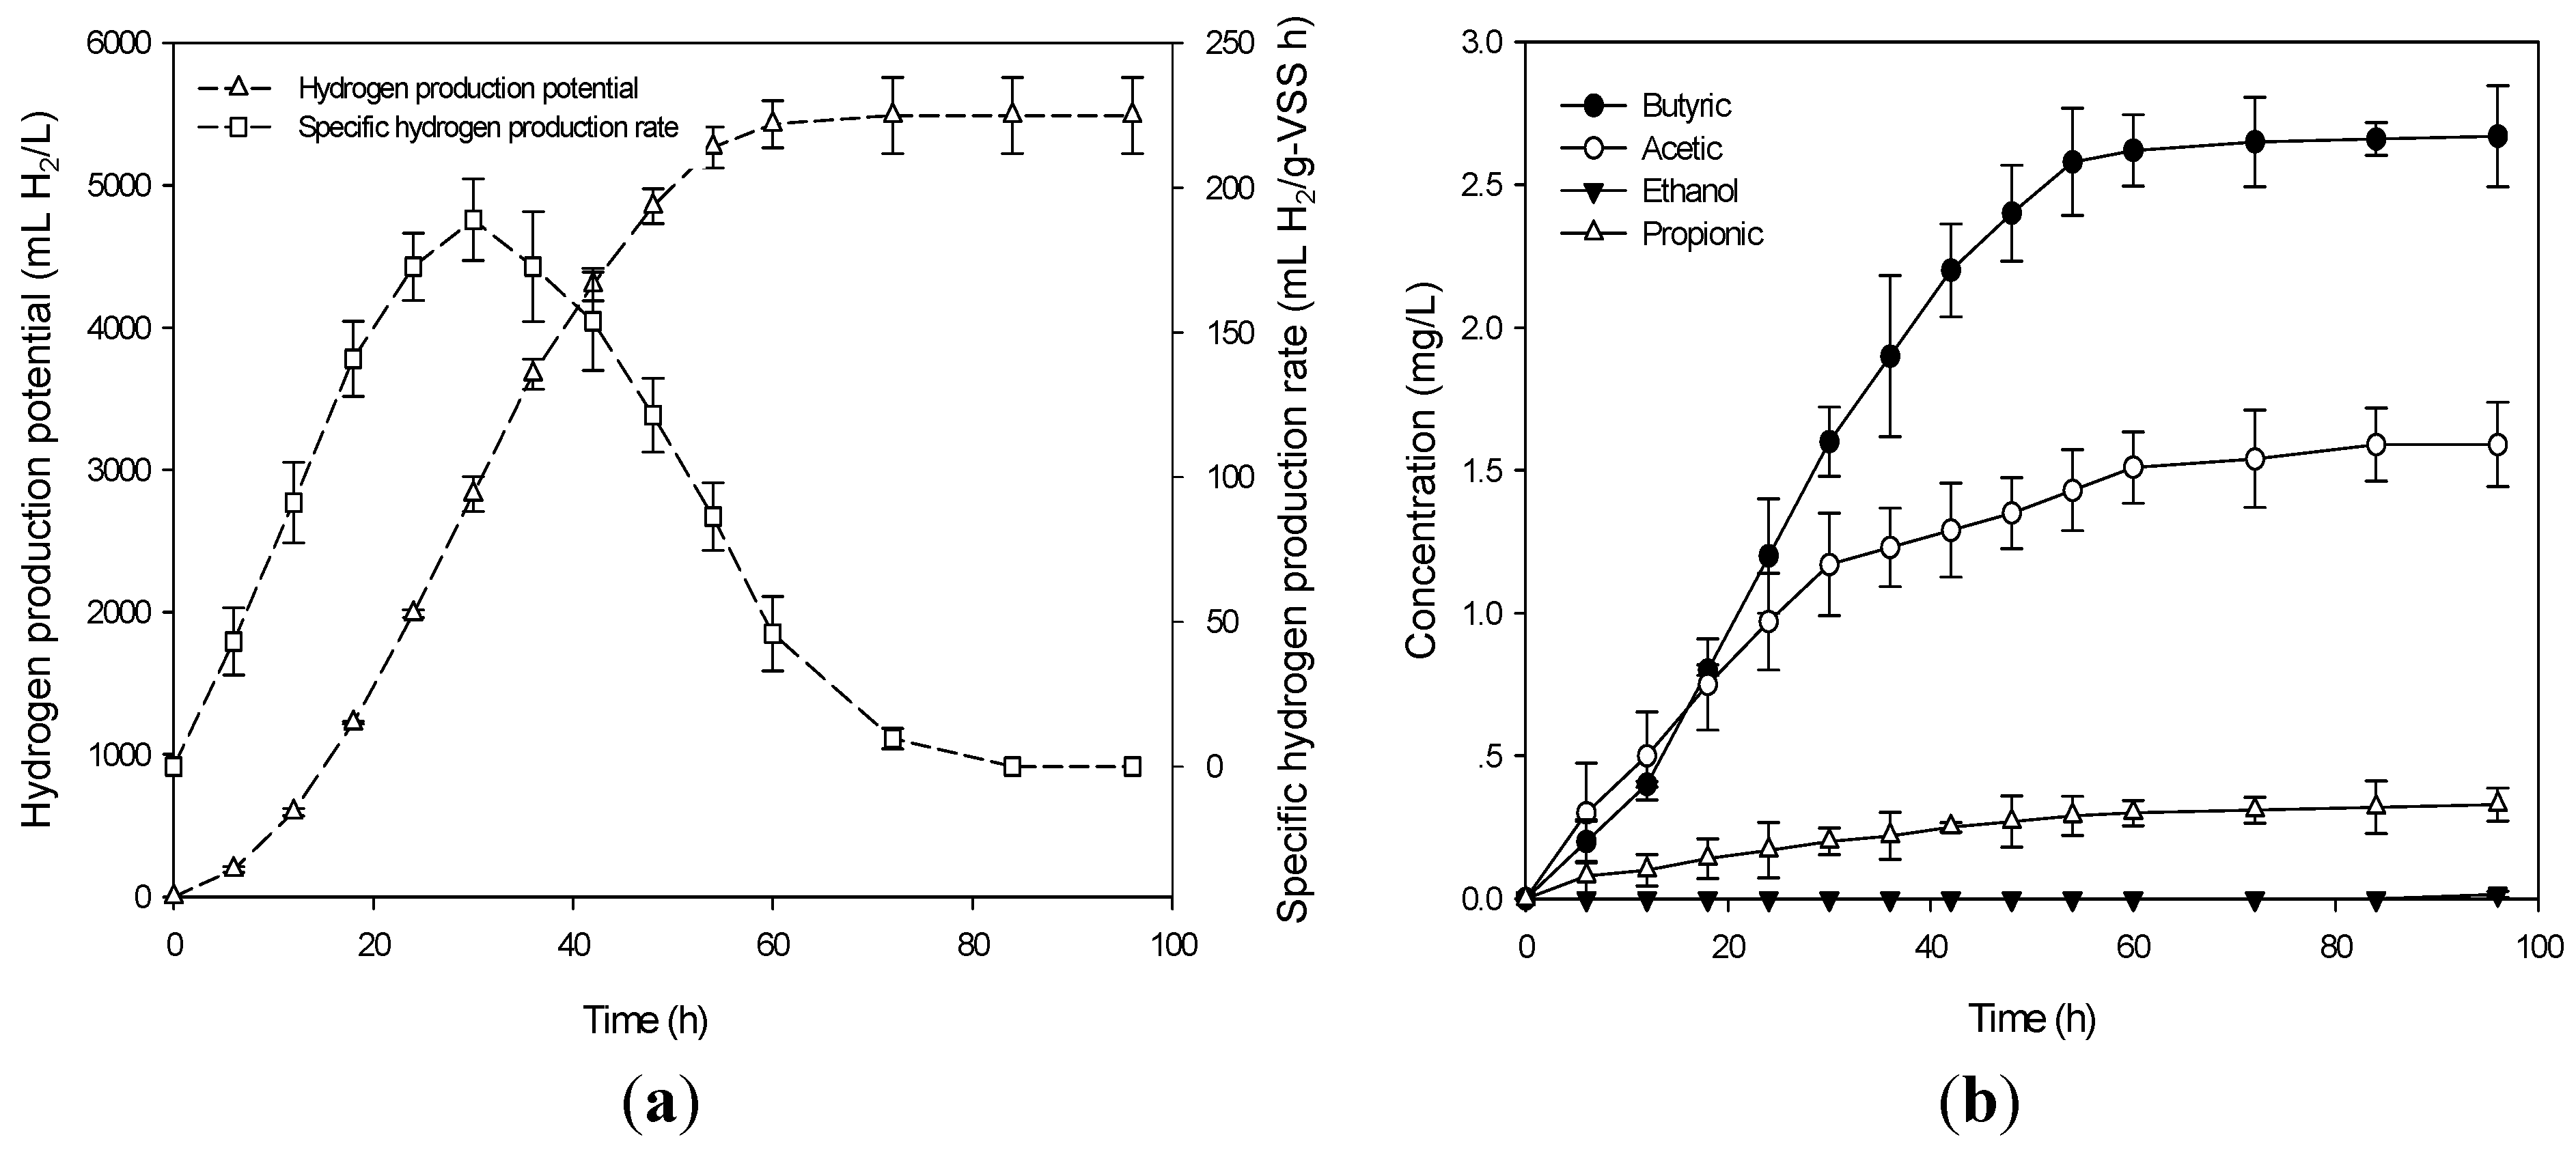
The biogas produced at the optimum conditions contained hydrogen (28%) and carbon dioxide (72%). No methane gas was detected. The time course of production of
Ps and SHPR obtained at the optimum conditions is depicted in
Figure 3a. As shown in
Figure 3a, after 4 h of lag phase, the
Ps and SHPR increased greatly. During fermentation time,
Ps increased over time and remained constant at the maximum level of 5427 mL H
2/L. SHPR increased and reached a maximum level of 76.43 mL H
2/g-VSS h then decreased after 30 h (
Figure 3a).
Figure 3b illustrates the formation of VFAs and alcohols accompanying the production of hydrogen obtained at the optimum conditions. After a lag phase, the concentrations of VFAs and alcohols sharply increased. The fermentation products were butyric acid, acetic acid, ethanol and propionic acid. The detection of butyric and acetic acids was a good indicator that efficient hydrogen production had been achieved [
25] and that the fermentation type was butyrate-acetate type fermentation.
The confirmation results in the treatment with Endo–nutrient addition and control (
Table 5) confirmed the results attained from the Placktett-Burman (
Table 1) that the Endo–nutrient does not have an individual effect on hydrogen production from pineapple waste extract by anaerobic mixed cultures.
Figure 3.
(a) Ps and SHPR in the confirmation experiment at optimum condition; and (b) development of soluble metabolite products at the optimum condition.
Figure 3.
(a) Ps and SHPR in the confirmation experiment at optimum condition; and (b) development of soluble metabolite products at the optimum condition.
The maximum hydrogen yield (HY) (1.82 mol H
2/mol glucose) obtained in this study was favorable compared with other results reported in the literature search (
Table 6). However, the
Ps and HY of Saraphirom and Reungsang [
26] were 1.26 and 1.21 times than ours, respectively, while the HY of Pan
et al. [
27] was 1.27 times higher than our HY. This is not surprising since the types/sources of inoculums and substrates used to produce hydrogen in their studies were different to those in our study. In addition, the
Ps, HY, and SHPR obtained from optimum conditions were approximately 2.93, 1.75, and 2.93, respectively, times higher than control (
i.e., 20 g/L pineapple waste extract without an addition of ferrous iron and Endo−nutrient) indicating a significant enhancement of
Ps, HY, and SHPR by adding ferrous iron.
Table 6.
Comparison of Ps and HY at the optimum conditions with various inoculums and substrates in the experimental batch.
Table 6.
Comparison of Ps and HY at the optimum conditions with various inoculums and substrates in the experimental batch.
| Inoculums | Substrate | Optimum conditions | Ps (mL H2/L) | HY (mol H2/mol glucose) | References |
|---|
| Anaerobic sludge | glucose | 26.80 g/L glucose, pH 7.0 and 39.3 °C | 3999 | 1.24 | [28] |
| Anaerobic sludge | glucose | 9.70 g/L glucose, pH 5.7 and 38 °C | - | 1.75 | [29] |
| Clostridium sp. Fanp2 | glucose | 23.75 g/L glucose, 0.159 M phosphate buffer and 13.3 mL/L vitamine solution | 4166 | 2.33 | [27] |
| Heat-treated sludge | glucose | 9.70 g/L glucose, pH 5.5 and 41 °C | 2935 | 1.67 | [30] |
| Heat-treated sludge | Sweet sorghum syrup | 25 g/L glucose, pH 4.78 and 1.45 g/L FeSO4 | 6897 | 2.22 | [26] |
| Heat-treated sludge | Pineapple waste extract | 25.76 g/L glucose, pH 5.56, 0.81 g/L FeSO4 and 35 °C | 5489 | 1.83 | This study |


