Article

Similarity Analysis in Scaling a Gas Hydrates Reservoir

1
Key Laboratory of Renewable Energy and Gas Hydrate, Guangzhou Institute of Energy Conversion, Chinese Academy of Sciences, Guangzhou 510640, China
2
Guangzhou Center for Gas Hydrate Research, Chinese Academy of Sciences, Guangzhou 510640, China
3
University of Chinese Academy of Sciences, Beijing 100083, China
*
Author to whom correspondence should be addressed.
Energies 2013, 6(5), 2468-2480; https://doi.org/10.3390/en6052468
Submission received: 19 March 2013 / Revised: 27 April 2013 / Accepted: 6 May 2013 / Published: 13 May 2013
(This article belongs to the Special Issue Natural Gas Hydrate 2013)

Abstract

:
A complete set of scaling criteria for gas hydrate reservoir of five-spot well system case is derived from the 3D governing equations, involving the mass balance equation, the energy balance equation, the kinetic model, the endothermic model and the phase equilibrium model. In the scaling criteria, the key parameters of the experiment are the water/gas production rates, the water injection rate, and the production time. By using the scaling criteria, the experimental results can be enlarged to a field scale. Therefore, the experimental results and the scaling criteria could be used to evaluate the hydrate dissociation strategies and the gas production potential of the hydrate reservoir.

1. Introduction

Natural gas hydrates are solid, non-stoichiometric compounds of small molecules and water. They form when the constituents come into contact at low temperature and high pressure [1]. Gas hydrates were first discovered in laboratory studies circa 1800, but it was not until 1965 that it was first recognized that they are common in Nature, and that the age of some natural gas hydrate systems may be on the order of millions of years [2]. Although there has been no systematic effort to evaluate this resource and current estimates of the in-place amounts vary widely, the consensus is that the worldwide quantity of hydrocarbon gas hydrates is vast [2,3,4]. Kevenvolden [5] estimated that the global amount of hydrate-bound methane was on the order of 1.8 × 10¹⁶−2.1 × 10¹⁶ m3, which is twice the amount of carbon to be found in all known fossil fuels (coal, oil, and natural gas) on Earth.
To investigate natural gas hydrate production, it is important to establish a safe and efficient hydrate exploitation technology. More and more studies have focused on how to exploit natural gas hydrates in recent years. The research has carried out not only with one-dimensional reactors in laboratory conditions [6], but also with two-dimensional [7] and three-dimensional reactors [8]. The information obtained from these laboratory experiments is vast, but how to use this information in gas hydrate exploitation has become the next and more important problem.
In fact, the laboratory experiments on hydrate production are physical simulations of the hydrate exploitation. The physical simulation plays an important role in revealing the mechanism of the physical process and optimizing the development programs in the short term at a low cost. The principle of similarity or scaling law is crucial for physical simulations [9]. The scaling law has been widely used in the oil industry to preview the oil exploitation [10]. By using this method, the results from three-dimensional experiments can be enlarged and predicted the hydrate production in the field.
In this paper, a three-dimensional 5.8 L cubic pressure vessel (the Cubic Hydrate Simulator or (CHS) [11] has been developed for investigating the production of the gas hydrate. The gas production behavior of methane hydrate in the porous media using the thermal stimulation method with the five-spot well system is investigated in the CHS. The scaling criteria are first used for predicting the real-scale hydrate production behavior.

2. Experimental Section

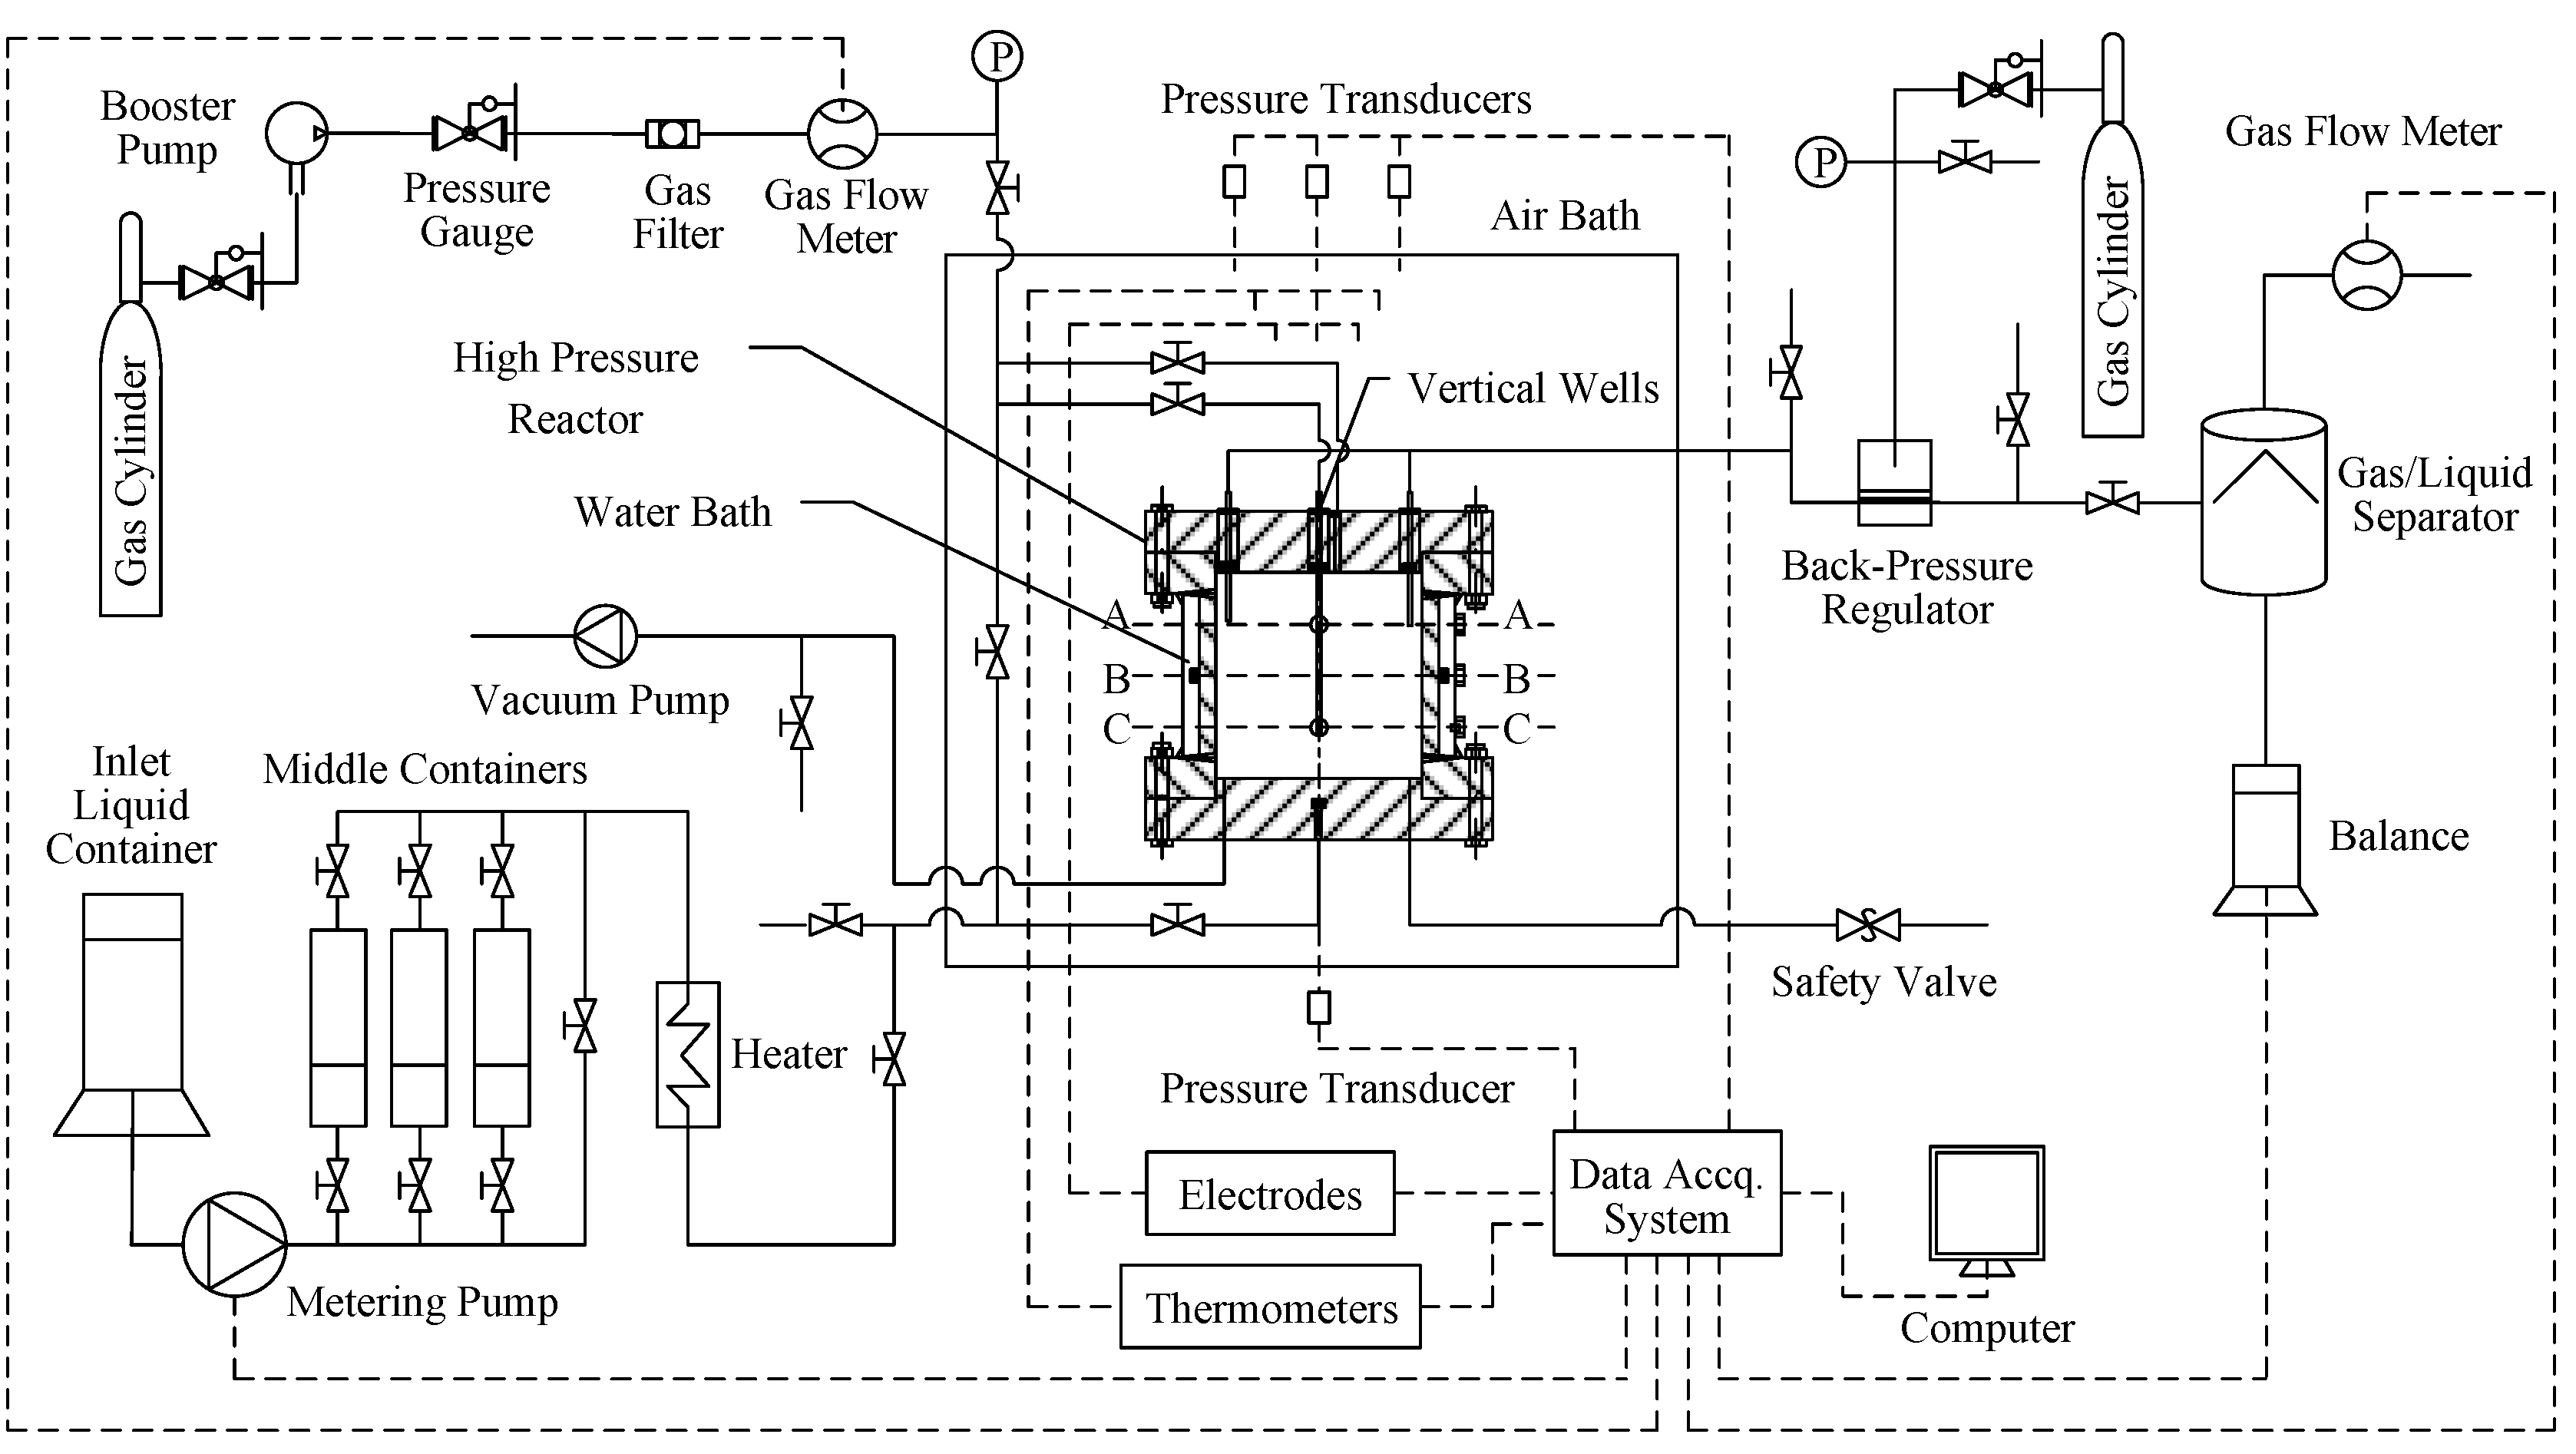
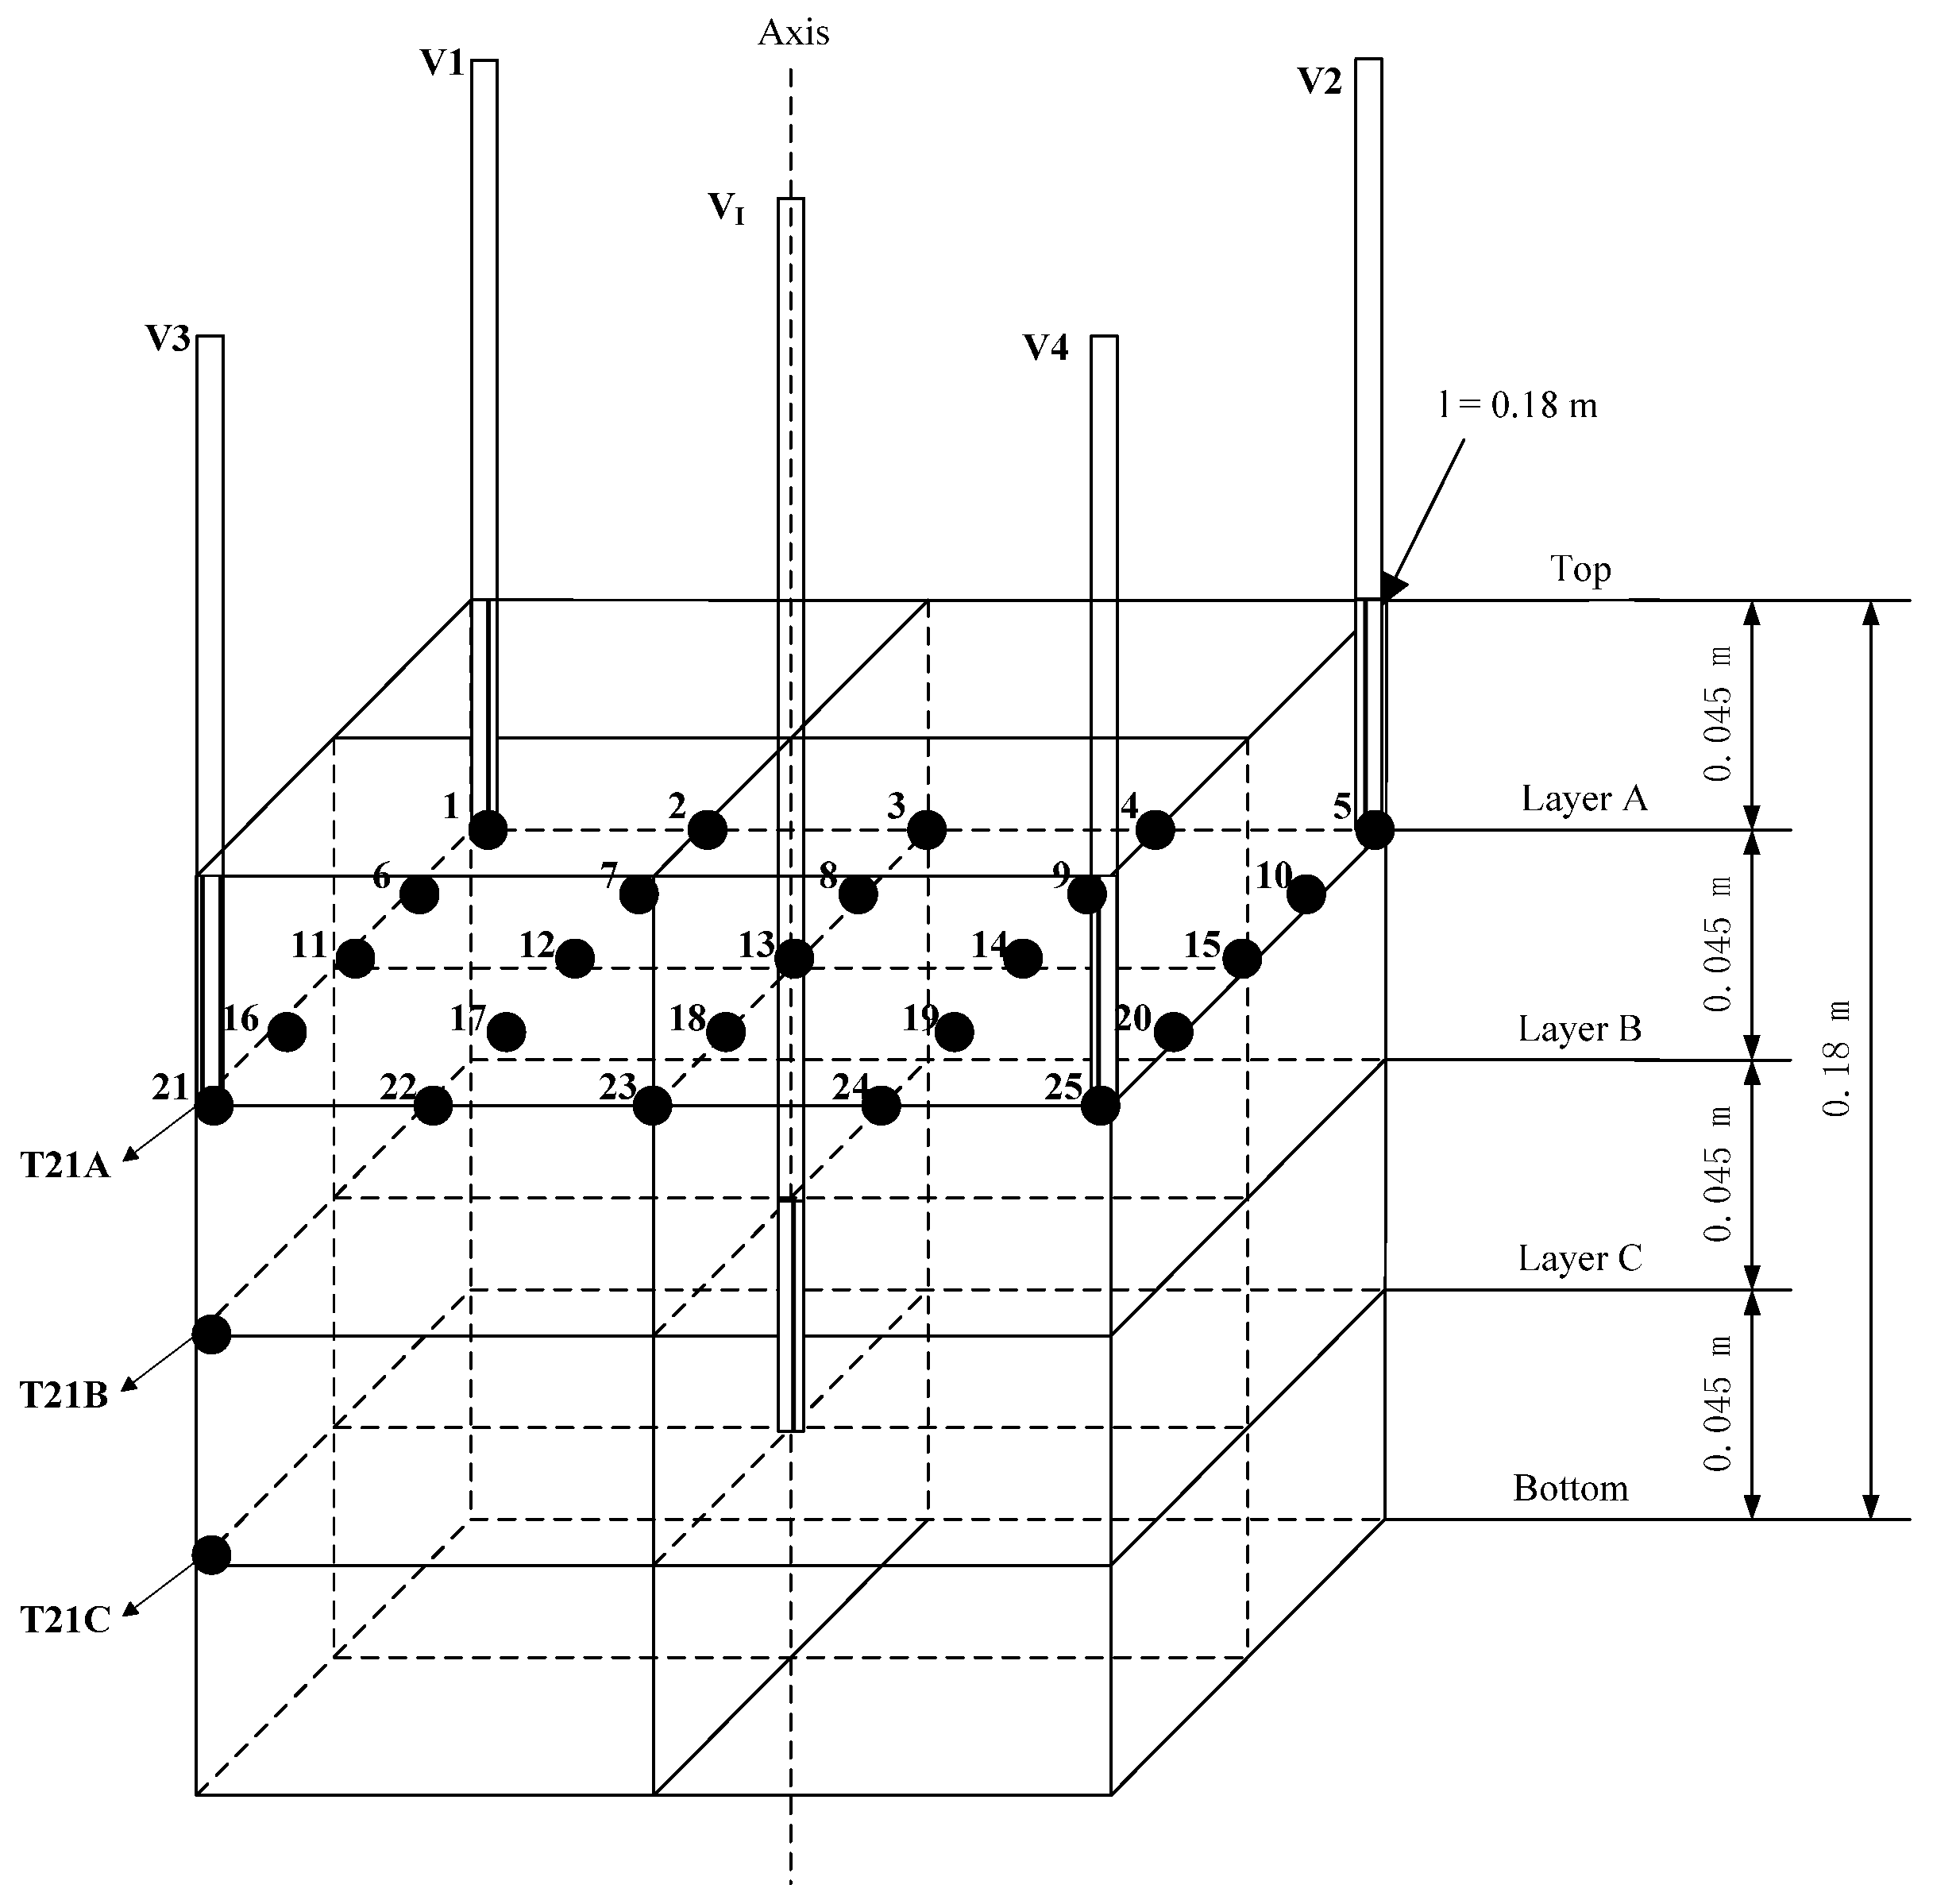
2.1. Experimental Apparatus

Details of the CHS have been reported in our previous work [11,12]. The schematic of the CHS which has been used to investigate methane hydrate production by the huff and puff method [8] and the depressurization method [11] is shown in Figure 1. The experimental apparatus involves a high-pressure reactor, a water bath around the reactor, a back-pressure regulator, a gas and liquid injection equipment, a water/gas separator, a data acquisition system, and some measurement units. The high-pressure reactor (cubic inside, volume of 5.8 L, maximum pressure of 25 MPa) is the core component of the apparatus.
Figure 1. Schematic of three-dimensional experimental apparatus.
Energies 06 02468 g001
The distributions of the thermocouples (measure temperatures), electrodes (measure resistances), and production wellheads within the CHS are shown in Figure 2.
Figure 2. Distributions of temperature, resistance measuring points and production wellhead of each layer within the three-dimensional reactor.
Energies 06 02468 g002
As seen in Figure 2, there are 25 × 3 thermocouples, one central vertical well, and four vertical wells in the four corners in the CHS. There are three layers, which divide the measuring points and the wellheads, named: Layer A, Layer B, and Layer C, respectively. In this work, the inlet for the heat injection is the VI wellhead in the layer C along the centerline of the reactor, and the outlets for the gas and water production are the V1–V4 wellheads in the layer A.

2.2. Experimental Method

Detailed descriptions of the hydrate formation process have been introduced in previous studies [11,12]. The porous sediment used in this work is quartz sand with grain sizes of 300–450 µm. Approximately 923.6 mL of deionized water is injected to the CHS by the metering pump. The temperature of the water bath is set to a predetermined temperature for gas hydrate formation, which is 8.0 °C in the current research. A total of 19.9 mol of methane is then injected to pressurize the CHS to 20 MPa. Afterwards, hydrate formation starts, and the pressure in the CHS decreases. After 14 days, the final pressure decreases to 13.5 MPa. Before hydrate production, the initial hydrate/water/gas saturations (volume) are calculated as 38.5%, 2.2%, and 59.3%, respectively, using the model proposed by Linga et al. [13]. During the hydrate production, the temperature of the water bath is maintained at 8.0 °C, and the corresponding equilibrium pressure is calculated to be 5.7 MPa by the fugacity model proposed by Li et al. [14]. The temperature of deionized water is raised to the injection temperature (Ti = 130 °C) in the pre-heater. After preheating, the hot water is injected through the inlet valve with the hot water injection rate (qi = 40 mL/min). The outlet valves of the wells open simultaneously, and then the gas production starts. The gas production pressure controlled by the back-pressure regulator keeps steady at 6.5 MPa. After more than 1 h hot water injection process, the rate of the gas production drops to approximately 0. We believe that no more hydrate decomposition in the CHS. Finally, the system is closed for more than 2 h, and then the system pressure starts to drop to atmosphere gradually. During these processes, the temperatures and pressures in the vessel, the gas production rate, the water injection/production rates are recorded at 10 s intervals.

3. Scaling Criteria

3.1. Mathematical Model

The 3D governing equations for hydrate dissociation in the porous sediments have been derived by combining the mass balance equation, the energy balance equation, the kinetic model, the endothermic model and the phase equilibrium model. Equations (1–3) are the mass balance equations for the gas phase, water phase, and hydrate phase:
x ( ρ g K g μ g ( P g x ) ) + y ( ρ g K g μ g ( P g y ) ) + z ( ρ g K g μ g ( P g z ) ) + q g + m g · = t ( ϕ ρ g s g )
x ( ρ w K w μ w ( P w x ) ) + y ( ρ w K w μ w ( P w y ) ) + z ( ρ w K w μ w ( P w z ) ) + q w + m w · = t ( ϕ ρ w s w )
Energies 06 02468 i001
where x, y, z are the coordinates; ø is the porosity; Kg and Kw are the permeabilities of the gas and water, respectively; Pg and Pw are pressures of the water and gas, respectively; µg and µw are the viscosities of gas and water, respectively; ρg, ρw and ρh are the densities of gas, water, and hydrate, respectively; sg, sw, and sh are the saturations of gas, water, and hydrate, respectively; m ˙ g , m ˙ w , and m ˙ h are the masses of gas, water, and hydrate formation or dissociation; qg and qw are the boundary changes of gas and water, which can be expressed as follows:
q g = π ρ g K g ( P g p P g ) 2 μ g ln r e o / r o δ ( x x p ) δ ( y y p )
q w = ρ w q I 4 H δ ( x x I ) δ ( y y I ) + π ρ w K w ( P w p P w ) 2 μ w ln r e o / r o δ ( x x p ) δ ( y y p )
where xp and yp are the coordinates of the production well, respectively; xI, yI are the coordinates of the injection well, respectively; Pgp and Pwp are the production pressures of gas and water, respectively; r0 is the well radius; re0 is the effective radius of well; qI is the rate of the water injection, H is the thickness of the hydrate reservoir. The power-law model [15] Equation (6) is used to describe the local absolute permeability:
K K 0 = ϕ e ϕ 0 ( ϕ e ( 1 ϕ 0 ) ϕ 0 ( 1 ϕ e ) ) 2 β
where K is the local absolute permeability; ø0 is the total porosity; K0 is the maximum absolute permeability corresponding to ø0; øe is the effective porosity defined as øe = ø0 (1−Sh); β is the index parameter.
The three-phase saturation relation is expressed as follows:
Sw + Sg + Sk = 1
The energy balance equation is written as:
t ( ( ϕ ( ρ w s w h w + ρ g s g h g + ρ h s h h h ) + ρ r h r ( 1 ϕ ) ) T ) = . [ ( ρ w h w k w μ w p w + ρ g h g k g μ g p g ) T ] + . ( ( ϕ s w λ w + ϕ s g λ g + ϕ s h λ h + ( 1 ϕ ) λ r ) T ) m ˙ h Δ H + h w T I ρ w q I 4 H δ ( x x I ) δ ( y y I )
where hg, hw, hh and hr are the specific heats of gas, water, hydrate, and rock, respectively; λg, λw, λh, and λr are conductivity coefficients of gas, water, hydrate, and rock, respectively; T is the temperature; TI is the temperature of the injected water; t is the time; ∆H is the enthalpy change of hydrate decomposition and can be expressed as follows [16]:
ΔH = 132.638 T + 446.12 × 10³
According to the dissociation reaction of hydrate, we can obtain the following equations:
m ˙ g m ˙ h = M g N h M w + M g
m ˙ w m ˙ g = N h M w M g
where Mw and Mg are the molecular weight of the water and gas, respectively; Nh is the coefficient of dissociation reaction.
The Kim-Bishnoi model is adopted to evaluate the local mass rate of gas production by hydrate dissociation as follows [17]:
Energies 06 02468 i002
where f and feq are the local gas fugacity and the equilibrium gas fugacity which are usually replaced by local gas pressure Pg and Peq; kd is the dissociation constant; As is the specific surface area of porous media bearing gas hydrate, which is calculated as follows:
A s = ( ϕ e 3 / 2 K ) 0.5
The gas hydrate equilibrium equation can be calculated as [18]:
log 10 P e q = a ( T e q T 0 ) + b ( T e q T 0 ) 2 + c
where Teq is the equilibrium temperature of gas hydrate; Peq is the equilibrium pressure of gas hydrate; T0 is 273.15 K; a, b, c are constant.
Initial conditions are given as:
s h | t = 0 = s h i   s w i | t = 0 = s w i   T | t = 0 = T i   P | t = 0 = P i
Boundary conditions are:
P l = P g p   T = T g p   P l i = 0   l = g , w , h   i   = x , y , z

3.2. Calculation

We introduce the dimensionless independent variables:
x D = x L   y D = y W   z D = z H   t D = t t 0 = m ˙ h t s h i ϕ 0 ρ h = p g p t k d s h i ϕ 0 ρ h ϕ 0 3 2 K 0
in which the xD, yD, zD, and tD are the dimensionless coordinates and dimensionless time, respectively; L, W, and H are the length, width, and thickness of the hydrate reservoir, respectively; Shi is the initial saturation of hydrate.
According to the calculation with the governing equations, energy equations, and the initial and boundary conditions, we get a complete set of scaling criteria of hydrate production including 36 dimensionless parameters as follows [19]:
π 1 = K g K r w g   π 2 = K w K r g w   π 3 = K K 0   π 4 = L W   π 5 = H L   π 6 = x p L   π 7 = y p W   π 8 = x I L   π 9 = y I W   π 10 = r e o L   π 11 = r o L   π 12 = ρ h ρ g   π 13 = ρ r ρ g   π 14 = ρ w ρ h   π 15 = λ g λ w   π 16 = λ h λ w   π 17 = λ r λ w   π 18 = h g h w   π 19 = h h h w   π 20 = h r h w   π 21 = Δ H h w T g p   π 22 = P e q P g p   π 23 = P i P g p   π 24 = T i T g p   π 25 = T I T g p   π 26 = s g i s r g Δ s   π 27 = s h i   π 28 = s r g   π 29 = s r w   π 30 = ϕ 0   π 31 = K r g w / μ w K r w g / μ g   π 32 = ρ g K 0 K r w g L 2 μ g k d 2 K 0 ϕ 0 3   π 33 = λ h L 2 P g p k d h h 2 K 0 ϕ 0 3   π 34 = σ cos θ P g p ϕ 0 K 0   π 35 = ρ w 0 q I H W L k d P g p 2 K 0 ϕ 0 3   π 36 = ρ g g L p g p
where Krwg is the effective permeability of the gas with the irreducible water; Krgw is the effective permeability of the water with the residual gas; srg and srw are the saturations of the residual gas and residual water, respectively.
The physical meaning of each parameter is as follows:
  • π1 and π2 are the dimensionless permeabilities of water and gas, respectively;
  • π3 is the dimensionless absolutely permeability;
  • π4–π11 are the similarities of geometry, well position, and well radius, respectively;
  • π12–π14 are the density ratios of hydrate to gas, rock to gas, and water to hydrate, respectively;
  • π15–π17 are the conductivity coefficient ratios of gas to water, hydrate to water, and rock to water, respectively;
  • π18–π20 are the specific heat ratios of gas to water, hydrate to water, and rock to water, respectively;
  • π21 is the dimensionless dissociation heat of hydrate;
  • π22 and π23 are the ratios of hydrate equilibrium pressure to gas production pressure, and initial gas pressure to gas production pressure, respectively;
  • π24 is the dimensionless temperature in the hydrate reservoir;
  • π25 is the dimensionless injection temperature;
  • π26 is the dimensionless initial gas saturation;
  • π27 is the initial hydrate saturation;
  • π28 and π29 are the saturation of residual gas and residual water, respectively;
  • π30 is the total porosity;
  • π31 is the mobility ratio of the water in residual gas and the gas in residual water;
  • π32 is the amount ratio of gas flow per unite area to gas production per unite area in hydrate sediment;
  • π33 is the ratio of conduction heat to hydrate dissociation heat per unite time;
  • π34 is the ratio of capillary force to gas production pressure;
  • π35 is the amount ratio of water flow per unite area to water production per unite area in hydrate sediment;
  • π36 is the dimensionless gravity.

4. Results and Discussion

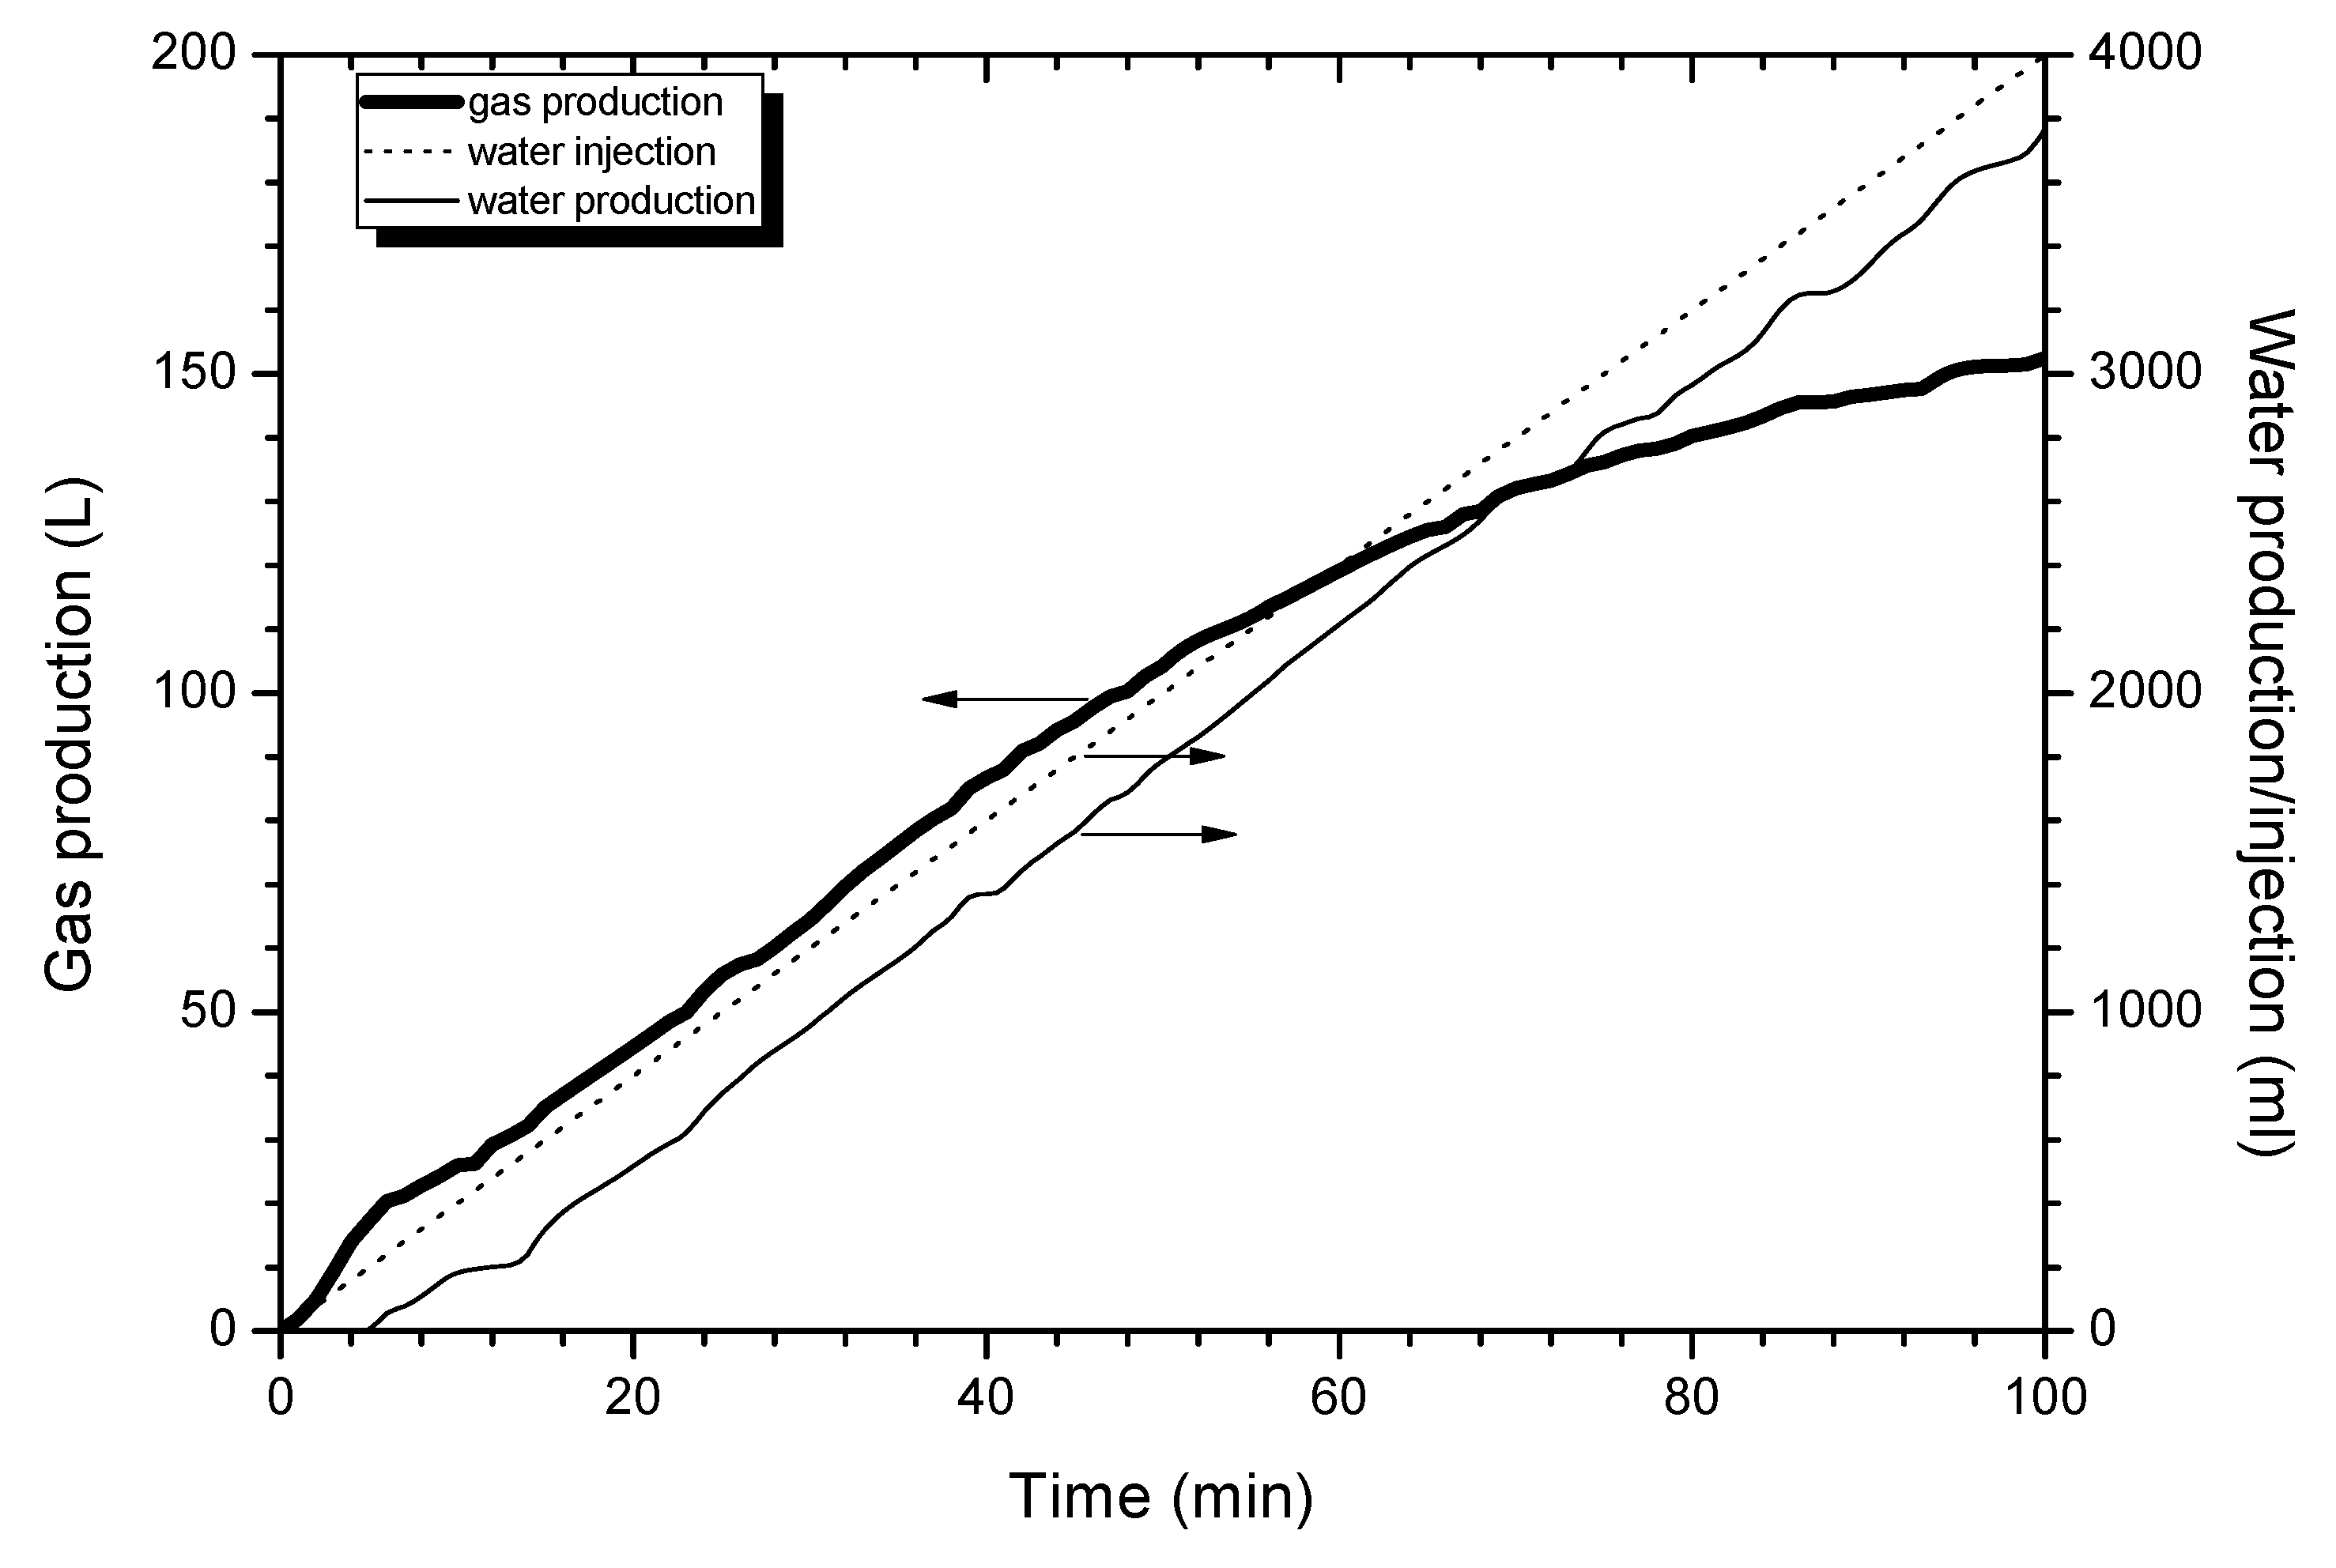
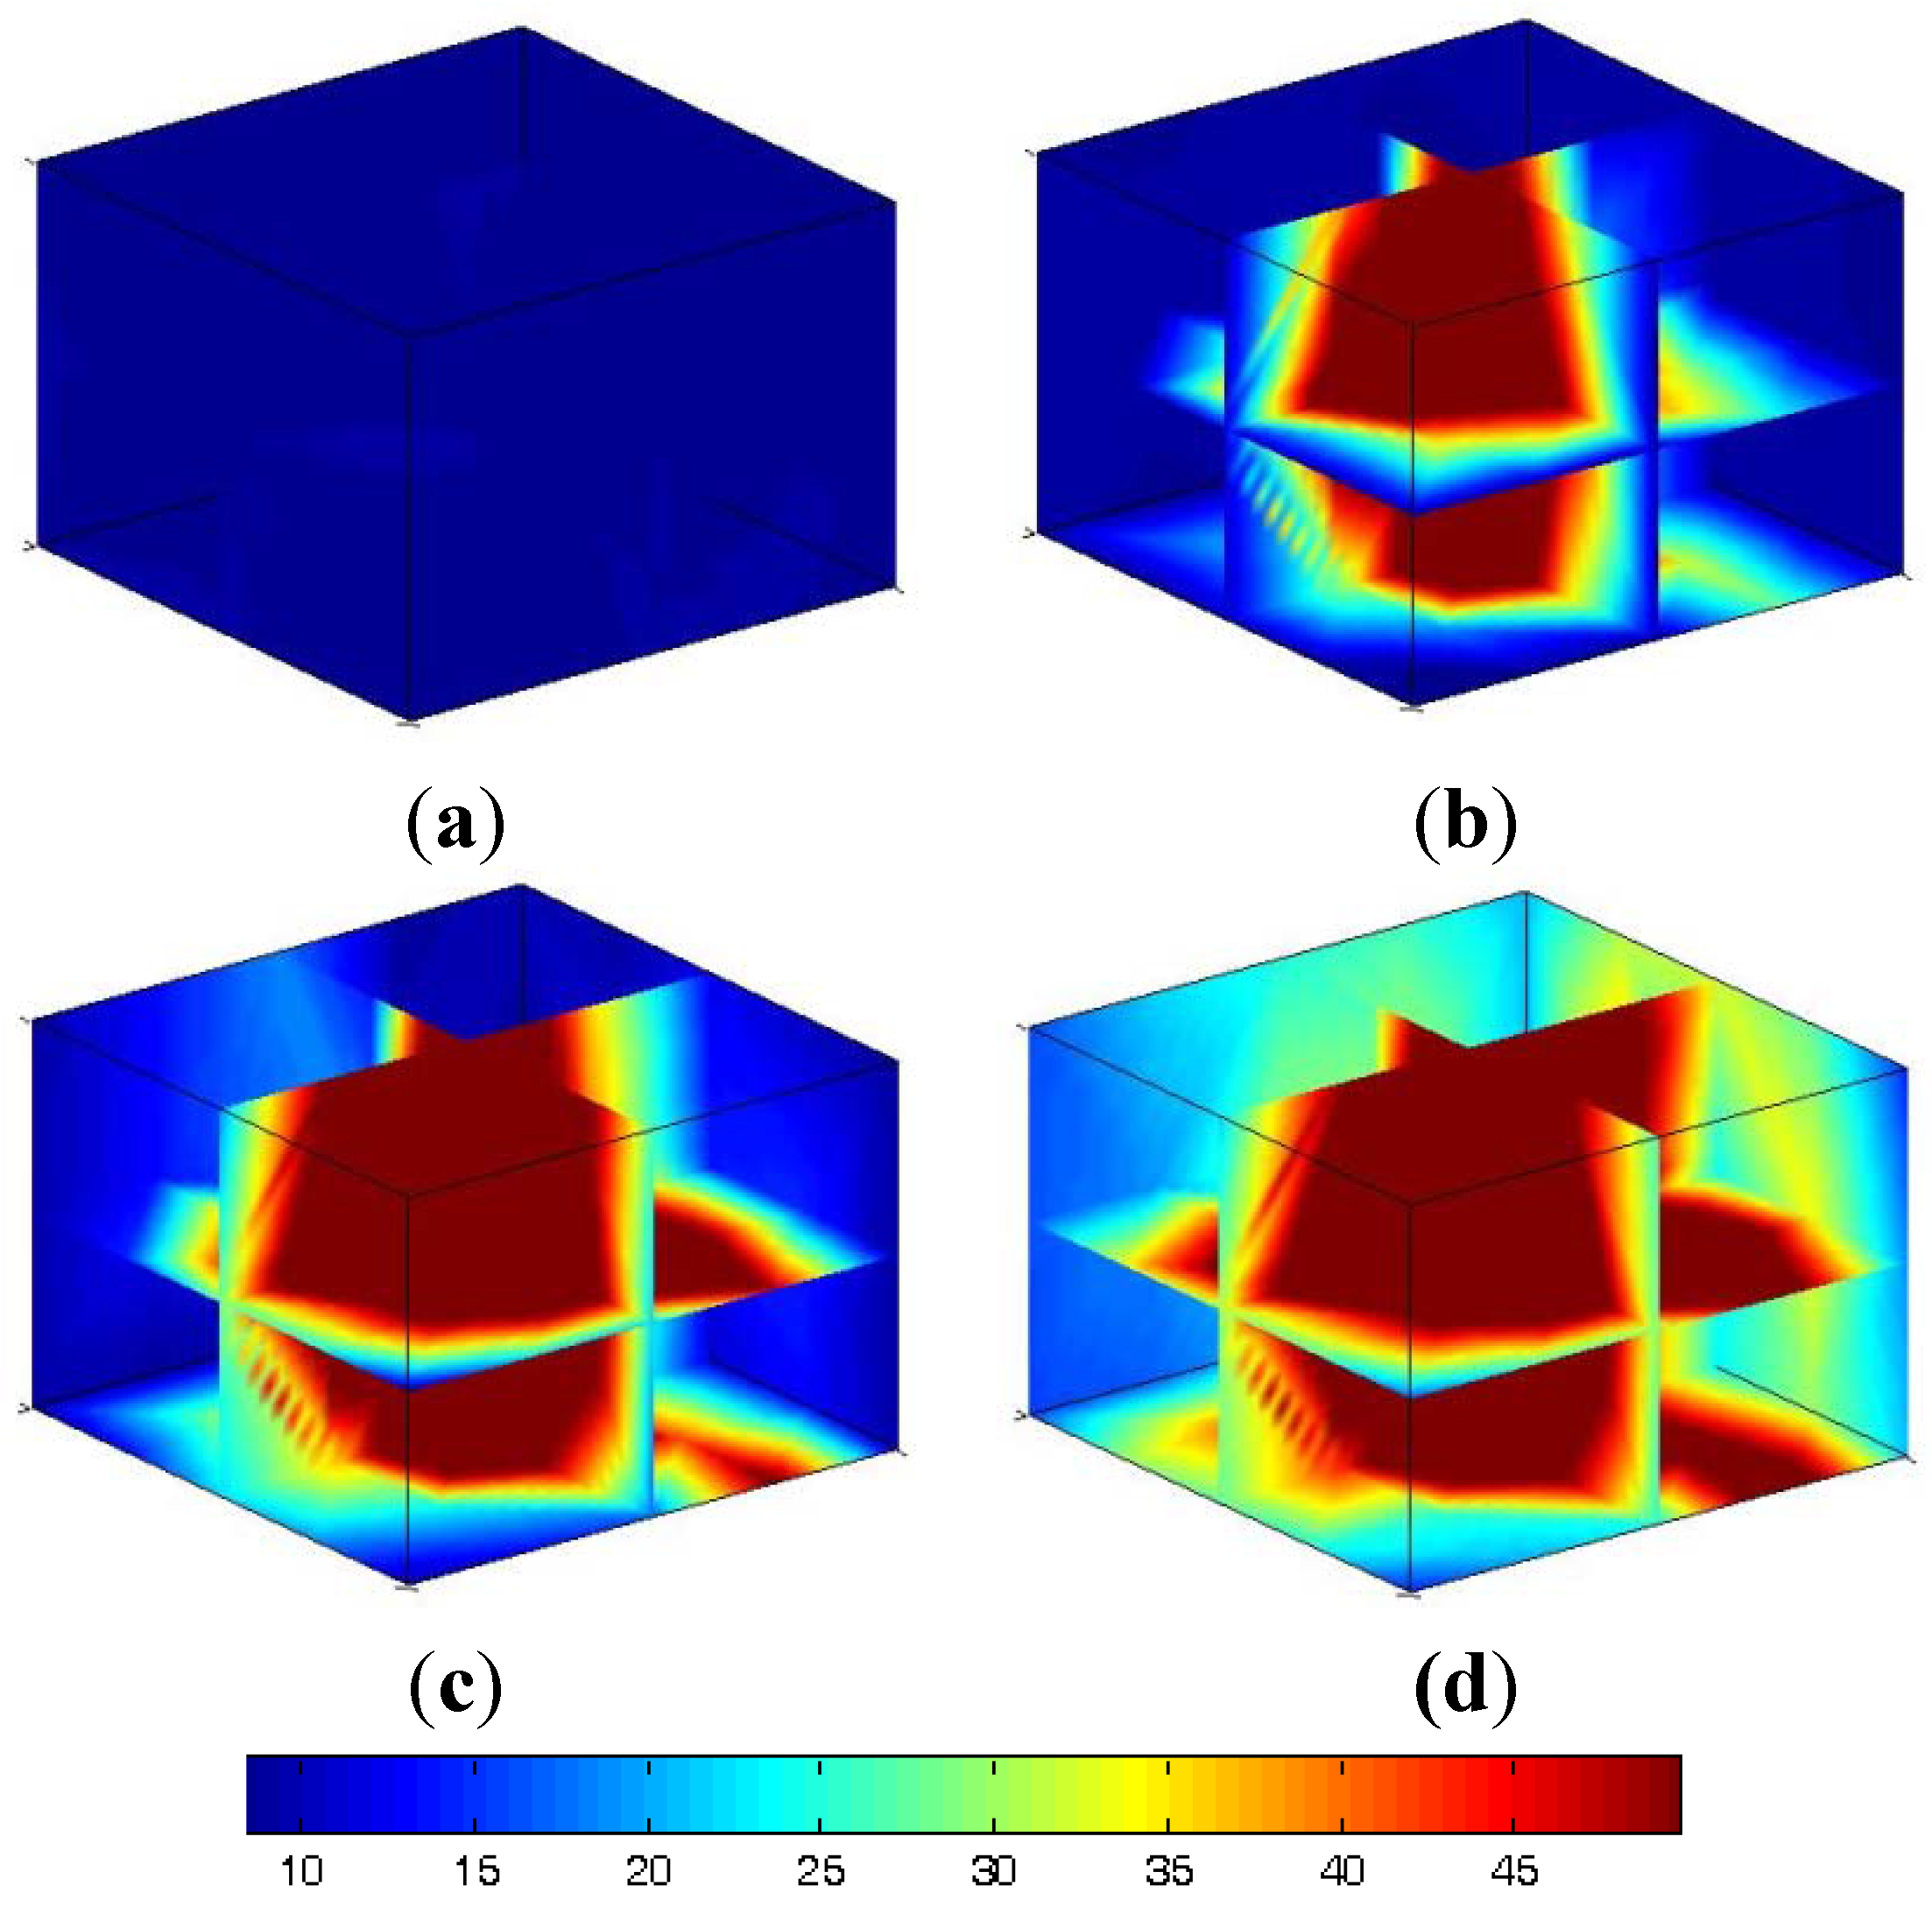
4.1. Production Process

Figure 3 shows the cumulative volumes of the produced gas/water and the injected water during the hydrate dissociation. As seen in Figure 3, during the hydrate production process, hot water (4000 mL) with the temperature of 130 °C at 40 mL/min is injected into the CHS. The total time of gas production is 100 min. Obviously, during the thermal injection process, the gas production rate is relatively high during the first 60 min, approximately 2 L/min. It is contributed to that the injected heat quickly diffuses in the hydrate reservoir, mainly dissociating the hydrate in this region. After that, the gas production rate gradually decreases with time because the hydrate around the central well has been completely decomposed and the hydrate in the production-well region is gradually decomposed, however, the heat loss on the boundary of the reactor which leaves less capability to progress to the surroundings and to decompose hydrate. The final cumulative volume of the produced gas is 152.5 L. The water production rate during the first 5 minutes is quite low. After that, the water production rate gradually increases and stabilizes at a certain rate which is equal to the water injection rate. It is attributed to that there are a lot of pores in the reservoir in the CHS before the beginning of the experiment, thus, some of the injected water remains in the CHS during the term. After this period, the pores are filled by the injected water gradually, and finally, the amount of the water injected is nearly identical to that of the water produced during the remaining experimental process.
Figure 3. Cumulative volumes of produced gas/water and injected water during hydrate dissociation with thermal stimulation method.
Energies 06 02468 g003
Figure 4 shows the three-dimensional temperature distributions in the experiment with the thermal stimulation method. In this work, the temperature of the injected water is 130 °C, while the temperature deceases to about 60 °C when it reaches the wellhead, due to the heat loss on the pipeline. Panels a−d in Figure 4 are the temperature distributions corresponding to time points of 0 min, 25 min, 50 min, and 100 min, respectively. At the beginning of the injection Figure 4a, the temperature at all points within the system remains almost same and is close to the environmental temperature. At the 25 min of the experiment Figure 4b, the temperature in the injection-well region has increased and the heat has diffused to the surroundings. At the 50 min Figure 4c, the temperature of the central continues to rise, which indicates that the heat continuously diffuses outward. At the end of the hot water injection Figure 4d, the temperatures in production-well regions increase because the heat is almost entirely diffused in the system.
Figure 4. Three-dimensional spatial temperature distributions during the hydrate dissociation with thermal stimulation method. (a) 0 min; (b) 25 min; (c) 50 min; (d) 100 min.
Energies 06 02468 g004

4.2. Similar Model

According to the scaling criteria derived in Section 3, the governing equations contain the both of small scale phenomena and large scale transport. The former is independent of the scale and the latter depends on the scale. Therefore, the experiment results from the thermal stimulation method in the CHS can be enlarged to a field scale by using the scaling criteria. However, it is difficult or even impossible to achieve an experimental model which is completely similar to the prototype, attributing to the conflict between the two different dimensionless parameters. Therefore, we have to ignore some of the dimensionless parameters in actual modeling. According to the sensitivity analysis by Liu et al. [19], the effect of physical parameters on hydrate dissociation can be quantified by a sensitivity factor, which means the variance in hydrate production caused by slightly changing dimensionless parameters. The higher sensitivity factor indicates that the parameter is more important.
As the sensitivity analysis, the important parameters are summarized as the initial temperature Ti, equilibrium pressure Peq, maximal porosity ø0, initial pressure pi, hydrate density ρh, and initial hydrate saturation shi. According to the scaling criteria, these parameters should keep the same in either the model or the prototype.
Furthermore, according to the calculation from the dimensionless parameters π32, π35, and the non-dimensional time tD, some important physical parameters (K0, qI, and t) ratio existing between the model and the prototype can be obtained. The detail calculation is shown as follows:
Firstly, the size ratio between the model and prototype is set as a, which means a = Lm/Lf = Hm/Hf = Wm/Wf.
Secondly, as the scaling criteria, the dimensionless parameters π32 for the model and prototype are same, which can be expressed as:
( ρ g K 0 K r w g L 2 μ g k d 2 K 0 ϕ 0 3 ) m = ( ρ g K 0 K r w g L 2 μ g k d 2 K 0 ϕ 0 3 ) f
Thus, the permeability ratio can be obtained as:
( K 0 3 ϕ 0 3 ) m / ( K 0 3 ϕ 0 3 ) f = ( L m / L f ) 2 = a 2
which is:
( K 0 ) m ( K 0 ) f = a 4 3
Subsequently, by above method, the injection rate ratio and the time ratio can be obtained as:
( q I ) m ( q I ) f = a 7 3   ( t ) m ( t ) f = a 2 3
The key physical parameters ratios for hydrate production have given above.
During the hydrate production process, the most important parameters are the water/gas production rates, the water injection rate, and the production time. Table 1 lists the results of the key parameters obtained from the experiment in the CHS. By using the scaling criteria, the results can be enlarged to a field scale. In this work, the size of the hydrate reservoir in CHS is enlarged 100 times to the size of 18 m × 18 m × 18 m. Therefore, the size ratio a is 100. And the injection rate ratio and the time ratio can be calculated as 46,377.7 and 21.54 by the Equation 22. The results of the scaling model also are shown in Table 1.
Table 1. Parameters of the CHS and the corresponding scaling model.
ParametersL/mH/mW/mqI /m3s−1r0/mSh
CHS0.180.180.186.7 × 10−72 × 10−30.310
Scaling model1818183.1 × 10−21 × 10−10.310
ParametersTI/°Cø 0Pgp/MPag/ms−2t/minQ/m3
CHS1300.466.59.81000.152
Scaling model1300.466.59.821541.52 × 105
As indicated in Table 1, during the experiment with thermal stimulation method in the CHS, the heat injection lasts 100 min at the rate of 40 mL/min, leading to a total injection amount of 4000 mL and the final cumulative volume of the produced gas of 152.5 L. The size of the hydrate reservoir in the CHS is enlarged 100 times. The results show that hot water of 130 °C is injected into the hydrate reservoir with a field scale (18 m × 18 m × 18 m) with the rate of 3.1 × 10⁻² m3/s for 2154 min, leading to the final cumulative volume of the produced gas of 1.52 × 10⁵ m3, which means that the final cumulative volume of the produced gas is enlarged 106 times. The experimental results and the scaling criteria could be used to evaluate the hydrate dissociation strategies and the gas production potential of the hydrate reservoir.

5. Conclusions

In this paper, the CHS, a three-dimensional 5.8 L cubic pressure vessel, has been developed for investigating the gas production of hydrate reservoir. The gas production behavior of methane hydrate in the porous media is investigated in the CHS using the thermal stimulation method. The scaling criteria are firstly used in the hydrate production experiments for predicting the real-scale hydrate production behavior.
In the scaling criteria, the key parameters of the experiment are the water/gas production rates, the water injection rate, and the production time. These parameters can be enlarged to a field scale by using the criteria. The data obtained from the experiment with thermal stimulation method in the CHS (injecting hot water of 130 °C at 40 mL/min for 100 min, the final cumulative volume of the produced gas is 152.5 L) are enlarged 100 times by the scaling criteria. The results show that the hot water of 130 °C is injected at 3.1 × 10⁻² m3/s for 2154 min in the enlarged hydrate reservoir, and the final cumulative volume of the produced gas is 1.52 × 10⁵ m3.

Nomenclature

Abbreviation

CHS
Cubic Hydrate Simulator

Symbols

V
wellhead
qi
rate of hot water (mL/min)
Ti
temperature of hot water (K)
x, y, z
coordinates
ø
porosity
ø0
total porosity
øe
effective porosity
s
saturation
P
pressure (MPa)
µ
viscosity (Pa S)
ρ
density (kg m−3)
K
permeability (m−2)
K0
maximum absolute permeability (m−2)
m ˙
mass rate (m3 s−1)
h
specific heat (J kg−1K−1)
λ
conductivity coefficient (w m−1 K−1)
q
heat changes on boundary (J)
g
the gravitational acceleration (m s−2)
xp, yp
coordinates of the production well (m)
xI, yI
coordinates of the injection well (m)
r0
well radii (m)
re0
effective radii of well (m)
H
enthalpy change of hydrate decomposition (J)
M
molecular weight
Nh
coefficient of dissociation reaction (5.8)
As
specific surface area of porous media (m2)
f
gas fugacity (Pa)
kd
the dissociation constant
L
length (m)
H
thickness (m)
W
width (m)
Q
volume of gas production (m3)
σ
gas throttle coefficient

Subscripts

i
initial
p
production
g
gas
w
water
h
hydrate
r
rock
eq
phase equilibrium
D
dimensionless
m
model
f
prototype

Acknowledgments

This work is supported by the National Key Basic Research & Development Program (973) Grant No.2009CB219507, National Science Fund for Distinguished Young Scholars of China (51225603), National Natural Science Foundation of China (51076155 and 51106160), and Key Arrangement Programs of the Chinese Academy of Sciences (KGZD-EW-301-2), which are gratefully acknowledged.

Conflict of Interest

The authors declare no conflict of interest.

References

  1. Sloan, E.D. Fundamental principles and applications of natural gas hydrates. Nature 2003, 426, 353–359. [Google Scholar] [CrossRef] [PubMed]
  2. Sloan, E.D.; Koh, C.A. Clathrate Hydrates of Natural Gases, 3rd ed.; Taylor and Francis, Inc.: Boca Raton, FL, USA, 2008. [Google Scholar]
  3. Milkov, A.V. Global estimates of hydrate-bound gas in marine sediments: How much is really out there? Earth-Sci. Rev. 2004, 66, 183–197. [Google Scholar] [CrossRef]
  4. Klauda, J.B.; Sandler, S.I. Global distribution of methane hydrate in ocean sediment. Energy Fuel 2005, 19, 459–470. [Google Scholar] [CrossRef]
  5. Kvenvolden, K.A. Methane hydrate-a major reservoir of carbon in the shallow geosphere. Chem. Geol. 1988, 71, 41–51. [Google Scholar] [CrossRef]
  6. Li, X.S.; Wan, L.H.; Li, G.; Li, Q.P.; Chen, Z.Y.; Yan, K.F. Experimental investigation into the production behavior of methane hydrate in porous sediment with hot brine stimulation. Ind. Eng. Chem. Res. 2008, 47, 9696–9702. [Google Scholar] [CrossRef]
  7. Sasaki, K.; Ono, S.; Sugai, Y.; Ebinuma, T.; Narita, H.; Yamaguchi, T. Gas production system from methane hydrate layers by hot water injection using dual horizontal wells. J. Can. Petrol. Technol. 2009, 48, 21–26. [Google Scholar] [CrossRef]
  8. Li, X.S.; Wang, Y.; Li, G.; Zhang, Y.; Chen, Z.Y. Experimental investigation into methane hydrate decomposition during three-dimensional thermal huff and puff. Energy Fuel 2011, 25, 1650–1658. [Google Scholar] [CrossRef]
  9. Sedov, L.I. Similarity and Dimensional Methods in Mechanics; Academic Press: New York, NY, USA, 1959. [Google Scholar]
  10. Bai, Y.H.; Li, J.C.; Zhou, J.F.; Li, Q.P. Sensitivity analysis of the dimensionless parameters in scaling a polymer flooding reservoir. Transp. Porous Med. 2008, 73, 21–37. [Google Scholar] [CrossRef]
  11. Li, X.S.; Zhang, Y.; Li, G.; Chen, Z.Y.; Wu, H.J. Experimental investigation into the production behavior of methane hydrate in porous sediment by depressurization with a novel three-dimensional cubic hydrate simulator. Energy Fuel 2011, 25, 4497–4505. [Google Scholar] [CrossRef]
  12. Li, X.S.; Wang, Y.; Li, G.; Zhang, Y. Experimental investigations into gas production behaviors from methane hydrate with different methods in a cubic hydrate simulator. Energy Fuel 2011, 26, 1124–1134. [Google Scholar] [CrossRef]
  13. Linga, P.; Haligva, C.; Nam, S.C.; Ripmeester, J.A.; Englezos, P. Gas hydrate formation in a variable volume bed of silica sand particles. Energy Fuel 2009, 23, 5496–5507. [Google Scholar] [CrossRef]
  14. Li, X.S.; Zhang, Y.; Li, G.; Chen, Z.Y.; Yan, K.F.; Li, Q.P. Gas hydrate equilibrium dissociation conditions in porous media using two thermodynamic approaches. J. Chem. Thermodyn. 2008, 40, 1464–1474. [Google Scholar] [CrossRef]
  15. Civan, F. Scale effect on porosity and permeability: Kinetics, model, and correlation. Aiche J. 2001, 47, 271–287. [Google Scholar] [CrossRef]
  16. Selim, M.S.; Sloan, E.D. Heat and mass transfer during the dissociation of hydrates in porous media. Aiche J. 1989, 35, 1049–1052. [Google Scholar] [CrossRef]
  17. Kim, H.C.; Bishnoi, P.R.; Heidemann, R.A.; Rizvi, S.S.H. Kinetics of methane hydrate decomposition. Chem. Eng. Sci. 1987, 42, 1645–1653. [Google Scholar] [CrossRef]
  18. Makogon, Y.F. Hydrate of Hydrocarbons; Penn Well Publishing Company: Tulsa, OK, USA, 1997. [Google Scholar]
  19. Liu, Y.; Chen, Y.; Bai, Y.; Li, S. Similarity theory for the physical simulation of natural gas hydrate reservoir development. Min. Sci. Technol. (China) 2010, 20, 782–788. [Google Scholar] [CrossRef]

