Hierarchical Communication Network Architectures for Offshore Wind Power Farms


Abstract
: Nowadays, large-scale wind power farms (WPFs) bring new challenges for both electric systems and communication networks. Communication networks are an essential part of WPFs because they provide real-time control and monitoring of wind turbines from a remote location (local control center). However, different wind turbine applications have different requirements in terms of data volume, latency, bandwidth, QoS, etc. This paper proposes a hierarchical communication network architecture that consist of a turbine area network (TAN), farm area network (FAN), and control area network (CAN) for offshore WPFs. The two types of offshore WPFs studied are small-scale WPFs close to the grid and medium-scale WPFs far from the grid. The wind turbines are modelled based on the logical nodes (LN) concepts of the IEC 61400-25 standard. To keep pace with current developments in wind turbine technology, the network design takes into account the extension of the LNs for both the wind turbine foundation and meteorological measurements. The proposed hierarchical communication network is based on Switched Ethernet. Servers at the control center are used to store and process the data received from the WPF. The network architecture is modelled and evaluated via OPNET. We investigated the end-to-end (ETE) delay for different WPF applications. The results are validated by comparing the amount of generated sensing data with that of received traffic at servers. The network performance is evaluated, analyzed and discussed in view of end-to-end (ETE) delay for different link bandwidths.
1. Introduction
Recently, wind power has gained greater attention with respect to sources of renewable energy due to the maturity of the technology and its relative cost competitiveness. Wind power farms (WPFs) are usually scattered in remote areas (onshore and offshore) selected by the wind speed, and in the case of offshore farms, water depth, and distance to shore. It is important to develop technology to monitor WPFs with higher capacities as the size and number of wind turbines in a WPF is continuously increasing. In order to provide real-time control and monitoring, a reliable bi-directional communication infrastructure is needed. According to their needs, most turbine manufacturers have developed their own monitoring and control systems due to an absence of a unified communication architecture. The performance of the system with respect to control and monitoring depends mainly on the communication capabilities supporting the exchange of real-time monitoring data between the control centers and the WPFs. Due to the importance of WPF communication infrastructure, the network should be able to continue to work, even in case of device/link failure. Therefore, WPF communication infrastructure requires high stability and reliability in order to effectively control the wind turbines and monitor the local conditions [1]. The communication infrastructure should also satisfy the bandwidth and latency requirements for proper data exchange and operation of the wind turbines and the control center.
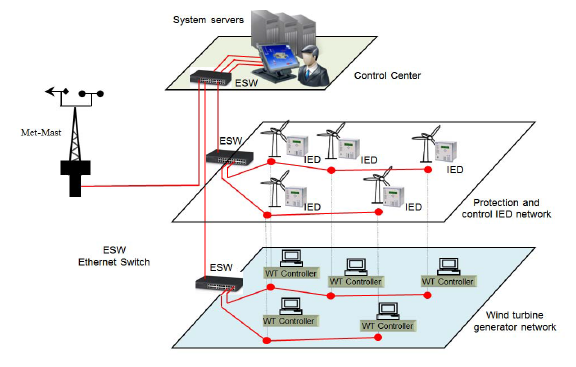
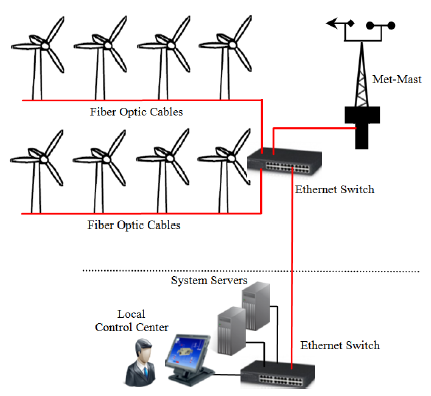
The conventional WPF communication infrastructure is a switch-based architecture, where independent sets of switches and communication links are used for different network applications including wind turbine generator networks, protection and control networks, and telephone and security networks, as shown in Figure 1. The design of a WPF communication network where all turbine applications share the same common infrastructure has not yet been considered [2], even though such a solution could optimize communication within the WPF network and reduce the cost of deploying independent networks. However, the requirements for different applications should be satisfied in order to guarantee that the new network configuration is acceptable for use.
Nowadays, there is no unified communications standard available for WPF nor is there integration of WPFs and smart grids [3]. Also, the IEC 61400-25-2 standard focuses mainly on onshore WPFs and lacks development for offshore wind turbines, such as floating turbines [4]. We had previously proposed architectural design, simulation, and evaluation of hybrid communication networks (WiFi, ZigBee, and Ethernet) for monitoring a large-scale wind turbine [5]. This paper proposes a communication network architecture for offshore WPFs (a simplified version of this work has been accepted for publication [6]). Two types of WPFs are studied. The first type are small-scale WPFs consisting of 10 wind turbines close to the grid while the second are medium-scale WPFs consisting of 20 wind turbines far from the grid. Relative to conventional network architectures where an independent communication infrastructure is used for different applications, the proposed network model allows network traffic, such as analogue measurements (AM), status information (SI) and protection & control information (PCI), to share a common architecture. With respect to current developments in the wind turbine industry, we considered the extension of wind turbine logical nodes for the wind turbine foundation (WFOU) and meteorological data. We defined the latency requirements of the WPF communication network for different applications. The OPNET modeler [7] is used for modelling the WPF communication network at different levels, such as those of the turbine area network (TAN), farm area network (FAN) and control area network (CAN). The modeler is validated by measuring the amount of received traffic at the control center servers, and the network performance is evaluated in view of end-to-end (ETE) delay for different link bandwidths.
The rest of this paper is organized as follows: Section 2 briefly describes the wind farm configuration and the IEC 61400-25 standard; Section 3 explains the proposed wind power farm communication network; Section 4 presents WPF modeling using OPNET; Section 5 shows the simulation results; and finally, Section 6 presents our conclusion and future work.
2. Wind Power Farm Architecture
2.1. Wind Farm Electric Topology
Generally, a WPF consists of wind turbines, a local wind turbine grid, a collection point, a transmission system, and a grid interface to the point of common coupling (PCC). The electrical layout of the wind farm can be designed with different configurations, depending on the wind farm size (small-scale, medium-scale, or large-scale) and level of redundancy. For small-scale WPFs, the expected loss in case of a fault is lower than the extra cost of system redundancy. Therefore, existing small-scale WPFs do not support system redundancy [8].
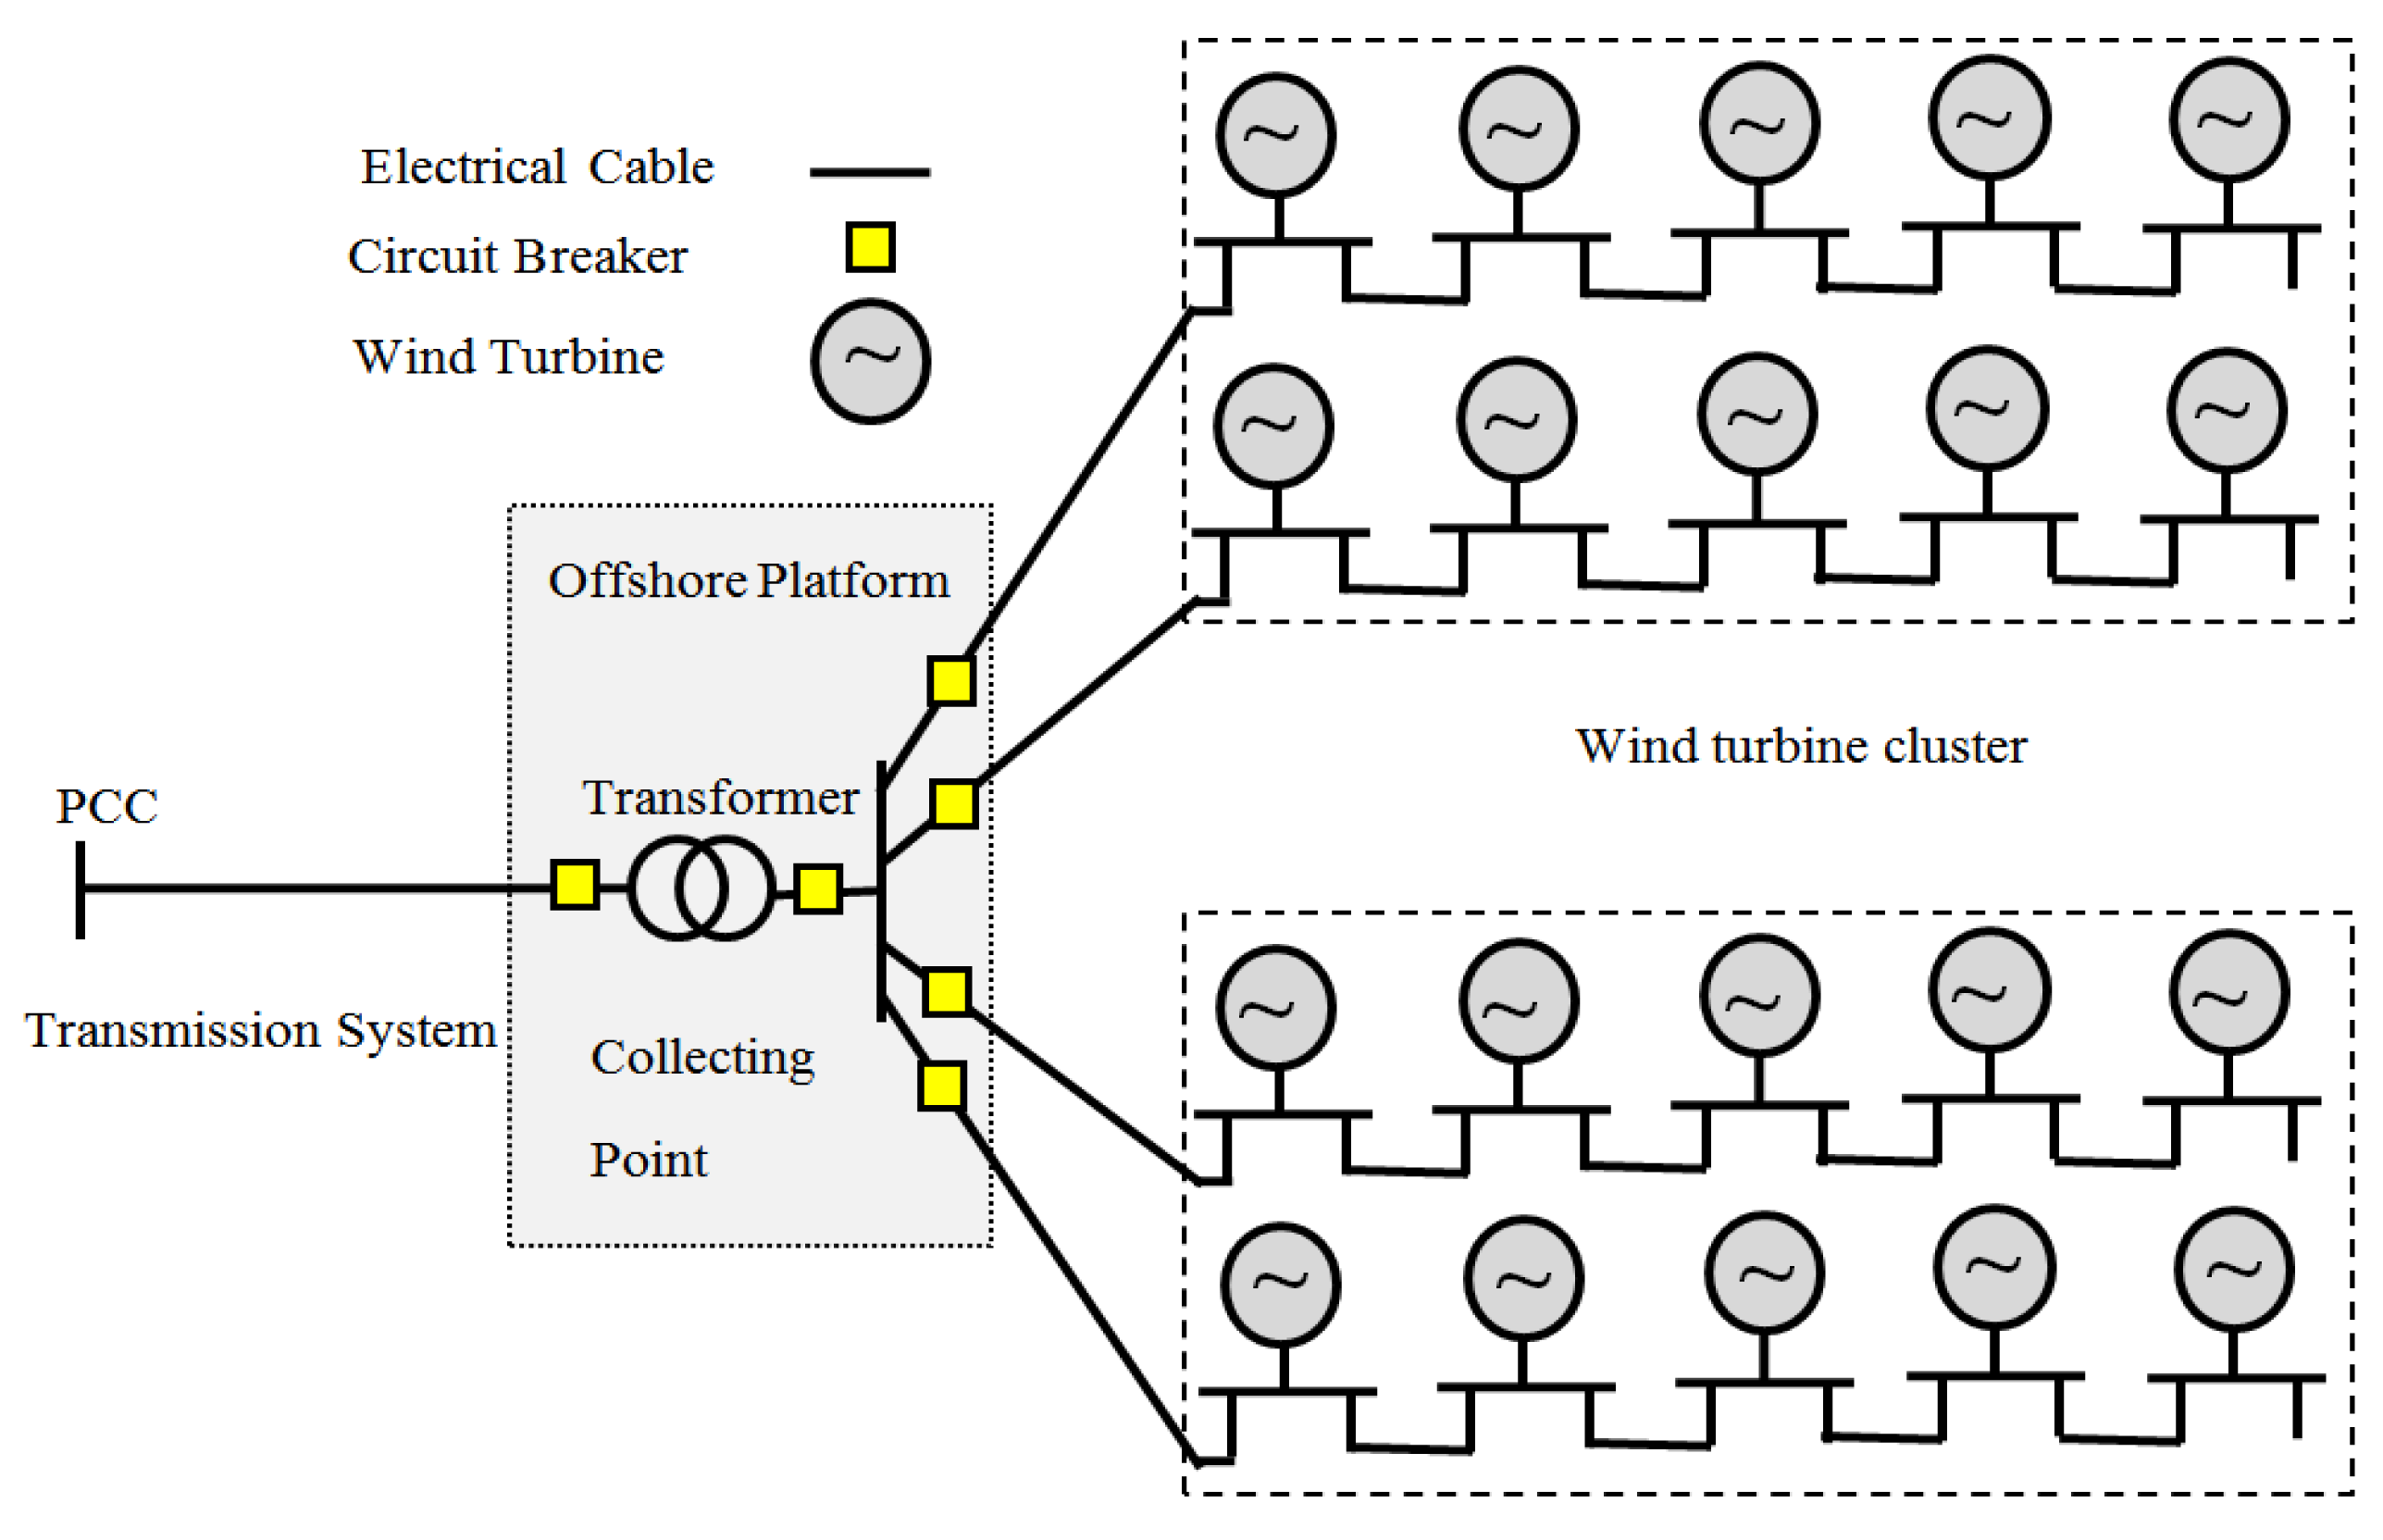
Figure 2 shows the layout of a medium-scale offshore wind farm consisting of four radials and two clusters (each of them with 10 wind turbines) connected to an offshore platform. Electric power cables with different cross-section areas are used for connections between the wind turbines. An offshore transformer is used to step up the voltage, and the total output power from the wind turbines is transmitted to the shore at the point of common coupling through the transmission system [9]. Since the cost of laying cables is very expensive, a SCADA communication network uses the same electric power cables to provide a connection between the wind turbines and the control center. A wireless backup solution can be incorporated into the communication network design to increase the reliability of the network. Furthermore, a wireless network can be configured in such a way that communication network topology is different from the electric power topology [10].
2.2. Wind Farm Communication Topology
The communication topology defines the connectivity between the wind turbines and the control center. This configuration usually follows the electrical topology of the WPF since the optical fiber cables are integrated in the submarine medium-voltage cables. However, the fiber optical layout may be designed in a different way due to the requirements of network redundancy. Most widely types of communication networks are linear (radial) topology, ring topology and star topology. Some other topologies are a combination between them. This section gives the basic communication network topologies in a wind farm. Briefly the advantages and limitation of different network topologies are explained as follows [10,11]:
Radial topology is recommended in the case of small installations with a small number of wind turbines. The turbines are connected in a daisy chain. Each turbine has its own switch. All wind turbines switches are connected with central switch. In case of one switch failure, the remaining turbines of the daisy chain are disconnected;
Ring topology is the preferred network topology in view of network reliability and safety. Each wind turbine switch is connected in a ring structure with a redundant path. The connection is similar to the radial topology with the addition of an alternative path. In case of a switch failure or a connection cable broken between wind turbines, no losses occur in the communication between the wind turbine and the control center;
Star topology where each wind turbine has its own connection. All wind turbines are connected directly to a central switch. When a certain connection cable is broken, the connected wind turbine only cannot work. Furthermore, it is easy to add turbines without the affection of network as each turbine is connected by a separate link.
2.3. IEC 61400-25 Standard
The IEC 61400-25 standard provides a uniform information exchange to control and monitor WPFs. The standard is based on the IEC 61850 standard of a substation automation system, and parts one through six have been currently published. The focus of IEC 61400-25 is the communication between the WPF components, including wind turbines, and systems that control and monitor the WPF, such as a SCADA system. The internal communication of the WPF components is outside the scope of IEC 61400-25.
Table 1 shows the breakdown of the logical nodes (LN) of a wind turbine, and the LNs in turn are classified into mandatory (M) and optional (O). It is highly recommended that all wind turbine logical nodes be considered. The LN is a data holder for different types of information related to their respective components [12]. Each LN contains several attributes, classified into three different categories: status information, analogue information, and control information. Table 2 shows different data attributes pertaining to the wind turbine nacelle (WNAC).
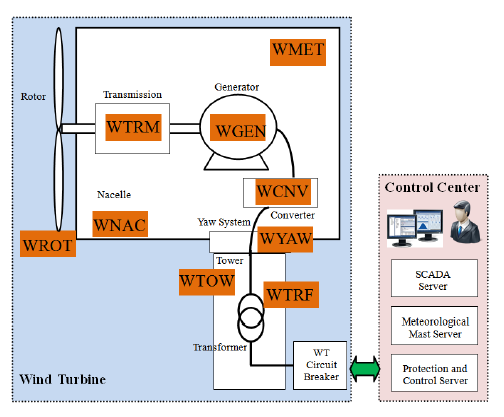
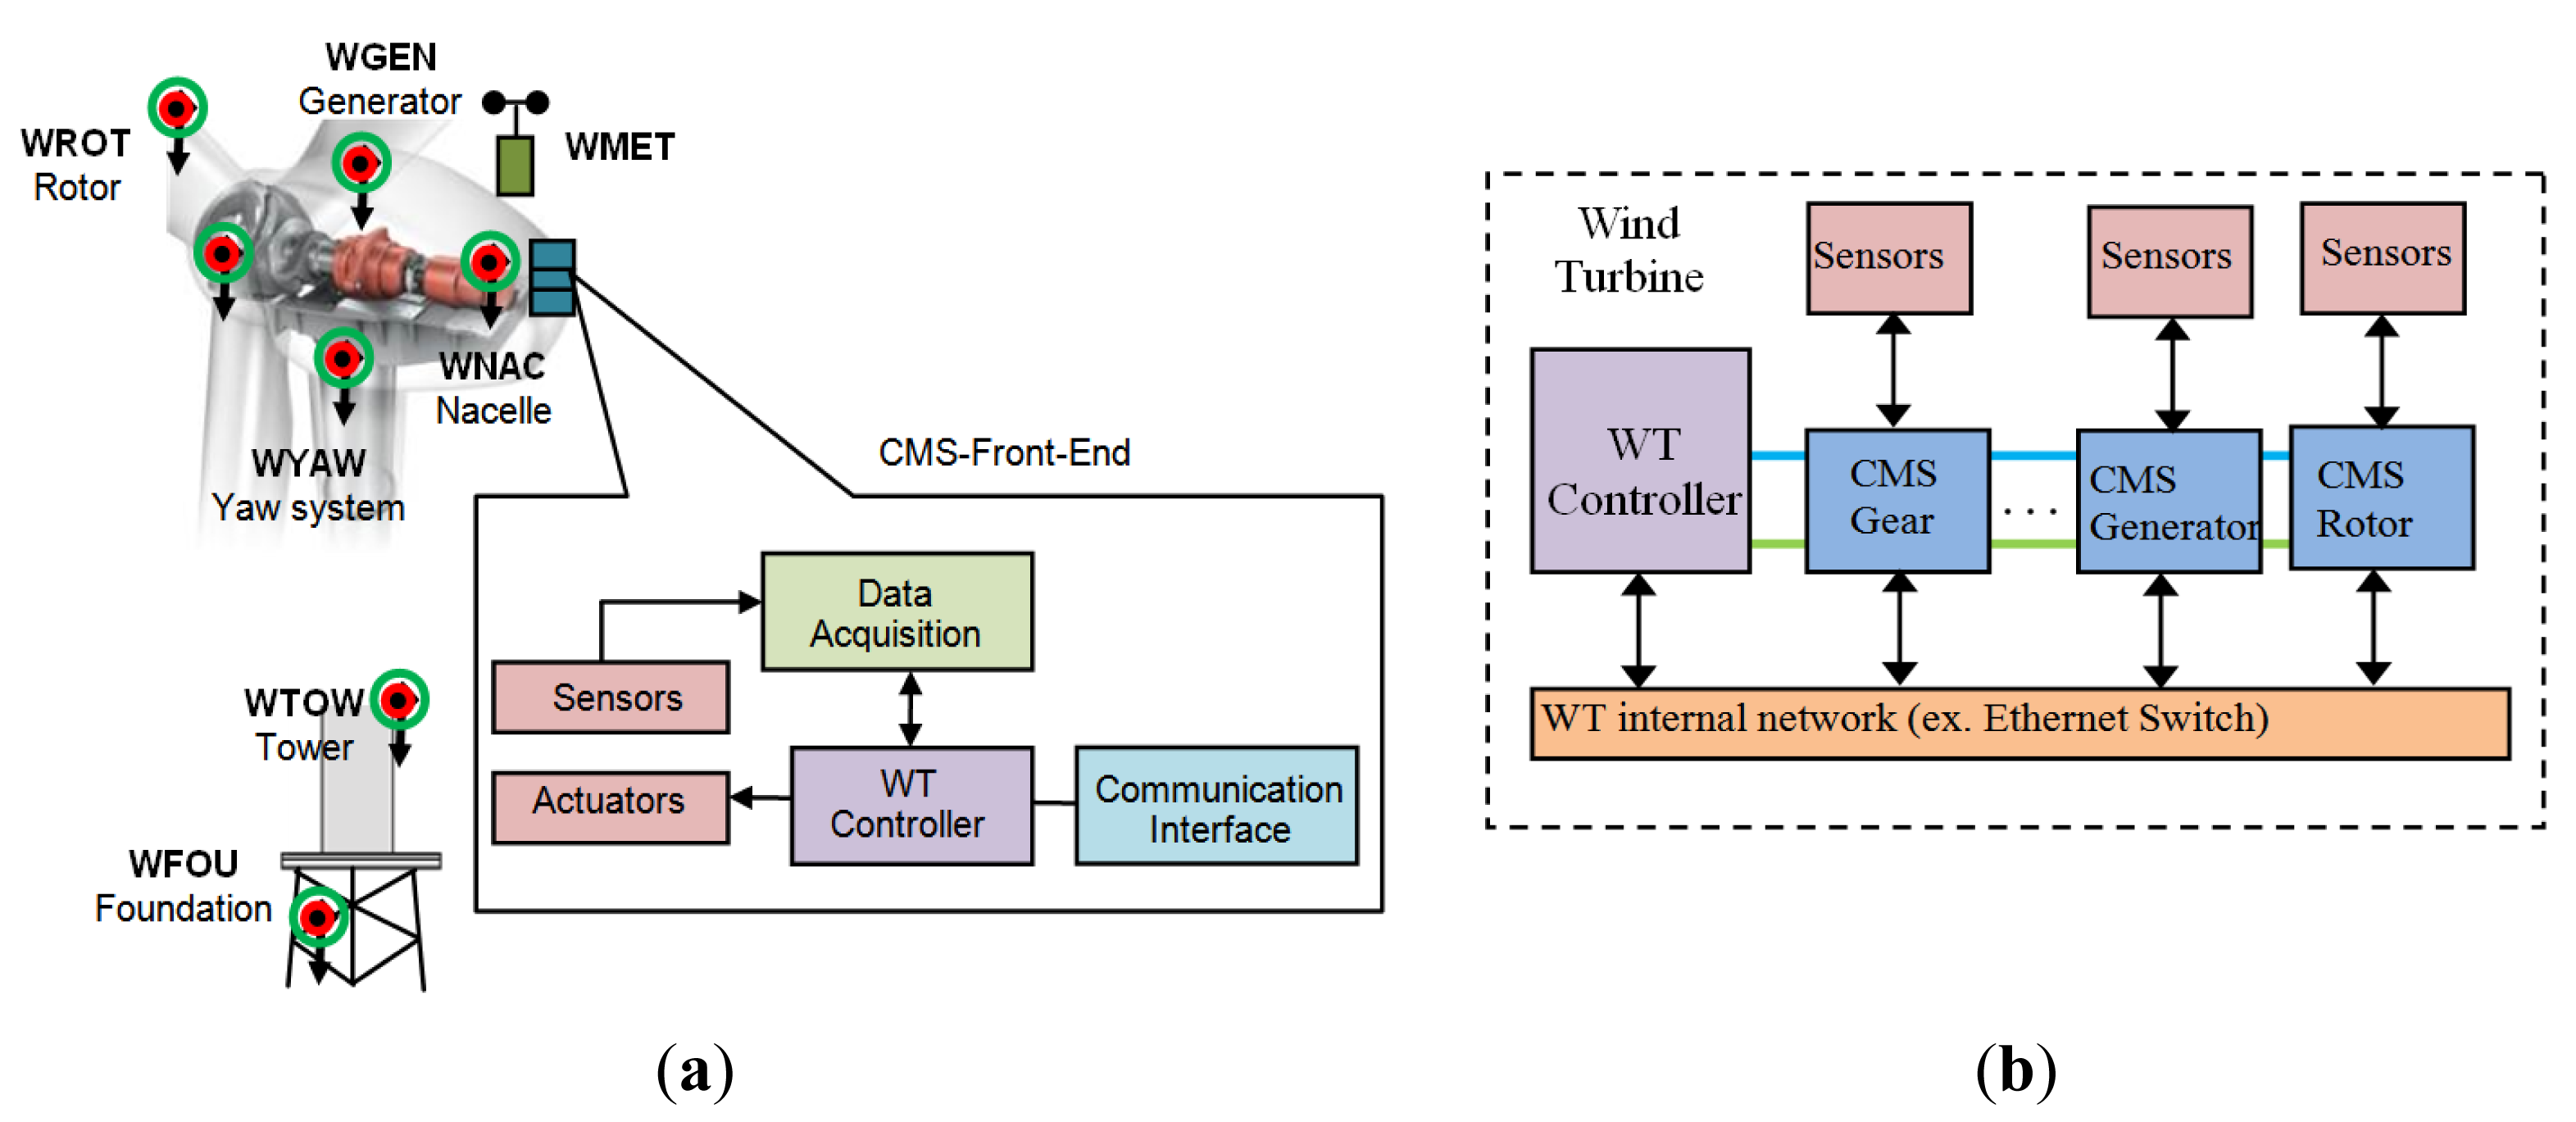
The LNs have well known functions and are modelled using a virtual model related to the real device. For example, LN WROT is related to the wind turbine rotor. We considered that a wind turbine (WT) consists of nine LNs. The LNs are WROT, WTRM, WGEN, WCNV, WNAC, WYAW, WTOW, WTRF and WMET, as shown in Figure 3.
2.4. Requirements for the WPF Communication Network
There are different standards for the communication network requirements of power system, including IEEE C37.1 for SCADA and automation systems, IEEE 1379 for the interoperability of IEDs and RTUs, and IEEE 1646 for communication internal and external to the electric substation [13], and in this work, we consider the communication timing requirements for electric substation automation based on the IEEE 1646 standard, as shown in Table 3.
The main requirements of the WPF communication network describe latency, bandwidth, and quality of service (QoS). There are different applications for the information inside of a wind turbine, and each application has different requirements. For example, the requirement for time delay of the protection information internal to the substation is of 4 ms and 8–12 ms external to the substation. In this study, the network bandwidth is configured for 100 Mbps and 1 Gbps, based on that of the Horns Rev project [14]. For QoS, we assume that all WPF applications have the same priority.
3. Wind Power Farm Communication Network
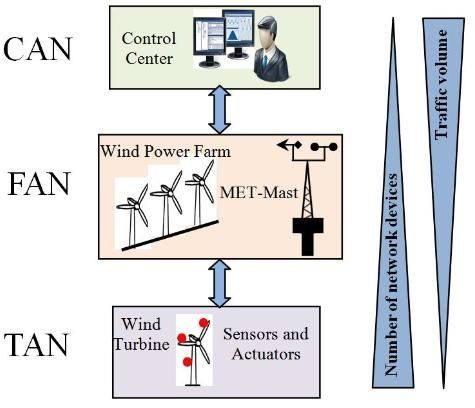
The communication network architecture of WPF is divided into three levels: turbine area network (TAN), farm area network (FAN) and control area network (CAN).
3.1. Turbine Area Network
The wind turbine consists of different parts, such as the rotor, generator, blades, etc. Each part is equipped with different types of sensors, actuators, and measuring devices. A front end (FE) unit with a condition monitoring system (CMS) is installed inside the wind turbine nacelle, and it consists of a data acquisition device (sensors and processing units), actuators, main controller, and communication interface. Each wind turbine is represented by nine LNs including WROT, WTRM, WGEN, WCNV, WTRF, WNAC, WYAW, WTOW, and WMET, and is based on the logical node (LN) concept defined in the IEC 61400-25 standard, as shown in Figure 4a.
Each LN produces different types of data including analog information, status information, and control information. To keep pace with current developments in wind turbine technology, we considered the extension of LNs of the wind turbine foundation (WFOU) and meteorological data defined by Nguyen et al. [4]. Figure 4b shows the communication network model inside a wind turbine.
3.2. Farm Area Network
The WPF consists of wind turbines, a meteorological tower, and control center, as shown in Figure 5. Most turbine manufacturers include local SCADA systems as a part of the WPF where the SCADA function is to communicate with the wind turbines, send and receive information, and execute start/stop commands. The meteorological data include essential information estimated from forecasts of deviations between energy offered to the energy market and real-time power output [15].
3.3. Control Area Network
The main function of the control center is to continuously and efficiently monitor the WPFs. The local control center (LCC) is dedicated to a single WPF and is responsible for collecting information from the wind turbines, meteorological masts, and substations. Independent servers are used for traffic received from different front-end applications of the wind turbines. The control center is designed according to the amount of information managed, the criticality of data, and the need to utilize the data in the future [15].
4. Modeling WPF Communication Network in OPNET
In this section, the WPF communication network is modeled using OPNET [7]. The models used for the wind turbines, wind farm network, meteorological mast, and control center are discussed in more detail. OPNET allows network design and study of the communication networks, devices, protocols, and applications. Note that, conventional WPF architectures use independent communication links and switches for different applications while our network model has all applications sharing the same physical link.
4.1. Modeling of Wind Turbine Network
To calculate the network traffic generated inside a wind turbine, we considered 73 analogue measurements and 29 status indicators for a WT, as shown in Table 4 [5]. Remote monitoring data from WT sensors and measuring devices shown in Table 5 include temperature, rotor speed, pressure, pitch angle, vibration, voltage, current, power, power factor, humidity, wind speed, wind direction, oil level, frequency, and torque. The requirements for measurements of different sensors are calculated according to Equation (1) by using the sampling frequency (fs) and the number of channels (Nc):
For example, the instrument that monitors voltage generates 2048 samples/s. The total amount of traffic is 12,288 bytes/s for three channels with 2 bytes of data for each sample. Table 6 shows the configuration of turbine area network. More details of the calculation for both analogue measurement and status information are given by Ahmed et al. [16].
In this work we considered an extension of the LNs for the wind turbine foundation (WFOU) and meteorological data, as shown in Table 7. The remote monitoring data of the WFOU includes that of the accelerometer, strain gauge, tilt, Acoustic Doppler Current Profile (ADCP), water level, and water temperature while meteorological measurements include temperature, pressure, humidity, wind speed, and wind direction.
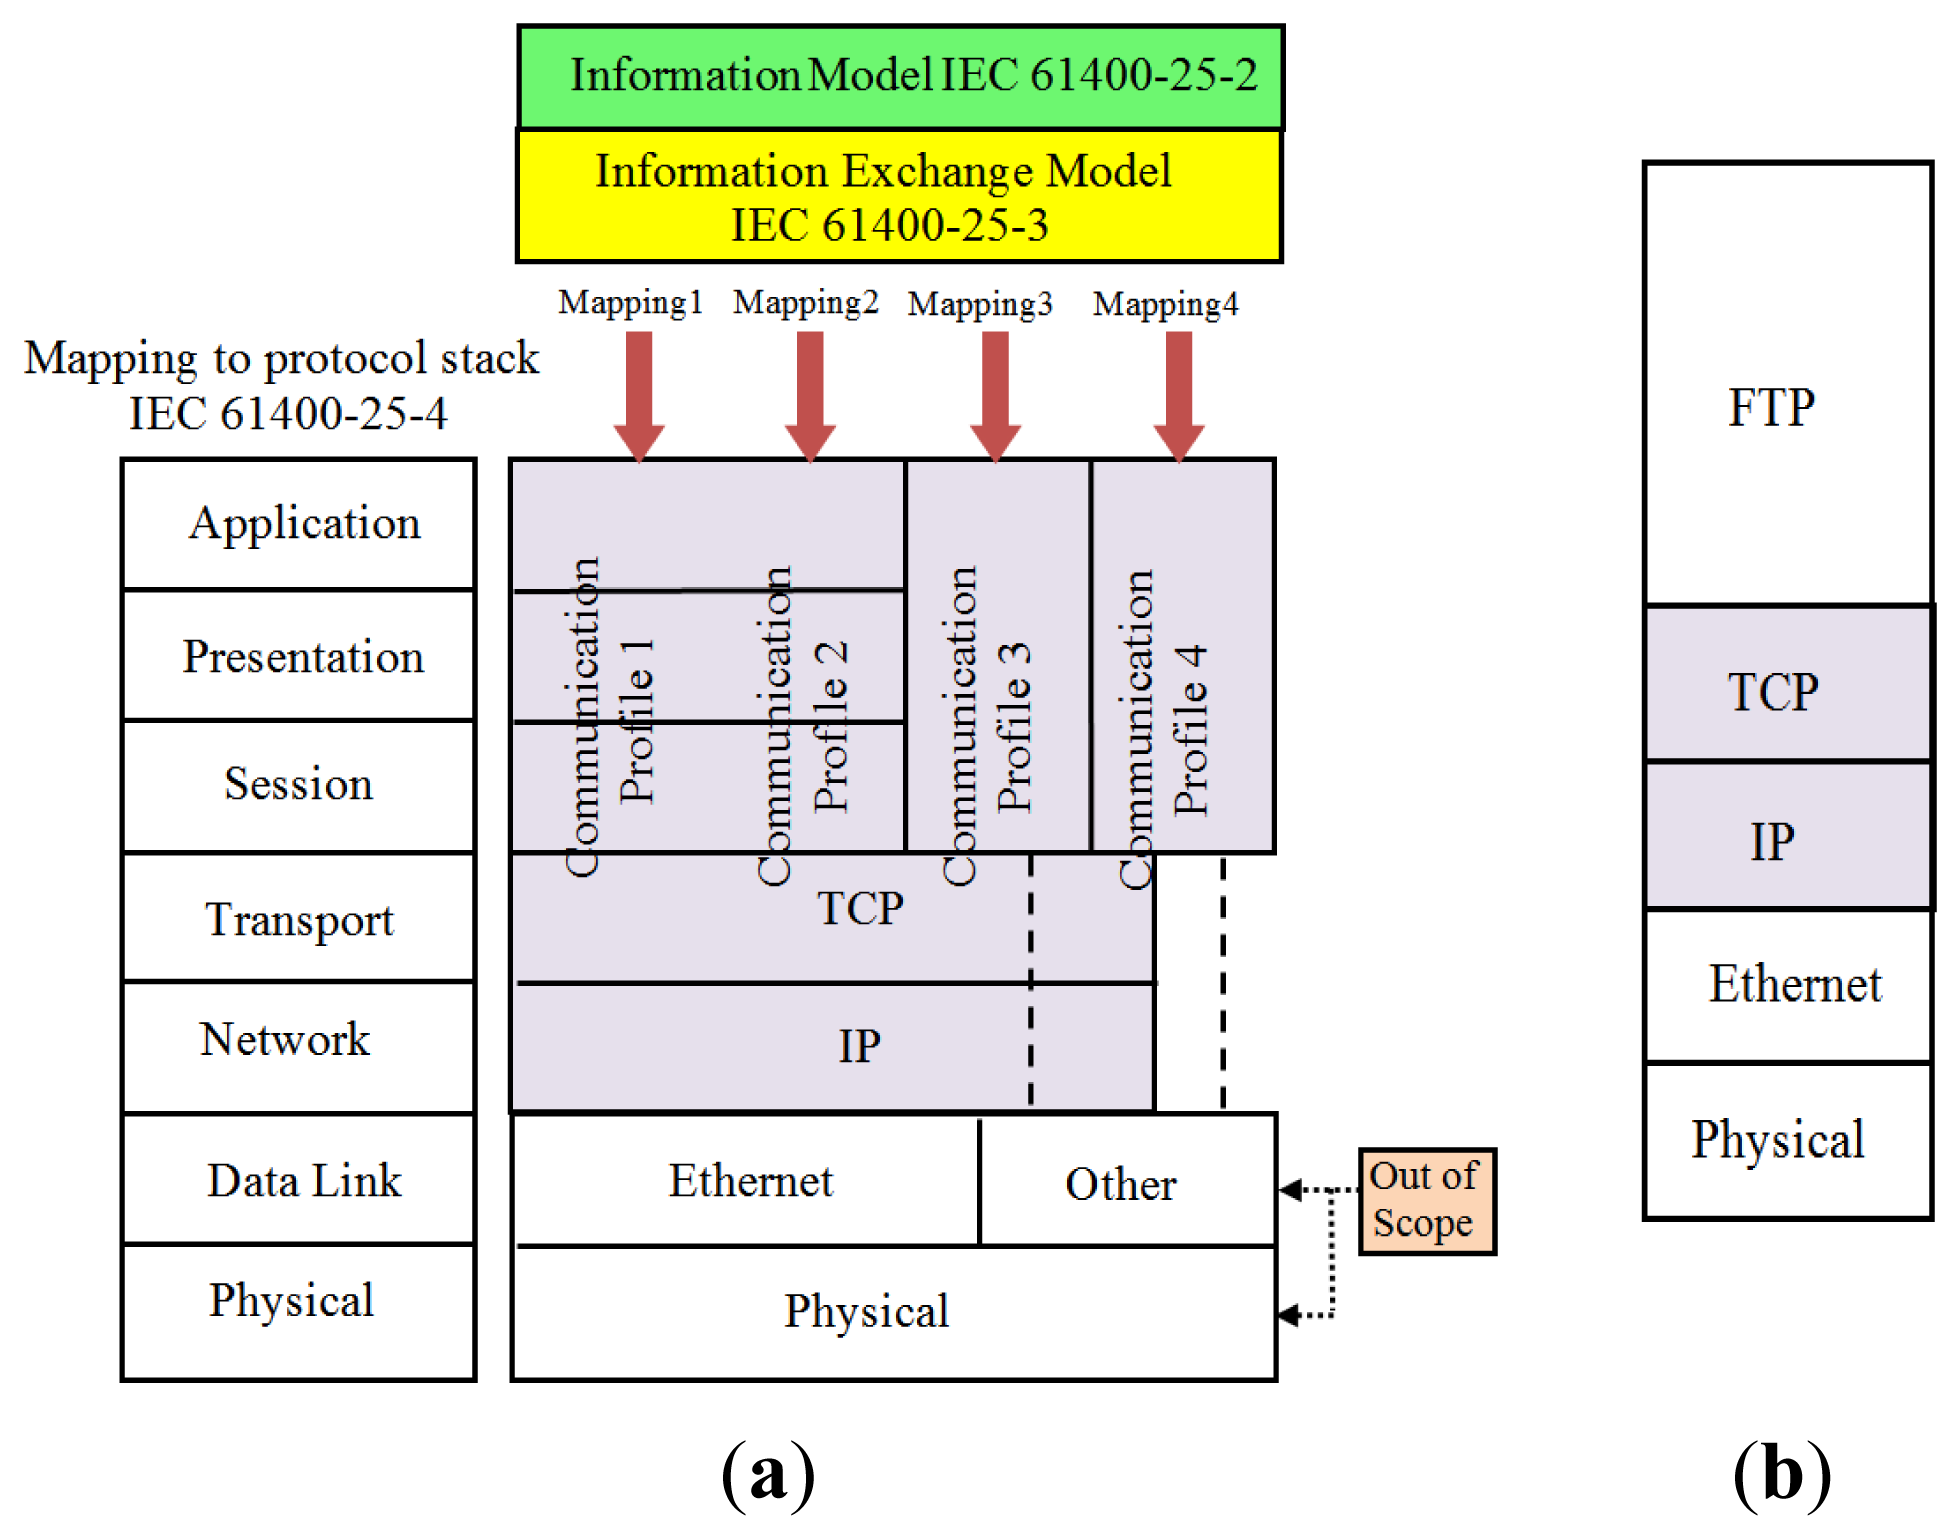
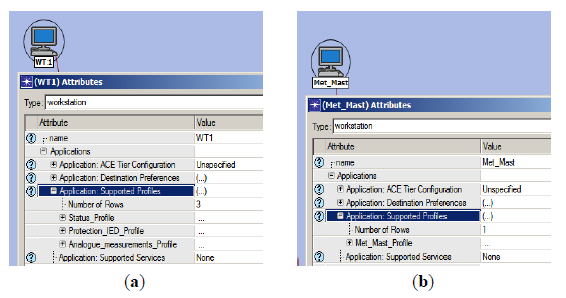
Figure 6a shows the architecture of different mapping configurations based on IEC 61400-25-4 standard. Different mapping methods can be used to exchange information between the wind turbine and control center which are modeled in a server-client model. In our network model, file transfer protocol (FTP) is selected to transfer the data from wind turbines to the control center. The FTP protocol is built on client-server architecture and it uses the services of TCP to transfer files from one host to another as shown in Figure 6b. The wind turbines and meteorological mast are modelled using OPNET workstations, as shown in Figure 7. The Ethernet protocol is used for the physical layer and data link layer while the network layer and transport layer adopt TCP/IP. The application layer in our model is configured for FTP.
4.2. Modeling the Farm Area Network
We considered two types of wind power farms: small-scale and medium-scale. The small-scale wind farm consists of 10 WTs and one meteorological tower while the medium-scale wind farm consists of 20 WTs and two meteorological towers. A switch-based architecture was considered for the network configuration where each wind turbine switch has a dedicated link to the main wind farm switch. The distance between the wind farm main switch and the control center is 5 Km. Full-duplex 100 Mbps and 1 Gbps configuration were used for the main communication link.
4.3. Modeling of Control Center Network
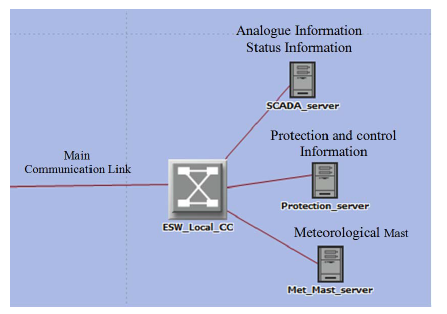
The control center has a 3-server configuration with one main Ethernet switch. The three servers are a SCADA server, a protection server, and a meteorological server, as shown in Figure 8. The SCADA server receives the packets for analogue measurements and status data while the protection server receives the packets from P&C IED devices. We configured the meteorological server to receive data packets from the meteorological tower installed at the WPF.
5. Simulation Results
5.1. Performance Metrics
An OPNET modeler is used to evaluate the performance of the proposed WPF communication network architecture. Table 6 and Table 8 summarize the communication network configuration of TAN, FAN, and CAN. Network performance is evaluated with respect to the following metrics:
End-to-End delay (ETE or Latency), which represents the time (in seconds) taken for the packet to reach its destination or the difference between the creation time of the packet and the time the packet arrives at its destination along the network path; and
Server FTP traffic received (byte/s), which represents the average bytes per second forwarded to the FTP application by the transport layer in the server node.
5.2. Network Model Validation
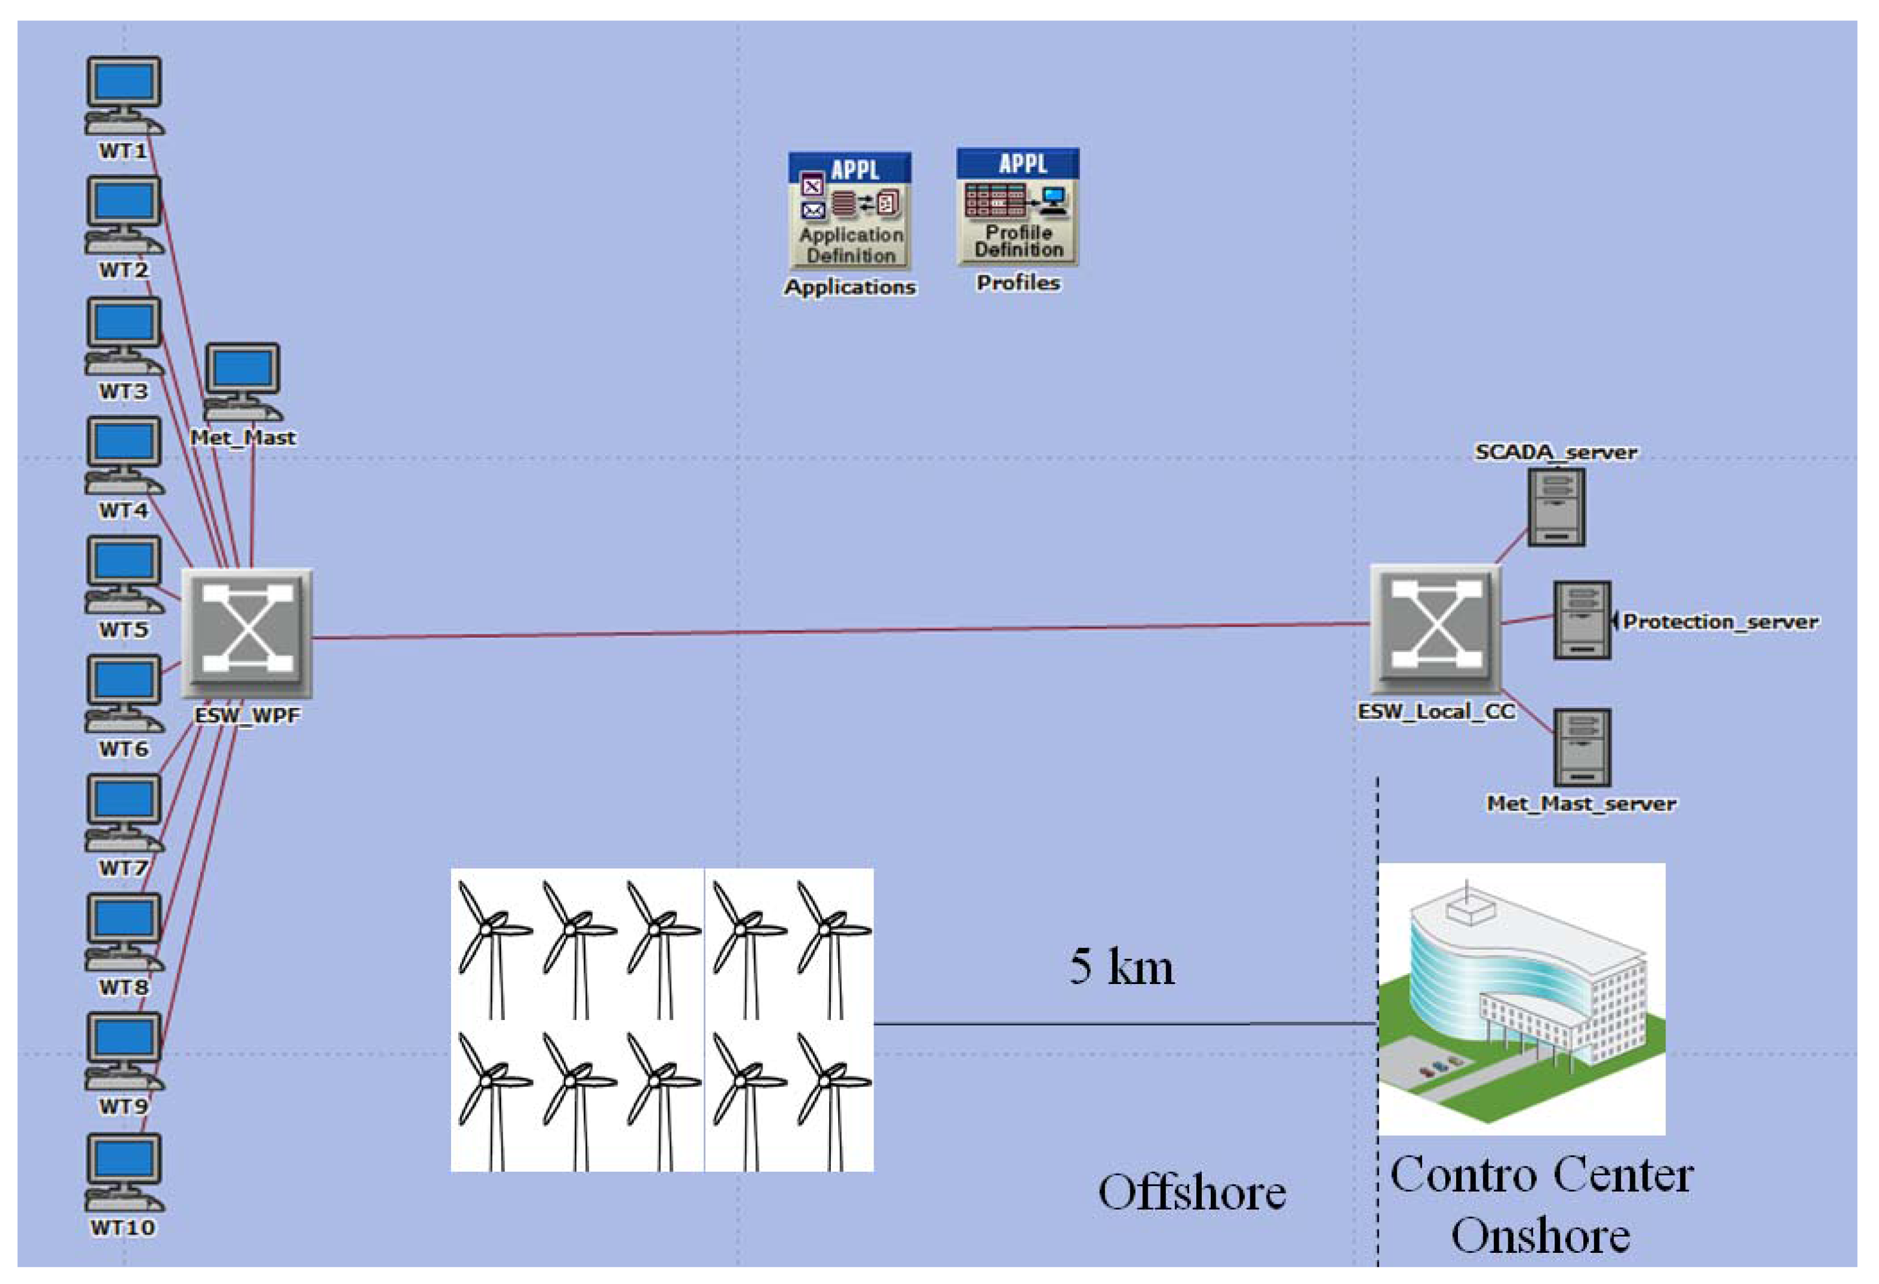
Figure 9 shows the communication network model for a small-scale WPF in OPNET. All wind turbines are connected to the WPF main switch using a direct link (star topology), and the communication link is configured with 100 Mbps or 1 Gbps link capacities. First, the communication network model is validated by measuring the amount of traffic received by the control center servers and compares it to the amount of transmission data generated.
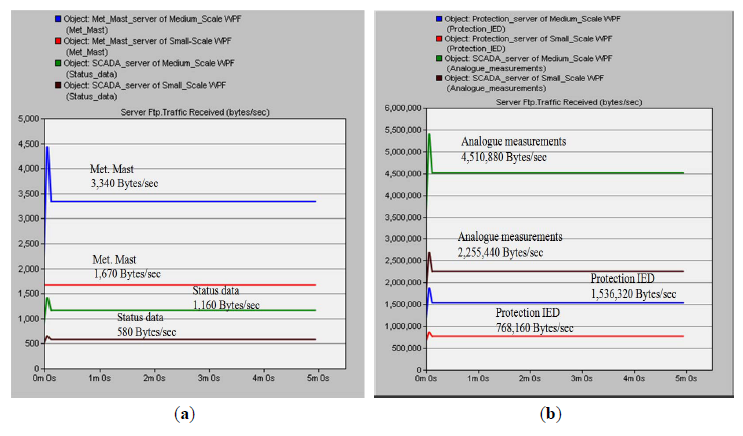
Figure 10 shows the traffic for different applications received at the control center. In case of the small-scale WPF, the traffic received for analogue measurements, status data, and protection IED are 2,255,440 bytes/s, 580 bytes/s and 768,160 bytes/s, respectively. In the case of the medium-scale WPF, the traffic received for analogue measurements, status data, and protection IED are 4,510,880 bytes/s, 1160 bytes/s and 1,536,320 bytes/s, respectively. For the meteorological data, the traffic received at the meteorological mast server is 1670 bytes/s for the small-scale WPF with one meteorological mast, and 3340 bytes/s for the medium-scale WPF with two meteorological masts. All traffic received at the control center is consistent with our calculations for both the small- and medium-scale wind farms.
5.3. End-to-End Delay
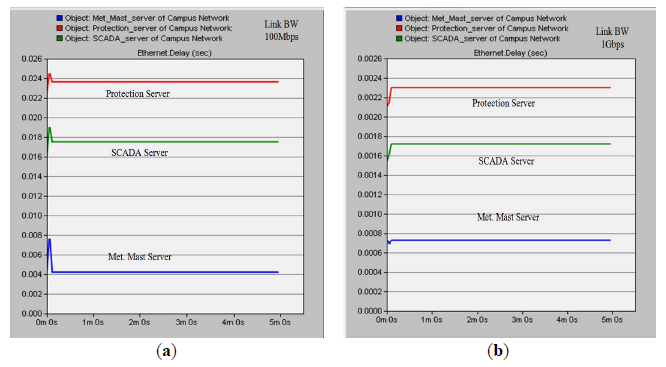
We consider three applications in our network model: SCADA, protection, and meteorological data. Each of these applications requires different response times. Figure 11 shows the average ETE delay for different applications for a small-scale WPF.
The average ETE delay for SCADA, protection, and meteorological data using a 100 Mbps link bandwidth are 8.70 ms, 11.75 ms, and 2.02 ms, respectively. Table 9 shows the average ETE delay for 100 Mbps and 1 Gbps link capacities. Comparing the results of Table 9 with the communication timing requirements in Table 3, the ETE delay of the proposed network model for small-scale WPF satisfies the requirements of the electric power system for both 100 Mbps and 1 Gbps link bandwidths.
The OPNET model for the medium-scale WPF is different from that of the small-scale WPF model. For the FAN, we consider a configuration with three Ethernet switches—one at the offshore platform, one for Turbine Cluster 1 and one for Turbine Cluster 2. Both clusters are directly connected to the offshore platform. The main communication link between the Ethernet switch at offshore platform and the Ethernet switch at the local control center carries the entire data traffic from all wind turbines and both meteorological masts.
Figure 12a shows the average ETE delay for SCADA, protection, and meteorological data using a 100 Mbps link bandwidth.
In this case, the average ETE delay for protection and control data is about 23.62 ms, which does not fulfill the timing requirement of the power system. This means that a link capacity of 100 Mbps is not sufficient for a medium-scale WPF. When we consider the 1 Gbps link capacity, the average ETE delay for different applications is shown in Figure 12b. In this case, the network model satisfies the timing requirements for an electric power system. Table 10 shows the average ETE delay for a medium-scale WPF with 100 Mbps and 1 Gbps link capacities. With respect to SCADA traffic, the ETE delay of SCADA traffic for individual wind turbines (WT1→WT10 for small-scale WPF and WT1→WT20 for medium-scale WPF) are shown in Figure 13a,b for 100 Mbps and 1 Gbps link bandwidths, respectively.
6. Conclusions
This paper proposes hierarchical communication network architectures for offshore WPFs. Two types of WPFs are studied: a small-scale WPF consisting of 10 wind turbines close to the grid and a medium-scale WPF consisting of 20 wind turbines far from the grid. We evaluated the hierarchical architecture through the OPNET modeler, and the network models were validated by measuring the amount of traffic received at the servers. We investigated network delay according to different link bandwidths where it was observed that increasing the link bandwidth from 100 Mbps to 1 Gbps offered better performance to various WPF applications. In case of a small-scale WPF with a link capacity of 1 Gbps, the average ETE delay for SCADA, protection, and meteorological data were 0.83 ms, 1.13 ms and 0.75 ms, respectively. In case of the medium-scale WPF, 100 Mbps did not fulfill the timing requirements for the power system. The simulation results showed that the proposed communication architecture with the link capacity of 1 Gbps satisfies the network requirements of a power system for WPF applications. The proposed network will be extended in order to implement a reliable communication network for large-scale WPFs in future work.
Acknowledgments
This work was supported by the National Research Foundation of Korea (NRF) funded by the Korea government (MSIP) (2010-0028509).
Conflicts of Interest
The authors declare no conflict of interest.
References
- Ahmed, M.A.; Kim, Y.-C. Protection schemes of EPON-based communication network for offshore wind power farms. Proceedings of the 2013 International Conference on ICT Convergence, Jeju, Korea, 14–16 October 2013; pp. 1135–1139.
- Goraj, M.; Epassa, Y.; Midence, R.; Meadows, D. Designing and deploying Ethernet networks for offshore wind power applications—A case study. Proceedings of the 10th International Conference on Developments in Power System Protection (DPSP 2010), Manchester, UK, 29 March–1 April 2010; pp. 1–5.
- Singh, B.K.; Coulter, J.; Sayani, M.A.G.; Sami, S.M.; Khalid, M.; Tepe, K.E. Survey on communication architectures for wind energy integration with the smart grid. Int. J. Environ. Stud. 2013, 70, 765–776. [Google Scholar]
- Nguyen, T.H.; Prinz, A.; Friiso, T.; Nossum, R. Smart grid for offshore wind farms: Towards an information model based on the IEC 61400–25 standard. Proceedings of the 2012 IEEE PES on Innovative Smart Grid Technologies (ISGT), Washington, DC, USA, 16–20 January 2012; pp. 1–6.
- Ahmed, M.A.; Kim, Y.-C. Hybrid communication network architectures for monitoring large-scale wind turbine. J. Electr. Eng. Technol. 2013, 8, 1626–1636. [Google Scholar]
- Ahmed, M.A.; Kim, Y.-C. Hierarchical communication network architectures for offshore wind power farms. Proceedings of the 2014 International Symposium on Computer, Consumer and Control (IS3C), Taichung, Taiwan, June 2014. in press.
- OPNET Technologies. OPNET Modeler. Available online: http://www.OPNET.com (accessed on 10 January 2014).
- Haugsten Hansen, T. Offshore Wind Farm Layouts: Performance Comparison for a 540 MW Offshore Wind Farm. Master's Thesis, Norwegian University of Science and Technology, Trondheim, Norway, July 2009. [Google Scholar]
- Shin, J.-S.; Kim, J.-O.; Cha, S.T.; Wu, Q. Reliability evaluation considering structures of a large scale wind farm. Proceedings of the 2013 15th European Conference on Power Electronics and Applications (EPE), Lille, France, 2–6 September 2013; pp. 1–10.
- Gardner, P.; Craig, L.M.; Smith, G.J. Electrical systems for offshore wind farms. Proceedings of the 20th British Wind Energy Association Conference, Cardiff, UK, 2–4 September 1998; pp. 309–317.
- Vestas Online SCADA Systems. Available online: http://vestas.com/en/products_and_services/operation_and_maintenance#!vestas-online-compact (accessed on 19 May 2014).
- International Electrotechnical Commission. Wind Turbines—Part 25-2: Communications for Monitoring and Control of Wind Power Plants—Information Models; International Standard IEC 61400-25-2. International Electrotechnical Commission: Geneva, Switzerland, 2006. Available online: http://webstore.iec.ch (accessed on 10 January 2014).
- Khan, R.H.; Khan, J.Y. A comprehensive review of the application characteristics and traffic requirements of a smart grid communications network. Comput. Netw. 2013, 57, 825–845. [Google Scholar]
- Kristoffersen, J.R.; Christiansen, P. Horns Rev offshore wind farm: Its main controller and remote control system. Wind Eng. 2003, 27, 351–360. [Google Scholar]
- Gallardo-Callesa, J.-M.; Colmenar-Santosb, A.; Ontañon-Ruiza, J.; Castro-Gilb, M. Wind control centres: State of the art. Renew. Energy 2013, 51, 93–100. [Google Scholar]
- Ahmed, M.A.; Yang, W.-H.; Kim, Y.-C. Simulation study of communication network for wind power farm. Proceedings of the 2011 International Conference on ICT Convergence (ICTC), Seoul, Korea, 28–30 September 2011; pp. 706–709.


| LN Classes | Description | M/O |
|---|---|---|
| WROT | Wind turbine rotor information | M |
| WTRM | Wind turbine transmission information | O |
| WGEN | Wind turbine generator information | M |
| WCNV | Wind turbine converter information | O |
| WTRF | Wind turbine transformer information | O |
| WNAC | Wind turbine nacelle information | M |
| WYAW | Wind turbine yawing information | M |
| WTOW | Wind turbine tower information | O |
| WMET | Wind power plant meteorological information | O |
| Data | Attribute | Explanation |
|---|---|---|
| Analogue information | Dir | Nacelle orientation |
| WdSpd | Wind speed outside nacelle | |
| WdDir | Wind direction outside nacelle | |
| Ex/InTmp | Temp. outside/ inside nacelle | |
| IntlHum | Humidity inside nacelle | |
| DispXdir | Tower displacement (longitudinal) | |
| DispYdir | Tower displacement (lateral) | |
| Status information | BecBulbSt | Status of beacon |
| WdHtSt | Status of heater for wind sensor | |
| IceSt | Status of ice detection | |
| AneSt | Status of anemometer | |
| Control information | SetBecMod | Set modus of beacon |
| SetBecLev | Set bulb light of beacon | |
| SetFlash | Set value of flash duty cycle of beacon | |
| Information type | Internal | External |
|---|---|---|
| Monitoring and control | 16 ms | 1 s |
| Protection | 4 ms | 8–12 ms |
| Operation and maintenance | 1 s | 10 s |
| Measurement | Sampling frequency | Data transmission (bytes/s) | # of measurement | Total traffic (bytes/s) |
|---|---|---|---|---|
| Temperature | 1 Hz | 2 | 16 | 32 |
| Speed | 3 Hz | 6 | 3 | 18 |
| Pressure | 100 Hz | 200 | 7 | 1,400 |
| Pitch Angle | 3 Hz | 6 | 6 | 36 |
| Vibration | 200 Hz | 1,200 | 2 | 2,400 |
| Voltage | 2,048 Hz | 12,288 | 12 | 147,456 |
| Current | 2,048 Hz | 12,288 | 6 | 73,728 |
| Power | 5 Hz | 10 | 2 | 20 |
| Power factor | 1 Hz | 2 | 2 | 4 |
| Humidity | 1 Hz | 2 | 3 | 6 |
| Wind direction | 3 Hz | 6 | 3 | 18 |
| Wind speed | 3 Hz | 6 | 3 | 18 |
| Displacement | 10 Hz | 40 | 2 | 80 |
| Oil Level | 1 Hz | 2 | 4 | 8 |
| Frequency | 10 Hz | 20 | 1 | 20 |
| Torque | 50 Hz | 300 | 1 | 300 |
| Status | 1 Hz | 2 | 29 | 58 |
| LN Classes | # of Sensors | # of analogue measurements | # of status Information | P&C information |
|---|---|---|---|---|
| WROT | 14 | 9 | 5 | Merging unit IED Process and transmit V & I signals from CT & VT 3-Ф voltage 3-Ф current |
| WTRM | 18 | 10 | 8 | |
| WGEN | 14 | 12 | 2 | |
| WCNV | 14 | 12 | 2 | |
| WTRF | 12 | 9 | 3 | |
| WNAC | 12 | 8 | 4 | |
| WYAW | 7 | 5 | 2 | |
| WTOW | 4 | 1 | 3 | |
| WMET | 7 | 7 | - | |
| TOTAL | 102 | 73 | 29 | 6 |
| Level | Application | Data rate |
|---|---|---|
| Wind turbine network | Analogue Measurements (AM) | 225,544 bytes/s |
| Status Indicators (SI) | 58 bytes/s | |
| Protection and Control IED (PCI) | 76,816 bytes/s |
| Attribute name | Measurement | Sampling frequency | # of Channel | Data (Bytes/s) |
|---|---|---|---|---|
| Met. mast | Temperature | 1 Hz | 1 | 2 |
| Pressure | 100 Hz | 1 | 200 | |
| Humidity | 1 Hz | 1 | 2 | |
| Wind direction | 3 Hz | 1 | 6 | |
| Wind speed | 3 Hz | 1 | 6 | |
| WFOU | Accelerometer | 200 Hz | 3 | 1200 |
| Strain gauge | 10 Hz | 3 | 60 | |
| Tilt-inclinometer | 10 Hz | 2 | 40 | |
| ADCP | Data rate 1200 bits/s, Up to 2000 m | 150 | ||
| Water level | 1 Hz | 1 | 2 | |
| Water temperature | 1 Hz | 1 | 2 | |
| Total traffic | 1670 Bytes/s | |||
| Network Part | Network Content | |
|---|---|---|
| Wind farm network | Ethernet switch small-scale WPF | 1 Switch |
| Ethernet switch medium-scale WPF | 3 Switches | |
| Link bandwidth | 100 Mbps, 1Gbps | |
| Control center network | SCADA server | 1 Server |
| PCI server | 1 Server | |
| Meteorological server | 1 Server | |
| Ethernet switch | 1 Switch | |
| Link bandwidth | 100 Mbps, 1Gbps | |
| Link capacity | SCADA | PCI | Met. mast |
|---|---|---|---|
| 100 Mbps | 8.70 ms | 11.75 ms | 2.02 ms |
| 1Gbps | 0.83 ms | 1.13 ms | 0.57 ms |
| Link capacity | SCADA | PCI | Met. mast |
|---|---|---|---|
| 100 Mbps | 17.51 ms | 23.62 ms | 4.21 ms |
| 1 Gbps | 1.72 ms | 2.30 ms | 0.73 ms |
© 2014 by the authors; licensee MDPI, Basel, Switzerland. This article is an open access article distributed under the terms and conditions of the Creative Commons Attribution license ( http://creativecommons.org/licenses/by/3.0/).
Share and Cite
Ahmed, M.A.; Kim, Y.-C. Hierarchical Communication Network Architectures for Offshore Wind Power Farms. Energies 2014, 7, 3420-3437. https://doi.org/10.3390/en7053420
Ahmed MA, Kim Y-C. Hierarchical Communication Network Architectures for Offshore Wind Power Farms. Energies. 2014; 7(5):3420-3437. https://doi.org/10.3390/en7053420
Chicago/Turabian StyleAhmed, Mohamed A., and Young-Chon Kim. 2014. "Hierarchical Communication Network Architectures for Offshore Wind Power Farms" Energies 7, no. 5: 3420-3437. https://doi.org/10.3390/en7053420