Fast Estimation of State of Charge for Lithium-Ion Batteries

Abstract
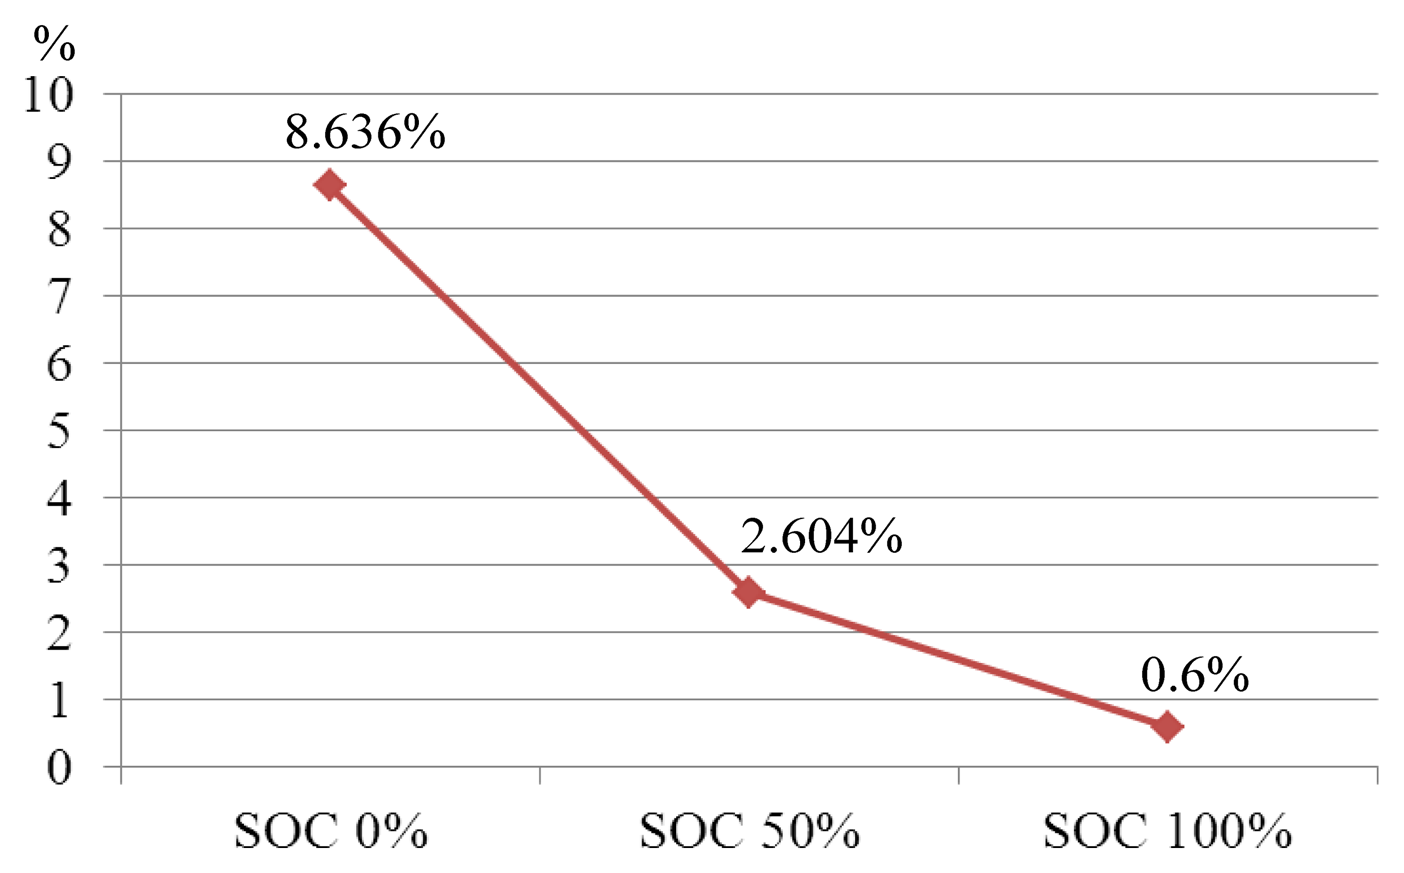
: This paper presents a novel impedance-based approach to efficiently estimate the state of charge (SOC) of a Li-ion battery. By using an AC impedance analyzer, a database is constructed, containing records of AC impedance versus SOC. In practical applications, the SOC values can be found instantly once the contents of the database are referenced. For validation purposes, AC impedance comparisons are conducted using AC impedance analyzer as a benchmark at SOC of 0%, 50% and 100%, which indicate errors of 8.636%, 2.604% and 0.600%, respectively.1. Introduction
As environmental pollution worsens, the development of various types of electric vehicles such as electric bicycles, hybrid vehicles, electric cars, and electric motorcycles, is receiving plenty of attention like never before. All these vehicles are battery powered, and Li-ion batteries are one of the most popular choices for this task. Li-ion batteries have the advantages of high energy density, high power density, low self-discharge, fast charging, high energy weight ratios, no memory effect and high durability [1]. However, there is no easy way to accurately display the battery SOC and acquire information on the current battery status. Definitely, SOC can serve as an indicator to remind users to recharge batteries and to prevent batteries from overcharging [2].
There are a variety of approaches to estimate the SOC for Li-ion batteries. The Coulomb counting method is a commonly seen rechargeable battery capacity estimation method, using an open-loop algorithm and counting the battery charge and discharge capacity. However, this method requires a high accuracy current measurement device and is incapable of performing real-time SOC measurements. Moreover, there is no easy way to acquire the initial SOC values and the defects of larger measurement error accumulation due to uncertain disturbances, leading to an inaccurate estimation [3,4]. The open circuit voltage method measures a family of open circuit voltage curves with the SOC value as a parameter in advance, but it doesn't consider parameter variations in electrochemical batteries and aging effects. Since it requires a long period of rest time after each measurement, it is hence inapplicable to hybrid vehicles applications [5,6]. The Kalman filter method has to build an accurate battery model first, which considers both the open circuit voltage and internal resistance of the battery. Using the built battery model, the open circuit voltage can be formulated, but this model cannot practically simulate the nonlinear dynamic behavior of the plant. In an attempt to achieve high accuracy in SOC estimation, the major disadvantages of the Kalman filter method are that it necessitates an accurate battery model and a complex mathematic operation [7–10].
This paper presents an efficient SOC estimation approach for Li-ion batteries. Using records of the AC impedance versus the SOC value contained in a pre-built database, the SOC value corresponding to the measured AC impedance, can be found instantly. AC impedance comparisons are made with an AC impedance analyzer as a benchmark at SOC of 0%, 50% and 100%, which indicates errors of 8.636%, 2.604% and 0.600%, respectively.
2. AC Impedance Analysis
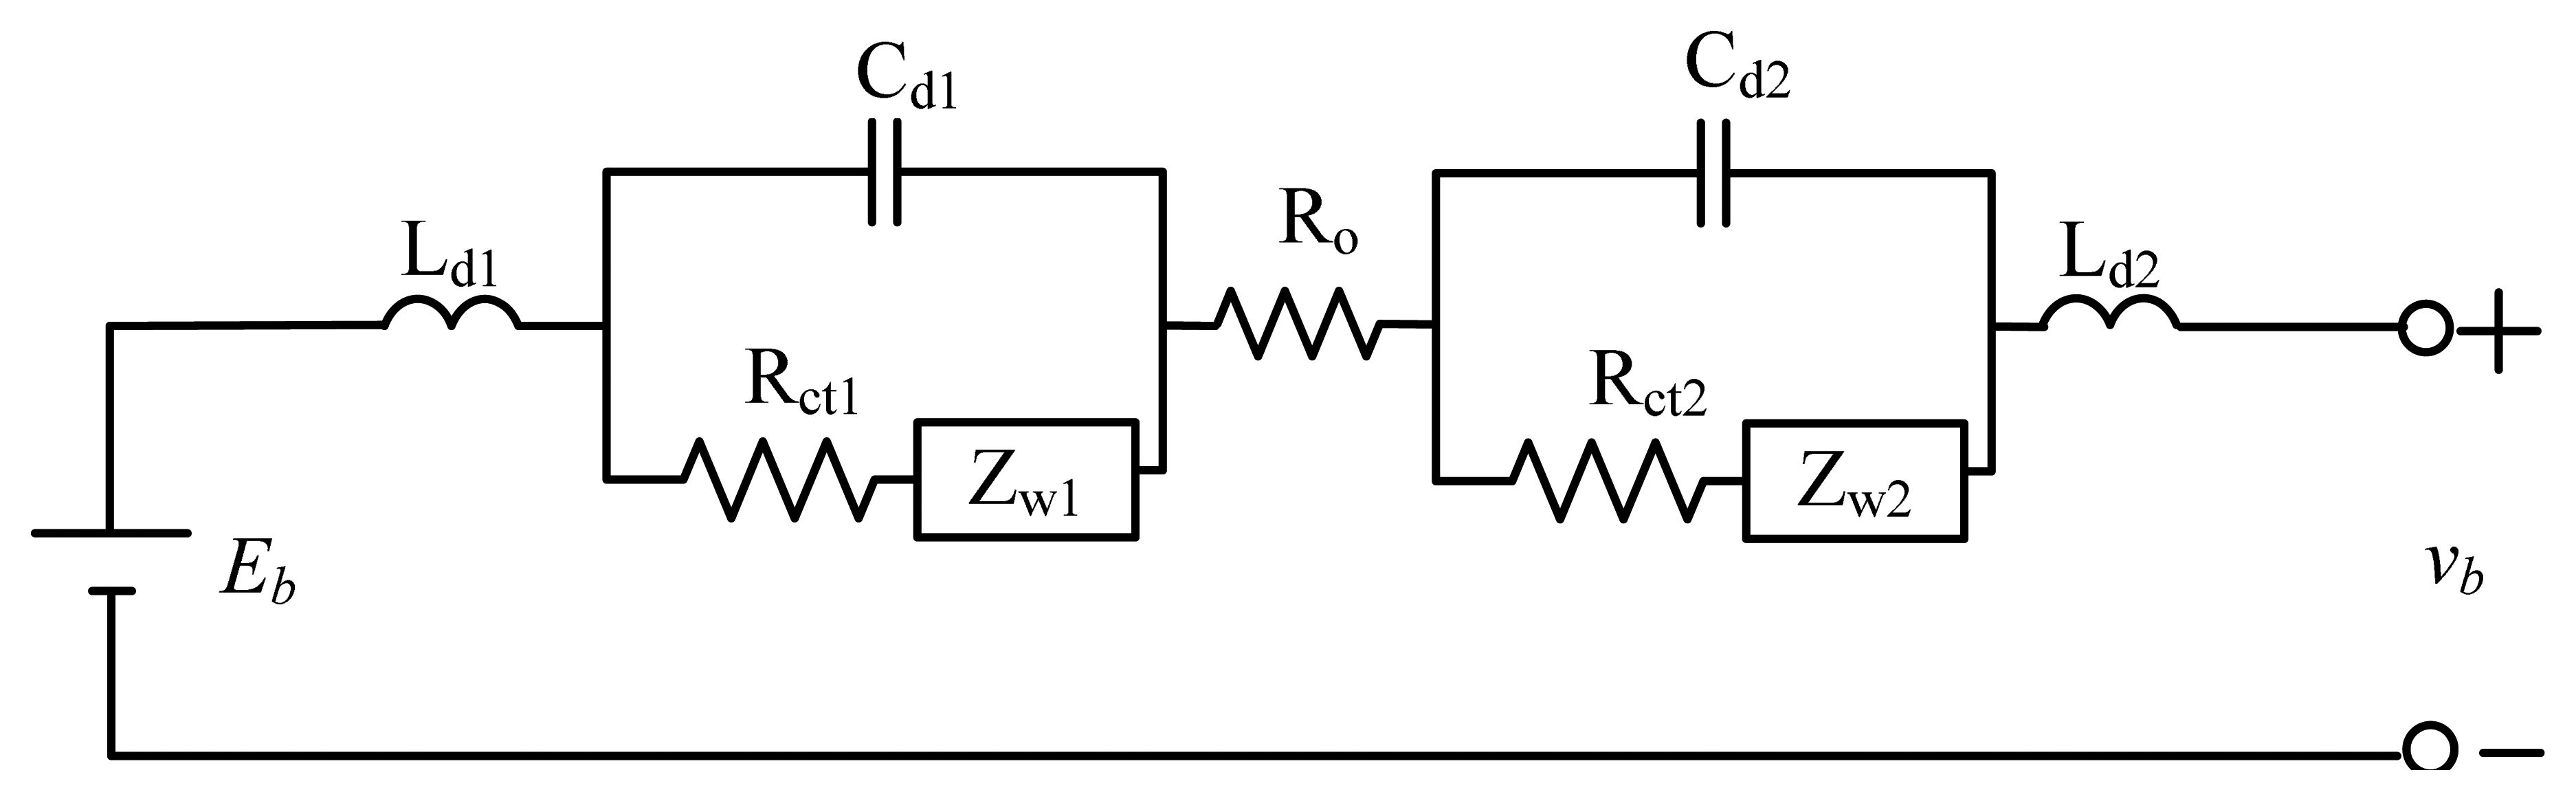
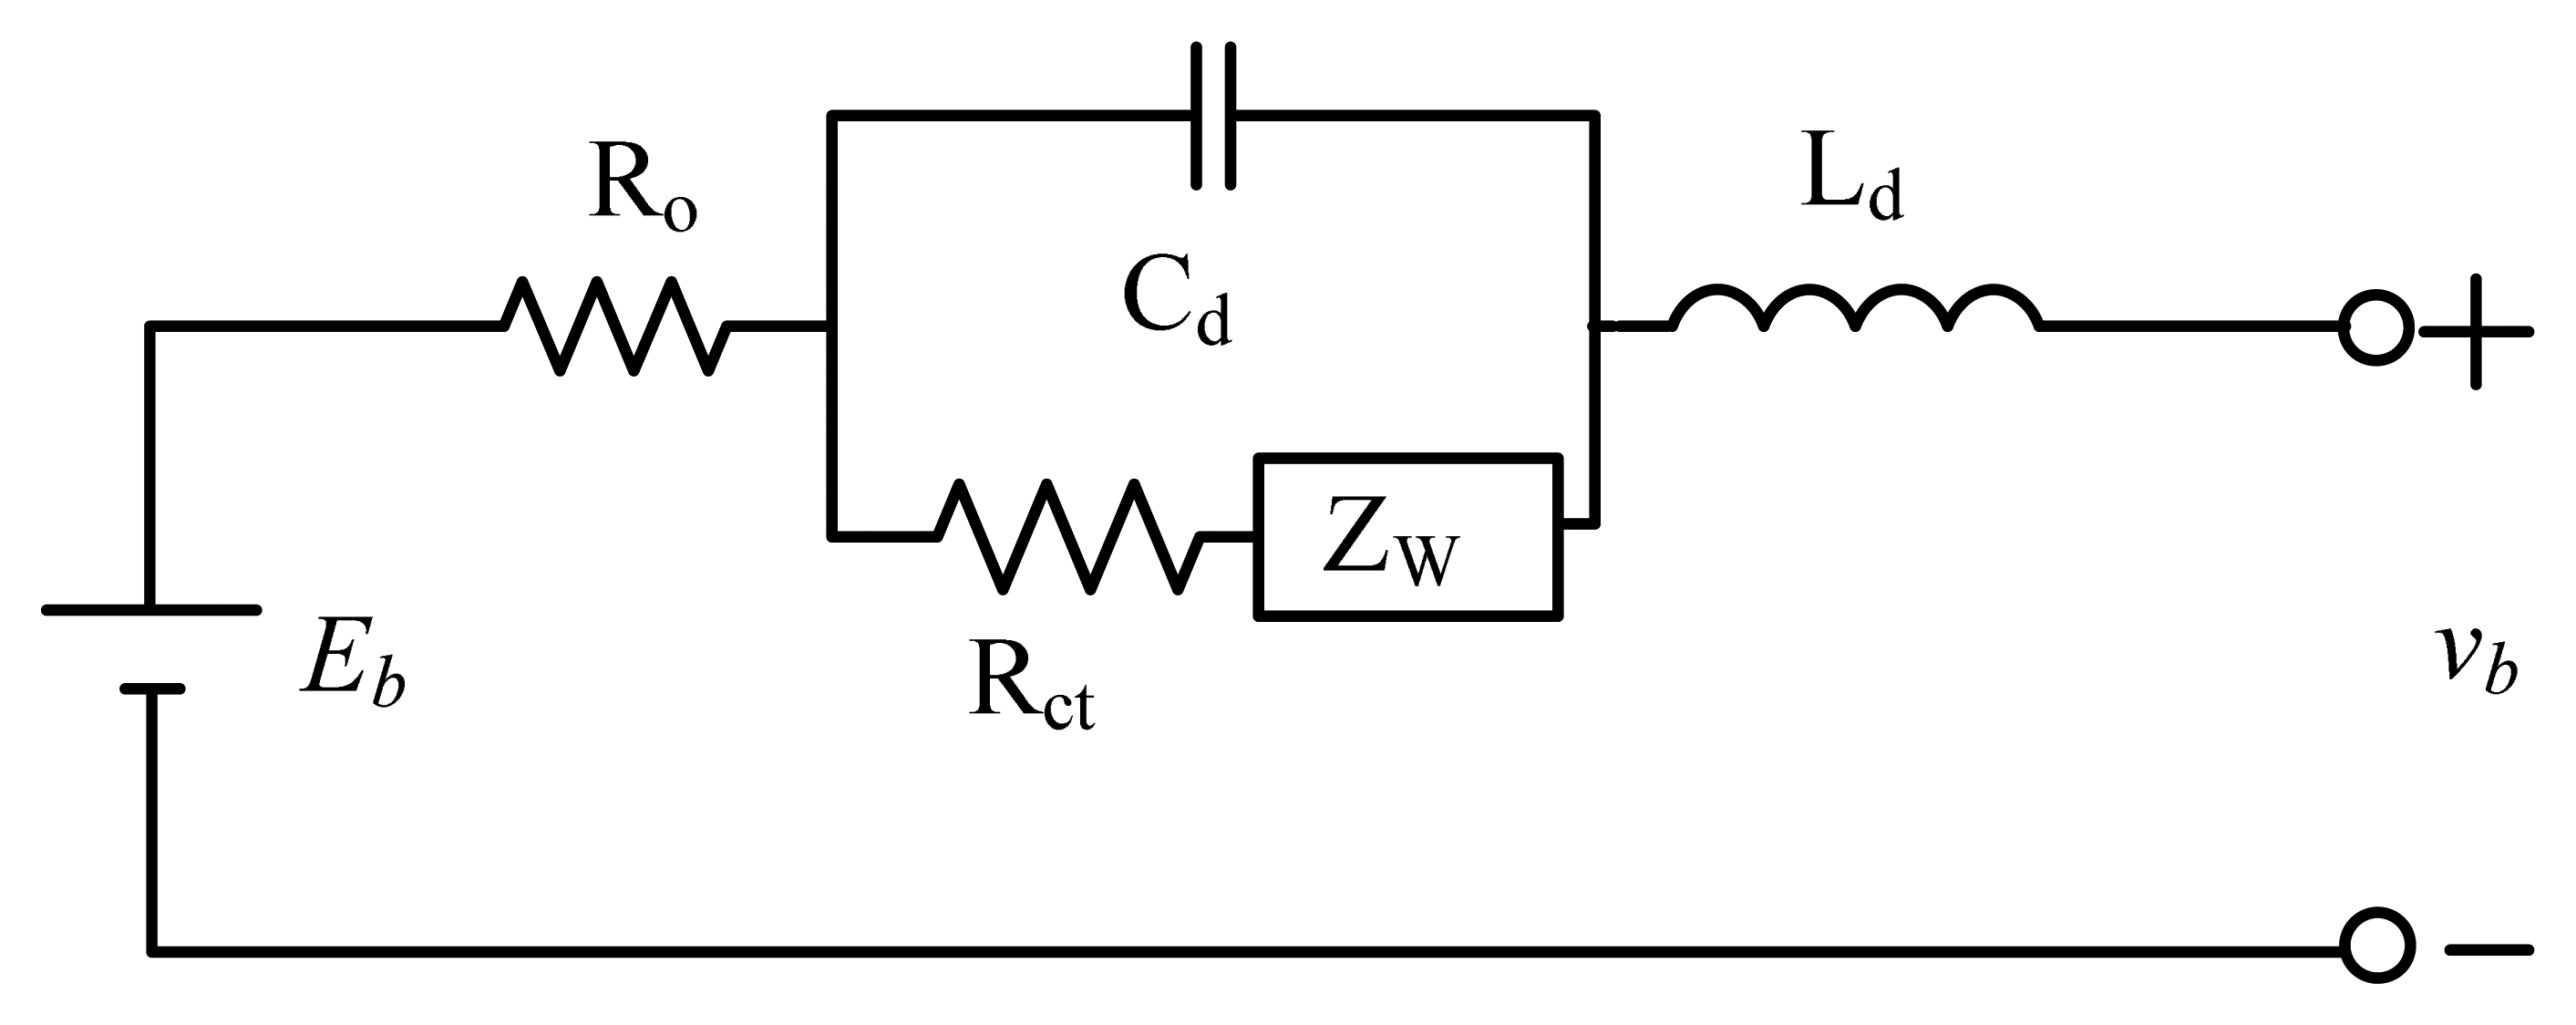
This paper aims are to explore the AC impedance influence of a 18650 Li-ion battery on SOC. Presented in Figure 1 is the complete Li-ion battery AC impedance model for an electrolyte battery where the equivalent AC impedance in the electrochemical process between the anode and cathode is described in detail. In most cases, electrodes are made of porous materials, partially accounting for the electrode impedance at high frequencies [11–13]. Furthermore, curled electrodes used for manufacturing purposes inevitably yield electrode inductances Ld1 and Ld2. Ro represents the ohmic resistance caused by electrode metals, electrolyte and battery terminals. The charge transfer resistance, Rct1 and Rct2, indicate the rate of charge delivery on the electrode surface, (i.e., the chemical reaction rate and activation energy on electrodes dominated by materials). The double-layer capacitances, Cd1 and Cd2, refer to the capacitance caused by the valence charges on the electrode surface immersed in electrolyte and ions with opposite charge attached to surface. Double-layer capacitances exist across the electrode-electrolyte interfaces, and vary with temperature, ion concentration and electrode roughness. The Warburg impedance Zw1 and Zw2 denotes the reactance caused by ion diffusion, when reactant approaches or combustion products escapes from electrode surface [14–16]. Finally, a battery is modeled as an ideal voltage source Eb in series with the above-stated AC impedance [17–19].
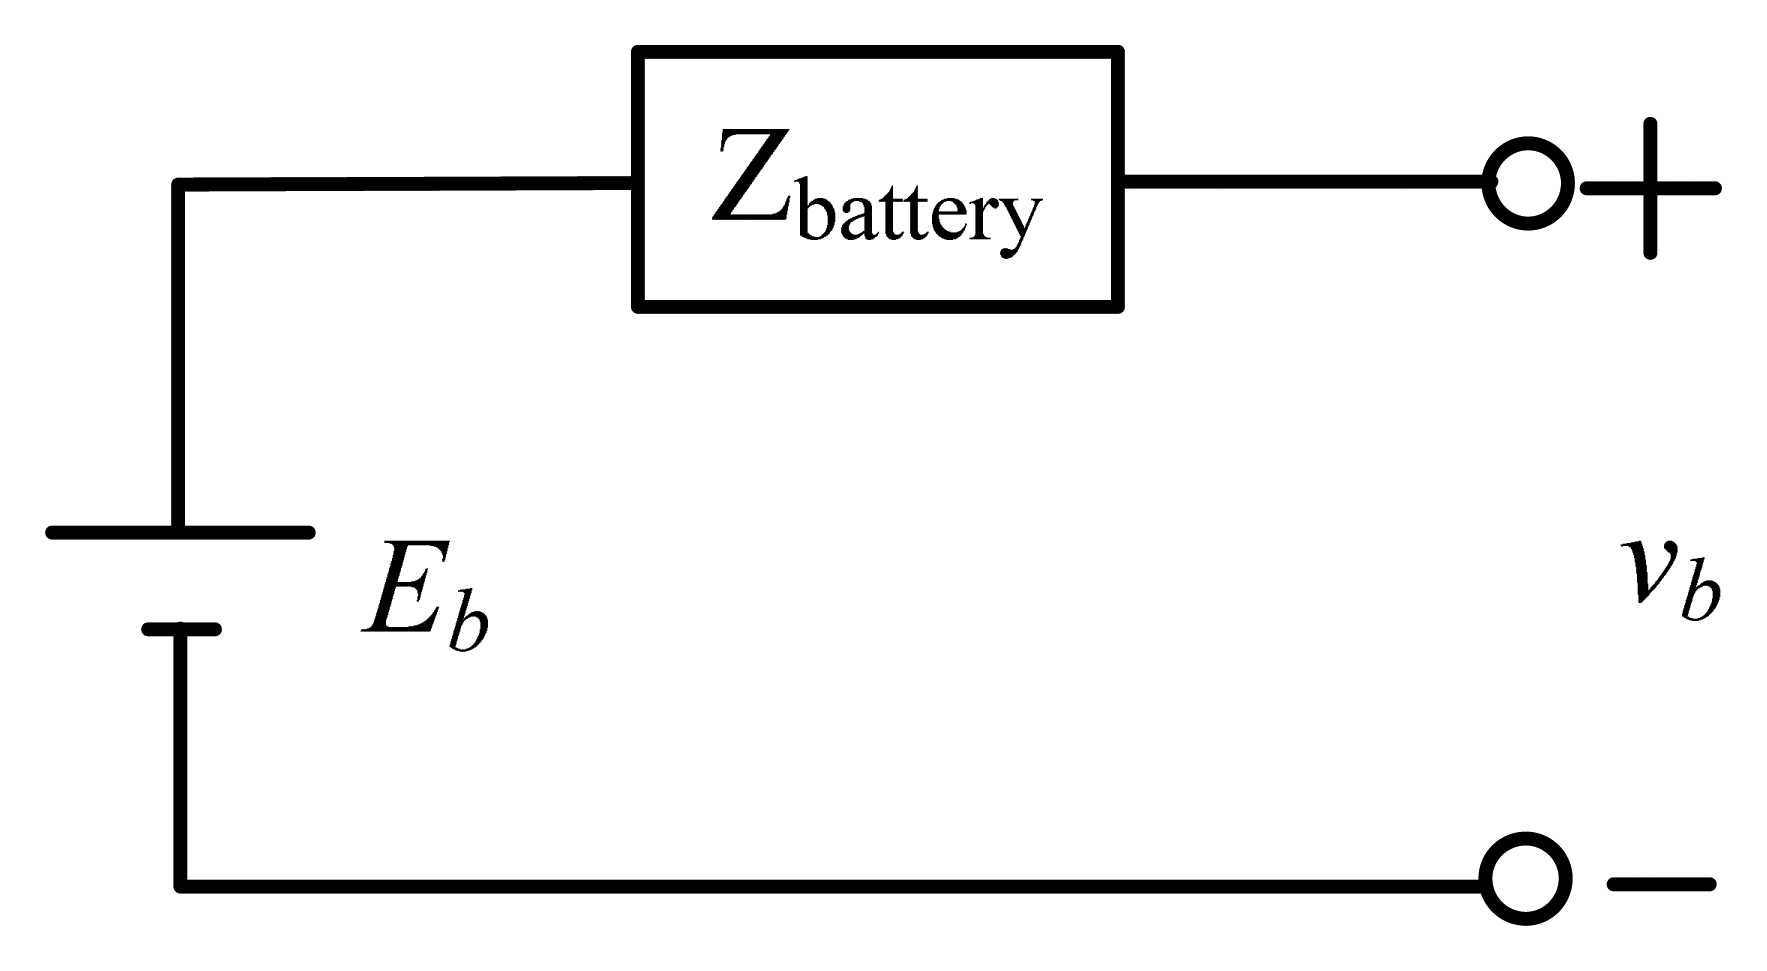
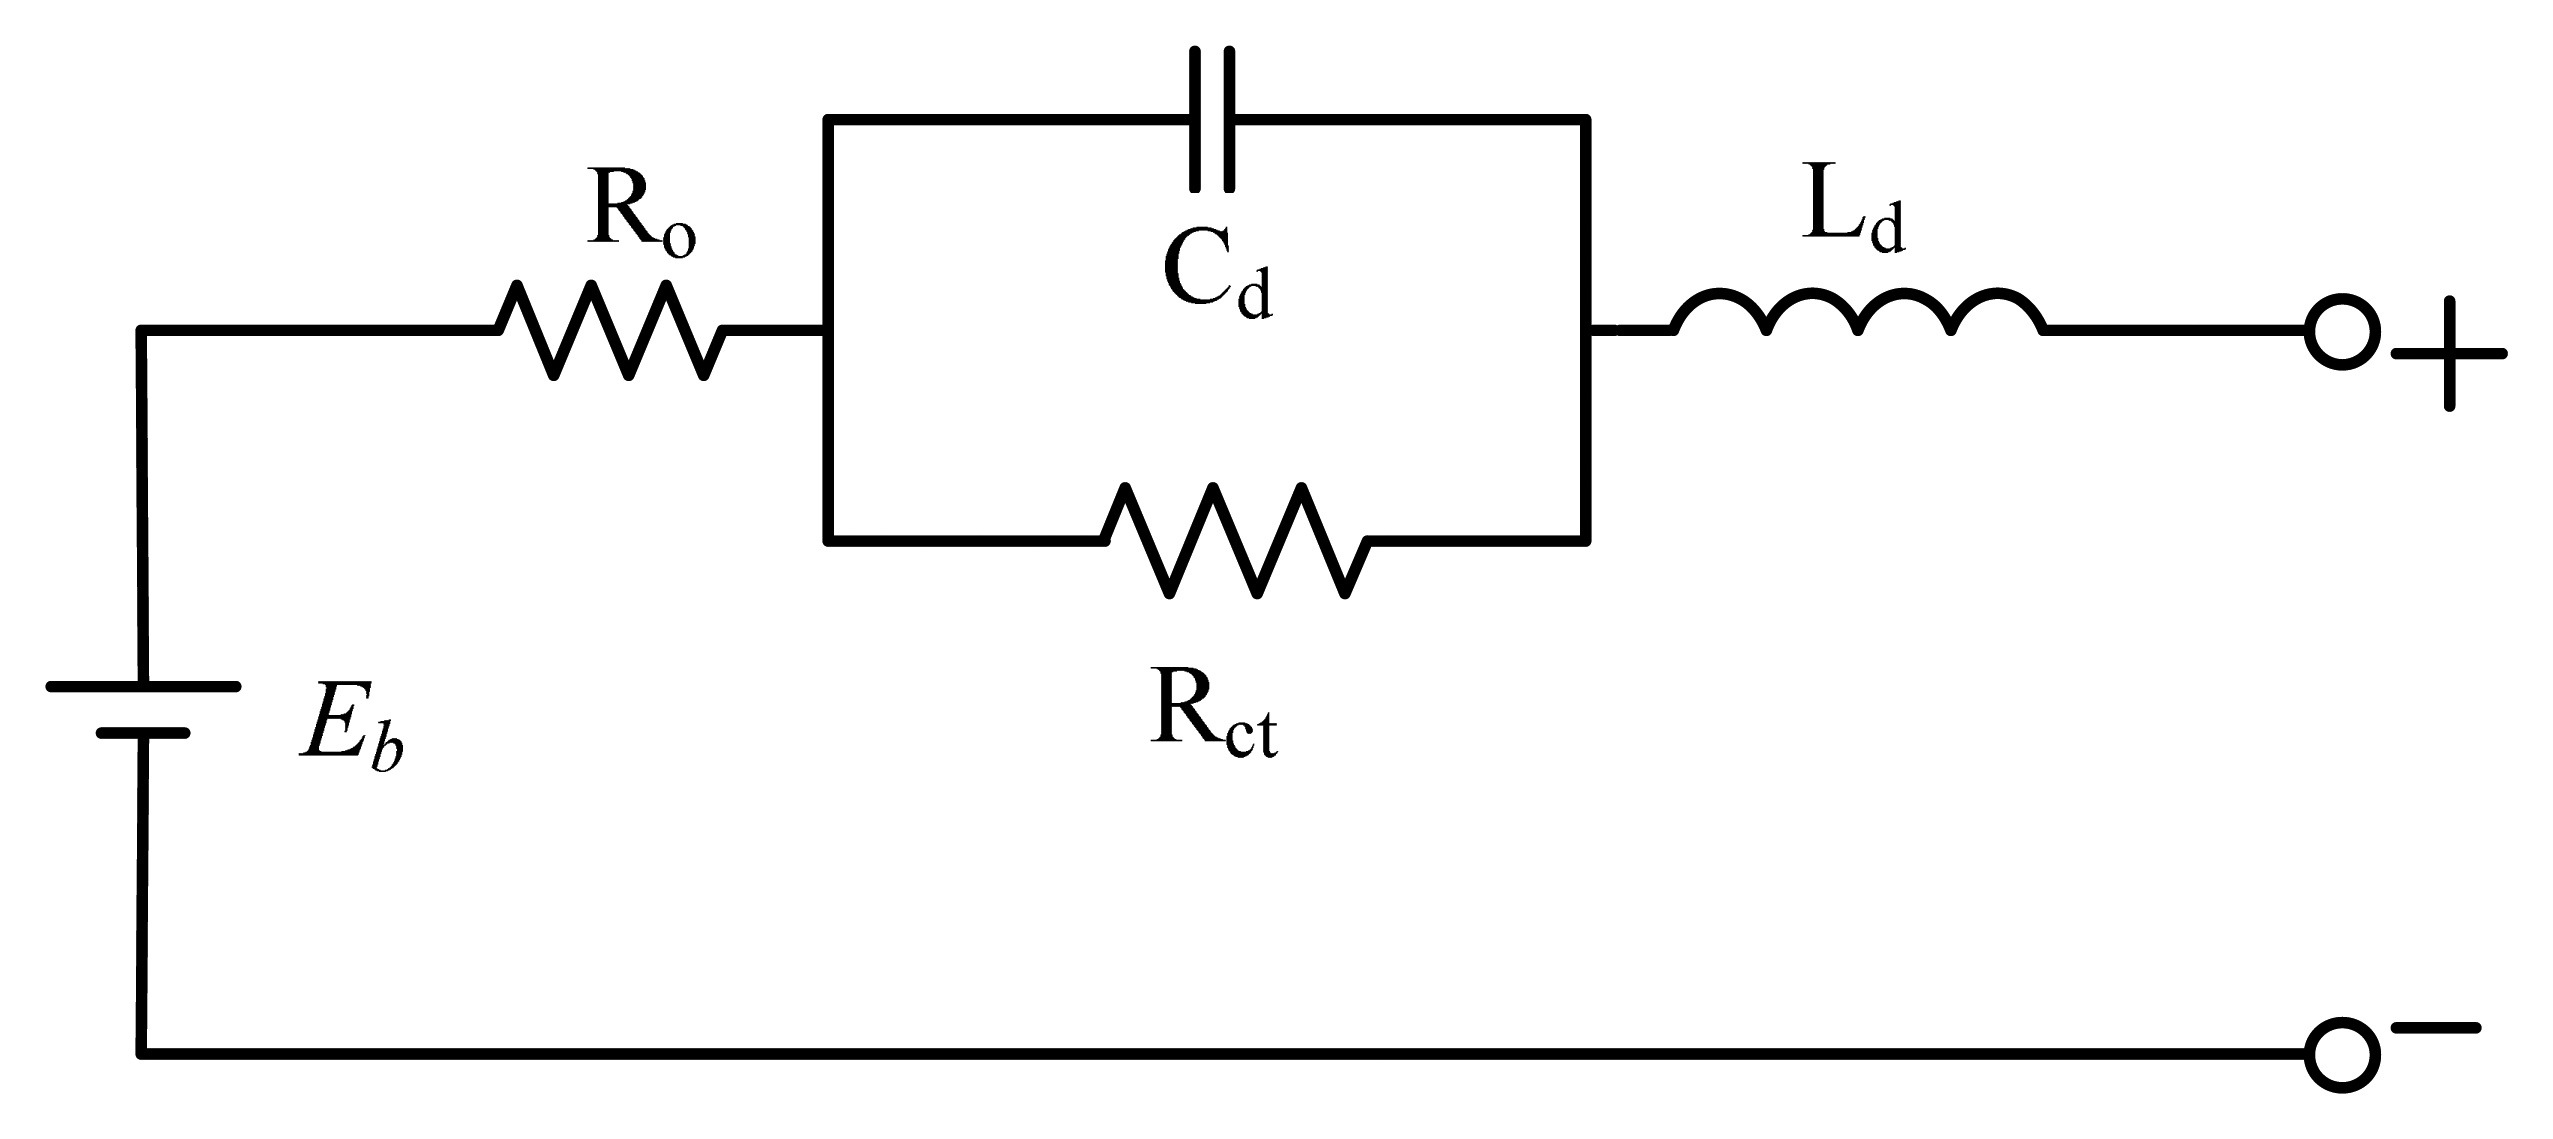
A simplified model of the complete one in Figure 1 is illustrated in Figure 2. Accordingly, a battery is modeled as a cascade of a charge transfer resistance Rct and a Warburg impedance Zw, connected in parallel with a double-layer capacitance Cd, then connected in series with an ohmic resistance Ro, an electrode inductance Ld and an ideal voltage source Eb [20].
The Warburg coefficient is expressed as:
The Warburg impedance Zw is found to demonstrate very little influence on the overall equivalent impedance at high frequencies. The battery can be divided into three frequency parts: a high frequency region at frequencies >1 kHz; an intermediate frequency region frequency between 10 Hz and 1 kHz; a low frequency region at frequency <1 Hz [21]. Since the battery discussed in this work is operated at frequencies beyond 1 Hz, Zw is hence not taken into account in the simplified model, as illustrated in Figure 3. The simplified model is employed herein for subsequent simulations, as illustrated in Figure 4.
A battery is modeled as an ideal voltage source connected in series with an equivalent impedance, represented as:
3. Experimental Analysis
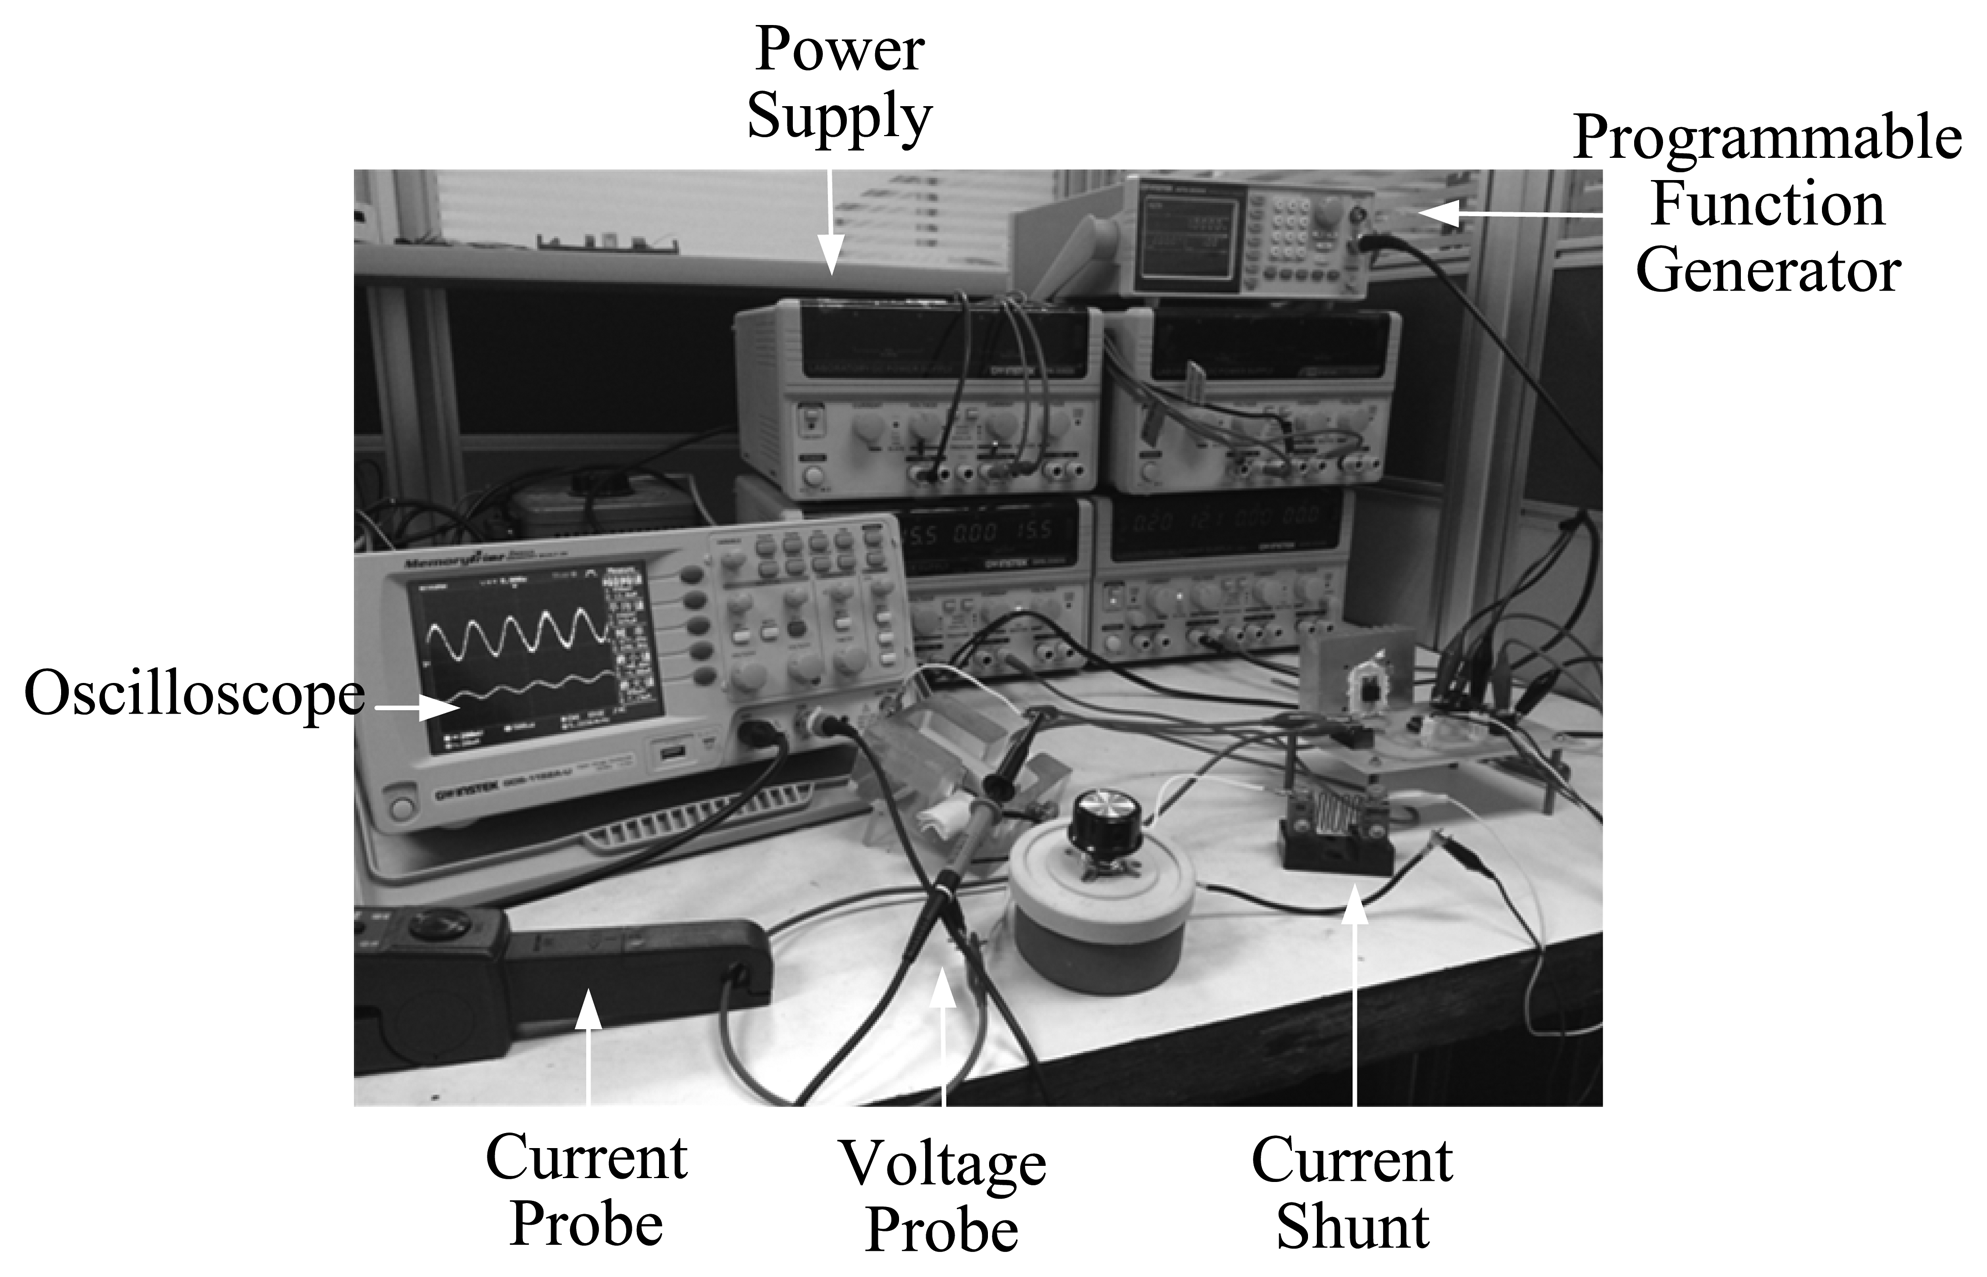
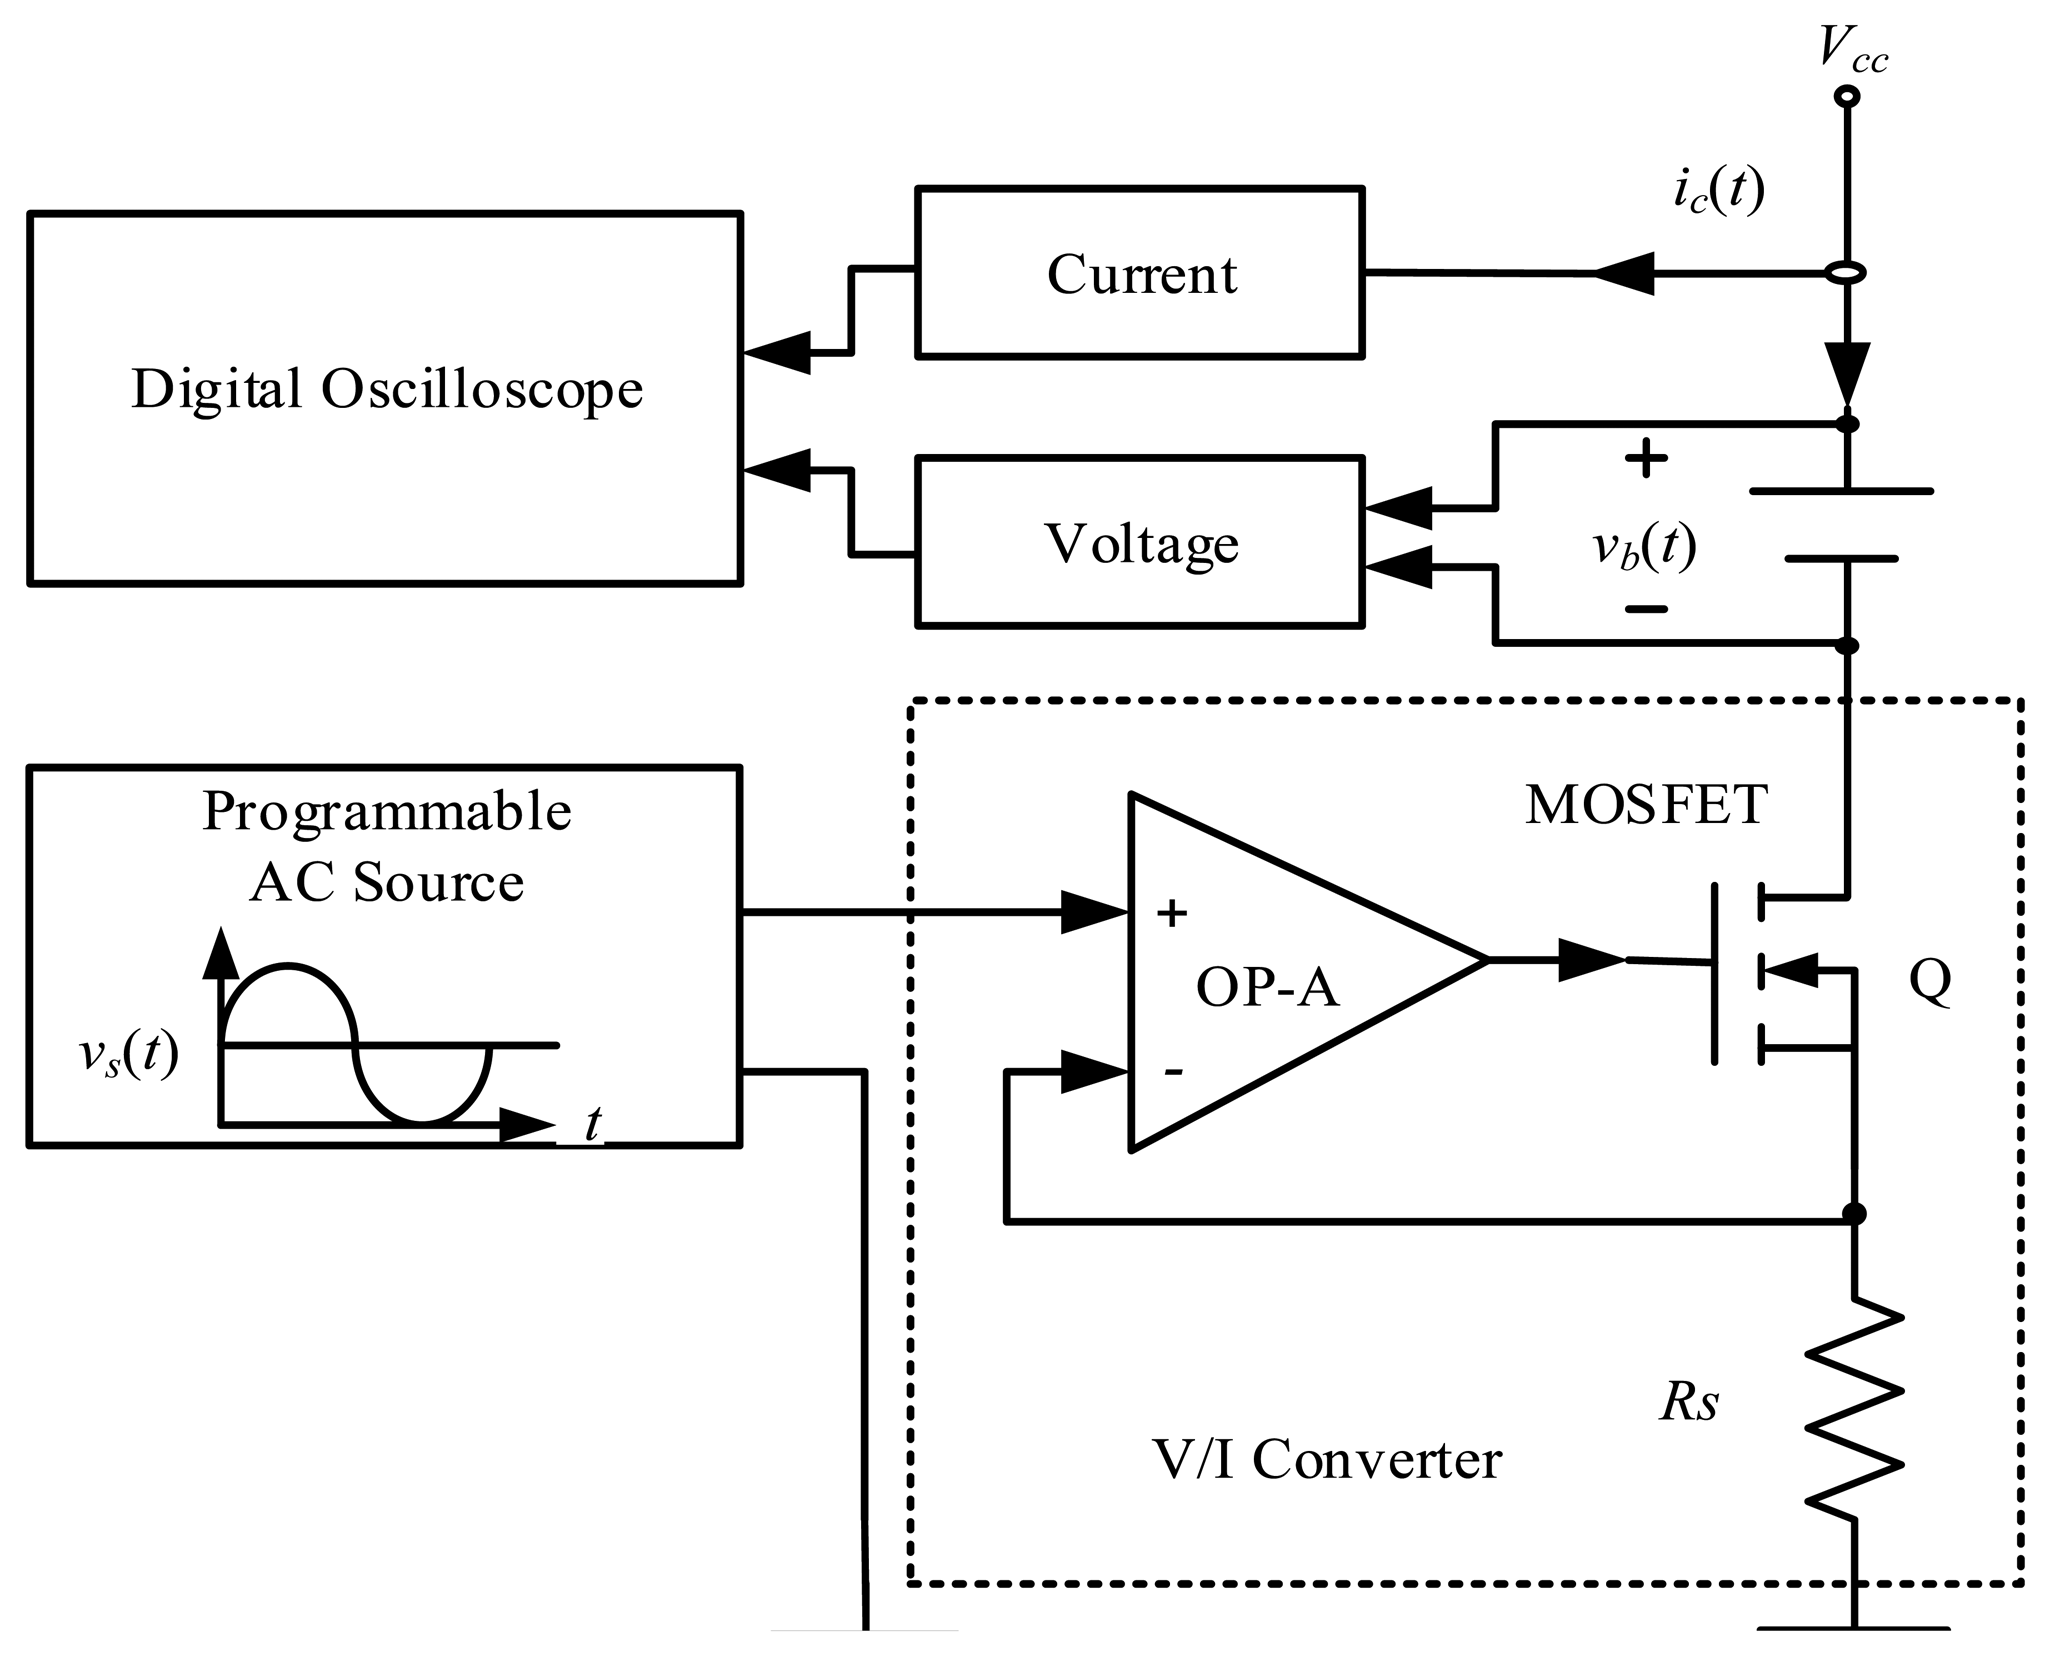
Figure 5 shows the battery SOC test platform. It mainly involves a digital oscilloscope, a current amplifier, a current shunt, a voltage probe(s), a programmable AC source, and a voltage/current converter.
The programmable AC source consists of a signal produced as a unit to specify the charging frequency, while the voltage/current converter is composed of an MOSFET and an operational amplifier (OPA).
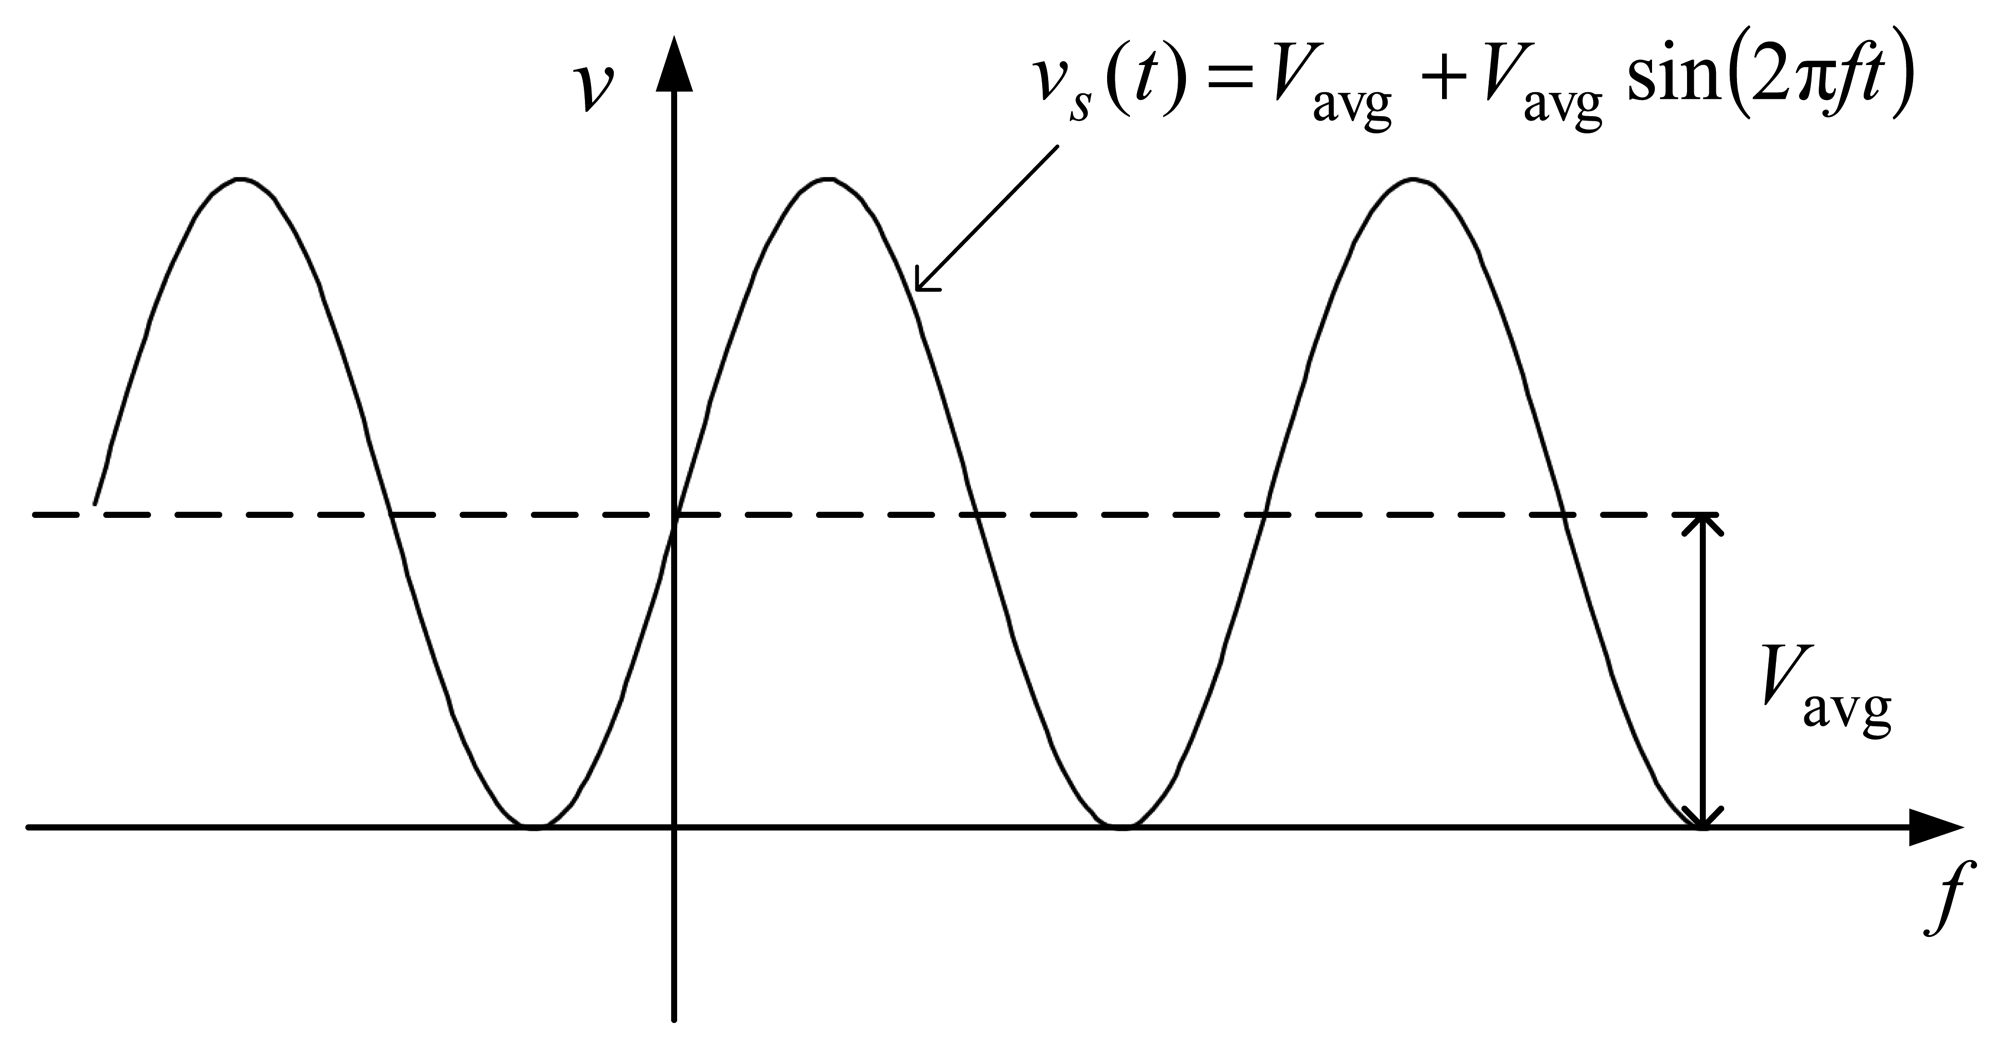
The test platform works as follows: the programmable AC source produces a sinusoidal ripple voltage vs(t) as follows:
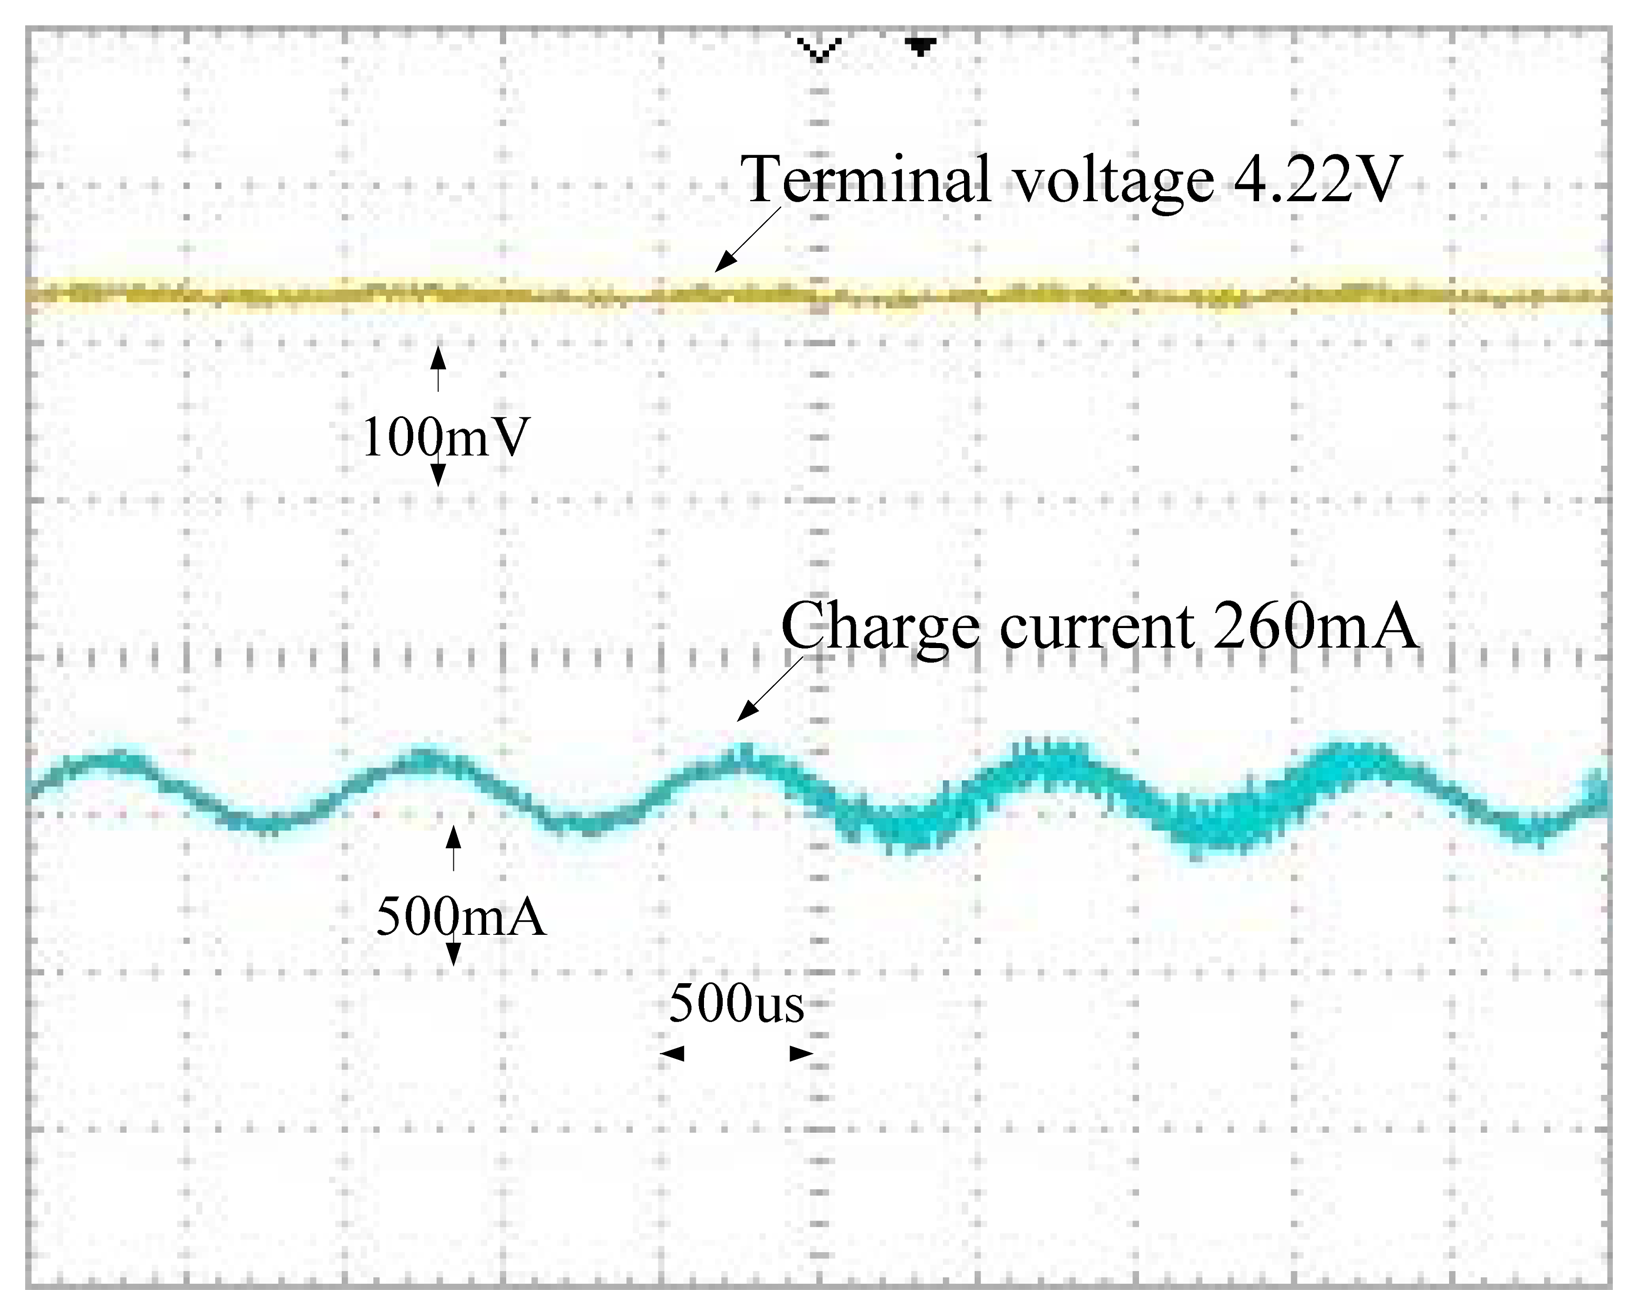
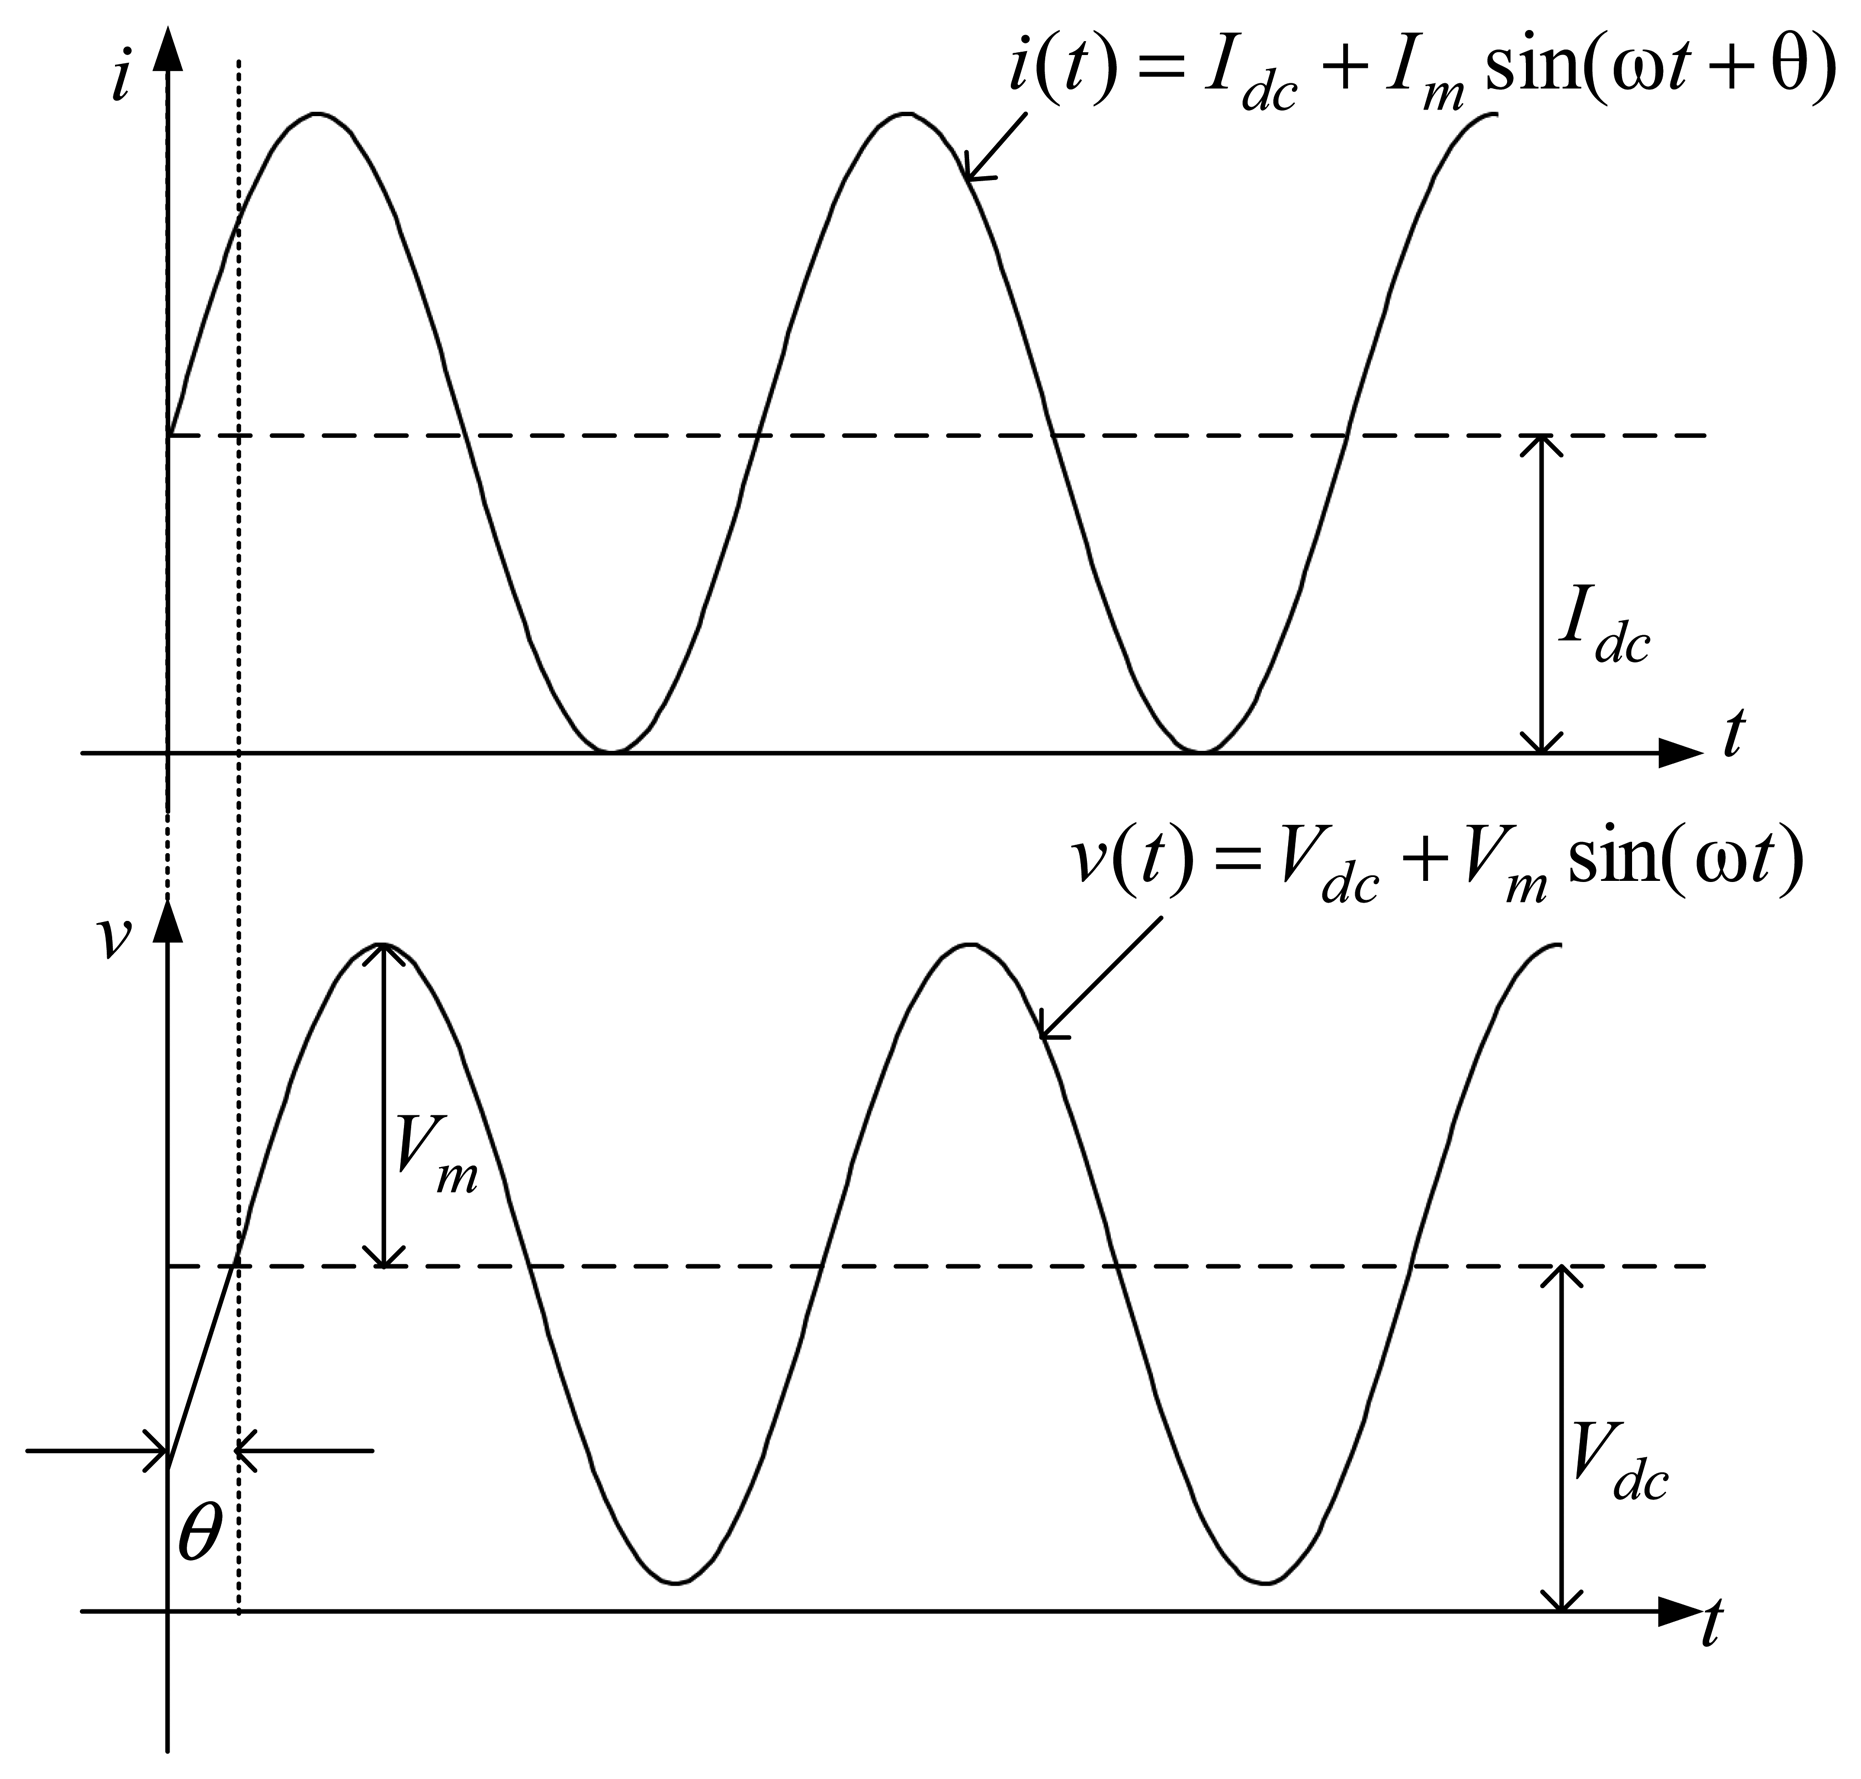
Figure 7 shows the charge current and battery voltage waveforms containing DC components, a low AC current signal, as expressed in Equation (8) and then applied to the battery, sets off an output voltage, as represented in Equation (9):
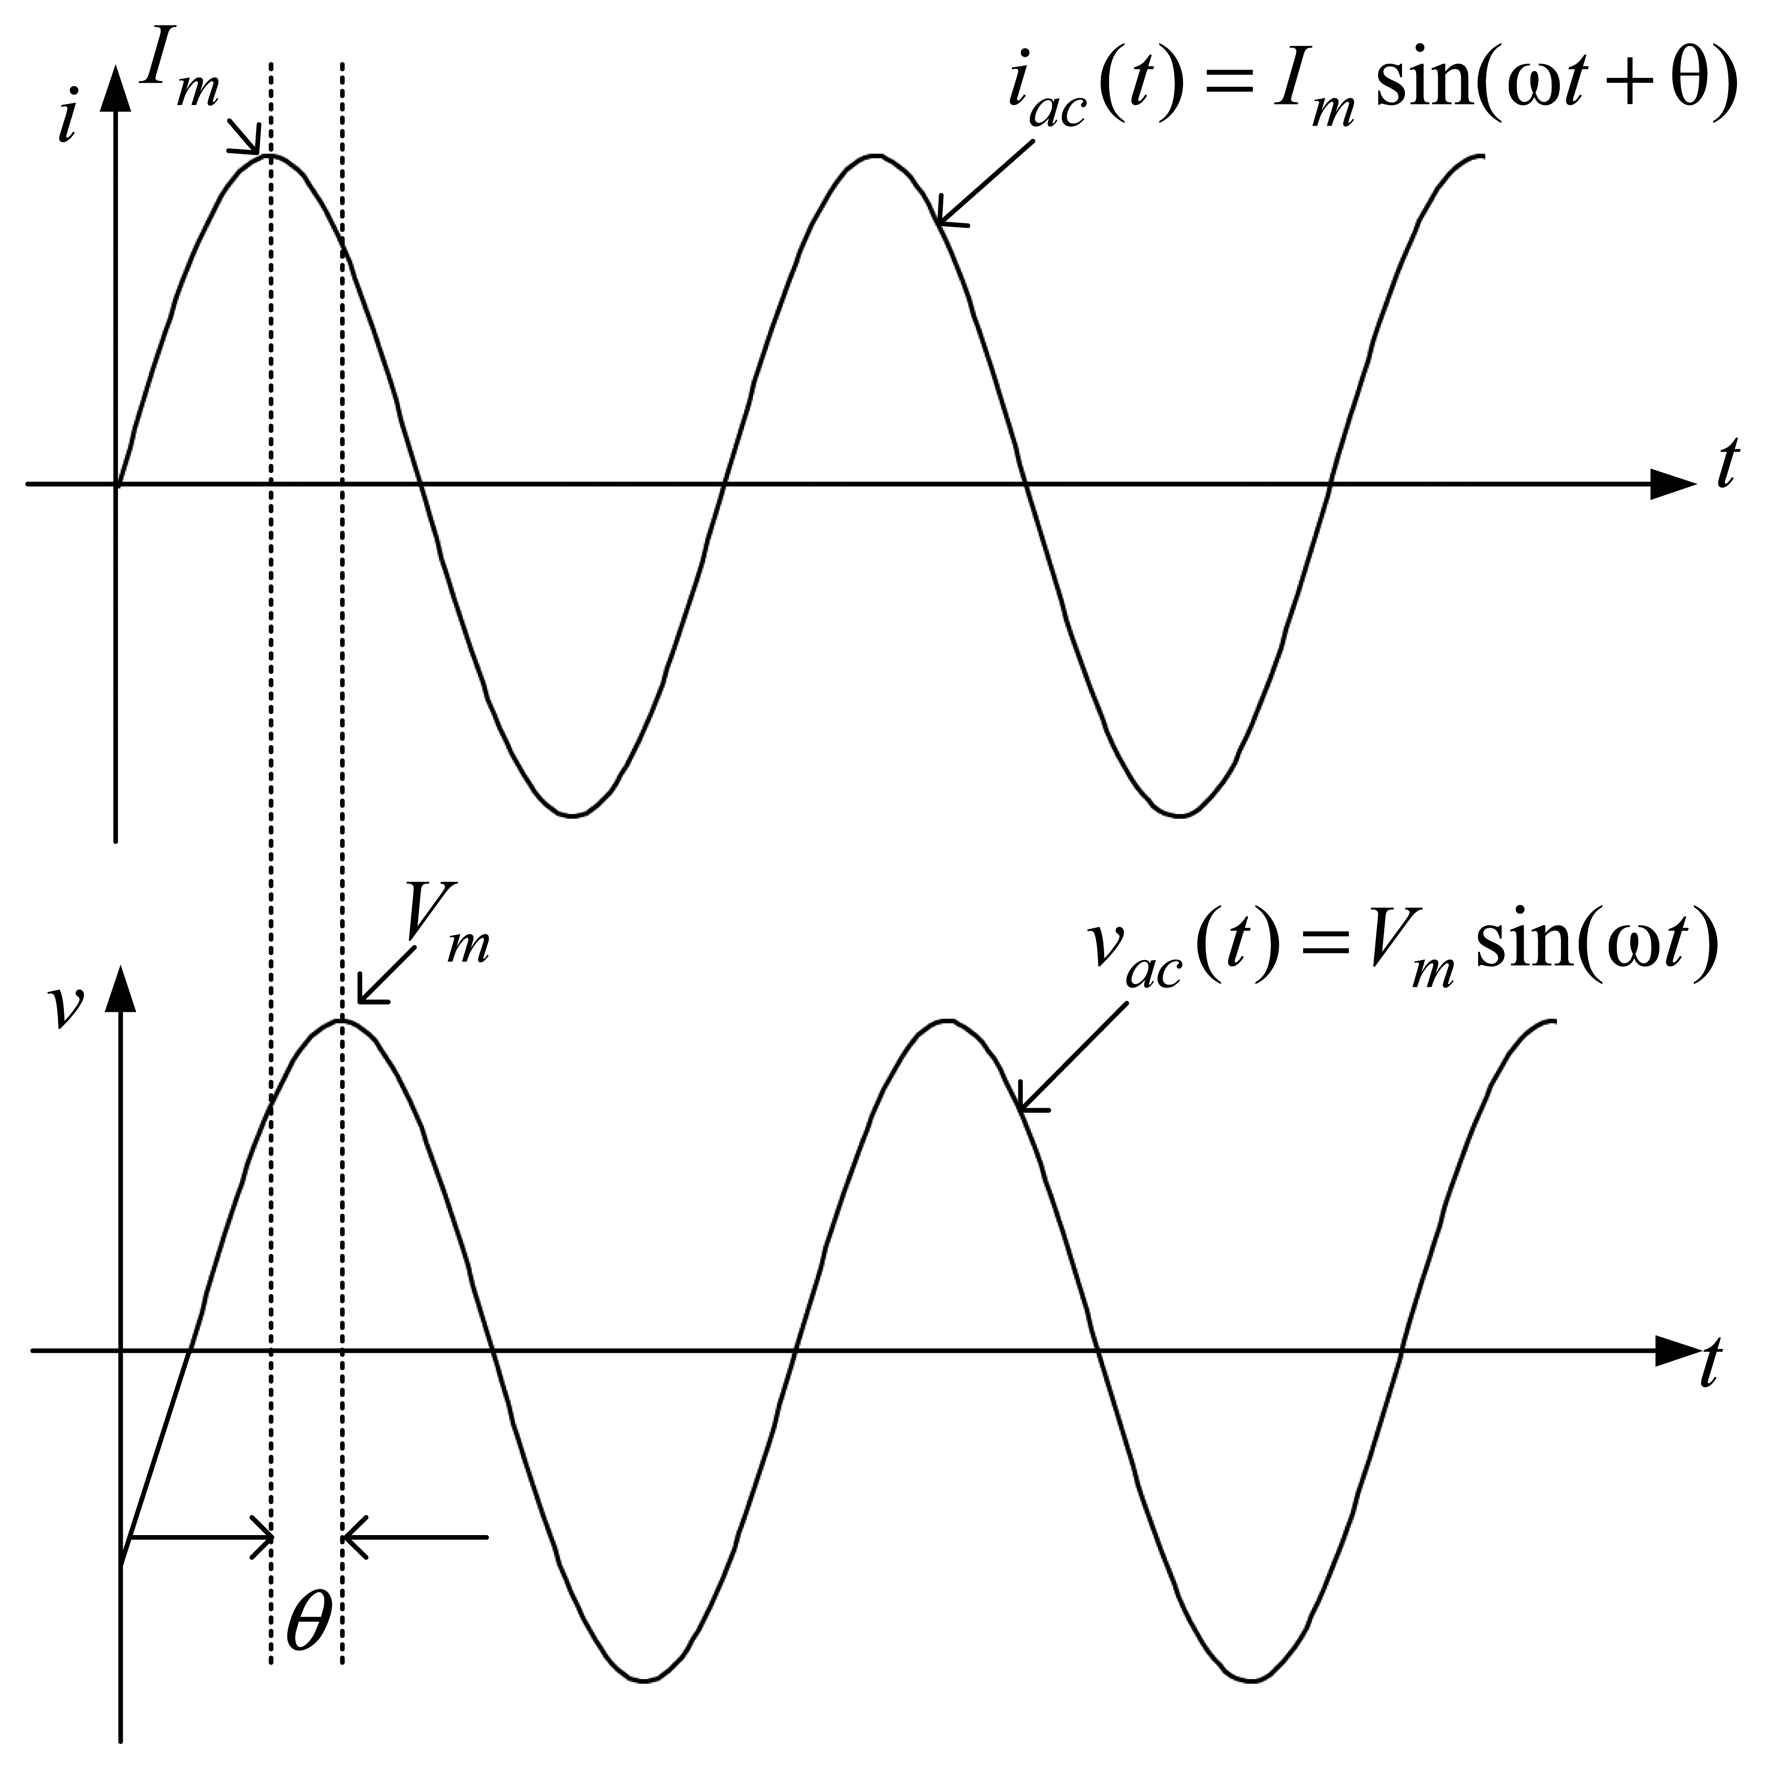
The filtered waveforms, iac(t) and vac(t), are illustrated in Figure 8, respectively expressed as:
According to Equations (10) and (11), the ratio of vac(t) to iac(t) gives the AC impedance, represented as:
Expressing Equation (12) in complex form, the battery impedance can be expressed as:
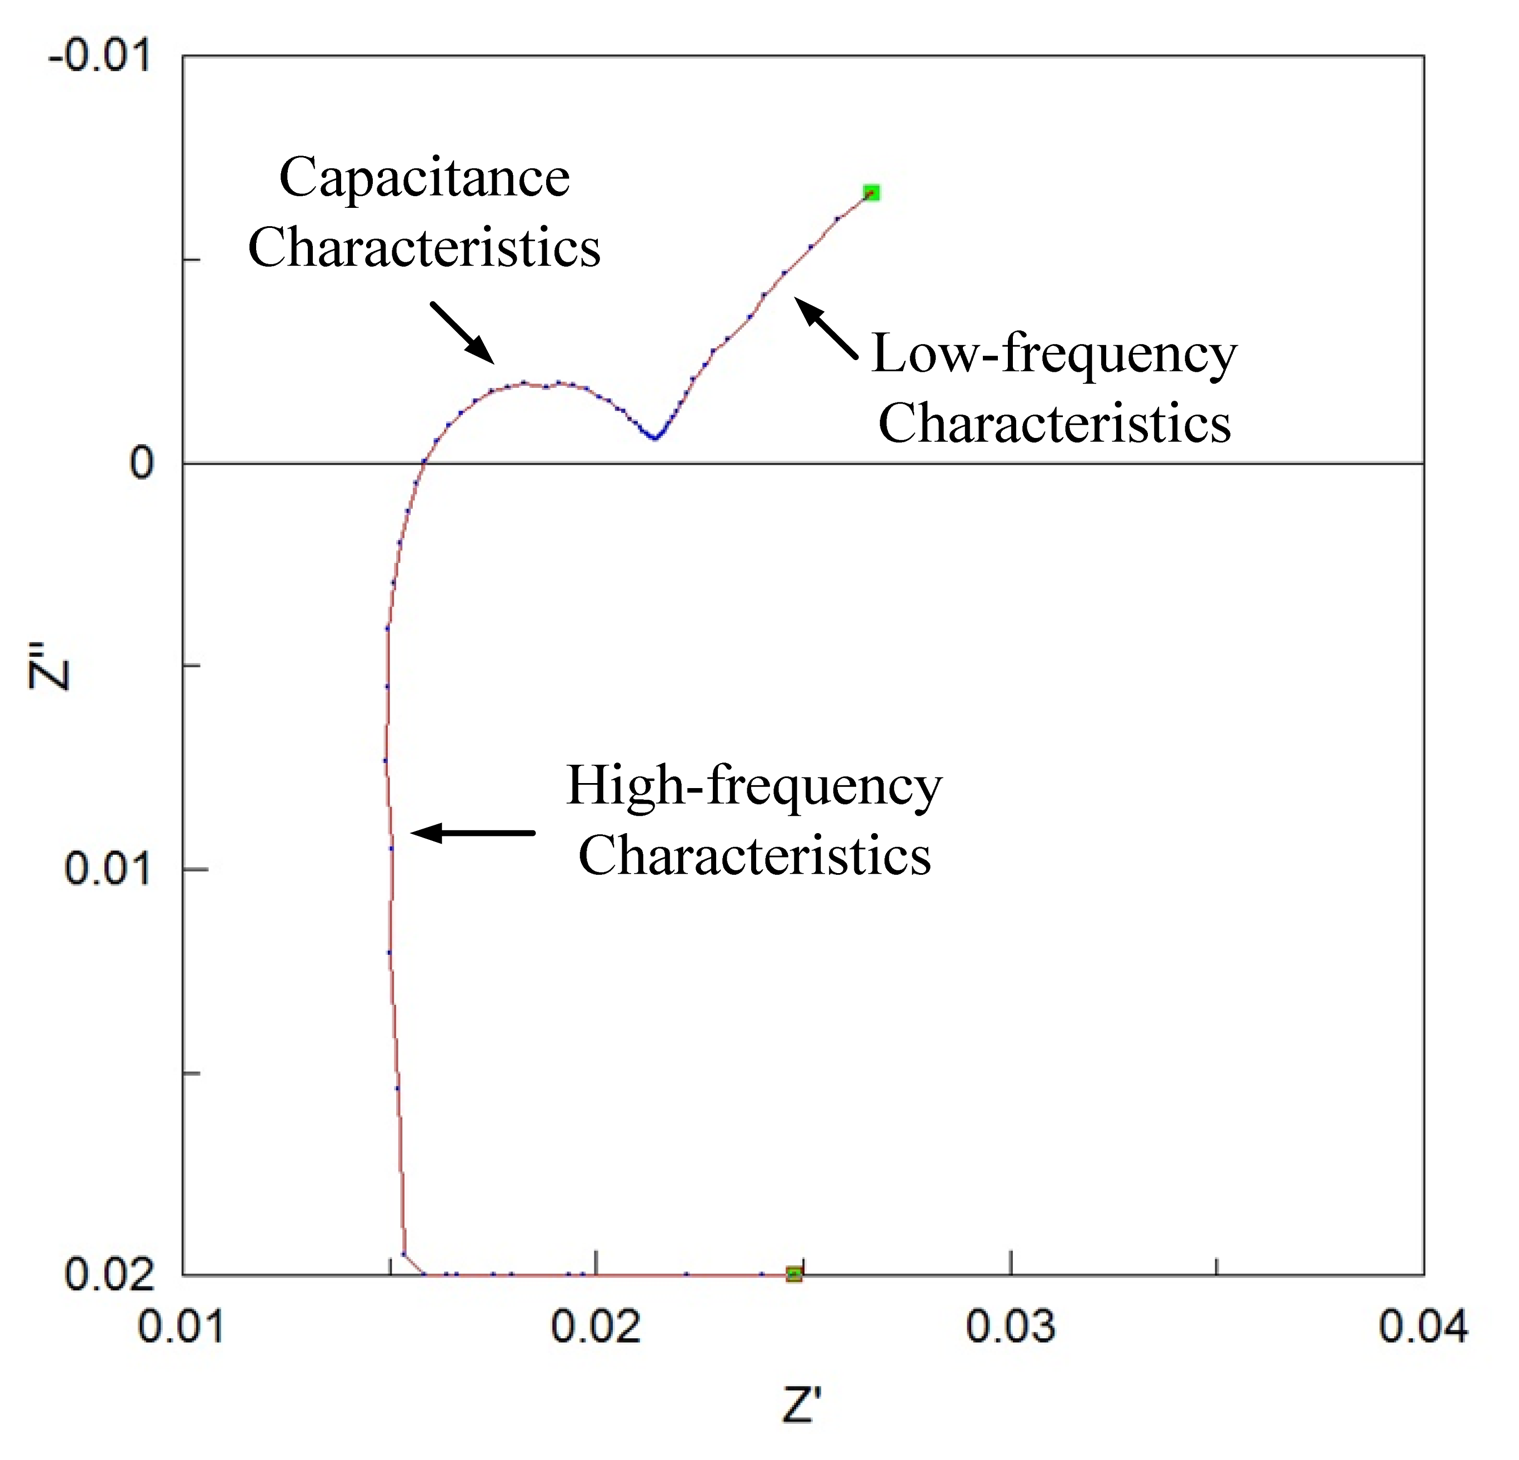
The AC impedance of an 18650 battery can be expressed on the complex plane in several forms. Figure 9 exhibits the Nyquist plot of a battery. A review of Figure 9 reveals that the battery internals are resistive, inductive and capacitive components, and the capacitive components of the Nyquist plot of a battery is presented in a semicircle case [25–27].
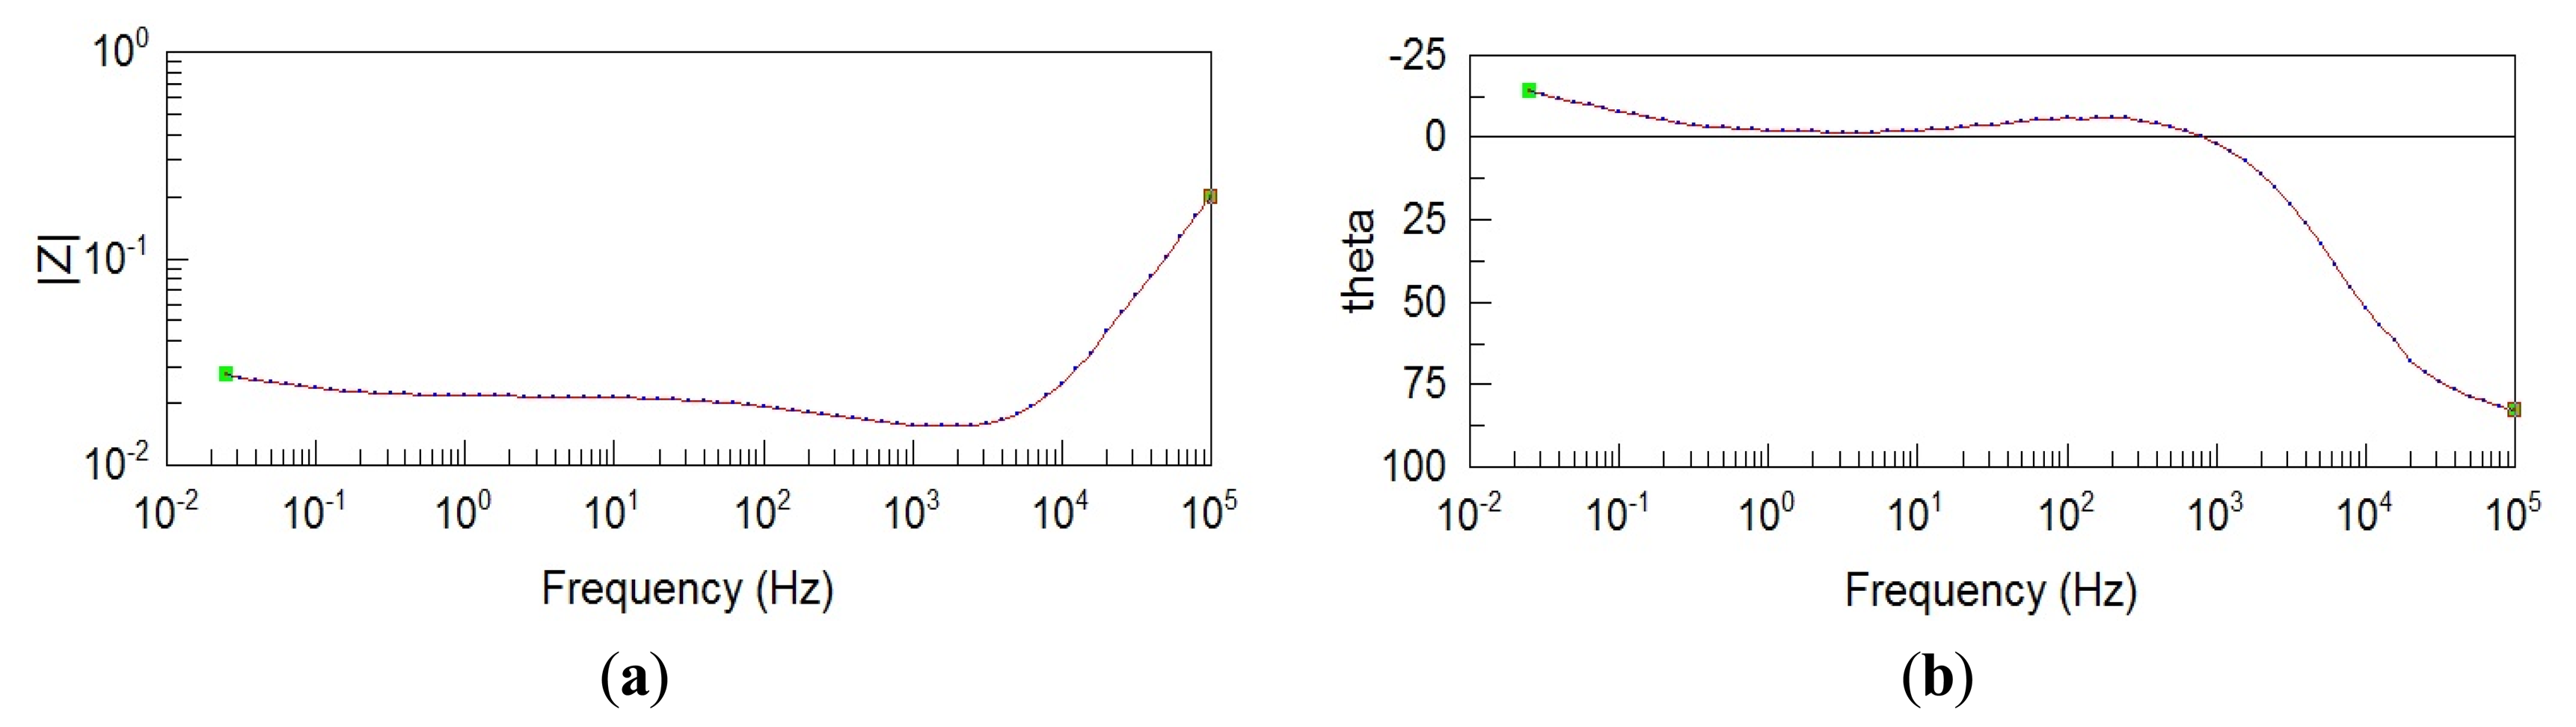
Figure 10a,b shows the AC impedance spectrum of test battery measured by the Solartron 1280 B AC impedance Bode plot analyzer.
4. Experimental Process
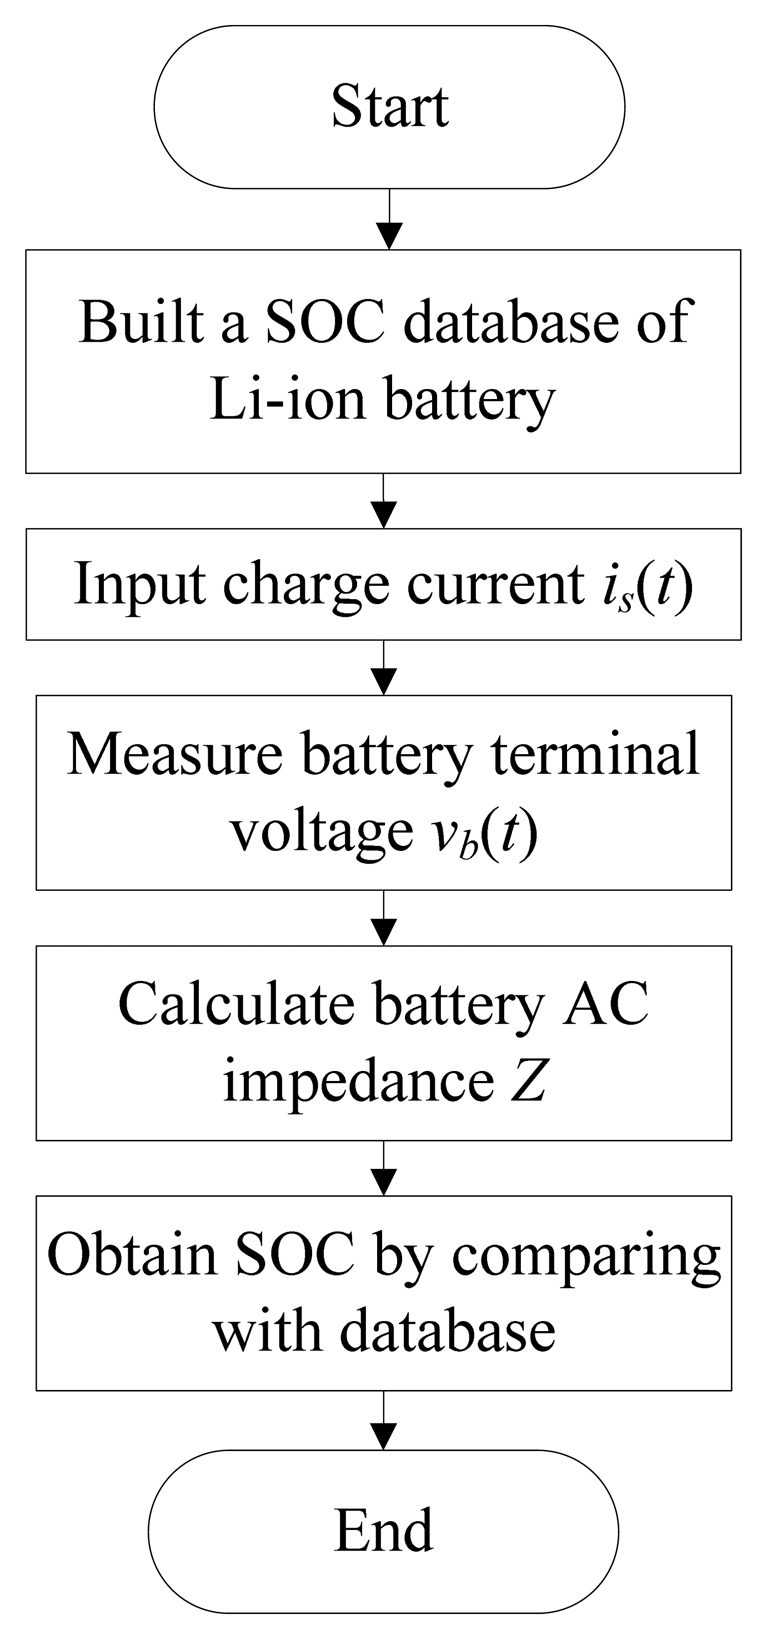
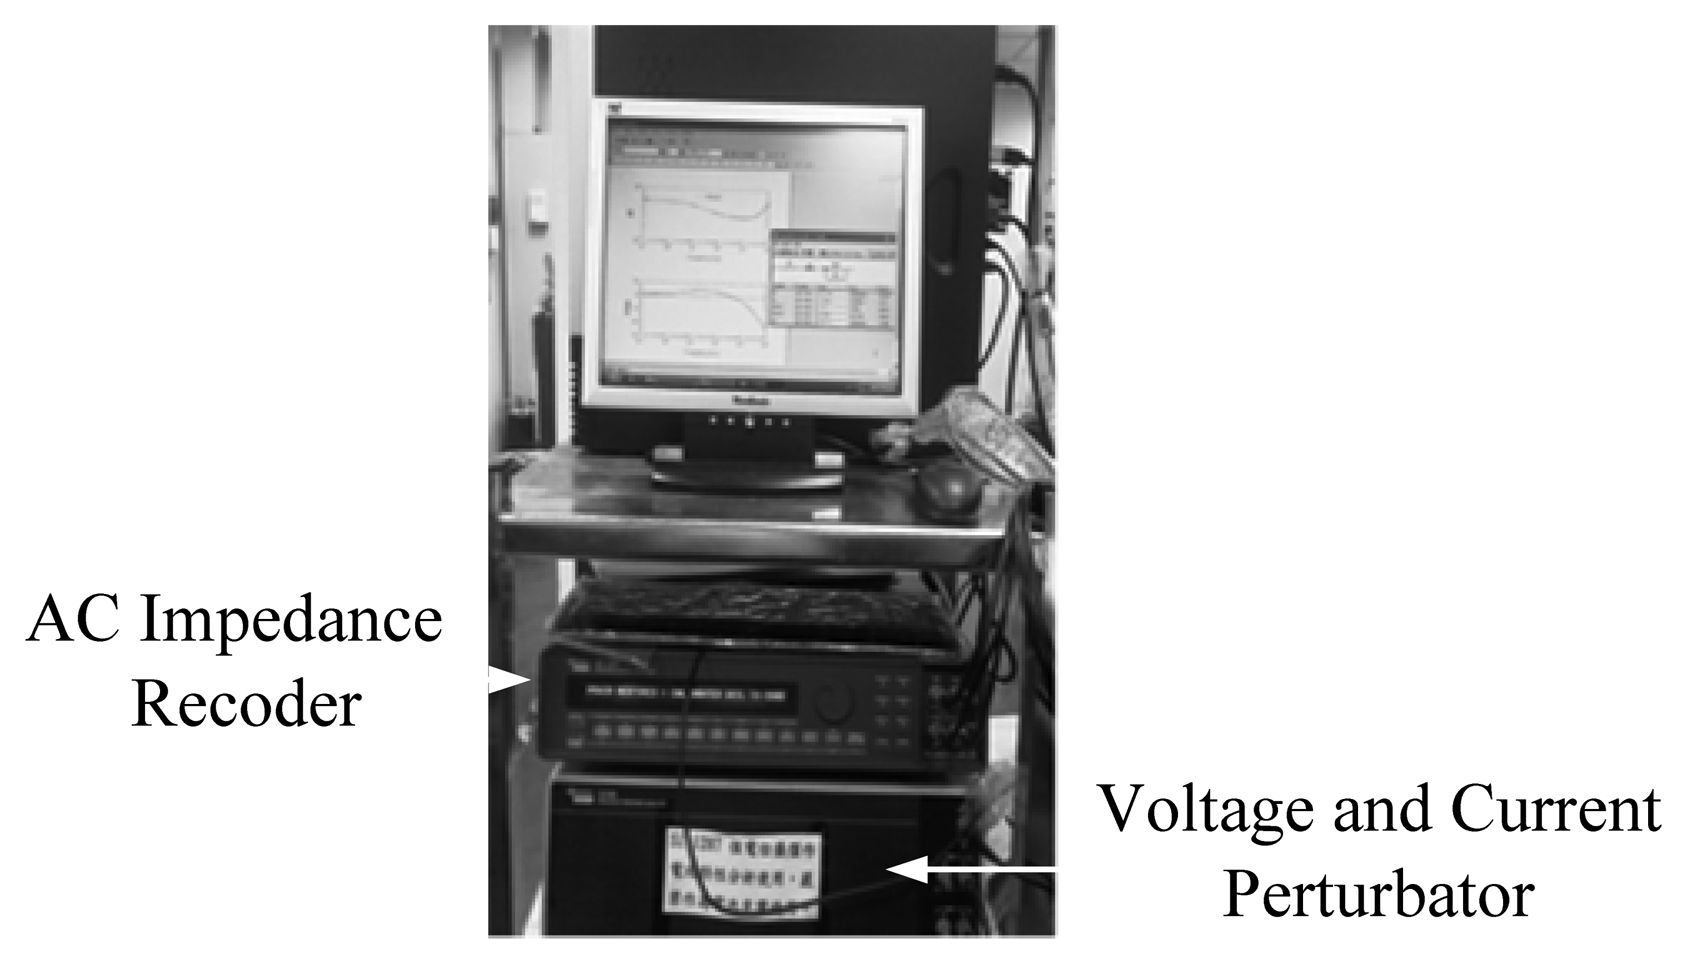
Figure 11 shows the flow chart of the presented SOC estimation approach for Li-ion battery proposed in this paper. As the first step, a database containing records of AC impedance versus SOC for a 18650 Li-ion battery is built using an AC impedance analyzer. Subsequently, the impedance Z, as stated in the preceding section and then measured in the presented test platform, is compared with the contents in the constructed database for the corresponding SOC value. Since the SOC value is fully determined by the measured AC impedance in this work, there is a definite need to perform high accuracy measurements. Tabulated in Table 1 are the measurement facilities employed, and presented in Figure 12 is a photo of the experimental setup. Besides, exhibited in Figure 13 is a photo of the AC impedance analyzer employed for a database construction, a device comprising an impedance recorder and a voltage and current perturbator.
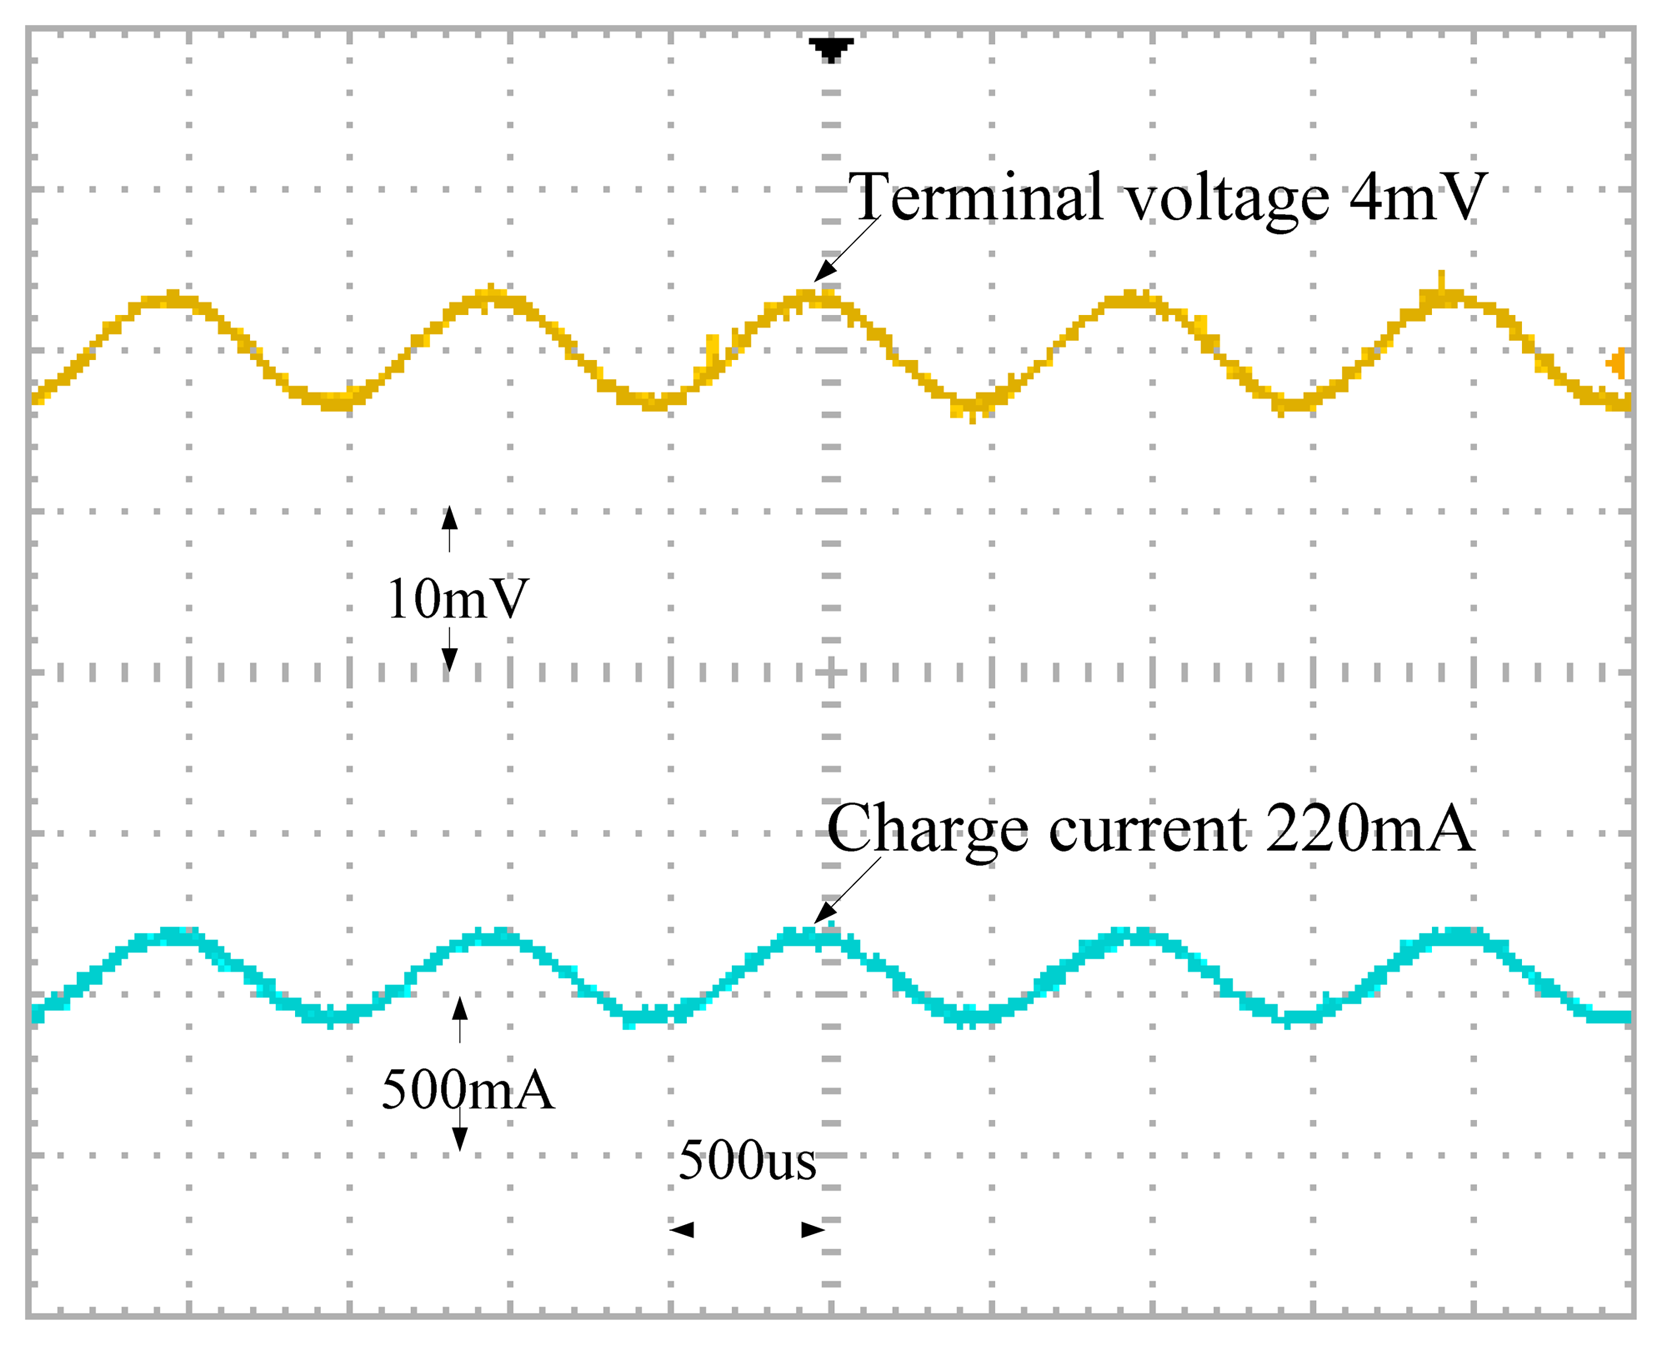
Figure 14 shows an illustration of the charge current and the battery terminal voltage waveforms in an AC impedance measurement. Enlargement of the waveforms in Figure 14 with DC components filtered indicates that both waveforms only contain AC components, as demonstrated in Figure 15.
The AC impedance measurement of an 18650 Li-ion battery can be made in real time using the charge current and the battery voltage waveforms, and the SOC is available instantly once the contents of a pre-built database are referenced.
5. Experiment Result
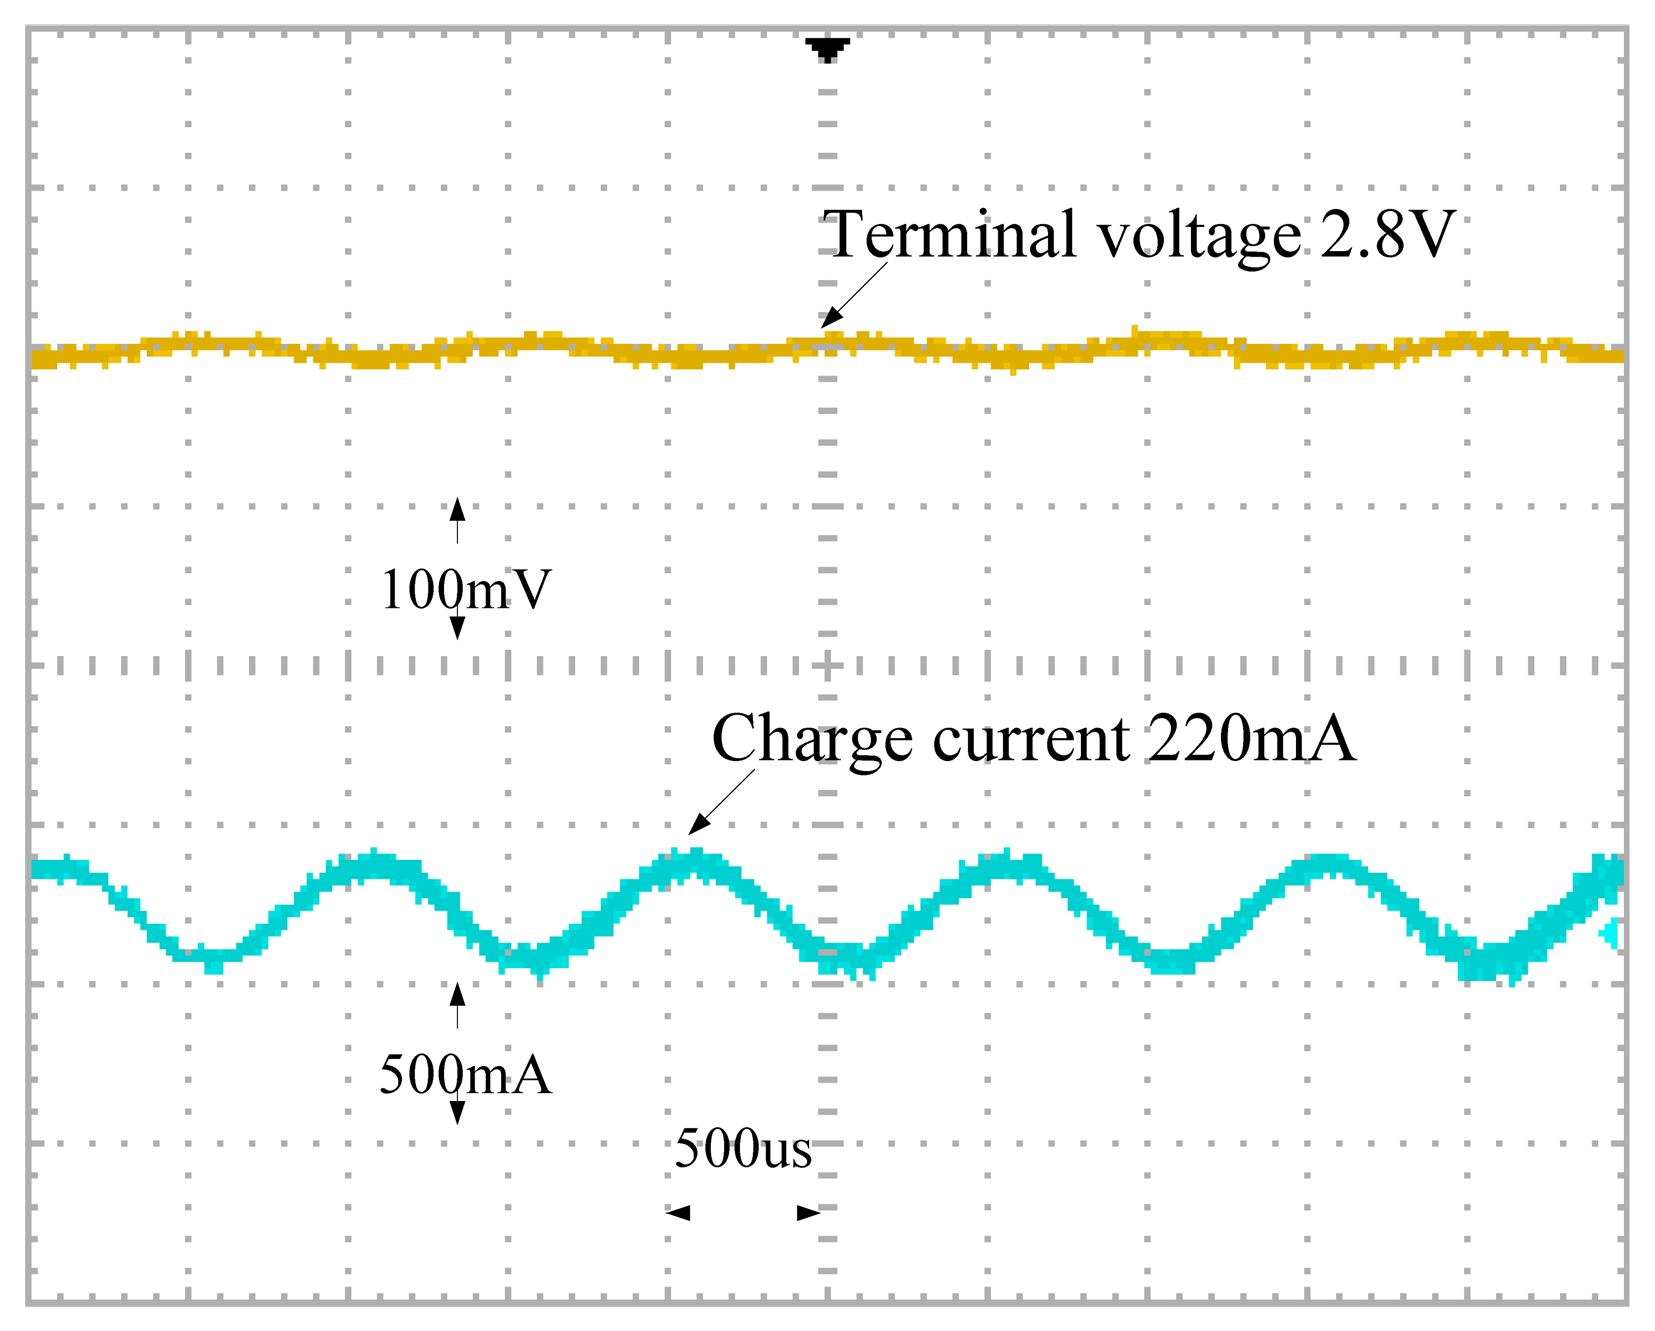
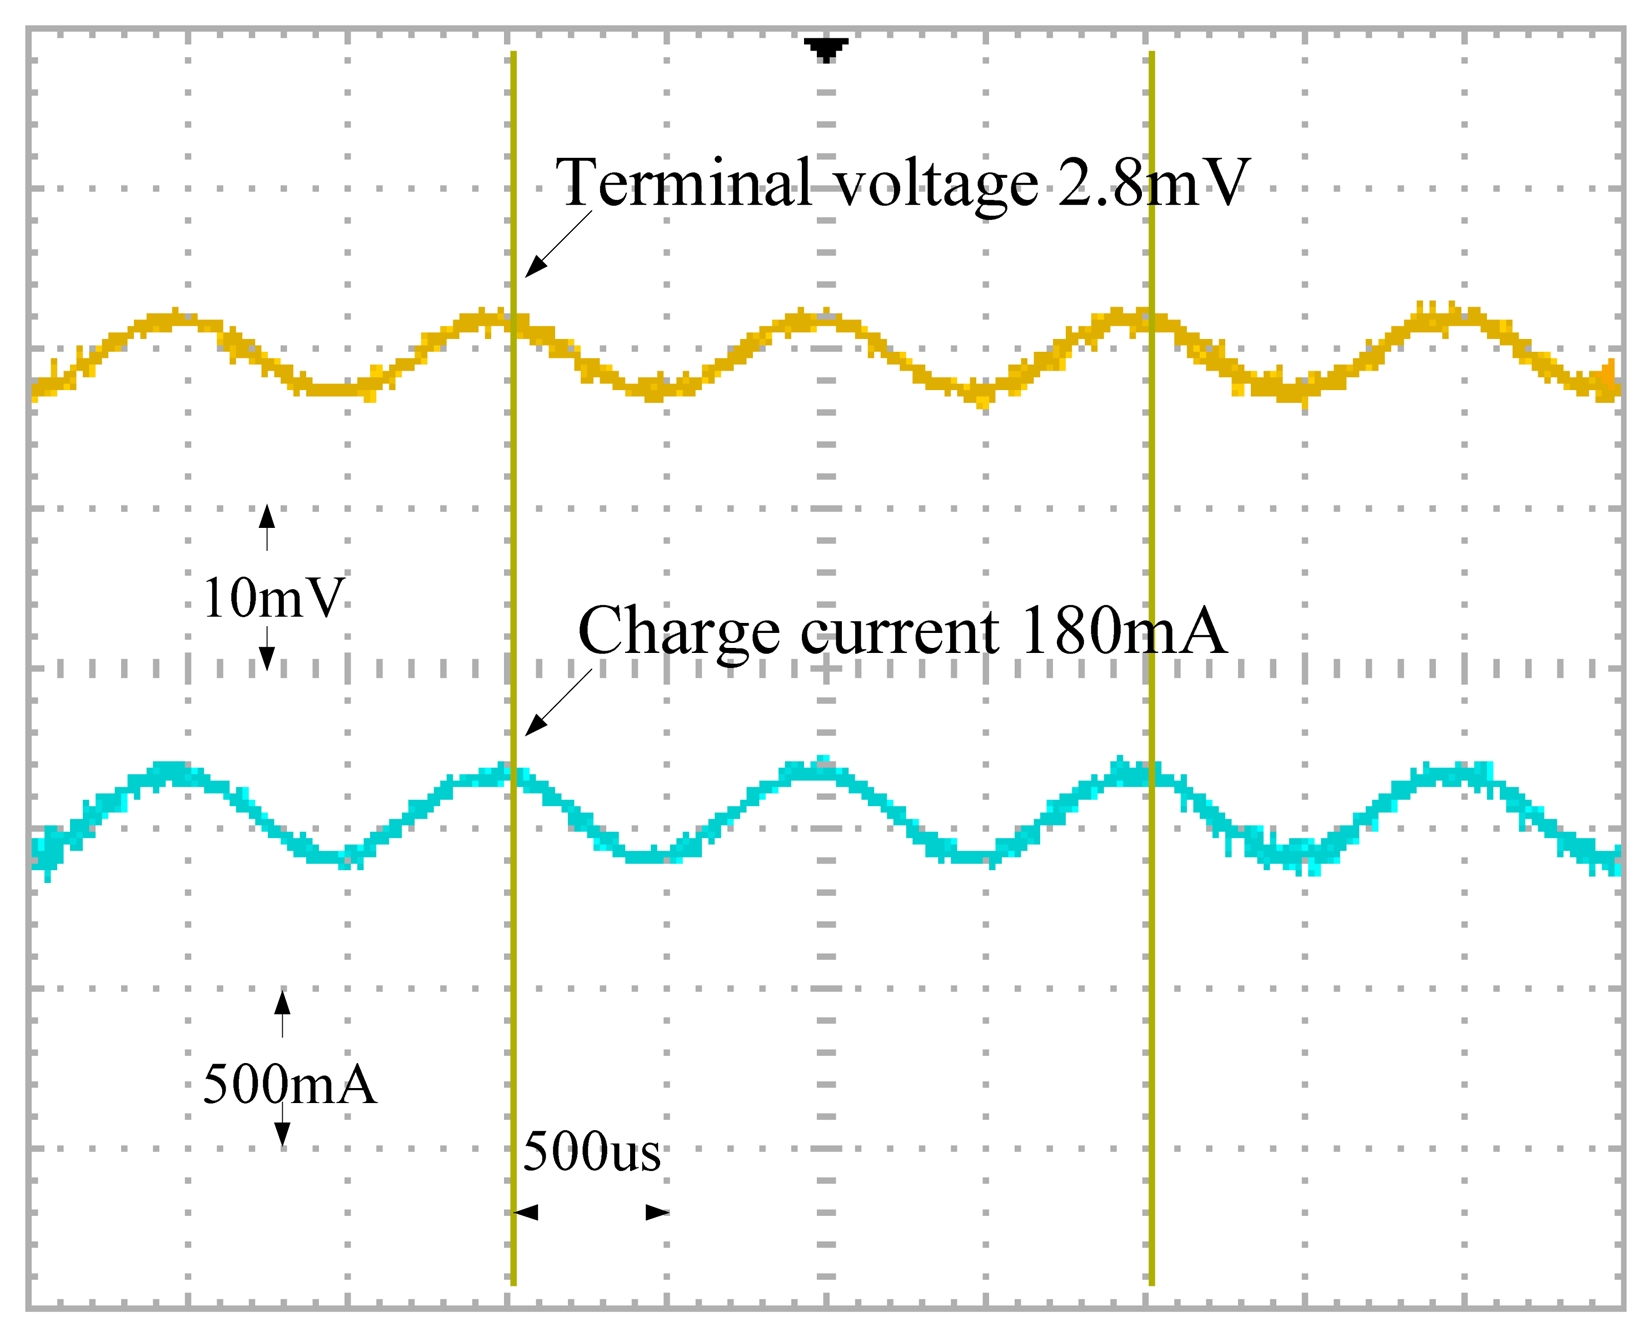
An IBR18650BC Li-ion battery is employed as a battery under test in this work. Cases with open circuit output voltage of 2.8 V, 3.7 V and 4.2 V are treated as the 0%, 50% and 100% SOC cases, respectively. Figures 16 and 17 show the unfiltered and filtered charge current and battery output voltage waveforms in the 0% SOC case, respectively.
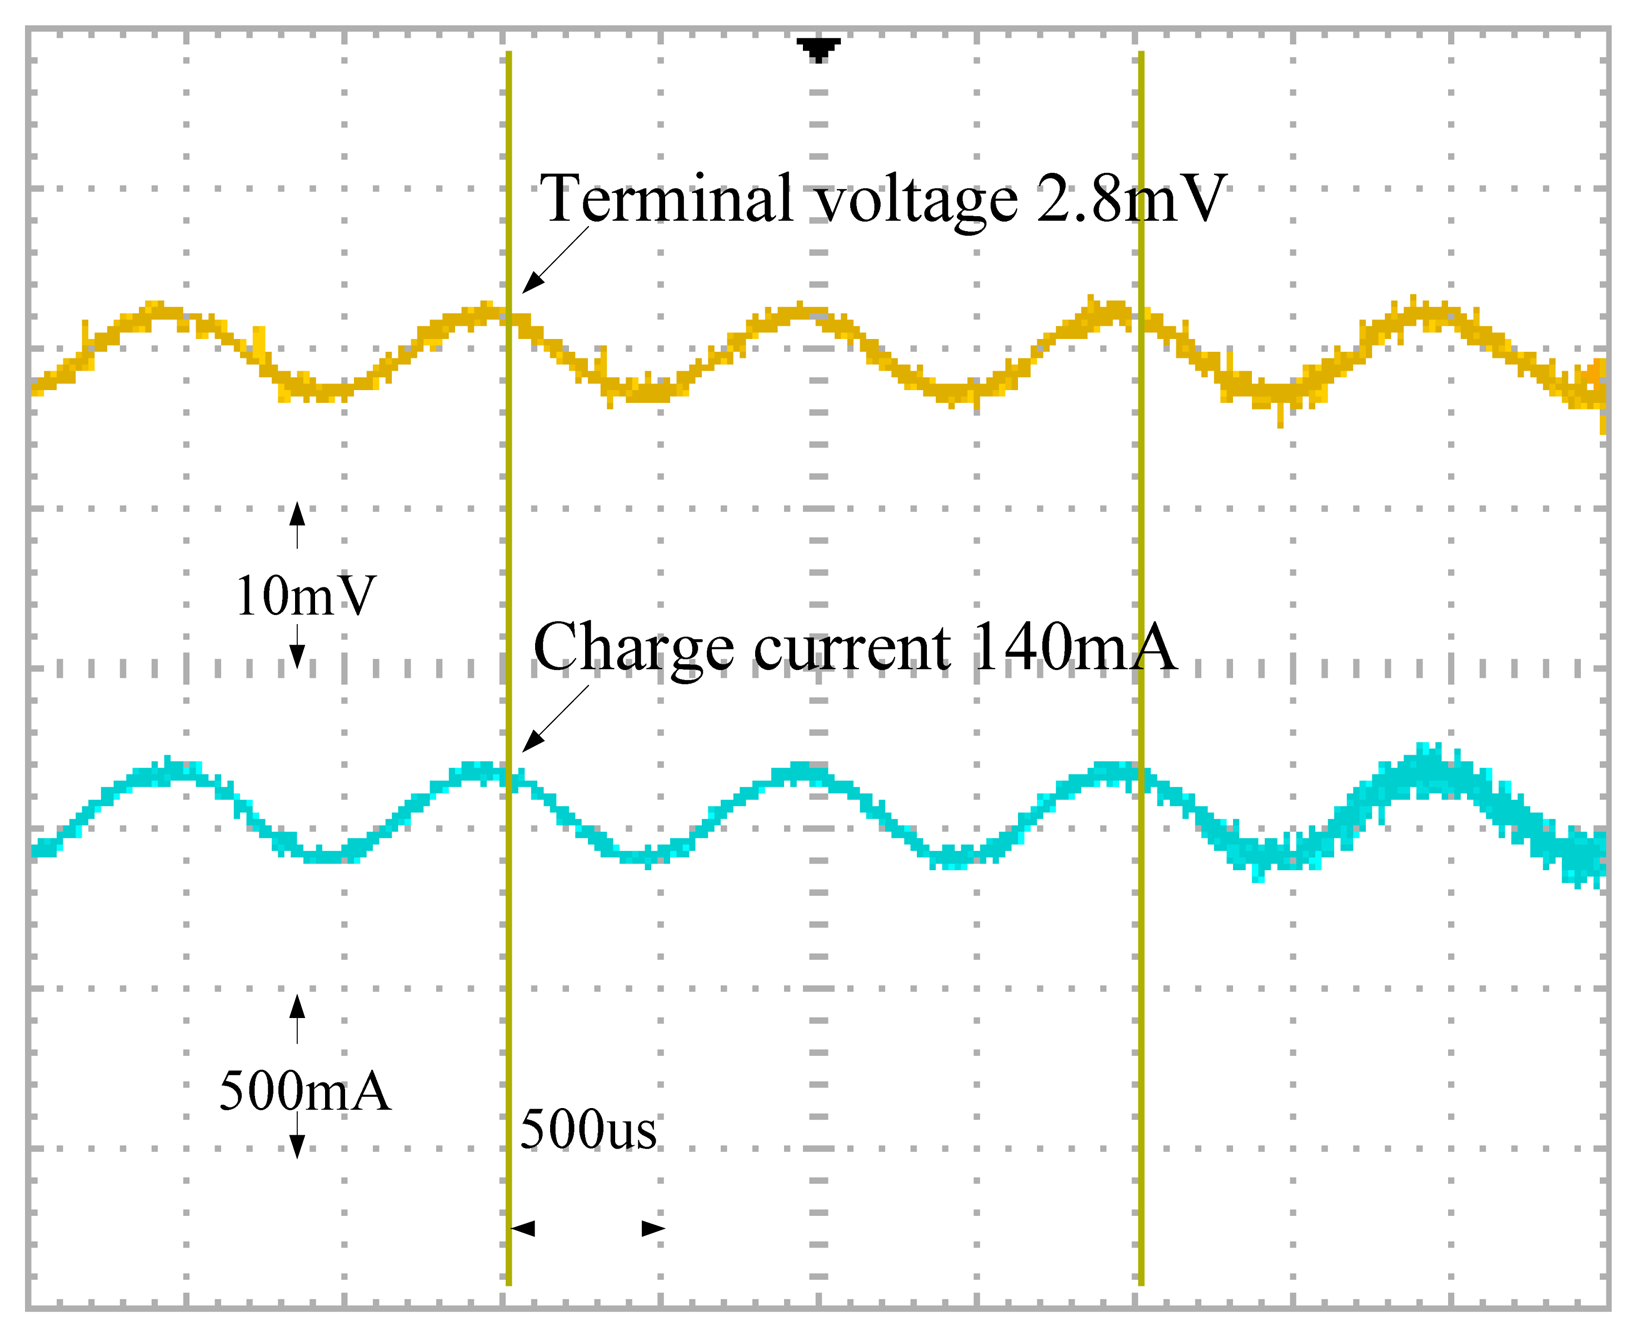
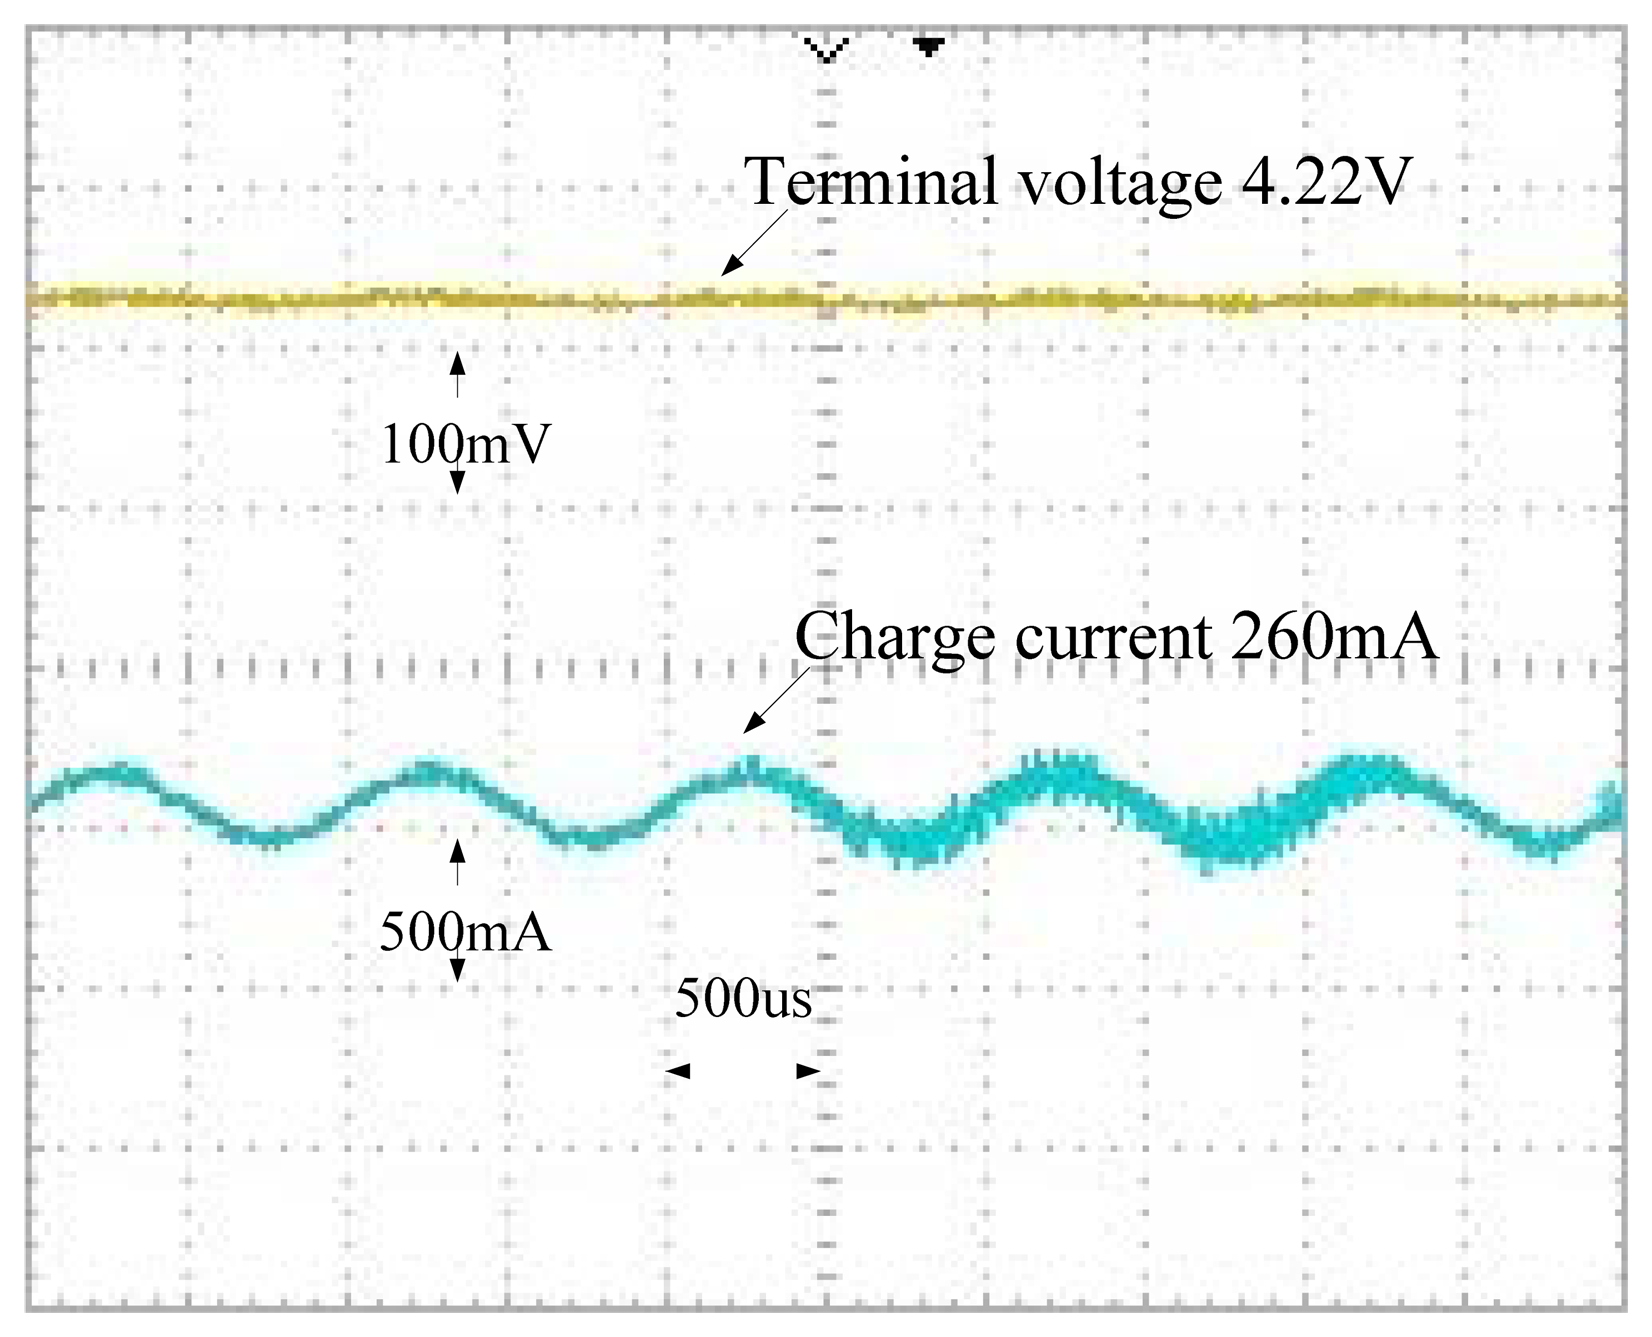
Figures 18 and 19 are the unfiltered charge current and battery output voltage waveforms in the 50% and 100% SOC cases, while in Figures 20 and 21 are the filtered versions of Figures 18 and 19, respectively.
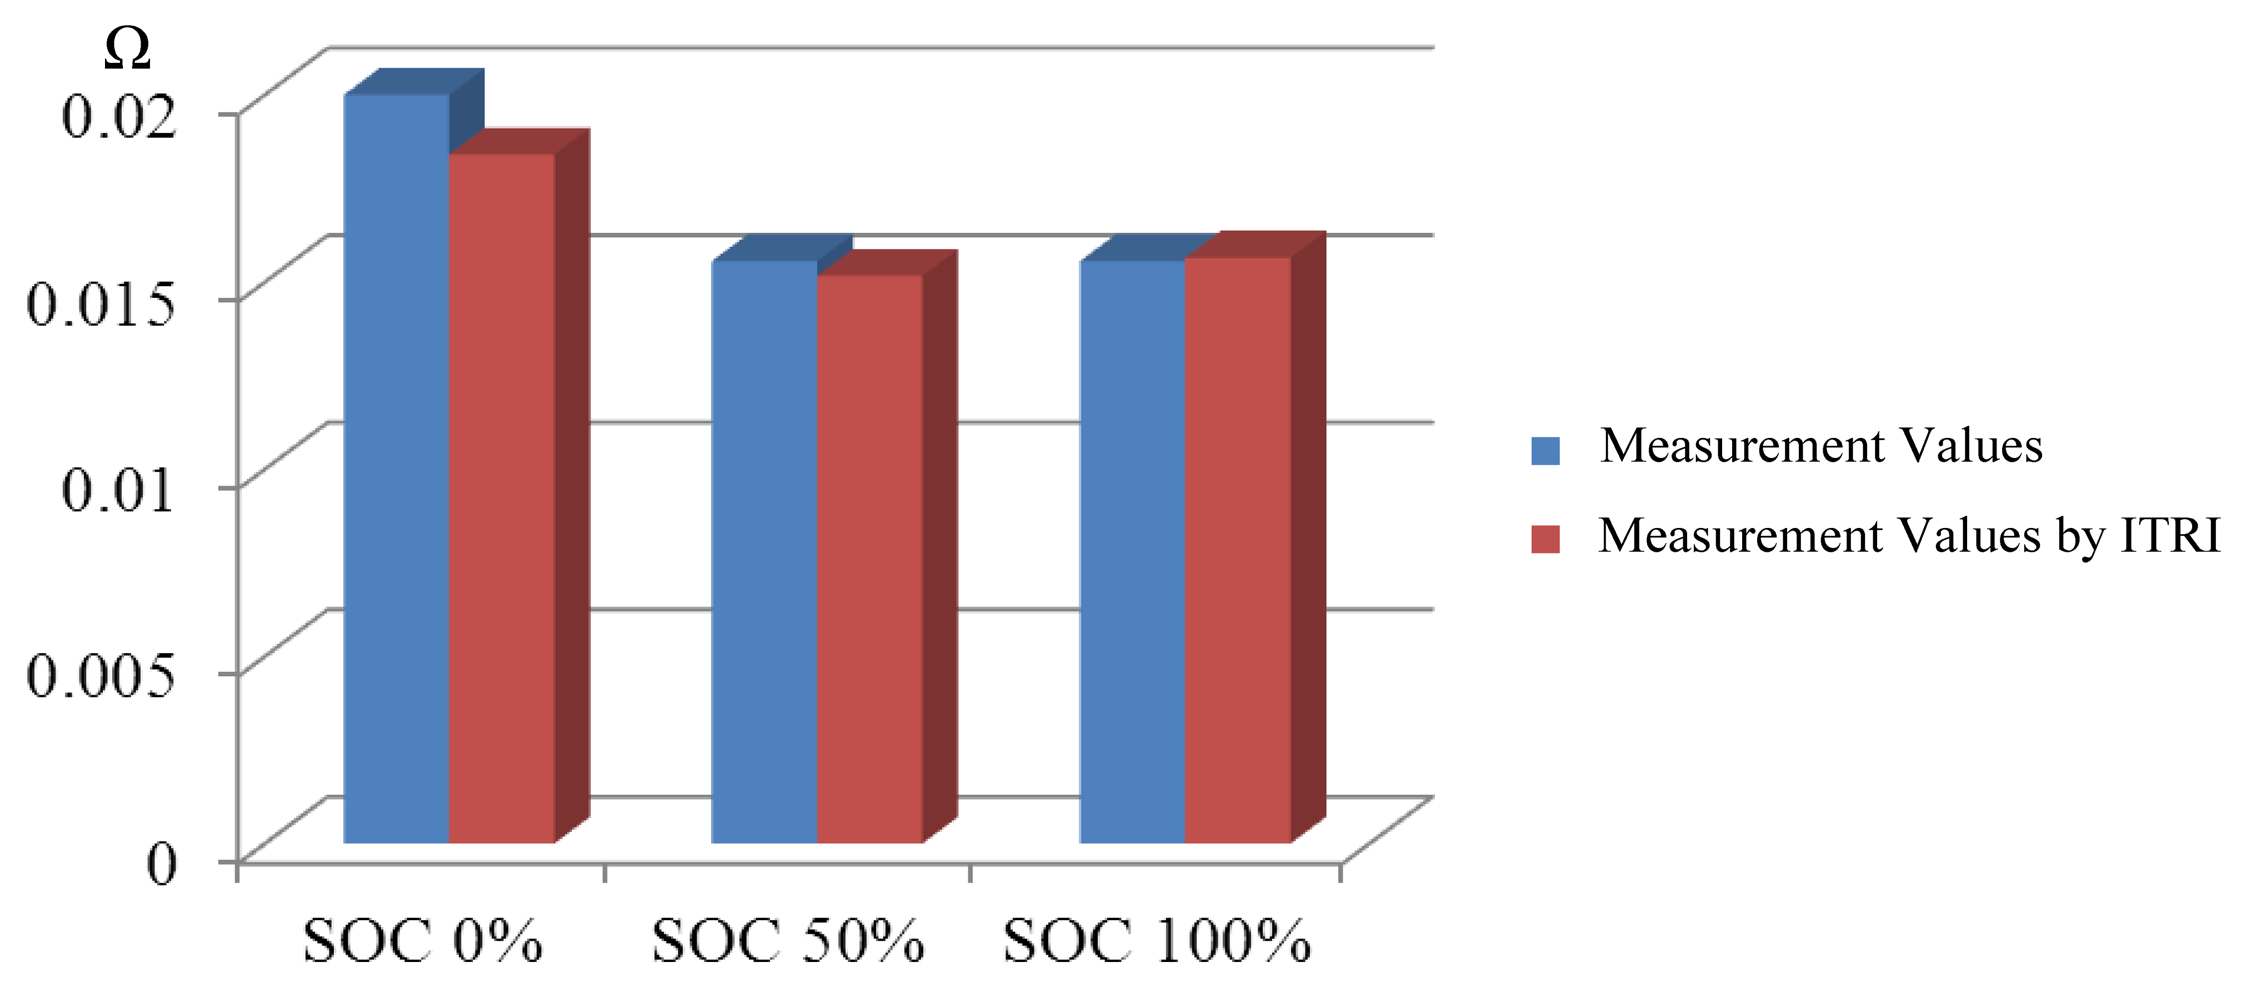
Figure 20 shows the filtered waveforms corresponding to an AC impedance of 0.01556 Ω. Figure 21 shows the filtered waveforms corresponding to an AC impedance of 0.01556 Ω. Table 2 shows the AC impedance compared with a database, provided by the Industrial Technology Research Institute (ITRI), Taiwan, as a benchmark. AC impedance errors are 8.636%, 2.604% and 0.6% in the 0%, 50% and 100% SOC cases, respectively.
Figure 22 shows the accuracy comparison of AC impedance values measured by the proposed method and ITRI at various battery SOC. Figure 23 shows the estimation errors of the AC impedance value.
6. Conclusions
This paper presents a novel approach to efficiently estimate SOC. As the first step, the AC impedance measurement of an 18650 Li-ion battery is made in a test platform at various values of SOC, and then a database is built accordingly. In practical uses, the pre-built database is referenced instantly to locate the corresponding SOC value, once the AC impedance of a battery under test is found experimentally. For validation purposes, an impedance comparison between this proposal and ITRI database is made in three cases. AC impedance errors of 8.636%, 2.604% and 0.600% are seen at SOC of 0%, 50% and 100%, respectively.
Acknowledgments
The research was sponsored by the National Science Council, Taiwan, China, under Grant No. NSC 102-2622-E-167-005-CC3.
Conflicts of Interest
The authors declare no conflict of interest.
References
- Johnson, V.H. Battery performance models in ADVISOR. J. Power Sources 2002, 110, 321–329. [Google Scholar]
- Nejdawi, I.M. Harmonic trend in NE USA: A preliminary survey. IEEE Trans. Power Deliv. 1999, 14, 1488–1494. [Google Scholar]
- Scrosati, B.; Croce, F.; Panero, S. Progress in lithium polymer battery R&D. J. Power Sources 2001, 100, 93–100. [Google Scholar]
- Ranjbar, A.H.; Banaei, A.; Khoobroo, A.; Fahimi, B. Online estimation of state of charge in Li-ion batteries using impulse response concept. IEEE Trans. Smart Grid 2012, 3, 360–367. [Google Scholar]
- Jespersen, J.L.; Tønnesen, A.E.; Nørregaard, K.; Overgaard, L.; Elefsen, F. Capacity measurements of Li-ion batteries using AC impedance spectroscopy. World Electr. Veh. J. 2009, 3, 13–16. [Google Scholar]
- Coleman, M.; Lee, C.K.; Zhu, C.; Hurley, W.G. State-of-charge determination from EMF voltage estimation: Using impedance, terminal voltage, and current for lead-acid and lithium-ion batteries. IEEE Trans. Ind. Electron. 2007, 54, 2550–2557. [Google Scholar]
- Kim, J.; Cho, B.H. State-of-charge Estimation and state-of-health prediction of a Li-ion degraded battery based on an EKF combined with a per-unit system. IEEE Trans. Veh. Technol. 2011, 60, 4249–4260. [Google Scholar]
- Charkhgard, M.; Farrokhi, M. State-of-charge estimation for lithium-ion batteries using neural networks and EKF. IEEE Trans. Ind. Electron. 2010, 57, 4178–4187. [Google Scholar]
- Dinh, D.V.; Forgez, C.; El Kadri Benkara, K.; Friedrich, G. Impedance observer for a Li-ion battery using Kalman filter. IEEE Trans. Veh. Technol. 2009, 58, 3930–3937. [Google Scholar]
- Wang, H.; He, L.; Sun, J.; Liu, S.; Wu, F. Study on correlation with SOH and EIS model of Li-ion battery. Proceedings of the 6th International Forum on Strategic Technology, Harbin, China, 22–24 August 2011; pp. 261–264.
- Hurley, W.G.; Wong, Y.S.; Wolfle, W.H. Self-equalization of cell voltages to prolong the life of VRLA batteries in standby applications. IEEE Trans. Ind. Electron. 2009, 56, 2115–2120. [Google Scholar]
- Smith, K.A.; Rahn, C.D.; Wang, C.Y. Model-based electrochemical estimation and constraint management for pulse operation of lithium-ion batteries. IEEE Trans. Contr. Syst. Technol. 2010, 18, 654–663. [Google Scholar]
- Hussein, A.A.H.; Batarseh, I. A review of charging algorithms for nickel and lithium battery chargers. IEEE Trans. Veh. Technol. 2011, 60, 830–838. [Google Scholar]
- Chen, L.R. A design of optimal pulse charge system by variable frequency technique. IEEE Trans. Ind. Electron. 2007, 54, 398–405. [Google Scholar]
- Buller, S.; Thele, M.; Doncker, R.W.; Karden, E. Impedance-based simulation models of supercapacitors and Li-ion batteries for power electronic applications. IEEE Trans. Ind. Appl. 2005, 41, 742–747. [Google Scholar]
- Huet, F. A review of impedance measurements for determination of the state-of-charge or state-of-health of secondary batteries. J. Power Sources 1998, 70, 59–69. [Google Scholar]
- Niya, S.M.R.; Hejabi, M.; Goba, F. Estimation of the kinetic parameters of processes at the negative plate of lead-acid batteries by impedance studies. J. Power Sources 2010, 195, 5789–5793. [Google Scholar]
- Rodrigues, S.; Munichandriah, N.; Shukla, A.K. AC impedance and state-of-charge analysis of a sealed lithium-ion rechargeable battery. J. Solid State Electrochem 1999, 3, 397–405. [Google Scholar]
- Spotniz, R.M. AC impedance simulation for lithium-ion cells. Proceedings of the 35th International Power Sources Symposium, Cherry Hill, NJ, USA, 22–25 June 1992; pp. 99–102.
- Qu, D. The AC impedance studies for porous MnO2 cathode by means of modified transmission line model. J. Power Sources 2001, 102, 270–276. [Google Scholar]
- Zhang, J.; Yu, J.; Cha, C.; Yang, H. The effects of pulse charging on inner pressure and cycling characteristics of sealed Ni/MH batteries. J. Power Sources 2004, 136, 180–185. [Google Scholar]
- Croce, F.; Nobili, F.; Deptula, A.; Lada, W.; Tossici, R.; D'Epifanio, A.; Scrosati, B.; Marassi, R. An electrochemical impedance spectroscopic study of the transport properties of LiNi0.75Co0.25O2. Electrochem. Commun. 1999, 1, 605–608. [Google Scholar]
- Rodrigues, S.; Munichandraiah, N.; Shukla, A.K. A review of state-of-charge indication of batteries by means of a.c. impedance measurements. J. Power Sources 2000, 87, 12–20. [Google Scholar]
- Chen, L.R.; Wu, S.L.; Chou, C.P.; Chen, T.R. Design of sinusoidal current charger with optimal frequency tracker for Li-ion battery. Proceedings of the 2010 International Power Electronics Conference, Sapporo, Japan, 21–24 June 2010; pp. 1484–1489.
- Chen, L.R.; Wu, S.L.; Chen, T.R. Improving battery charging performance by using sinusoidal current charging with the Minimum AC impedance frequency. Proceedings of the IEEE International Conference on Sustainable Energy Technologies (ICSET), Kandy, Sri Lanka, 6–9 December 2010.
- Chen, L.R.; Wu, S.L.; Shieh, D.T.; Chen, T.R. Sinusoidal ripple current charging strategy and optimal charging frequency study for Li-ion batteries. IEEE Trans. Ind. Electron. 2013, 60, 88–97. [Google Scholar]
- Chen, L.R.; Chen, J.J.; Ho, C.M.; Wu, S.L.; Chen, T.R. Improvement of Li-ion battery discharging performance by pulse and sinusoidal current strategies. IEEE Trans. Ind. Electron. 2013, 60, 5620–5628. [Google Scholar]


| Apparatus | Type |
|---|---|
| Digital Oscilloscope | GW GDS-1152A-U |
| Programmable AC Source | GW AFG-2025 |
| Power Supply | GW GPS-3303 |
| Shunt | SH-0002A-200 |
| AC Impedance Analyzer | Solartron 1280B |
| Digital Oscilloscope | GW GDS-1152A-U |
| Programmable AC Source | GW AFG-2025 |
| SOC | Proposal values (Ω) | Database values (Ω) | Error (%) |
|---|---|---|---|
| SOC 0% | 0.02000 | 0.018410 | 8.636 |
| SOC 50% | 0.01556 | 0.015165 | 2.604 |
| SOC 100% | 0.01556 | 0.015654 | 0.600 |
© 2014 by the authors; licensee MDPI, Basel, Switzerland. This article is an open access article distributed under the terms and conditions of the Creative Commons Attribution license (http://creativecommons.org/licenses/by/3.0/).
Share and Cite
Wu, S.-L.; Chen, H.-C.; Chou, S.-R. Fast Estimation of State of Charge for Lithium-Ion Batteries. Energies 2014, 7, 3438-3452. https://doi.org/10.3390/en7053438
Wu S-L, Chen H-C, Chou S-R. Fast Estimation of State of Charge for Lithium-Ion Batteries. Energies. 2014; 7(5):3438-3452. https://doi.org/10.3390/en7053438
Chicago/Turabian StyleWu, Shing-Lih, Hung-Cheng Chen, and Shuo-Rong Chou. 2014. "Fast Estimation of State of Charge for Lithium-Ion Batteries" Energies 7, no. 5: 3438-3452. https://doi.org/10.3390/en7053438