Evaluation of the Wave Energy Conversion Efficiency in Various Coastal Environments †

Department of Mechanical Engineering, "Dunarea de Jos" University of Galati, 47 Domneasca Street, 800201 Galati, Romania
†
This paper was previously presented in the 1st International e-Conference on Energies, 2013, c015, doi:10.3390/ece-1-c015, available online: http://www.sciforum.net/conference/ece-1/paper/2342.
Energies 2014, 7(6), 4002-4018; https://doi.org/10.3390/en7064002
Submission received: 8 April 2014
/
Revised: 11 June 2014
/
Accepted: 16 June 2014
/
Published: 24 June 2014
(This article belongs to the Special Issue Selected Papers from the 1st International e-Conference on Energies — Whither Energy Conversion? Present Trends, Current Problems and Realistic Future Solutions)
Abstract
:The main objective of the present work was to assess and compare the wave power resources in various offshore and nearshore areas. From this perspective, three different groups of coastal environments were considered: the western Iberian nearshore, islands and an enclosed environment with sea waves, respectively. Some of the most representative existent wave converters were evaluated in the analysis and a second objective was to compare their performances at the considered locations, and in this way to determine which is better suited for potential commercial exploitation. In order to estimate the electric power production expected in a certain location, the bivariate distributions of the occurrences corresponding to the sea states, defined by the significant wave height and the energy period, were constructed in each coastal area. The wave data were provided by hindcast studies performed with numerical wave models or based on measurements. The transformation efficiency of the wave energy into electricity is evaluated via the load factor and also through the capture width, defined as the ratio between the electric power estimated to be produced by each specific wave energy converters (WEC) and the expected wave power corresponding to the location considered. Finally, by evaluating these two different indicators, comparisons of the performances of three WEC types (Aqua Buoy, Pelamis and Wave Dragon) in the three different groups of coastal environments considered have been also carried out. The work provides valuable information related to the effectiveness of various technologies for the wave energy extraction that would operate in different coastal environments.
1. Introduction
In the medium to long term, wave energy has been identified as having the potential to make a significant contribution to the European and global energy system. At present, the technologies are still in early stages of development, but the evolution of the wave energy converters is very dynamic and major technology improvements are now expected in order to make the wave energy economically viable.
Taking into account that more than 70% of the Earth’s surface is covered by ocean, the theoretical ocean energy resource has been estimated at about four times the global electricity demand [1]. The trend of increasing the renewable energy extraction is also highly motivated by the global awareness related to the need for a transition to a lower-carbon energy system, since greenhouse gas emissions are recognized factors in the climate changes. The decarbonization of the energy sector due to low carbon technological innovation is fundamental in achieving emissions reduction targets. Thus, renewable energy technologies face opportunities and challenges as a result of this desire for “accelerated innovation” [2,3].
Since the need for accelerating innovation for a wide range of new energy sources is becoming recognized, wave and tidal energy are attracting growing attention as part of future diverse and low carbon energy systems. Wave and tidal energy have the potential to be particularly valuable contributors to a low-carbon energy mix, having different geographic distributions compared to wind and solar, greater predictability, and less intermittency. Even if only a fraction of this huge resource could be exploited, wave and tidal energy offer a very significant untapped renewable energy potential.
A very important aspect when extracting the wave energy in a coastal location is to consider the wave energy converters (WEC) that are more appropriate for the particular conditions usually encountered in that area. On the other hand, due to some particularities (as for example the bathymetry) the expected wave energy can vary considerably in a relatively small geographical scale, and the locations where the wave energy is usually higher than in the neighbouring marine sectors are called hot spots.
From this perspective, the main objective of the present work was to assess and compare the wave power resources in various offshore and nearshore areas. Three different groups of coastal environments were considered: the western Iberian nearshore, islands and enclosed an environment with sea waves, respectively. The performances of various existent WEC types were evaluated in each environment and a second objective was to compare their performances at the considered locations, and in this way to determine which is better suited for potential commercial exploitation. Of course, this might be done only after analyzing also very carefully all the economic aspects for each specific case.
Comparisons of the performances of three WEC types (Aqua Buoy, Pelamis and Wave Dragon) in the three different groups of coastal environments considered have been also carried out. This was done by evaluating two different indicators: the load factor and the capture width.
Various classifications of the existent wave energy converters have been made, but probably the most relevant are: after the location (shoreline, nearshore and offshore), after the operating principle (oscillating water column, overtopping devices and wave activated bodies) and after the directional characteristics (point absorber, terminator and attenuator). Since the present work targets especially the nearshore and offshore areas, the following converters were considered: Oceantec [4], Pelamis [5], Pontoon Power Converter [6], Seabased [6], Wave Dragon [7], Aqua Buoy [8], Archimedes Wave Swing (AWS) [9], Langlee [6], Ocean Energy Buoy (OE Buoy) [6] and Wavebob [6]. The rating powers and some other characteristics of these devices are given in Table 1. For each converter the manufacturer provided the nominal power (or power rating, which is the maximum power to be used with that device) and the power matrix that indicates the average electric power (in kW) expected to be provided by the device when working in the wave conditions that correspond to each specific sea state. The sea states are usually structured into bins of 0.5 s × 0.5 m (ΔTe × ΔHs). At this point, it has to be underlined that for the sake of generality in the present study the sizes of the devices were considered the same at all locations and also that the park effect was not accounted for. Apart from forming arrays, some of WECs might be scalable in size, function of the wave climate particularities, which could be crucial in performance optimization and economic viability of the deployment. Thus, in further studies the devices dimensions should be carefully considered on case-by-case bases, as they may significantly affect the economic viability of WECs.

| Device | Power per Unit (kW) | Movement | Depth (m) | Size |
|---|---|---|---|---|
| Oceantec | 500 | heave | 30–50 | medium |
| Pelamis | 750 | surge & heave | 50–70 | medium |
| P P Converter | 3620 | heave | deep | large |
| Seabased | 15 | heave | 30–50 | small |
| Wave Dragon | 7000 | overtopping | 30–50 | large |
| Aqua Buoy | 250 | heave | >50 | small |
| AWS (Archimedes Wave Swing) | 2320 | heave | 40–100 | medium |
| Langlee | 1665 | oscillating flaps | deep | medium |
| OE Buoy | 2800 | oscillating column | deep | medium |
| Wavebob | 1000 | heave | deep | medium |
From this perspective, in order to assess correctly the expected electric power produced by a certain device in a specific location, a very important issue is to determine properly the wave energy distribution along the sea states and generate the scatter diagrams that give the bivariate distribution of the sea occurrences, which correspond to the sea states defined by significant wave height and energy period [10,11].
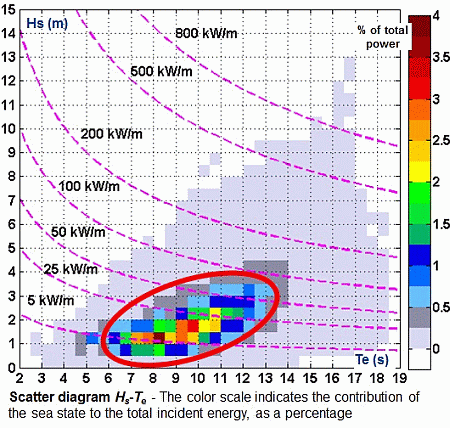
Medium to long term wave data time series ([11] recommends periods greater than ten years to avoid year-to-year variation to influence results too heavily), coming from either wave modelling systems or in situ measurements are considered for each coastal location in order to generate the scatter diagrams of the Hs-Te joint distributions. Such a diagram presents the probabilities of occurrences of different sea states expressed in percentages from the total number of occurrences and the color of each bin indicates the percentage according to a color-map, which was designed the same for all diagrams and is illustrated in the color-bar of the figures. As an example, a scatter diagram, for a location from the coastal environment in the West Iberian nearshore, is presented in Figure 1 structured in total and winter time, respectively, where the winter time represents the periods between October and March.
Figure 1.
The specific pattern for the west Iberian nearshore, scatter diagrams Hs-Te as resulted from 41 years (1960–2000) of WAM (acronym for Wave Modeling) simulations (structured in total and winter time, respectively). The color scale is used to represent the contribution of the sea state to the total incident energy, as a percentage. The wave power isolines are also represented.

The wave power isolines, which are represented in each diagram, have been computed using the equation of the deep wave energy flux [12]:
![Energies 07 04002 i001]() where PW is the wave energy flux in watts per meter of crest length, ρ = 1025 kg/m3 is the density of sea water, g is the acceleration of gravity.
where PW is the wave energy flux in watts per meter of crest length, ρ = 1025 kg/m3 is the density of sea water, g is the acceleration of gravity.

As the diagram presented on the left side of Figure 1 shows, for the total time the bulk of the occurrences in terms of significant wave height is in the interval 1–3 m, while as regards the energy periods, the interval 5.5–12.5 s appears to be dominant. The winter time conditions are illustrated in the right side of Figure 1, where it can be seen that the interval of the most probable wave energies moves with about two bins towards the higher values in each direction. Figure 1 also shows that for the total time, although most of the wave energy lies between the power isolines of 5 and 25 kW/m, significant occurrences can also be encountered in the interval between the isolines of 25 and 50 kW/m. In the winter time, the cluster of most probable occurrences moves from the interval 5–25 kW/m to the interval 25–50 kW/m. In this case, some relevant occurrences can be seen also for the power interval 50–100 kW/m. The below diagrams show that the most probable sea states are concentrated along the diagonal that makes an angle of about 30 and 45 degrees with the horizontal, for the total and winter time, respectively. Such concentration of the sea states occurrences along a diagonal line appears to be higher in the winter time. For each bivariate diagram, a table was associated (not shown in the work), giving the wave activity during the time interval considered. The elements of these tables indicate the number of occurrences, in percentages of the total.
Since the relationship (1) is valid only in deep water, for the shallow water cases analysed in the present work, SWAN (acronym for Simulating Waves Nearshore) results were considered. In SWAN, the wave power components (expressed in W/m, i.e., energy transport per unit length of wave front) are computed with the relationships:
![Energies 07 04002 i002]() where: x, y are the problem coordinate system (for the spherical coordinates x axis corresponds to longitude and y axis to latitude), E (ω,θ) the wave energy spectrum in terms of absolute wave frequency (ω) and wave direction (θ), cx, cy are the propagation velocities of the wave energy in the geographical space. The absolute value of the wave power is:
where: x, y are the problem coordinate system (for the spherical coordinates x axis corresponds to longitude and y axis to latitude), E (ω,θ) the wave energy spectrum in terms of absolute wave frequency (ω) and wave direction (θ), cx, cy are the propagation velocities of the wave energy in the geographical space. The absolute value of the wave power is:
![Energies 07 04002 i003]()


The approach considered to evaluate the electric power of a certain WEC in a specific site [11,13] is to associate to the power matrix of each device with the matrix that indicates the wave activity for the respective location in a determined time interval. This yields to the following formula for the estimation of the average electric power that might be expected in the time interval associated to the matrix that gives the wave activity:
![Energies 07 04002 i004]() where pij represent the energy percentage corresponding to the bin defined by the line i and the column j and Pij the electric power corresponding to the same energy bin for the WEC considered, nT indicates the number of bins on the horizontal (corresponding to the Te discretization) and nH is the number of bins on the vertical (corresponding to the Hs discretization). Thus, considering this approach, the average electric power expected at each location and for each device can be estimated and, as the time interval considered for the sea states assessment is longer, the estimations of the expected average wave power become more reliable [11]. A detailed description of the approach considered in the evaluation of the expected wave power provided by a certain device is given in [14,15].
where pij represent the energy percentage corresponding to the bin defined by the line i and the column j and Pij the electric power corresponding to the same energy bin for the WEC considered, nT indicates the number of bins on the horizontal (corresponding to the Te discretization) and nH is the number of bins on the vertical (corresponding to the Hs discretization). Thus, considering this approach, the average electric power expected at each location and for each device can be estimated and, as the time interval considered for the sea states assessment is longer, the estimations of the expected average wave power become more reliable [11]. A detailed description of the approach considered in the evaluation of the expected wave power provided by a certain device is given in [14,15].

Finally, at the end of this section it has to be also highlighted that the large wave energy farms may also play an active role in the coastal protection. Some recent studies [16] showed that nearshore currents, which are the main factor in driving the coastline dynamics, are sometimes even more sensitive than the waves to the nearshore energy extraction. This is explained by the fact that the wave farms induce relevant changes, not only to the wave heights, but also to the wave directions.
2. Results and Discussion
2.1. Transformation of the Wave Energy in Western Iberian Nearshore
The first target area is the western Iberian nearshore and the analysis is structured in two parts, the Spanish coastal environment (corresponding to the northwestern side of the Iberian nearshore) and the Portuguese nearshore. Several studies have been previously focused on this coastal environment [17,18,19,20] that appeared to be quite adequate to the wave energy extraction.
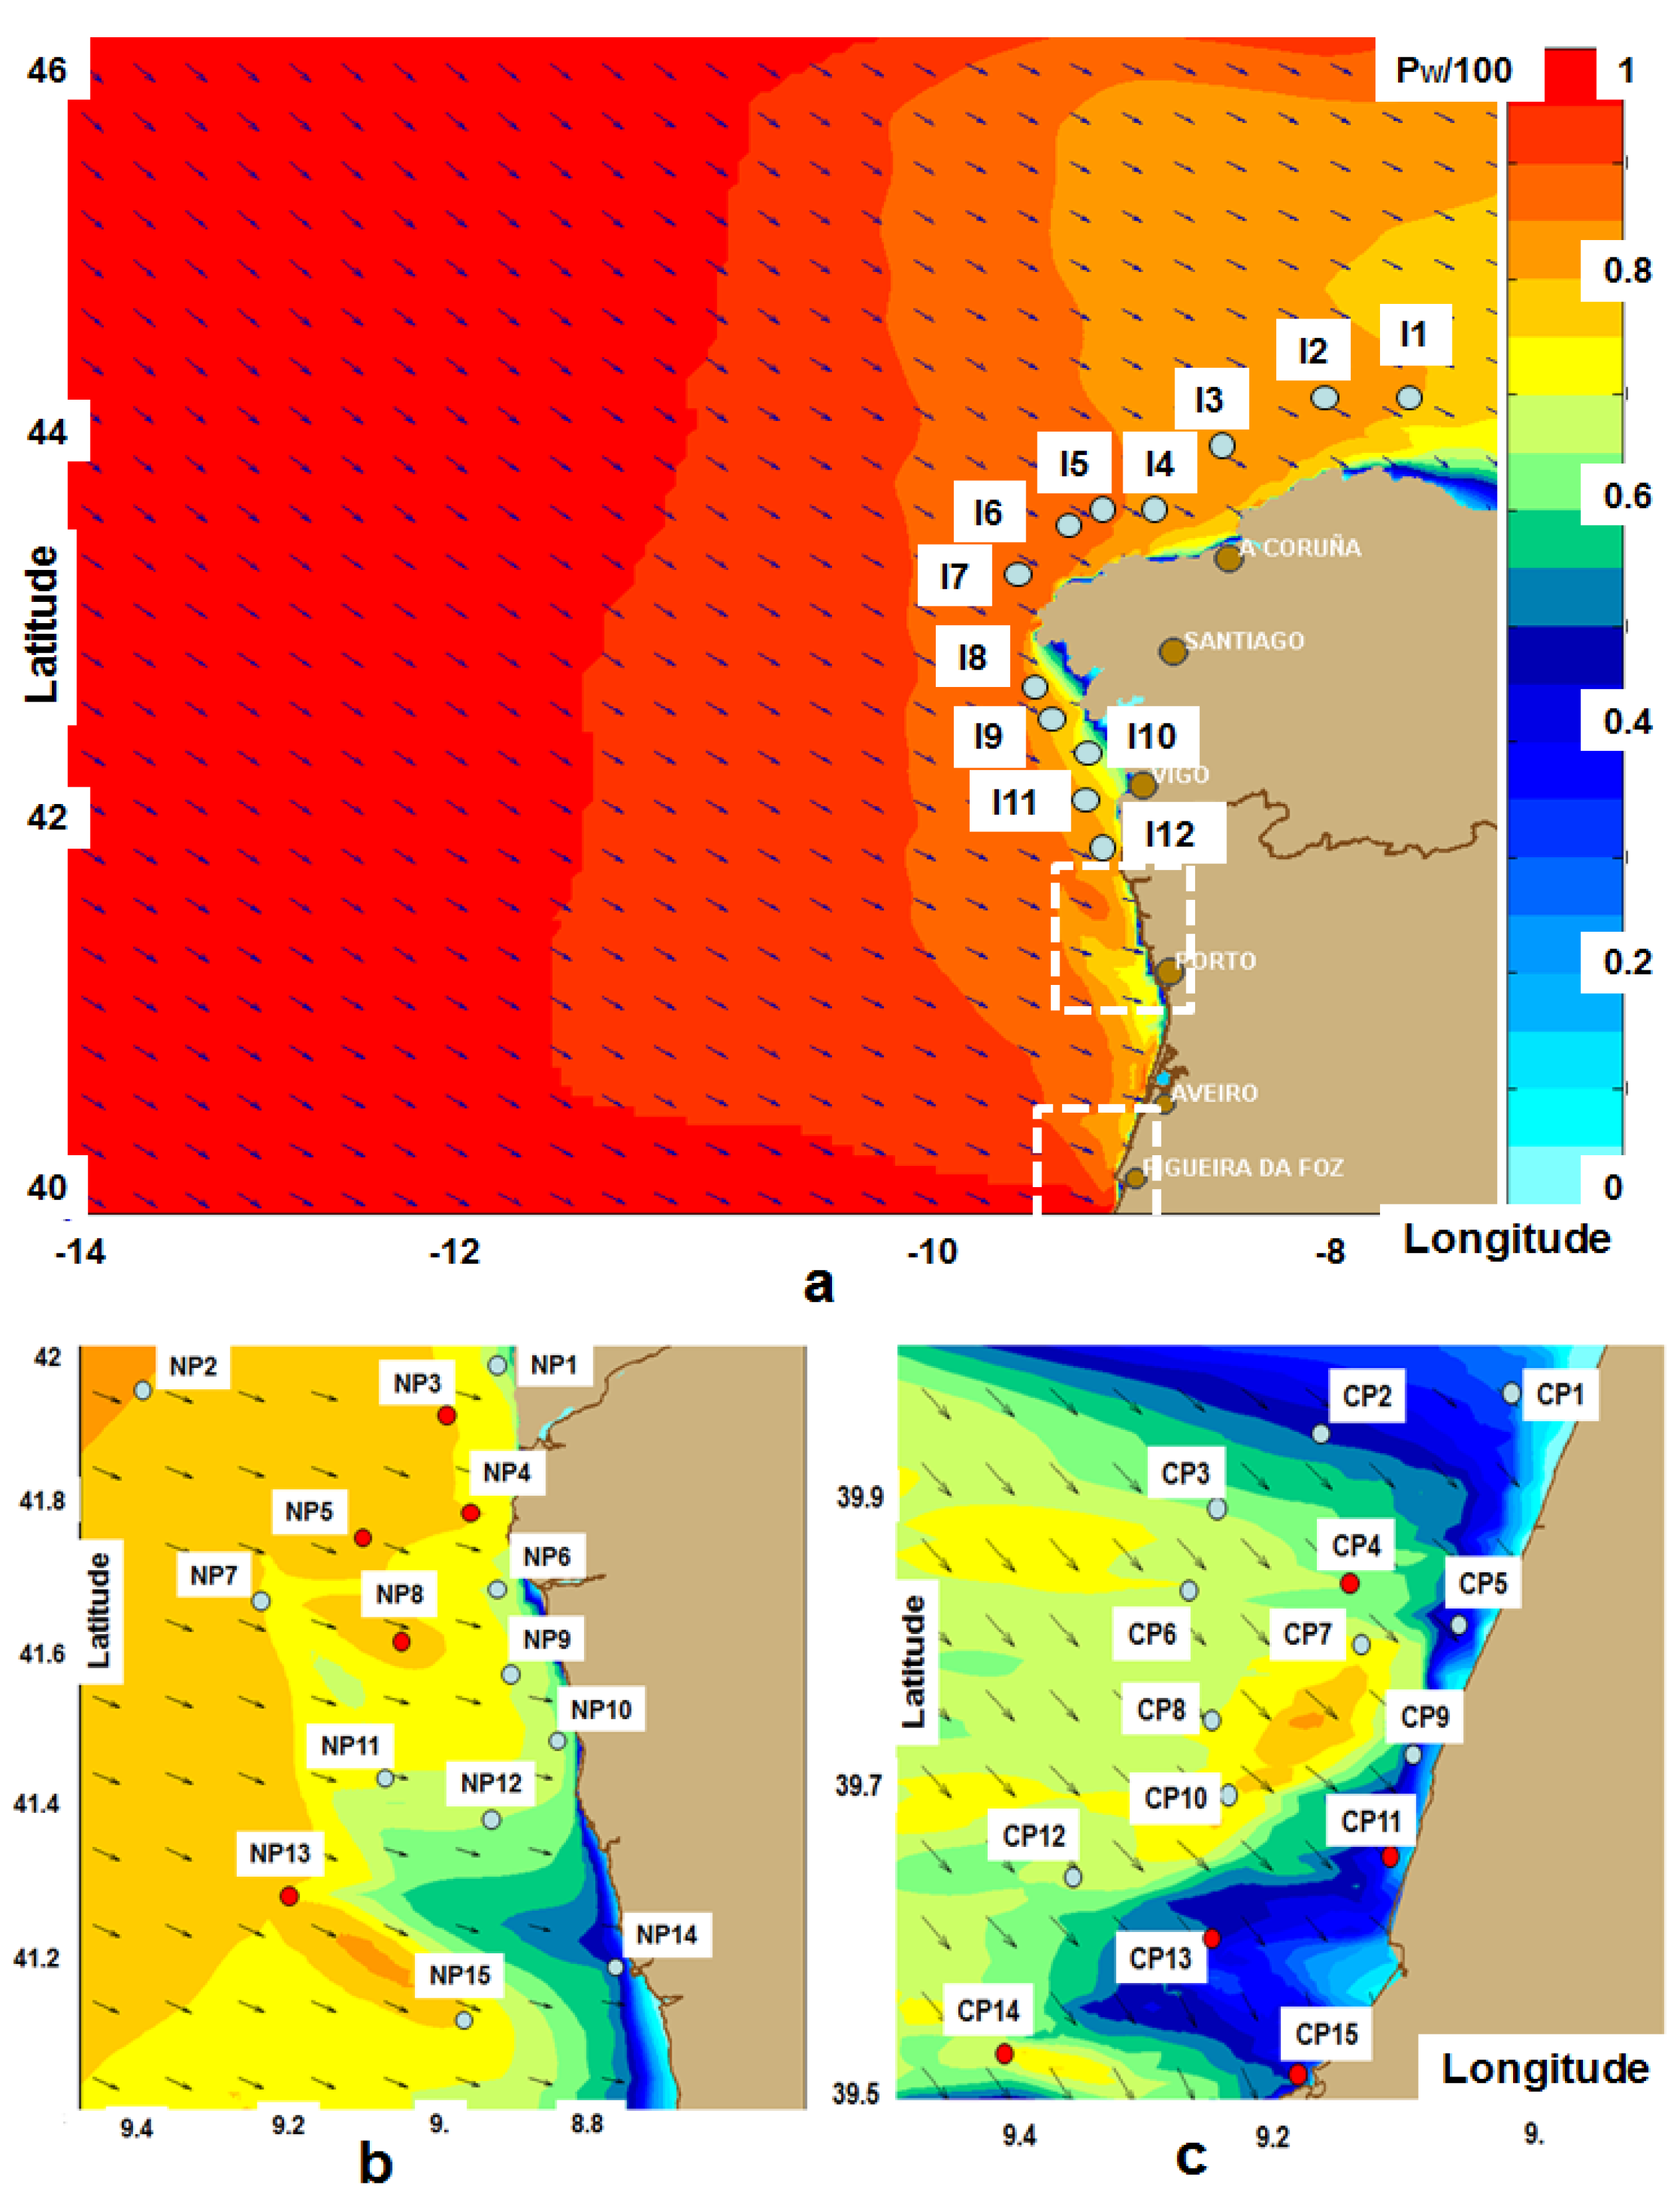
In order to identify the most energetic locations in the Spanish nearshore, an analysis based on long term WAM (Wave Modeling) [21] model simulations was performed considering a numerical data set composed of hindcast wind and wave data for a period of 41 years (1960–2000) with a three-hourly frequency provided by Puertos del Estado (the Spanish Ports Authority). Twelve reference points (denoted as the I-points) were considered for the wave data analysis and their locations are illustrated in Figure 2a with the mention that all of them are in deep water.
Figure 2.
.Distribution of the mean relative wave power and the positions of the reference points in the northwest Iberian and Portuguese coastal environments (a) the northwestern Iberian nearshore (denoted as the Spanish nearshore), SWAN simulation corresponding to the time frame 2010/01/16/h18 reflecting high non storm energy conditions, the positions of 12 reference points are also indicated (I-points), the computational domains considered in the Portuguese nearshore are also indicated. The extents of the geographical spaces corresponding to the subsequent northern and central computational domains are also illustrated. (b) and (c) the northern and central domains defined in the Portuguese nearshore, SWAN simulations corresponding to the time frame 2010/04/22/h18 reflecting average wave energy conditions, the positions of 15 reference points are defined in each case (NP and CP-points, respectively).

Subsequently, for assessing better the spatial distribution patterns of the wave energy SWAN [22] simulations with a higher resolution in the geographical space were also performed [23] and the background of Figure 2a presents the distribution of the mean relative wave power for a representative situation corresponding to the time frame 2010/01/16/h18 that reflect high non storm energy conditions. The code defined to describe the time frames all over this work has the following signification: year/month/day/hour.
The non dimensional normalized wave power is expressed as:
![Energies 07 04002 i005]() where PW represents the wave power in the respective point of the computational domain PWmax represents the maximum value, which in all the cases considered in the present work was considered 100 kW.
where PW represents the wave power in the respective point of the computational domain PWmax represents the maximum value, which in all the cases considered in the present work was considered 100 kW.

The average values of the wave power in the I-points, structured in total time (TT) and winter time (WT) are presented in Table 2, while Table 3 shows the expected electric power for the six most energetic reference points (I1, I2, I3, I5, I6 and I7), evaluations carried out considering the approach defined in the previous section, corresponding to the performance characteristics of five different WEC devices (Oceantec, Pelamis, Pontoon Power Converter, Seabased AB and Wave Dragon). Detailed descriptions of how these results were obtained together with some additional comments are given in [24].
As regards the second part of the first target area, represented by the Portuguese continental coastal environment, it has to highlight first that since this was a very popular area for the wave energy developers, and various studies have been previously performed as for example that presented in [25].
Table 2.
Spanish nearshore (the I-points), average values of the wave power in kW over meter of wave front (structured in total TT and winter time WT, respectively), WAM model results for a 41-year period (1960–2000).
| Points | I1 | I2 | I3 | I4 | I5 | I6 | I7 | I8 | I9 | I10 | I11 | I12 | |
|---|---|---|---|---|---|---|---|---|---|---|---|---|---|
| PWmed (kW/m) | TT | 28.7 | 29.7 | 29.2 | 25.5 | 28.7 | 31.7 | 30.2 | 20.4 | 23.8 | 12.8 | 15.7 | 19.4 |
| WT | 51.9 | 53.6 | 52.3 | 44.6 | 50.9 | 56.2 | 53.3 | 36.8 | 42.3 | 25.0 | 30.1 | 34.2 | |
Table 3.
Spanish nearshore, average electric power in kW for the six most energetic reference points studied, estimations corresponding to the characteristics of five different WEC devices.
| PE (kW) Point/Period | Oceantec | Pelamis | Pontoon Power C | Seabased AB | Wave Dragon | |||||
|---|---|---|---|---|---|---|---|---|---|---|
| TT | WT | TT | WT | TT | WT | TT | WT | TT | WT | |
| I1 | 96.5 | 102.8 | 114.2 | 145.4 | 221.5 | 252.1 | 2.6 | 3.2 | 2037.2 | 2667.6 |
| I2 | 99.9 | 105.4 | 118.1 | 150.2 | 227.2 | 258.5 | 2.7 | 3.3 | 2083.8 | 2730.9 |
| I3 | 97.2 | 100.4 | 118.4 | 150.0 | 224.8 | 253.1 | 2.7 | 3.2 | 2112.6 | 2768.6 |
| I5 | 94.4 | 94.4 | 115.6 | 144.8 | 219.7 | 244.4 | 2.6 | 3.2 | 2095.2 | 2736.4 |
| I6 | 107.1 | 106.5 | 126.6 | 158.6 | 239.4 | 239.4 | 2.8 | 3.4 | 2197.8 | 2875.0 |
| I7 | 105.0 | 103.6 | 124.5 | 155.9 | 236.3 | 263.7 | 2.8 | 3.3 | 2172.4 | 2839.5 |
The results analyzed at this level of the work are based on medium term simulations carried out with a different wave prediction system compared to [25]. This uses Wave Watch III [26], for the wave generation at the scale of the entire North Atlantic Ocean, and SWAN, for the coastal wave transformation. The main physical processes accounted in the SWAN simulations are: generation by wind, whitecaping dissipation, quadruplet interactions and wave breaking. More details concerning the SWAN model settings and the characteristics of the computational grids for this particular case are provided in [14]. The results provided by this system were evaluated against measurements coming from two directional buoys. Pursuing the wave energy patterns, especially with regard to the most frequent wave power spatial distributions in the two medium resolution computational domains, fifteen reference points were defined for each computational domain and their positions are indicated in Figure 2b,c, for the northern and central computational domains. They will be denoted as NP (northern points) for and CP (central points), respectively. The background of the figures illustrates the distribution of the normalized wave power in the two medium resolution computational domains, simulations for the time frame 2010/04/22/h18. The above situation corresponds to average wave energy conditions that are in line with the most usual wave energy patterns encountered in the target areas considered. The average values of the wave power in the NP and CP-points, also structured in total and winter time are presented in Table 4.
Table 4.
Portuguese nearshore, average values of the wave power in kW over meter of wave front resulted from simulations with SWAN performed for the time interval 2009–2011, structured in total TT and winter time WT, respectively.
| NP-Points Pw (kW/m) | NP1 | NP2 | NP3 | NP4 | NP5 | NP6 | NP7 | NP8 | NP9 | NP10 | NP11 | NP12 | NP13 | NP14 | NP15 |
|---|---|---|---|---|---|---|---|---|---|---|---|---|---|---|---|
| TT | 17.3 | 27.8 | 26.2 | 22.9 | 25.2 | 19.8 | 25.2 | 27.4 | 23.7 | 17.9 | 24.6 | 22.8 | 26.5 | 17.1 | 24.9 |
| WT | 26.8 | 43.1 | 40.7 | 35.4 | 38.9 | 30.5 | 38.9 | 42.7 | 36.5 | 27.9 | 37.9 | 34.9 | 41.3 | 26.6 | 38.6 |
| CP-points Pw (kW/m) | CP1 | CP2 | CP3 | CP4 | CP5 | CP6 | CP7 | CP8 | CP9 | CP10 | CP11 | CP12 | CP13 | CP14 | CP15 |
| TT | 20.3 | 24.7 | 23.2 | 24.9 | 21.7 | 24.1 | 23.4 | 23.5 | 21.2 | 24.9 | 24.8 | 25.3 | 24.5 | 24.8 | 24.8 |
| WT | 31.5 | 38.4 | 35.9 | 38.9 | 33.7 | 37.5 | 36.3 | 36.4 | 32.8 | 36.1 | 38.9 | 39.1 | 37.8 | 38.5 | 38.5 |
Table 5 shows the expected electric power for the five most energetic reference points in each computational domain (NP3, NP4, NP5, NP8, NP13 and CP4, CP11, CP13, CP14, CP15, respectively), corresponding to four different wave converters (Pelamis, Archimedes Wave Swing, Aqua Buoy and Wave Dragon). Some more information concerning these results is provided in [11].
Table 5.
Portuguese nearshore, average electric power in kW for ten most energetic reference points, estimations corresponding to the characteristics of four different WEC devices.
| PE (kW) Point/Period | Pelamis | AWS | Aqua Buoy | Wave Dragon | ||||
|---|---|---|---|---|---|---|---|---|
| TT | WT | TT | WT | TT | WT | TT | WT | |
| NP3 | 95.1 | 130 | 282.7 | 446 | 34.4 | 48.9 | 907.5 | 1359 |
| NP4 | 78.7 | 109 | 246.9 | 396 | 28.8 | 41.5 | 766.7 | 1153 |
| NP5 | 98.0 | 134 | 286.8 | 451 | 35.7 | 50.6 | 927.9 | 1388 |
| NP8 | 101.1 | 139 | 302.8 | 476 | 36.3 | 51.4 | 979.2 | 1475 |
| NP13 | 100.2 | 138 | 295.9 | 467 | 36.1 | 51.4 | 957.1 | 1440 |
| CP4 | 95.8 | 132 | 274.5 | 436 | 34.1 | 48.6 | 895.8 | 1339 |
| CP11 | 85.4 | 121 | 275.1 | 447 | 30.3 | 44.2 | 859.2 | 1317 |
| CP13 | 102.3 | 142 | 286.9 | 455 | 36.2 | 51.8 | 955.9 | 1436 |
| CP14 | 97.5 | 136 | 274.0 | 433 | 33.9 | 48.3 | 905.2 | 1354 |
| CP15 | 83.1 | 115 | 262.7 | 421 | 30.0 | 43.0 | 820.8 | 1232 |
2.2. Transformation of the Wave Energy in the Nearshore of Canary Islands and Madeira Archipelago
For the next study, data from Puertos de Estado have been used for the reason that they bring more information about the waves in the ocean and in the coastal areas neighboring the Canary Islands. These data are time series of wind and wave parameters provided by numerical models. They come from the prediction system that the Spanish Port Authority has been developing, in collaboration with the Spanish National Agency for Meteorology (AEMET). It has to be however highlighted that these data are not simple predictions, but they are analysis or diagnosis data. To generate the wave fields, the models WAM and Wave Watch III have been used.Twelve reference points (C-points all located in deep water) were considered for the wave data analysis in the coastal area of the Canary Islands and their positions are illustrated in Figure 3a. For this level of the analysis, a seventeen-year time interval (1996–2012) is considered. The average values of the wave power in the C-points, also structured in total and winter time are presented in Table 6.
Table 7 shows the expected electric power corresponding to all these reference points for six wave energy converters that are considered more appropriate for such environment because they are designed to operate in deep water (Pelamis, Archimedes Wave Swing, Aqua Buoy, OE Buoy, Langlee and Wave Bob). A more detailed description of how these results were obtained is given in [27].
The next island environment considered is represented by Madeira Archipelago. Unlike the area of the Canary Islands, this is composed of two major islands quite distanced (Madeira and Porto Santo) while southeast of Madeira, lies a group of smaller islands called the Desert Islands. The background of the Figure 3b,c illustrate the distribution of the normalized wave power (the wave power divided by 100 kW) in two medium resolution computational domains, corresponding to Madeira and Porto Santo, respectively, simulations corresponding to the time frame 2001/03/15/h21. The above situation corresponds to average wave energy conditions that are in line with the most usual wave energy patterns encountered in the target areas considered and in the wave power was divided this time by 50 kW. Three reference points (M-points) were selected, M1 in Madeira and M2 and M3 in Porto Santo, and they correspond to locations that have been identified as relevant hot spots with average energy considerably higher than the neighboring areas. The existence of such relevant hot spots in island environment has been also identified in the Archipelago of Azores, as presented in [28]. Some others relevant studies concerning the evaluation of the wave energy in island environment are presented in [29,30].
The average values of the wave power in the M-points, also structured in total and winter time are presented in Table 6. Table 8 gives the expected electric power for the reference points M1 and M3 corresponding to the wave converters (Pelamis, Aqua Buoy and Wave Dragon). More information concerning these results and the wave conditions and wave energy potential in Madeira Archipelago is provided in [15].
Figure 3.
(a) Canary Islands (C-points), the map of the area and the positions of the reference points considered. The other data points available are represented by white dots. (b) Distribution of the mean relative wave power in the vicinity of Madeira island (SWAN simulation corresponding to the time frame 2001/03/18/h06, average energetic conditions), the position of the reference point M1 is also represented; (c) Wave energy pattern in the vicinity of Porto Santo island (SWAN simulation corresponding to the time frame 2001/03/18/h06, average energetic conditions), the position of the reference points M2 and M3 are also represented.

Table 6.
Average values of the wave power: C-points, Canary Islands, structured, in total time (TT) and winter time (WT), respectively, data processed for the seventeen-year time interval 1996–2012; M-points, Madeira Archipelago (WT in kW over meter of wave front), representing the results of SWAN simulations performed for the time intervals (1997/10/07–1998/03/01) and (2000/12/01–2001/05/03).
| C-points Pw (kW/m) | C1 | C2 | C3 | C4 | C5 | C6 | C7 | C8 | C9 | C10 |
|---|---|---|---|---|---|---|---|---|---|---|
| TT | 16.3 | 16.2 | 17.3 | 17.3 | 16.8 | 16.9 | 17.4 | 19.1 | 19.1 | 19.3 |
| WT | 18.2 | 18.4 | 19.2 | 19.0 | 18.3 | 18.5 | 19.2 | 20.6 | 20.6 | 20.7 |
| M-points | M1 | M2 | M3 | – | – | – | – | – | – | – |
| WT | 51.5 | 65.4 | 57.4 | – | – | – | – | – | – | – |
Table 7.
Canary Islands, average electric power in kW for the reference points studied, estimations corresponding to the characteristics of six different WEC devices.
| PE (kW) Point/Period | Pelamis | AWS | Aqua Buoy | OE Buoy | Langlee | Wave Bob | ||||||
|---|---|---|---|---|---|---|---|---|---|---|---|---|
| TT | WT | TT | WT | TT | TT | WT | WT | TT | WT | TT | WT | |
| C1 | 65.4 | 78.8 | 260.1 | 403.2 | 24.3 | 52.2 | 52.9 | 32.3 | 126.9 | 168.8 | 86.9 | 112.8 |
| C2 | 66.2 | 79.5 | 260.2 | 403.0 | 24.6 | 52.1 | 53.0 | 32.5 | 128.2 | 171.2 | 87.4 | 113.4 |
| C3 | 76.0 | 90.0 | 273.5 | 421.0 | 27.6 | 61.5 | 62.0 | 36.0 | 143.1 | 188.5 | 95.5 | 123.0 |
| C4 | 74.8 | 88.3 | 271.8 | 418.5 | 27.2 | 60.5 | 60.6 | 35.4 | 141.1 | 185.5 | 94.4 | 121.3 |
| C5 | 72.5 | 80.8 | 255.3 | 391.1 | 25.8 | 61.5 | 57.2 | 32.3 | 134.4 | 169.2 | 89.7 | 111.5 |
| C6 | 74.1 | 82.1 | 257.7 | 394.0 | 32.3 | 63.1 | 58.2 | 32.7 | 137.1 | 171.8 | 91.3 | 112.9 |
| C7 | 81.3 | 90.4 | 270.0 | 412.6 | 28.7 | 69.2 | 64.2 | 35.8 | 149.5 | 187.9 | 98.3 | 121.9 |
| C8 | 87.8 | 93.4 | 275.6 | 417.1 | 30.7 | 75.6 | 66.3 | 37.0 | 159.6 | 193.7 | 103.7 | 124.9 |
| C9 | 88.5 | 93.2 | 275.8 | 416.6 | 31.0 | 76.3 | 66.1 | 37.0 | 160.7 | 193.4 | 104.2 | 124.7 |
| C10 | 90.3 | 94.2 | 277.4 | 418.1 | 31.5 | 78.3 | 67.1 | 37.3 | 163.6 | 195.5 | 105.7 | 125.7 |
Table 8.
Average electric power in kW for the converters: Pelamis, Aqua Buoy and Wave Dragon in two reference points in Madeira (M1 and M3), one reference point in the Black Sea (B-point) and other reference point in the North Sea at Fino station (F-point).
| PE (kW) Point/Period | Pelamis | Aqua Buoy | Wave Dragon | |||
|---|---|---|---|---|---|---|
| TT | WT | TT | WT | TT | WT | |
| M1 | - | 134.9 | - | 40.2 | - | 1147.4 |
| M3 | - | 105.3 | - | 50.4 | - | 1644.2 |
| B | 60.0 | 89.0 | 15.9 | 24.0 | 391.2 | 578.1 |
| F | 69.7 | 98.0 | 12.1 | 25.5 | 735.4 | 895.1 |
2.3. Transformation of the Wave Energy in Enclosed Environments with Sea Waves
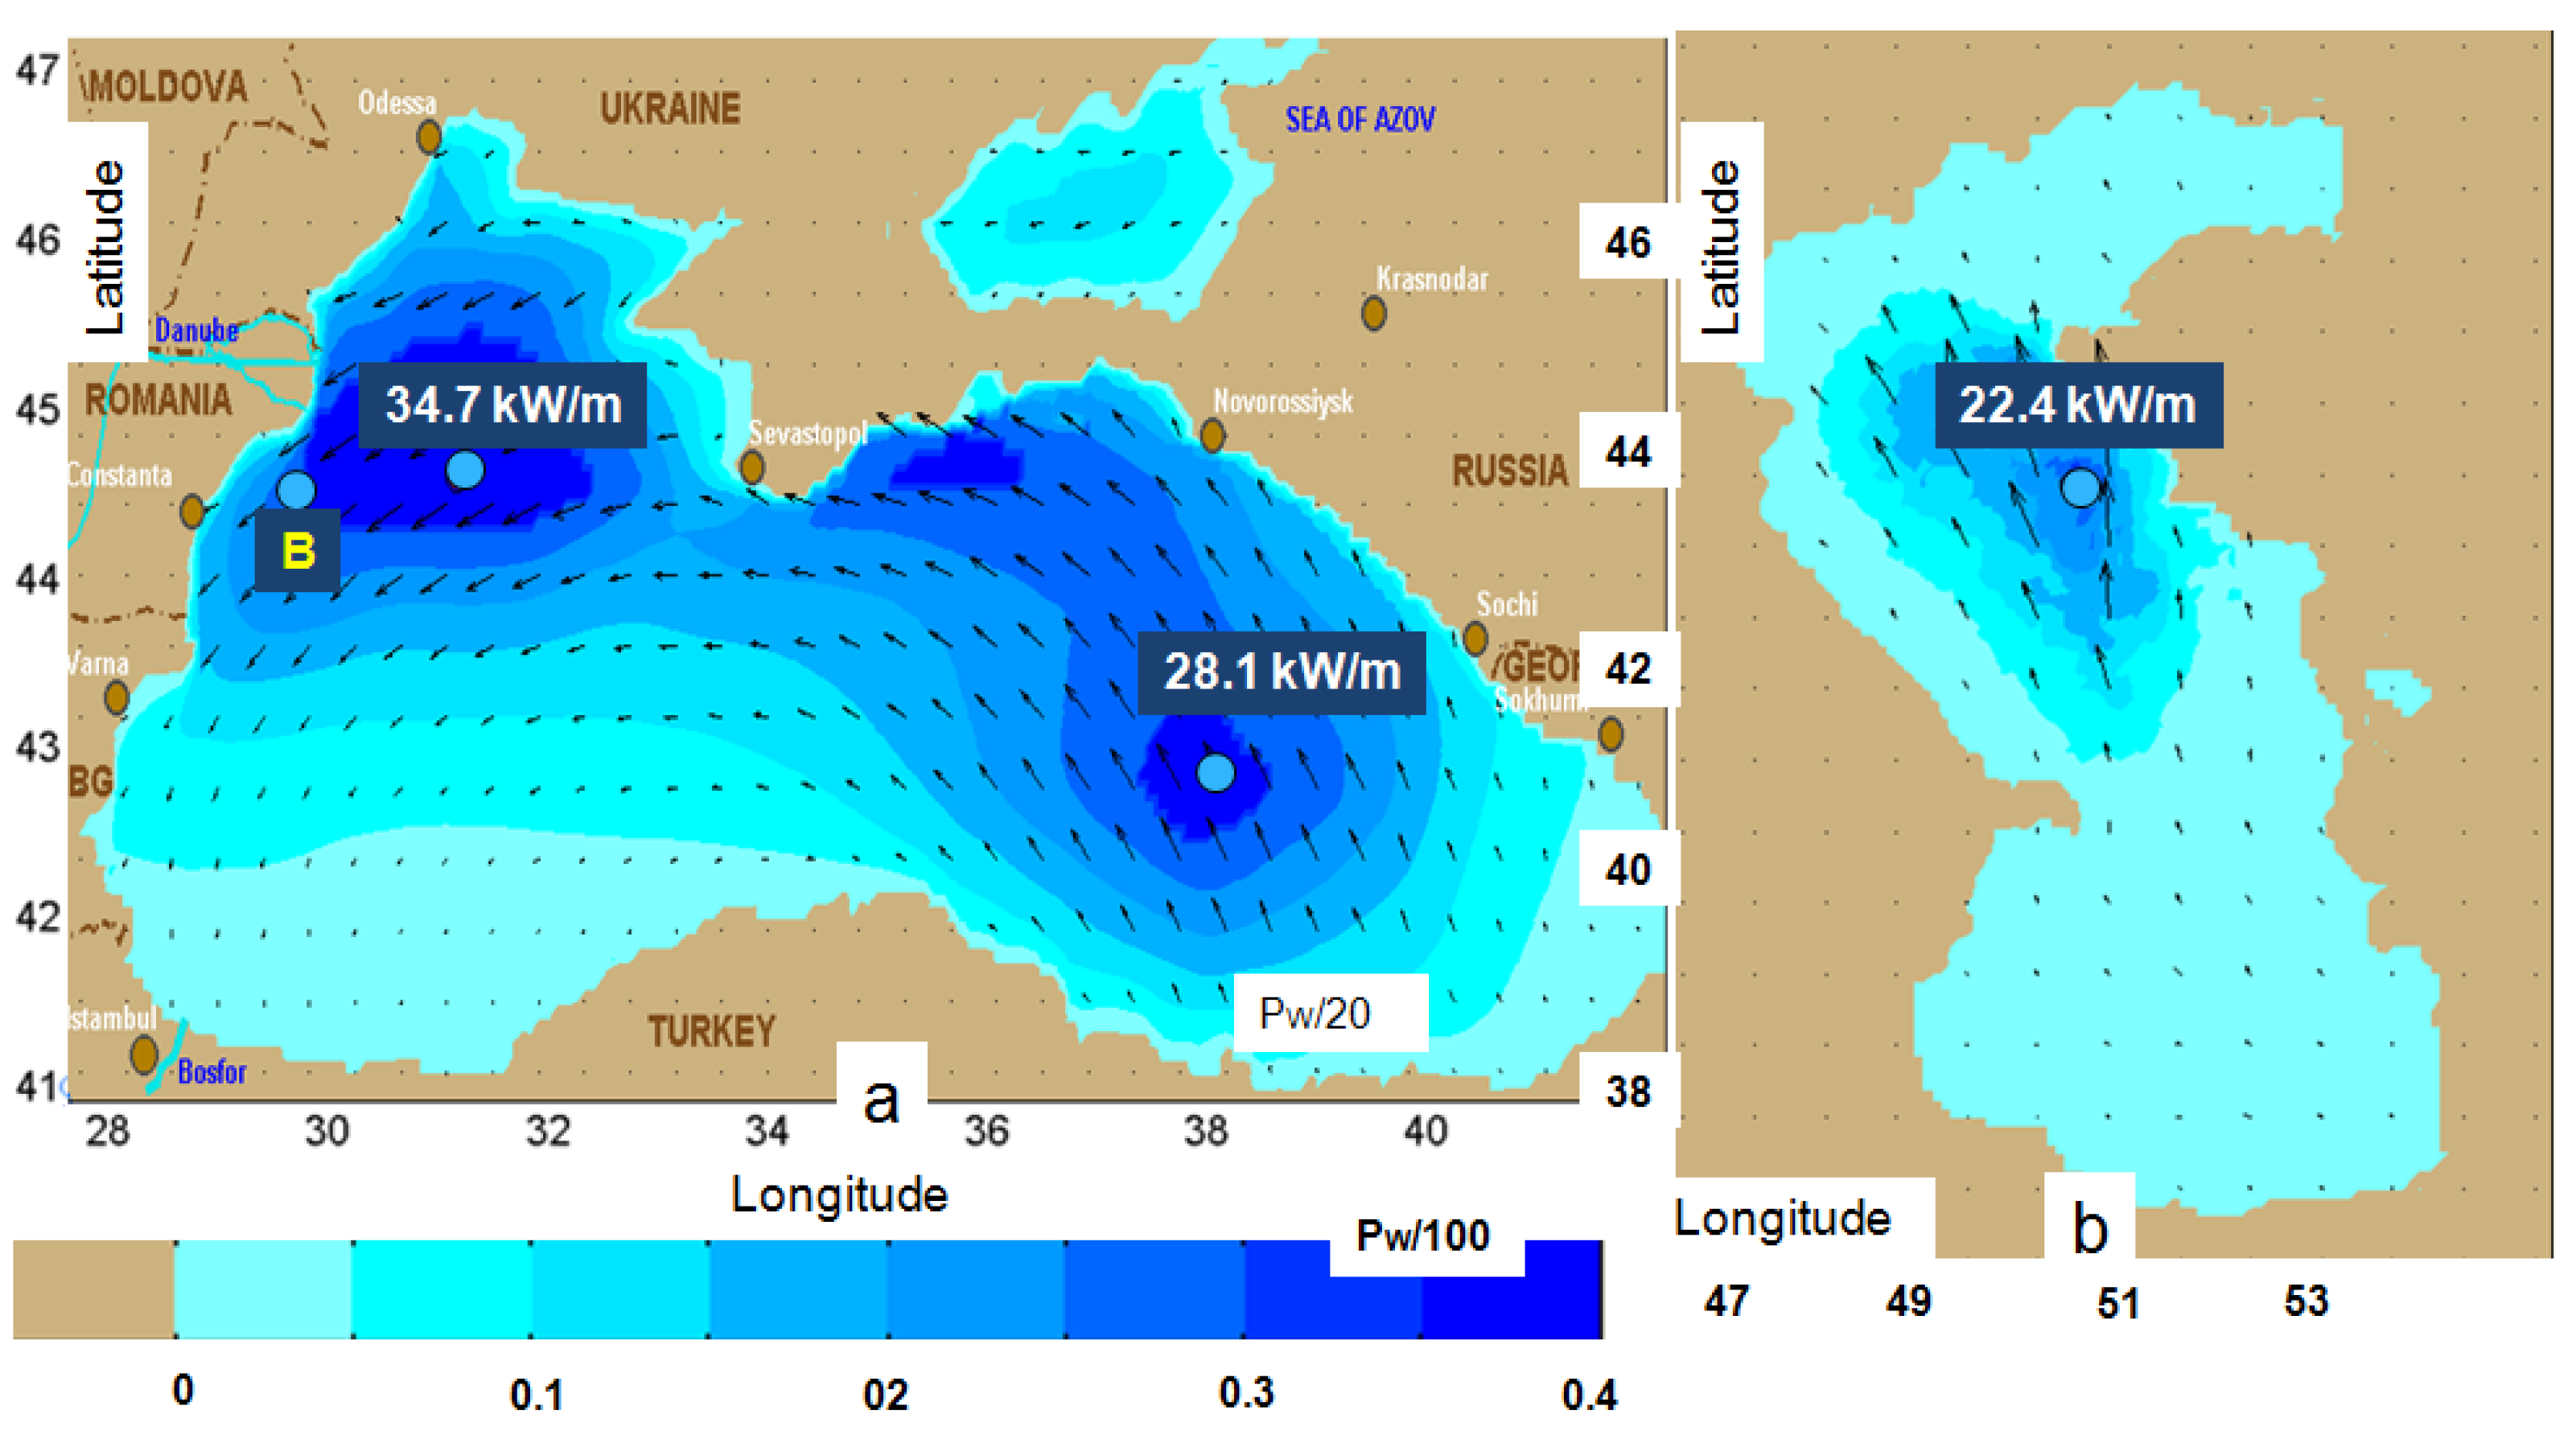
The next work direction is related to the study of the wave energy potential in enclosed environments with sea waves and a representative case is given by two enclosed seas, the Black and the Caspian. Additionally, the North Sea can be also considered relevant since some wind farms are already operational there and where some wave farms might be expected in the near future. The wave climate and energy in the Black Sea was studied by various authors considering a modeling system SWAN based [31]. Following the above results, Figure 4a illustrates the distribution of the mean relative wave power in the Black Sea (divided by 100 kW) as a result of a SWAN simulation corresponding to the time frame 1997/01/18/h12 and reflecting average energetic conditions.
The position of the reference point (B-point) is also represented. Figure 4b illustrates a relevant pattern concerning the distribution of the mean relative wave power in the Caspian Sea, as a result of SWAN simulation corresponding to the time frame 2009/10/02/h18, winter average energy conditions [32]. As Figure 4b shows, the Caspian sea is in general poor in terms of wave energy with the exception of the center of the sea (located in deep water) where some energy concentration occurs. As regards the Black Sea, the western side is more energetic. Table 8 presents the expected electric power (from the wave converters Pelamis, Aqua Buoy and Wave Dragon) for two reference points B, in the Black Sea, corresponding to the location of the Gloria drilling unit (44°31′N; 29°34′E), and F, in the North Sea at the location Fino1 (54°1′N; 6°35′E) where a wind farm already operates [33]. In both places wave measurements are available for the time interval 2003–2009.
Figure 4.
(a) Distribution of the mean relative wave power in the Black Sea (SWAN simulation corresponding to the time frame 1997/01/18/h12, average energetic conditions) and the position of the reference point (B-point); (b) Distribution of the mean relative wave power in the Caspian Sea (SWAN simulation corresponding to the time frame 2009/10/02/h18, winter average energy conditions).

2.4. Discussion
Eleven different wave energy converters were evaluated in the present work considering the specific wave conditions from various coastal environments. At this point, the discussion will be focused on three devices that were found from various points of view more appropriate in many coastal environments. These are: Aqua Buoy, Pelamis and Wave Dragon. Figure 5a–c illustrates the range of the electric power expected from these devices in the coastal environments studied. As the results presented in the figure show, the electric power expected from a certain device varies in a relatively wide range depending on the location and also on the season (TT or WT). Thus, for Aqua Buoy this range is from 12 kW (TT) in the Black Sea to 52 kW (WT) in the Portuguese nearshore (with the observation that this device was not evaluated in the Spanish nearshore). For Pelamis, the range of the expected average electric power is from about 60 kW (TT) in the Black Sea to 159 kW (WT) in the Spanish coastal environment while as regards the Wave Dragon the variation is even higher in both relative and absolute terms starting from 391 kW (TT) in the Black Sea and reaching 2875 kW (WT) in the Spanish nearshore.
Besides the expected values of the electric power, two different indicators of the efficiency of wave energy transformation into electricity were also evaluated. The first is the load factor defined as the average power capture divided by the device rating:
I L = 100 ∙ PE / P nom
Figure 5.
Expected electric power in various coastal environments. (a) Aqua Buoy; (b) Pelamis; (c) Wave Dragon.
Figure 5.
Expected electric power in various coastal environments. (a) Aqua Buoy; (b) Pelamis; (c) Wave Dragon.

For the same three devices (Pelamis, Aqua Buoy and Wave Dragon) the average values of this index corresponding to the two extremes (the Spanish nearshore, which is the most energetic and the sea environment, which is the less energetic) are presented in Table 9. The results show that from this point of view the Wave Dragon appears to be the most effective device with a maximum value of the load factor of 48.7, in comparison with Pelamis for which the maximum value of this factor is only 21.1.
The second indicator evaluated is related to the energy capture and is often expressed as the “capture width” (CW). This represents the width of wave front from which all the energy is extracted and it is computed as the ratio of electrical power output of the WECSs (PE) to the power in the sea state (PW). The wave power has units of kW/m and the power output of the WECs has units of kW so the ratio has dimensions of “length”, and it is called “capture length” or “capture width” [11]:
CW = PE / PW
Table 9.
Average values of the load factor in the Spanish nearshore and in sea environment (the Black and the North seas). The WECs considered are: Pelamis, Aqua Buoy and Wave Dragon.
| IL (%) Location/Period | Pelamis | Aqua Buoy | Wave Dragon | |||
|---|---|---|---|---|---|---|
| TT | WT | TT | WT | TT | WT | |
| Spanish Nearshore | 15.2–16.9 | 19.3–21.1 | - | - | 34.5–37.3 | 45.2–48.7 |
| Sea Environment | - | 11.9–13.07 | - | 8.4–9.5 | - | 8.2–2.78 |
The evaluation of such an index might be also relevant because it can provide a comprehensive picture of the efficiency of different WECs in various sites. Its average values for the same three WECs considered for the comparisons are presented in Table 10.
Table 10.
Average values of the capture width Cw (m) in the Iberian nearshore (Spanish and Portuguese) and in Madeira archipelago. The WECs considered are Pelamis, Aqua Buoy and Wave Dragon.
| Cw (m) Location/Period | Pelamis | Aqua Buoy | Wave Dragon | |||
|---|---|---|---|---|---|---|
| TT | WT | TT | WT | TT | WT | |
| Spanish Nearshore | 3.98–4.13 | 2.80–2.93 | - | - | 69.42–73.05 | 51.0–53.77 |
| Portuguese Nearshore | 3.3–4.2 | 3.0–3.7 | 1.2–1.5 | 1.1–1.4 | 33.1–39.2 | 32.0–38.0 |
| Madeira Archipelago | - | 1.61–2.62 | - | 0.77–0.78 | - | 22.28–25.14 |
It has to be also highlighted that, although it is not very meaningful to compare this index from one device to another, by comparing its values coming from the same device in various coastal environments (or even in different locations from the same area), this can give a comprehensive picture of the power capture efficiency in certain area for a certain device. Nevertheless, the range of variation of this index is also quite large from one environment to another. Thus, for Wave Dragon the average values of the capture width (corresponding to the time intervals considered) are between 22.28 and 73.05, for Pelamis between 1.61 and 4.2, while for Aqua Buoy the range is (0.78–1.5).
Another observation, coming from the analysis of the results presented in Table 10, would be that the values of this index are lower for WT in comparison with TT, which means that, although in winter time the wave energy is higher, the efficiency of its transformation into electricity is lower. This behavior might be explained through the fact that in winter the wave energy is more scattered along the sea states.
The work is still ongoing and some other types of wave energy converters are now being evaluated. From this perspective, the Seawave-Slot Cone Generator (SSG) is also under consideration taking into account the intense research that is currently done on its hydraulic response [34,35]. Finally, there have to be also noticed the excelent performances of the Wave Dragon, in all the coastal environments where this device was evaluated. From this perspective, it has to be considered in the future studies that the Wave Dragon, as a deepwater floating offshore WEC, similarly moored through slack chains as for example Pelamis, appears to be also suitable for the conditions of the Canary Islands (where this device was not evaluated in the framework of the present work) as well as for the typical island environment, in general.
3. Conclusions
The present work provides some information about the wave conditions and the efficiency of the wave energy transformations in three different types of coastal environment: continental coasts of the ocean (the western Iberian nearshore), island environment (Canary Island and Madeira Archipelago) and sea environment (Black, Caspian and North seas). More types of WECs were evaluated covering a large range from the existent nearshore and offshore devices. Nevertheless, it has to be highlighted also that for the sake of generality, the sizes of the devices were considered the same at all locations and the park effect was not accounted for. Apart from forming arrays, some of WECs might be scalable in size function of the wave climate particularities, which could be crucial in performance optimization and economic viability of the deployment. However these aspects were not considered in the present study, as also the influence of the wave direction on the power caption of different devices.
The results show that only the evaluation of the wave energy in a certain location is not enough and even more important is in fact the correlation between the power matrix of a WEC and the scatter diagram that gives the bivariate distribution of the sea states specific to the coastal area where the WEC is going to operate. From this perspective, although the number one design consideration for the WEC manufacturers is still represented by the survival issues, a future research direction to be taken into consideration would be to design converters with adjustable power matrices in order to fit better the environmental conditions from the locations where they will be installed and to increase in this way the efficiency of the wave energy transformation into electricity. On the other hand, if such a variable dynamics would blow the cost away and increase the risk of failure the alternative solution remains to select the most effective device from the point of view of the correspondence between its power matrix and the expected distribution of the sea states from a certain location. It has to be also mentioned that, although yet with some limits, active control strategies are already widely researched and employed in their practical effect of “adjusting” the power matrix.
Finally, as regards the sea environment, although it becomes quite obvious that most of the existing WEC devices are designed especially for the oceanic coastal environment, where the waves are more powerful and the wave periods are larger, the issue of the wave energy cannot be completely ignored, at least from the perspective of the hybrid wind-wave projects.
Acknowledgments
This work was supported by a grant from the Romanian Ministry of National Education, CNCS—UEFISCDI (Romanian National Research Council—Executive Agency for Higher Education, Research, Development and Innovation Funding), project number PN-II-ID-PCE-2012-4-0089 (project DAMWAVE). The author would like also to express his gratitude to the reviewers for their suggestions and observations that helped in improving the present work.
Conflicts of Interest
The author declares no conflict of interest.
References
- Nielsen, K. Ocean Energy Technology Study; Technical Report No.1 for the Alliance for Offshore Renewables; Danish Wave Energy Center: Hanstholm, Danmark, 2012. [Google Scholar]
- European Commission. Energy Roadmap 2050; European Commission: Brussels, Belgium, 2011; p. 885. [Google Scholar]
- European Commission. Technology Map of the SET-Plan; European Commission: Brussels, Belgium, 2011; p. 24979. [Google Scholar]
- OCEANTEC—Desarrollo Tecnologico de un Sistema de Aprovechamiento de la Energia de las olas. Available online: http://www.bizkaia.net/Home2/Archivos/DPTO8/Temas/Pdf/Ekin_Eus_2005/16-2005.pdf (accessed on 18 June 2014).
- Henderson, R. Design, simulation, and testing of a novel hydraulic power take-off system for the Pelamis wave energy converter. Energy 2006, 31, 271–283. [Google Scholar]
- Babarit, A.; Hals, J.; Muliawan, M.J.; Kurniawan, A.; Moan, T.; Krokstad, J. Numerical benchmarking study of a selection of wave energy converters. Renew. Energy 2012, 41, 44–63. [Google Scholar]
- Kofoed, J.P.; Frigaard, P.; Friis-Madsen, E.; Sørensen, H.C. Prototype testing of the wave energy converter Wave Dragon. Energy 2006, 31, 181–189. [Google Scholar]
- Weinstein, A.; Fredrikson, G.; Parks, M.J.; Neislen, K. AquaBuOY—The offshore wave energy converter: Numerical modeling and optimization. In Proceedings of the Oceans ’04 MTS/IEEE Techno-Ocean’04, Kobe, Japan, 9–12 November 2004.
- Variability of UK Marine Resources; Environmental Change Institute: Oxford, UK, 2005.
- LaBonte, A.; O’Connor, P.; Fitzpatrick, C.; Hallett, K.; Li, Y. Standardized cost and performance reporting for marine and hydrokinetic technologies. In Proceedings of the 1st Marine Energy Technology Symposium (METS13), Washington, DC, USA, 10–11 April 2013.
- EMEC. The European Marine Energy Centre 2009. In Assessment of Wave Energy Resource; The European Marine Energy Centre Ltd.: Stromness, Orkney, UK, 2009; Volume 36. [Google Scholar]
- Waters, R.; Engstrom, J.; Isberg, J.; Leijon, M. Wave climate off the Swedish west coast. Renew. Energy 2009, 34, 1600–1606. [Google Scholar] [CrossRef]
- Carballo, R.; Iglesias, G. A methodology to determine the power performance of wave energy converters at a particular coastal location. Energy Convers. Manag. 2012, 61, 8–18. [Google Scholar] [CrossRef]
- Silva, D.; Rusu, E.; Guedes Soares, C. Evaluation of various technologies for wave energy conversion in the portuguese nearshore. Energies 2013, 6, 1344–1364. [Google Scholar] [CrossRef]
- Rusu, E.; Guedes Soares, C. Wave energy pattern around the Madeira islands. Energy 2012, 5, 771–785. [Google Scholar] [CrossRef]
- Iglesias, G.; Carballo, R. Wave farm impact: The role of farm-to-coast distance. Renew. Energy 2014, 69, 375–385. [Google Scholar] [CrossRef]
- Iglesias, G.; Carballo, R. Offshore and inshore wave energy assessment: Asturias (N Spain). Energy 2010, 35, 1964–1972. [Google Scholar] [CrossRef]
- Iglesias, G.; Carballo, R. Wave energy potential along the death coast (Spain). Energy 2009, 34, 1963–1975. [Google Scholar] [CrossRef]
- Iglesias, G.; Carballo, R. Wave energy resource in the Estaca de Bares area (Spain). Renew. Energy 2010, 35, 1574–8154. [Google Scholar] [CrossRef]
- Carballo, R.; Sánchez, M.; Ramos, V.; Taveira-Pinto, F.; Iglesias, G. A high resolution geospatial database for wave energy exploitation. Energy 2014, 68, 572–583. [Google Scholar] [CrossRef]
- WAMDI Group. The WAM model—A third generation ocean wave prediction model. J. Phys. Oceanogr. 1988, 18, 1775–1810. [Google Scholar] [CrossRef]
- Booij, N.; Ris, R.C.; Holthuijsen, L.H. A third-generation wave model for coastal regions. I—Model description and validation. J. Geophys. Res. 1999, 104, 7649–7666. [Google Scholar] [CrossRef]
- Rusu, E.; Ventura Soares, C.; Rusu, L. Computational strategies and visualization techniques for the waves modeling in the portuguese nearshore. In Maritime Transportation and Exploitation of Ocean and Coastal Resources; Taylor & Francis Publications: London, UK, 2006; pp. 1129–1136. [Google Scholar]
- Morales Vaquero, A.; Castro Ruiz, F.; Rusu, E. Evaluation of the wave power potential in the northwestern side of the Iberian nearshore. In Developments in Maritime Transportation and Exploitation of Sea Resources—Guedes Soares & López Peña; Taylor & Francis Group: London, UK, 2014; pp. 1012–1019. [Google Scholar]
- Rusu, E.; Guedes Soares, C. Numerical modeling to estimate the spatial distribution of the wave energy in the Portuguese nearshore. Renew. Energy 2009, 34, 1501–1516. [Google Scholar] [CrossRef]
- Tolman, H.L. A third-generation model for wind waves on slowly varying, unsteady and inhomogeneous depths and currents. J. Phys. Oceanogr. 1991, 21, 782–797. [Google Scholar] [CrossRef]
- Molina Andres, O.; Castro Ruiz, F.; Rusu, L. Efficiency assessments for different WEC types in the Canary Islands. In Developments in Maritime Transportation and Exploitation of Sea Resources—Guedes Soares & López Peña; Taylor & Francis Group: London, UK, 2014; pp. 879–887. [Google Scholar]
- Rusu, L.; Guedes Soares, C. Wave energy assessments in the Azores islands. Renew. Energy 2012, 45, 183–196. [Google Scholar] [CrossRef]
- Veigas, M.; Iglesias, G. ave and offshore wind potential for the island of Tenerife. Energy Convers. Manag. 2013, 76, 738–745. [Google Scholar] [CrossRef]
- Iglesias, G.; Carballo, R. Wave resource in El Hierro-an island towards energy self-sufficiency. Renew. Energy 2011, 36, 689–698. [Google Scholar] [CrossRef]
- Rusu, E. Wave energy assessments in the Black Sea. J. Mar. Sci. Technol. 2009, 14, 359–372. [Google Scholar] [CrossRef]
- Rusu, E.; Onea, F. Evaluation of the wind and wave energy along the Caspian Sea. Energy 2013, 50, 1–14. [Google Scholar] [CrossRef]
- Onea, F. Study Concerning the Opportunity of the Renewable Energy Extraction in Marine Environment with Application to the Black Sea Basin. Ph.D. Thesis, Dunarea de Jos University of Galati, Galaţi, Romania, 2013; p. 223. [Google Scholar]
- Vicinanza, D.; Margheritini, L.; Kofoed, J.P.; Buccino, M. The SSG wave energy converter: Performance, status and recent developments. Energies 2012, 5, 193–226. [Google Scholar] [CrossRef]
- Buccino, M.; Banfi, D.; Vicinanza, D.; Calabrese, M.; del Giudice, G.; Carravetta, A. Non breaking wave forces at the front face of seawave slotcone generators. Energies 2012, 5, 4779–4803. [Google Scholar] [CrossRef]
© 2014 by the authors; licensee MDPI, Basel, Switzerland. This article is an open access article distributed under the terms and conditions of the Creative Commons Attribution license (http://creativecommons.org/licenses/by/3.0/).
Share and Cite
MDPI and ACS Style
Rusu, E. Evaluation of the Wave Energy Conversion Efficiency in Various Coastal Environments. Energies 2014, 7, 4002-4018. https://doi.org/10.3390/en7064002
AMA Style
Rusu E. Evaluation of the Wave Energy Conversion Efficiency in Various Coastal Environments. Energies. 2014; 7(6):4002-4018. https://doi.org/10.3390/en7064002
Chicago/Turabian StyleRusu, Eugen. 2014. "Evaluation of the Wave Energy Conversion Efficiency in Various Coastal Environments" Energies 7, no. 6: 4002-4018. https://doi.org/10.3390/en7064002