Optimizing the Design of Small Fast Spectrum Battery-Type Nuclear Reactors

Department of Physics and Astronomy, Uppsala University, Ångström Lab, Lägerhyddsvägen 1, Uppsala 752 37, Sweden
Energies 2014, 7(8), 4910-4937; https://doi.org/10.3390/en7084910
Submission received: 3 June 2014
/
Revised: 7 July 2014
/
Accepted: 18 July 2014
/
Published: 31 July 2014
(This article belongs to the Special Issue Advances in Nuclear Reactor and Fuel Cycle Technologies)
Abstract
:This study is focused on defining and optimizing the design parameters of inherently safe “battery” type sodium-cooled metallic-fueled nuclear reactor cores that operate on a single stationary fuel loading at full power for 30 years. A total of 29 core designs were developed with varying power and flow conditions, including detailed thermal-hydraulic, structural-mechanical and neutronic analysis. Given set constraints for irradiation damage, primary cycle pressure drop and inherent safety considerations, the attainable power range and performance characteristics of the systems are defined. The optimum power level for a core with a coolant pressure drop limit of 100 kPa and an irradiation damage limit of 200 DPA (displacements per atom) is found to be 100 MWt/40 MWe. Raising the power level of an optimized core gives significantly higher attainable power densities and burnup, but severely decreases safety margins and increases the irradiation damage. A fully optimized inherently safe battery-type fast reactor core with an active height and diameter of 150 cm (2.6 m3), a pressure drop limit of 100 kPa and an irradiation damage limit of 300 DPA can be designed to operate at 150 MWt/60 MWe for 30 years, reaching an average discharge burnup of 100 MWd/kg-actinide.
1. Introduction
A wide array of technology options for nuclear reactor systems exist, with the main parameters determining system characteristics being the physical size, power level, primary and secondary coolant and type of fuel. The dominant reactor technology in the world today is large high-power reactors that are cooled and moderated by water (light or heavy) using uranium oxide fuel, producing electricity using a steam cycle. Recently, much of the focus of commercial reactor vendors and national programs has switched to the development of Small Modular (thermal) Reactors (SMR). There are currently ~10 small thermal modular reactor concepts with capacities below 300 MWe in well-advanced stages of development. The SMRs offer unique advantages such as the ability to manufacture and potentially mass-produce reactor units in factories rather than on-site. There are several additional advantages with SMR-type technology, which include:
- ▪
- Enhanced safety features (robustness)
- ○
- Easier implementation of passive safety features
- ▪
- Suitable for isolated or small electrical grids
- ▪
- Lower capital cost per unit
- ○
- Small initial investment and short construction period reduces financial riskssafety features
- ○
- Makes nuclear energy feasible for more utilities and energy suppliers
- ▪
- Short construction time
- ○
- Improved economics and reduced financial risk
- ▪
- Improved quality control and modular construction
- ▪
- Just-in-time capacity addition
- ○
- Enable gradual capacity increase to meet electric demand growth
- ▪
- Multi-purpose application (co-generation flexibilities)
- ▪
- Appropriate size to replace retiring fossil plants and use portions of the existing plant and facilities
A single SMR unit may not be able to compete economically with a large plant, since many of the same systems need to be in place while the SMR produces only a fraction of the power. However, with co-location of multiple SMR units and efficient standardized factory manufacturing of all major components, there is great potential that SMRs could radically reduce the cost of nuclear power. The Airbus A-380 is the largest available passenger airliner and is comparable in size, technical complexity and regulatory demands to an SMR; factories can produce it at a rate of about one unit every 8–9 days.
While thermal SMRs (where most of the fissions are induced by low energy neutrons) may have economic and safety potential, they are still subject to the technological limitations inherent in all solid-fuel thermal nuclear systems, which is the poor utilization of fuel resources. A thermal reactor (small or large) is able to extract a mere ~0.6% of the potential fission energy of the mined uranium. With highly complex and expensive reprocessing to produce mixed oxide (UO2-PuO2) fuel from used fuel, this number can be increased up to ~0.9%. In contrast, a fast system (most of the fissions are induced by high energy neutrons) is in principle able to utilize the full energy potential of the fuel resource, minus inevitable inefficiency losses in reprocessing units. A small modular fast reactor (SMFR) system can combine the superior fuel utilization potential of a fast system with the economic potential of modular design methods. Due to their capability to breed their own fuel during operation, SMFRs can run on the initial fuel load for several decades, compared to the 18–24 month cycle of thermal systems.
The objective of this study is to combine existing and novel principles and ideas to develop an optimized pre-conceptual design of a new SMFR “battery” type reactor core that operates continuously on a single static fuel loading for 30 years. Existing nuclear battery concepts, from which many of the ideas of this study are based or inspired, include the ENHS (Encapsulated Nuclear Hear Source) [1], ARC-100 (Advanced Reactor Concepts-100) [2], AFR-100 (Advanced Fast Reactor-100) [3], SMFR (Small Modular Fast Reactor) [4], PEACER (Proliferation-resistant, Environment-friendly, Accident-tolerant, Continual and Economical Reactor) [5], Toshiba 4S (Super-Safe, Small and Simple) [6] and S-STAR (Secure, Transportable, Autonomous Reactor) [7].
Section 2 summarizes the basis for the core design study, including general design choices and the layout of the core. Section 3 defines the constraints and limits applied to design parameters and components. Section 4 explains the general design methodology and presents the codes and tools used in the study. In Section 5, the results of the parametric study for parameters such as core size, power density, burnup and reactivity swing are presented. Section 6 presents the reactivity feedback coefficients, which are used for safety analysis using the quasi-static reactivity balance method in Section 7. Conclusions and future work is summarized in Section 8.
2. Core Materials, General Design Choices and Layout
2.1. Summary of General Design Parameters
A number of general design parameters have been set and are not subjected to parametric studies. This is partly to limit the scope of the study but also because some design parameters are estimated a priori to give optimal core performance. These design choices are summarized in Table 1 and their motivations are discussed in the following subsections.

| Parameter | Value | |
|---|---|---|
| Fuel type | Annular metallic uranium alloy with 2 wt% Zr, 75% smear density | |
| Primary coolant | Sodium | |
| Plant layout | Pool-type | |
| Structure (Cladding, Wire, Duct, Reflector pin) | HT9 steel | |
| Absorber (shield, control system) | B4C | |
| Full power years of operation | 30 (33.3 years at 90% capacity factor) | |
| Coolant friction pressure loss in the primary cycle outside of the core | 17% of total (assumed) | |
| Coolant inlet and average outlet temperature | 355–510 °C (ΔTco = 155 °C) | |
| Fuel rods per fuel assembly | 169 | |
| Rod spacing | Wrapped wires with a pitch (pitch: the axial length of a 360° revolution around the pin) 25 times that of the outer diameter of the rod | |
| Fission gas plenum | Fission gas venting through 40 cm plenum (regardless of fuel length) | |
| Active core shape | Height = Equivalent diameter | |
| Assembly duct wall thickness | 2.5 mm | |
| Inter-assembly gap per assembly | 2.0 mm | |
| Cladding thickness ratio (CTR) The thickness of the cladding (Ct) is calculated as Ct = CTR × D, where D is the outer fuel rod diameter | 0.05 | |
| # of assemblies | Fuel | 48 |
| Control elements | 9 burnup reactivity control elements and 4 emergency shut down (SCRAM) elements | |
| Radial reflector | 24 | |
| Radial shield | 36 | |
2.2. Choice of Coolant
To achieve the conversion ratio required to keep the reactivity swing to a minimum and enable the discharged fuel to be remanufactured in to a new core without adding extra fissile material, a hard neutron spectrum is required. The choice of coolant is thus limited to low-moderation fast reactor coolant options such as a liquid metals or a gas. The option of a gaseous coolant was rejected due to the safety implications of a potential leak in the high-pressure coolant system. The choice between lead (or lead-bismuth eutectic) and sodium as the primary coolant for this application is in no way obvious. It was decided to limit this study to systems cooled by sodium, which is a more mature technology and which allows for a higher volumetric power density. Future studies, particularly those focusing on natural circulation cooled systems, will include lead or lead-bismuth eutectic as options for the primary coolant.
2.3. Fuel, Fuel Rod and Assembly Geometry
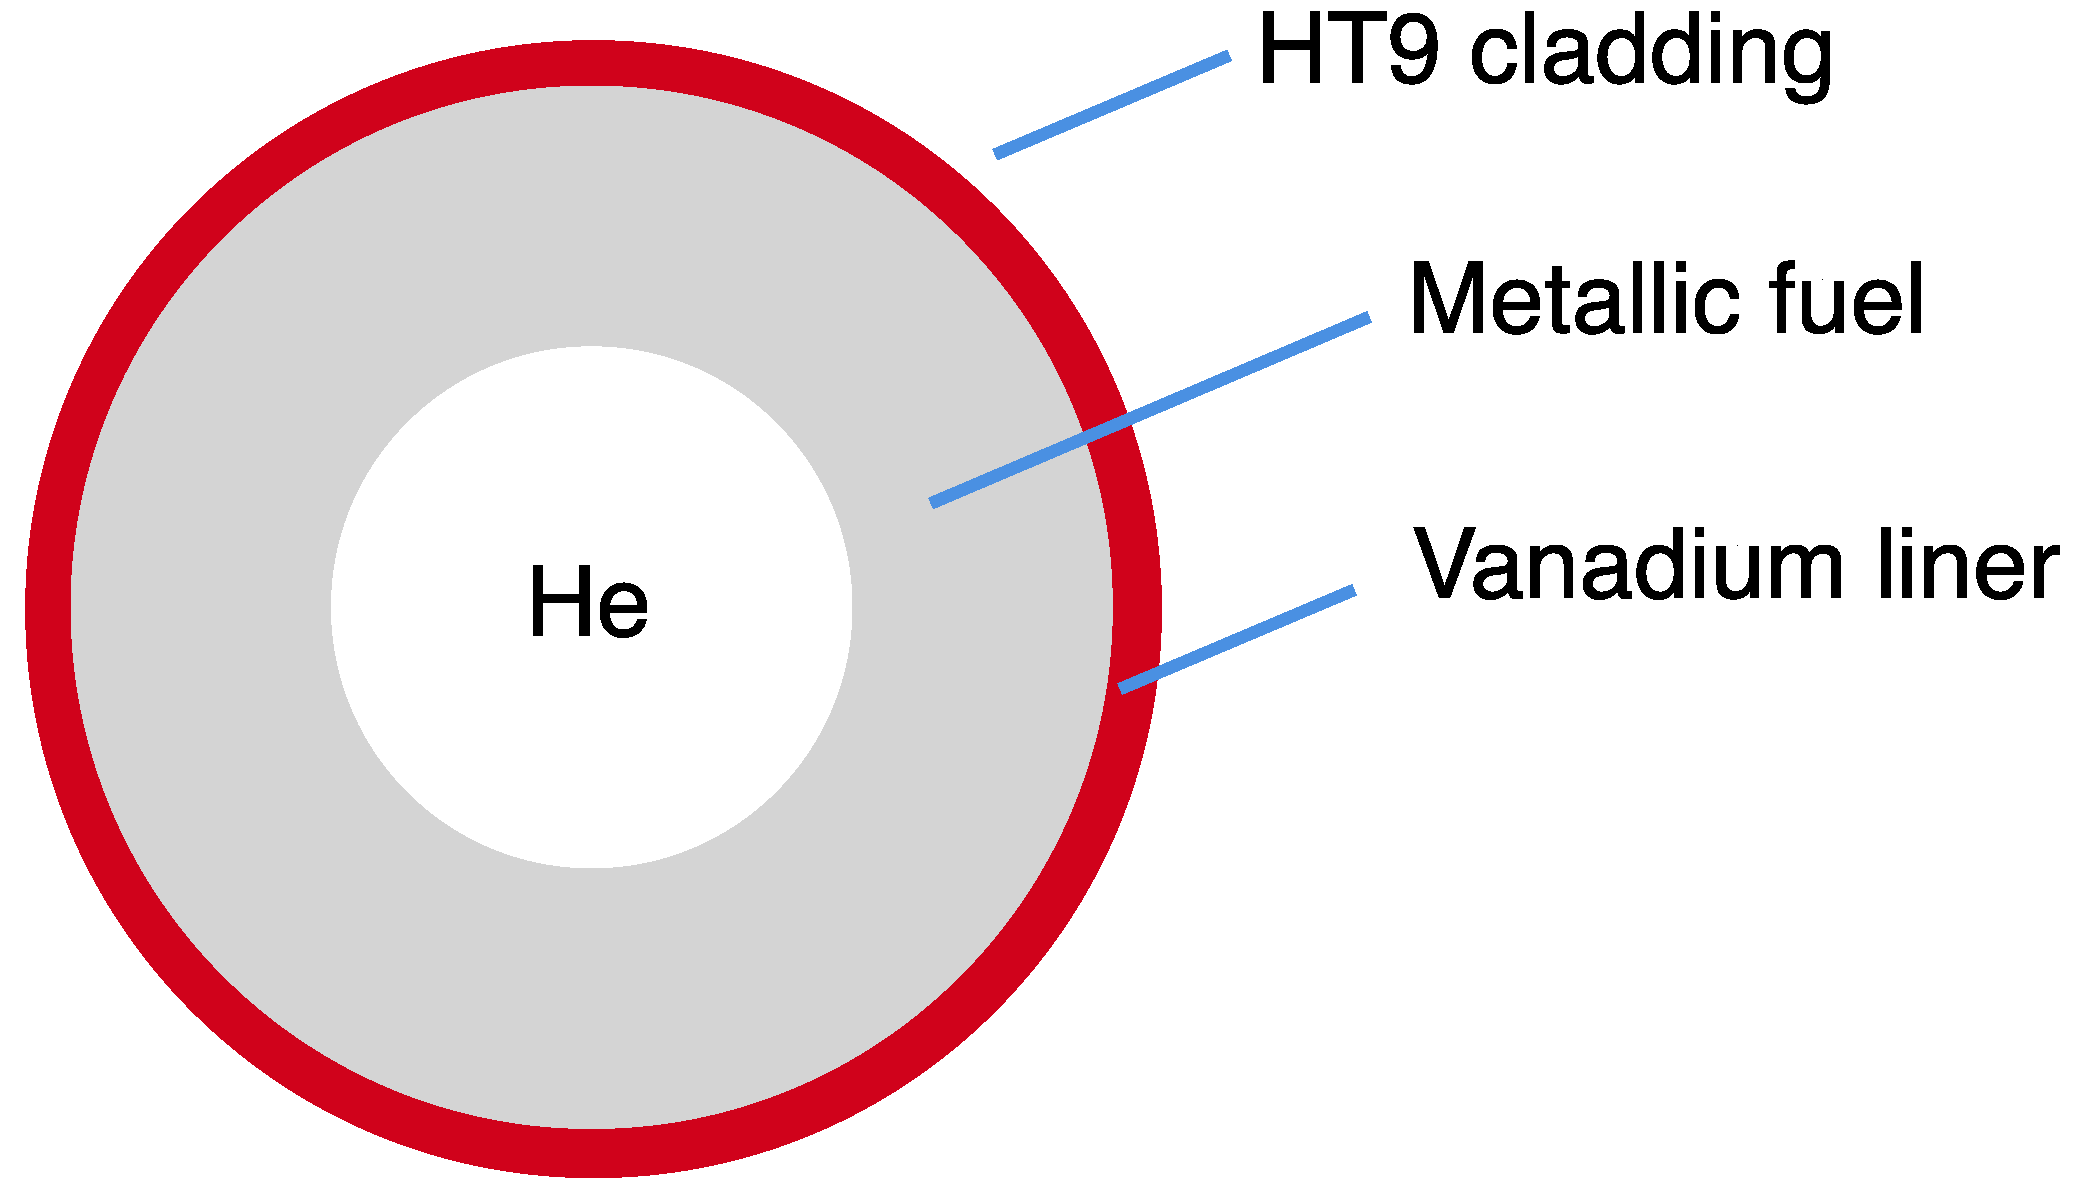
All else being equal, maximizing the actinide density maximizes the neutron economy of a fast reactor core of a given volume. Metallic fuel offers the highest actinide density of any available fuel alternative, even when alloyed with 10 wt% zirconium. Since long-life cores operate at low power density, peak fuel temperatures are low which allows for a reduction in the fuel solidus temperature and a smaller Zr-alloying component weight fraction. A reduction of the Zr-component from 10% to 2% in the fuel enables an 18% increase in the fuel density, from 15.85 to 18.74 g/cm3 at 500 °C, while reducing the solidus temperature from ~1200 °C to ~1100 °C [8]. Instead of primarily relying on the fuel-alloy zirconium-content as a diffusion barrier to avoid fuel/cladding chemical interaction (FCCI), the inner surface of the cladding steel is coated with a 30 μm thick vanadium liner [9].
To avoid the use of a liquid bond material and potentially limit axial fuel swelling, the fuel rod is designed as an annulus rather than the shape of a conventional solid cylinder. While the rod design allows for up to 10% axial swelling of the fuel, it is expected that the radial mechanical contact with the cladding steel will limit axial swelling to a only a fraction of this value. Limiting axial swelling improves the neutron economy and simplifies reactivity control of the core. Upcoming irradiation campaigns of “mechanically bonded” metallic fuel in the Indian Fast Breeder Test Reactor (FBTR) will make it possible to more clearly estimate the axial growth of this type of fuel [10]. The reference fuel rod design is shown from above and from the side in Figure 1 and Figure 2 respectively. A similar type of fuel was manufactured by Argonne National Laboratory in the early 1960s and was tested in the EBR-1 reactor [11].
Figure 1.
To-scale model of the fuel rod with 75% fuel smear density as seen from above.

Figure 2.
Fuel rod as seen from the side (not to scale).

To minimize the stress induced in the cladding from gaseous fission products and reduce the overall length of the pin, a 40-cm DISCA-type diving bell fission gas venting device is installed at the top of each pin. This allows for venting of gaseous fission products into the coolant and a continuous depressurization of the rod. No specific design was worked out for the venting device; its preliminary length estimate is conservatively based on the data presented in Martini and Gerosa [12]. Since the metallic fuel form is chemically compatible with the coolant (in contrast to the ceramic fuel for which the DISCA concept was developed) there may be substantial room for optimizing the fission-gas venting device—this will be a topic of future studies.
2.4. Core Layout
In theory, the most neutronically efficient shape of a volume containing fissile material is a sphere, since this geometric shape minimizes the surface to volume ratio and thus minimizes the loss of neutrons. Since it is not practical from an engineering perspective to design a (controlled) nuclear core as a sphere or spheroid shape, the preferred shape considering both engineering and neutron economy is that of a cylinder with equal height and diameter. A core made up of a lattice of hexagonal assemblies can be designed to approximate a circular shape by removing assemblies at the corners of the hexagonal lattice. The number of fuel assemblies in a core of this shape with symmetrical rings of burnup control and SCRAM assemblies (where the central assembly is not a fuel assembly) is given by [13]:
where n is the number of hexagonal rings of fuel assemblies and N is the number of non-fuel (control, experimental etc.) assembly rings, excluding the central assembly
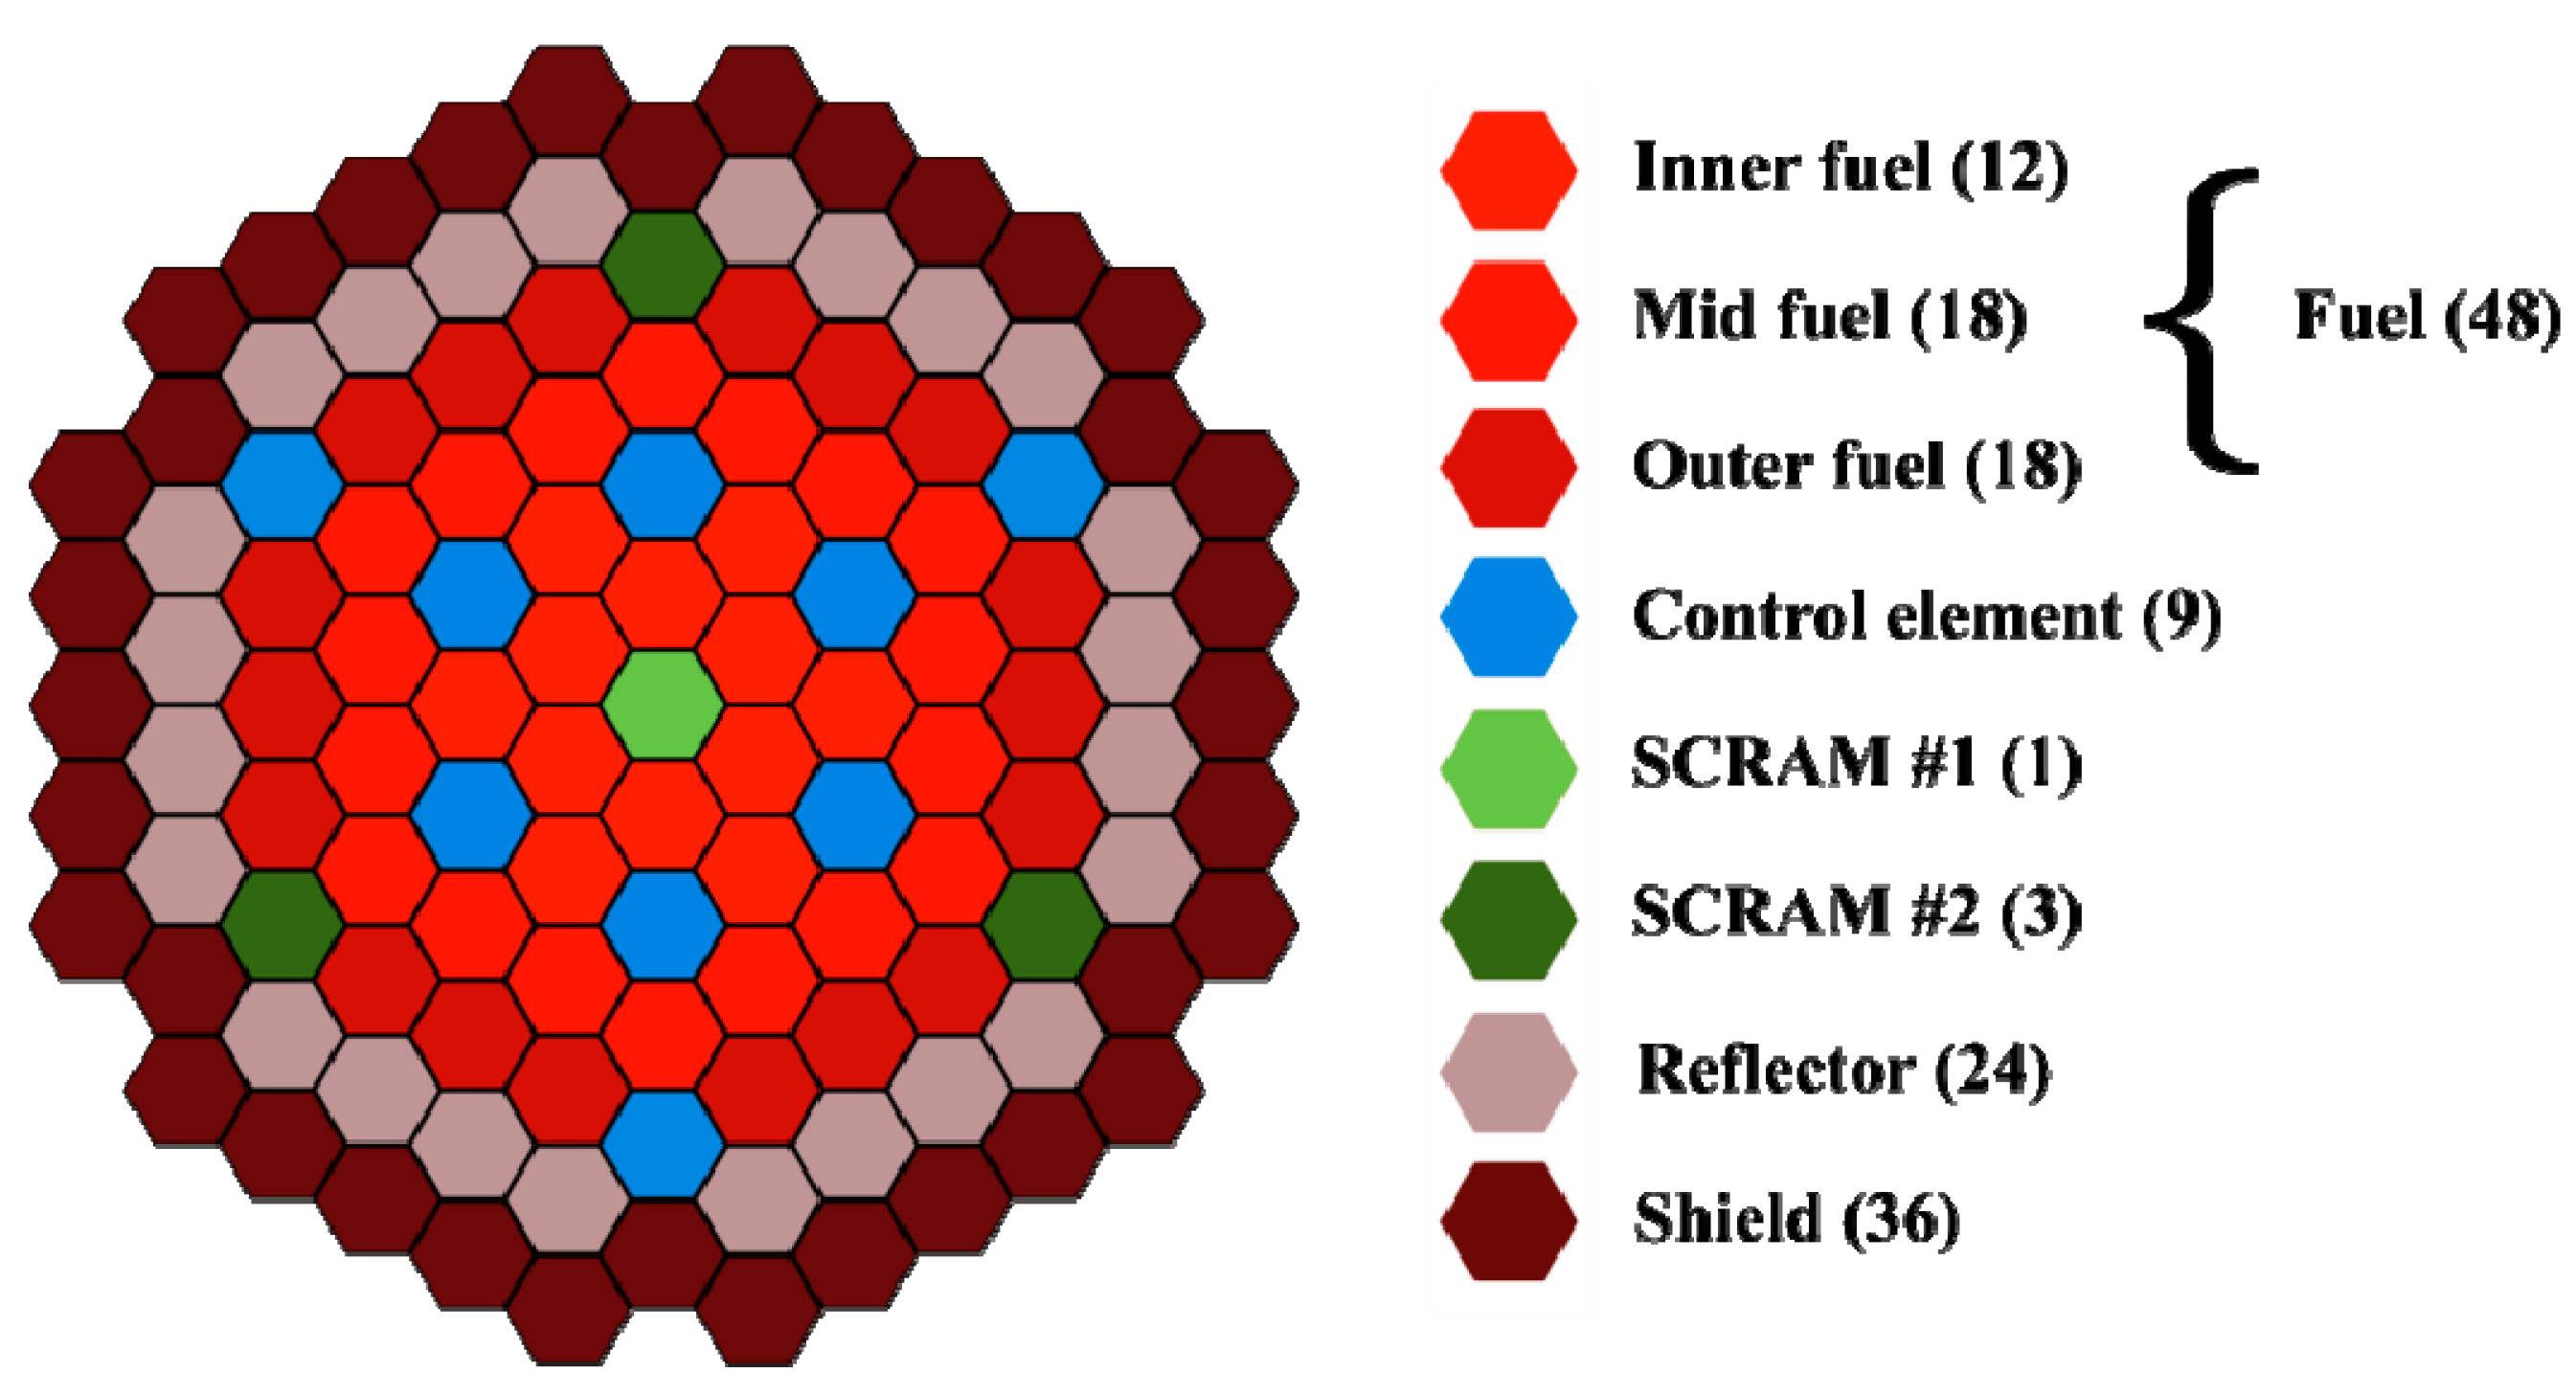
As will be shown in Section 5, Section 6 and Section 7, the range of possible power outputs from an optimized battery-type core operating for 30 years is quite limited. It was found that in this limited range of power and corresponding range of core volumes, a single core layout could be used for all cores analyzed. To change the size of the core, the width and height of individual assemblies were altered. The optimal numbers for n (the number of fuel assembly rows) and N (the number of in-core control assembly rows) were found to be 5 and 2 respectively, giving a total of 48 fuel assemblies and 13 control assemblies. As core power and size is varied, the width across the flats of the ducts of the fuel assemblies range in the span 16–25 cm, which is within the span typical of fast reactor designs [14]. Out of the 13 control assembly positions, 9 are dedicated to fine adjustment of reactivity (burnup reactivity swing, start-up and planned shut-down) and 1 + 3 are dedicated to two separate and redundant equal-reactivity SCRAM systems. Surrounding the core radially is one row of 24 reflector assemblies and beyond that one row of 36 shield assemblies. The complete layout of the 121 assemblies that make up the core is shown in Figure 3.
Figure 3.
Core assembly layout as seen from above.

The fuel assemblies have been subdivided in to three batches, which mark flow orificing zones. Radial enrichment zoning with higher feed-fuel fissile content in the outer radial zones (Mid fuel and Outer fuel of Figure 3) could ostensibly lead to a more optimized core by flattening the radial power profile. For very low levels of burnup, it is possible that such enrichment zoning can lead to better core performance, but this is likely not true for long-life cores with average discharge burnups exceeding the levels of current light water reactor (LWR) technology (>60 MWd/kg).
Moving power generation and neutron flux toward the periphery of the core increases the neutron leakage probability, which to some extent counteracts the performance gains from a flatter power distribution. More importantly for this application, radial enrichment zoning leads to severe problems with the coolant flow distribution over core life, which has a strong negative impact on the core design. In a core with a uniform level of enrichment that maintains a constant reactivity over core life, there is little change in the radial power distribution as burnup progresses [15]. Thus a full-cycle optimal flow distribution can be designed by tailoring flow orifices in the fuel assembly coolant inlet regions. In a core with radial enrichment zoning that maintains constant reactivity, the central zones will “over-breed” fissile material and gain in relative power, while the outer radial zones will be “burners” and decrease in relative power during core life. Since the flow distribution to each assembly must be dimensioned to keep temperatures below constraints at maximum local power, all assemblies are “overcooled” for most of the core life, which in every sense is far from optimal.
For this reason, along with the simplicity of a single fuel enrichment design, all cores developed in this study have uniform enrichment. Since the flow is distributed radially, axial enrichment zoning does not have any adverse affects on coolant flow distribution and should be included as a parameter in future studies.
3. Design Constraints
3.1. Summary of Core Design Constraints
The design constraints applied to these cores are summarized in Table 2 and discussed in the following subsections.
| Parameter | Value | |
|---|---|---|
| Thermal hydraulics | Primary loop pressure drop limit | 100 kPa (short vessel) 200 kPa (tall vessel) |
| Sodium flow velocity | <12 m/s | |
| Mechanical | Structural steel DPA limit | 200 (current knowledgebase) 300 (near-term realistic) 500 (optimistic) |
| Duct & cladding stress | <2/3 yield stress (σy) <1/3 ultimate tensile stress (σuts) | |
| Temperature | Fuel | 770 °C |
| Cladding | 560 °C | |
| Duct | ||
3.2. Thermal-Hydraulic Constraints
Design constraints related to primary coolant flow are fundamental to the core design, and often end up being the most important factors determining the geometric parameters of a low power-density system. The fundamental constraints associated with coolant flow are the mechanical limitations of the pump: allowable nozzle-to-nozzle pressure difference and the volumetric flow rate. For a single-stage mechanical impeller sodium pump, the pressure limitation has been reported as ~1.38 MPa (200 psi) [13]. Multi-stage impeller or electromechanical pumps will have other limits, but as will be shown, the mechanical limitations of the pumps (regardless of type) are of no practical importance. The peak flow rate limitation of a single pump is not an issue since it can be avoided by simply adding more pumps. The coolant flow velocity is indirectly limited by the pressure drop constraints, but also by concerns for corrosion, cavitation and mechanical vibration of core components. This limit is not precisely defined and depends on parameters such as system temperatures and the coolant oxygen concentration. However, a generally applied limitation on the peak flow velocity of sodium weighing in all these considerations is 12 m/s.
Compared to these fundamental constraints, tighter limitations are put in place based on safety considerations. An inherently safe core must be able to terminate the fission chain reaction and remove the residual decay heat without the use of active systems. This implies that the decay heat from the core should be removed at acceptable system temperatures by natural circulation. The buoyancy pressure (Pnc) developed by a difference in coolant density is given by [16]:
where g is the gravitational constant (9.82 m/s2), Hxc is the thermal center elevation between the core and the heat sink (m), and ρ is the density (kg/m3) of the coolant at the thermal centers.
Assuming that we want to establish a natural circulation flow at the chosen nominal coolant temperature range (355–510 °C), the pressure head for sodium as given by Equation (2) becomes Pnc = 358 Hxc. The friction pressure drop in the primary coolant loop is given by:
where X is a set of geometrical factors (of no importance for this discussion), fx is the friction factor and mx is the coolant mass flow rate.
Around 6% of the nominal mass flow rate is required to remove decay heat while approximately maintaining the same core coolant temperature rise right after the fission chain reaction has been terminated. Friction pressure drop scales by the square of the mass flow rate. The friction factor (fx) increases as a function of Reynolds number–at 6% of nominal mass flow rate; it can conservatively be assumed to be 2.5 times larger than at full-flow conditions [17]. Thus, the buoyancy pressure needed for natural circulation decay heat removal is ~0.9% that of full-power operating conditions. The required thermal center elevation can then be expressed as: Hxc = ΔPf (100% Flow)/40,000. This relation gives a scaling factor for the height of the reactor vessel as a function of full-flow coolant pressure drop. In addition, the coolant elevation difference between the hot and cold pool is directly dependent on the pressure developed by the pumps.
In order to keep the vessel height below 10 m (and thus in some sense qualify the reactor as “small”), the minimum required thermal center elevation should be kept below 5 m, which implies a pressure drop constraint of 200 kPa. A “short-vessel” option with a 100-kPa pressure drop constraint was chosen as the preferred option in this paper. At such a low pressure drop constraint, resulting flow velocities are so low that flow velocity constraint considerations are effectively not applicable.
3.3. Irradiation Damage Limits
The limit of neutron irradiation experience for fast reactor steels is a fast fluence of 3.9 × 10²³ n/cm2 (E > 0.1 MeV). This was achieved without excessive swelling or mechanical problems for HT9 steel in the Fast Flux Test Facility (FFTF) reactor. The corresponding number of displacements per atoms (DPA) was calculated to be ~208 [18]. Conservatively, 200 DPA or simply a fast fluence below 4 × 10²³ n/cm2 is most commonly used as the upper irradiation damage constraint in fast reactor design. More optimistically, TerraPower LLC is expecting optimized heats of HT9 steel to able to sustain up to 500–600 DPA of neutron irradiation damage [19]. Constraints of 200, 300 and 500 DPA were considered in this study, in order to show the impact the value of this constraint has on the performance and design of battery type cores.
3.4. Component Temperature and Stress Limits
The solidus temperature of U-2Zr fuel is ~1100 °C. Applying a 30% margin-to-melt at standard operation gives a peak allowable fuel temperature of 770 °C. The cladding and duct steel are limited to a peak temperature of 560 °C to limit the drop in mechanical strength. The steel stress limits are taken from the American Society of Mechanical Engineers (ASME) code [20].
4. Core Design Methodology
The core design and optimization process has been automated to a large degree by utilizing the full capabilities of the integrated ADOPT & Serpent code packages [21,22]. The ADOPT code takes a set of general input parameters and design constraints (as defined in Section 2 and Section 3) and analyzes and optimizes the core geometry by performing thermal-hydraulic and structural-mechanical calculations. Since ADOPT does not perform neutron transport calculations, it is coupled to the Serpent monte-carlo neutron transport code. ADOPT produces a full-detail Serpent input file describing the “optimized” core geometry and its materials, and then iteratively runs Serpent to update initial guesses and finally converge on the core power & flux distribution (which cannot be known a priori).
The ADOPT code methodology is built on the principle of “Constrained Nuclear Design” [13] to optimize the core design. Optimized here refers to a core design that pushes core performance to the limits of the thermal-hydraulic and structural-mechanical constraints that confine the design space. This means, for example, that the primary coolant velocity will be at precisely the value allowed by the velocity and pressure drop constraints, which will give the most efficient (optimized) heat removal capability, allowing the highest power density. In this way, an optimized design can be arrived at quickly for a single defined set of operational parameters and constraints, but the set parameters and constraints cannot themselves be subjected to optimization. Open parameters in this study are the core thermal power level, the pressure drop constraint and the irradiation damage constraint, which are used as variables in order to develop a total of 29 full-detail core designs and associated performance characteristics. The ADOPT/Serpent package can automatically estimate core safety performance using the quasi-static reactivity balance approach [23], from which core temperatures following unprotected transients can be calculated. An explanation of this method and the results of this analysis are given in Section 8.
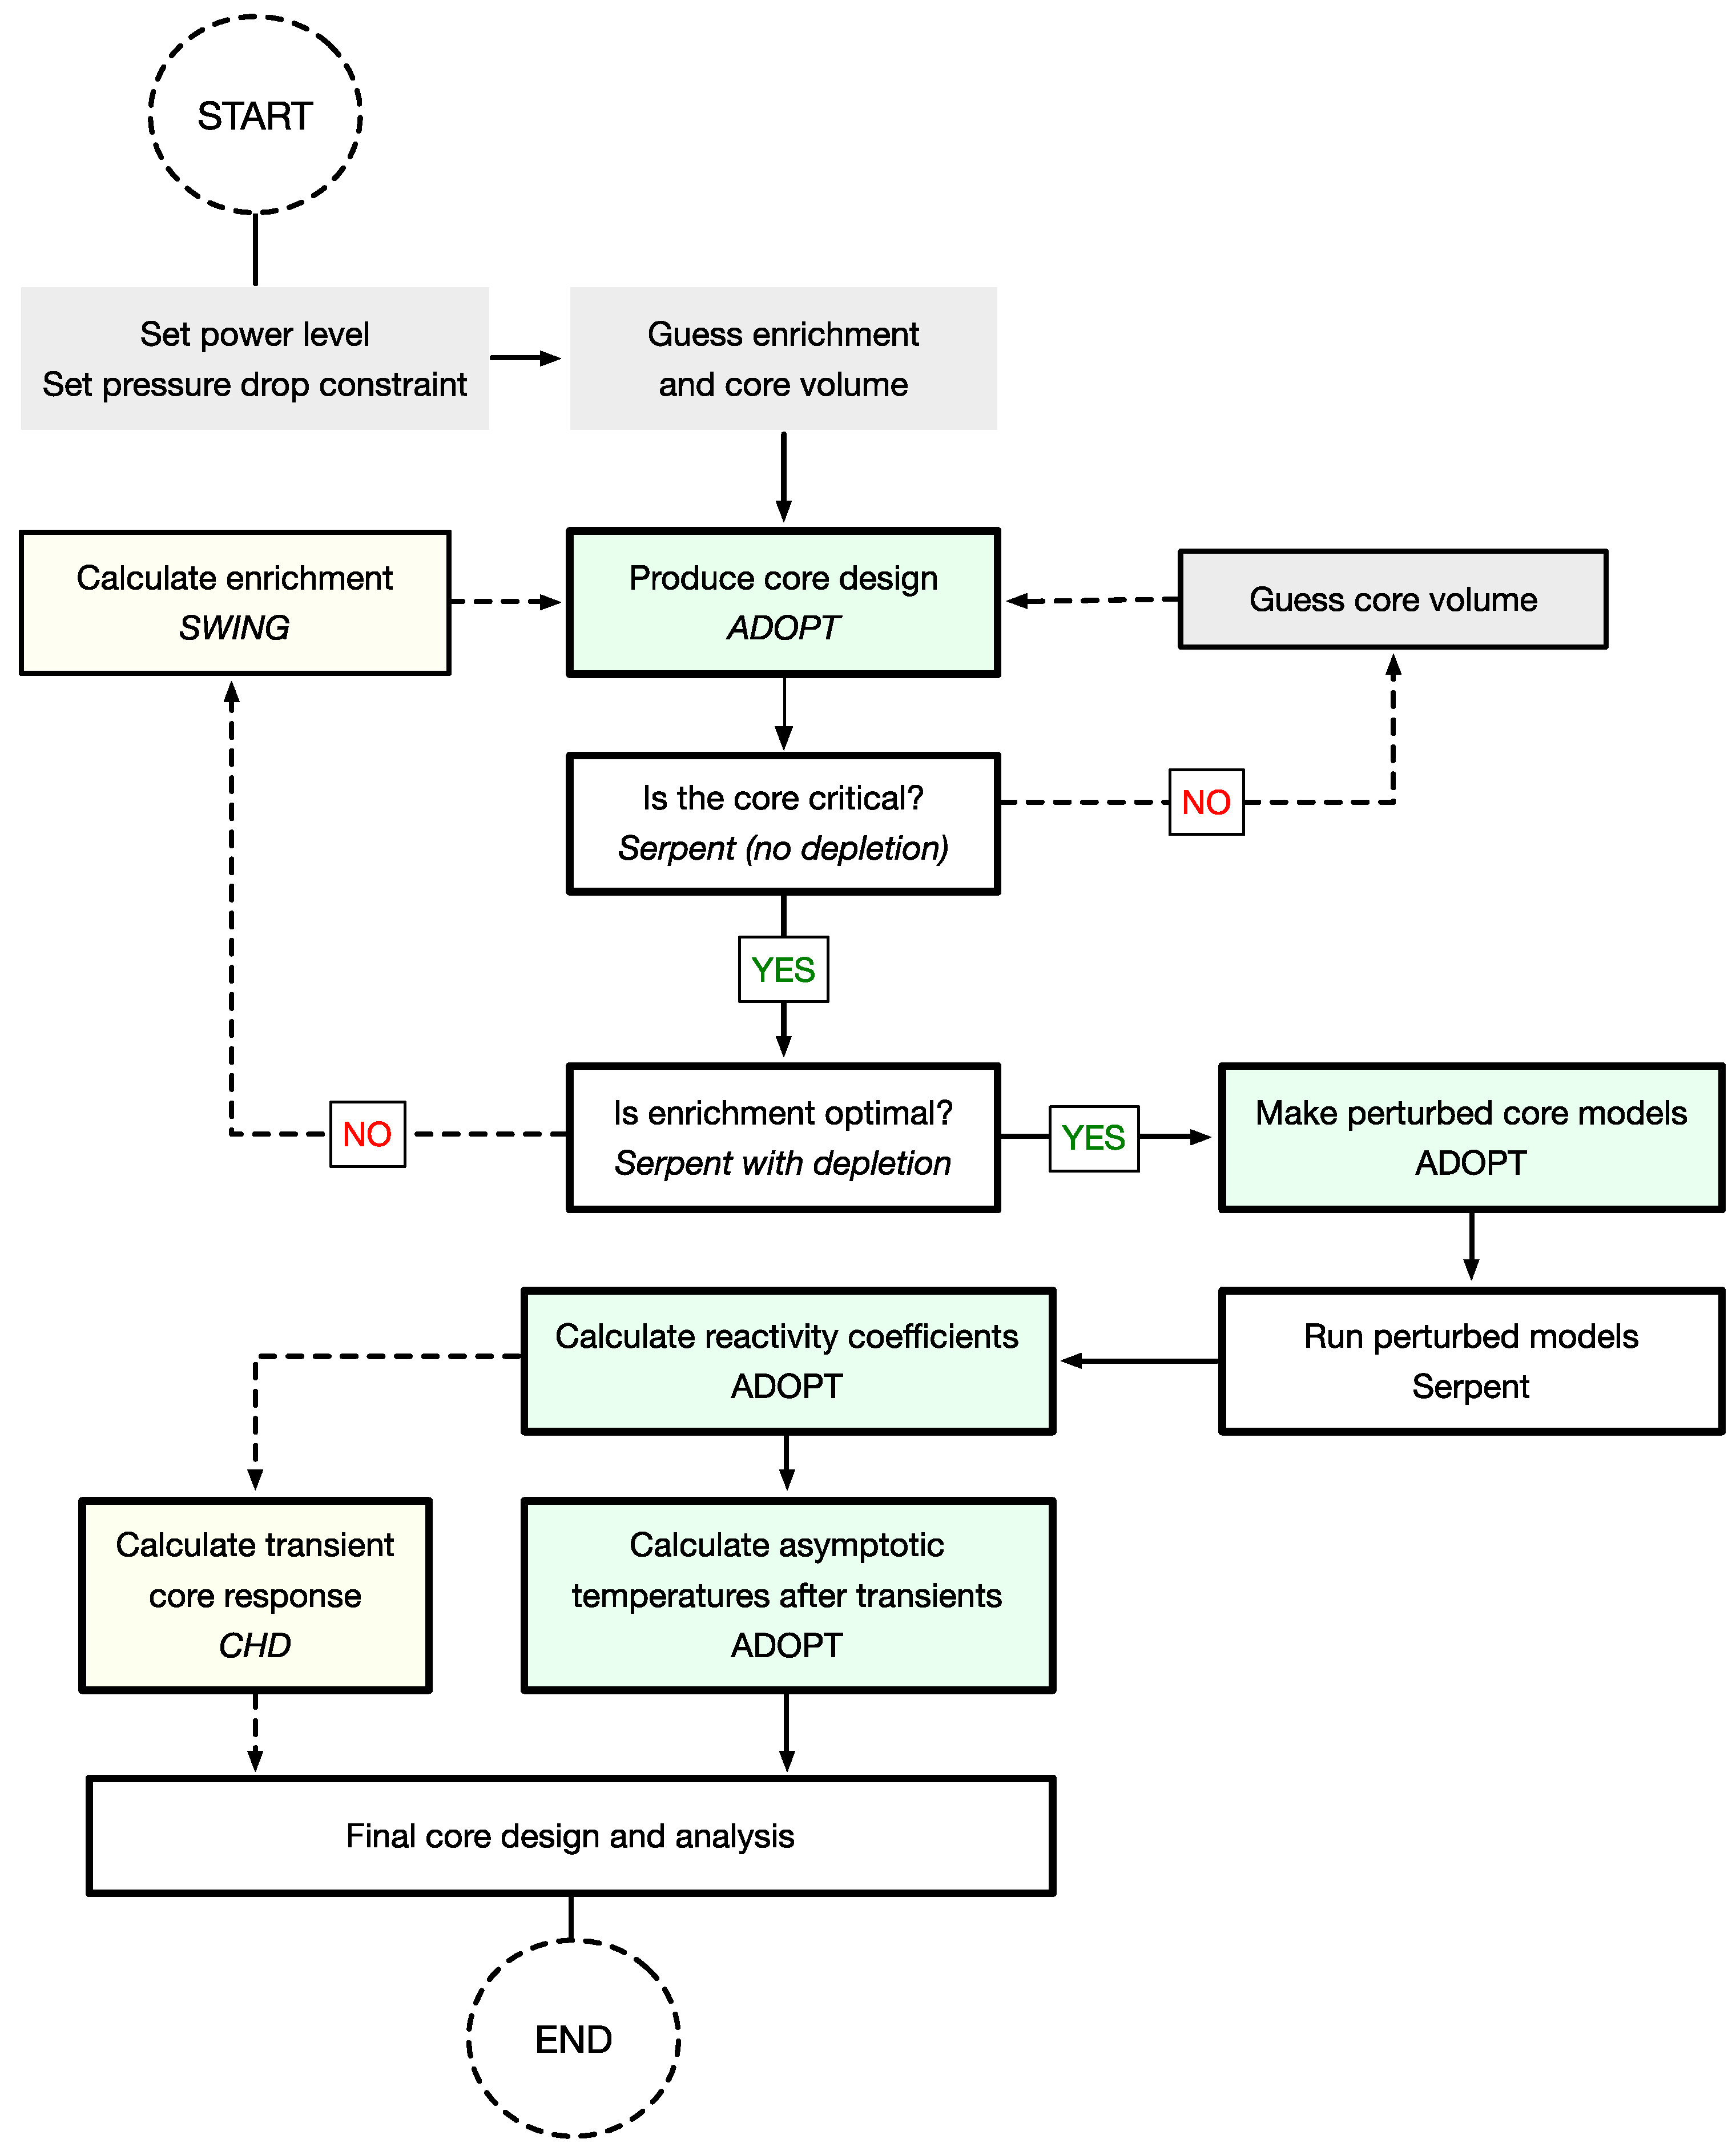
Since the objective of this study is to analyze cores with minimum reactivity swing, an additional in-house code called SWING was utilized in order to quickly identify the optimum level of enrichment for a given system. SWING takes 1-group cross-section data from a single Serpent calculation and then solves neutron balance and isotope-concentration equations in order to find the ratio of fissile/fertile isotopes in the feed-fuel material that minimizes the burnup reactivity swing. Step-by-step, the full core design process is carried out in the following way:
- Set a total core thermal power level (ex. 100 MWt) and an allowable primary loop coolant pressure drop level (ex. 100 kPa)
- Make initial guesses for
- Feed-fuel 235U enrichment (or TRU content) that gives a minimized swing
- Active core volume
- Power and flux peaking factors (radially and axially)
- Produce an optimized core design for the given parameters using ADOPT
- Run Serpent without depletion analysis
- Check if the core is critical
- Compare initial guess of peaking factors (Step 2c) to calculated values
If difference is larger than convergence criteria, go back and update Step 2c - Depending on results from Step 4, the effective neutron multiplication factor is:
- Below 1.0: Return to Step 2b, increase the core volume
- ~1.0: Continue to Step 6
- Above 1.0: Return to Step 2b, decrease core volume
- Run Serpent with depletion to obtain the burnup reactivity swing
- Depending on results from Step 6, the burnup reactivity swing is:
- Optimal: Continue to Step 8
- Not optimal: Run SWING code, then return to and update Step 2a with new value
- We now have the final core design, for which we need to calculate safety parameters. ADOPT produces Serpent input files for temperature-perturbed core geometries, materials and cross-section libraries
- Reactivity coefficients are calculated using Serpent with the input-files produced in Step 8
- Quasi-static reactivity feedback analysis and DPA-damage is calculated by ADOPT
- If requested, ADOPT runs the CHD code [24] for detailed transient analysis
- The full data for the core geometry, thermal-hydraulics, structural mechanics, fuel cycle and safety performance is collected
The steps 1–11 are fully automated, with the ADOPT code managing the data and running the other codes. The number of total iterations to find a final converged core design and the corresponding computational burden depends very heavily on the accuracy of the initial guesses. A simplified flow-chart of the core design process is shown in Figure 4.
Figure 4.
Minimum swing core design process.

5. Parametric Core Design Study Results
5.1. Core Size and Power Density
A battery type fast reactor with a minimized burnup reactivity swing must be loaded with fuel containing a specific ratio between fissile and fertile isotopes in order to neither gain nor drop in reactivity during the burnup cycle. In reality, a conventional minimum-swing core first gains, then loses reactivity, but the change in reactivity over the cycle is minimized. Only traveling wave type or continuously refueled reactors can maintain an absolutely stable reactivity trajectory over time. The optimum enrichment level depends on core-specific parameters, but simulation results performed in this study indicate that it is not above 13% 235U for any uranium-fueled system.
Below a certain power density for a given coolant temperature rise and flow velocity, the core design reaches an asymptote where geometric parameters do not change. The asymptote is reached as the fuel rod pitch-to-diameter ratio (P/D) approaches 1, and rods cannot be packed more closely together. For a set operation time, cores with lower power densities will achieve lower burnup and use the fuel less effectively. The cycle time of derated cores could be proportionally increased, but this approach runs into other limitations. Operational cycles exceeding 30 years may not be realistic or rational, since components that wear (including pumps and other mechanical systems) will need to be replaced. Reducing the power output increases the reactor cost per installed power ($/kW) and increases the relative amount of fuel recycling needed since less burnup is achieved in every cycle. These characteristics effectively put a rational lower limit on the core power of any battery-type reactor system.
For a core of optimal shape (H/D = 1), the power level where this limit is reached is a direct function of the allowable primary coolant system pressure drop. At P/D = 1.015 (fuel vol. frac ~40.7%), the minimum core volume for which minimum burnup reactivity swing operation is possible is ~1.7 m3, which implies a minimum height and equivalent diameter of ~129 cm. P/D = 1.015 was chosen as a lower limit rather than P/D = 1.0 in order to enable a non-zero thickness for the spacer wire and to limit the difference in coolant outlet temperature between different coolant channel types (interior, edge and corner). The corresponding total uranium and fissile (235U) mass is 12,500 kg and 1500 kg respectively. A primary cycle pressure drop of 100 kPa limits the power to ~50 MWt for the minimum core volume and fuel mass. If the pressure drop constraint is set higher, the minimum thermal power is correspondingly higher. At 200 kPa, the minimum power is ~75 MWt. The relation between pitch-to-diameter, core power and the pressure drop constraint is shown in Figure 5.
Figure 5.
Pitch-to-diameter ratio vs. core thermal power output.
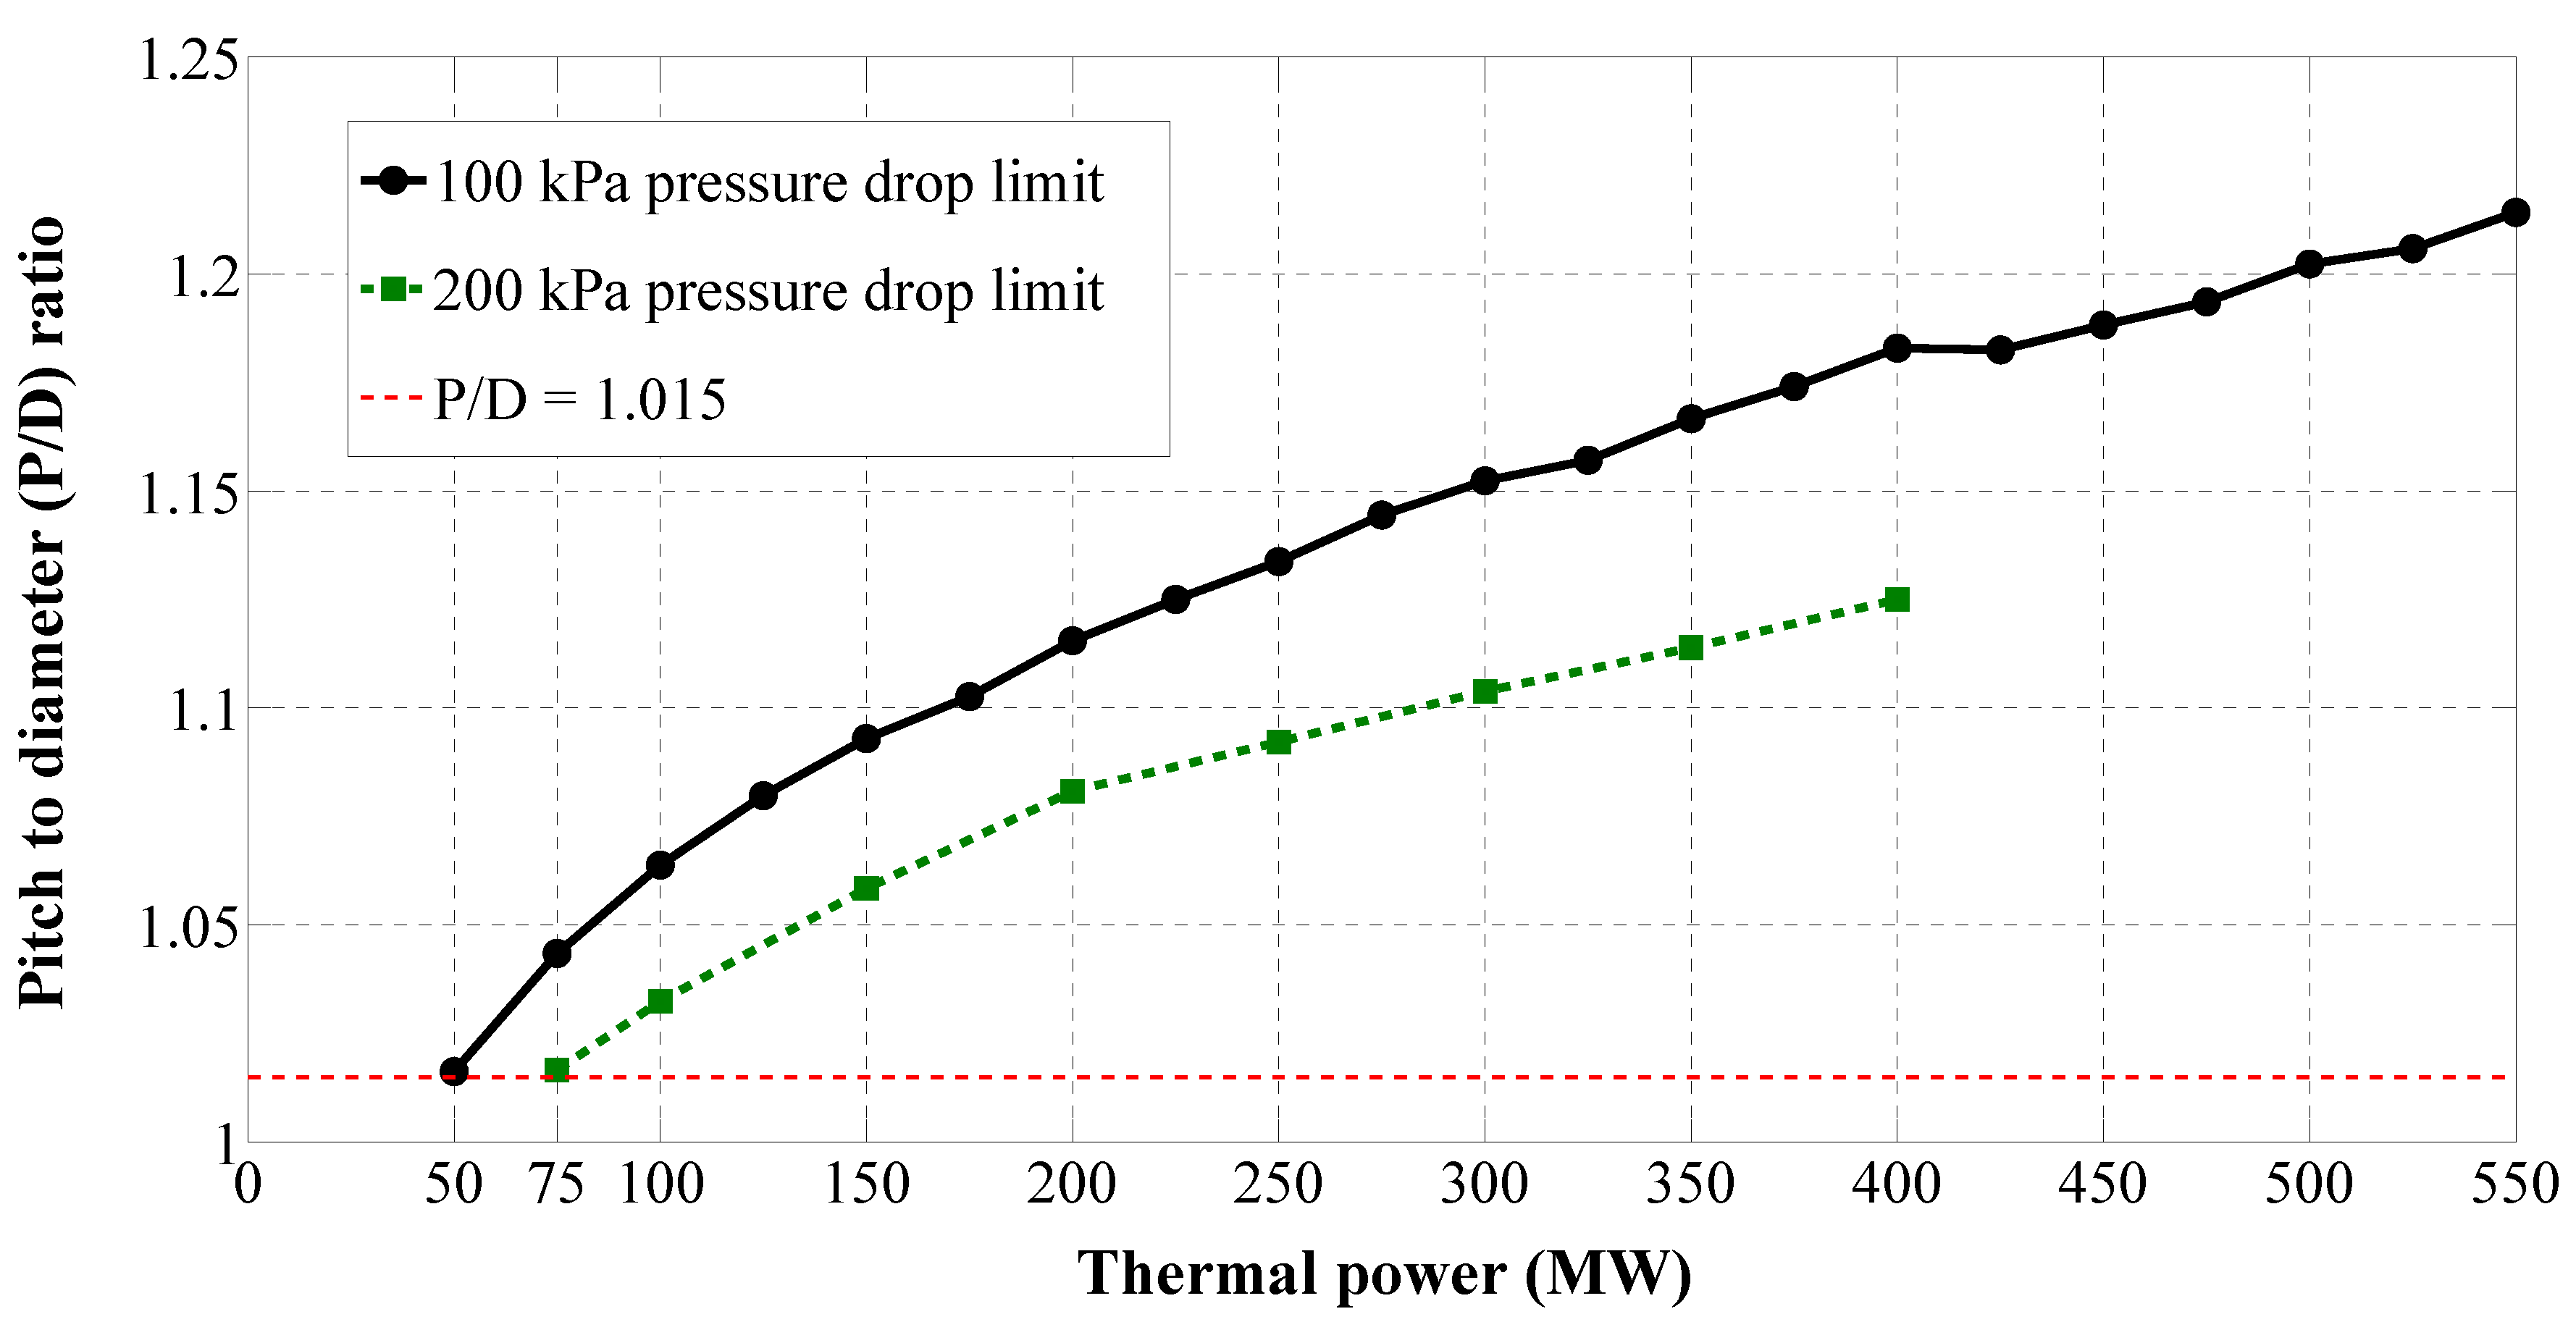
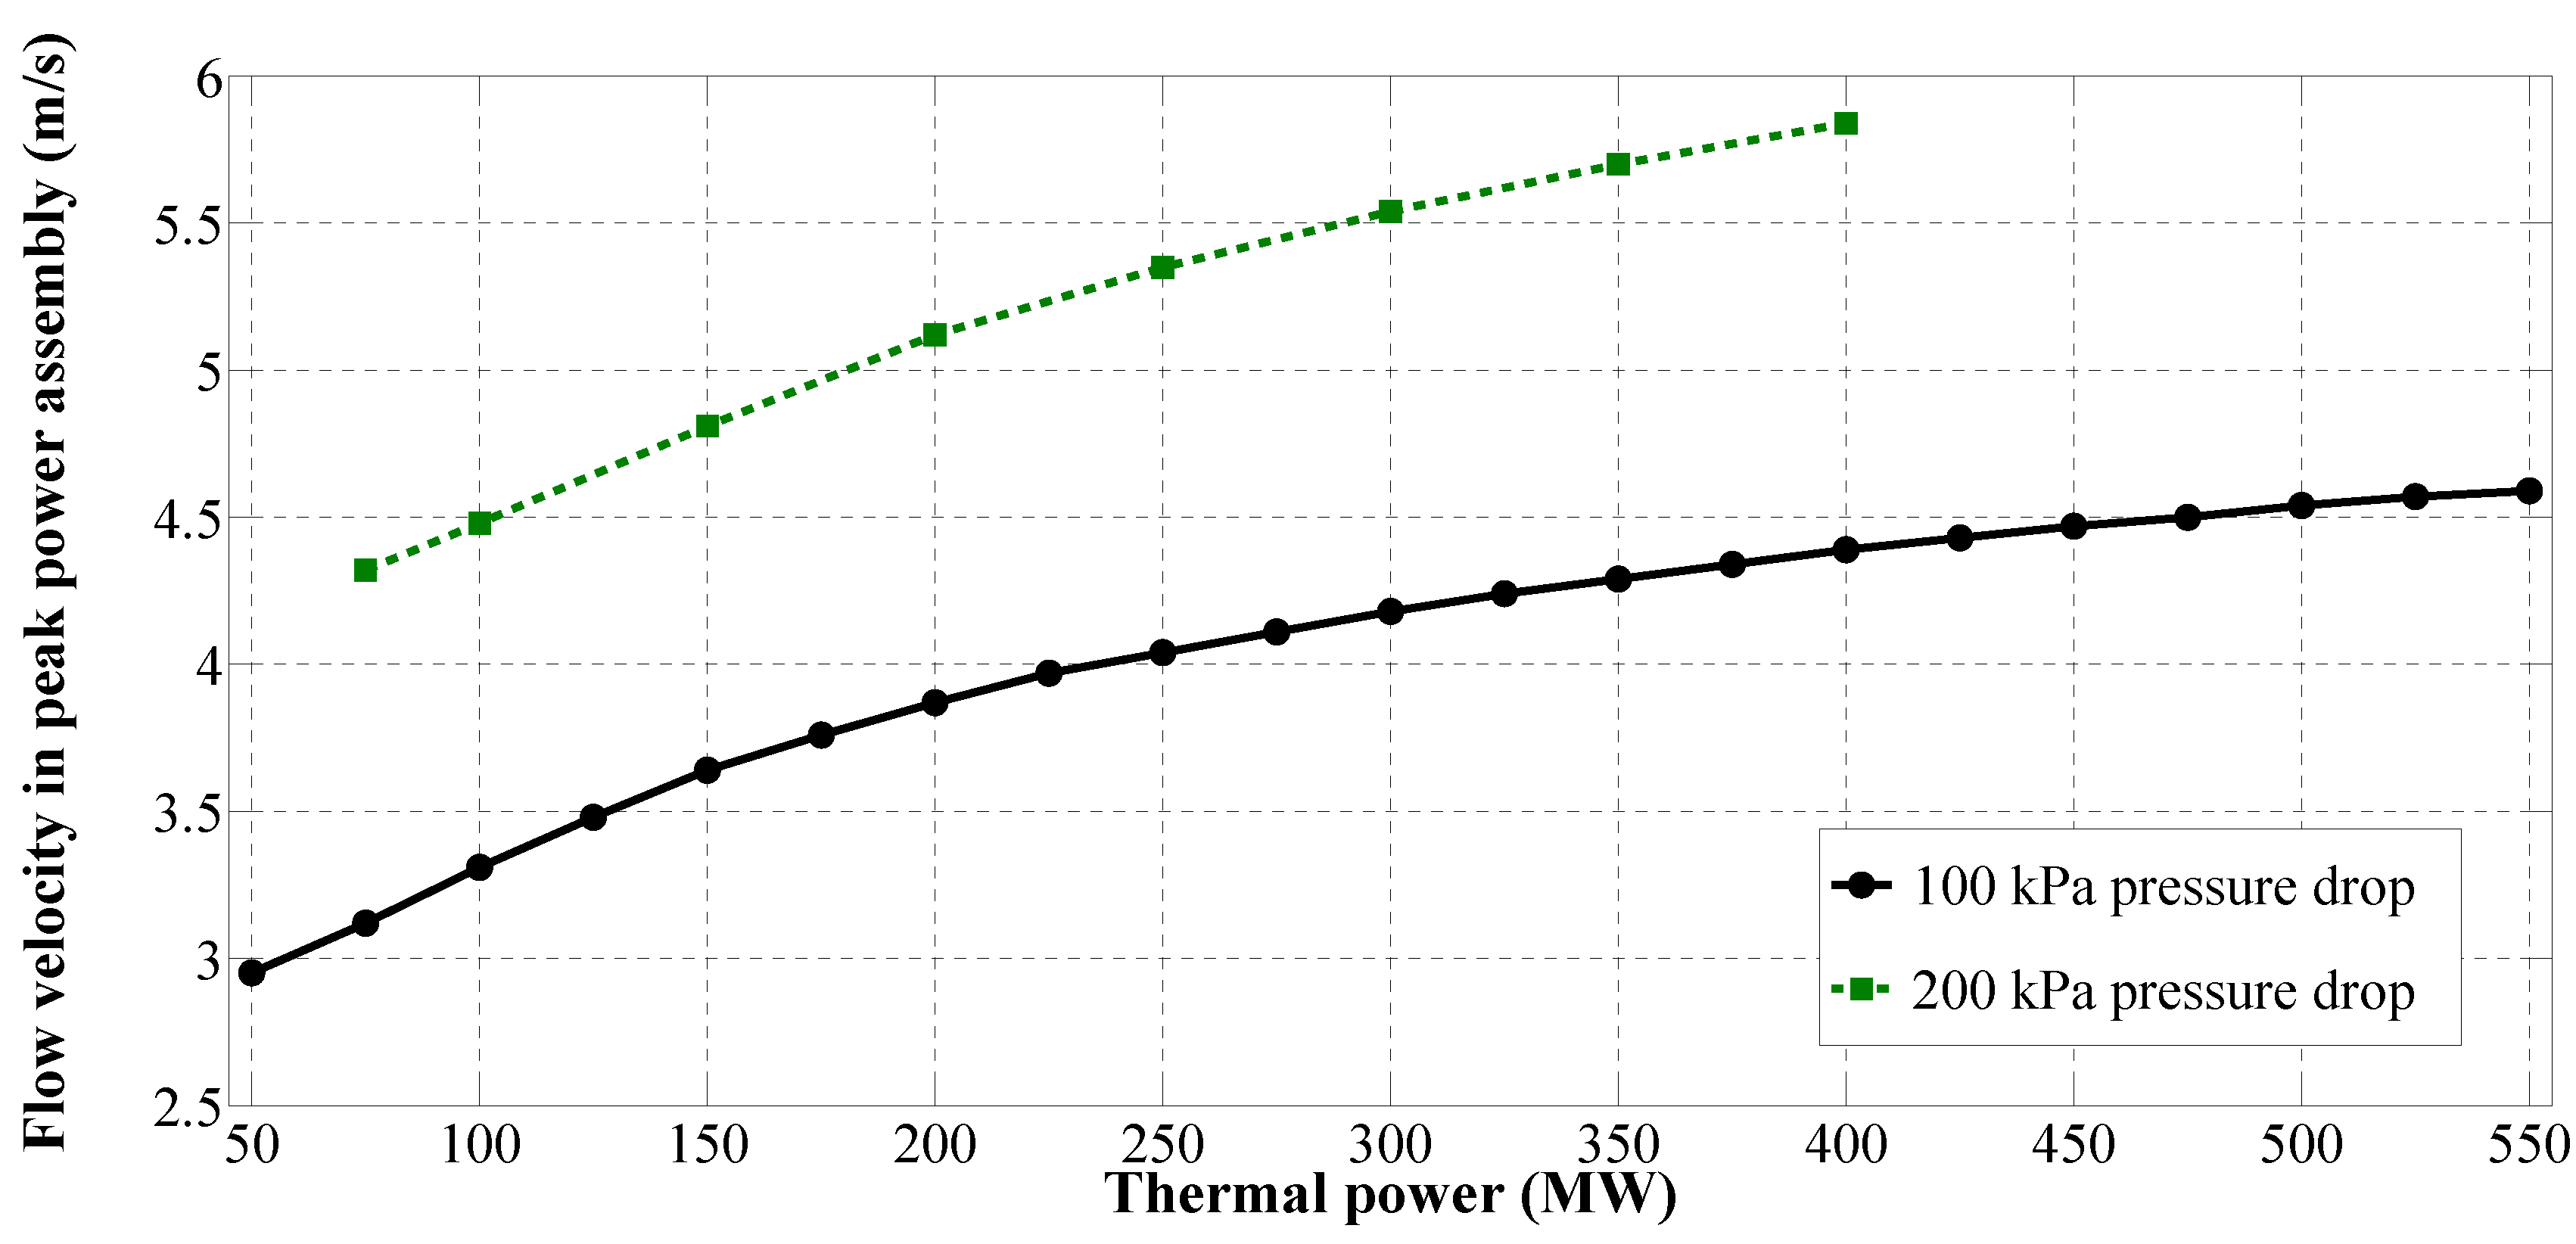
Assuming a thermal conversion efficiency of ~40%, it is clear that there is no technical rationale to design forced-flow long-life battery-type systems with electrical outputs lower than 40 MWe, since such cores would simply be derated without changes in the geometry. As the pitch-to-diameter ratio (P/D) goes below ~1.1, the pressure drop increases rapidly for a given coolant flow velocity. Since the total pressure drop is set, the coolant velocity and thus the heat removal capacity and power density see corresponding drops. The increase in coolant velocity with thermal power output can be seen in Figure 6. The attainable power density for minimum-swing operation as a function of core power is shown in Figure 7.
Figure 6.
Average coolant flow velocity in the peak-power assembly (m/s).

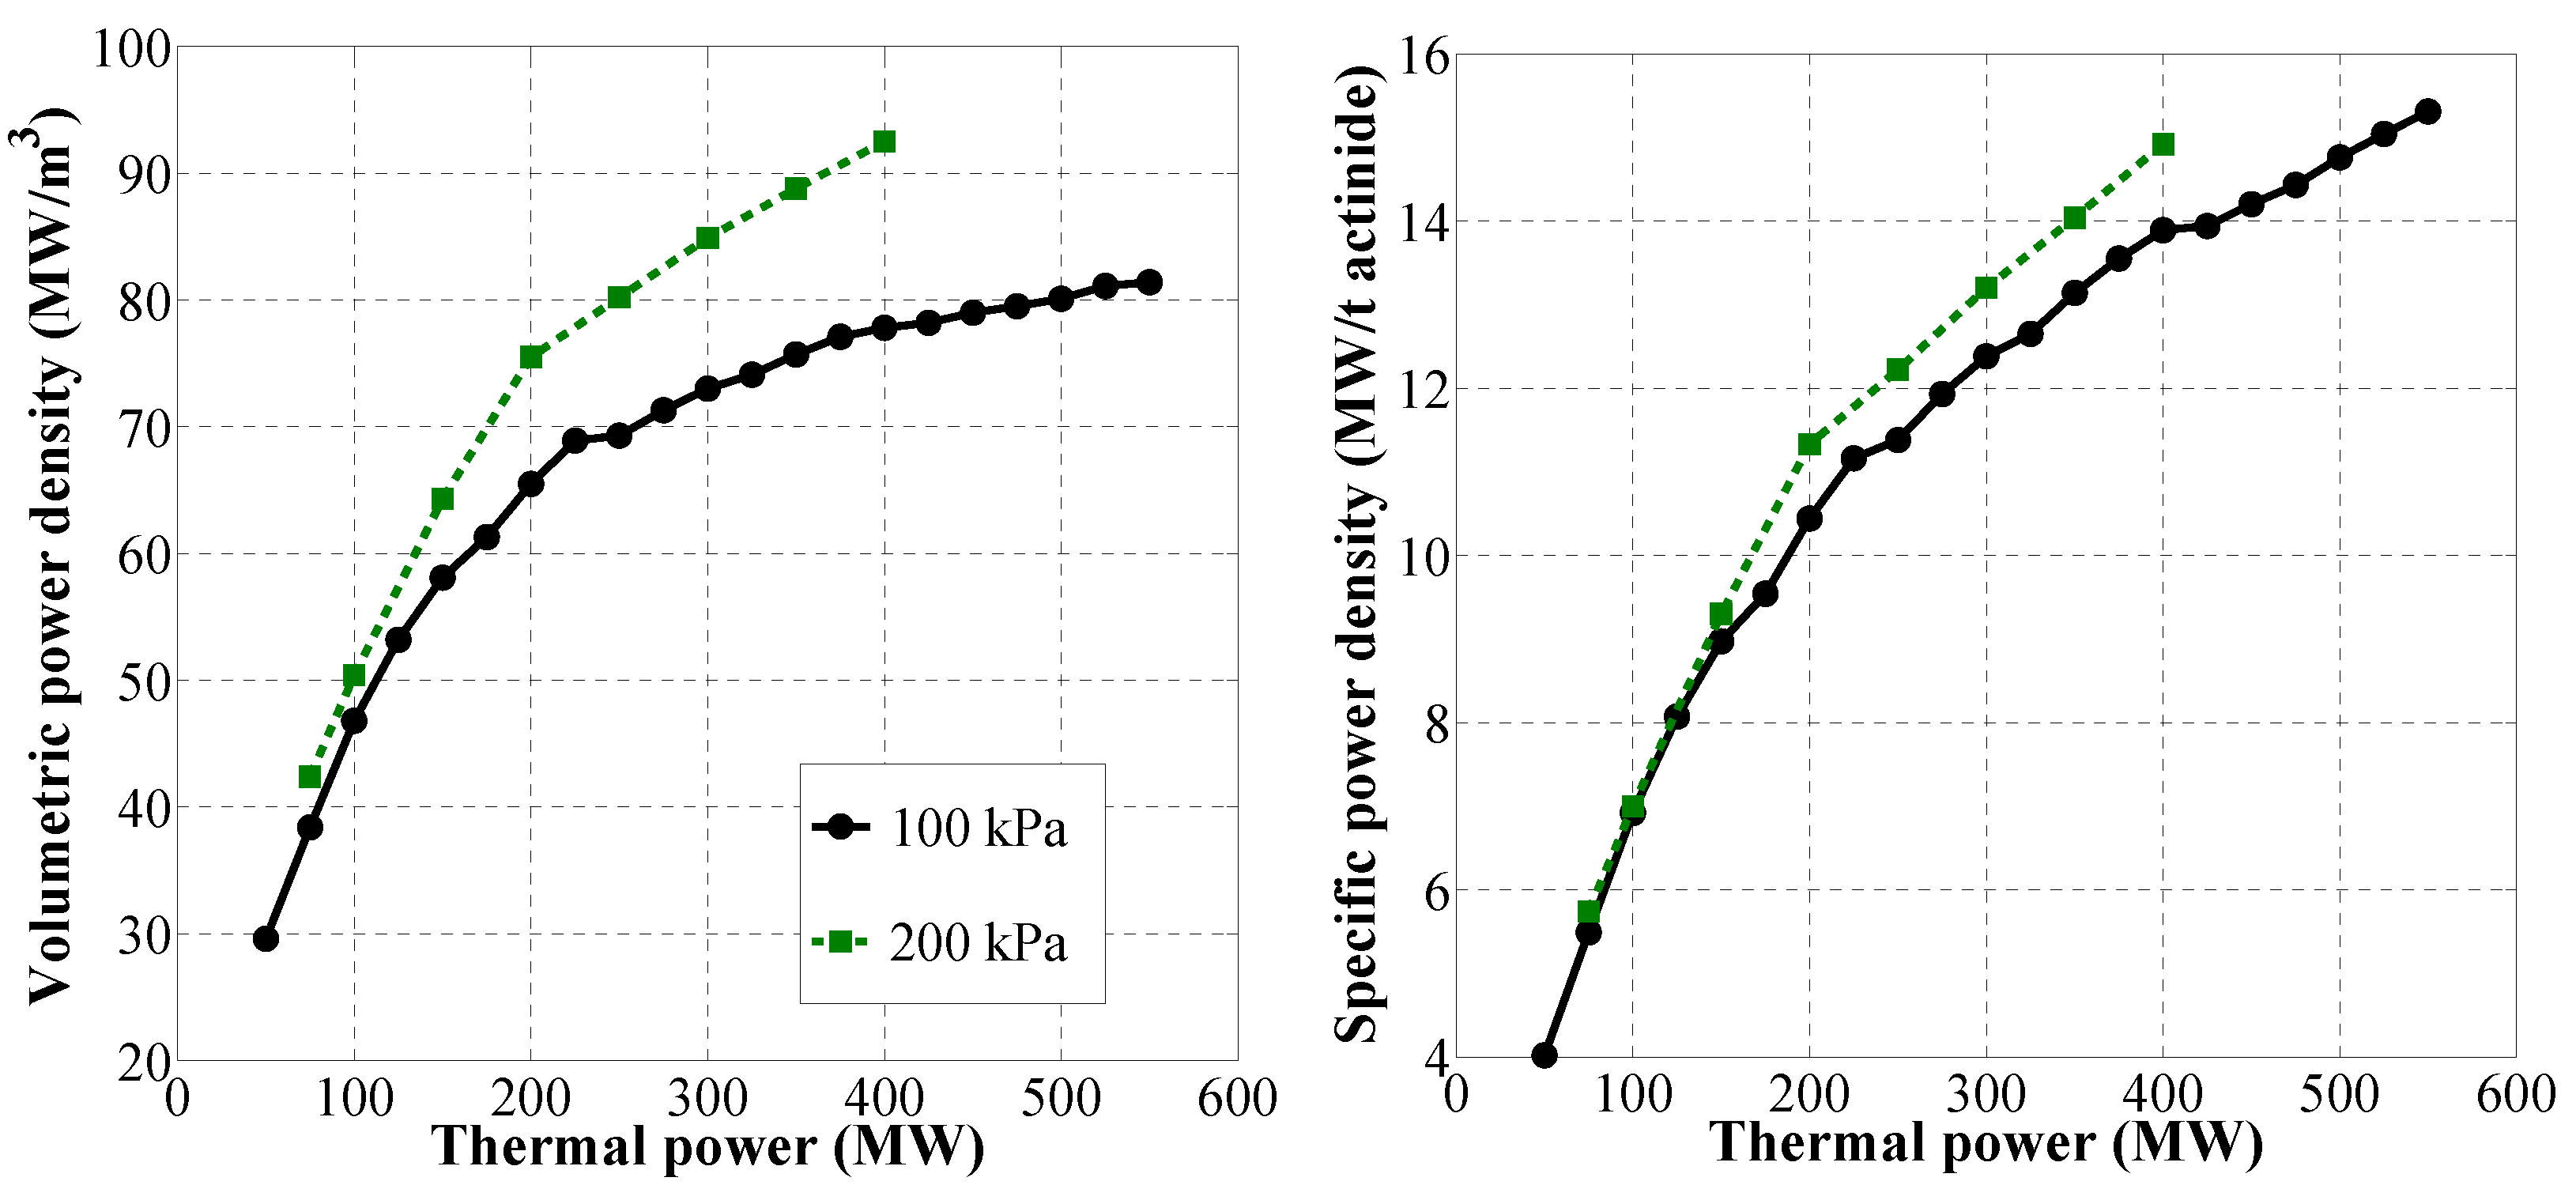
Figure 7.
Power density vs. power output for optimized cores.

Below 200 MWt, a doubling of the power gives a ~50% increase in the power density, giving a strong economic incentive to aim for the highest power output possible. Going from 50 MWt to 550 MWt, an increase in power of 11 times, the core volume expands (keeping the core shape at H/D = 1) by 4 times, from 1.7 m3 up to 6.75 m3.
5.2. Burnup and Reactivity Swing
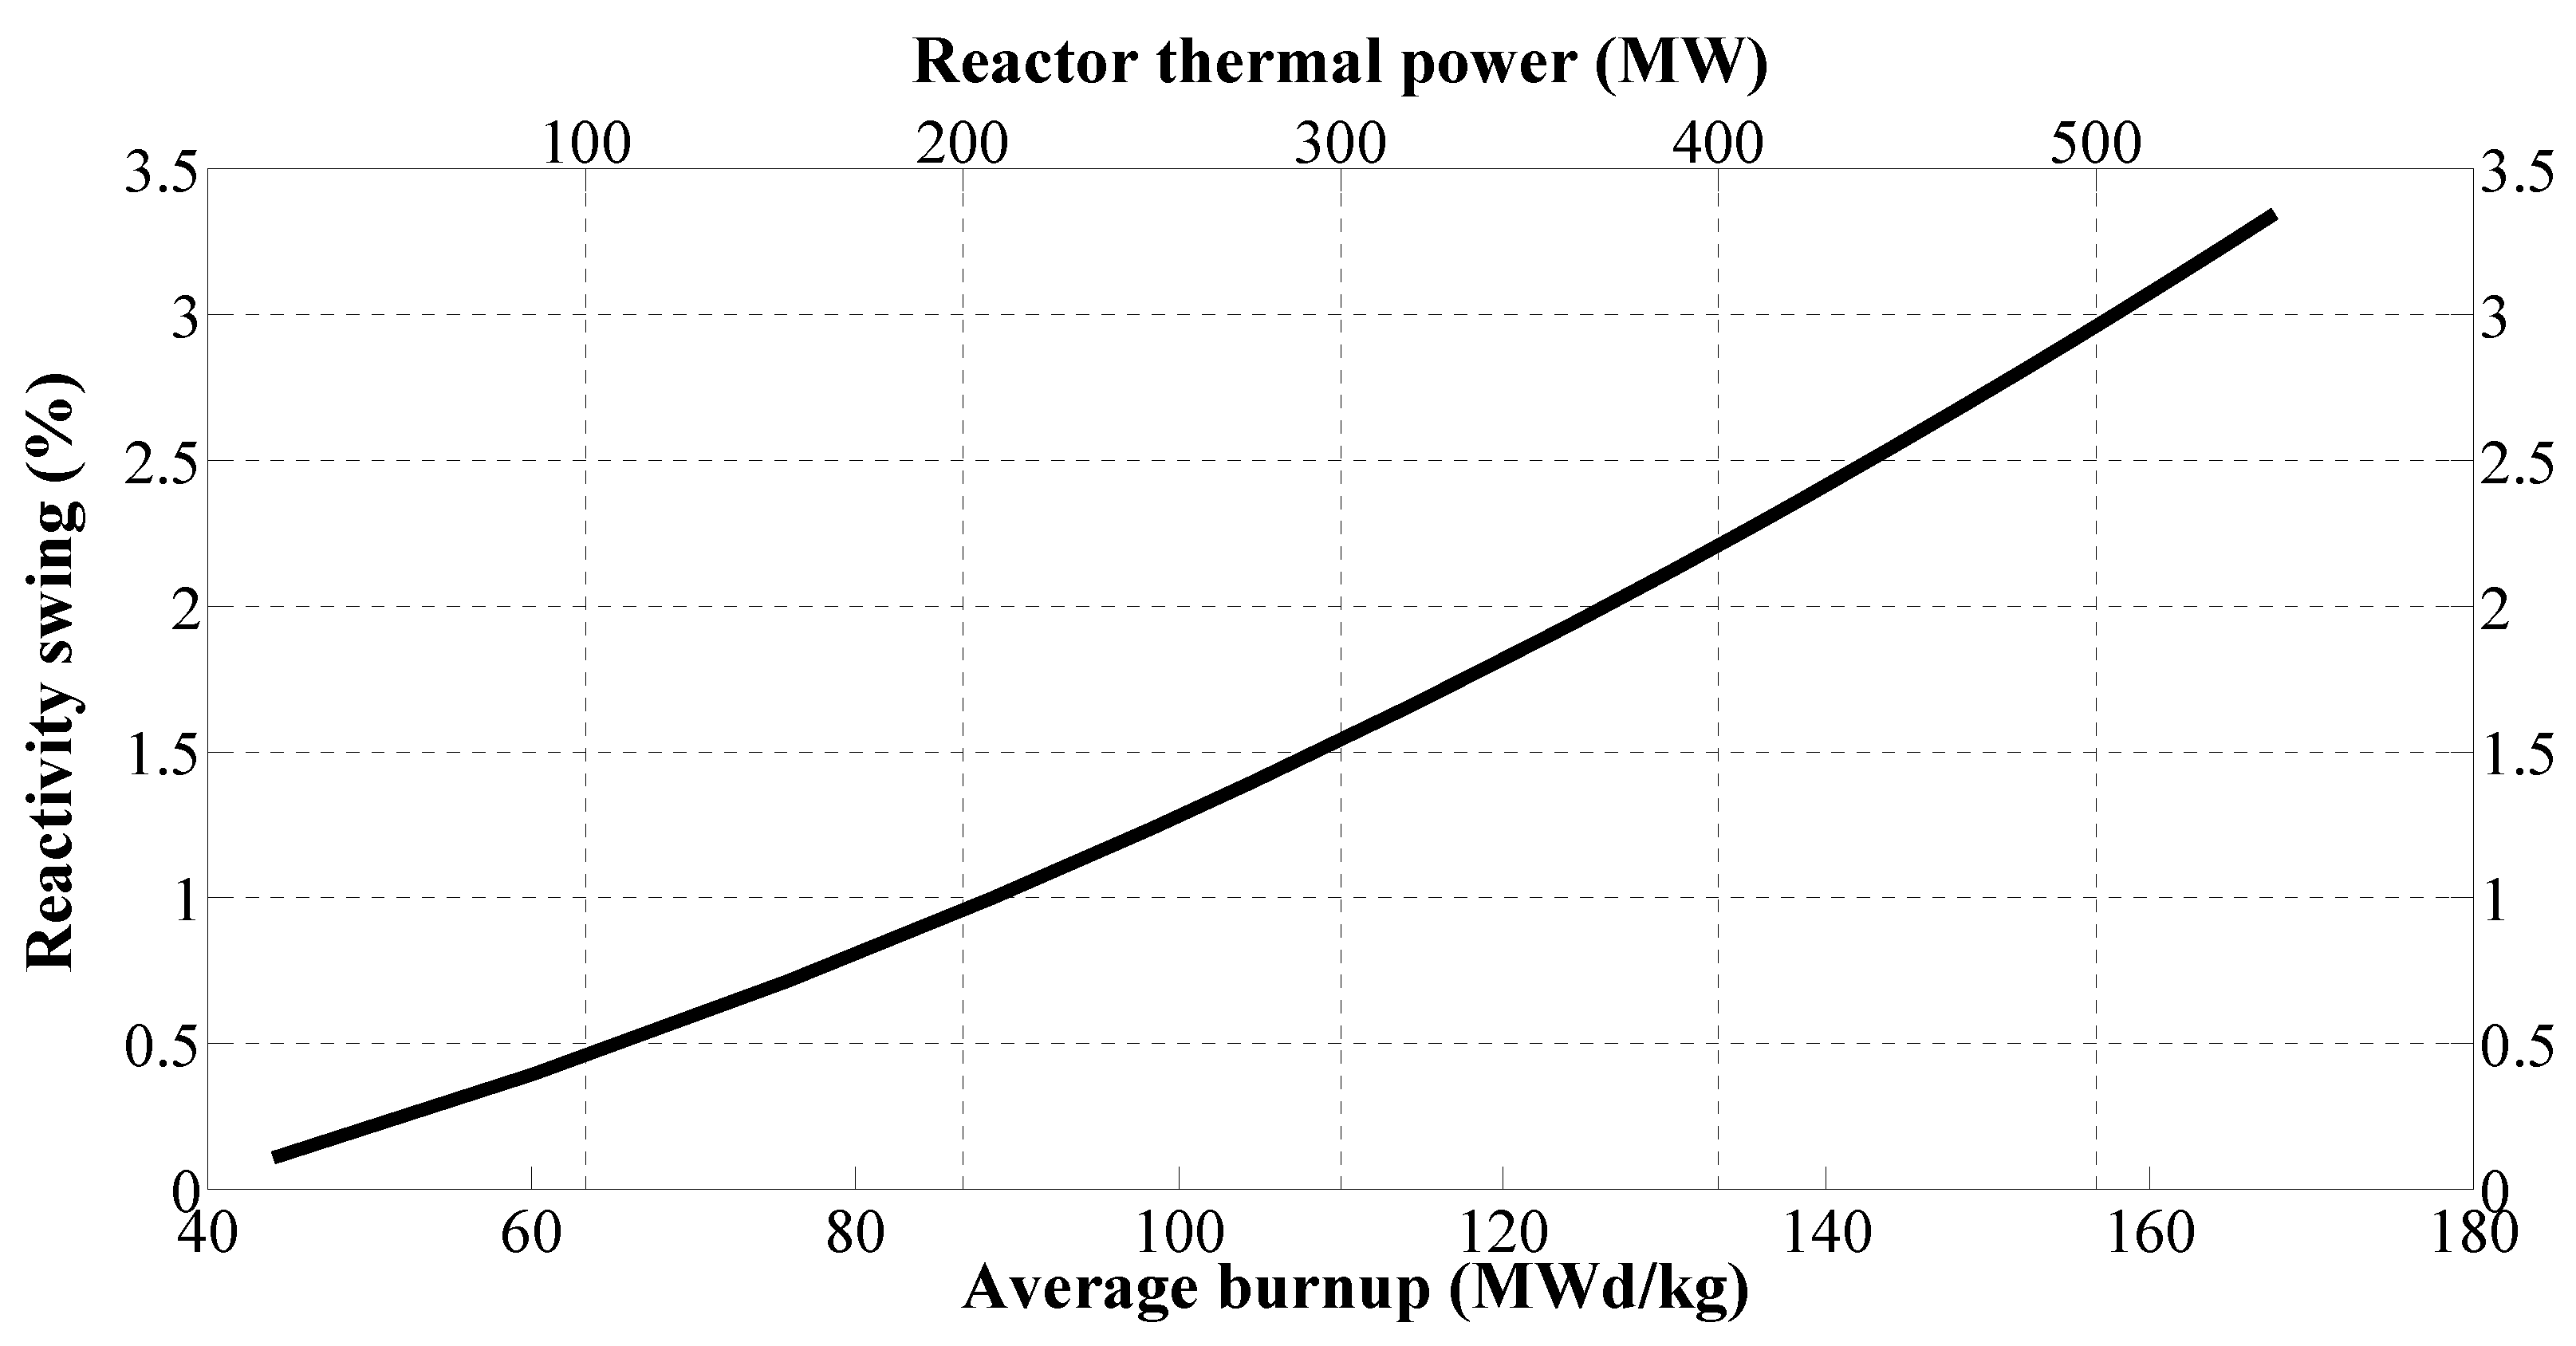
The relation between core thermal power, average fuel burnup and the reactivity swing is shown in Figure 8. The higher power & power-density cores reach higher burnups and consequently require more breeding to stay critical throughout the cycle. Any minimum-swing system with a uniform fuel loading (uniform: single feed-fuel enrichment in all regions of the core) will have a parabolic uncontrolled reactivity swing trajectory, with keff = 1.0 at the beginning and end of cycle, and a peak value for keff near the middle of the cycle. The higher the average discharge burnup of the system, the larger the peak uncontrolled reactivity (referred to as the “reactivity swing”) needs to be. This is because more 239Pu must be built up in the fuel (i.e., higher breeding ratio) to counteract the increasing probability of neutron capture and moderation by fission products. Early in the cycle, the net reactivity gain from increasing 239Pu content leads to increasing reactivity, which at some point is overtaken by the increase in fission product poisoning, leading to the parabolic reactivity trajectory. Reactivity-adjustment control systems have to be dimensioned so that their total reactivity worth matches the peak uncontrolled reactivity and additional margins. The amplified control requirements lead to more severe potential accidents as the power output and corresponding average burnup of the systems increase.
Figure 8.
Reactor power, average burnup and reactivity swing.

5.3. Irradiation Damage
As mentioned in Section 3.3, irradiation damage constraints for structural materials (such as fuel rod cladding and assembly duct steel) can severely limit the performance of battery-type nuclear systems. For a fixed full-power operational time (in this study, 30 years), the damage suffered by the structural steel in the core is directly proportional to fluence, burnup and power density. The results presented in Section 5.1 and Section 5.2 show that optimized higher power cores operate at a higher power density and reach a higher burnup, and thus irradiation damage increases with core power for these types of systems. Counteracting this trend is the spectral softening in the higher-power cores due to a relatively higher coolant volume fraction. The increased moderation by the coolant lowers the effective one-group DPA cross-section for HT9 steel. The level of DPA was calculated using 100 energy-group flux detectors in Serpent, taking element-wise DPA cross-section data and the data for the energy level required to displace atoms from the documentation of the Argonne National Laboratory (ANL) SPECTER code [25]. As seen in Figure 9, a relative drop of 25% in the fuel volume fraction (from 40% to 30% on a total basis) corresponds to a relative drop in the cycle-averaged 1-group HT9 dpa cross-section in the center of the core of ~8% (from 303 to 280 barns). The fast flux fraction (E > 0.1 MeV) in the center of the core drops from 65.7% in the 50 MWt core to 60.0% in the 550 MWt core.
Figure 9.
1-group HT9 dpa cross-section in the core center as a function of thermal power and fuel volume fraction in the 100-kPa core designs.
Figure 9.
1-group HT9 dpa cross-section in the core center as a function of thermal power and fuel volume fraction in the 100-kPa core designs.

The impacts of different DPA limits on the characteristics of core performance are given in Table 3. The burnup and peak fast fluence corresponding to a certain level of DPA is essentially independent of specific core design parameters such as thermal power level or pressure drop constraint. Because of the spectral softening in larger cores, a higher level of total neutron fluence is needed to reach a given level of DPA. As shown in Section 5.1, a higher pressure drop constraint allows for a higher coolant velocity and more effective heat removal. This results in a smaller core volume and fuel mass, which for a set power and operational cycle time raises the flux, fluence and fuel burnup. This results in a lower maximum power level at which the core can operate for a set period of time without violating the DPA-damage constraints. Seemingly paradoxically, in this way for this specific type of core and operating cycle, a less effective heat removal allows for a higher operating power.
| Operational Parameter | Irradiation Damage Constraint | |||
|---|---|---|---|---|
| 200 DPA | 300 DPA | 500 DPA | ||
| Core-averaged burnup (MWd/kg-actinide) | 67 | 100 | 169 | |
| Maximum thermal power for 30 years of operation (MW) | 100 kPa limit | 100 | 150 | 550 |
| 200 kPa limit | 75 | 140 | 400 | |
The available range of thermal power for an optimized battery-type core becomes more narrow if the pressure drop limitation is set at a higher value, since the minimum power is raised and the maximum power is lowered. For a 200-kPa core with a DPA-constraint of 200, the lower and upper power bounds nearly coincide, and 75–85 MWt is the only operational power possible for a fully optimized system running for 30 years. This indicates that a pressure drop limit above 200 kPa would inevitably lead to sub-optimal core designs for the given design constraints. For 100-kPa 200-DPA cores, there is a span of output power possibilities from 50 MWt to 100 MWt, but the width of the span itself (as long as it is larger than 0) is not of significance. As explained in Section 5.1, the volumetric and specific (per kg-fuel) power density increases with power level. A truly optimized system will therefore be designed to operate at precisely the maximum allowable power as defined in Table 3.
6. Reactivity Feedback
6.1. Methods and Definitions
Core reactivity is impacted in four fundamental ways due to changes in the temperatures of the components that make up the core. These are briefly summarized below:
- Neutron absorption probability in the fuel and other core components change with changes in temperature due to the nuclear Doppler effect.
- The core and fuel expands or contracts radially and axially due to changes in temperature, which causes the neutron leakage probability to change.
- Changes in the coolant temperature affect both the neutron spectrum and the leakage probability (changes in absorption probability is a minor effect). The resulting net effect can be either positive or negative depending primarily on the shape and size of the core and its nominal neutron leakage probability.
- An increase in the coolant temperature will increase the temperature of the drivelines that operate the core control systems. This causes them to thermally which effectively pushes neutron-absorbing material toward the core. Since the cores analyzed here are minimum-swing systems, the reactivity stored in control systems is small and this effect is neglected.
The feedbacks are calculated by running neutron transport calculations of a “reference” and various perturbed core models using the Serpent neutron transport code with 15 × 106 active neutron histories for each calculation. The resulting statistical uncertainty in the multiplication factor is ~20 pcm. Reactivity coefficients are then calculated in the unit of cents (1 ¢ = 0.01 $ = 0.01 βeff) per Kelvin using Equation (4):
where ki and kref is the perturbed and reference core state neutron multiplication factor, ΔT is the temperature difference between the two states (K) and βeff is the effective delayed neutron fraction of the reference state core.
The fuel Doppler reactivity coefficient (αD) is calculated by changing the ENDF/B-VII.0 cross-section library temperature of the fuel isotopes by 900 K [26]. The radial expansion reactivity coefficient (αr) is simulated in a simplified manner by expanding the lower core grid plate steel corresponding to a temperature increase of 500 K. The resulting radial expansion increases the distance between assemblies, which results in a larger coolant volume in the inter-assembly gaps. This simplified modeling approach assumes a uniform expansion and disregards the effects of core “flowering” as duct load pads interact. These effects can be included by multiplying the uniform expansion coefficient by local temperature changes and geometrical factors, as explained in the documentation for the SAS4A/SASSYS-1 code [27]. The coolant thermal expansion coefficient (αco) is calculated by uniformly adjusting the density of the coolant within the active core region.
The reactivity effect of thermal expansion of annular fuel (αfc) can accurately be modeled as an axial expansion only, since there is no liquid bond present to be displaced by radial expansion of the fuel. Modeling of the axial fuel expansion of annular metallic fuel does however present a large source of uncertainty. The annular fuel slug is manufactured to be in mechanical contact with the inner cladding liner. Assuming that the clad and fuel are stuck together and no sliding or plastic deformation occurs during a limited temperature transient, the combined thermal expansion coefficient of the fuel/cladding system can be estimated using thermo-physical data. The combined thermal expansion coefficient (εfc) is then given as:
where subscripts f and c denote fuel and cladding, ε is the thermal expansion coefficient (K−1), Y is the elastic modulus (Pa) and A is the cross-sectional area of the component (m2).
In the work of many research groups, porous metallic fuel is assumed to be so weak at operating temperatures that this procedure is deemed unnecessary; the fuel component in the combined expansion calculation is simply ignored by setting its elastic modulus (Yf) to 0. This assumption has been used by ANL [28] (US), Brookhaven National Laboratory (BNL) [29] (US), Massachusetts Institute of Technology (MIT) [30] (US), Korea Atomic Energy Research Institute (KAERI) [31] (Korea), Indira Gandhi Centre for Atomic Research (IGCAR) [32] (India) and many others. It appears to be an un-physical simplification for standard metallic fuel, since Yf is certainly larger than 0 Pa. More importantly, in some accident scenarios, this assumption leads to non-conservative results. The issue is even more important for annular metallic fuel, since fuel & cladding are mechanically bound before the fuel is noticeably weakened by porosity. For such a fuel design, the Yf = 0 assumption leads to drastic errors in the estimated reactivity impact of an increase in the temperature of cladding and fuel near the beginning of cycle (BOC). In order to correctly make use of Equation (5), a new correlation based on a re-evaluation of experimental data points has been developed. Using data from the figures of [33], the elastic modulus of unirradiated, fully dense U-2.4Zr fuel produced by arc melting is given as:
where T is the temperature of the material in Kelvin.
Equation (6) is strictly valid in the temperature range 25–500 °C. Since the temperature-dependence is linear over this temperature range, it is reasonable to assume a linear temperature-dependence up until a phase-change occurs. For the low-Zr U-Zr alloys, this happens at ~660 °C. The data in ref. [33] show that the value of Yf decreases with increasing Zr-content, which indicates that Equation (6) slightly under-estimates the value of Yf for U-2Zr fuel. More advanced correlations were recently developed from the same data source for metallic fuel alloys with Zr-contents in the span 6%–10% [34].
Equation (6) gives the value for Yf at 600 °C as 122.4 GPa. Using the correlation for HT9 steel from [35] gives Yc = 129.0 GPa at 550 °C. Since Af is much larger than Ac for any fuel rod design, the fuel primarily controls the combined expansion of an annular metallic fuel rod, at least near BOC. Using the geometric relations of a fuel rod, Equation (6) can be rewritten as [34]:
where CTR is the Cladding Thickness Ratio (explained in Section 2.2) and FSD is the fresh, un-swollen Fuel Smear Density (0 < FSD ≤ 1)
For all the cores studied in this article, we have FSD = 0.75 and CTR = 0.05. Combined with the values of Yf and Yc defined above, Equation (7) yields:
Equation (8) is only valid for fresh fuel at the beginning of cycle (BOC). As the fuel swells inward, the value for Yf drops with increasing porosity in the fuel, while Af increases. Available correlations on the porosity impact on Yf indicate the following type of relationship [36]:
where P is the fractional porosity in the fuel.
At 75% smear density and assuming the annular fuel is not able to swell axially, the porosity developed at full inward radial swelling is ~1/0.75 − 1 = 0.33 (33%). This leads to the following combined expansion coefficient at middle of cycle (MOC) and end of cycle (EOC):
6.2. Reactivity Coefficient Calculation Results
An extensive study was carried out to calculate the reactivity coefficients of each core at three points during core life: BOC, MOC and EOC. It is well known from previous studies that reactivity coefficients change for the worse with core size and decreasing nominal neutron leakage probability [37,38], and similar trends are seen in this study. Another important factor is the change in reactivity coefficients as burnup progresses. Since the primary isotope responsible for neutron production shifts from 235U to 239Pu in these systems, the reactor physics of the cores change. The main difference is that the η-value (η = νσf/σa) of 239Pu increases more with increasing neutron energy than that of 235U, which gives a more positive (or less negative) coolant density coefficient. This effect (in reverse) also causes a more negative radial expansion coefficient as burnup progresses, since the increased coolant volume fraction softens the spectrum. The main isotope contributing to the fuel Doppler effect is 238U, and since its concentration decreases as burnup progresses, the magnitude of the feedback effect is smaller at EOC compared to BOC. There is little difference in the axial fuel expansion reactivity feedback magnitude (as measured in pcm/K) going from BOC to EOC.
The reactivity coefficients as calculated by ADOPT/Serpent of the 100-kPa cores are summarized in Figure 10. The axial fuel expansion reactivity coefficient corresponds to freely expanding fuel and should be reduced in magnitude by multiplication of an appropriate weighing factor for the combined fuel/clad-system to be applicable in safety analysis. The radial expansion reactivity coefficient corresponds to a uniform expansion, and does not take into account bowing effects. The uncontrolled reactivity (and thus the worth of the reactivity control system) peaks near MOC, which makes this point in the cycle the most important for control-rod ejection type scenarios. The values for MOC generally lie in between the values for BOC and EOC; they have been omitted from the figure for clarity.
Figure 10.
Reactivity coefficients at BOC and EOC for the 100-kPa cores.

7. Quasi-Static Reactivity Feedback Analysis of Core Safety Parameters
7.1. Introduction to the Method
The quasi-static reactivity balance (QSRB) method was developed by Wade et al., at Argonne National Laboratory (ANL) in the 1980s [23]. It is used to estimate the core state after a perturbation of core operating parameters based on solving a reactivity balance equation that depends on the ratios of three measurable integral reactivity parameters (A, B and C). The only information flow paths across the reactor boundary are the primary flow rate (F) that is controlled by pumps, the coolant inlet temperature (Tin), affected by the operation of the secondary coolant system, and an externally introduced reactivity insertion (ρext). Given these three general ways to affect the state of a reactor core, a total of six potential scenarios can be analyzed:
- Changes in primary system pumping (ΔF)
- Loss of flow
- Pump overspeed
- Control rod motion or re-arrangement of core geometry (seismic events etc.) (Δρext)
- Injection or negative-reactivity re-arrangement
- Ejection or positive-reactivity re-arrangement
- Secondary cycle temperature & flow rate (ΔTin)
- Loss of heat sink
- Chilled inlet temperature
Since control rod injection is the means to shut the reactor down, it by itself cannot be considered an accident scenario. All other scenarios may raise the temperatures of certain components in the core, and they are thus the focus of the safety evaluation. The reactivity balance used in QSRB analysis is defined by Equation (11):
where A, B and C are integral reactivity parameters (to be defined), Δp is the core reactivity, P is the normalized power (P = 1 is full operational power), F is the normalized coolant flow rate (F = 1 is forced-flow at full pumping power), δTin is the change in the coolant inlet temperature and ρext is a reactivity introduced for example by the motion of control rods.
In any unprotected (unprotected: active core shutdown systems are not functioning) accident or transient scenario, power and temperatures adjusts up or down and the core will return to a zero-reactivity state at some new power level and temperature. Re-arranging Equation (11), the normalized power level can be expressed as:
The coolant temperature rise across the core is a function of the power/flow ratio. It is given by:
where ΔTco is the standard operating condition coolant temperature rise.
The coolant outlet temperature, using the preceding definitions, is given by:
Combining Equations (13) and (14), the change in coolant outlet temperature can then be described as:
The average temperature of the fuel can be described at steady state conditions as:
where ΔTrcl is the average radial temperature increase across the cladding steel, and ΔTrf is the average radial temperature increase across the fuel annulus.
As the core adjusts to the perturbed conditions, the new fuel temperature is calculated as:
The integral reactivity parameter A is directly dependent on the power level of the core and only includes reactivity parameters that are directly linked to the fuel temperature. In this study, three alternative interpretations of A for annular metallic fuel have been considered, defined as:
where ΔTf is the difference between the average fuel and average coolant temperatures. (1) applies when the fuel is not mechanically bound to the clad; (2) applies when fuel and clad are bound and the system expansion (εfc) is given by Equation (7); and (3) applies when fuel and clad are bound and fuel expansion is not included, as recommended in [37].
It appears option (2) is most applicable for the systems studied in this paper, and it is the one used for safety analysis in this paper. In future studies, all three options should be considered in order to identify the most conservative modeling approach. On this topic, Wade states [39] (1988): “At the current time, the fuel axial expansion coefficient is an ambiguous one: if the fuel moves free of the clad, then αf goes with the fuel temperature along with αD; alternately if the fuel is linked to the clad, then αf goes with the coolant temperature. Experimental results do not yet make a clear choice possible and we will consider both options in all that follows. This is not viewed as an uncertainty but rather as an open issue, which can be resolved by future experiments.” To the author’s knowledge, such experimental data have not been published since and this remains an open issue. The power/flow coefficient B is defined as:
The integral coolant inlet temperature coefficient of reactivity C is defined as:
Since the fuel axial expansion reactivity coefficient is a component of B and C as well, the same three alternatives as defined in Equation (16) is used as options also for the B and C parameters.
7.2. Loss of Flow
In the unprotected loss of flow event (ULOF), the primary system pumps are tripped and forced flow is lost without the actuation of the core SCRAM system. The coolant inlet temperature is assumed to remain constant (i.e., δTin = 0). The accident progression is:
- Primary system pumps are tripped
- Power-to-flow ratio increases raising the average core temperature
- The temperature rise introduces negative reactivity which lowers core power
- Natural circulation flow is established at low power
In order to solve Equation (11) in a useful manner to analyze accident scenarios, some idealizations are necessary. In the ULOF scenario, it is the power/flow-ratio that determines the accident progression rather than the normalized power by itself. Thus the value for P coupled to the integral power reactivity parameter A is set to zero for the asymptotic state. Letting P/F remain a variable, Equation (11) can be solved to show the quasi-static (long term) response:
The change in the mixed mean core coolant outlet temperature for the ULOF scenario becomes:
The ULOF scenario has been refined to include a non-zero power and flow in the following way [40]:
In this study, it is assumed natural circulation is established at 2% flow (F = 0.02).
7.3. Primary Pump Overspeed
The unprotected pump overspeed scenario (UPPO) is the opposite of the ULOF. It could potentially be reached by a signal error in the primary pump control system. Depending on the type of pumps used, the severity of the UPPO event is limited by physical phenomena such as a cavitation and limits in the power supply to the pumps. Severe UPPO events could in fact be initiators of subsequent LOF & ULOF events as pumps may fail, which indicate a need to study the effects of these events in series. Initially, the increased coolant flow rate caused by UPPO will reduce the coolant outlet temperature and increase core power. Solving Equation (11) for the initial stage gives:
The heat removal system cannot reject all the power produced in the core, and subsequently the core inlet temperature will rise and power will return to P = 1. Again solving Equation (11) gives:
The normalized flow rate F in the UPPO-scenario analyzed in this paper is assumed to be 2.0 (200% of nominal flow rate), which is highly unlikely or even impossible but gives a conservative upper bound for the scenario.
7.4. Control Element Ejection
The unprotected transient overpower (UTOP) scenario studied involves the insertion of positive reactivity by the ejection of one of nine burnup control assemblies, the composition of which are all tailored to have the same reactivity worth. The peak added reactivity in a TOP scenario (occurring near the middle of the burnup cycle) is thus:
where Δkcycle is the burnup reactivity swing and 9 is the number of burnup control assemblies
Initially, the reactivity will give an increase in power, with F = 1 and δTin = 0, which for Equation (11) yields:
The heat removal system on the secondary side cannot maintain a constant primary coolant core inlet temperature at the higher power level, so δTin will adjust to bring power back to its nominal value (P = 1). Solving Equation (11) for this scenario gives:
7.5. Loss of Heat Sink
In an unprotected loss of heat sink event (ULOHS), heat rejection to the secondary system is lost, while primary coolant pumps continue to operate. As the transient is reaching its asymptotic state, the power level has reached decay heat levels. The larger the primary coolant inventory heat capacity, the longer time it takes to reach peak temperatures. The final stable asymptotic state in the ULOHS scenario is reached when the positive reactivity introduced by bringing the power toward zero, (A + B), is balanced by the negative reactivity introduced by the rise in coolant temperature (at this point Tin = Tout, ΔTc = 0). Solving Equation (11) for the ULOHS scenario gives:
7.6. Chilled Inlet Temperature
The unprotected chilled inlet scenario (UCI) is, opposite to the ULOHS, a situation where the secondary cycle heat removal system is operating above nominal capacity, resulting in a drop in the primary coolant inlet temperature. The flow rate (F) remains constant, while the power P increases. Solving Equation (11) for this scenario yields:
The reduction in coolant inlet temperature δTin is limited to the solidification temperature of sodium (~125 °C), at which point the solid sodium causes flow blockages that turn the situation in to a combined loss of flow and loss of heat sink scenario. The situation analyzed in this paper is δTin = −155 °C, which means a reduction of the coolant inlet temperature to 200 °C.
7.7. QSRB Analysis Results
The peak quasi-static fuel and coolant temperatures were calculated for all cores for each of the seven possible isolated events presented; ULOF, UTOP (initial and final), ULOHS, UCI, UPPO (initial and final). Calculations were performed using all three interpretations of the axial fuel expansion reactivity effect, but for brevity only the results using the physical stress balance equation (Equation (7)) are presented. The resulting temperatures and the corresponding transient scenarios are summarized in Table 4. The temperature data in this table are indicative of trends at best, and higher temperatures may be reached at earlier stages of the transient, particularly in loss-of-flow events. This analysis will be supplemented by more detailed time-dependent transient analysis of the most promising core design options.
There are three main factors impacting the resulting temperatures and how they differ between the different cores:
- ▪
- The fuel linear power density and corresponding ΔTf in standard operation
- ▪
- The burnup, burnup reactivity swing and corresponding ρext
- ▪
- Differences in αco
| Transient | Temperature (°C) * | Power (MW) | ||||||||
|---|---|---|---|---|---|---|---|---|---|---|
| 50 | 75 | 100 | 150 | 200 | 250 | 300 | 350 | 400 | ||
| ULOF | C | 569 | 560 | 575 | 583 | 597 | 619 | 628 | 630 | 645 |
| F | 574 | 583 | 590 | 600 | 611 | 608 | 619 | 635 | 643 | |
| Cy | B | B | B | B | B | B | B | B | B | |
| UPPO (initial) | C | 553 | 531 | 535 | 528 | 526 | 525 | 524 | 523 | 522 |
| F | 595 | 634 | 628 | 650 | 670 | 685 | 701 | 715 | 728 | |
| Cy | M | E | M | M | M | M | E | E | M | |
| UPPO (final) | C | 615 | 514 | 521 | 517 | 518 | 519 | 522 | 521 | 527 |
| F | 533 | 634 | 648 | 671 | 690 | 708 | 726 | 739 | 759 | |
| Cy | E | E | E | E | E | E | M | E | E | |
| ULOHS | C | 522 | 512 | 527 | 533 | 552 | 568 | 582 | 590 | 628 |
| F | 623 | 634 | 647 | 660 | 684 | 704 | 721 | 731 | 778 | |
| Cy | E | E | E | E | E | E | E | E | E | |
| UTOP (initial) | C | 583 | 575 | 603 | 621 | 637 | 666 | 677 | 688 | 715 |
| F | 613 | 646 | 683 | 739 | 787 | 851 | 893 | 936 | 1003 | |
| Cy | M | M | M | M | M | M | M | M | M | |
| UTOP (final) | C | 577 | 569 | 596 | 619 | 640 | 686 | 717 | 729 | 787 |
| F | 618 | 652 | 603 | 747 | 792 | 864 | 917 | 947 | 1032 | |
| Cy | M | M | M | M | M | M | M | M | M | |
* C and F in the second column refer to peak coolant and fuel temperatures in °C respectively, and Cy marks what point the cycle (B = Beginning, M = Middle or E = End) the peak temperature occurs.
While inherent safety, here defined as the response of the core and core component temperatures to unprotected transients [41], is directly linked to reactivity feedback coefficients, only one feedback (αc) changes strongly enough between these cores to have an important impact on transient scenario temperatures. Operating parameters such as power density and the average discharge burnup affect core safety to a larger extent than the changes seen in αr, αD and αf between the different cores.
The coolant outlet temperature response to a loss-of-flow scenario is proportional to the ratio A/B, which increases ten times from 0.09 for the 50 MWt core to 1.00 for the 550 MWt core. However, if the linear power density and thus ΔTf is kept constant, the increase is a mere 35% (from 0.09 to 0.121). Similarly, the coolant temperature response to UTOP is proportional to ρext/|B|, which also increases ten times from 0.22 for the 50 MWt core to 2.38 for the 550 MWt core. If ρext is kept constant, the increase is 23%, from 0.22 to 0.27. The response to ULOHS and UCI is proportional to the ratio CΔTco/B, and does not change noticeably with core size. Fuel temperatures are higher for larger cores in these scenarios simply because standard operating fuel temperatures are higher due to the higher linear power density.
In any unprotected transient, the main objectives are to avoid sodium boiling and fuel melting (and, ideally, avoid damage to the cladding). Sodium boils at 883 °C (at atmospheric pressure) and the fuel melts at ~1100 °C, so introducing a QSRB-transient temperature margin of 150 °C gives a peak allowable coolant temperature of 733 °C and a peak fuel temperature of 950 °C. For cores larger than ~80 MWt, it is the events involving the reactivity vested in control elements that pose the most challenging transients, specifically near MOC when the uncontrolled reactivity is the highest. As is shown in Table 4, optimized 100-kPa cores with a thermal power above 350 MW require reactivity swings so large that the temperatures in the UTOP scenario exceed constraints.
The low reactivity vested in the fuel temperature above the coolant temperature leads to a relatively benign quasi-static response in ULOF scenarios, but the study of ULOF needs to be supplemented by time-dependent analysis that includes the pump coast-down period. Apart from in the ULOF scenario, higher temperatures in accident scenarios are reached if the transient occurs late in the burnup cycle. For all but the smallest cores, a UTOP occurring when ρext is at its maximum near MOC is the most severe accident scenario.
8. Conclusions and Future Work
This extensive parametric study has determined the factors impacting design choices for 30-year stationary singe-fuel loaded fast reactor cores, subject to the constraints discussed in this paper. The fuel rod geometry, core layout, and general plant design yielding optimal performance has been defined. Open parameters were the core thermal power level and constraints for pressure drop and irradiation damage. The core power for the preferred “short-vessel” (100 kPa pressure drop constraint) optimized design is limited to 100 MWt with the present irradiation damage database (200 DPA). The core can be uprated to 150 MWt with a realistic extension to this limit (300 DPA) and the power finally limited by safety considerations to 350 MWt with an arbitrarily high irradiation damage constraint. An arbitrary reduction in the core power density, which would yield a sub-optimal design for the given set of general core parameters and constraints, would allow a higher total operating power for all these cases. Some of the most important parameters of the three identified optimal designs are summarized in Table 5.
| Operational Parameter | Irradiation Damage Constraint | ||
|---|---|---|---|
| 200 DPA | 300 DPA | 500 DPA | |
| Optimum thermal power | 100 MWt | 150 MWt | 350 MWt |
| Est. electric power (40% efficiency) | 40 MWe | 60 MWe | 140 MWe |
| Actual DPA | 200 | 300 | 432 |
| Power-limiting factor | DPA | DPA | UTOP |
| Core-averaged burnup (MWd/kg-actinide) | 67 | 100 | 144 |
| Peak burnup (MWd/kg-actinide) | 126 | 189 | 269 |
| Peak fast fluence (n/cm2, E > 0.1 MeV) | 4.31× 10²³ | 6.47 × 10²³ | 9.30 × 10²³ |
| Active core volume (m3) | 2.2 | 2.6 | 4.6 |
| Actinide/fissile feed-fuel mass (tons) | 14.5/1.7 | 16.7/2.0 | 26.6/2.9 |
| Average volumetric power density (kW/L) | 45 | 58 | 76 |
| Average specific power density (kW/kg-actinide) | 6.9 | 9.0 | 13.2 |
| Total fuel rod length (cm) | 201 | 211 | 248 |
| Minimum QSRB-transient margin to coolant boiling (°C) | 277 | 259 | 151 |
It appears highly likely that advanced low-swelling steels (possibly optimized heats of HT9) will be able to perform well up to and above a neutron irradiation damage of 300 DPA. Because of its superior economic potential due to the significantly higher power density, the 150 MWt 300-DPA core will be the main focus of future research rather than the smaller 100 MWt 200-DPA core. This future work will include the following objectives:
- ▪
- Implementation of ARC systems [21] for improved response to transients as well as for autonomous burnup reactivity swing control, removing the need for burnup control assemblies and with that removing the UTOP accident scenario
- ▪
- Fully time-dependent analysis of unprotected transients without SCRAM
- ▪
- Analysis of reprocessing options and equilibrium state core performance
- ▪
- Detailed design of fission gas venting systems specifically optimized for metallic-fuel alloys
- ▪
- Detailed determination of cladding, duct wall and inter-assembly gap thickness requirements
- ▪
- Analysis of the advantages and disadvantages of axial enrichment zoning
- ▪
- Analysis of the potential for a natural circulation versions of the core design, cooled by a heavy liquid metal such as lead or lead-bismuth eutectic
- ▪
- Component design development specifically aimed to enable unit factory mass-production.
Conflicts of Interest
The author declares no conflict of interest.
References
- Greenspan, E. STAR: The Secure Transportable Autonomous Reactor System, Encapsulated Fission Heat Source (The ENHS Reactor); University of California: Berkeley, CA, USA, 2003. [Google Scholar]
- Wade, D.C. ARC-100: A modular nuclear plant and symbiotic fuel cycle. In Proceedings of the 4th Asia Pacific Forum on Small and Medium Reactors: Benefits and Challenges, Berkeley, CA, USA,, 18–19 June 2010.
- Grandy, C. An overview of U.S. SFR design concepts. In Proceedings of the GIF/INPRO Workshop on SFR Safety, Vienna, Austria, 30 November–1 December 2011.
- ANL/CEA/JNC. Small Modular Fast Reactor Design Description; Argonne National Lab, Commesariat a l’Energie Atomique/Japan Nuclear Cycle Development Institute: Chicago, IL, USA, 2005. [Google Scholar]
- Choi, S.; Bae, J.H.; Lim, J.; Puspitarini, D. Long burning small modular reactor based on natural circulation. Nucl. Eng. Des. 2011, 243, 1486–1499. [Google Scholar] [CrossRef]
- Tsuboi, Y.; Arie, K.; Ueda, N.; Grenci, T.; Yacout, A.M. Design of the 4S Reactor. Nucl. Technol. 2012, 178, 201–217. [Google Scholar]
- Brown, N.W.; Hassberger, J.A.; Smith, C.; Carelli, M.; Greenspan, E.; Peddicord, K.; Stroh, K.; Wade, D.C.; Hill, R.N. The secure, transportable, autonomous reactor system. In Proceedings of the International Conference on Future Nuclear Systems, Jackson Hole, WY, USA,, 29 August–2 September 1999.
- Rough, F.A. An Evalutation of Data on Zirconium-Uranium Alloys; Battelle Memorial Institute: Columbus, OH, USA, 1955. [Google Scholar]
- Ryu, H.; Lee, B.O.; Oh, S.J.; Kim, J. H.; Lee, C.B. Performance of FCCI barrier foils for U-Zr-Z metallic fuel. J. Nucl. Mater. 2009, 392, 206–212. [Google Scholar] [CrossRef]
- Kaity, S.; Banerjee, J.; Ravi, K.; Keswani, R.; Kutty, T.R.; Kumar, A.; Prasad, G.J. Characterization and property evaluation of U-15 wt% Pu alloy for fast reactor. J. Nucl. Mater. 2012, 433, 206–214. [Google Scholar] [CrossRef]
- Horak, J.A.; Kittel, J. H.; Yaggee, F.L. Irradiation Behavior of Restrained and Vented Uranium-2 w/o Zirconium Alloy; Argonne National Laboratory: Lemont, IL, USA, 1962. [Google Scholar]
- Martini, M.; Gerosa, A. Venting device for sodium-cooled fast ceramic reactor fuel elements. Nucl. Technol. 1973, 19, 96–110. [Google Scholar]
- Barthold, W.P. Constrained Nuclear Design. In Proceedings of the ANS Meeting on Advanced Reactors; Physics, Design and Economics, Atlanta, GA, USA, 8 September 1974.
- Waltar, A.E.; Todd, D.R.; Tsvetkov, P.V. Fast Spectrum Reactors; Springer: New York, NY, USA, 2012. [Google Scholar]
- Hong, S.G.; Greenspan, E. Power flattening options for the ENHS (encapsulated nuclear heat source) core. Prog. Nucl. Energy 2005, 47, 178–189. [Google Scholar] [CrossRef]
- Todreas, N.E.; Kazimi, M.S. Thermal Hydraulic Fundamentals 1 & 2, 2nd ed.; Taylor & Francis: Cambridge, UK, 2011. [Google Scholar]
- Qvist, S.; Greenspan, E. The ADOPT code for automated fast reactor core design. Ann. Nucl. Energy 2014, 71, 23–36. [Google Scholar] [CrossRef]
- Toloczko, M.B.; Garner, F.A.; Eiholzer, C.R. Irradiation creep and swelling of the US fusion heats of HT9 and 9Cr-1Mo to 208 dpa at ~400 °C. J. Nucl. Mater. 1994, 212–215, 604–607. [Google Scholar]
- Gilleland, J. Traveling wave reactor: A sustainable globally scalable energy solution for the near and long term future. In Proceedings of the International Congress on Advances in Nuclear Power Plants (ICAPP) 2014, Jeju, Korea, 14–18 April 2013.
- ASME. Boiler and Pressure Vessel Code; Article UG-27; ASME: New York, NY, USA, 2005. [Google Scholar]
- Qvist, S.; Greenspan, E. The autonomous reactivity control system. In Proceedings of the International Congress on Advances in Nuclear Power Plants (ICAPP), Charlotte, NC, USA, 6–9 April 2014.
- Leppänen, J. Serpent monte carlo physics code. In Proceedings of the AER Symposium on VVER Reactor Physics and Reactor Safety, Espoo, Finland, 20–24 September 2010.
- Wade, D.C.; Chang, Y.I. The integral fast reactor (IFR) concept: Physics of operation and safety. In Proceedings of the International Topical Meeting on Advances in Reactor Physics Mathematics and Computation, Paris, France, 27 April 1987.
- Hellesen, C. Personal Communication, Uppsala University: Uppsala, Sweden, March 2014.
- Greenwood, L.R.; Smither, R.K. SPECTER: Neutron Damage Calculations for Materials Irradiations; Argonne National Laboratory: Lemont, IL, USA, 1985. [Google Scholar]
- Chadwick, M.B. ENDF/B-VII. 0: Next generation evaluated nuclear data library for nuclear science and technology. Nucl. Data Sheets 2006, 107, 2931–3060. [Google Scholar] [CrossRef]
- Fanning, T.H. The SAS4A/SASSYS-1 Safety Analysis Code System, ANL/NE-12/4; Argonne National Laboratory: Lemont, IL, USA, 2012. [Google Scholar]
- Fanning, T.H. SAS4A/SASSYS-1: Point Kinetics and Reactvity Feedback; Argonne National Laboratory: Lemont, IL, USA, 2013. [Google Scholar]
- Van Tuyle, G.J. Summary of Advanced LMR (Liquid Metal Reactor) Evaluations: PRISM (Power Reactor Inherently Safe Module) and SAFR (Sodium Advanced Fast Reactor); Brookhaven National Laboratory: Upton, NY, USA, 1989. [Google Scholar]
- Hejzlar, P.; Davis, C.B. Performance of the lead-alloy-cooled reactor concept balanced for actinide burning and electricity production. Nucl. Technol. 2004, 147, 344–367. [Google Scholar]
- KAERI. SSC-K Code Users Manual (Rev.1); Korea Atomic Energy Research Institute: Daejeon, Korea, 2002. [Google Scholar]
- Sathiyasheela, T.; Riyas, A.; Sukanya, R. Inherent safety aspects of metal fuelled FBR. Nucl. Eng. Des. 2013, 265, 1149–1158. [Google Scholar] [CrossRef]
- Bauer, A.A. An Evaluation of the Properties and Behaviour of Zirconium-Uranum Alloys; Batelle Memorial Institute: Columbus, OH, USA, 1959. [Google Scholar]
- Qvist, S. Safety and Core Design of Large Liquid-Metal Cooled Fast Breeder Reactors; University of California Berkeley: Berkeley, CA, USA, 2013. [Google Scholar]
- Cahalan, J.E. Chapter 4: Reactor Point Kinetics, Decay Heat, and Reactivity Feedback. In SASSYS/SAS4A Manual; Argonne National Laboratory: Lemont, IL, USA, 2012. [Google Scholar]
- Sofu, T.; Kramer, J.M. FPIN2: Pre-Failure Metal. Fuel Pin Behavior Model; Nuclear Engineering Division, Argonne National Laboratory: Lemont, IL, USA, 2012. [Google Scholar]
- Wade, D.C.; Fujita, E.K. Trends vs. reactor size of passive reactivity shutdown and control performance. In Proceedings of the Annual NEA-CRP meeting, Helsinki, Finland, 14 September 1987.
- Qvist, S.; Greenspan, E. Inherent safety of minimum-burnup breed & burn reactors. In Proceedings of the International Congress on Advances in Nuclear Power Plants (ICAPP), Chicago, IL, USA, 24–28 June 2012.
- Wade, D.C. A simplified analysis of uncertainty propagation in inherently controlled ATWS events. In Proceedings of the Annual NEA-CRP meeting, Helsinki, Finland, 14 September 1987.
- Janssen, A.J. On the Safety of the ALMR: Some Physics Aspects; The Netherlands Energy Research Foundation ECN: Petten, The Netherlands, 1994. [Google Scholar]
- Van Dam, H. Physics of nuclear reactor safety. Rep. Prog. Phys. 1992, 11, 2025–2071. [Google Scholar]
© 2014 by the authors; licensee MDPI, Basel, Switzerland. This article is an open access article distributed under the terms and conditions of the Creative Commons Attribution license (http://creativecommons.org/licenses/by/3.0/).
Share and Cite
MDPI and ACS Style
Qvist, S. Optimizing the Design of Small Fast Spectrum Battery-Type Nuclear Reactors. Energies 2014, 7, 4910-4937. https://doi.org/10.3390/en7084910
AMA Style
Qvist S. Optimizing the Design of Small Fast Spectrum Battery-Type Nuclear Reactors. Energies. 2014; 7(8):4910-4937. https://doi.org/10.3390/en7084910
Chicago/Turabian StyleQvist, Staffan. 2014. "Optimizing the Design of Small Fast Spectrum Battery-Type Nuclear Reactors" Energies 7, no. 8: 4910-4937. https://doi.org/10.3390/en7084910