An Economic and Environmental Assessment Model for Selecting the Optimal Implementation Strategy of Fuel Cell Systems—A Focus on Building Energy Policy


Abstract
:1. Introduction
2. Literature Review
3. Materials and Methods
3.1. Part 1: Establishment of Comparison Type of Building and Calculation of Energy Demand
3.1.1. Establishment of Comparison Type of Building from the Perspective of Building Energy Policy
- Certification of NREs: this certification scheme was designed to guarantee the quality of systems manufactured or imported to enhance user reliability. Certification of NREs focuses on promoting the commercialization of NRE technologies (i.e., solar thermal, solar PV, wind power, geothermal, and fuel cell) in buildings;
- NREs mandatory use for public buildings: under this mandatory scheme, new buildings of public institutions (i.e., administrative bodies, local autonomous entities, and state-run companies), the floor area of which exceeds 1,000 square meters, are obliged to use more than 10% of their total expected energy consumptions from installed NREs;
- The standard of energy cost calculation: for the purpose of acceleration of NREs deployment, the government provides a special fuel unit price (i.e., a special unit price for gas only used for fuel cells) and a system marginal price (SMP) electricity market price applied in transactions involving electricity generated from non-fossil fuels, for NREs users to participate in the utility market; and
- The standard of government subsidy: the government provides subsidies for NREs users to promote NREs deployment. Those government subsidy schemes are classified into two categories which are the test-period deployment subsidy program and the general deployment subsidy program. The test-period deployment subsidy program aims to support the newly developed technologies and systems to advance into the market. On the other hand, the general deployment subsidy program aims to activate the market for NREs which already have been commercialized (i.e., solar PV, wind power, geothermal, and fuel cell).


| Category | Multi-family housing complex | Multi-use office complex |
|---|---|---|
| Location | Seoul | Seoul |
| Type | Residential | Non-residential |
| Heating system | Centralized | Centralized |
| Government subsidy | Yes (technically)No (practically) | Yes (technically)No (practically) |
| Progressive tax | Yes | No |
| Occupants of the building | Residents | Commuters/Students |
| Hours of use | AM 6–8/PM 7–12 (7 h) | AM 8–PM 8 (12 h) |
| Major energy consumption | Elec > Gas | Elec >> Gas |
| Amount of electricity per year (TOE) | 1,885.35 | 4,822.08 |
| Amount of Gas per year (TOE) | 842.87 | 534.17 |
| Total amount of Energy (TOE) | 2,728.22 | 5,356.25 |
| Total Energy Cost (US$) | 1,414,634 | 1,382,248 |
3.1.2. Calculation of the Monthly Energy Demand of a Given Building
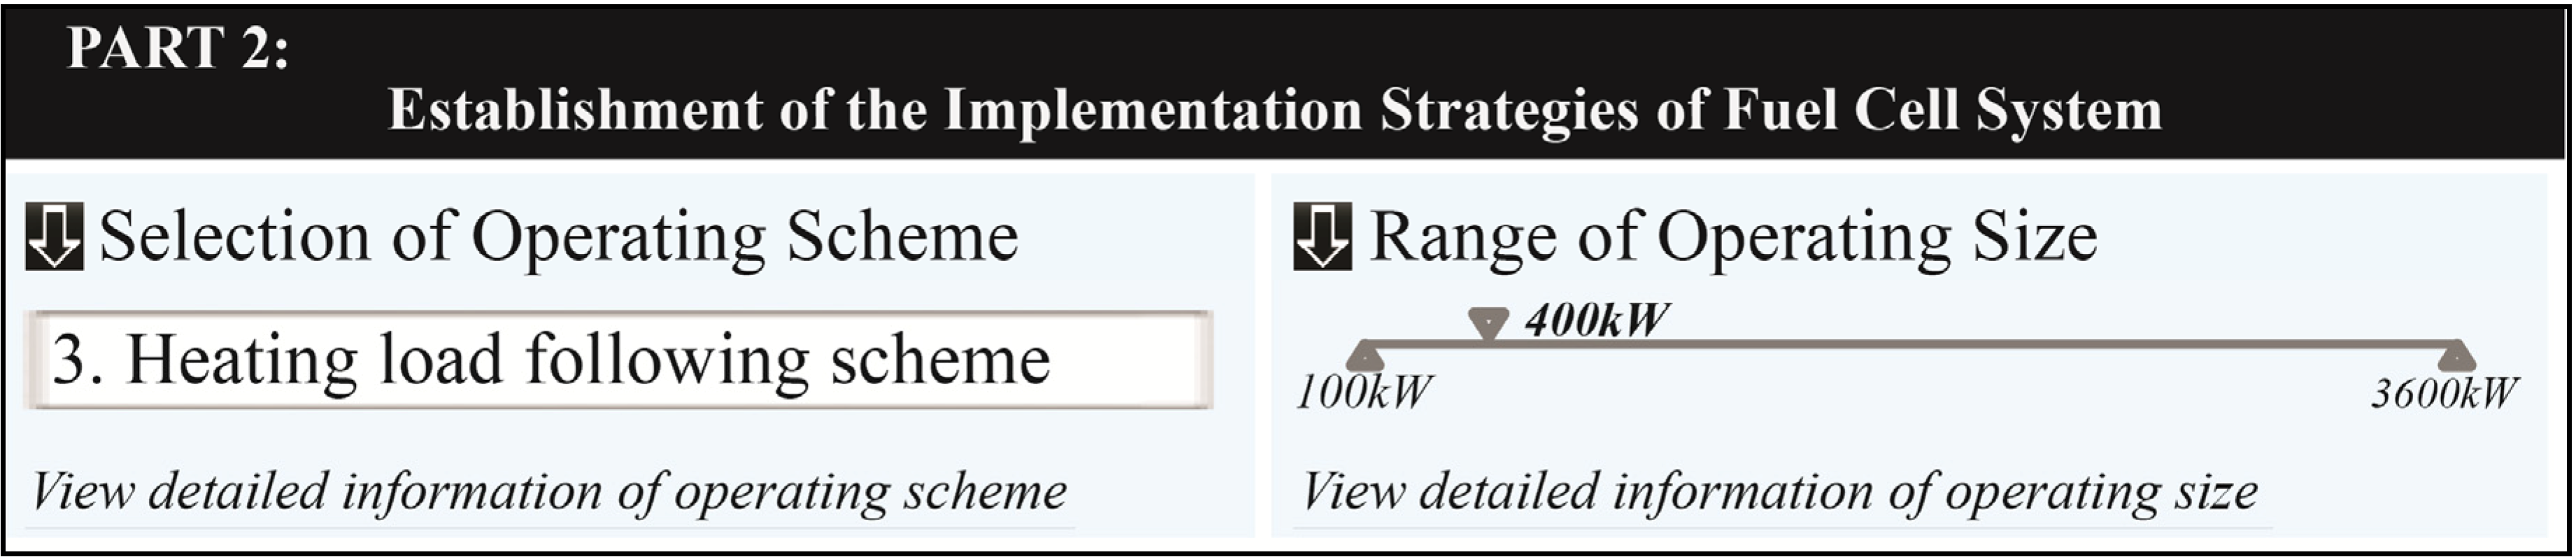
3.2. Part 2: Establishment of the Fuel Cell System Implementation Strategies
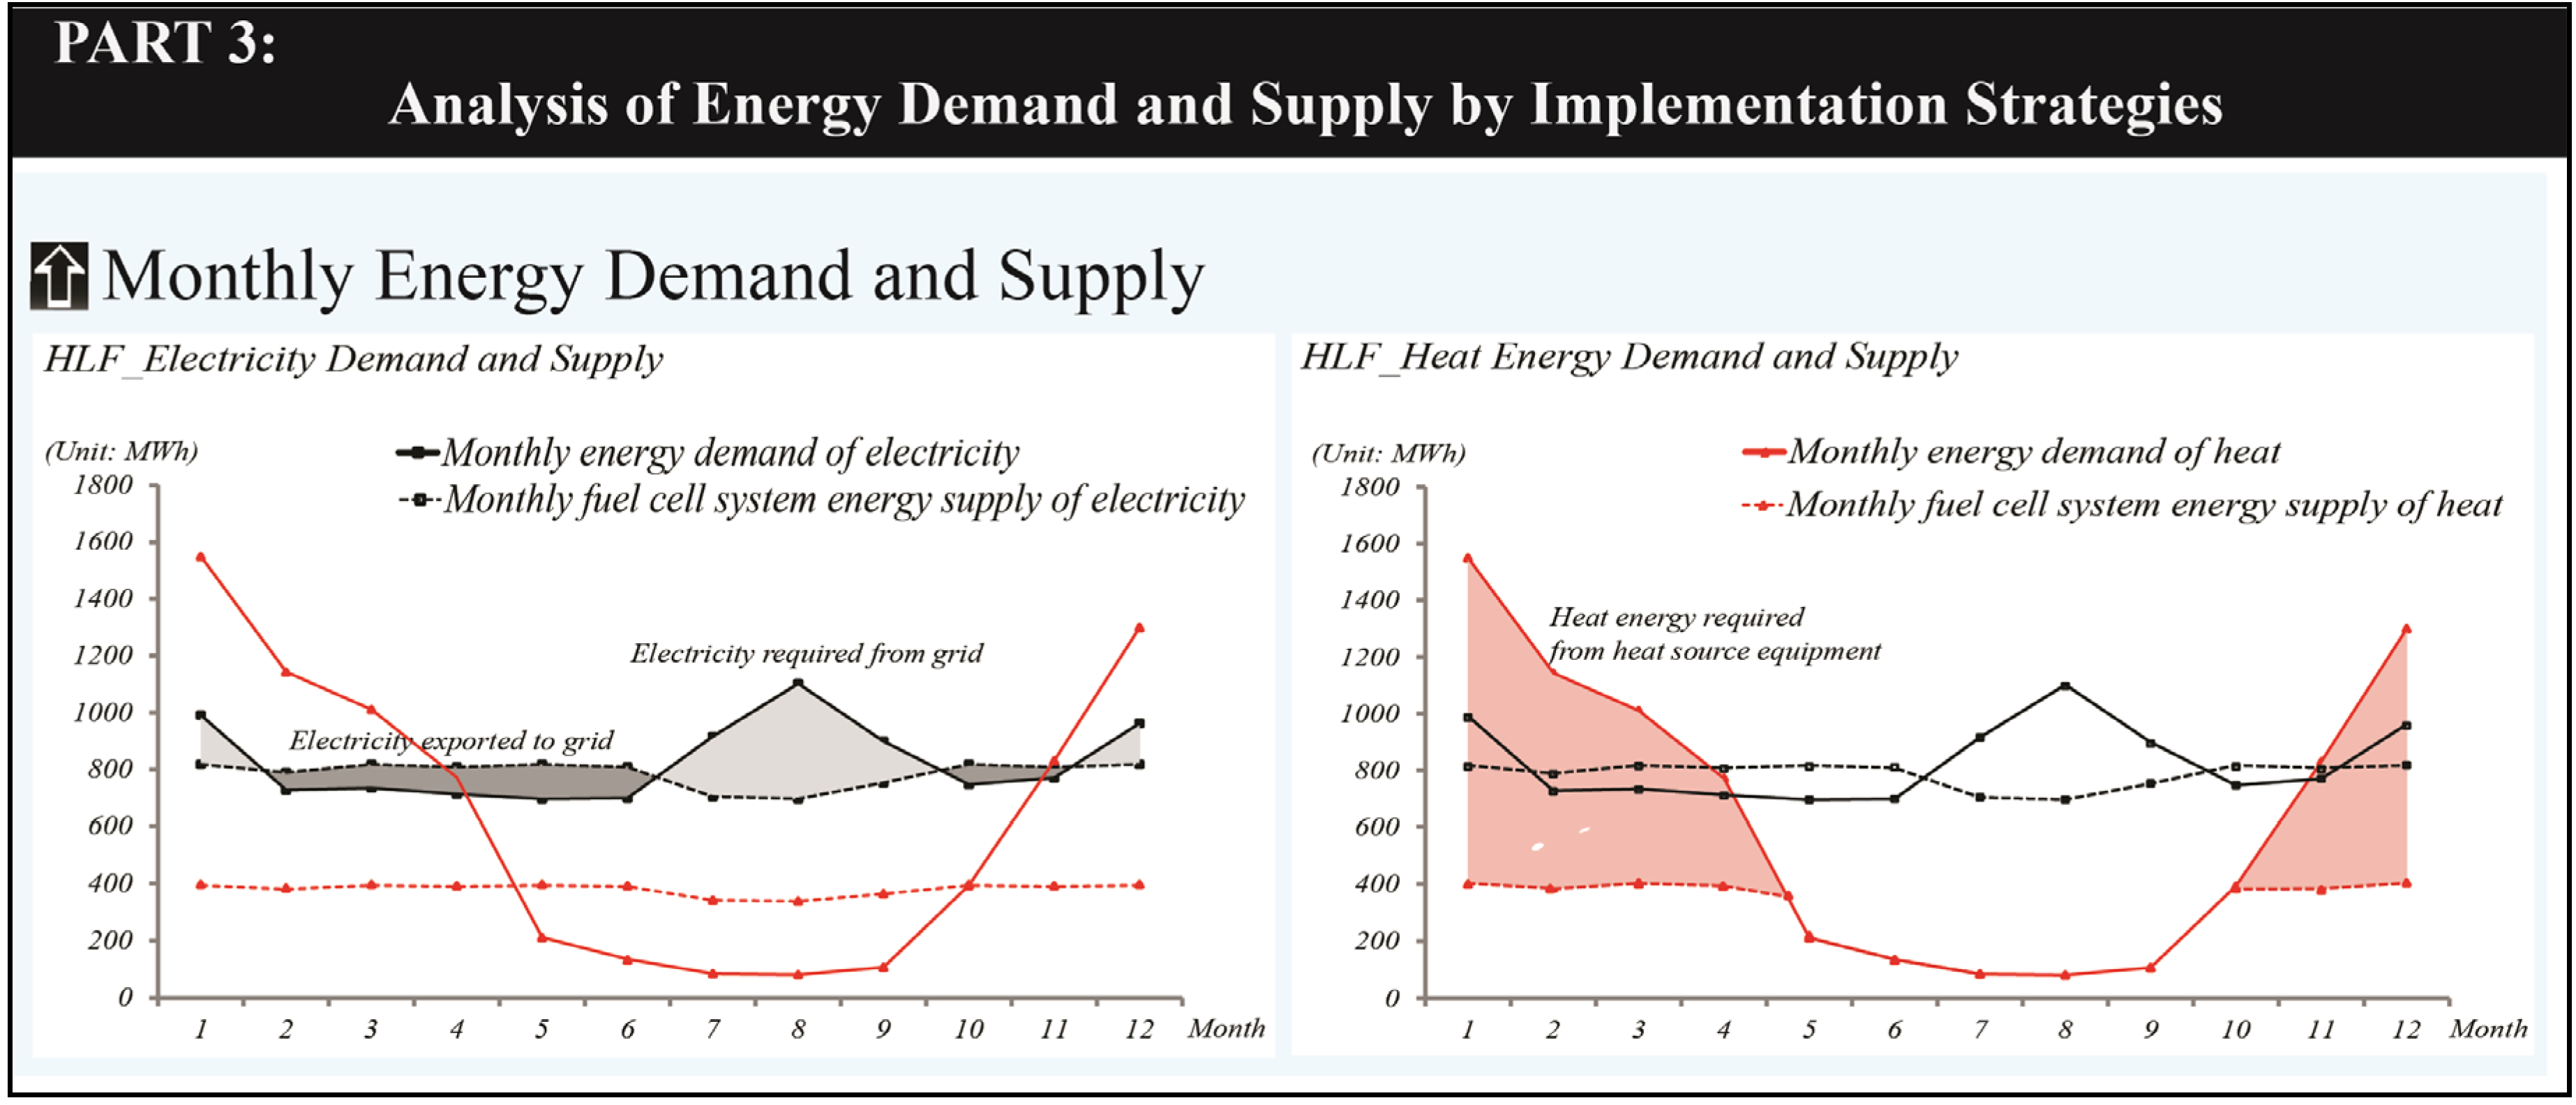
3.3. Part 3: Analysis of Energy Demand and Supply by Implementation Strategies


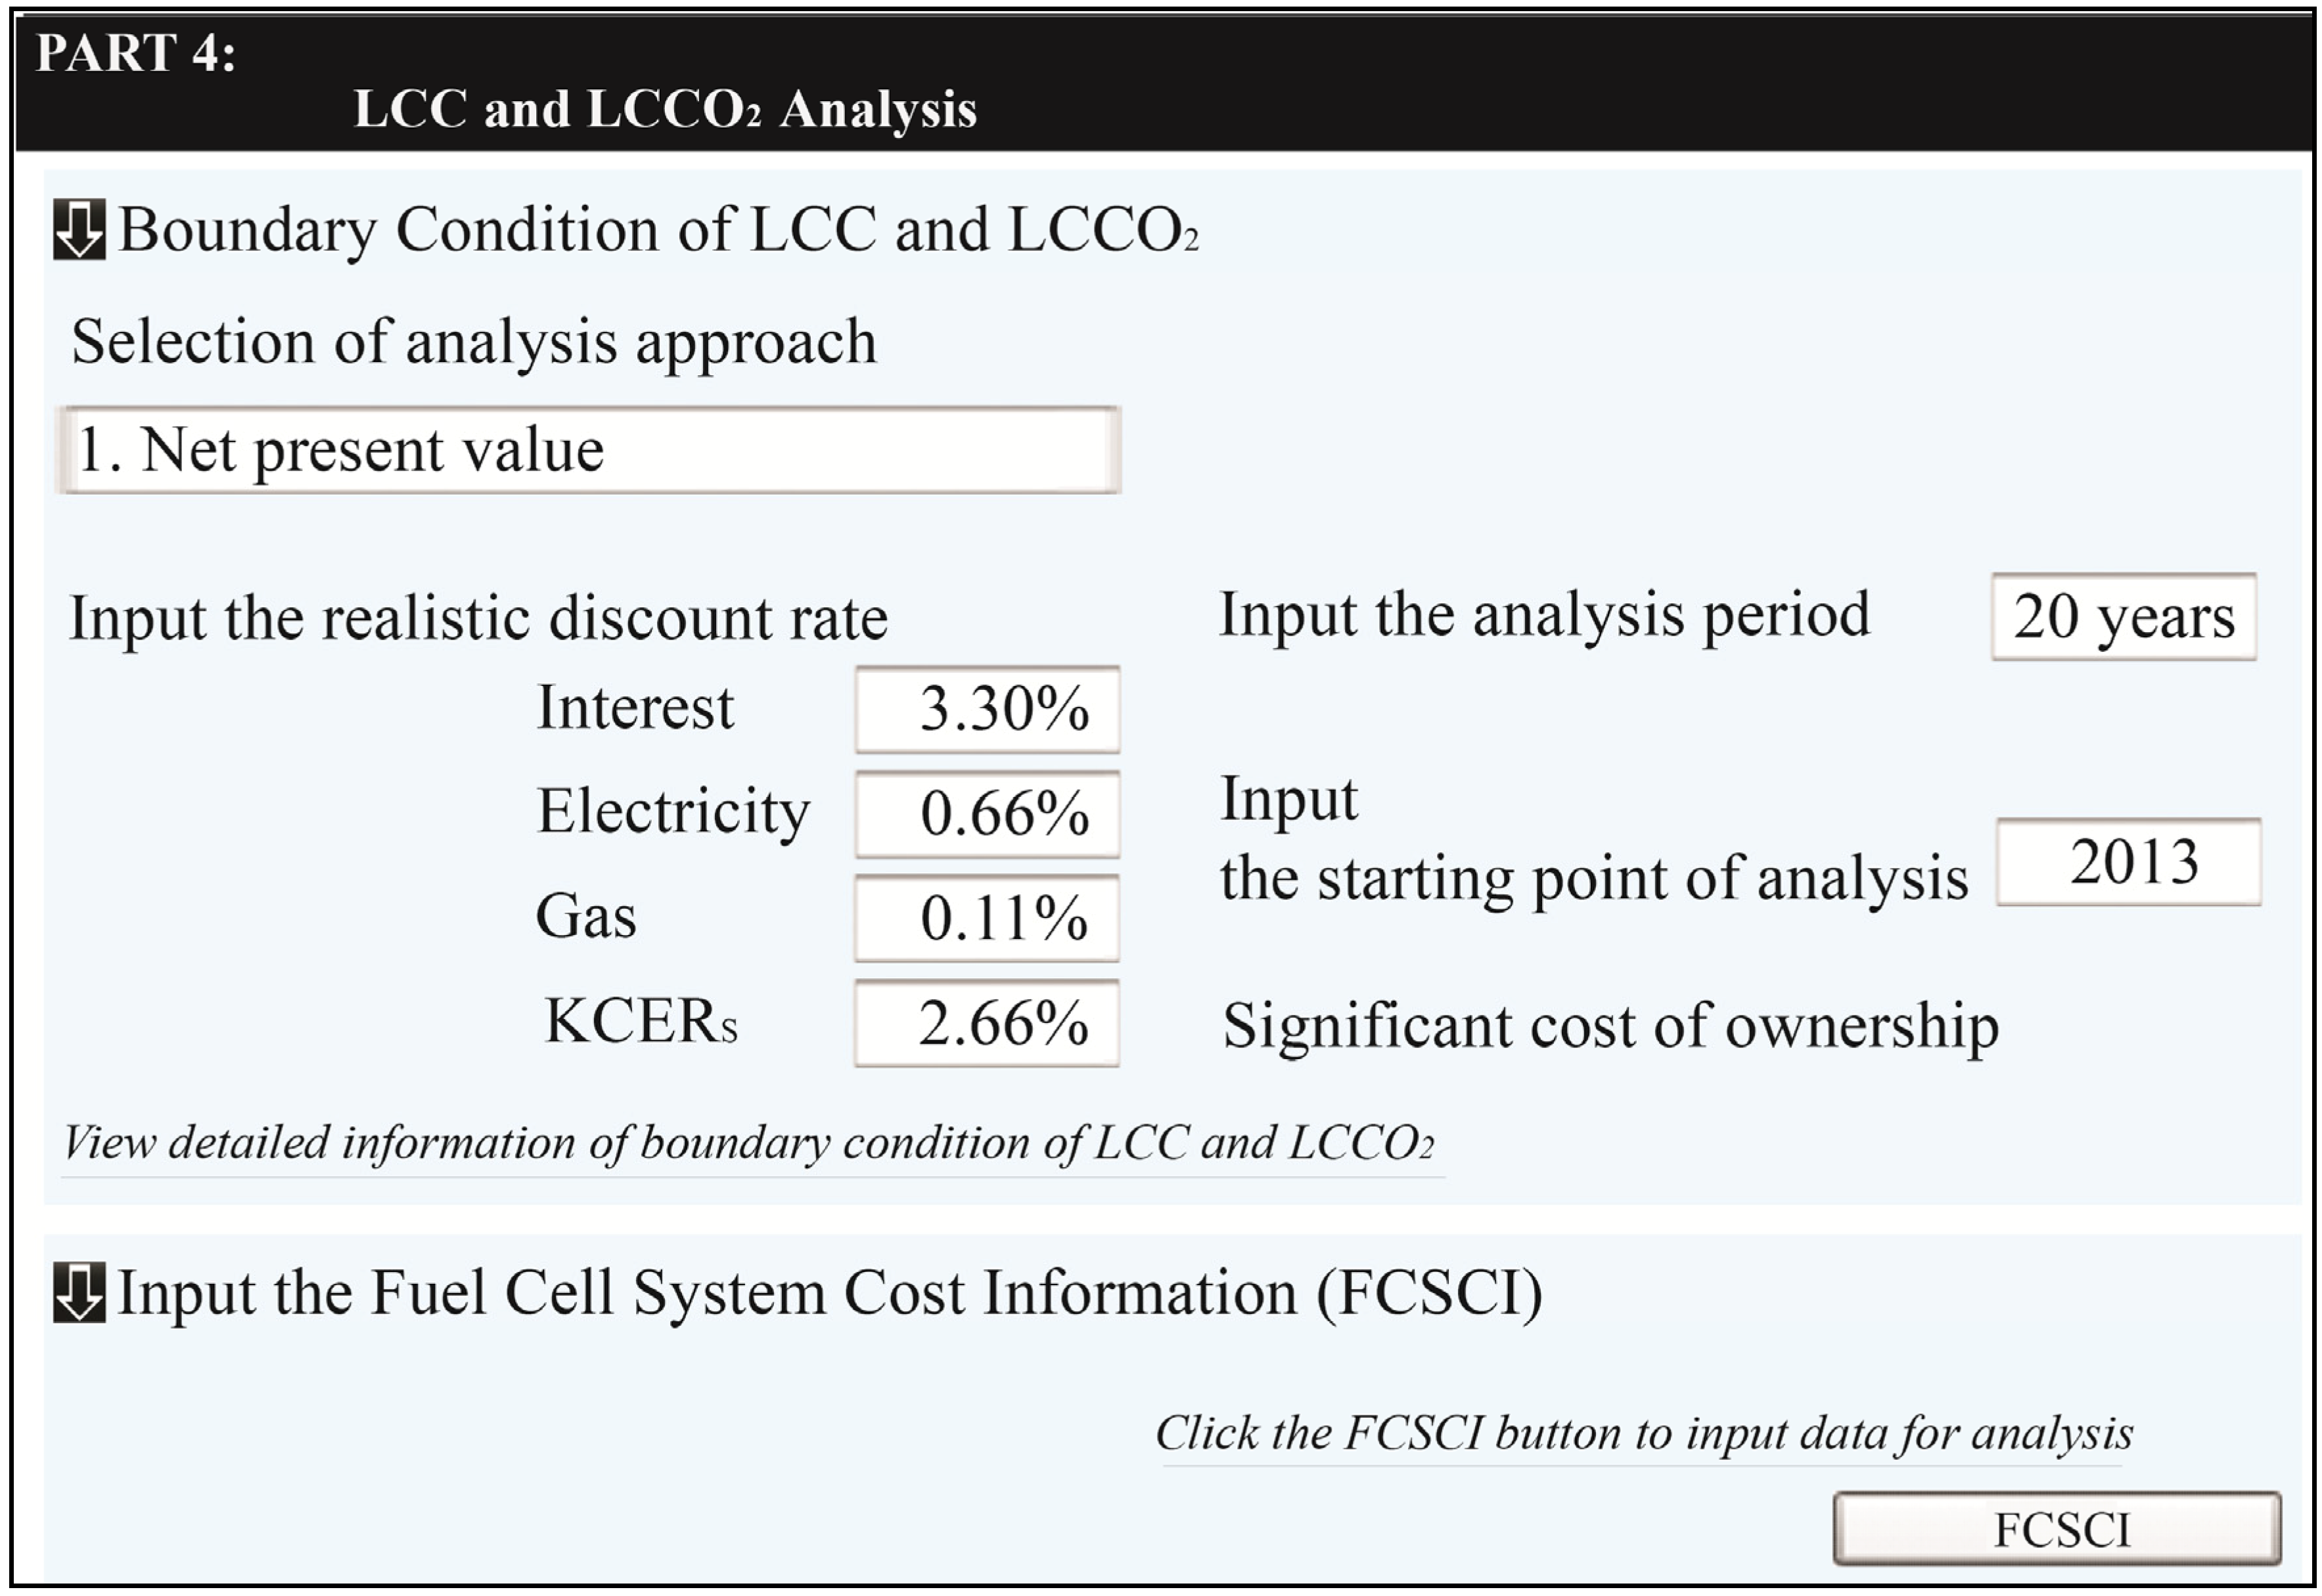
3.4. Part 4: LCC and LCCO2 Analysis

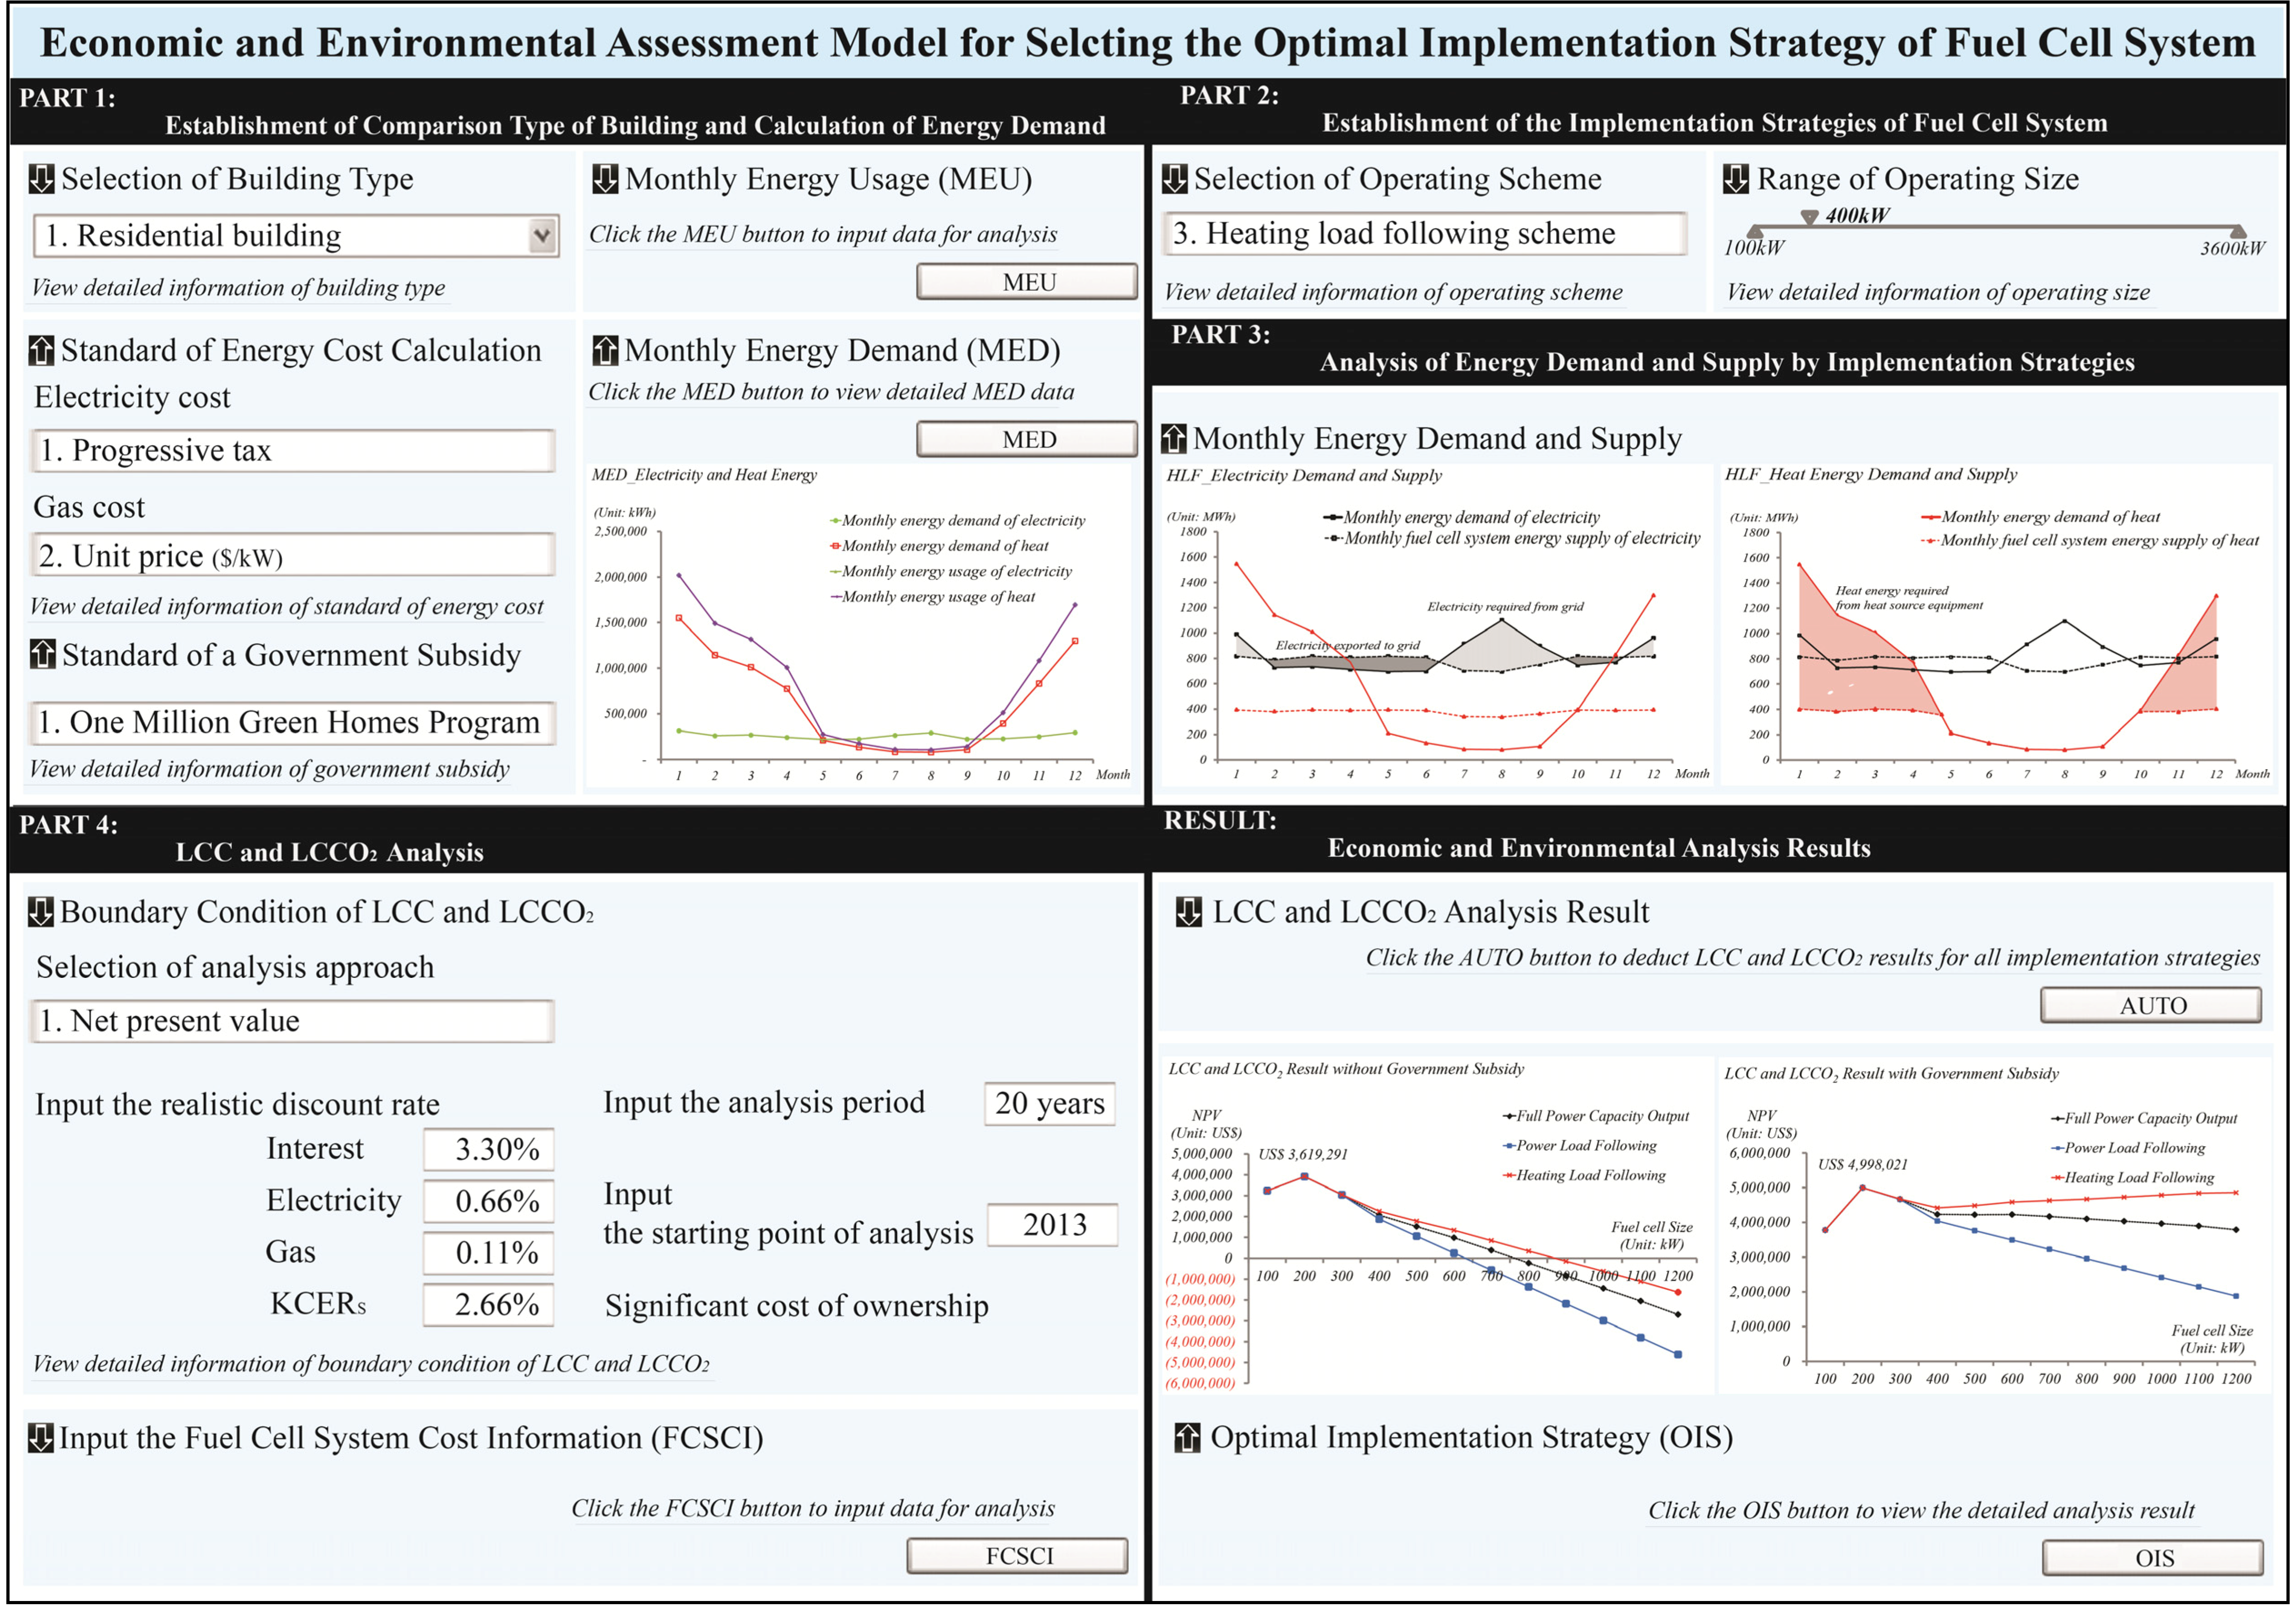
3.5. Graphical User Interface of the Developed Model
- The simplicity of the input variables, to improve user convenience;
- The automatization of the developed model, to shorten the execution time;
- Visualization of the analysis results, to help the final decision-maker recognize the optimal implementation strategy of the fuel cell system easily and clearly; and
- The expandability of the developed model, to enable the final decision-maker to apply the developed model to any other country or any other type of building.
- Part 1: the user can select building type. Then, the energy cost calculation and government subsidy standards will be determined automatically according to the building type. The users need to input the monthly energy usage information to deduce the monthly energy demand of a given building (refer to Equation (1) and (2));
- Part 2: the users can establish an implementation strategy by selecting the operating scheme and operating size of the fuel cell system. The monthly energy supply of the fuel cell system will be calculated and automatically saved on the database server (refer to Table A1). In the model, the user can choose default or referenced specifics of the fuel cell system (i.e., heat rate and heat recovery efficiency of MCFC) (refer to Table A3);

- Part 3: the comparison results between monthly energy demand of a given building (from Part 1) and monthly energy supply of the fuel cell system (from Part 2) will be presented in Part 3. And detailed information (i.e., electricity exported to grid, electricity required from grid, heat energy required from the heat source equipment, and heat energy wasted) for LCC and LCCO2 analysis will be automatically saved on the database server;
- Part 4: the users can input detailed indices for LCC and LCCO2 analysis (i.e., realistic discount rate, the analysis period, and the starting point of analysis). The user can also use the recommended value of this model; and
- Result: the users can conduct the LCC and LCCO2 analysis in terms of NPV and BEP of a selected implementation strategy. This model provides an “Auto” function which draws the optimal implementation strategy in terms of LCC and LCCO2 by calculating all of the possible implementation strategies for a given set of conditions.
4. Results and Discussion
4.1. “O” Multi-family Housing Complex with Progressive Tax
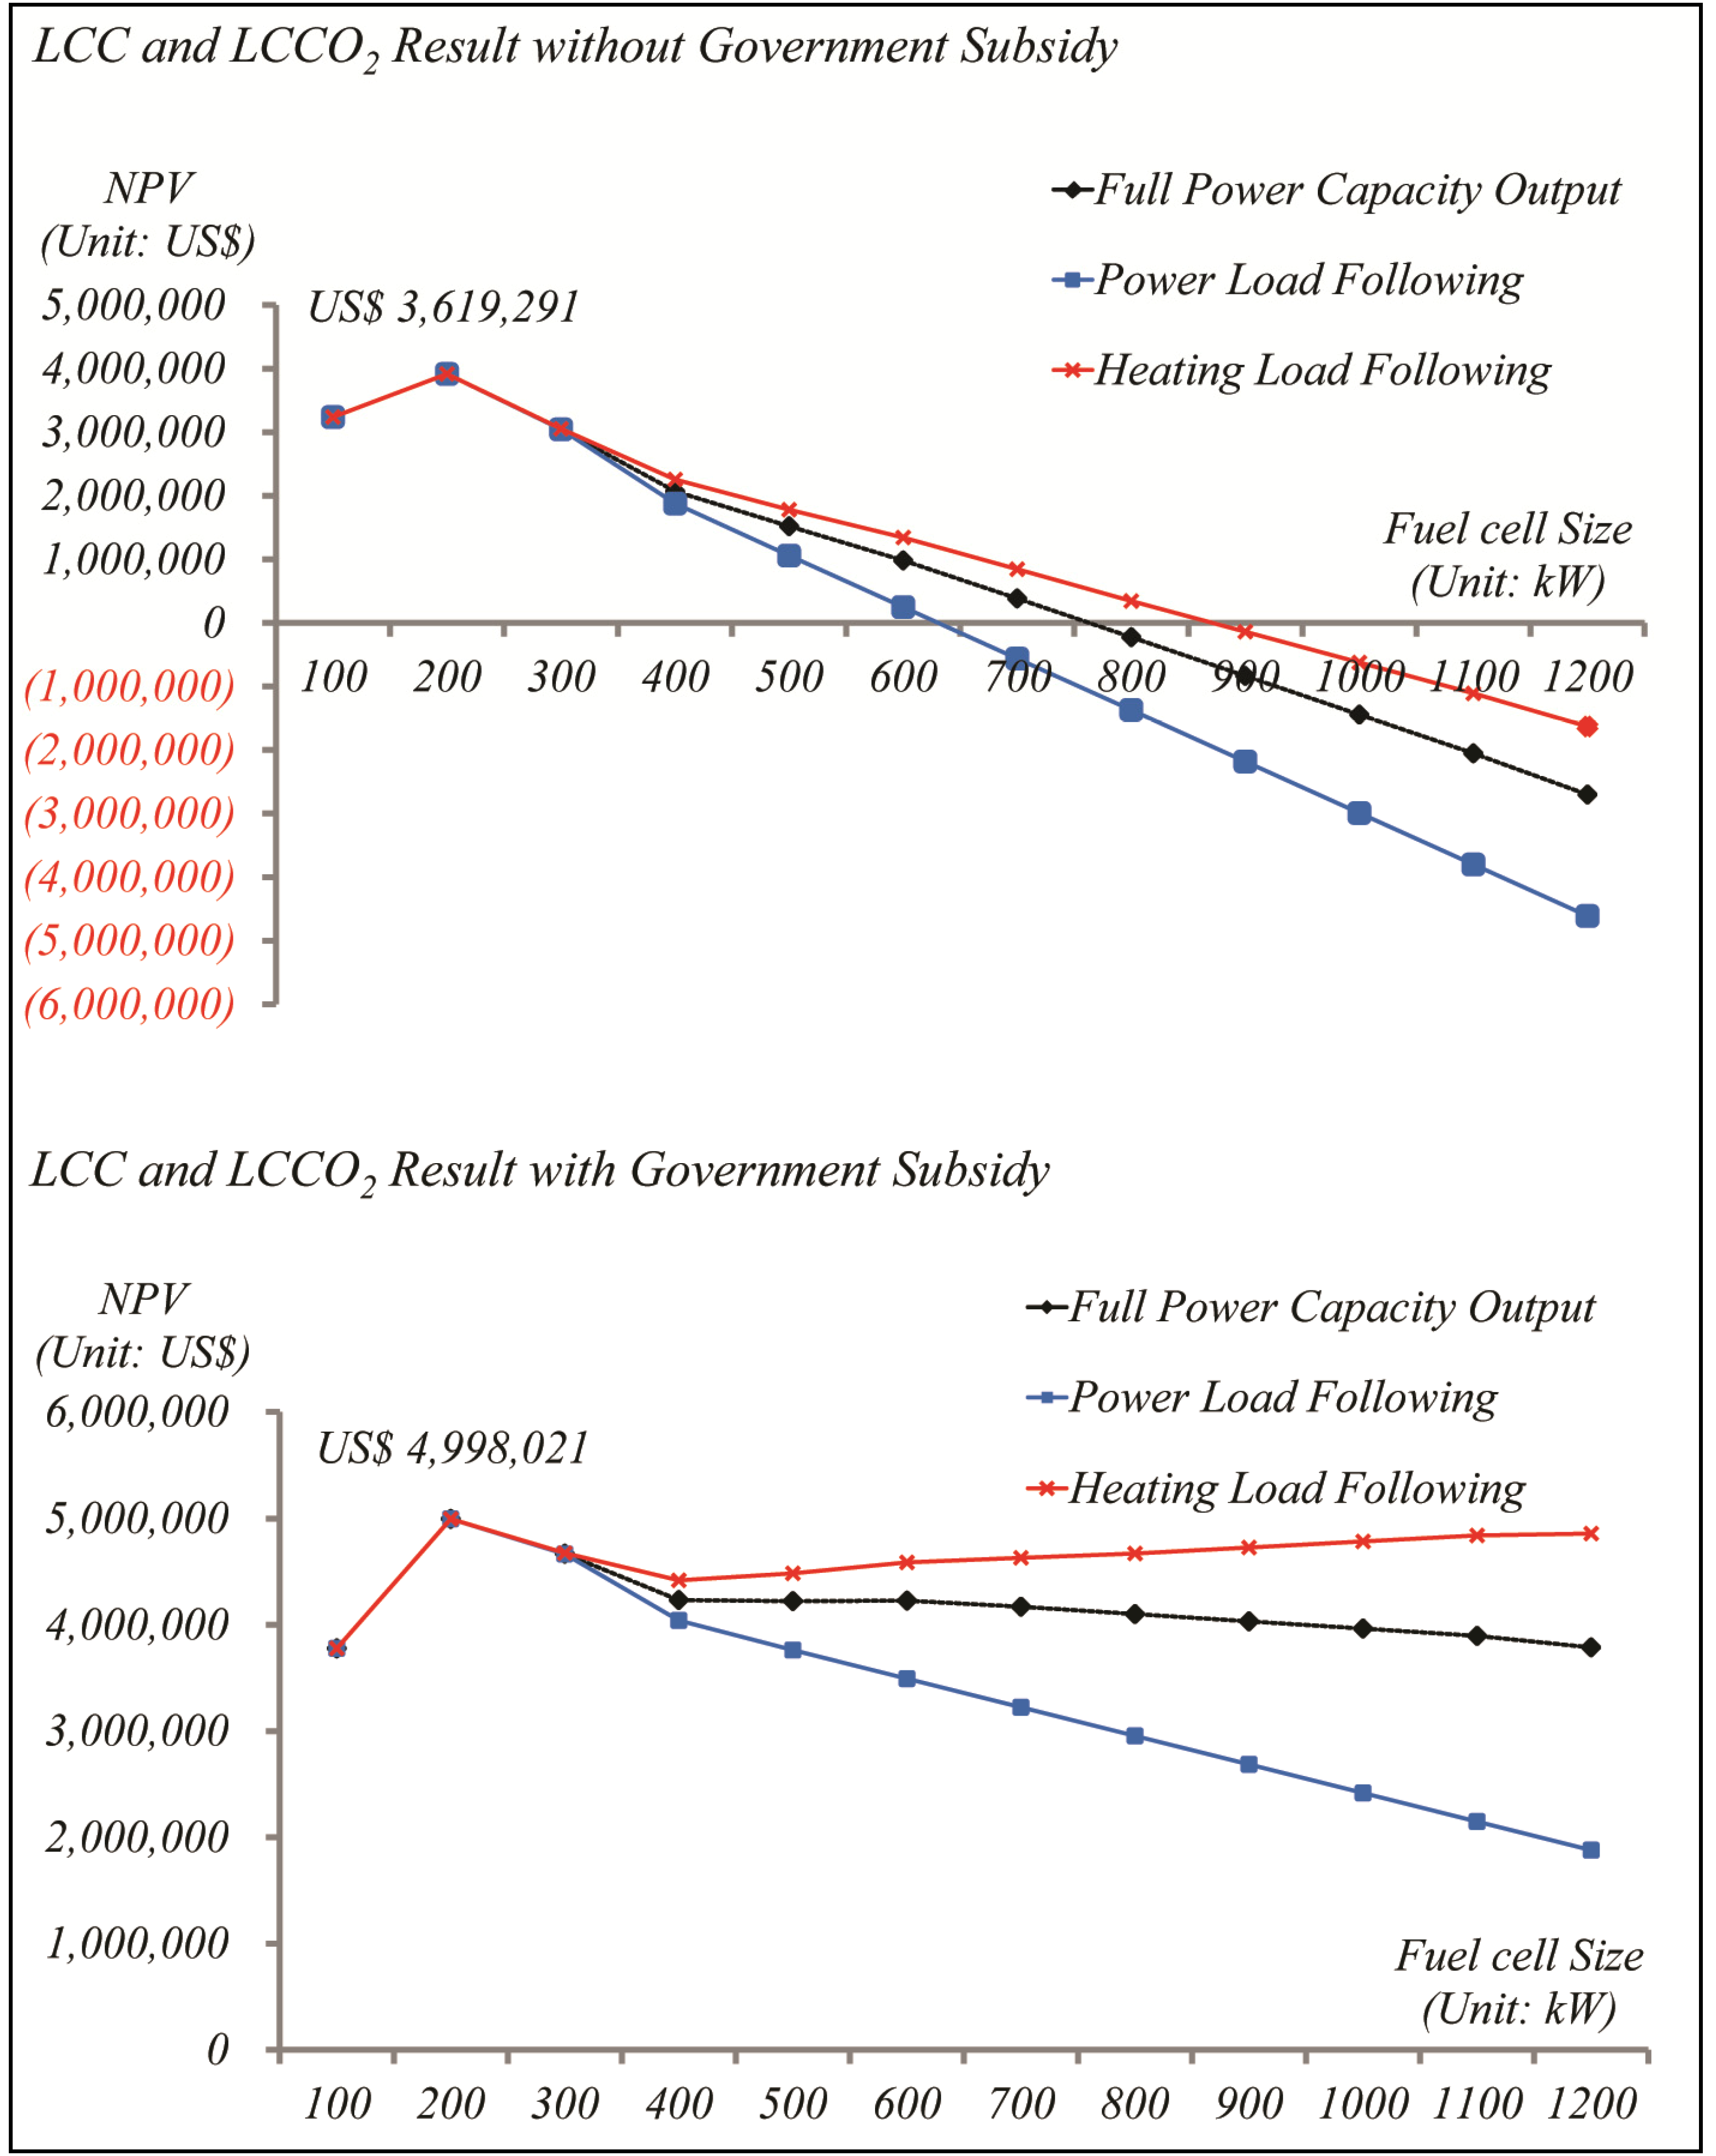
- Operating scheme: In the case of “O” multi-family housing complex, the HLF scheme was superior to the other operating schemes. It was shown to be the most cost-effective because it allowed exported-to-the-grid sales in winter and it did not produce surplus heat energy in summer. On the other hand, in the case of the FPCO scheme, while its exported-to-the-grid sales were highest, its monthly fuel used in a fuel cell system (MFUG) and its surplus heat energy, which cannot be recycled in summer, were too high. Furthermore, in the case of the PLF scheme, there was no exported-to-the-grid sales due to the properties of its operating scheme; and like the FPCO scheme, it produced large surplus heat energy in summer.
- Operating size: The optimal operating size of the fuel cell system was found to be IS_HLF_200 kW. If the energy surplus of the fuel cell system is higher than the energy demand of a given building (more than 300 kW), the FPCO scheme could not recover the increase in the initial construction cost due to the increase of its capacity, as the SMP is low and the gas cost is high. On the other hand, the PLF scheme and the HLF scheme did not offer additional economic benefits due to the properties of their operating schemes. In other words, as the operating size of the fuel cell system increases, it cannot produce surplus electricity or heat energy but the initial construction cost and the operating and maintenance costs do increase. Therefore, the optimal operating size of the fuel cell system was shown to be IS_HLF_200 kW, at which the energy supply of the fuel cell system came closest to the energy demand of a given building.

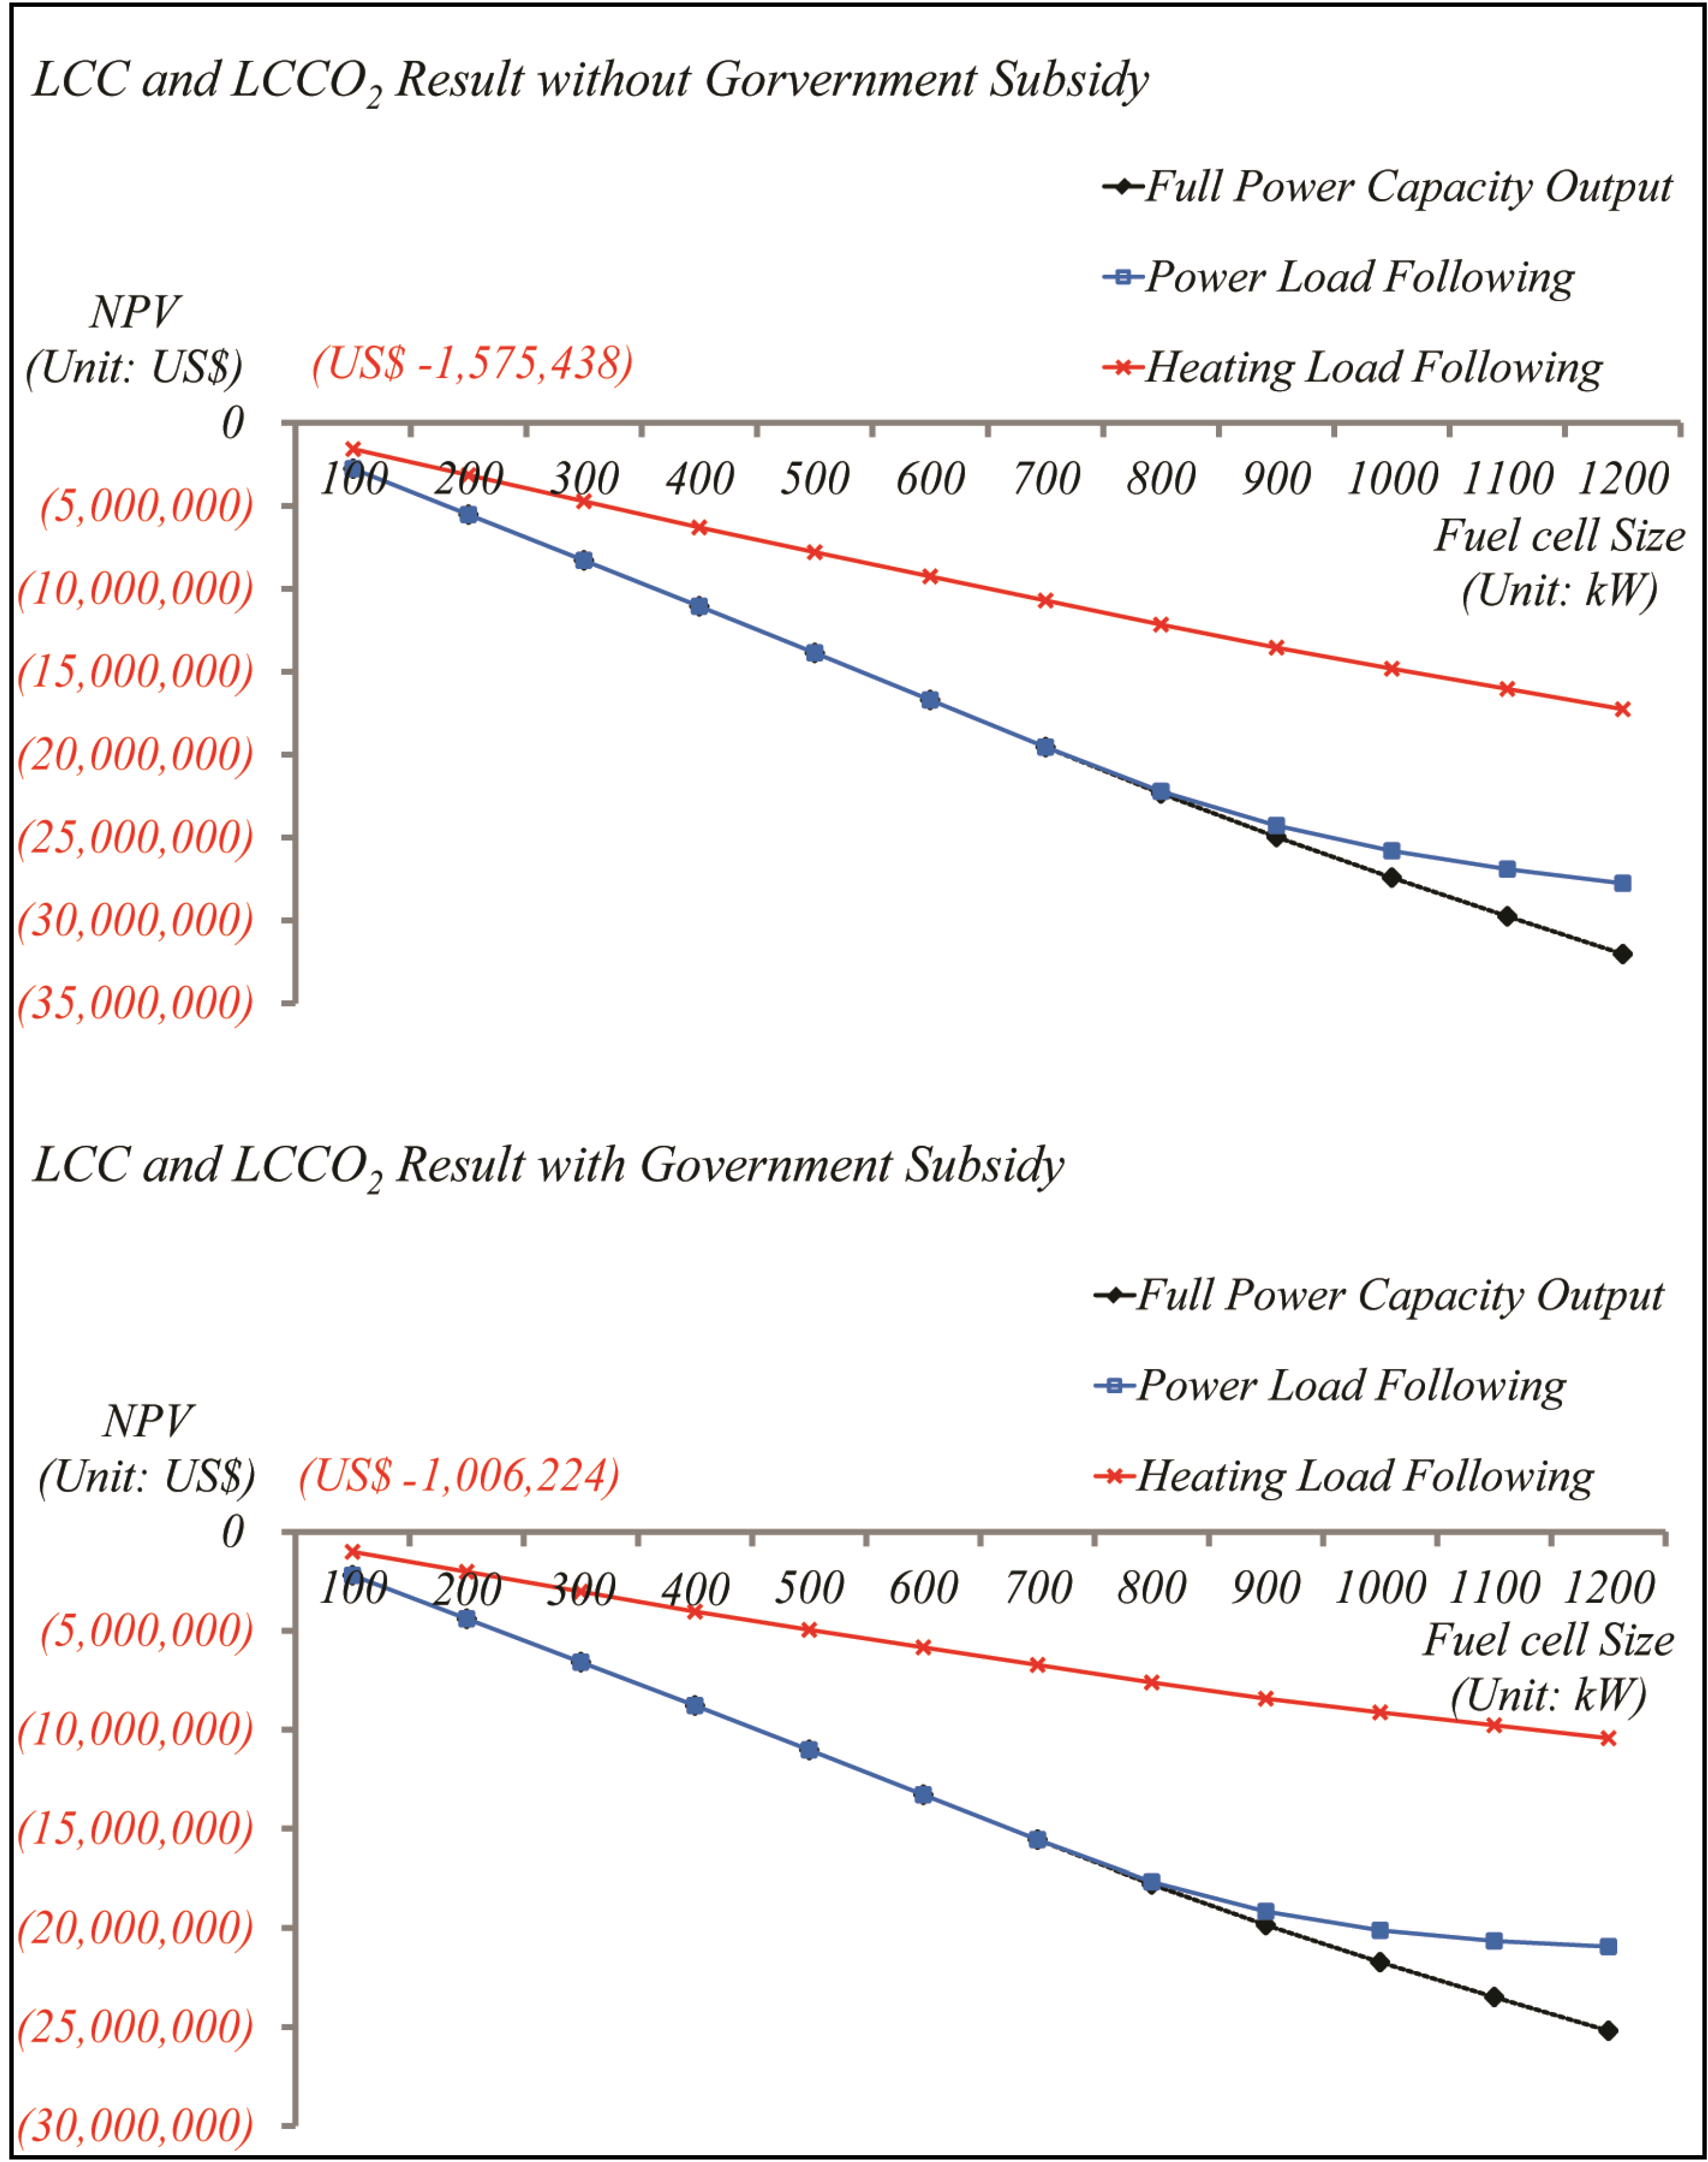
4.2. “Y” Multi-use Office Complex without Progressive Tax
- Operating scheme: In the case of “Y” multi-use office complex, the HLF scheme was superior to the other operating schemes in terms of LCC and LCCO2. This result was analyzed to have the same context as that of “O” multi-family housing complex.
- Operating size: The optimal operating size of the fuel cell system was found to be IS_HLF_100 kW. Although “Y” multi-use office complex was almost similar to “O” multi-family housing complex in terms of the yearly energy cost, the primary energy usage of “Y” multi-use office complex was 96.4% higher than that of “O” multi-family housing complex. Nevertheless, no implementation strategy of the fuel cell system satisfied NPV20 > 0.
- In summary, the analysis results showed that considering only the energy demand of a given building in implementing the fuel cell system would not achieve an economic effect. Despite the larger amount of energy consumption in “Y” multi-use office complex, the LCC and LCCO2 results of “O” multi-family housing complex was superior to that of “Y” multi-use office complex, which depended on the progressive tax. In other words, “Y” multi-use office complex, as a non-residential building, is not affected by the progressive tax. This results means that the benefits from the fuel cell system (i.e., the energy saving effect) do not cancel out the initial construction cost, the operating and maintenance cost, and the gas cost of the fuel cell system.

5. Conclusions
- Residential building: Since the progressive tax is applied to this type of building, the more electricity energy was used, the more significantly the fuel cell system affected the electricity energy savings. As for multi-family housing complex, IS_HLF_200kW was determined to be the optimal implementation strategy. First, without government subsidy, 19.5% of the life cycle energy cost was saved. NPV20 and BEP were determined as US$3,619,291 and three years, respectively. Next, with government subsidy, NPV20 and BEP were determined as US$4,998,021 and one year, respectively, due to the decrease in the initial construction cost.
- Non-residential building: Since the progressive tax is not applied to this type of building, the fuel cell system affected the electricity energy savings significantly less compared to the residential building. In other words, the increase in the gas energy cost of the fuel cell system was larger than the electricity energy cost savings with the implementation of the fuel cell system. In the case of “Y” multi-use office complex, even after 100% of the financial support for the initial construction cost from a government subsidy, there was no life cycle saving effect. That is, none of the implementation strategies was able to make the fuel cell system feasible. Therefore, to actively promote the implementation of the fuel cell system in non-residential building, only using an improvement of the government subsidy would not be meaningful. Rather, it is necessary to adjust the energy cost, such as an increase in the SMP, a decrease in the gas price, and to apply the progressive tax to non-residential building.
Acknowledgements
Author Contributions
Appendix
| Operating scheme | Equations |
|---|---|
| Full power capacity output (FPCO) |  |
| Power load Following (PLF) |  |
| Heating load Following (HLF) |  |
 is the monthly fuel cell system energy supply of electricity in FPCO scheme;
  is the monthly fuel cell system energy supply of heat in FPCO scheme; MFUG is the monthly fuel (gas) used in a fuel cell system; HR is the heat rate; and HRE is the heat recovery efficiency;
  is the monthly fuel cell system energy supply of electricity in PLF scheme; MEDE is the monthly energy demand of electricity;
  is the monthly fuel cell system energy supply of heat in PLF scheme;
  is the monthly fuel cell system energy supply of heat in HLF scheme; MEDH is the monthly energy demand of heat;
  is the monthly fuel cell system energy supply of electricity in HLF scheme.
 | Classification | Detailed classification | Detailed description |
|---|---|---|
| Analysis approach | Present worth method (NPV20, BEP) | |
| Realistic discount rate | Interest | 3.30% |
| Electricity | 0.66% | |
| Gas | 0.11% | |
| KCERs | 2.66% | |
| Analysis period | 20 years | |
| Starting point of analysis | 2013 | |
| Significantcost of ownership | Initial construction cost | Initial investment cost |
| Initial benefit | Government subsidy (67%) | |
| Operation & maintenance cost | Replacement/repair cost | |
| Energy consumption cost | ||
| Progressive tax | ||
| Operation & maintenance benefit | Gas savings, electricity savings | |
| Benefit from SMP | ||
| Benefit from KCERs | ||
| TYPE | PEMFC 1 | PAFC 2 | MCFC 3 | SOFC 4 |
|---|---|---|---|---|
| 1st generation | 2nd generation | 3th generation | ||
| Development | Commercialization phase | Verification phase | ||
| Application range | Car-Home | Building | Building-Plant | Home-Building |
| Size (kW) | 1 kW | 100 kW~ | 100 kW~ | 1 kW~ |
| Heat rate (kJ/kWh) | 10,286 | 8,571 | 7,660 | 6,545 |
| Heat recovery efficiency (%) | 50% | 48% | 43% | 35% |
| Operating temperature (°C) | 25~80 | 200 | 650 | 800 |
| Initial cost ($/kW) | 5,712 | 4,284 | 4,284 | 7,235 |
| O & M | 1.5%/year | 30%/5 year | 30%/5 year | 30%/5 year |
| External reformers | necessary | necessary | unnecessary | unnecessary |
| Stack | Platinum | Platinum | Perovskites | Nickel |
| High price | Low price | Low price | ||
| Life duration(year) | 10 | 20 | 20 | 20 |
Nomenclature
| Abbreviations | Detailed explanation |
| IS_HLF_200 kW | Implementation strategy (IS) with the operating scheme of Heating Load Following (HLF) and the operating size of 200 kW |
| IS_HLF_100 kW | Implementation strategy (IS) with the operating scheme of Heating Load Following (HLF) and the operating size of 100 kW |
| MEUE | Monthly Energy Usage of Electricity (kWh) |
| MEUG | Monthly Energy Usage of Gas (kWh) |
| MEDE | Monthly Energy Demand of Electricity (kWh) |
| MEDH | Monthly Energy Demand of Heat (kWh) |
| MFESE | Monthly fuel cell system Energy Supply of Electricity (kWh) |
| MFESH | Monthly fuel cell system Energy Supply of Heat (kWh) |
| MFUG | Monthly Fuel(Gas) Used in a fuel cell system (kWh) |
| MESE | Monthly Energy Saving of Electricity (kWh) |
| MESG | Monthly Energy Saving of Gas (kWh) |
| HR | Heat Rate (kJ/kWh) |
| HRE | Heat Recovery Efficiency (%) |
| Ω (Greek letter) | Pipe-loss coefficient |
| Δ (Greek letter) | Boiler load-loss coefficient |
| δ (Greek letter) | Boiler efficiency |
Conflicts of Interest
References
- Malça, J.; Coelho, A.; Freire, F. Environmental life-cycle assessment of rapeseed-based biodiesel: Alternative cultivation systems and locations. Appl. Energy 2014, 114, 837–844. [Google Scholar]
- Chicago Climate Exchange. CO2 Market Data 2011. Available online: http://www.chicagoclimatex.com/market/data/summary.jsf (accessed on 30 May 2013).
- Höök, M.; Xu, T. Depletion of fossil fuels and anthropogenic climate change—A review. Energy Policy 2013, 52, 797–809. [Google Scholar]
- Hong, T.H.; Kim, J.M.; Lee, J.Y.; Koo, C.W.; Park, H.S. Assessment of seasonal energy efficiency strategies of a double skin façade in a monsoon climate region. Energies 2013, 6, 4352–4376. [Google Scholar]
- Ekici, B.B.; Aksoy, U.T. Prediction of building energy needs in early stage of design by using ANFIS. Expert Syst. Appl. 2011, 38, 5352–5358. [Google Scholar] [CrossRef]
- Zhao, H.X.; Magoules, F. A review on the prediction of building energy consumption. Renew. Sustain. Energy Rev. 2012, 16, 3586–3592. [Google Scholar] [CrossRef]
- Foucquier, A.; Robert, S.; Suard, F.; Stephan, L.; Jay, A. State of the art in building modeling and energy performances prediction: A review. Renew. Sustain. Energy Rev. 2013, 23, 272–288. [Google Scholar] [CrossRef]
- Fahmy, M.; Mahdy, M.M.; Nikolopoulou, M. Prediction of future energy consumption reduction using GRC envelope optimization for residential building in Egypt. Energy Build. 2014, 70, 186–193. [Google Scholar] [CrossRef]
- Catalina, T.; Virgone, J.; Blanco, E. Development and validation of regression models to predict monthly heating demand for residential buildings. Energy Build. 2008, 40, 1825–1832. [Google Scholar] [CrossRef]
- Koo, C.W.; Park, S.K.; Hong, T.H.; Park, H.S. An estimation model for the heating and cooling demand of a residential building with a different envelope design using the finite element method. Appl. Energy 2014, 115, 205–215. [Google Scholar] [CrossRef]
- Kim, J.M.; Hong, T.H.; Koo, C.W. Economic and environmental evaluation model for selecting the optimum design of green roof systems in elementary schools. Environ. Sci. Technol. 2012, 46, 8475–8483. [Google Scholar] [CrossRef] [PubMed]
- Sun, J.; Liu, Y. The application of renewable energy in the building energy efficiency. Mech. Mater. 2014, 521, 719–723. [Google Scholar]
- Oh, S.D.; Yoo, Y.P.; Song, J.H.; Song, S.J.; Jang, H.N. A cost-effective method for integration of new and renewable energy systems in public building in Korea. Energy Build. 2014, 74, 120–131. [Google Scholar] [CrossRef]
- Fong, K.F.; Lee, C.K. Investigation on hybrid system design of renewable cooling for office building in hot and humid climate. Energy Build. 2014, 75, 1–9. [Google Scholar] [CrossRef]
- Christian, M.; Carsten, B.; Mads, P.N. A cost optimization model for 100% renewable residential energy supply system. Energy 2012, 48, 118–127. [Google Scholar] [CrossRef]
- Kapsalaki, M.; Leal, V.; Santamouris, M. A methodology for economic efficient design of net zero energy buildings. Energy Build. 2012, 55, 765–778. [Google Scholar] [CrossRef]
- Maria, B. Energy concept design of zero energy buildings. Adv. Mater. Res. 2013, 649, 7–10. [Google Scholar] [CrossRef]
- Koo, C.W.; Hong, T.H.; Park, H.S.; Yun, G.C. Framework for the Analysis of the Potential of the Rooftop Photovoltaic System to Achieve the net-Zero Energy Solar Buildings. Prog. Photovolt. Res. Appl. 2014, 22, 462–478. [Google Scholar] [CrossRef]
- Wasim, Y.S. Toward net zero energy homes down under. Renew. Energy 2013, 49, 211–215. [Google Scholar] [CrossRef]
- Danny, H.W.L.; Liu, Y.; Joseph, C.L. Zero energy buildings and sustainable development implication—A review. Energy 2013, 54, 1–10. [Google Scholar] [CrossRef]
- Hong, T.H.; Koo, C.W.; Kwak, T.H. Framework for the Implementation of a new renewable energy system in an educational facility. Appl. Energy 2013, 103, 539–551. [Google Scholar] [CrossRef]
- Hong, T.H.; Koo, C.W.; Kwak, T.H.; Park, H.S. An economic and environmental assessment for selecting the optimum new renewable energy system for educational facility. Renew. Sustain. Energy Rev. 2014, 29, 286–300. [Google Scholar] [CrossRef]
- Hong, T.H.; Koo, C.W.; Park, J.H.; Park, H.S. A GIS (geographic information system)-based optimization model for estimating the electricity generation of the rooftop PV (photovoltaic) system. Energy 2014, 65, 190–199. [Google Scholar] [CrossRef]
- Hearps, P.; McConnell, D. Renewable Energy Technology Cost Review; Melbourne Energy Institute: Carlton, Victoria, Australia, 2011. [Google Scholar]
- International Energy Agency. Medium-Term Renewable Energy Market Report 2012; OECD Publishing: Paris, France, 2012. [Google Scholar]
- Renewables 2012: Global Status Report; Renewable Energy Policy Network for the 21st Century: Paris, France, 2012.
- World Energy Outlook 2012; International Energy Agency: Paris, France, 2012.
- World Energy Outlook 2013; International Energy Agency: Paris, France, 2013.
- Marone, A.; Izzo, G.; Mentuccia, L.; Massini, G.; Paganin, P.; Rosa, S.; Varrone, C.; Signorini, A. Vegetable waste as substrate and source of suitable microflora for bio-hydrogen production. Renew. Energy 2014, 68, 6–13. [Google Scholar] [CrossRef]
- Rincon, R.; Jimenez, M.; Munoz, J.; Saez, M.; Calzada, M.D. Hydrogen production from ethanol decomposition by two microwave atmospheric pressure plasma source: Surfatron and TIAGO Torch. Plasma Chem. Plasma Process 2014, 34, 145–157. [Google Scholar] [CrossRef]
- Zhang, D.; Ye, F.; Xue, T.; Guan, Y.; Wang, Y.M. Transfer hydrogenation of phenol on supported Pd catalysts using formic acid as an alternative hydrogen source. Catal. Today 2014, 234, 133–138. [Google Scholar] [CrossRef]
- Acar, C.; Dincer, I. Comparative assessment of hydrogen production methods from renewable and non-renewable sources. Int. J. Hydrog. Energy 2014, 39, 1–12. [Google Scholar] [CrossRef]
- Sivagurunathan, P.; Kumar, G.; Lin, C.Y. Hydrogen and ethanol fermentation of various carbon sources by immobilized Escherichia coli (XL1-Blue). Int. J. Hydrog. Energy 2014, 39, 6881–6888. [Google Scholar] [CrossRef]
- Hrycak, B.; Czylkowski, D.; Miotk, R.; Dors, M.; Jasinski, M.; Mizeraczyk, J. Application of atmospheric pressure microwave plasma source for hydrogen production from ethanol. Int. J. Hydrog. Energy 2014, 1–7. [Google Scholar]
- Nelke, J. The advantage of hydrogen fuel cell technology. Electron. Compon. News 2010, 54, 15–16. [Google Scholar]
- Posco Energy Ltd. Available online: http://www.poscoenergy.com (accessed on 30 May 2013).
- George, E. Future economics of the fuel cell housing market. Hydrog. Energy 2003, 28, 685–694. [Google Scholar]
- Kang, S.H.; Choi, S.J.; Kim, J.W. Analysis of the world energy status and hydrogen energy technology R&D of foreign countries. Korean Hydrog. New Energy Soc. 2007, 18, 216–223. [Google Scholar]
- Handbook of Energy & Economic Statistics in Korea 2013; Korea Energy Management Corporation: Seoul, Korea, 2013.
- Territorial Policy Bureau Administration Data; Korea Ministry of Land: Seoul, Korea, 2013.
- Seoul Statistics Yearbook 2012 Seoul; The Seoul Government: Seoul, Korea, 2012.
- Steward, D.; Penev, M.; Saur, G.; Becker, W. Fuel Cell Power Model Version 2: Startup Guide, System Designs, and Case Studies; Technical Report, National Renewable Energy Laboratory: Golden, CO, USA, 2013. [Google Scholar]
- Rashidi, R.; Berg, P.; Dincer, I. Performance investigation of a combined MCFC system. Int. J. Hydrog. Energy 2009, 34, 4395–4405. [Google Scholar] [CrossRef]
- Yin, H.; Powers, N. Do state renewable portfolio standards promote in-state renewable generation? Energy Policy 2010, 38, 1140–1149. [Google Scholar] [CrossRef]
- Zhao, Y.; Tang, K.K.; Wang, L.L. Do renewable electricity policies promote renewable electricity generation? Evidence from panel data. Energy Policy 2013, 62, 887–897. [Google Scholar] [CrossRef]
- Pade, L.L.; Schroder, S.T. Fuel cell based micro-combined heat and power under different policy frameworks—An economic analysis. Energy Convers. Manag. 2013, 66, 295–303. [Google Scholar] [CrossRef]
- Zhang, S.; Andrews-Speed, P.; Zhao, X.; He, Y. Interactions between renewable energy policy and renewable energy industrial policy: A critical analysis of China’s policy approach to renewable energies. Energy Policy 2013, 62, 342–353. [Google Scholar] [CrossRef]
- Liu, X.M.; Ren, H.; Wu, Y.; Guo, L.Y. Policy design and evaluation for demonstration projects of application of renewable energy sources to buildings in China. Appl. Mech. Mater. 2013, 368–370, 1254–1261. [Google Scholar]
- Johnstone, N.; Hascic, I.; Propp, D. Renewable energy policies and technological innovation: Evidence based on patent counts. Environ. Resour. Econ. 2010, 45, 133–155. [Google Scholar] [CrossRef]
- Kalkuhl, M.; Edenhofer, O.; Lessmann, K. Renewable energy subsidies: Second-best policy or fatal aberration for mitigation? Resour. Energy Econ. 2013, 35, 217–234. [Google Scholar]
- Zarnikau, J. Successful renewable energy development in a competitive electricity market: A Texas case study. Energy Policy 2011, 39, 3906–3913. [Google Scholar] [CrossRef]
- Rio, P.D.; Cerda, E. The policy implications of the different interpretations of the cost-effectiveness of renewable electricity support. Energy Policy 2014, 64, 364–372. [Google Scholar] [CrossRef]
- Delmas, M.; Montes-Sancho, M.J. U.S. state policies for renewable energy: Context and effectiveness. Energy Policy 2011, 39, 2273–2288. [Google Scholar] [CrossRef]
- Hong, T.H.; Kim, D.H.; Koo, C.W.; Kim, J.M. Framework for establishing the optimal implementation strategy of a fuel-cell-based combined heat and power system: Focused on multi-family housing complex. Appl. Energy 2014, 127, 11–24. [Google Scholar] [CrossRef]
- Mahlia, T.M.I.; Chan, P.L. Life cycle cost analysis of fuel cell based cogeneration system for residential application in Malaysia. Renew. Sustain. Energy Rev. 2011, 15, 416–426. [Google Scholar] [CrossRef]
- Guizzi, G.L.; Manno, M. Fuel cell-based cogeneration system covering data centers’ energy needs. Energy 2012, 41, 56–64. [Google Scholar] [CrossRef] [Green Version]
- Oh, S.D.; Kim, K.Y.; Oh, S.B.; Kwak, H.Y. Optimal operation of 1-kW PEMFC-based CHP system for residential applications. Appl. Energy 2012, 95, 93–101. [Google Scholar] [CrossRef]
- Barbieri, E.S.; Spina, P.R.; Venturini, M. Analysis of innovative micro-CHP systems to meet household energy demands. Appl. Energy 2012, 97, 723–733. [Google Scholar] [CrossRef]
- Chen, J.M.P.; Ni, M. Economic analysis of a solid oxide fuel cell cogeneration/trigeneration system for hotels in Hong Kong. Energy Build. 2014, 75, 160–169. [Google Scholar] [CrossRef]
- Sanchez, D.; Chacartegui, J.M.; Escalona, M.; Munoz, A.; Sanchez, T. Performance analysis of a MCFC & supercritical carbon dioxide hybrid cycle under part load operation. Int. J. Hydrog. Energy 2011, 36, 10327–10336. [Google Scholar] [CrossRef]
- Tanaka, Y.; Fukushima, M. Optimal operation of residential fuel cell system with rapidly fluctuating energy demand. Electr. Eng. Jpn. 2011, 175, 8–17. [Google Scholar] [CrossRef]
- Wakui, T.; Yokoyama, R. Optimal sizing of residential SOFC cogeneration system for power interchange operation in housing complex from energy-saving viewpoint. Energy 2012, 41, 65–74. [Google Scholar] [CrossRef]
- Aki, H.; Taniguchi, Y.; Tamura, I.; Kegasa, A.; Hayakawa, H.; Ishikawa, Y.; Yamamoto, S.; Sugimoto, I. Fuel cells and energy networks of electricity, heat, and hydrogen: A demonstration in hydrogen-fueled apartments. Int. J. Hydrog. Energy 2012, 37, 1204–1213. [Google Scholar] [CrossRef]
- Fong, K.F.; Lee, C.K. Investigation on zero grid-electricity design strategies of solid oxide fuel cell trigeneration system for high-rise building in hot and humid climate. Appl. Energy 2014, 114, 426–433. [Google Scholar] [CrossRef]
- Vasallo, M.J.; Bravo, J.M.; Andujar, J.M. Optimal sizing for UPS systems based on batteries and/or fuel cell. Appl. Energy 2013, 105, 170–181. [Google Scholar] [CrossRef]
- Bianchi, M.; Pascale, A.; Melino, F. Performance analysis of an integrated CHP system with thermal and electric energy storage for residential application. Appl. Energy 2013, 112, 928–938. [Google Scholar] [CrossRef]
- Wakui, T.; Yokoyama, R.; Shimizu, K. Suitable operational strategy for power interchange operation using multiple residential SOFC (solid oxide fuel cell) cogeneration systems. Energy 2010, 35, 740–750. [Google Scholar] [CrossRef]
- Arsalis, A.; Nielsen, M.P.; Kaer, S.K. Application of an improved operational strategy on a PBI fuel cell-based residential system for Danish single-family households. Appl. Therm. Eng. 2013, 50, 704–713. [Google Scholar] [CrossRef]
- Electricity Supply Provision; Korea Electric Power Corporation: Seoul, Korea, 2012.
- The Building Energy Efficiency Rating System Operation Provision; Korea Ministry of Land, Infrastructure and Transport: Seoul, Korea, 2012.
- RETScreen International. Available online: http://www.RETScreen.net (accessed on 30 May 2013).
- Koo, C.W.; Hong, T.H.; Lee, M.H.; Park, H.S. Estimation of the monthly average daily solar radiation using geographic information system and advanced case-based reasoning. Environ. Sci. Technol. 2013, 47, 4826–4839. [Google Scholar] [CrossRef]
- Lee, M.H.; Koo, C.W.; Hong, T.H.; Park, H.S. Framework for the mapping of the monthly average daily solar radiation using an advanced case-based reasoning and a geostatistical Technique. Environ. Sci. Technol. 2014, submitted. [Google Scholar]
- Dan, C.; Jonathan, W. Fuel Cell Industry Review 2013; Fuel Cell Today: Hertfordshire, UK, 2013. [Google Scholar]
- New Renewable Energy Center in the Korea Energy Management Corporation. Available online: http://www.knrec.or.kr/knrec/index.asp (accessed on 30 May 2013).
© 2014 by the authors; licensee MDPI, Basel, Switzerland. This article is an open access article distributed under the terms and conditions of the Creative Commons Attribution license (http://creativecommons.org/licenses/by/3.0/).
Share and Cite
Kim, D.; Kim, J.; Koo, C.; Hong, T. An Economic and Environmental Assessment Model for Selecting the Optimal Implementation Strategy of Fuel Cell Systems—A Focus on Building Energy Policy. Energies 2014, 7, 5129-5150. https://doi.org/10.3390/en7085129
Kim D, Kim J, Koo C, Hong T. An Economic and Environmental Assessment Model for Selecting the Optimal Implementation Strategy of Fuel Cell Systems—A Focus on Building Energy Policy. Energies. 2014; 7(8):5129-5150. https://doi.org/10.3390/en7085129
Chicago/Turabian StyleKim, Daeho, Jimin Kim, Choongwan Koo, and Taehoon Hong. 2014. "An Economic and Environmental Assessment Model for Selecting the Optimal Implementation Strategy of Fuel Cell Systems—A Focus on Building Energy Policy" Energies 7, no. 8: 5129-5150. https://doi.org/10.3390/en7085129