Battery Sizing for Plug-in Hybrid Electric Vehicles in Beijing: A TCO Model Based Analysis

Abstract
:1. Introduction
2. The TCO Model
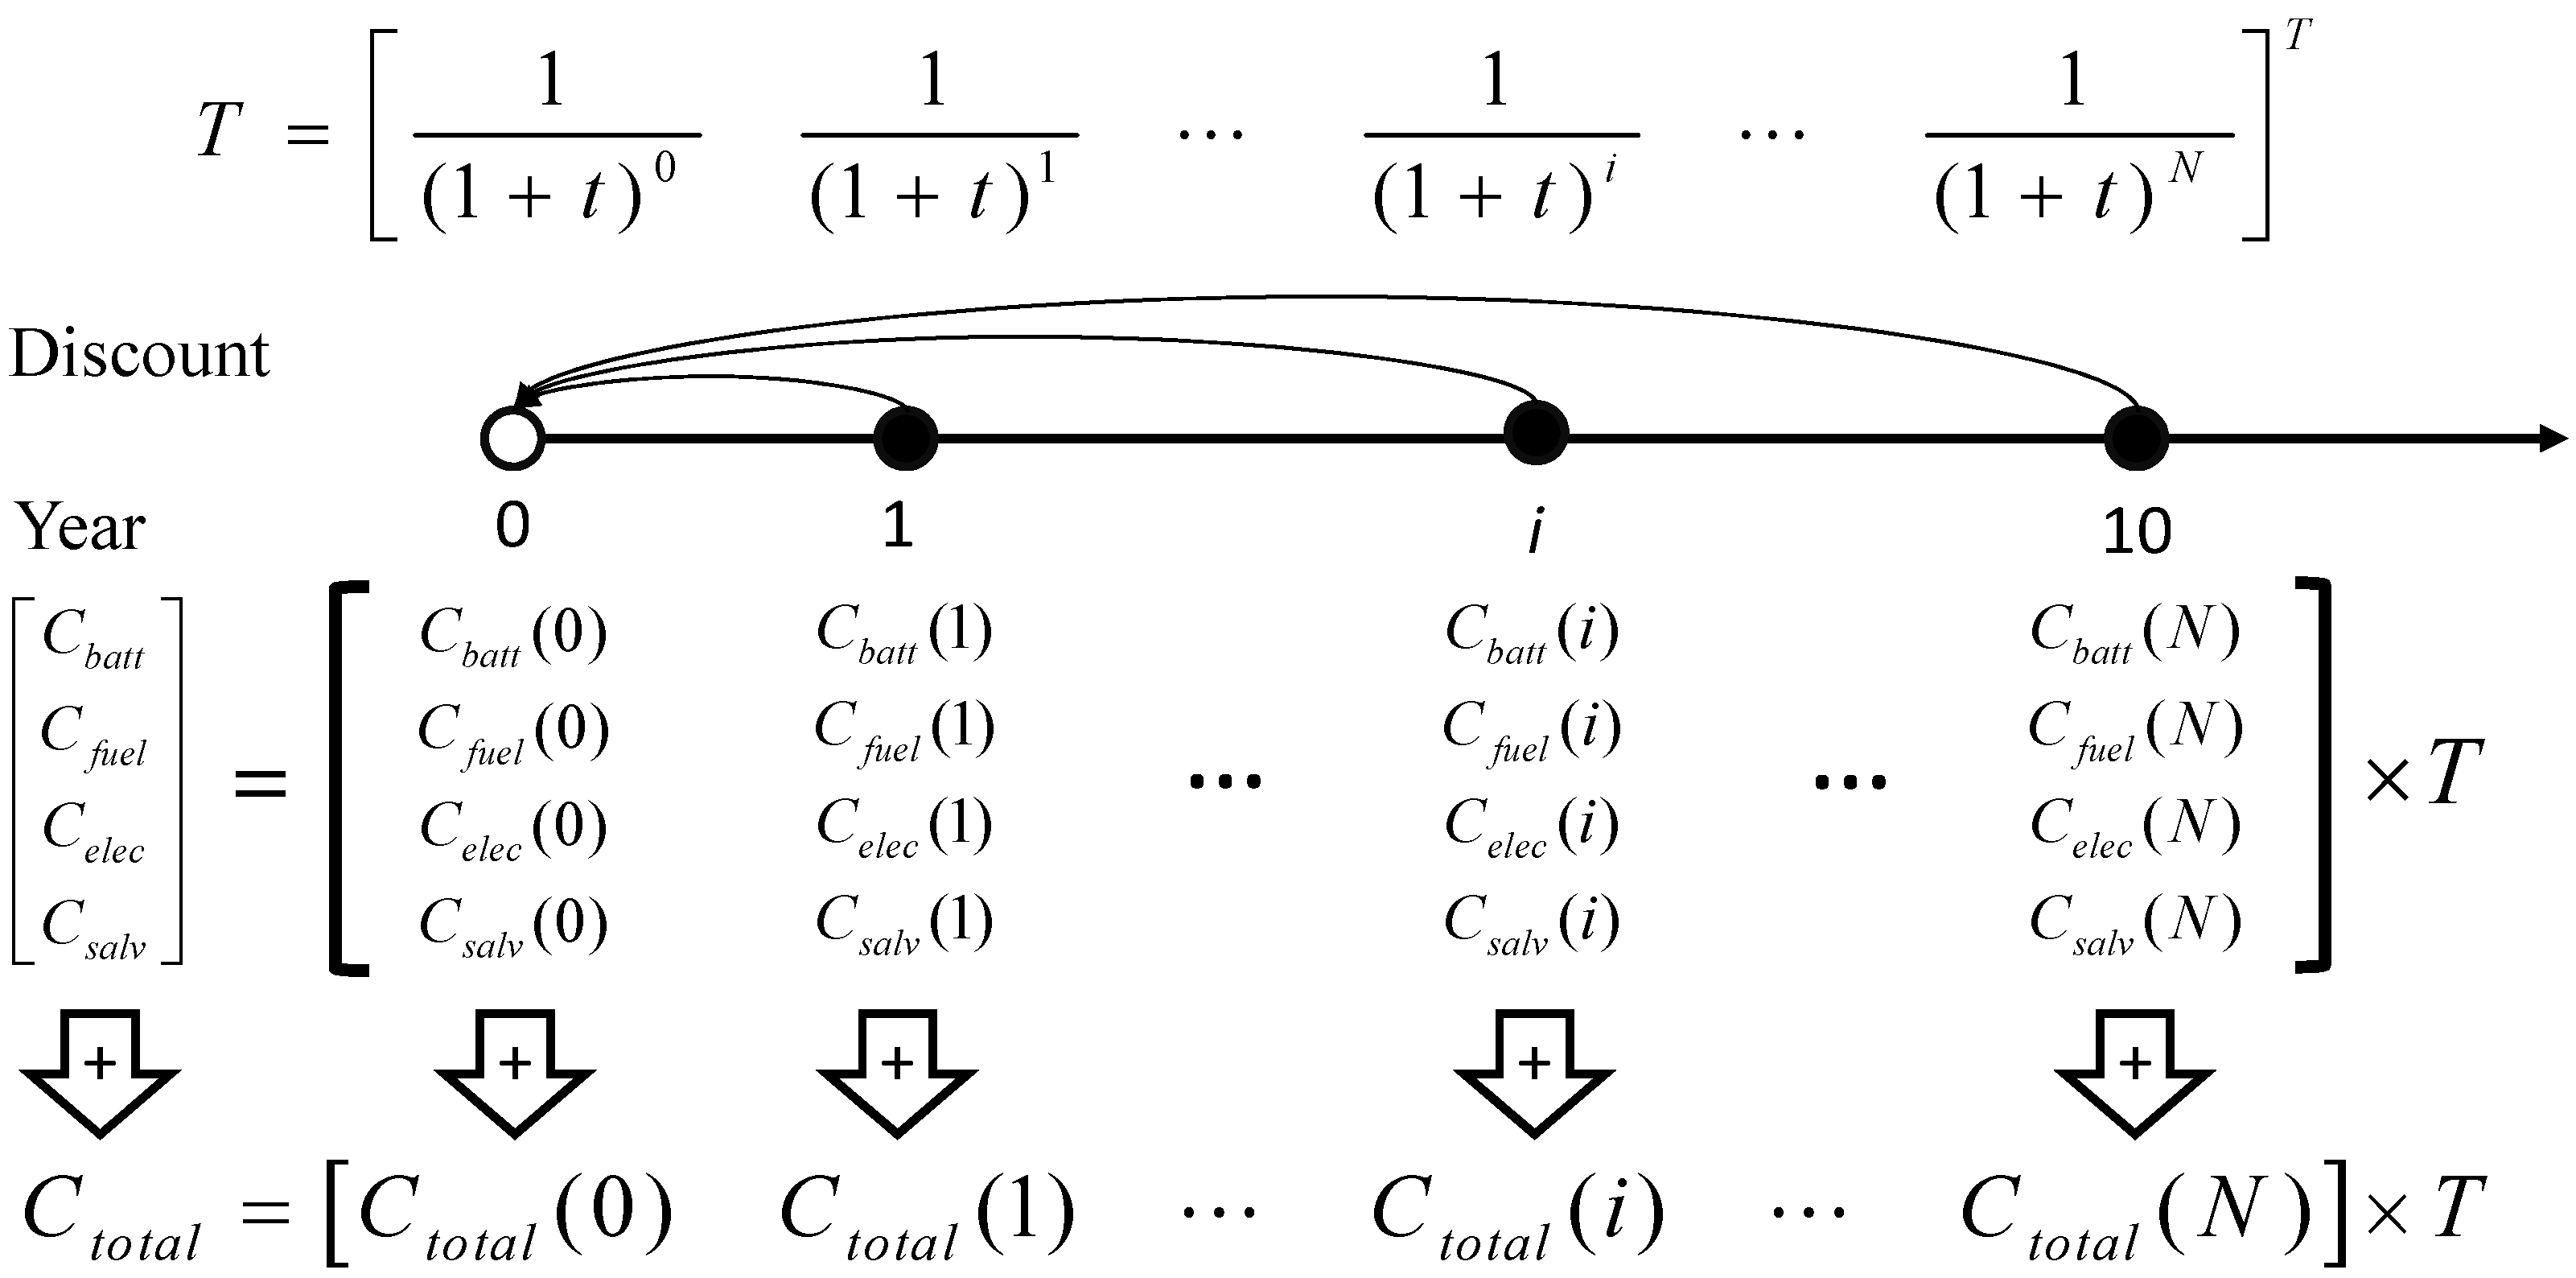
2.1. Model Overview
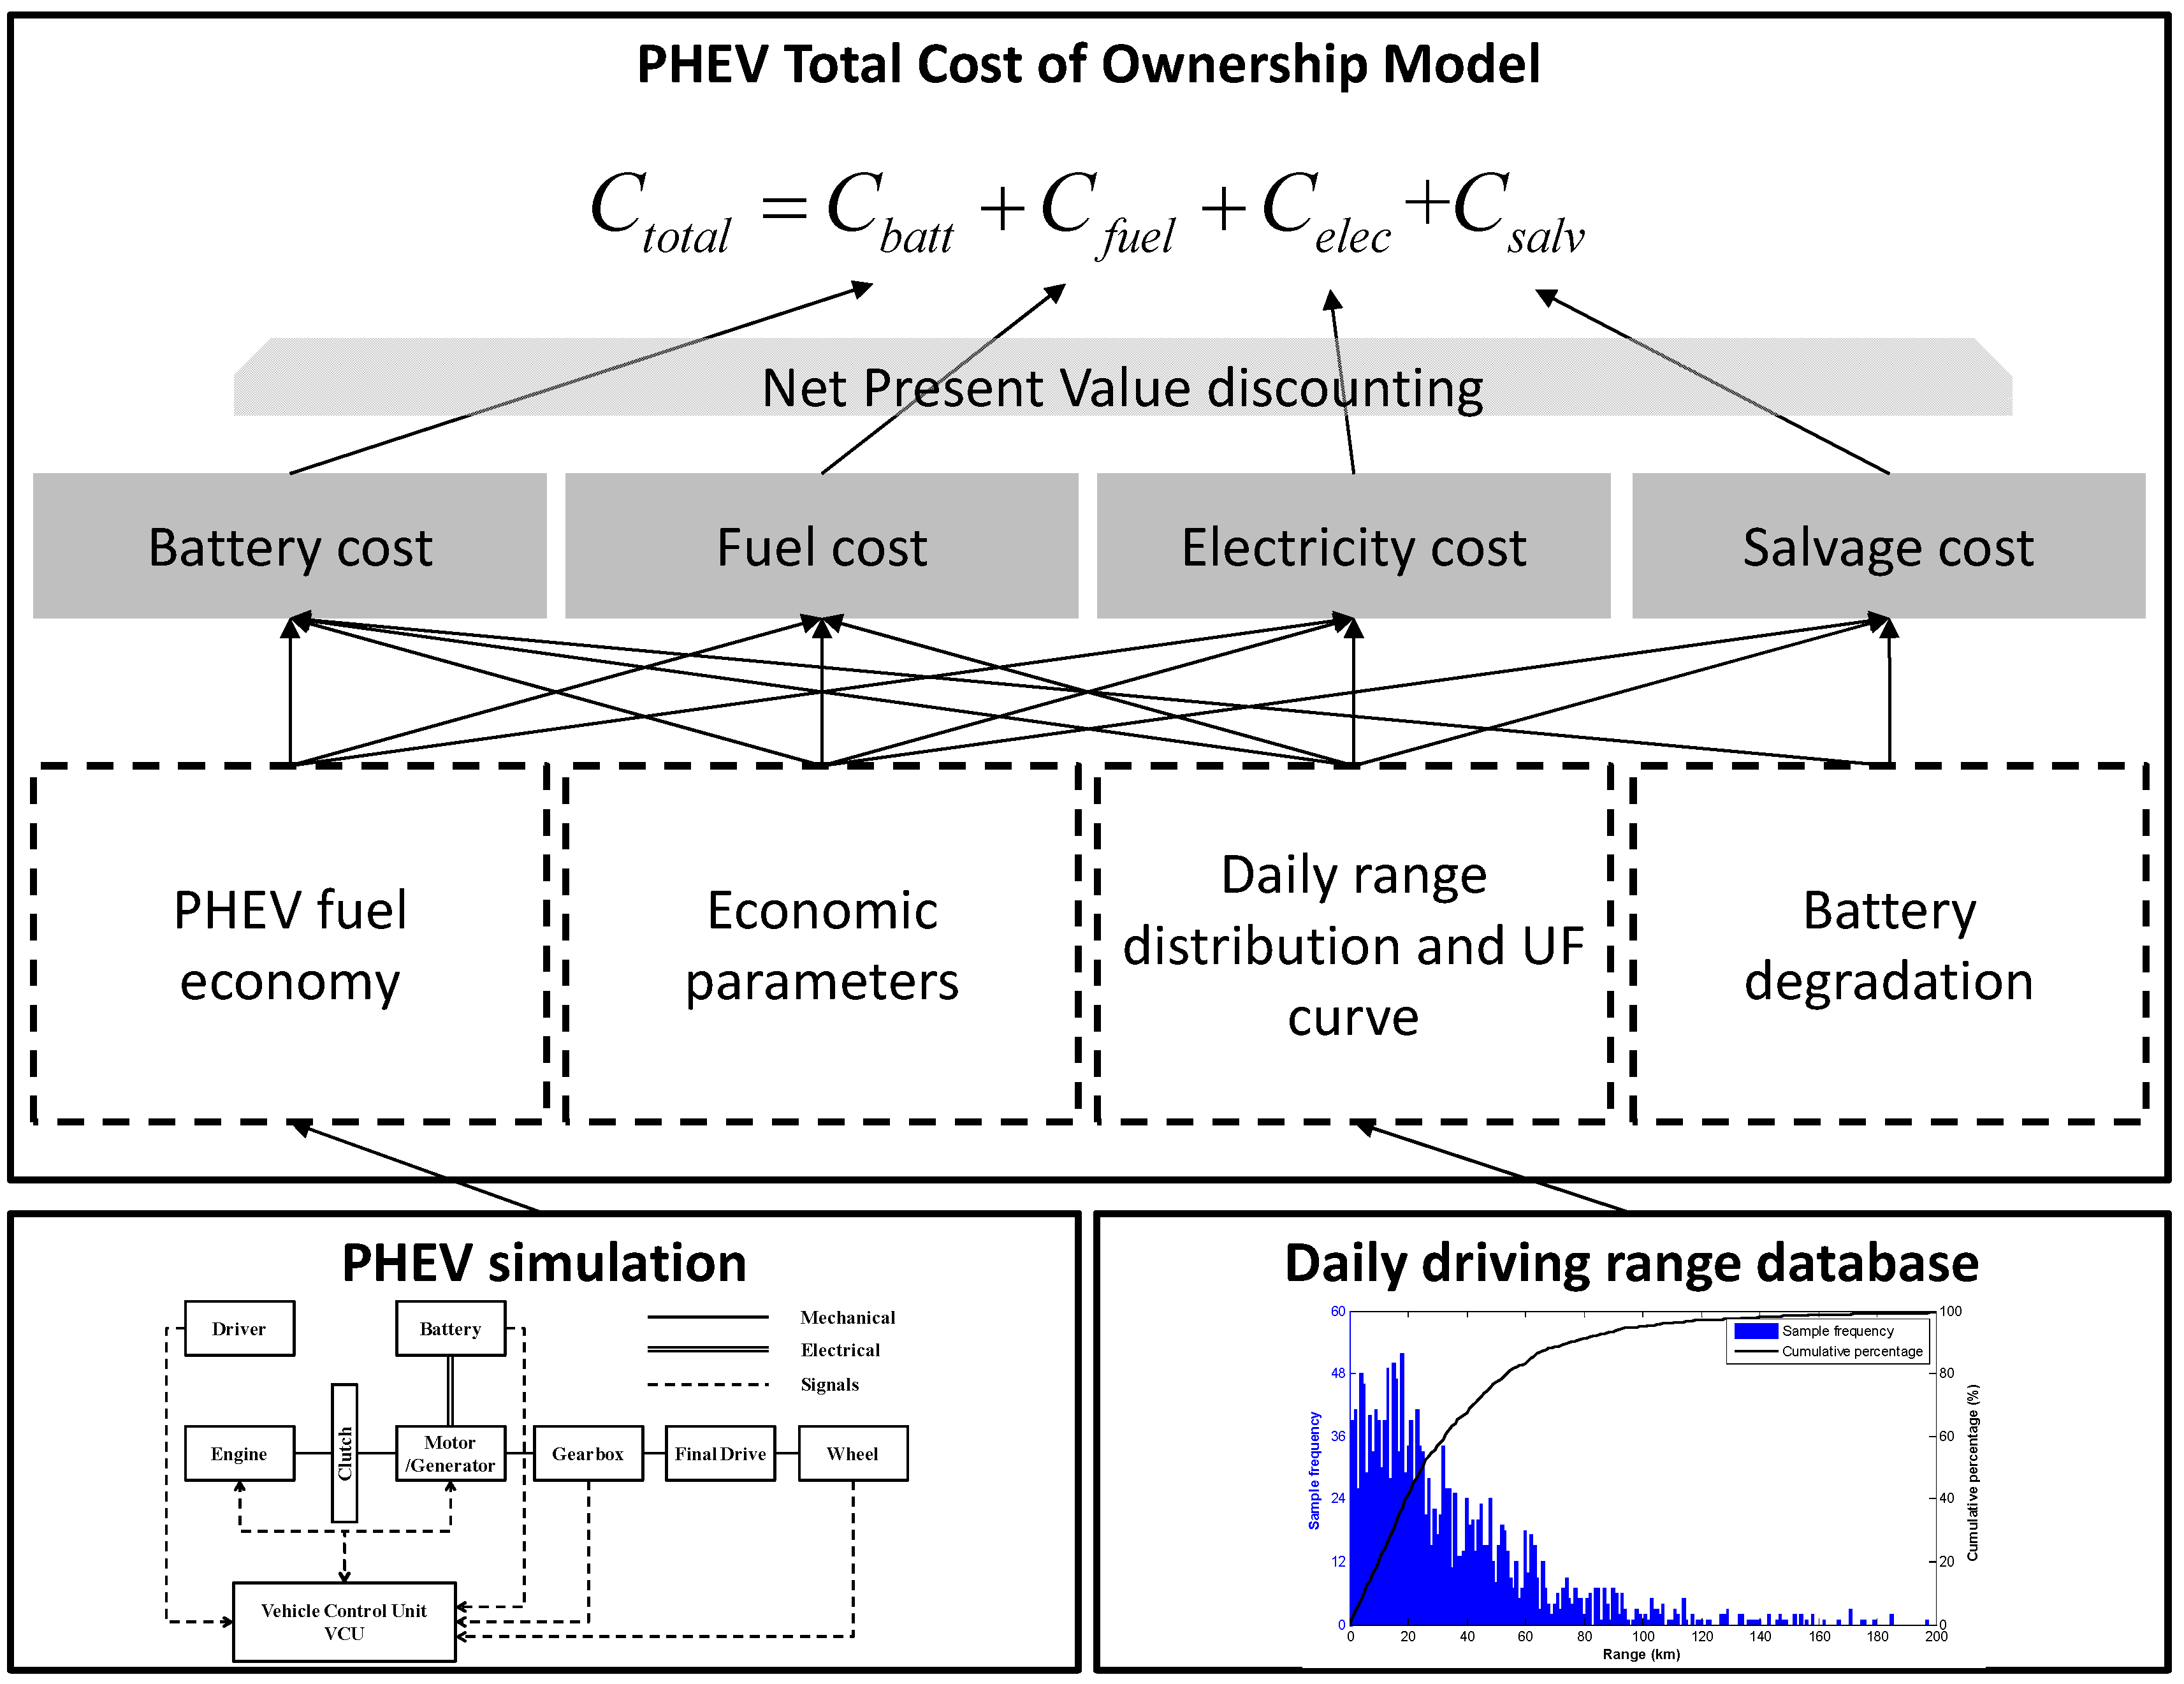
2.2. Battery Cost

2.3. Fuel Cost

2.4. Electricity Cost

2.5. Salvage Cost


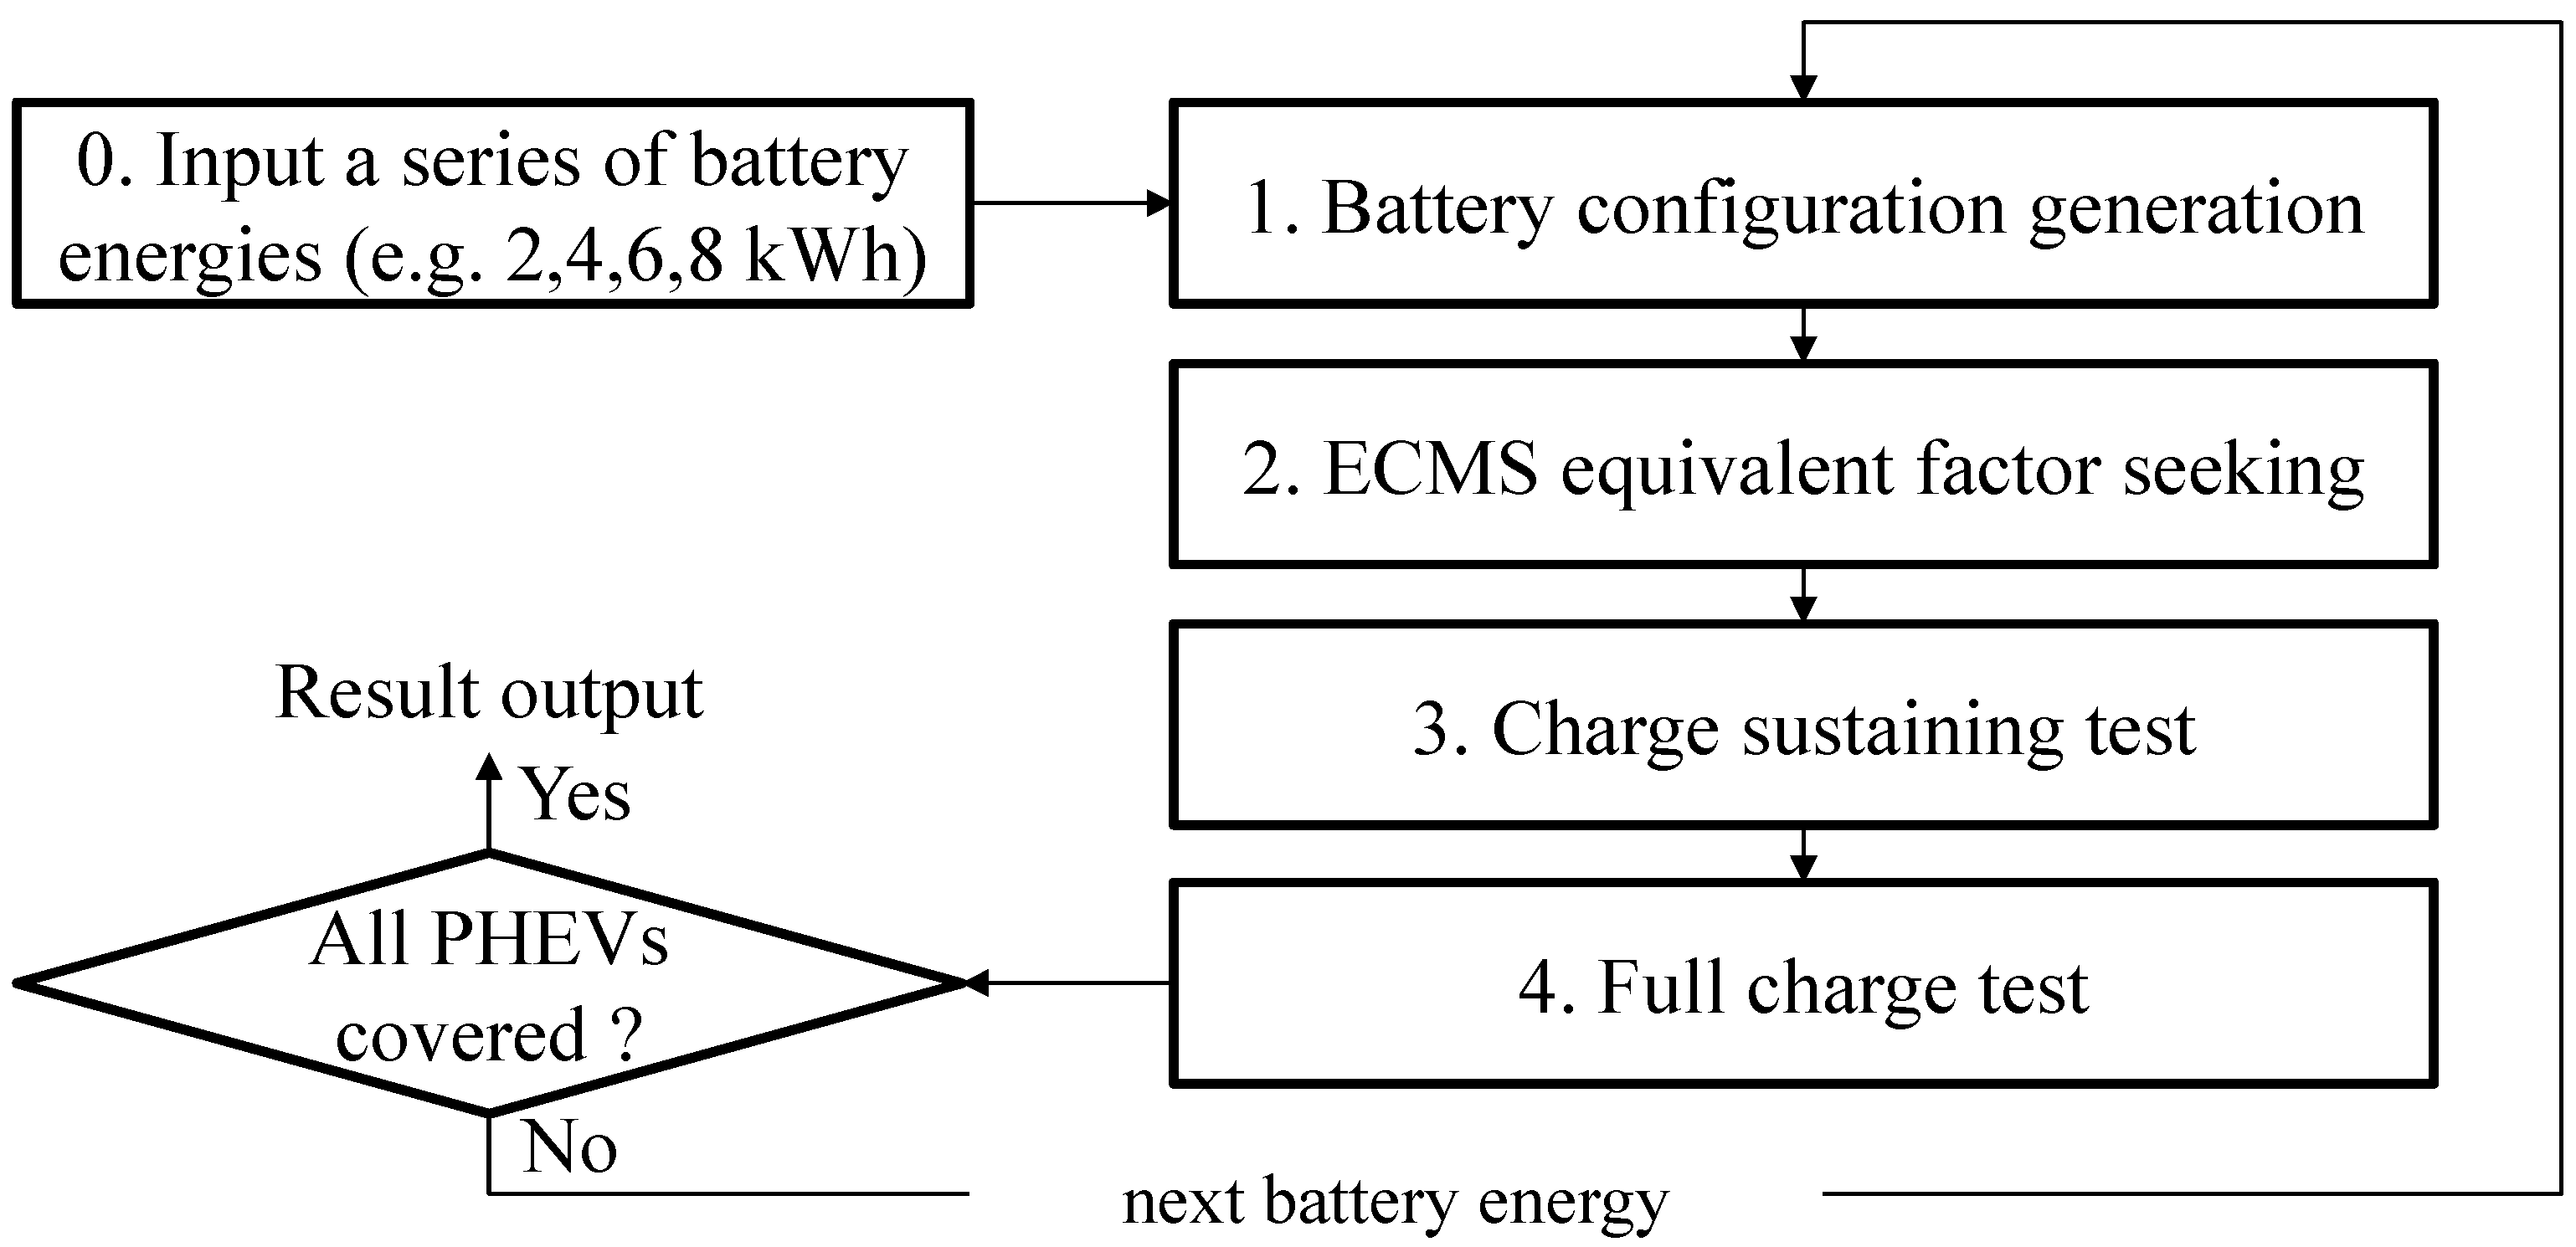
2.6. PHEV Simulation

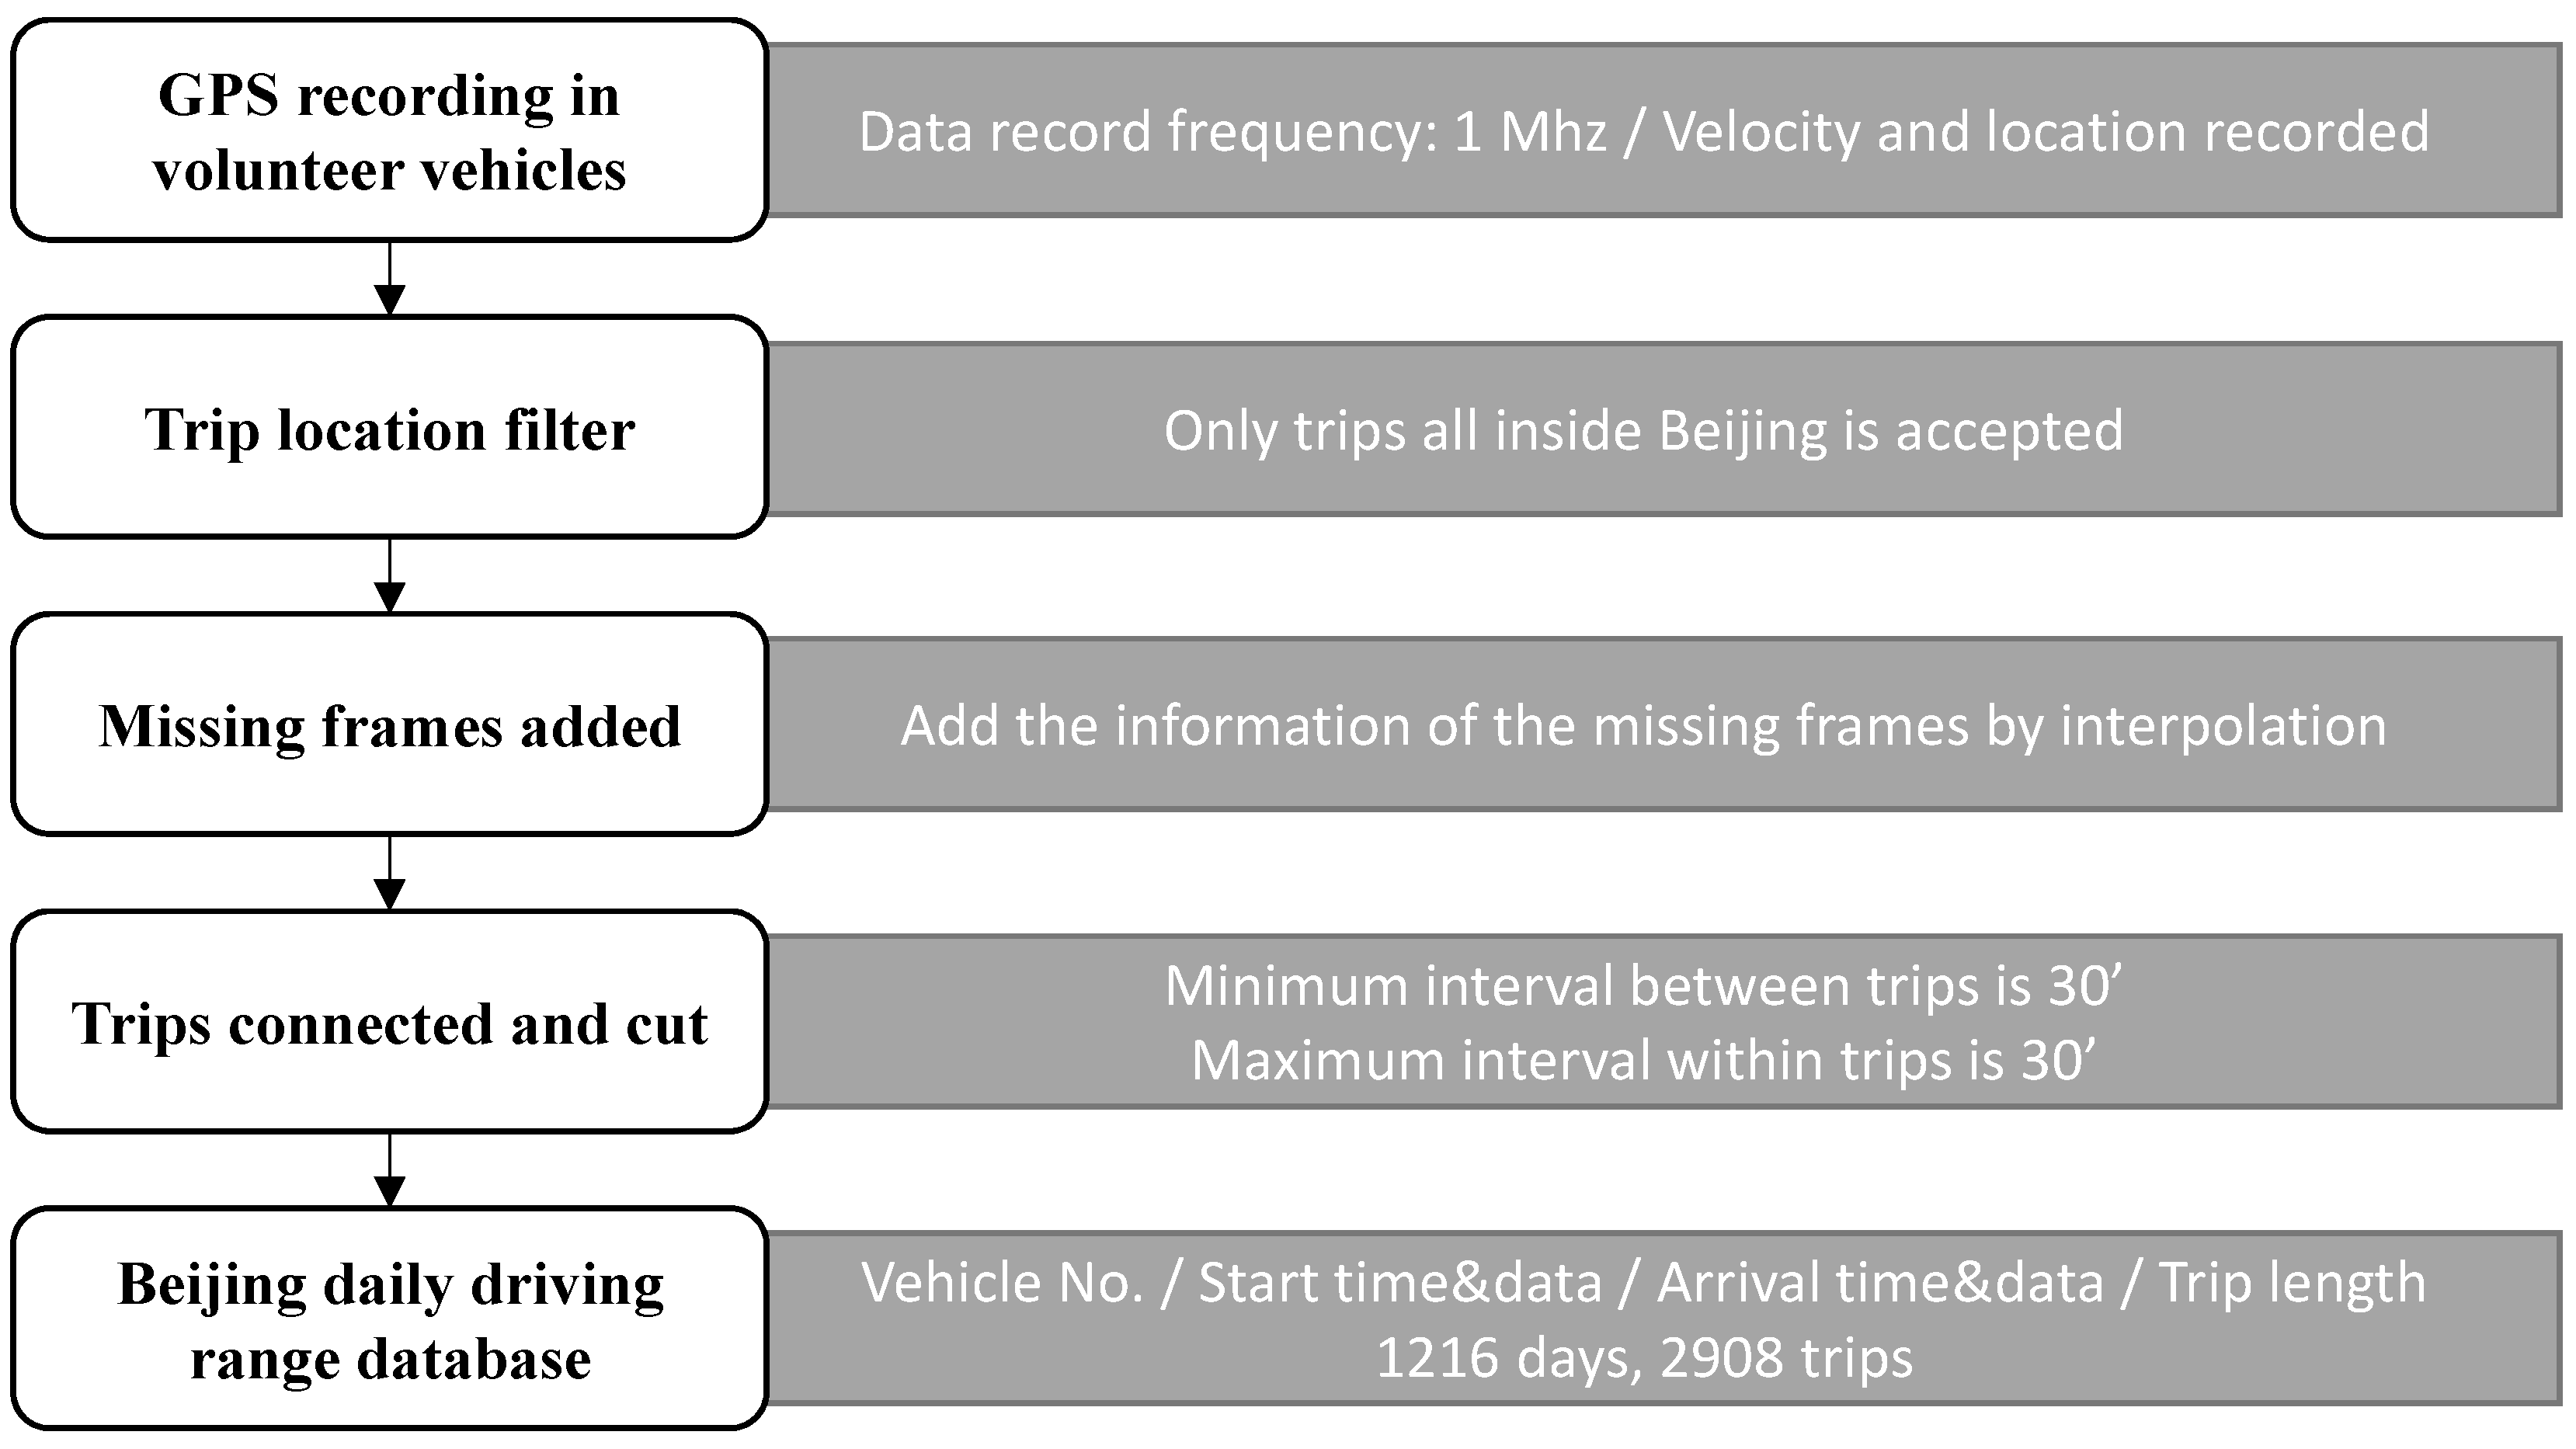
2.7. Daily Driving Range Database
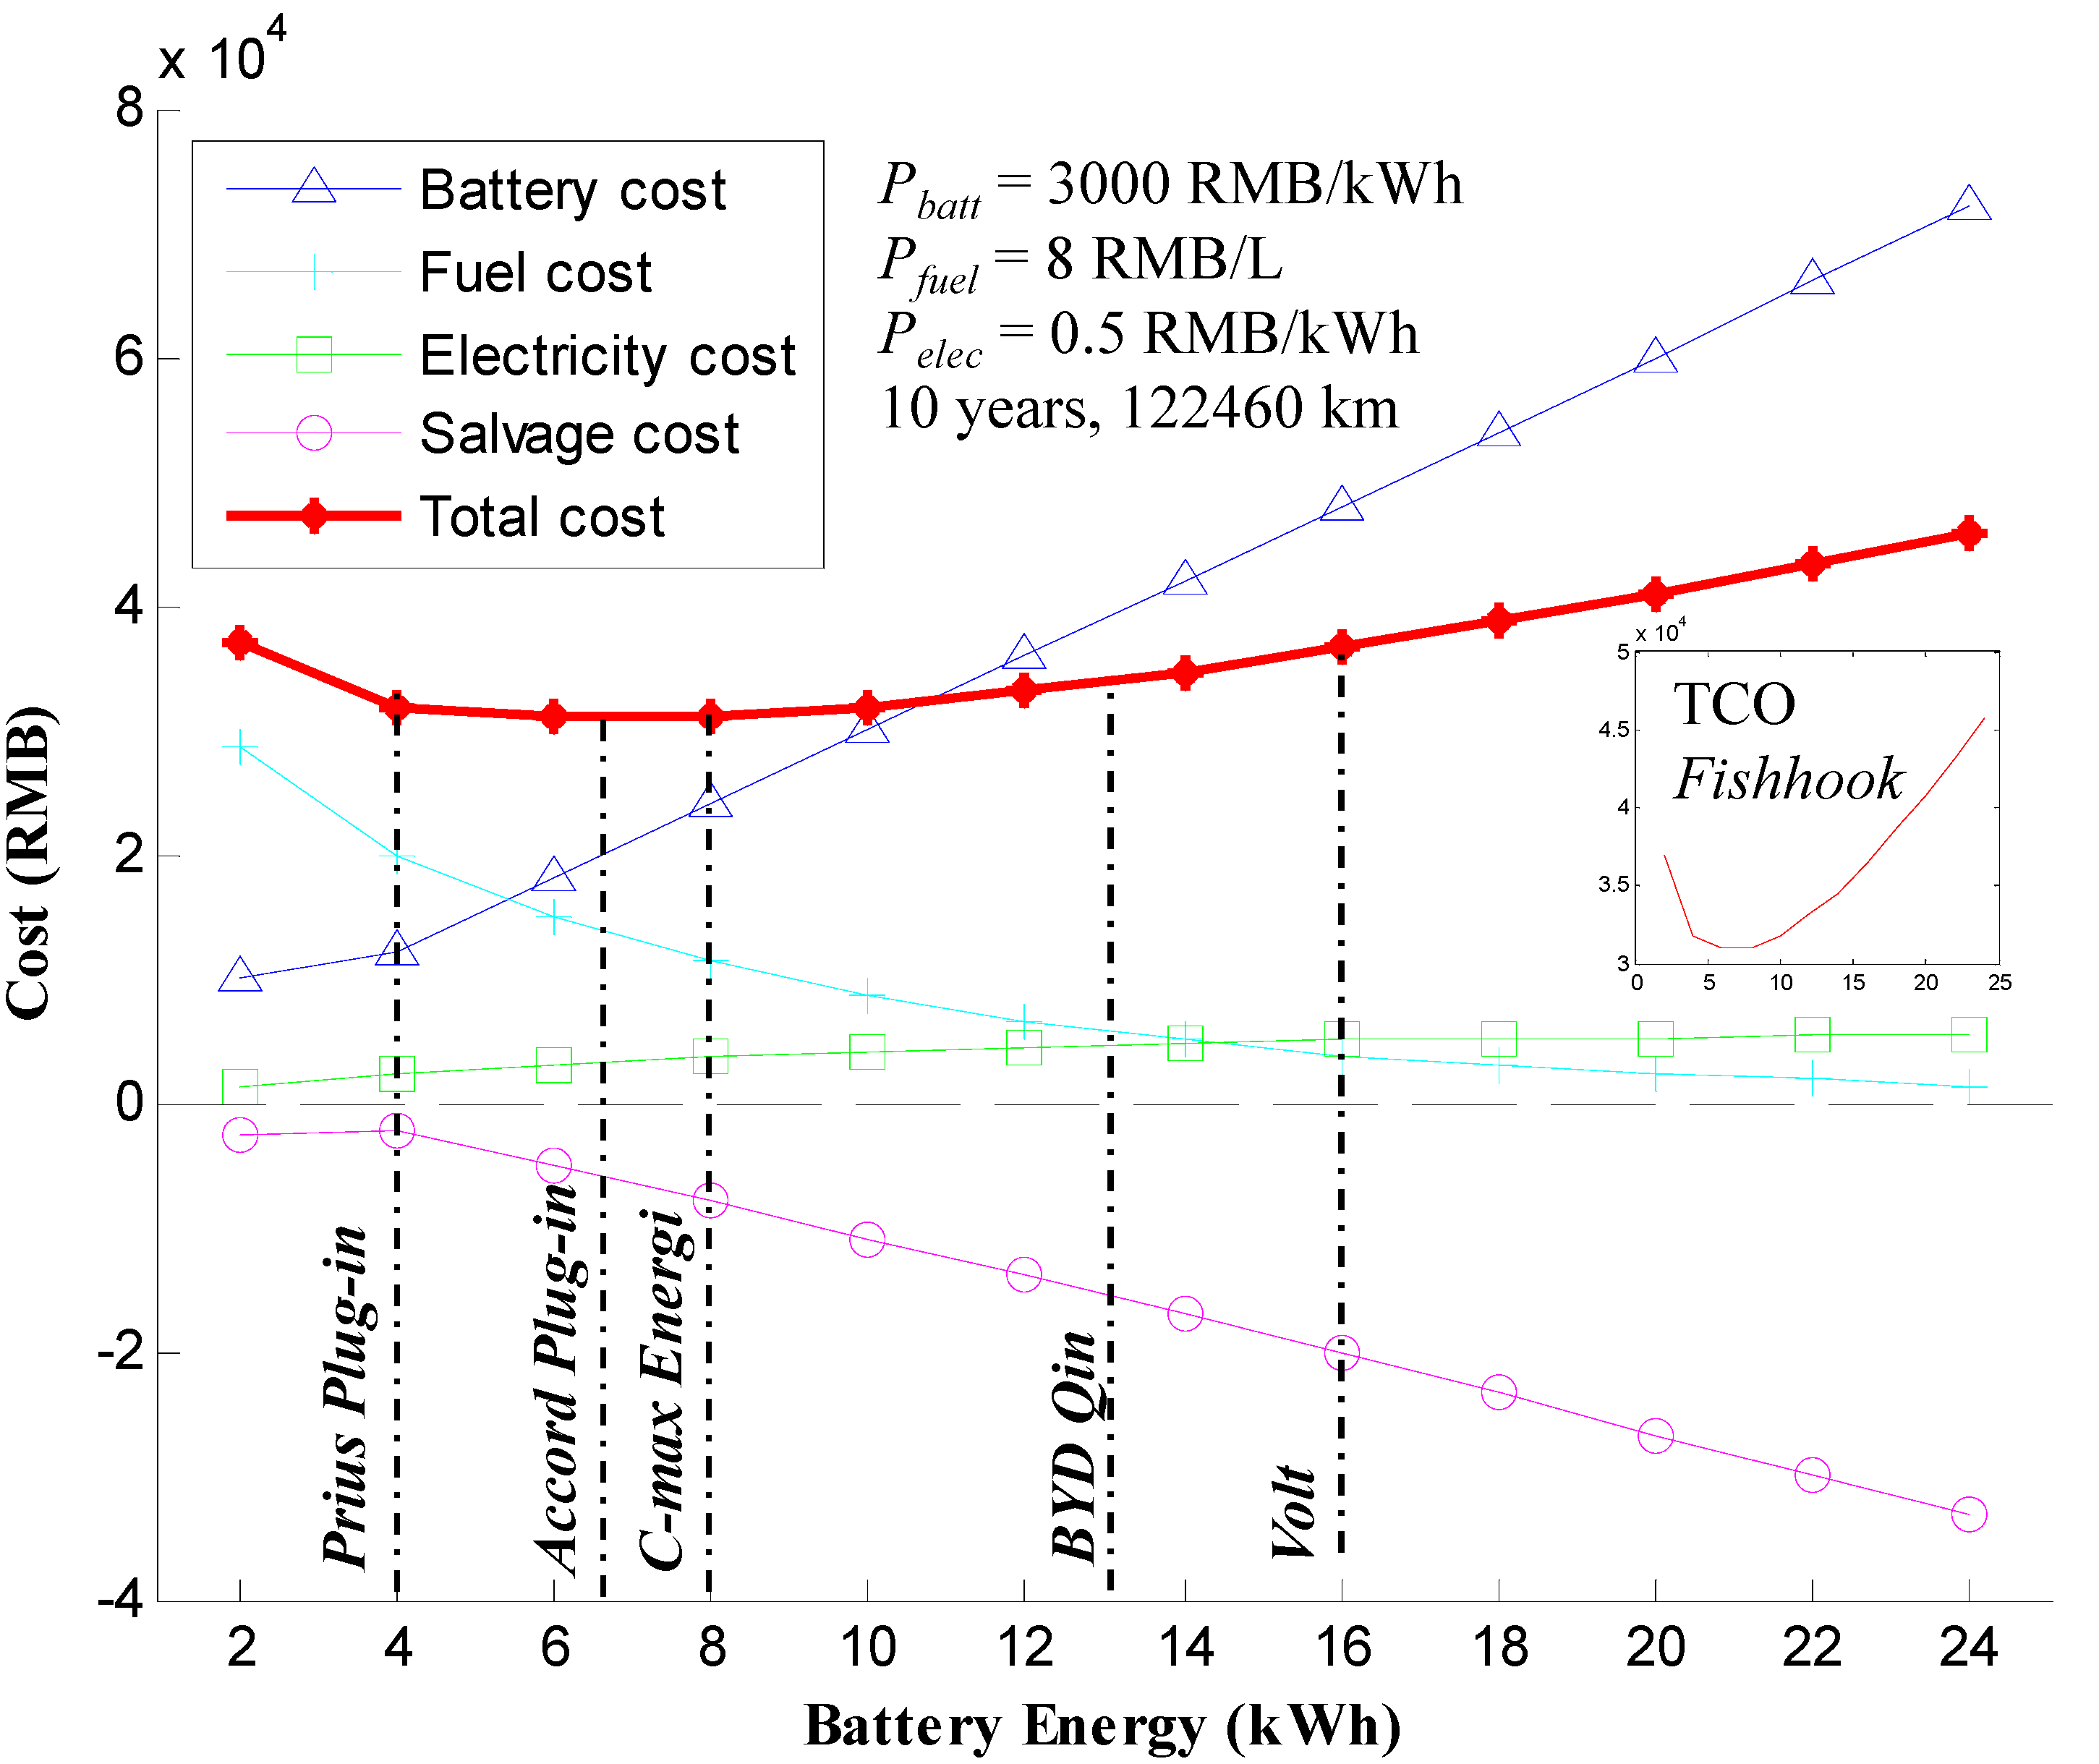
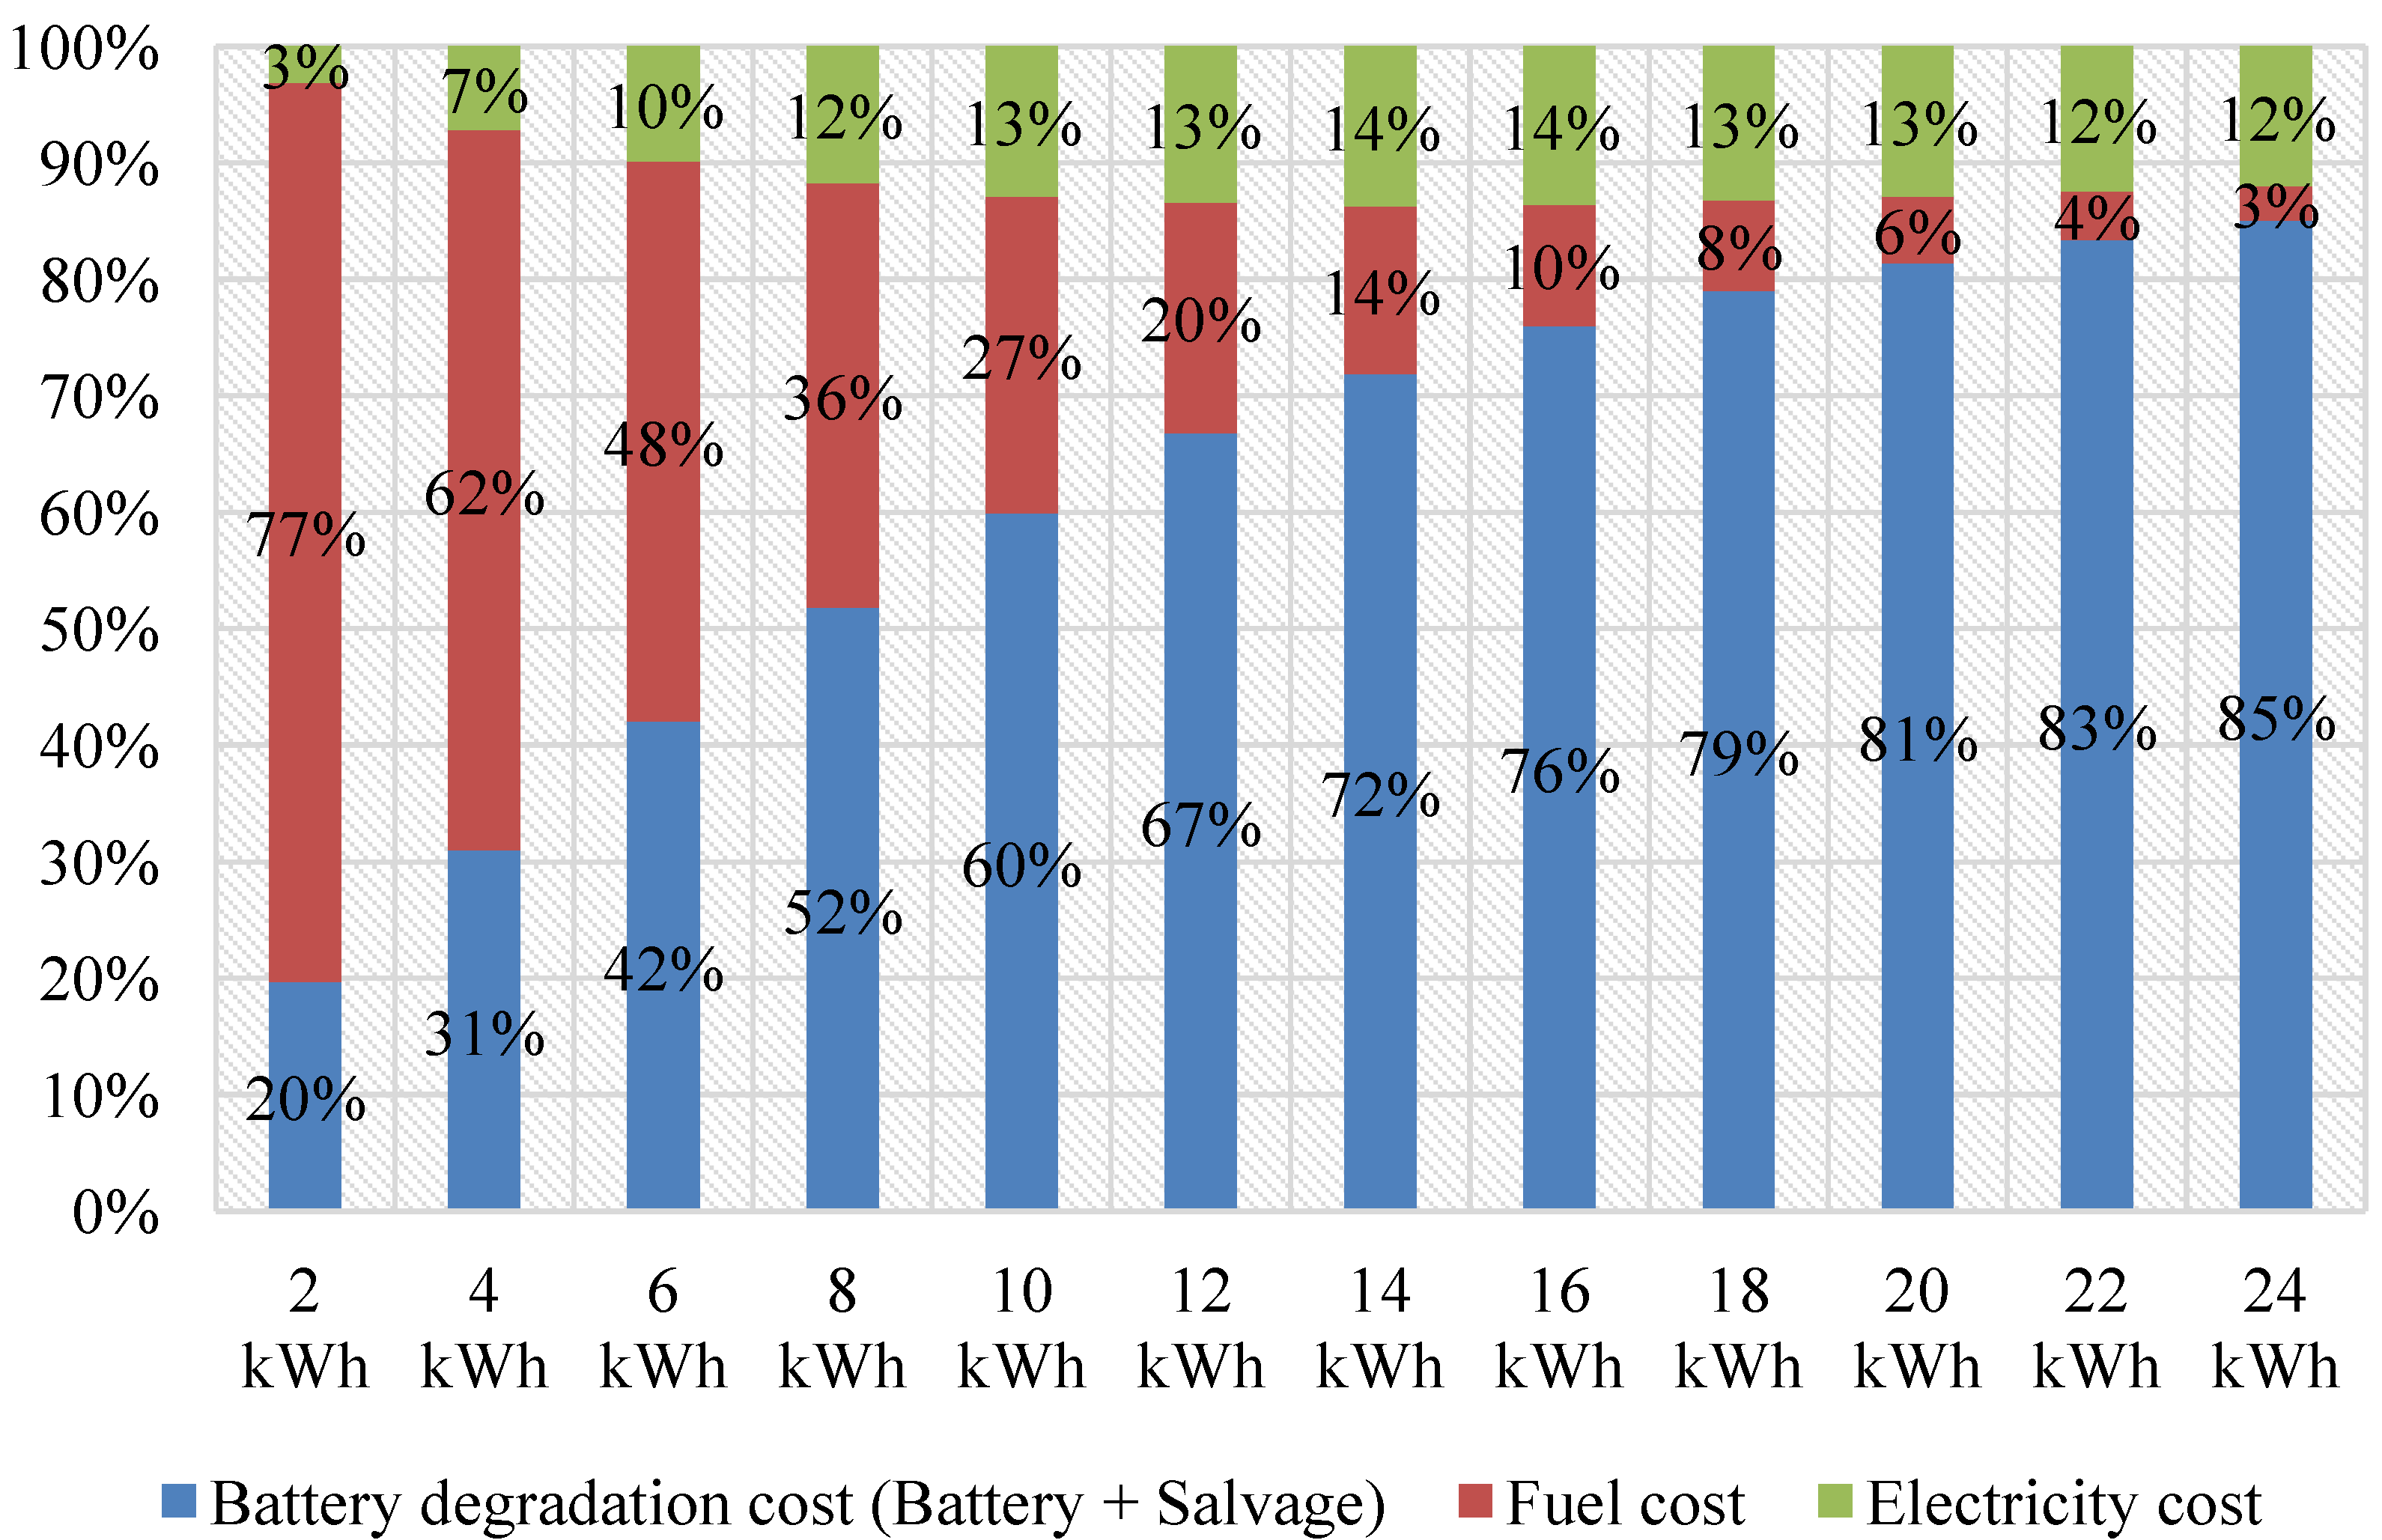
3. Baseline Analysis

| Parameters | Value | Source |
|---|---|---|
| Battery rate | 3000 RMB/kWh | Feng et al. [14] |
| Fuel price | 8 RMB/L | Market value |
| Electricity price | 0.5 RMB/kWh | Market value |
| Discount rate | 0.06 | Al-Alawi and Bradley [8] |
| Evaluation period | 10 years | Hao et al. [26] |
| Battery end rate proportion | 0.2 | ANL Report. [21] |

| Vehicle Configuration | Year | 0 | 1 | 2 | 3 | 4 | 5 | 6 | 7 | 8 | 9 | 10 |
|---|---|---|---|---|---|---|---|---|---|---|---|---|
| Discount rate | 1.00 | 0.94 | 0.89 | 0.84 | 0.79 | 0.75 | 0.70 | 0.67 | 0.63 | 0.59 | 0.56 | |
| PHEV 5 (TCO = 37,152 RMB) | Battery cost (RMB) | 6000 | 0 | 0 | 0 | 0 | 0 | 0 | 3990 | 0 | 0 | 0 |
| Fuel cost (RMB) | 0 | 3657 | 3450 | 3255 | 3070 | 2897 | 2733 | 2578 | 2432 | 2294 | 2165 | |
| Electricity cost (RMB) | 0 | 147 | 138 | 131 | 123 | 116 | 110 | 103 | 98 | 92 | 87 | |
| Salvage cost (RMB) | 0 | 0 | 0 | 0 | 0 | 0 | 0 | –440 | 0 | 0 | –2073 | |
| Total cost (RMB) | 6000 | 3804 | 3588 | 3385 | 3194 | 3013 | 2842 | 6232 | 2530 | 2386 | 178 | |
| PHEV 10 (TCO = 31,956 RMB) | Battery cost (RMB) | 12,000 | 0 | 0 | 0 | 0 | 0 | 0 | 0 | 0 | 0 | 0 |
| Fuel cost (RMB) | 0 | 2519 | 2376 | 2242 | 2115 | 1995 | 1882 | 1776 | 1675 | 1580 | 1491 | |
| Electricity cost (RMB) | 0 | 292 | 275 | 260 | 245 | 231 | 218 | 206 | 194 | 183 | 173 | |
| Salvage cost (RMB) | 0 | 0 | 0 | 0 | 0 | 0 | 0 | 0 | 0 | 0 | –1974 | |
| Total cost (RMB) | 12,000 | 2811 | 2652 | 2502 | 2360 | 2227 | 2101 | 1982 | 1869 | 1764 | –310 | |
| PHEV 20 (TCO = 31,224 RMB) | Battery cost (RMB) | 24,000 | 0 | 0 | 0 | 0 | 0 | 0 | 0 | 0 | 0 | 0 |
| Fuel cost (RMB) | 0 | 1447 | 1365 | 1288 | 1215 | 1146 | 1081 | 1020 | 962 | 908 | 856 | |
| Electricity cost (RMB) | 0 | 467 | 440 | 415 | 392 | 370 | 349 | 329 | 310 | 293 | 276 | |
| Salvage cost (RMB) | 0 | 0 | 0 | 0 | 0 | 0 | 0 | 0 | 0 | 0 | –7704 | |
| Total cost (RMB) | 24,000 | 1913 | 1805 | 1703 | 1607 | 1516 | 1430 | 1349 | 1273 | 1201 | –6571 | |
| PHEV 40 (TCO = 36,775 RMB) | Battery cost (RMB) | 48,000 | 0 | 0 | 0 | 0 | 0 | 0 | 0 | 0 | 0 | 0 |
| Fuel cost (RMB) | 0 | 487 | 459 | 433 | 409 | 386 | 364 | 343 | 324 | 305 | 288 | |
| Electricity cost (RMB) | 0 | 636 | 600 | 566 | 534 | 503 | 475 | 448 | 423 | 399 | 376 | |
| Salvage cost (RMB) | 0 | 0 | 0 | 0 | 0 | 0 | 0 | 0 | 0 | 0 | –19982 | |
| Total cost (RMB) | 48,000 | 1122 | 1059 | 999 | 942 | 889 | 839 | 791 | 747 | 704 | –19318 |
4. Scenario Analysis
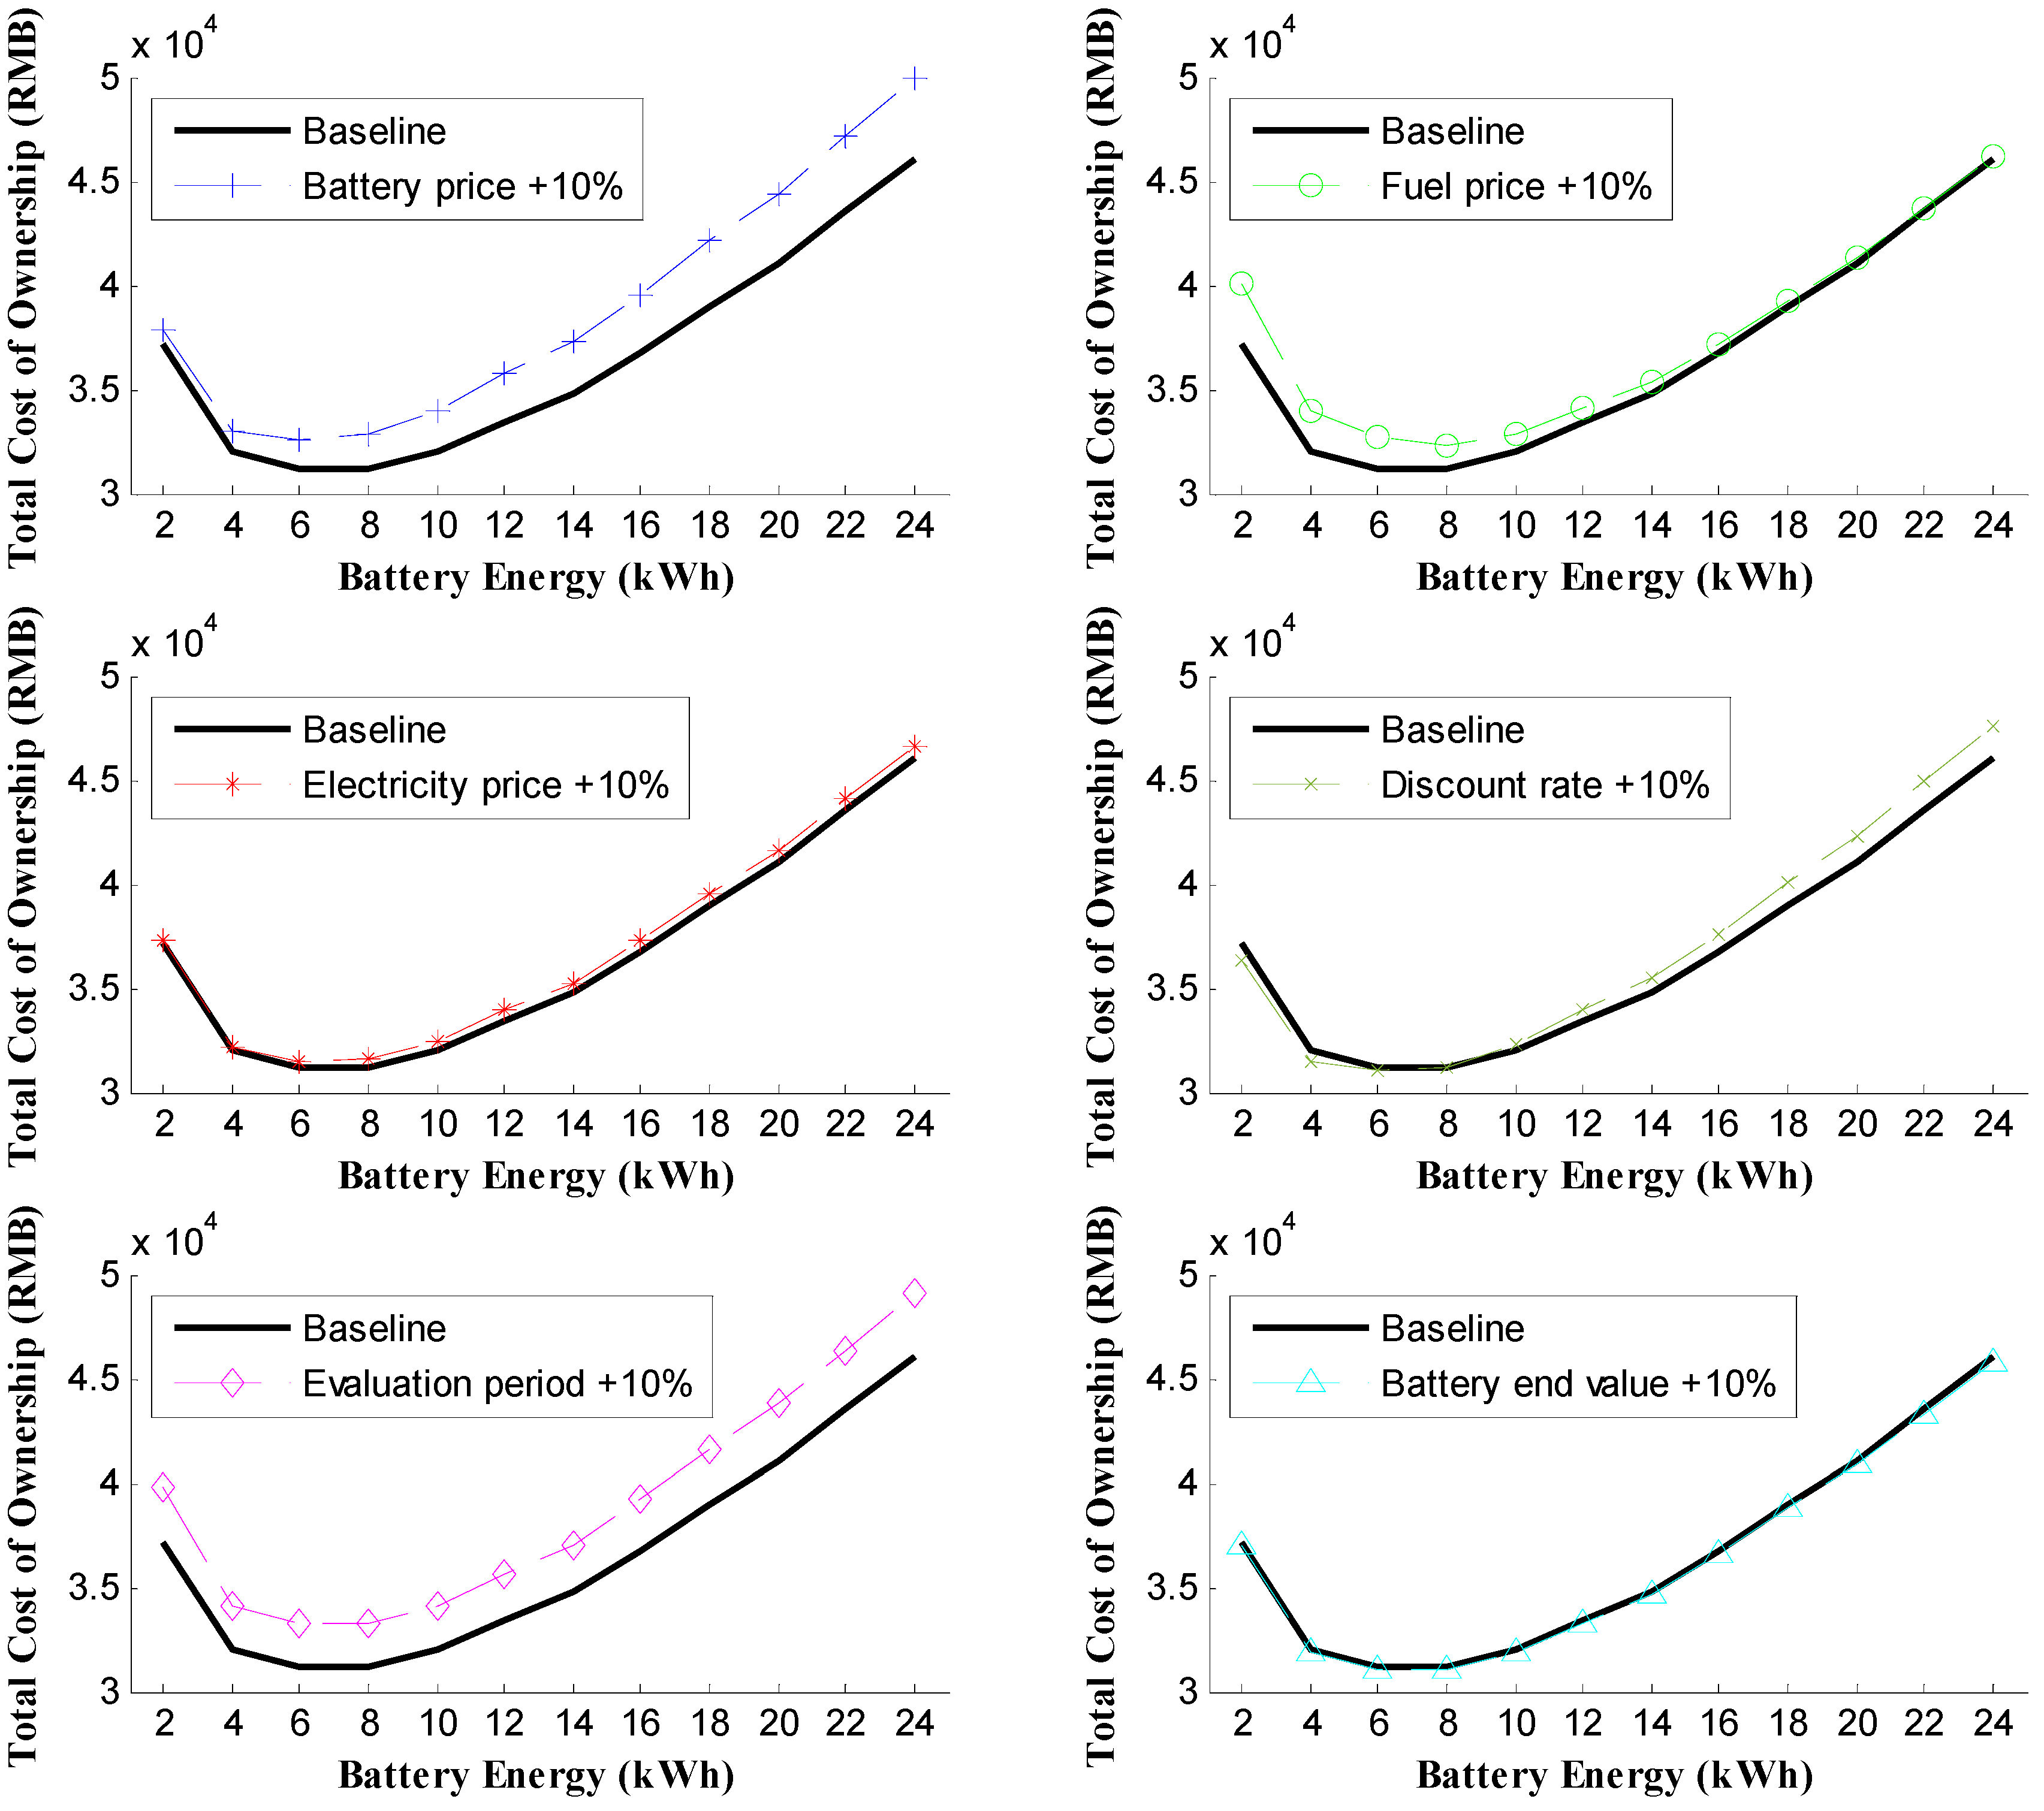
4.1. Sensitivity Analysis

| Parameter | Baseline | Increased | Comparison |
|---|---|---|---|
| Battery price (RMB/kWh) | 3000 | 3300 | 10% |
| Fuel price (RMB/L) | 8 | 8.8 | 10% |
| Electricity price (RMB/kWh) | 0.5 | 0.55 | 10% |
| Discount rate | 0.06 | 0.066 | 10% |
| Evaluation period (year) | 10 | 11 | 10% |
| Battery end relative value | 0.2 | 0.22 | 10% |
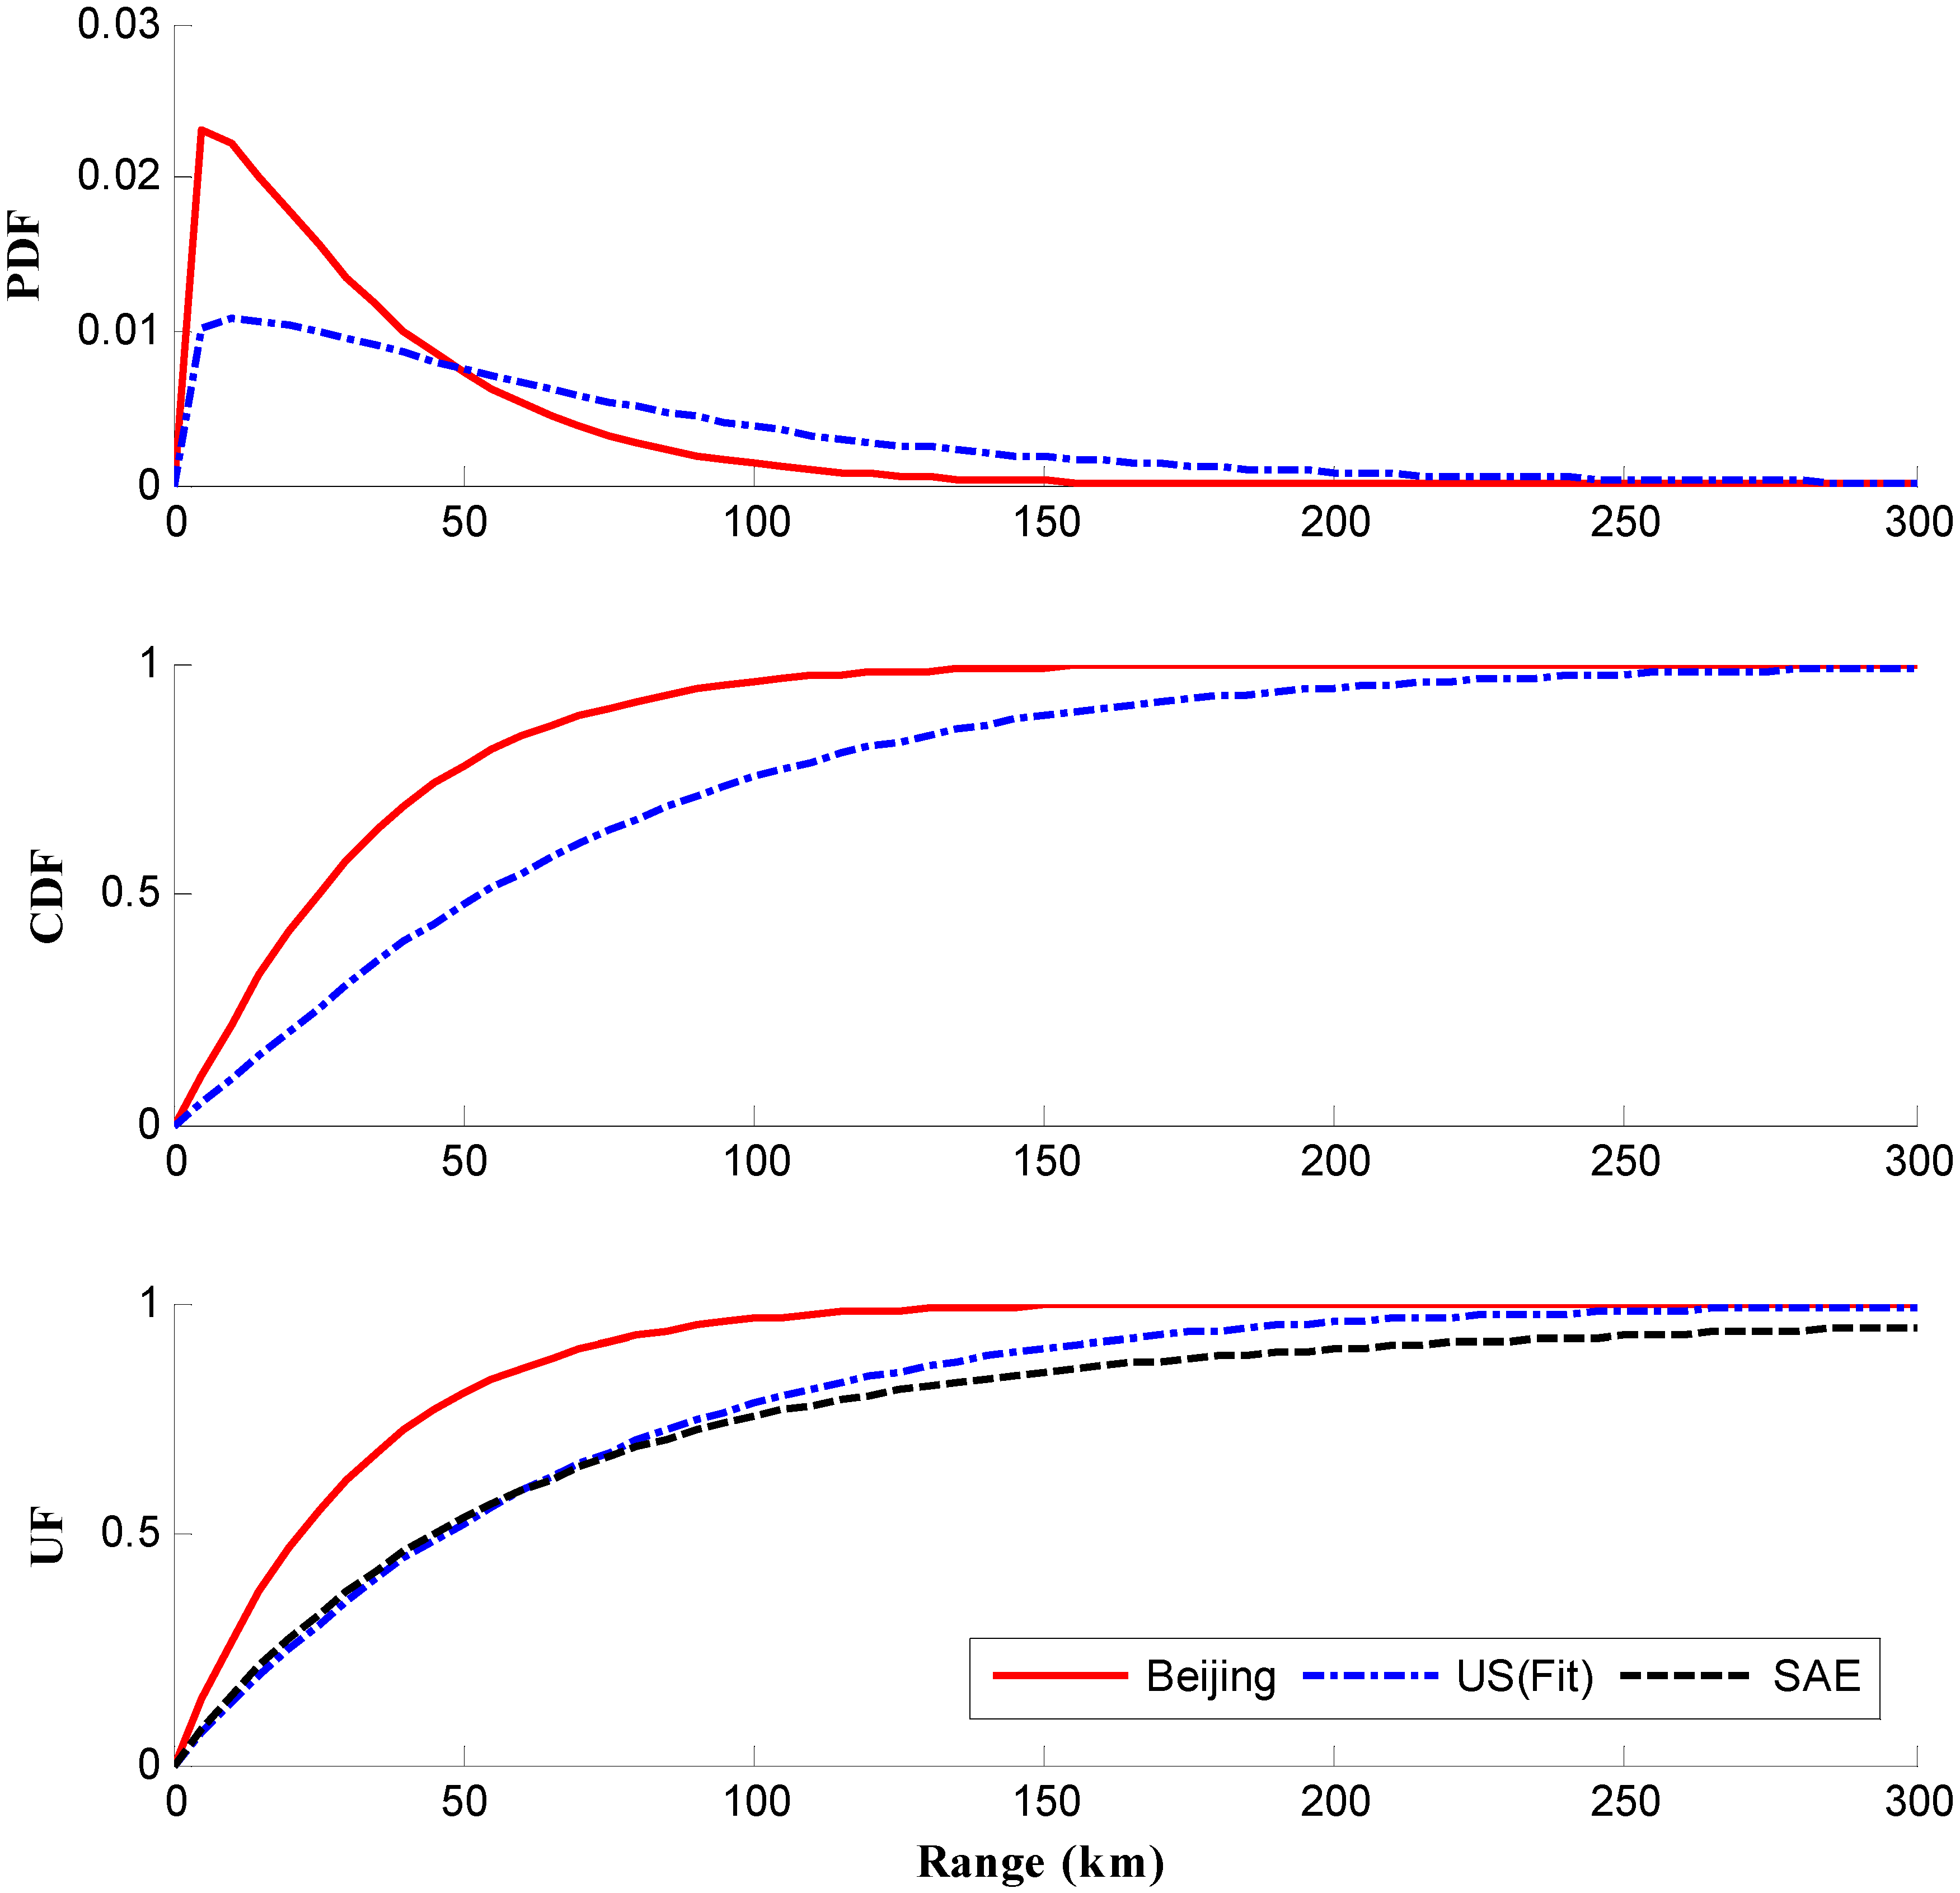
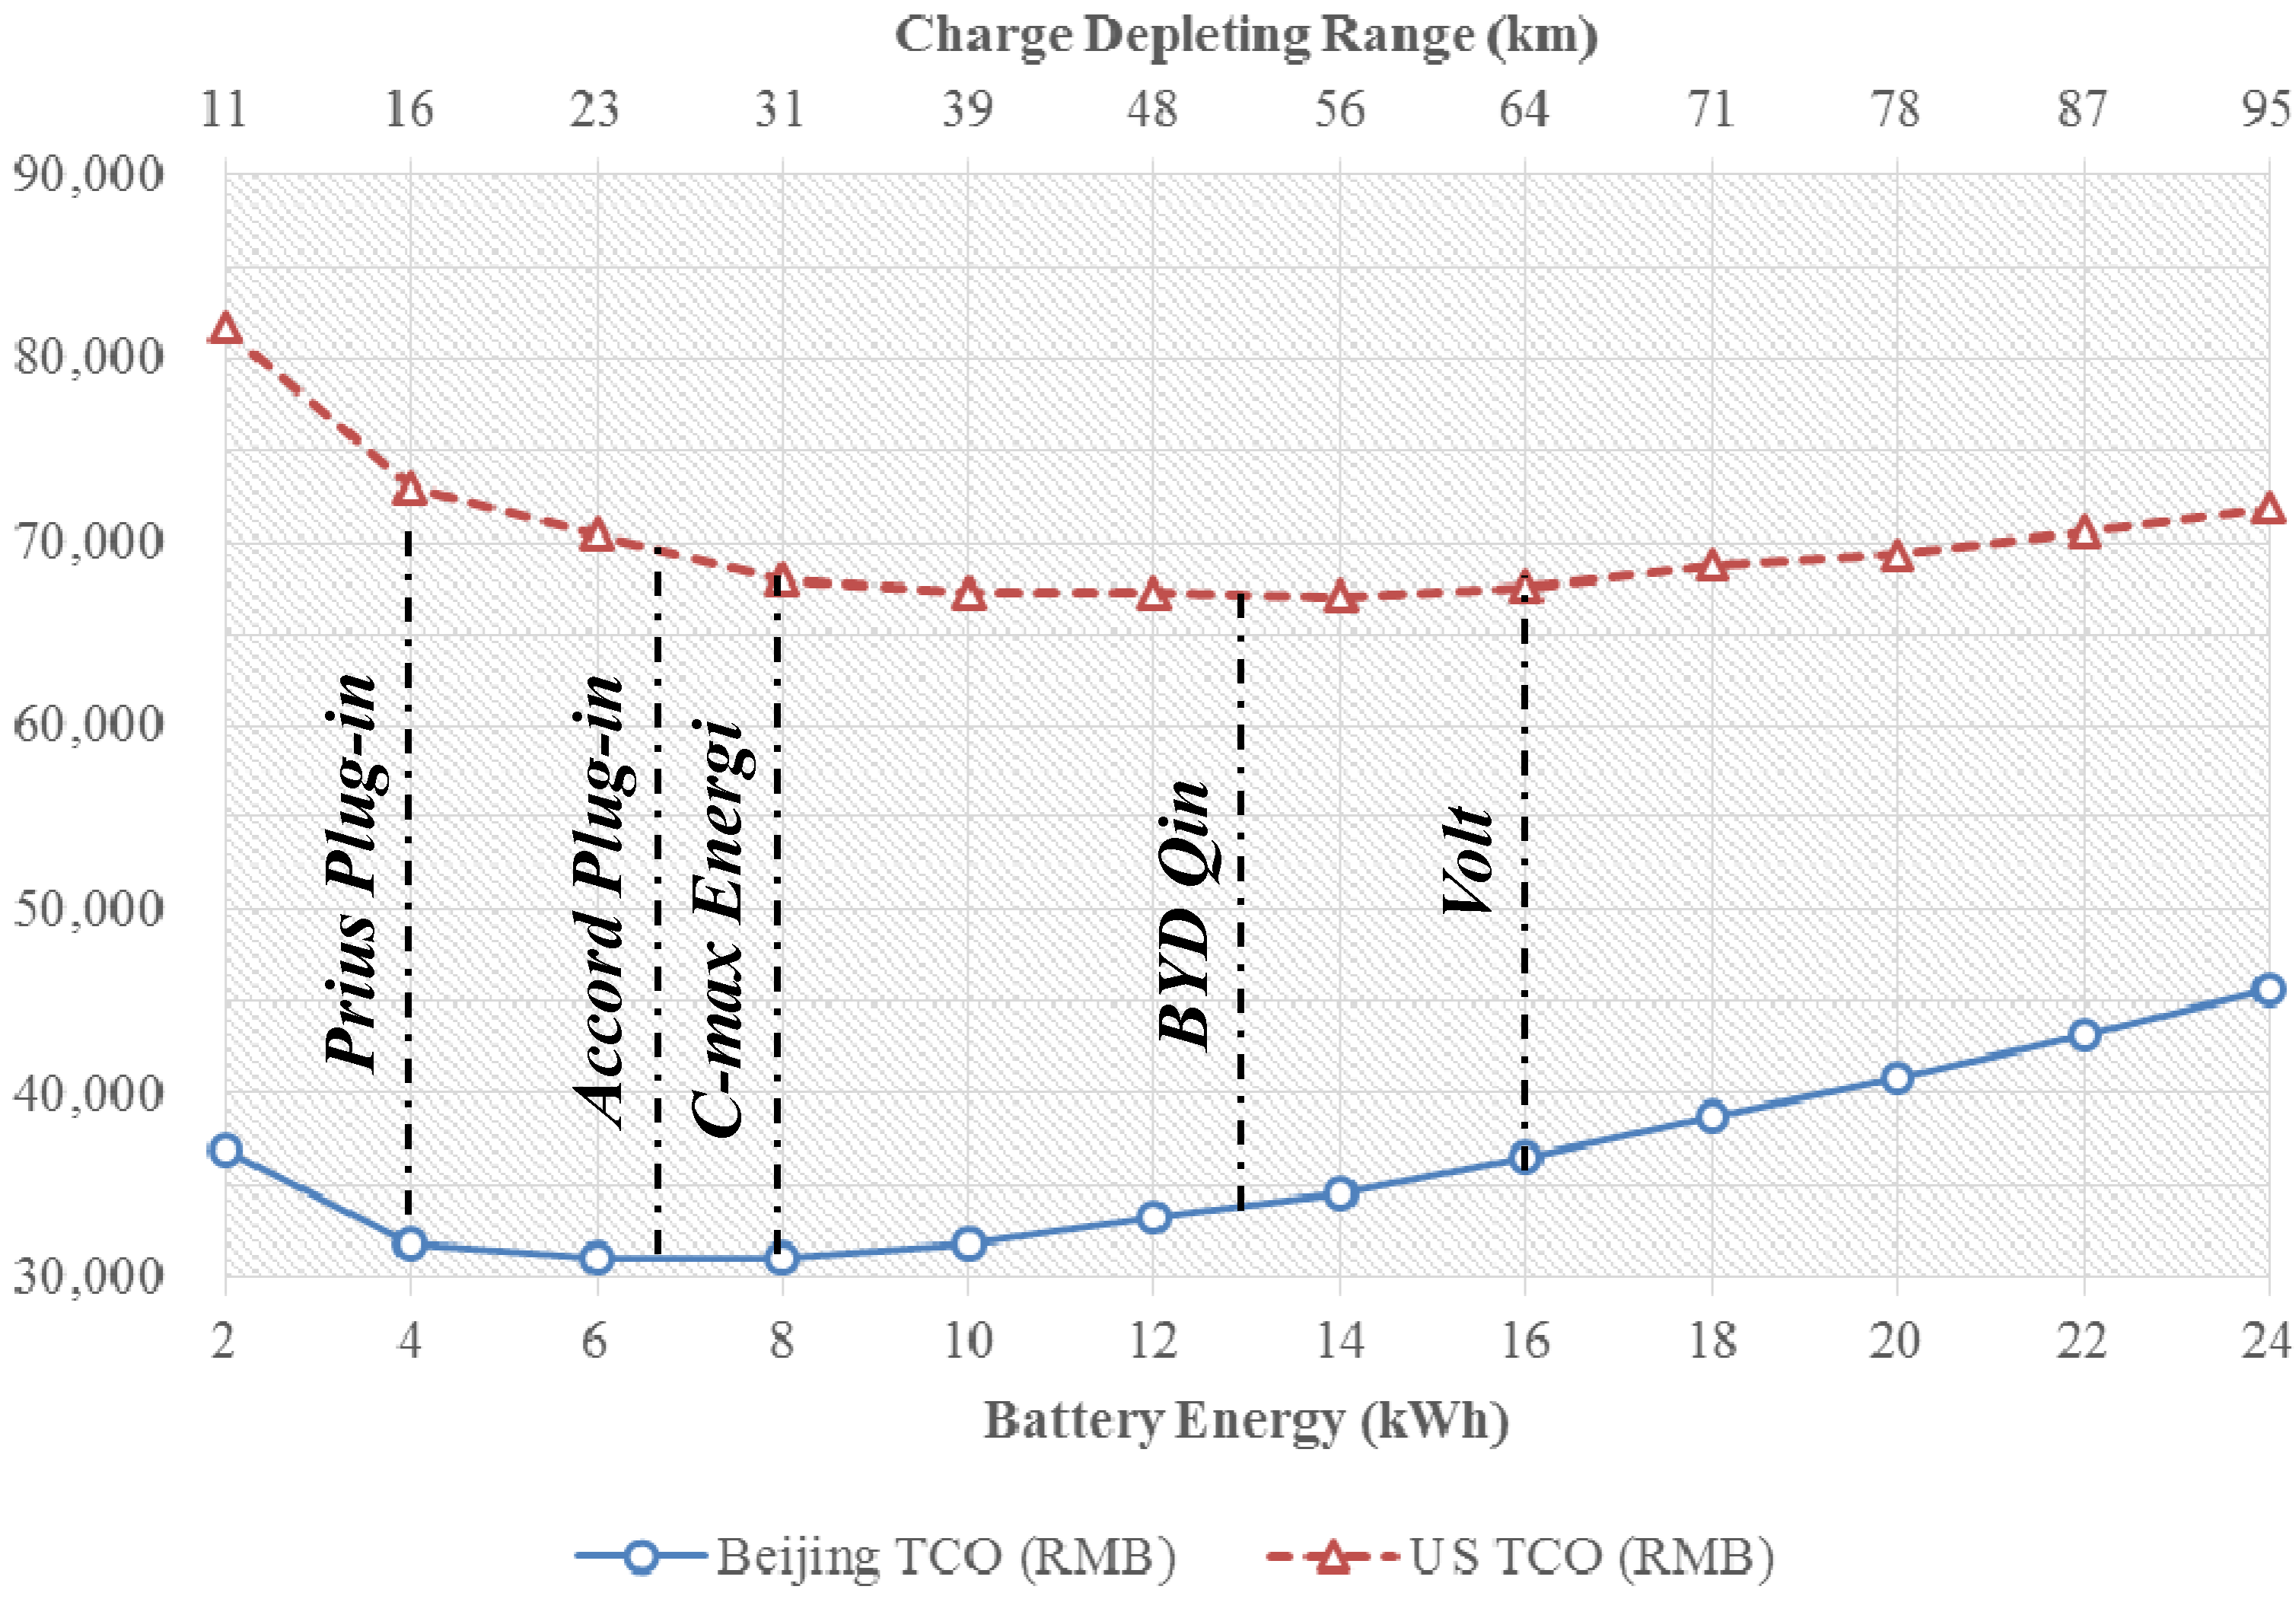
4.2. Driving Range Distributions

| Location | Parameter a | Parameter b |
|---|---|---|
| Beijing | 1.20 | 27.87 |
| U.S. | 1.21 | 59.58 |

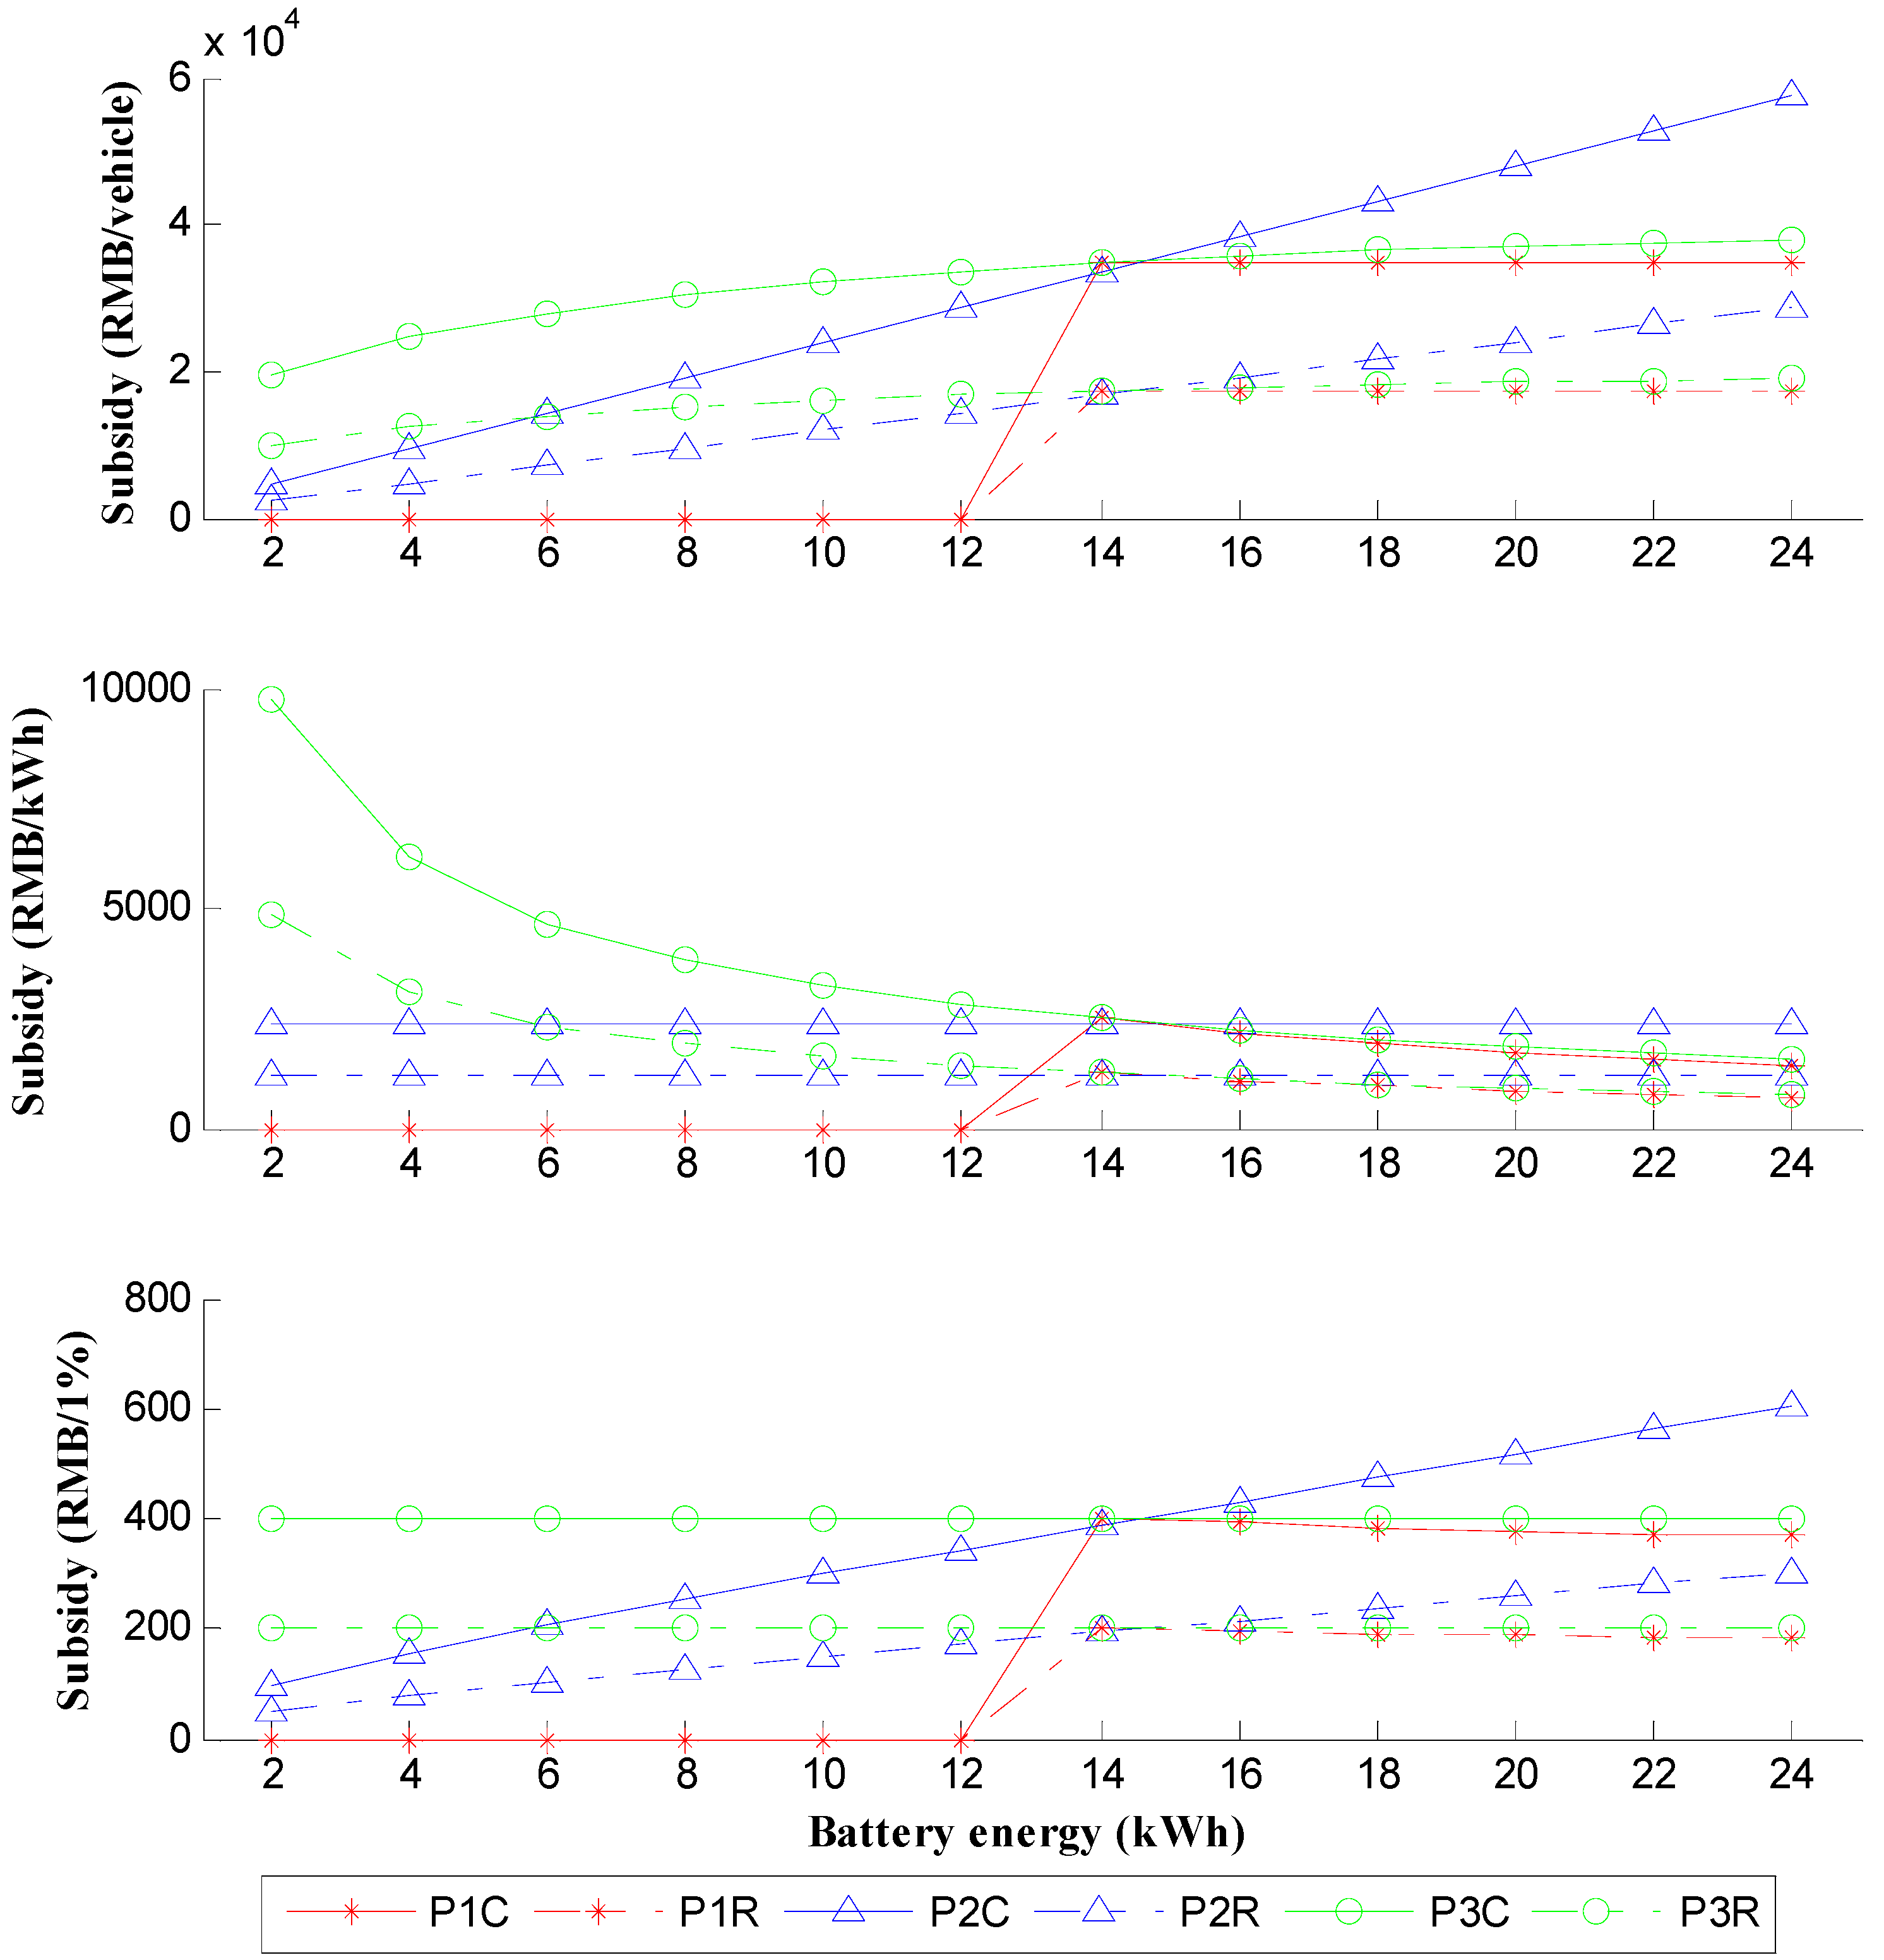
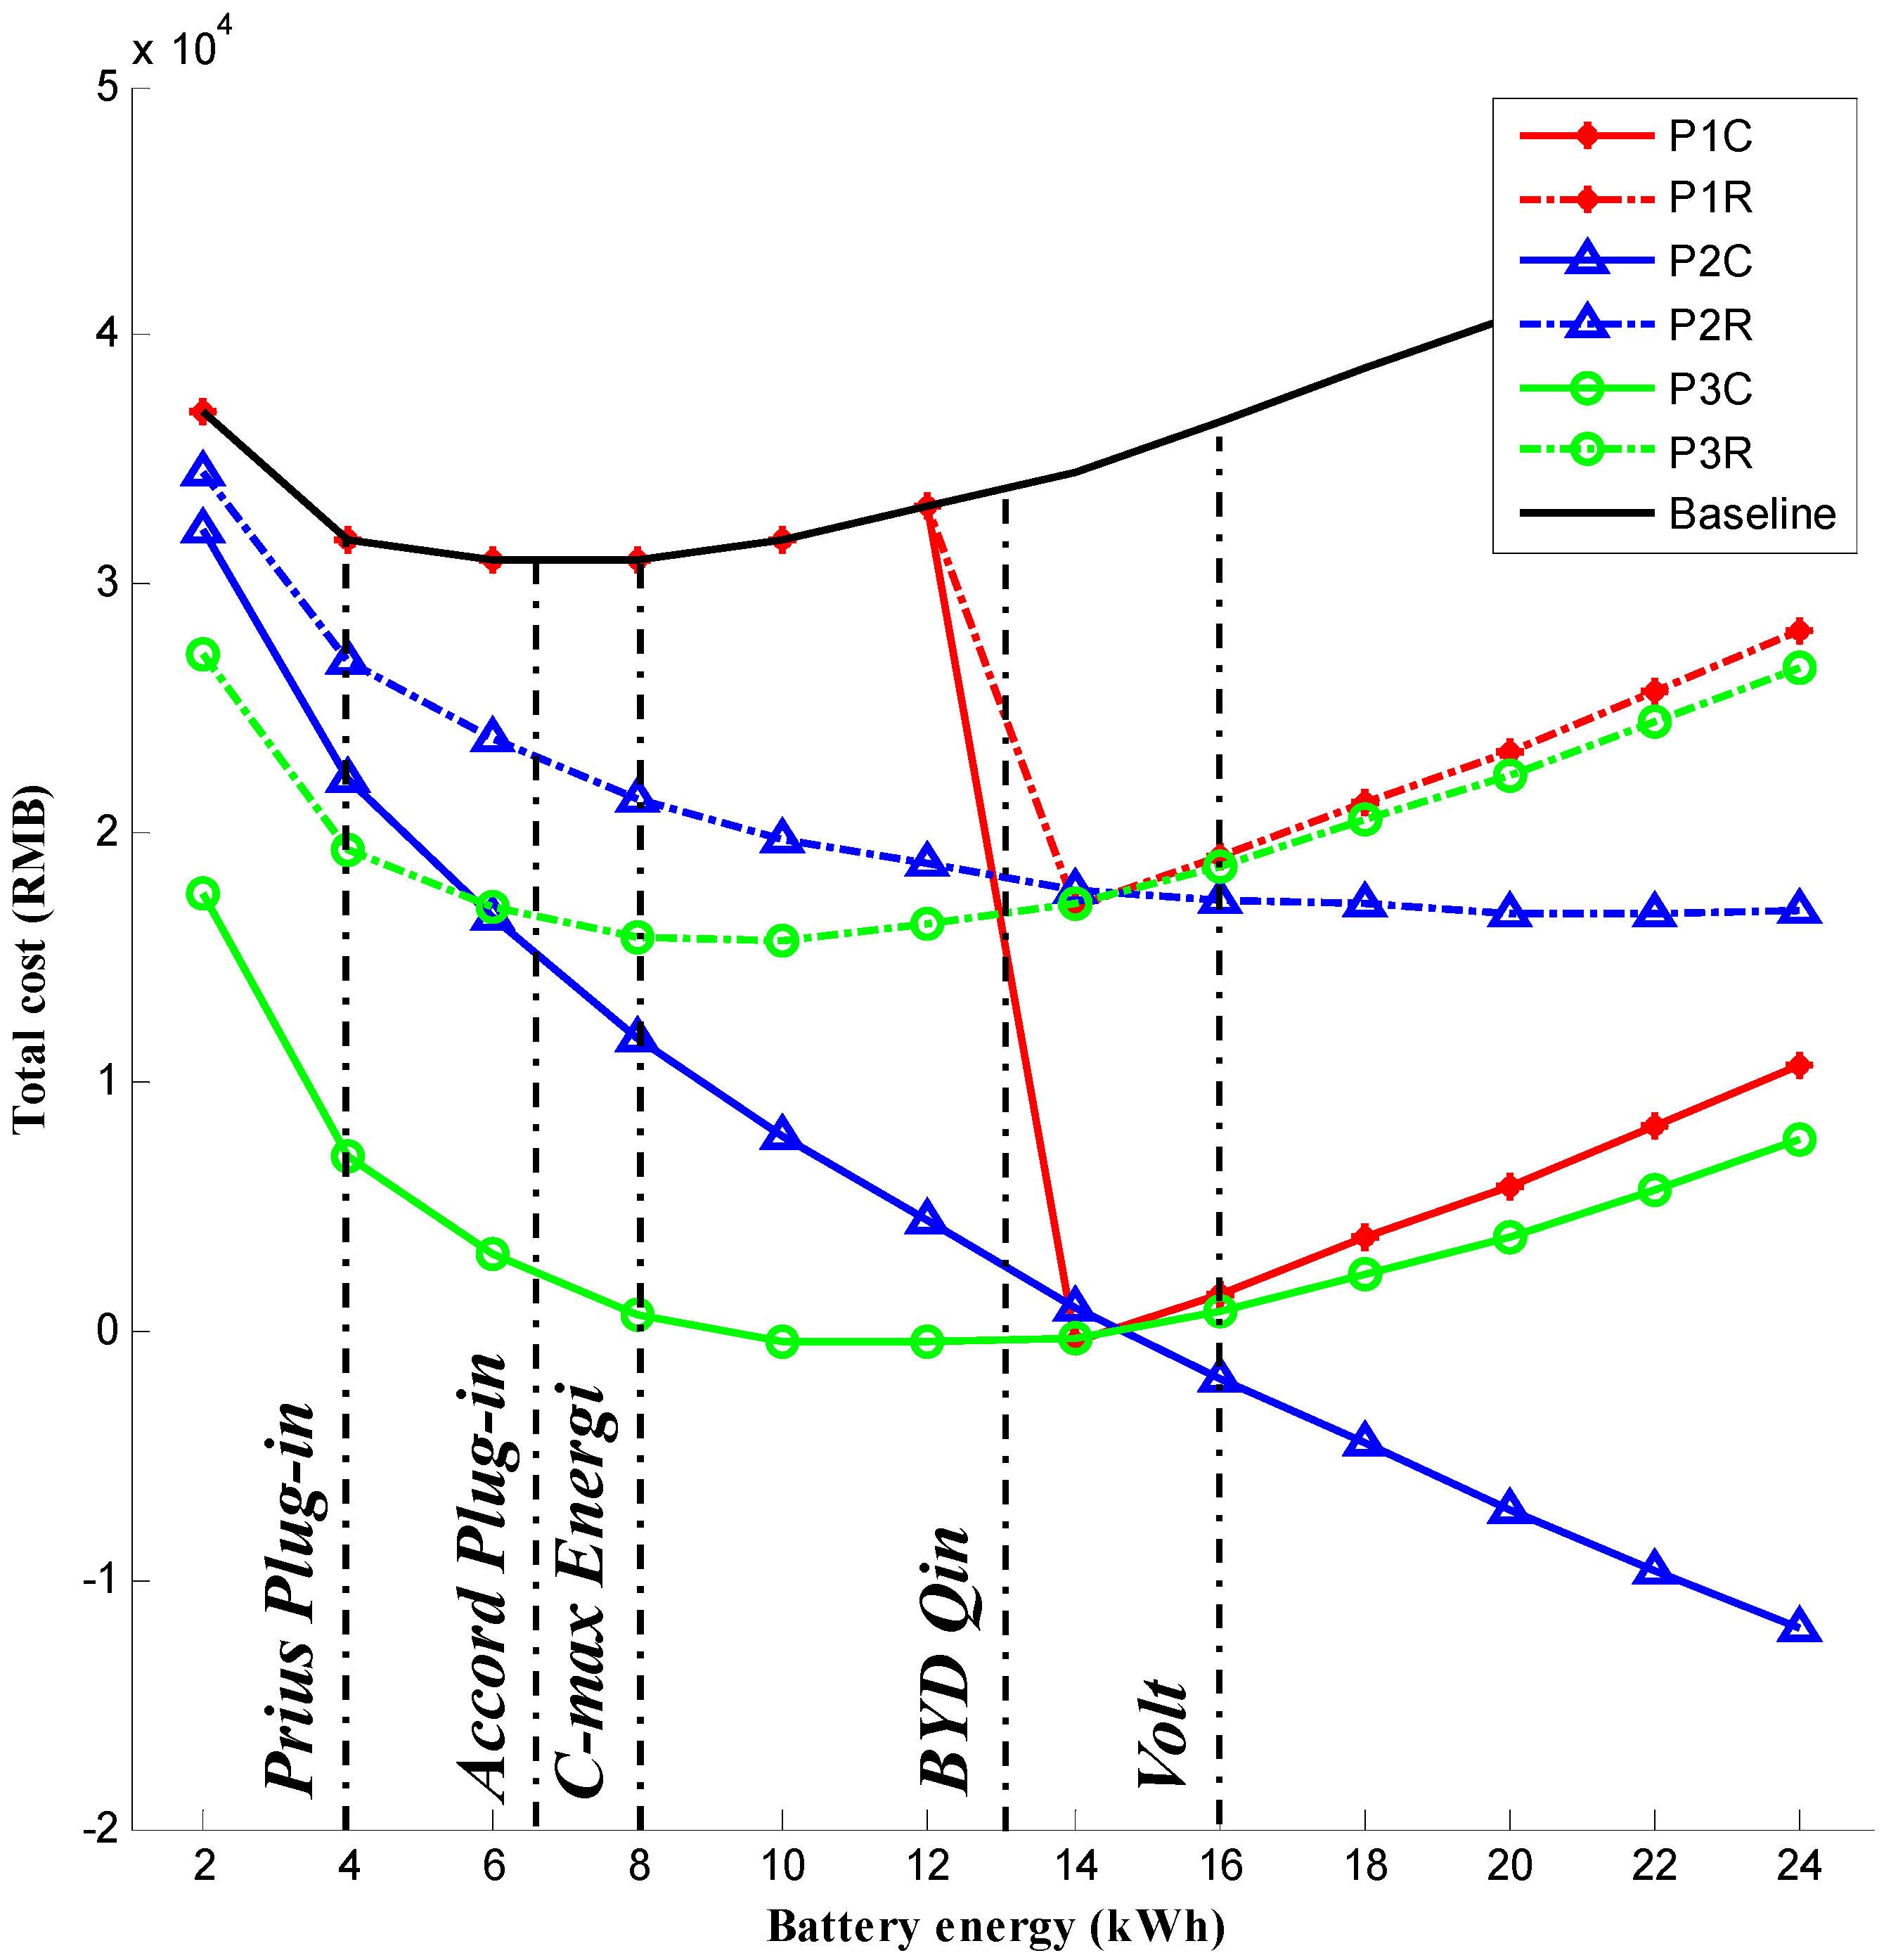
4.3. Subsidy
| Policy | Proposal | Symbol | Description |
|---|---|---|---|
| Policy 1 | Current (C) | P1C | AER ≥ 50 km, 35,000 RMB/vehicle |
| Reduced (R) | P1R | AER ≥ 50 km, 17,500 RMB/vehicle | |
| Policy 2 | Current (C) | P2C | Based on battery energy, 2400 RMB/kWh |
| Reduced (R) | P2R | Based on battery energy, 1200 RMB/kWh | |
| Policy 3 | Current (C) | P3C | Based on fuel saving, 400 RMB/1% |
| Reduced (R) | P3R | Based on fuel saving, 200 RMB/1% |


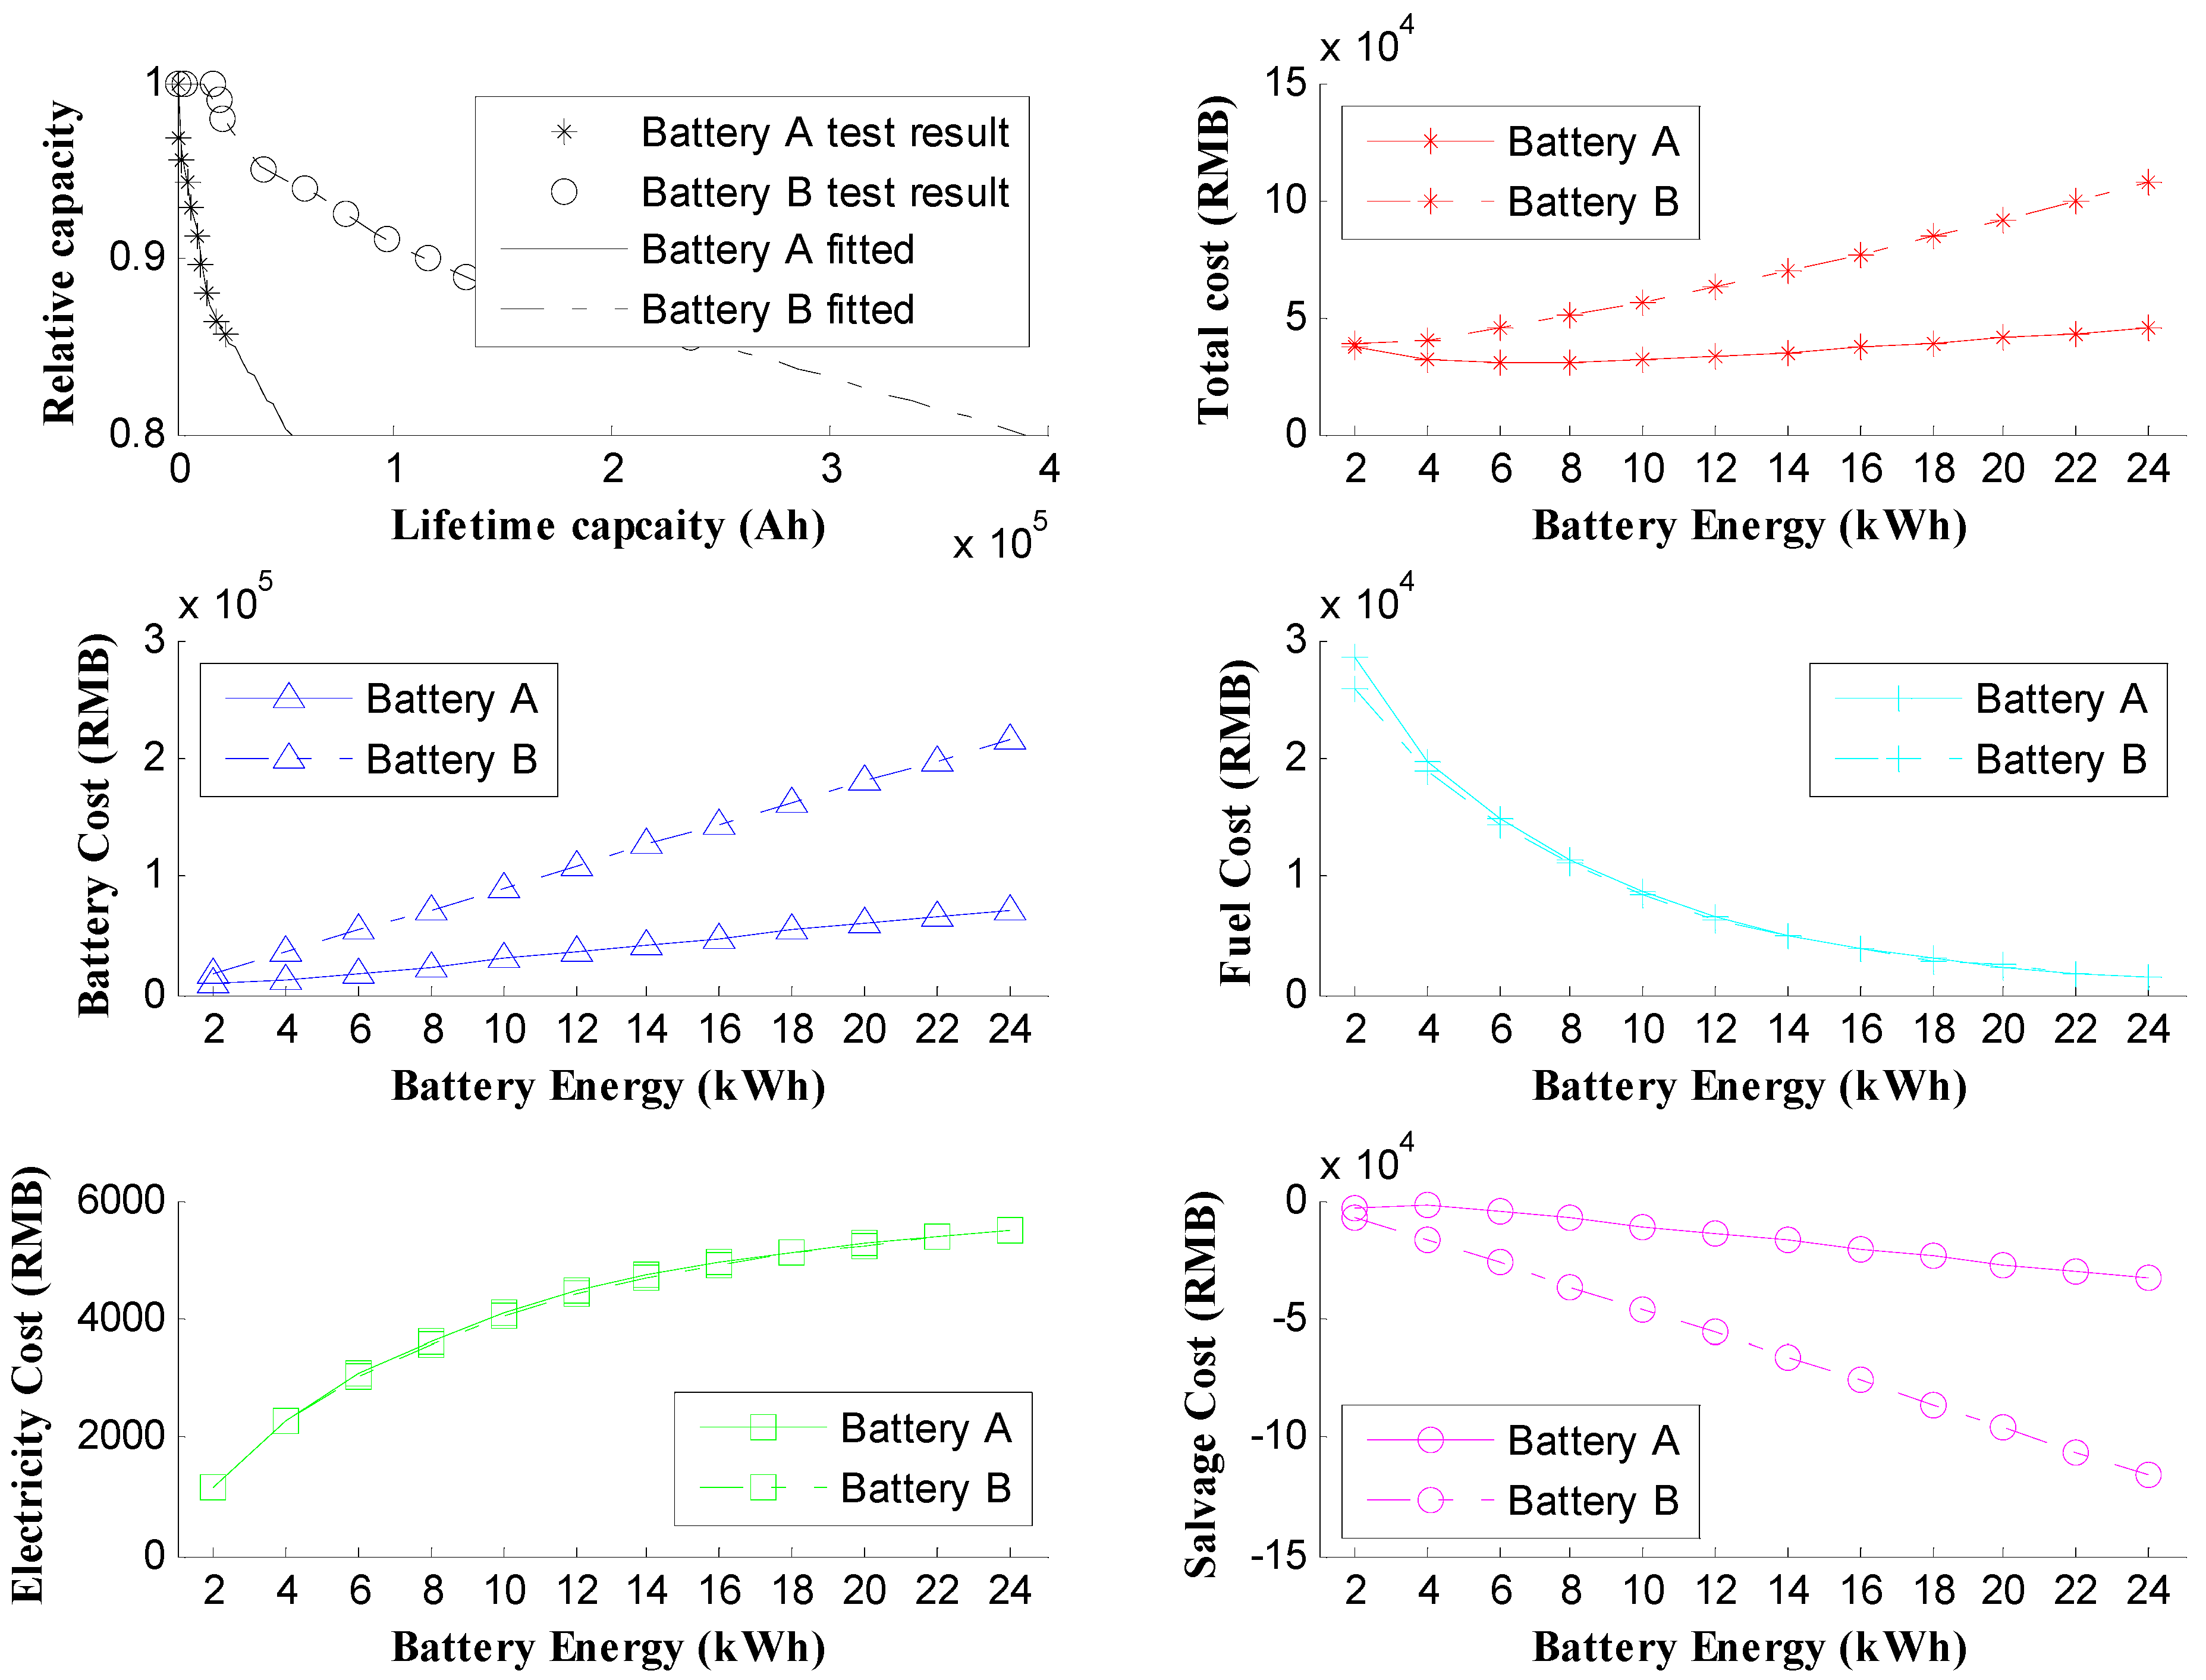
4.4. Battery Type
| Battery type | Battery A | Battery B |
|---|---|---|
| Cell type | LiFePO4 | LTO |
| Cell VOC (V) | 3.3 | 2.3 |
| Cell resistance (ohm) | 0.0088 | 0.0028 |
| Cell capacity (Ah) | 12.35 | 20.5 |
| Cell mass (kg) | 0.36 | 0.51 |
| Max Terminal Voltage (V) | 3.7 | 2.8 |
| Min Terminal Voltage (V) | 2.5 | 1.5 |
| Battery price (RMB/kWh) | 3000 | 9000 |

5. Conclusions
Abbreviations
| AFC | Average fuel consumption (L/100km) |
| AEC | Average electricity consumption (kWh/100km) |
| AER | All-electric range (km) |
| AECS | All-electric, charge sustaining |
| a | Parameter a in Gamma distribution |
| b | Parameter b in Gamma distribution |
| Cbatt | The battery cost (RMB) |
| Celec | The electricity cost (RMB) |
| CD | Charge depleting |
| Cfuel | The fuel cost (RMB) |
| CS | Charge sustaining |
| Csalv | Salvage cost (RMB) |
| Ctotal | The total cost (RMB) |
| cbatt | The battery capacity (Ah) |
| cCD | The charge and discharge capacity consumption in CD stage (Ah/100km) |
| cCS | The charge and discharge capacity consumption in CS stage (Ah/100km) |
| ccharge | The annual charge and discharge capacity in charging phase (Ah/year) |
| clife | The annual charge and discharge capacity in driving phase (Ah/year) |
| e | Battery energy (kWh) |
| ECCD | Electricity consumption in the CD stage (kWh/100km) |
| FCCD | Fuel consumption in the CD stage (L/100km) |
| FCCS | Fuel consumption in the CS stage (L/100km) |
| i | The ith year |
| ibatt | The number of years served by the present battery |
| N | Evaluation years |
| NPV | Net present value |
| Pbatt | Battery price (RMB/kWh) |
| Pdeg | Battery degradation rate (RMB/(Ah·kWh)) |
| Pfuel | Fuel price (RMB/L) |
| Pelec | Electricity price (RMB/kWh) |
| Pres | Battery reserved price (RMB/kWh) |
| Pend | The proportion of the battery end rate over the initial battery rate |
| Ravg | Average daily range (km) |
| RCD | Charge depleting range (km) |
| SOCCS | SOC level where the vehicle sustains the charge |
| SOCfull | SOC when the battery is full charged |
| r | Daily driving range (km) |
| T | Discount rate vector in N years |
| TCO | Total cost of ownership (RMB) |
| t | The discount rate |
| UF | Utility factor |
| zon | The decision of installing a new battery |
| zoff | The decision of disposing an installed battery |
Acknowledgments
Author Contributions
Conflicts of Interest
References
- Williams, B.; Martin, E.; Lipman, T.; Kammen, D. Plug-in-hybrid vehicle use, energy consumption, and greenhouse emissions: An analysis of household vehicle placements in northern California. Energies 2011, 4, 435–457. [Google Scholar] [CrossRef]
- Wu, X.; Cao, B.; Li, X.; Ren, X. Component sizing optimization of plug-in hybrid electric vehicles. Appl. Energy 2011, 88, 799–804. [Google Scholar] [CrossRef]
- Xu, L.; Ouyang, M.; Li, J.; Yang, F.; Lu, L.; Hua, J. Optimal sizing of plug-in fuel cell electric vehicles using models of vehicle performance and system cost. Appl. Energy 2012, 103, 477–487. [Google Scholar]
- Lin, Z. Optimizing and diversifying the electric range of plug-in hybrid electric vehicles for US drivers. SAE Int. J. Altern. Powertrains 2012, 1, 180–194. [Google Scholar]
- Murgovski, N.; Johannesson, N.; Sjoberg, J.; Egart, B. Component sizing of a plug-in hybrid electric powertrain via convex optimization. Mechatronics 2012, 22, 106–120. [Google Scholar] [CrossRef]
- Raghavan, S.S.; Khaligh, A. Electrification potential factor: Energy-based value proposition analysis of plug-in hybrid electric vehicles. IEEE Trans. Veh. Technol. 2012, 61, 1052–1059. [Google Scholar] [CrossRef]
- Ernst, C.; Hackbarth, A.; Madlener, R.; Lunz, B.; Sauer, D.U.; Eckstein, L. Battery sizing for serial plug-in hybrid electric vehicles: A model-based economic analysis for Germany. Energy Policy 2011, 39, 5871–5882. [Google Scholar] [CrossRef]
- Al-Alawi, B.M.; Bradley, T.H. Total cost of ownership, payback, and consumer preference modeling of plug-in hybrid electric vehicles. Appl. Energy 2013, 103, 488–506. [Google Scholar] [CrossRef]
- Electric Power Research Institute (EPRI). Advanced Batteries for Electric Drive Vehicles a Technology and Cost-Effectiveness Assessment for Battery Electric Vehicles, Power Assist Hybrid Electric Vehicles and Plug-in Hybrid Electric Vehicles; Report for Electric Power Research Institute: Palo Alto, CA, USA, 2004. [Google Scholar]
- Lemoine, D.; Kammen, D.; Farrell, A. Effects of Plug-in Hybrid Electric Vehicles in California Energy Markets. In Proceedings of the 86th Annual Meeting of the Transportation Research Board, Washington, WA, USA, 21–25 January 2007.
- Markel, T.; Simpson, A. Cost-benefit Analysis of Plug-in Hybrid Electric Vehicle Technology. In Proceedings of the 22nd International Electric Vehicle Symposium, Yokohama, Japan, 23–28 October 2006.
- Li, Z.; Ouyang, M. A win-win marginal rent analysis for operator and consumer under battery leasing mode in China electric vehicle market. Energy Policy 2011, 39, 3222–3237. [Google Scholar] [CrossRef]
- Zhou, C.; Qian, K.; Allan, M.; Zhou, W. Modeling of the cost of EV battery wear due to V2G application in power systems. IEEE Trans. Energy Conver. 2011, 26, 1041–1050. [Google Scholar] [CrossRef]
- Feng, X.; He, X.; Lu, L.; Ouyang, M. Running costs evaluation of the fuel cell hybrid powertrain using Li4Ti5O12 battery. In Proceedings of the FISITA 2014 World Automotive Congress, Maastricht, The Netherlands, 2–6 June 2014.
- Wu, L. A GPS-based Research on the Driving Patterns of Private Passenger Vehicle in Beijing. Master Thesis, Tsinghua University, Beijing, China, June 2013. [Google Scholar]
- Lin, Z.; Dong, J.; Liu, C.; Green, D. Estimation of energy use by plug-in hybrid electric vehicles. Transp. Res. Rec. 2012, 2287, 37–43. [Google Scholar] [CrossRef]
- Hou, C.; Wang, H.; Ouyang, M. A methodology of calculating PHEV average fuel consumption based on the trip range distribution. Automot. Eng. 2014, in press. [Google Scholar]
- Utility Factor Definitions for Plug-in Hybrid Electric Vehicles Using 2001 U.S. DOT National Household Travel Survey Data; SAE International: Warrendale, PA, USA, March 2009; SAE J2841.
- Recommended Practice for Measuring the Exhaust Emissions and Fuel Economy of Hybrid-electric Vehicles, Including Plug-in Hybrid Vehicles. SAE International: Warrendale, PA, USA, June 2010; SAE J1711.
- Ecker, M.; Gerschler, J.B.; Vogel, J.; Käbitz, S.; Friedrich, E.H.; Dechent, P.; Sauer, D.U. Development of a lifetime prediction model for lithium-ion batteries based on extended accelerated aging test data. J. Power Sources 2012, 215, 248–257. [Google Scholar]
- Center for Transportation Research, Argonne National Laboratory (ANL). Costs of Lithium-Ion Batteries for Vehicles Report; Center for Transportation Research, Argonne National Laboratory: DuPage County, IL, USA, 2000. [Google Scholar]
- Belt, J.; Utgikar, V.; Bloom, I. Calendar and PHEV cycle life aging of high-energy, lithium-ion cells containing blended spinel and layered-oxide cathodes. J. Power Sources 2011, 196, 10213–10221. [Google Scholar]
- Hou, C.; Ouyang, M.; Xu, L.; Wang, H. Approximate Pontryagin’s minimum principle applied to the energy management of plug-in hybrid electric vehicles. Appl. Energy 2014, 115, 174–189. [Google Scholar] [CrossRef]
- Hou, C.; Ouyang, M.; Wang, H.; Xu, L. An assessment of PHEV energy management strategies using driving range data collected in Beijing. In Proceedings of the EVS27 Symposium, Barcelona, Spain, 17–20 November 2013.
- Wang, H.; Wu, L.; Hou, C. A GPS-based research on driving range and patterns of private passenger vehicle in Beijing. In Proceedings of the EVS27 Symposium, Barcelona, Spain, 17–20 November 2013.
- Hao, H.; Wang, H.; Ouyang, M.; Cheng, F. Vehicle survival patterns in China. SCI China Technol. Sci. 2011, 54, 625–629. [Google Scholar]
- Prius Plug-in Specifications. Available online: http://www.toyota.com/prius-plug-in/ (accessed on 7 December 2013).
- Volt Specifications. Available online: http://www.chevrolet.com/volt-electric-car.html (accessed on 7 December 2013).
- Higuchi, N.; Sunaga, Y.; Tanaka, M.; Shimada, S. Development of a new two-motor plug-in hybrid system. SAE Int. J. Altern. Powertrains 2013, 2, 135–145. [Google Scholar]
- C-max Energi Specifications. Available online: http://www.ford.com/cars/cmax/trim/energy (accessed on 7 December 2013).
- Qin Specifications. Available online: http://qin.bydauto.com.cn/ (accessed on 25 December 2013).
- Ministry of Industry and Information Technology (MIIT) of PRC. Available online: http://www.miit.gov.cn/n11293472/n11293832/n12843926/n13917042/15629217.html (accessed on 7 December 2013).
- Internal Revenue Bulletin. Available online: http://www.irs.gov/irb/2009–48_IRB/ar09.html (accessed on 7 December 2013).
- EV Demonstration Program News. Available online: http://www.evdays.com/html/201305/41928.html (accessed on 7 December 2013).
- Han, X.; Ouyang, M.; Lu, L.; Li, J.; Zheng, Y.; Li, Z. A comparative study of commercial lithium ion battery cycle life in electrical vehicle. Part III: Aging mechanism identification. J. Power Sources 2013, 251, 38–54. [Google Scholar]
- Takami, N.; Inagaki, H.; Tatebayashi, Y.; Saruwatari, H.; Honda, K.; Egusa, S. High-power and long-life Lithium-ion batteries using Lithium Titanium Oxide anode for automotive and stationary power applications. J. Power Sources 2012, 244, 459–475. [Google Scholar]
© 2014 by the authors; licensee MDPI, Basel, Switzerland. This article is an open access article distributed under the terms and conditions of the Creative Commons Attribution license (http://creativecommons.org/licenses/by/3.0/).
Share and Cite
Hou, C.; Wang, H.; Ouyang, M. Battery Sizing for Plug-in Hybrid Electric Vehicles in Beijing: A TCO Model Based Analysis. Energies 2014, 7, 5374-5399. https://doi.org/10.3390/en7085374
Hou C, Wang H, Ouyang M. Battery Sizing for Plug-in Hybrid Electric Vehicles in Beijing: A TCO Model Based Analysis. Energies. 2014; 7(8):5374-5399. https://doi.org/10.3390/en7085374
Chicago/Turabian StyleHou, Cong, Hewu Wang, and Minggao Ouyang. 2014. "Battery Sizing for Plug-in Hybrid Electric Vehicles in Beijing: A TCO Model Based Analysis" Energies 7, no. 8: 5374-5399. https://doi.org/10.3390/en7085374