
Deep Sediment-Sourced Methane Contribution to Shallow Sediment Organic Carbon: Atwater Valley, Texas-Louisiana Shelf, Gulf of Mexico

Abstract
:
1. Introduction
2. Materials and Methods
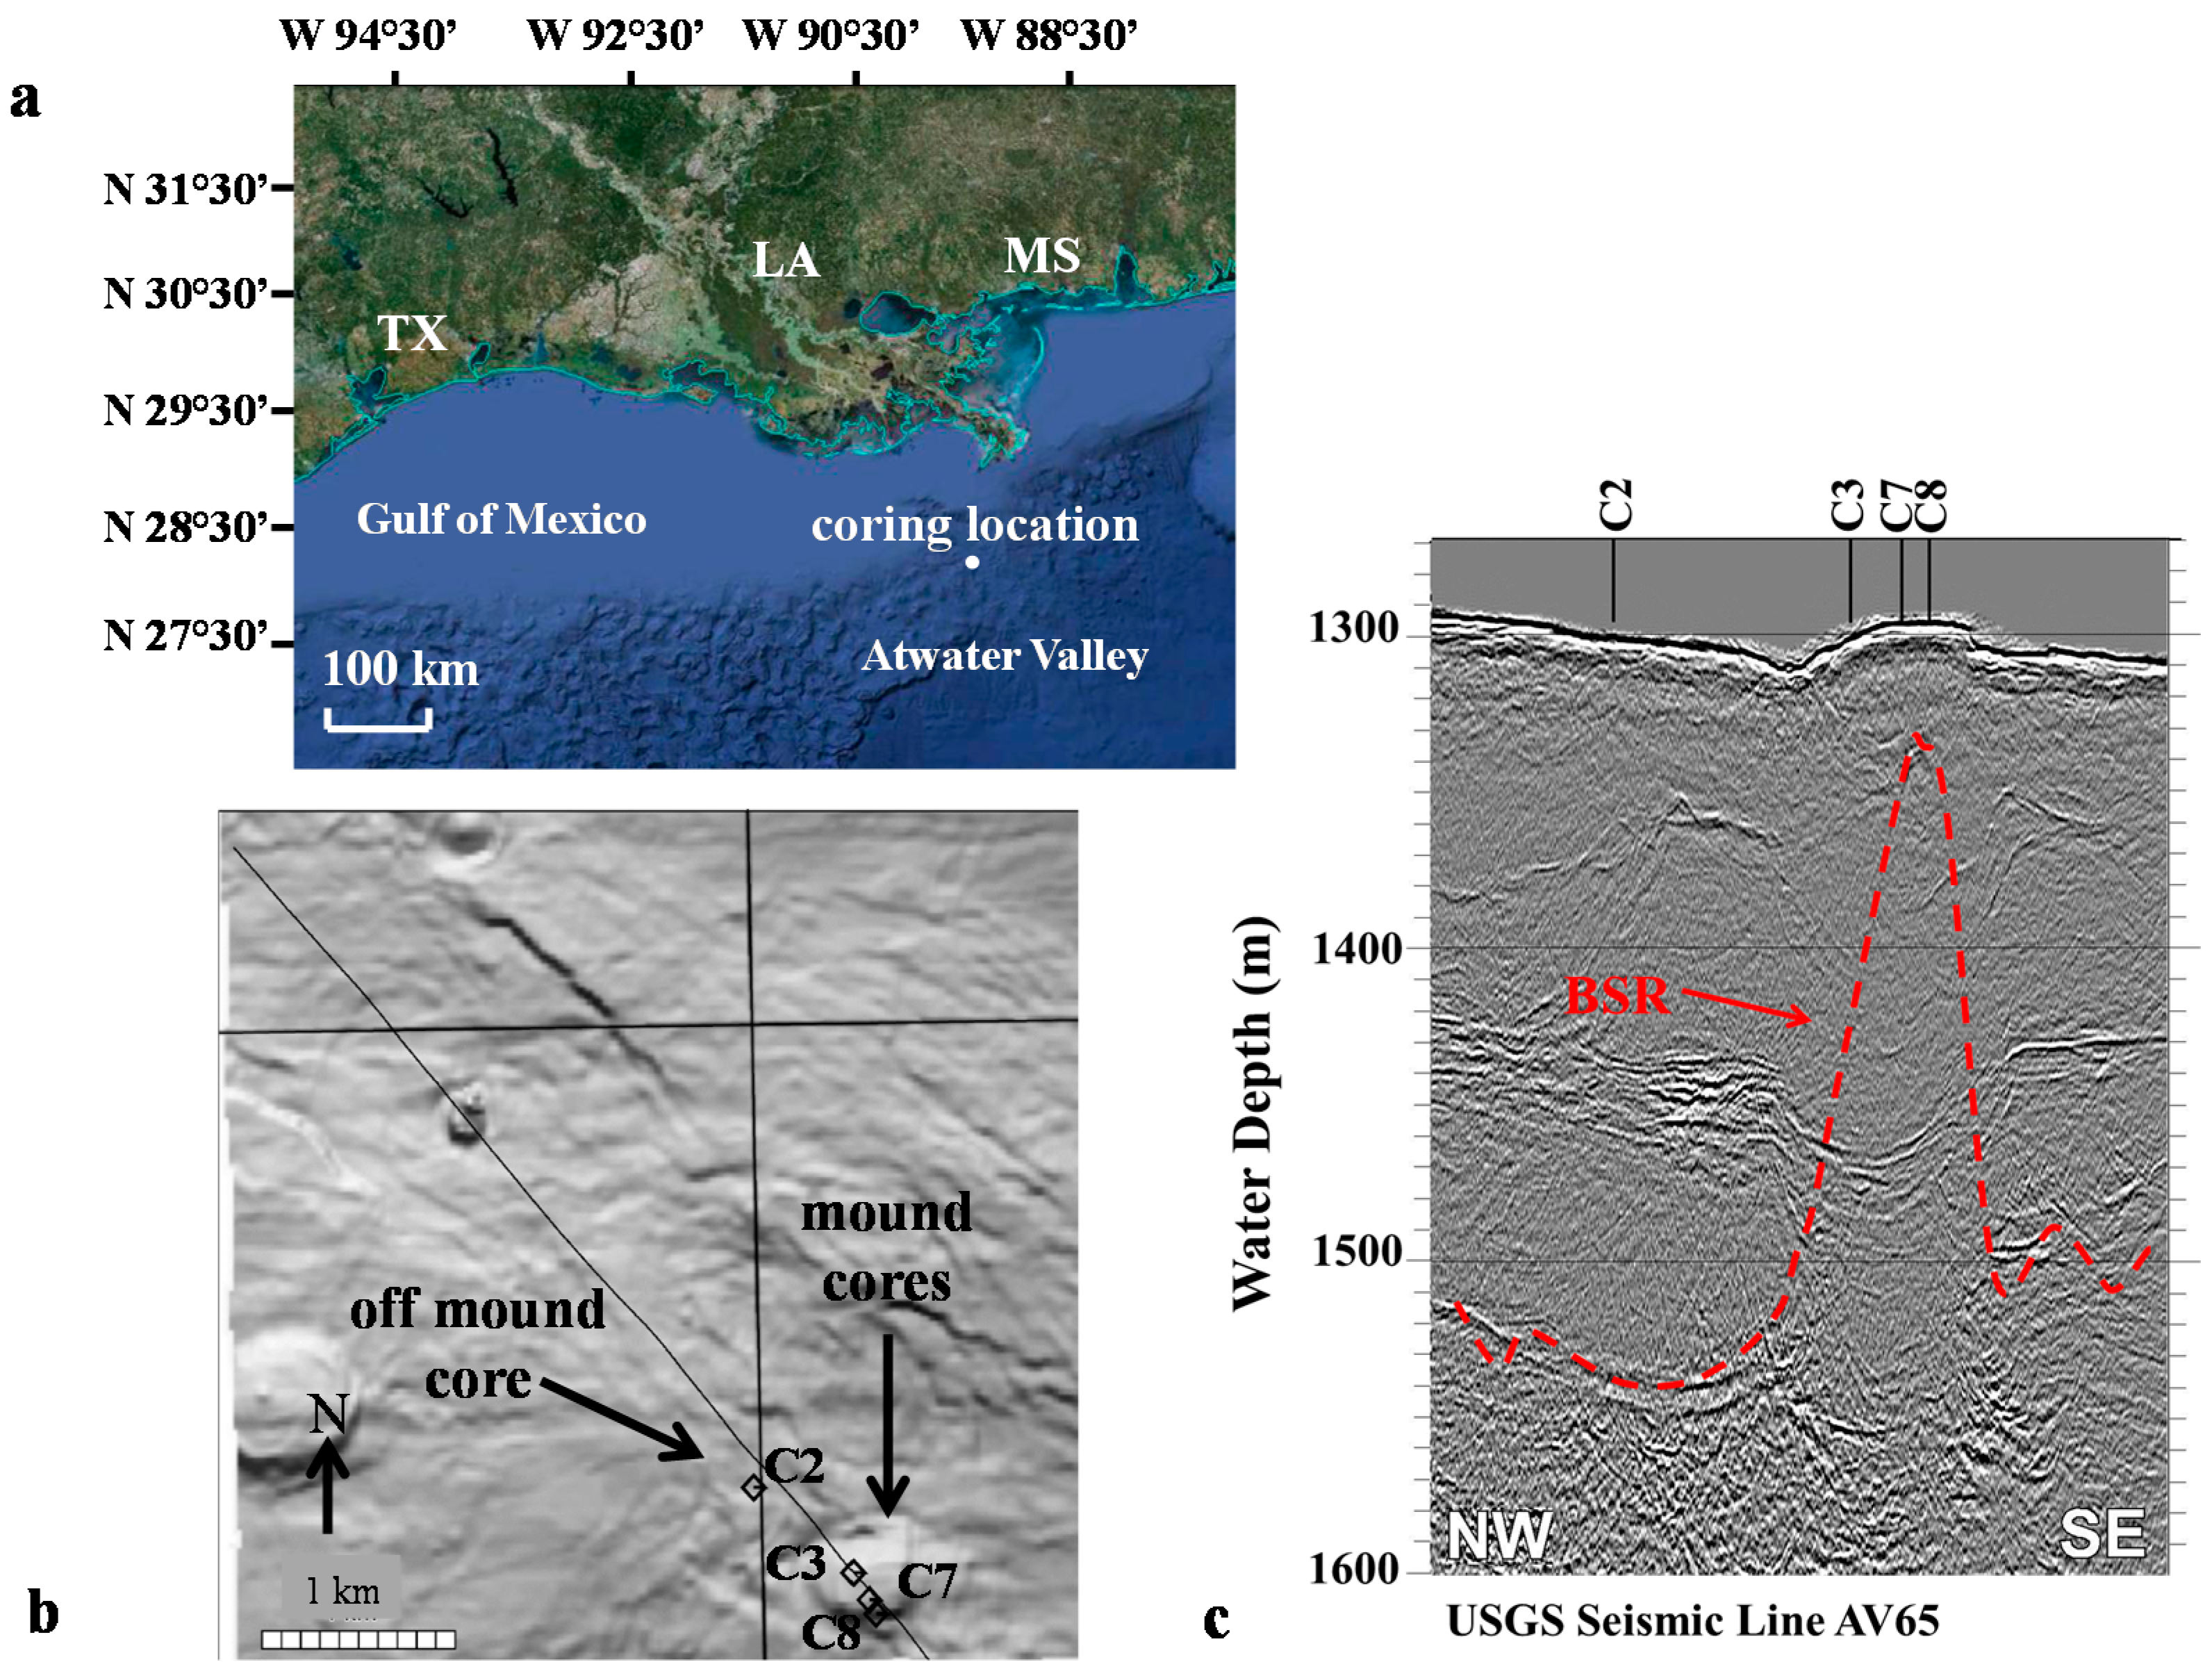
2.1. Study Location


| Parameter | Cores | ||||
|---|---|---|---|---|---|
| Off Mound | Mound | ||||
| C2 | C7 | C3 | C8 | Ref. | |
| Latitude | 27°56′26.644 | 27°56′26.644 | 27°56′26.644 | 27°56′26.644 | [27] |
| Longitude | 89°16′49.696 | 89°16′49.696 | 89°16′49.696 | 89°16′49.696 | [27] |
| Water Column Depth (m) | 1300 | 1296 | 1301 | 1296 | [27] |
| Core Pentetration (cmbsf) | 470 | 867 | 515 | 370 | [27] |
| SMT (cmbsf) | 410 | no SMT | no SMT | 59 | [22] |
| Methane Flux (mM CH4 m−2·year−1) | 20 | 3250 | ND | 167 | [22] |
| Average Cl− (mM) | 551 ± 6 | 934 ± 44 | 911 ± 79 | 770 ± 102 | [22] |
| Heat Flow (mW·m−2) | 40 | 160 | - | - | [22] |
| BSR depth (mbsf) | 240 | 40 | - | - | [23] |
2.2. Sediment Core Collection and Processing
2.3. Shipboard Analyses
2.4. Post-Cruise Laboratory Analyses
2.5. Radiocarbon Isotope Analysis
2.6. δ13C Data Interpretation
3. Results
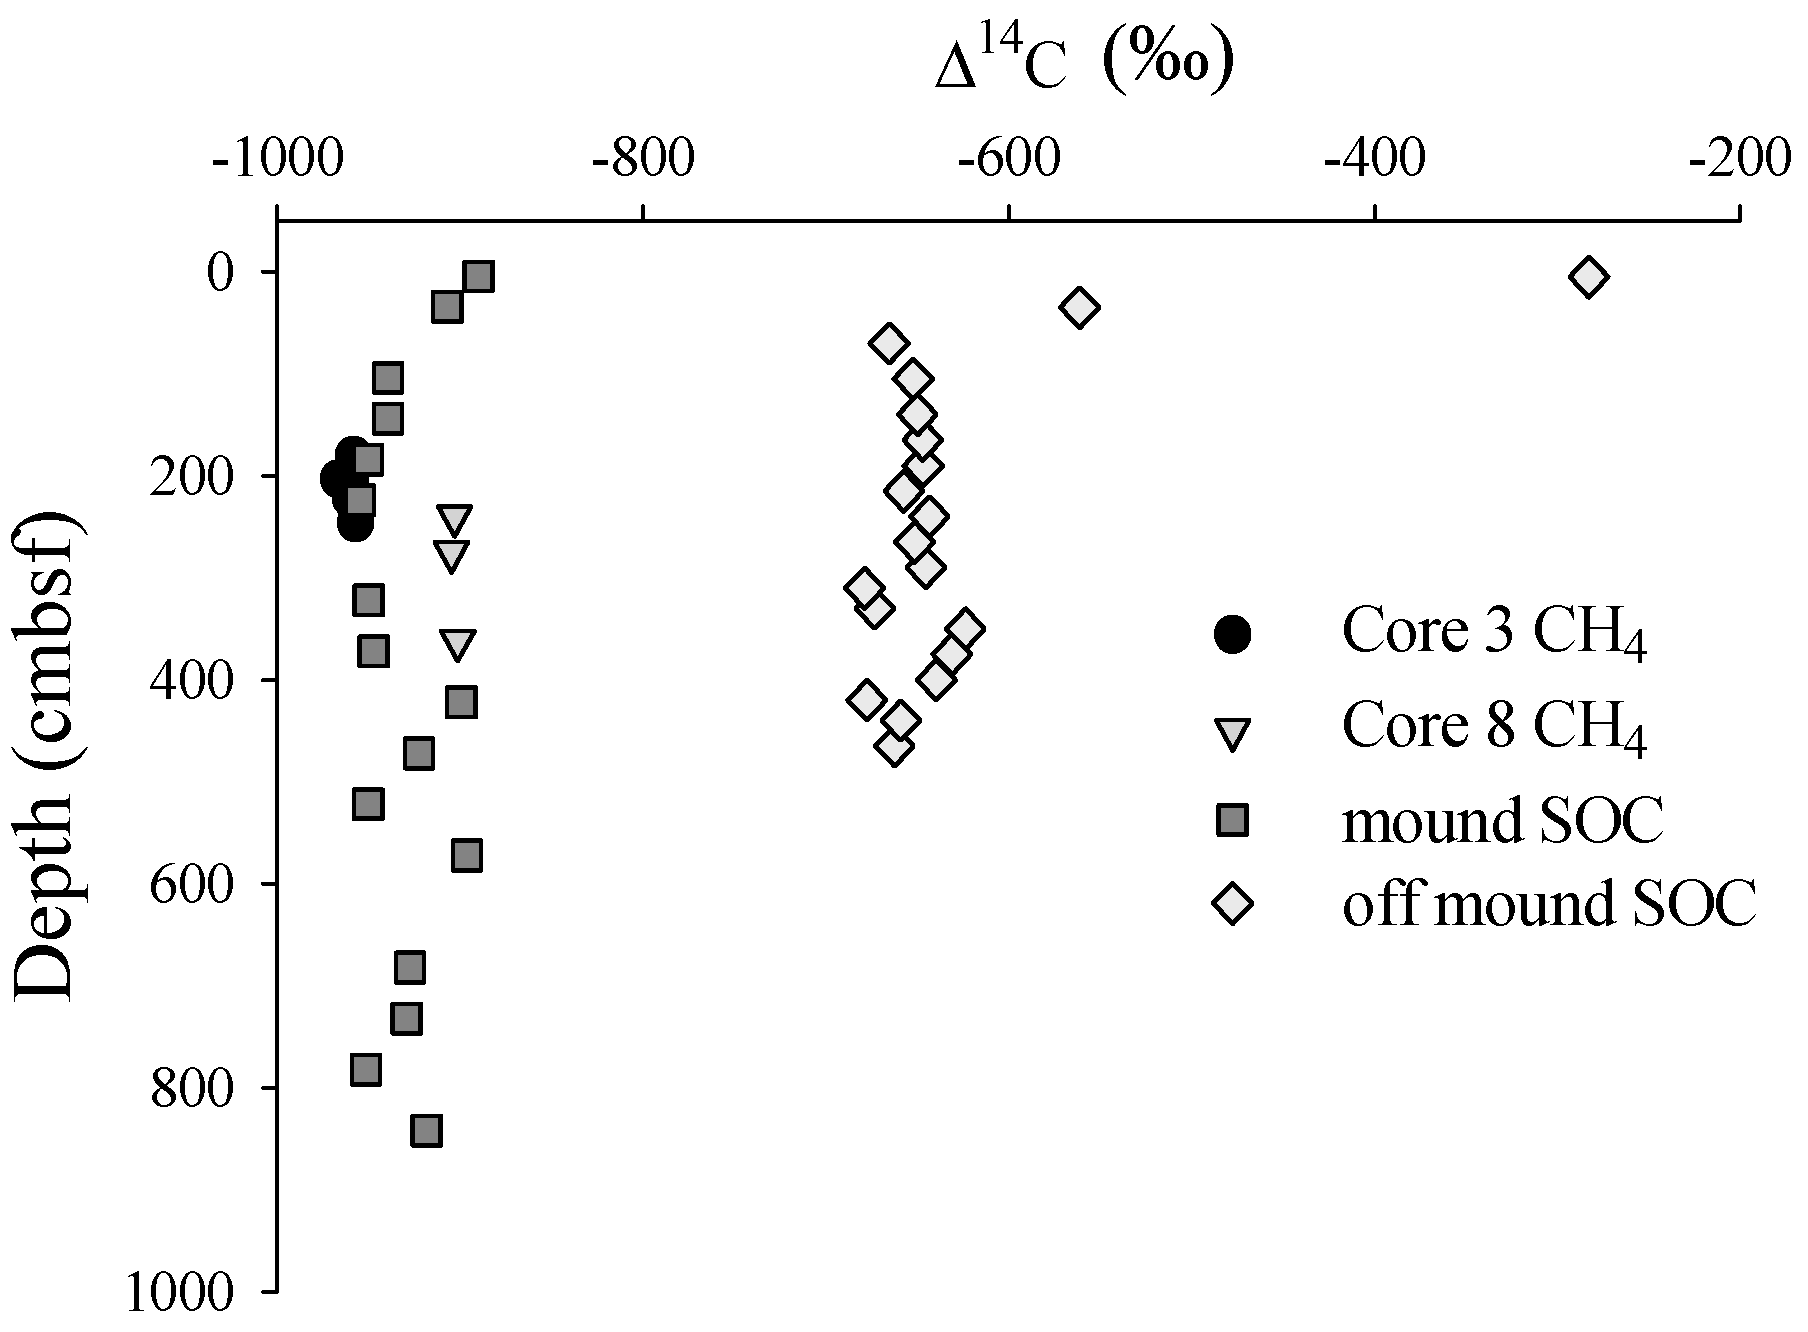
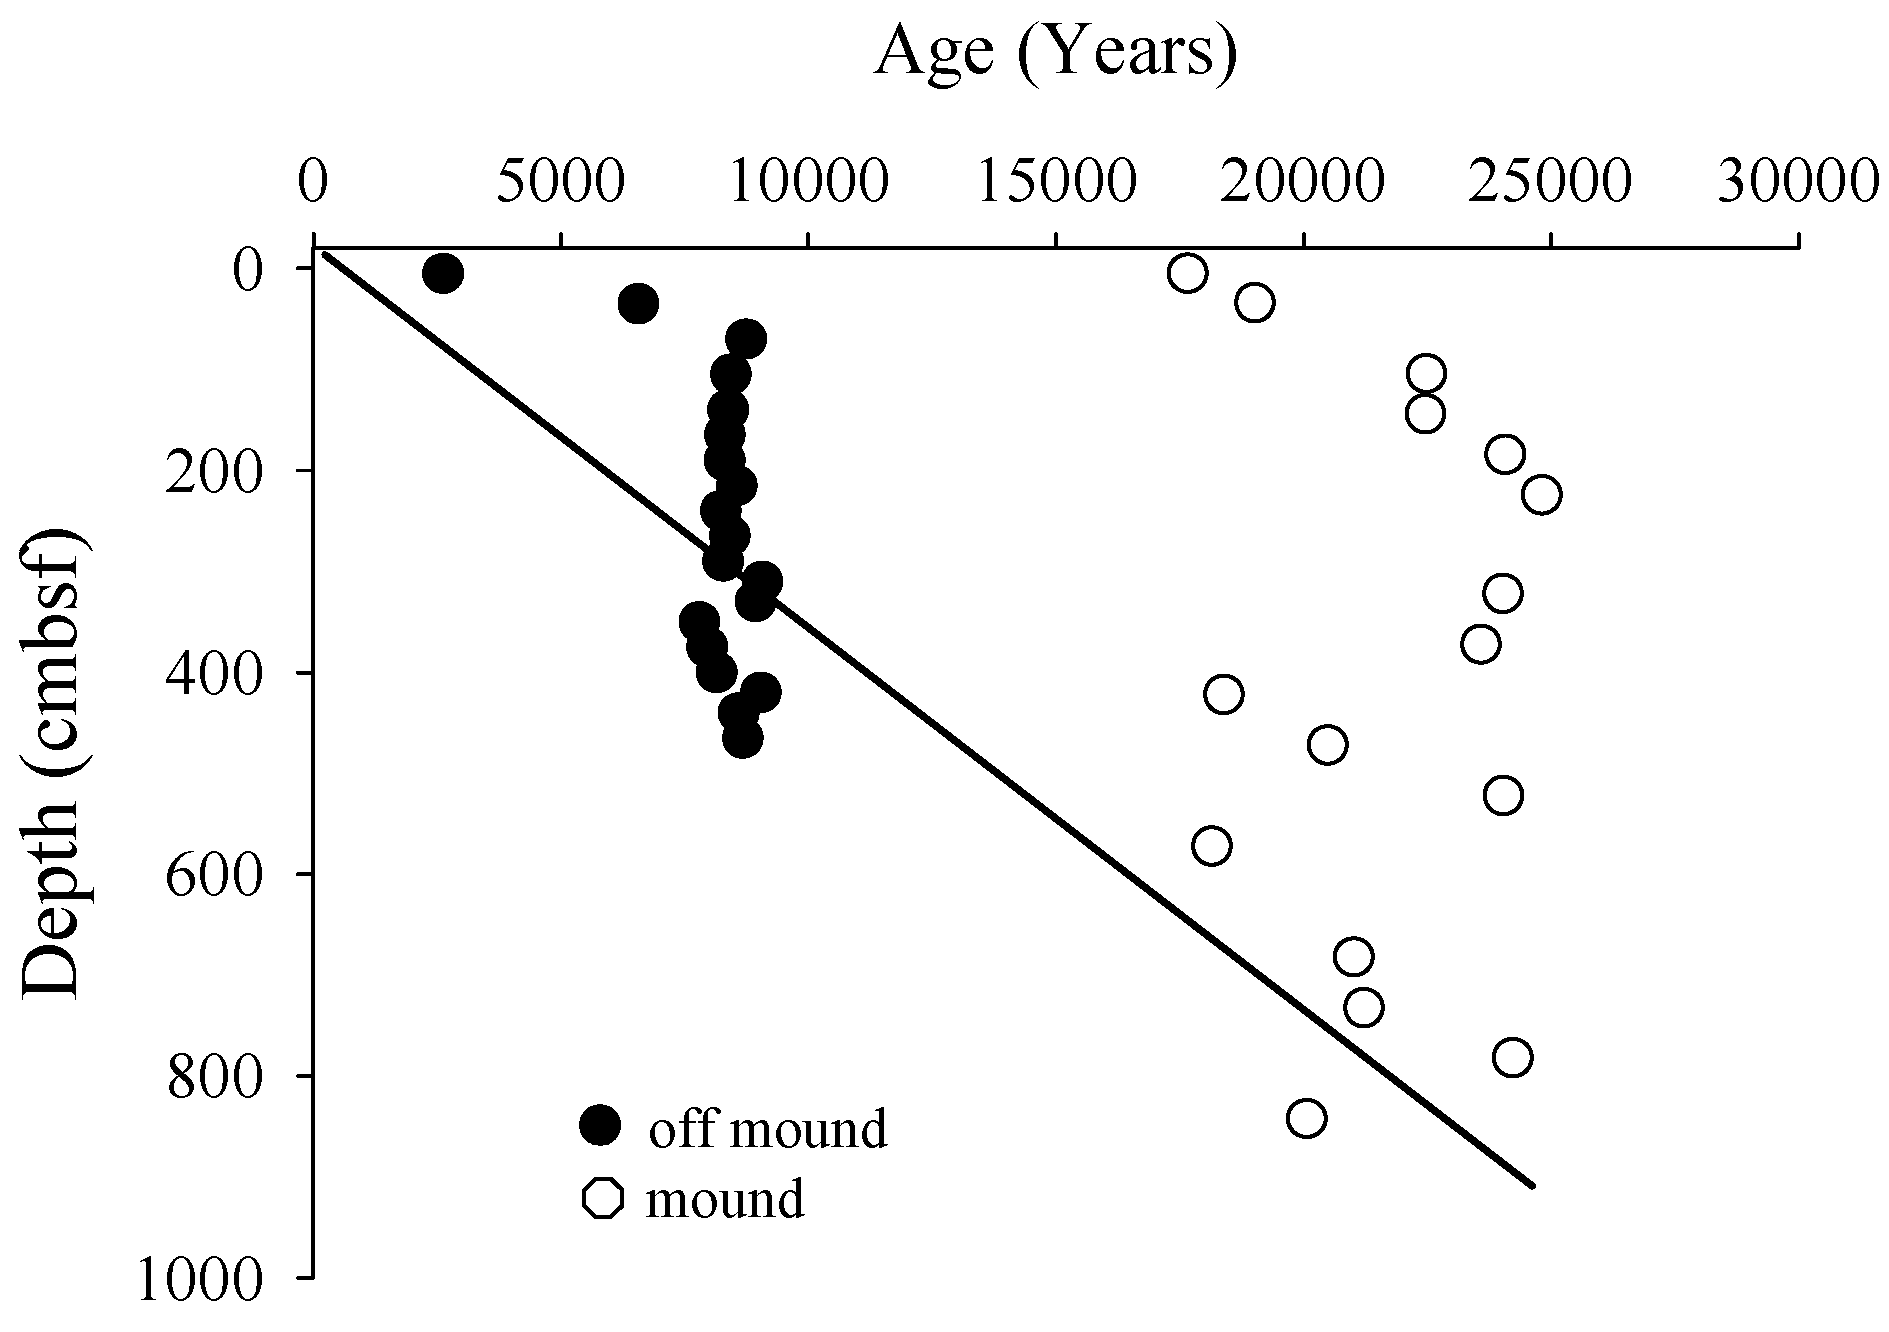
3.1. Radiocarbon


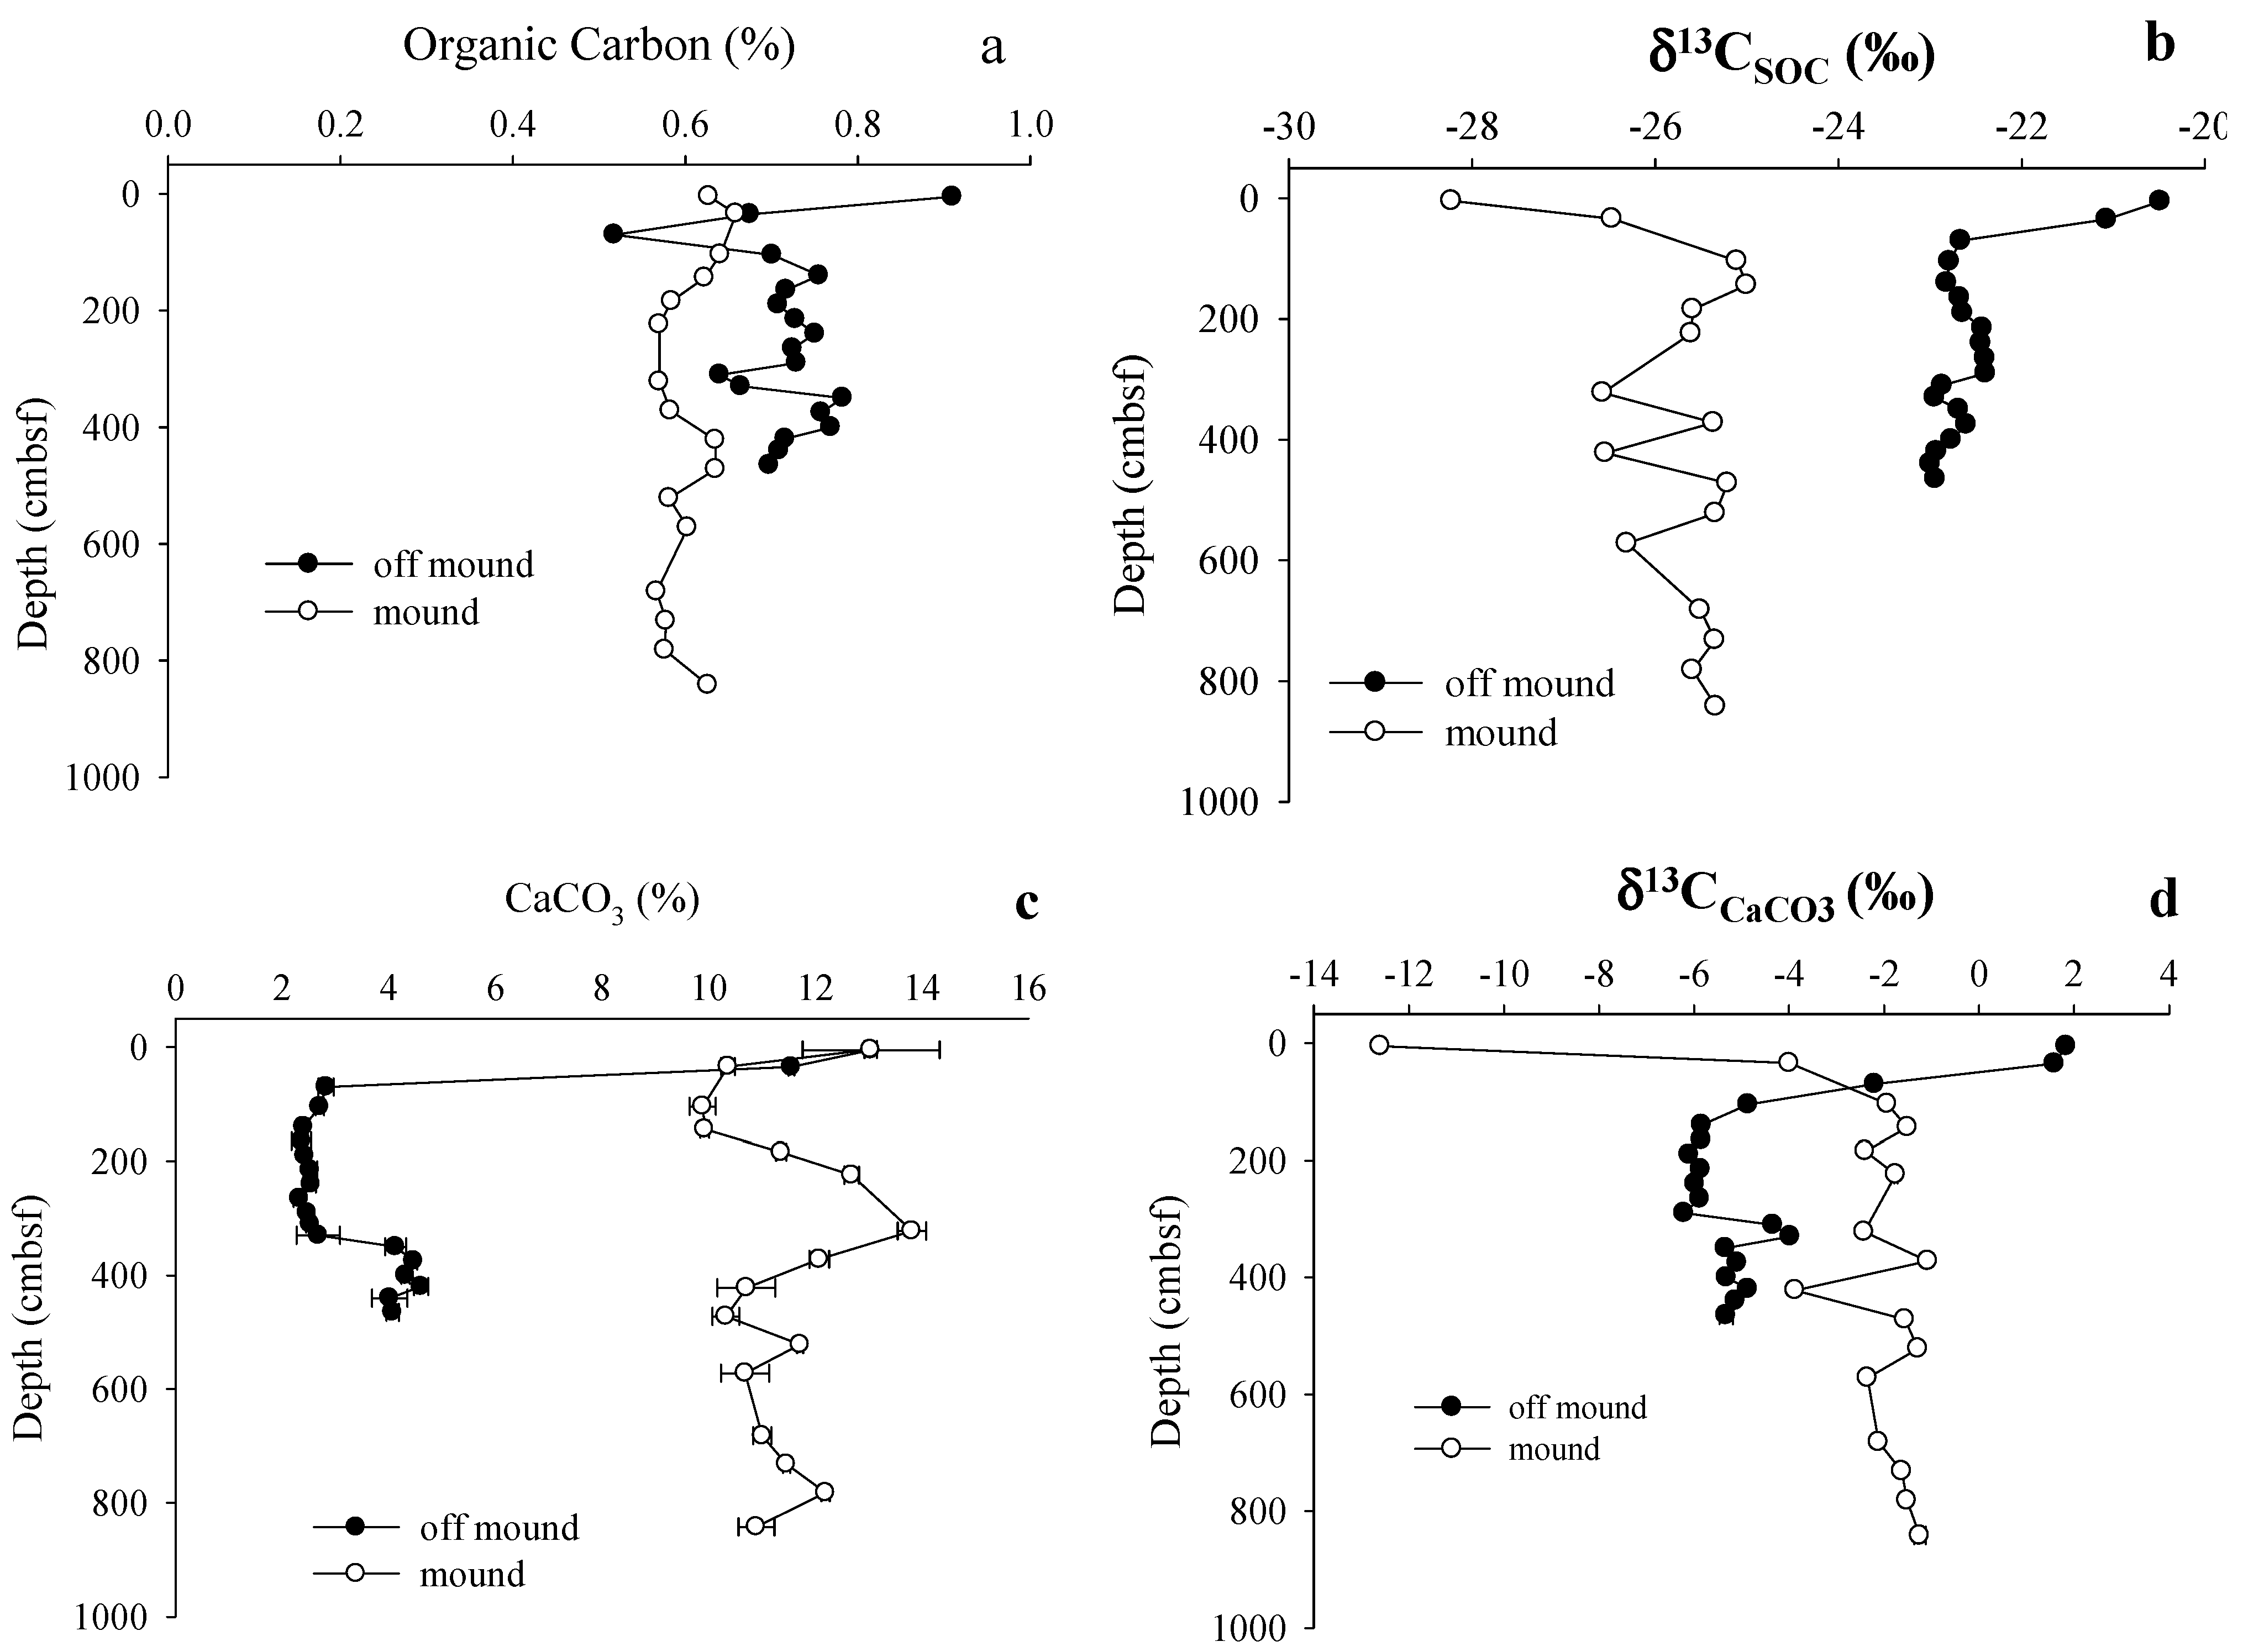
3.2. Solid Phase Sediment Profiles

| Core ID | Gas | Porewater | Sediment | ||||||||||
|---|---|---|---|---|---|---|---|---|---|---|---|---|---|
| δ13CCH4 | Δ14CCH4 | CH4 (mM) | δ13CCH4 | DIC (mM) | δ13CDIC | DOC (mM) | δ13CDOC | % SOC | δ13CSOC | Δ14CSOC | % CaCO3 | δ13CTIC | |
| C2 | |||||||||||||
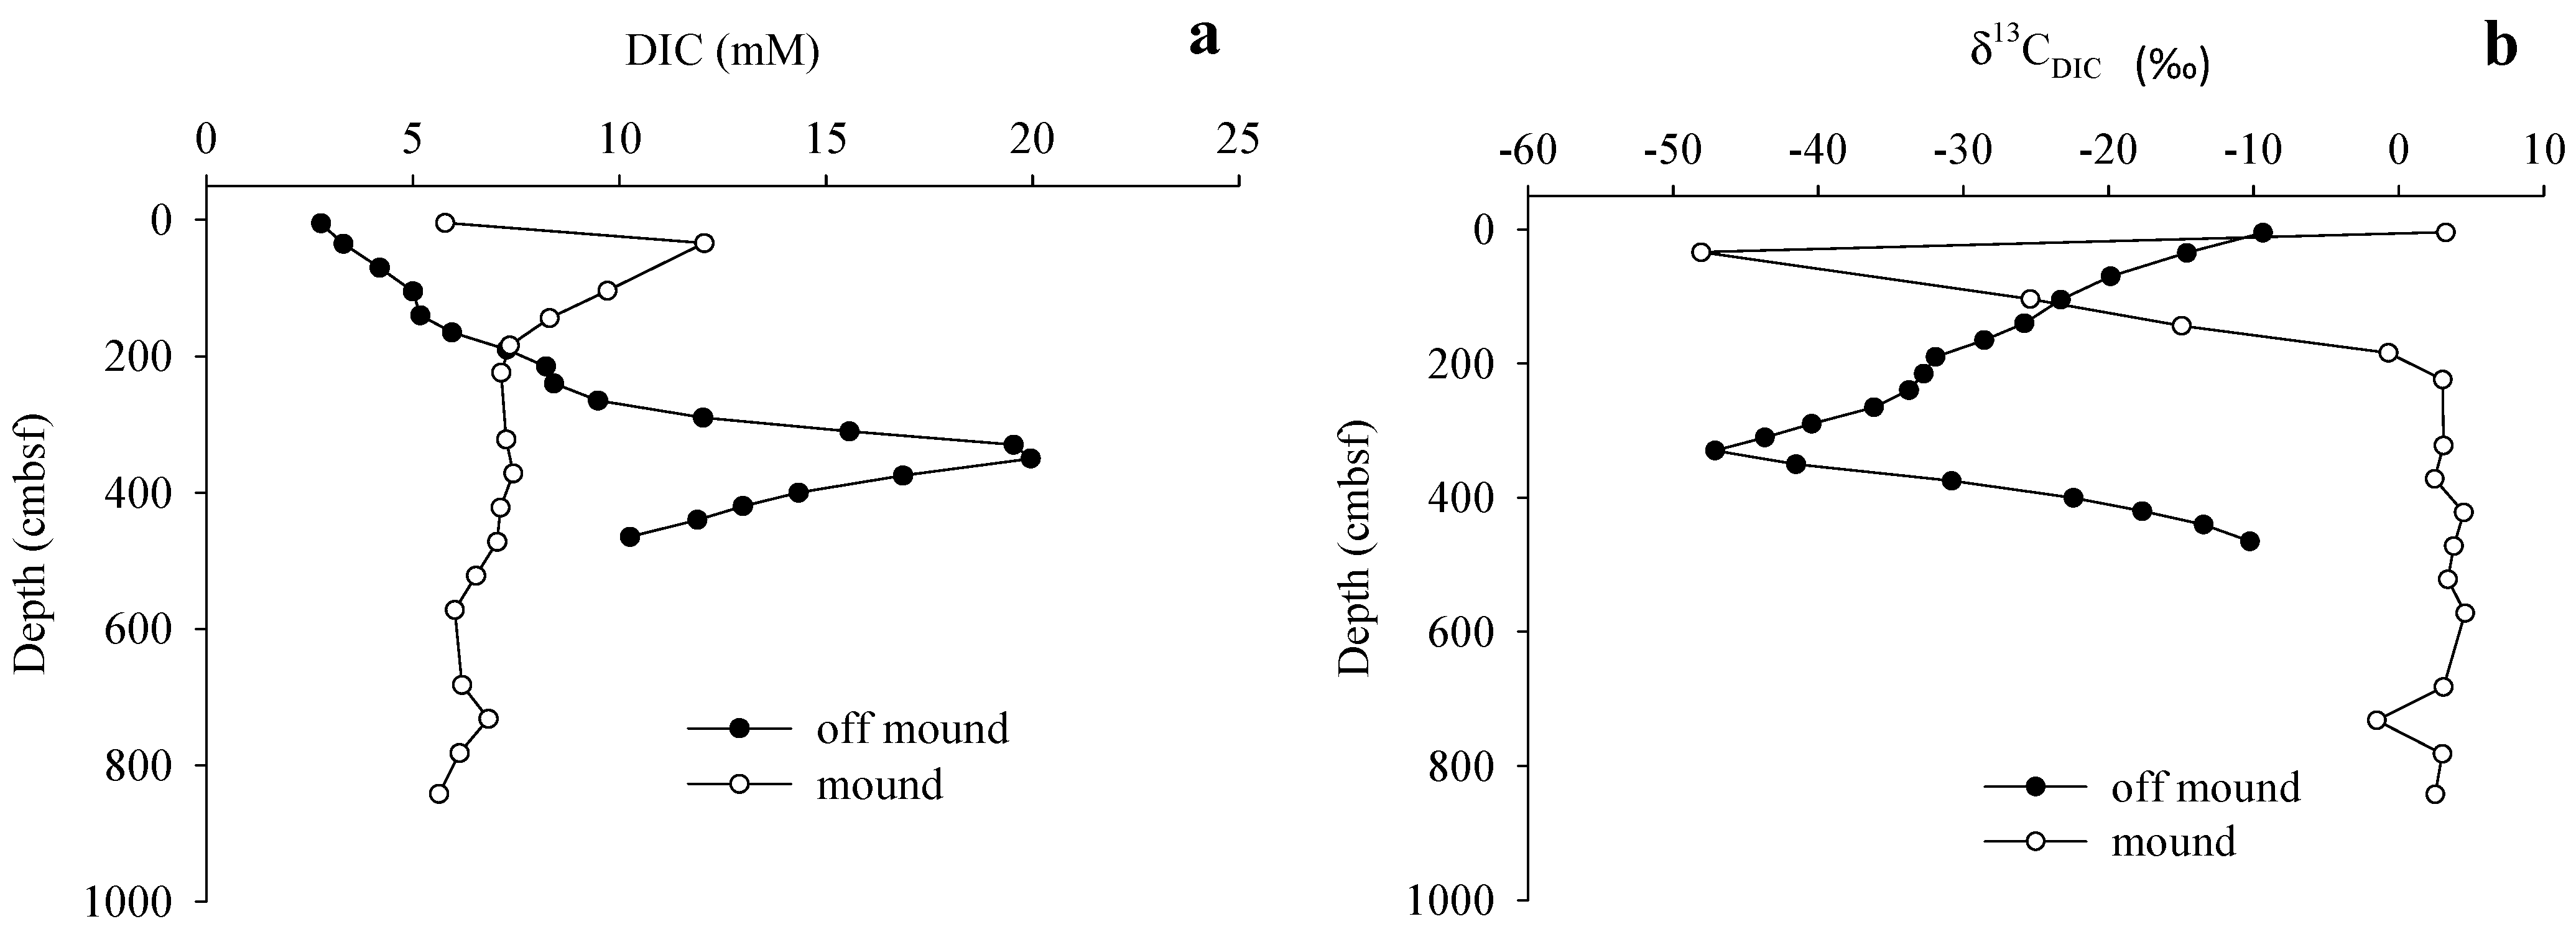
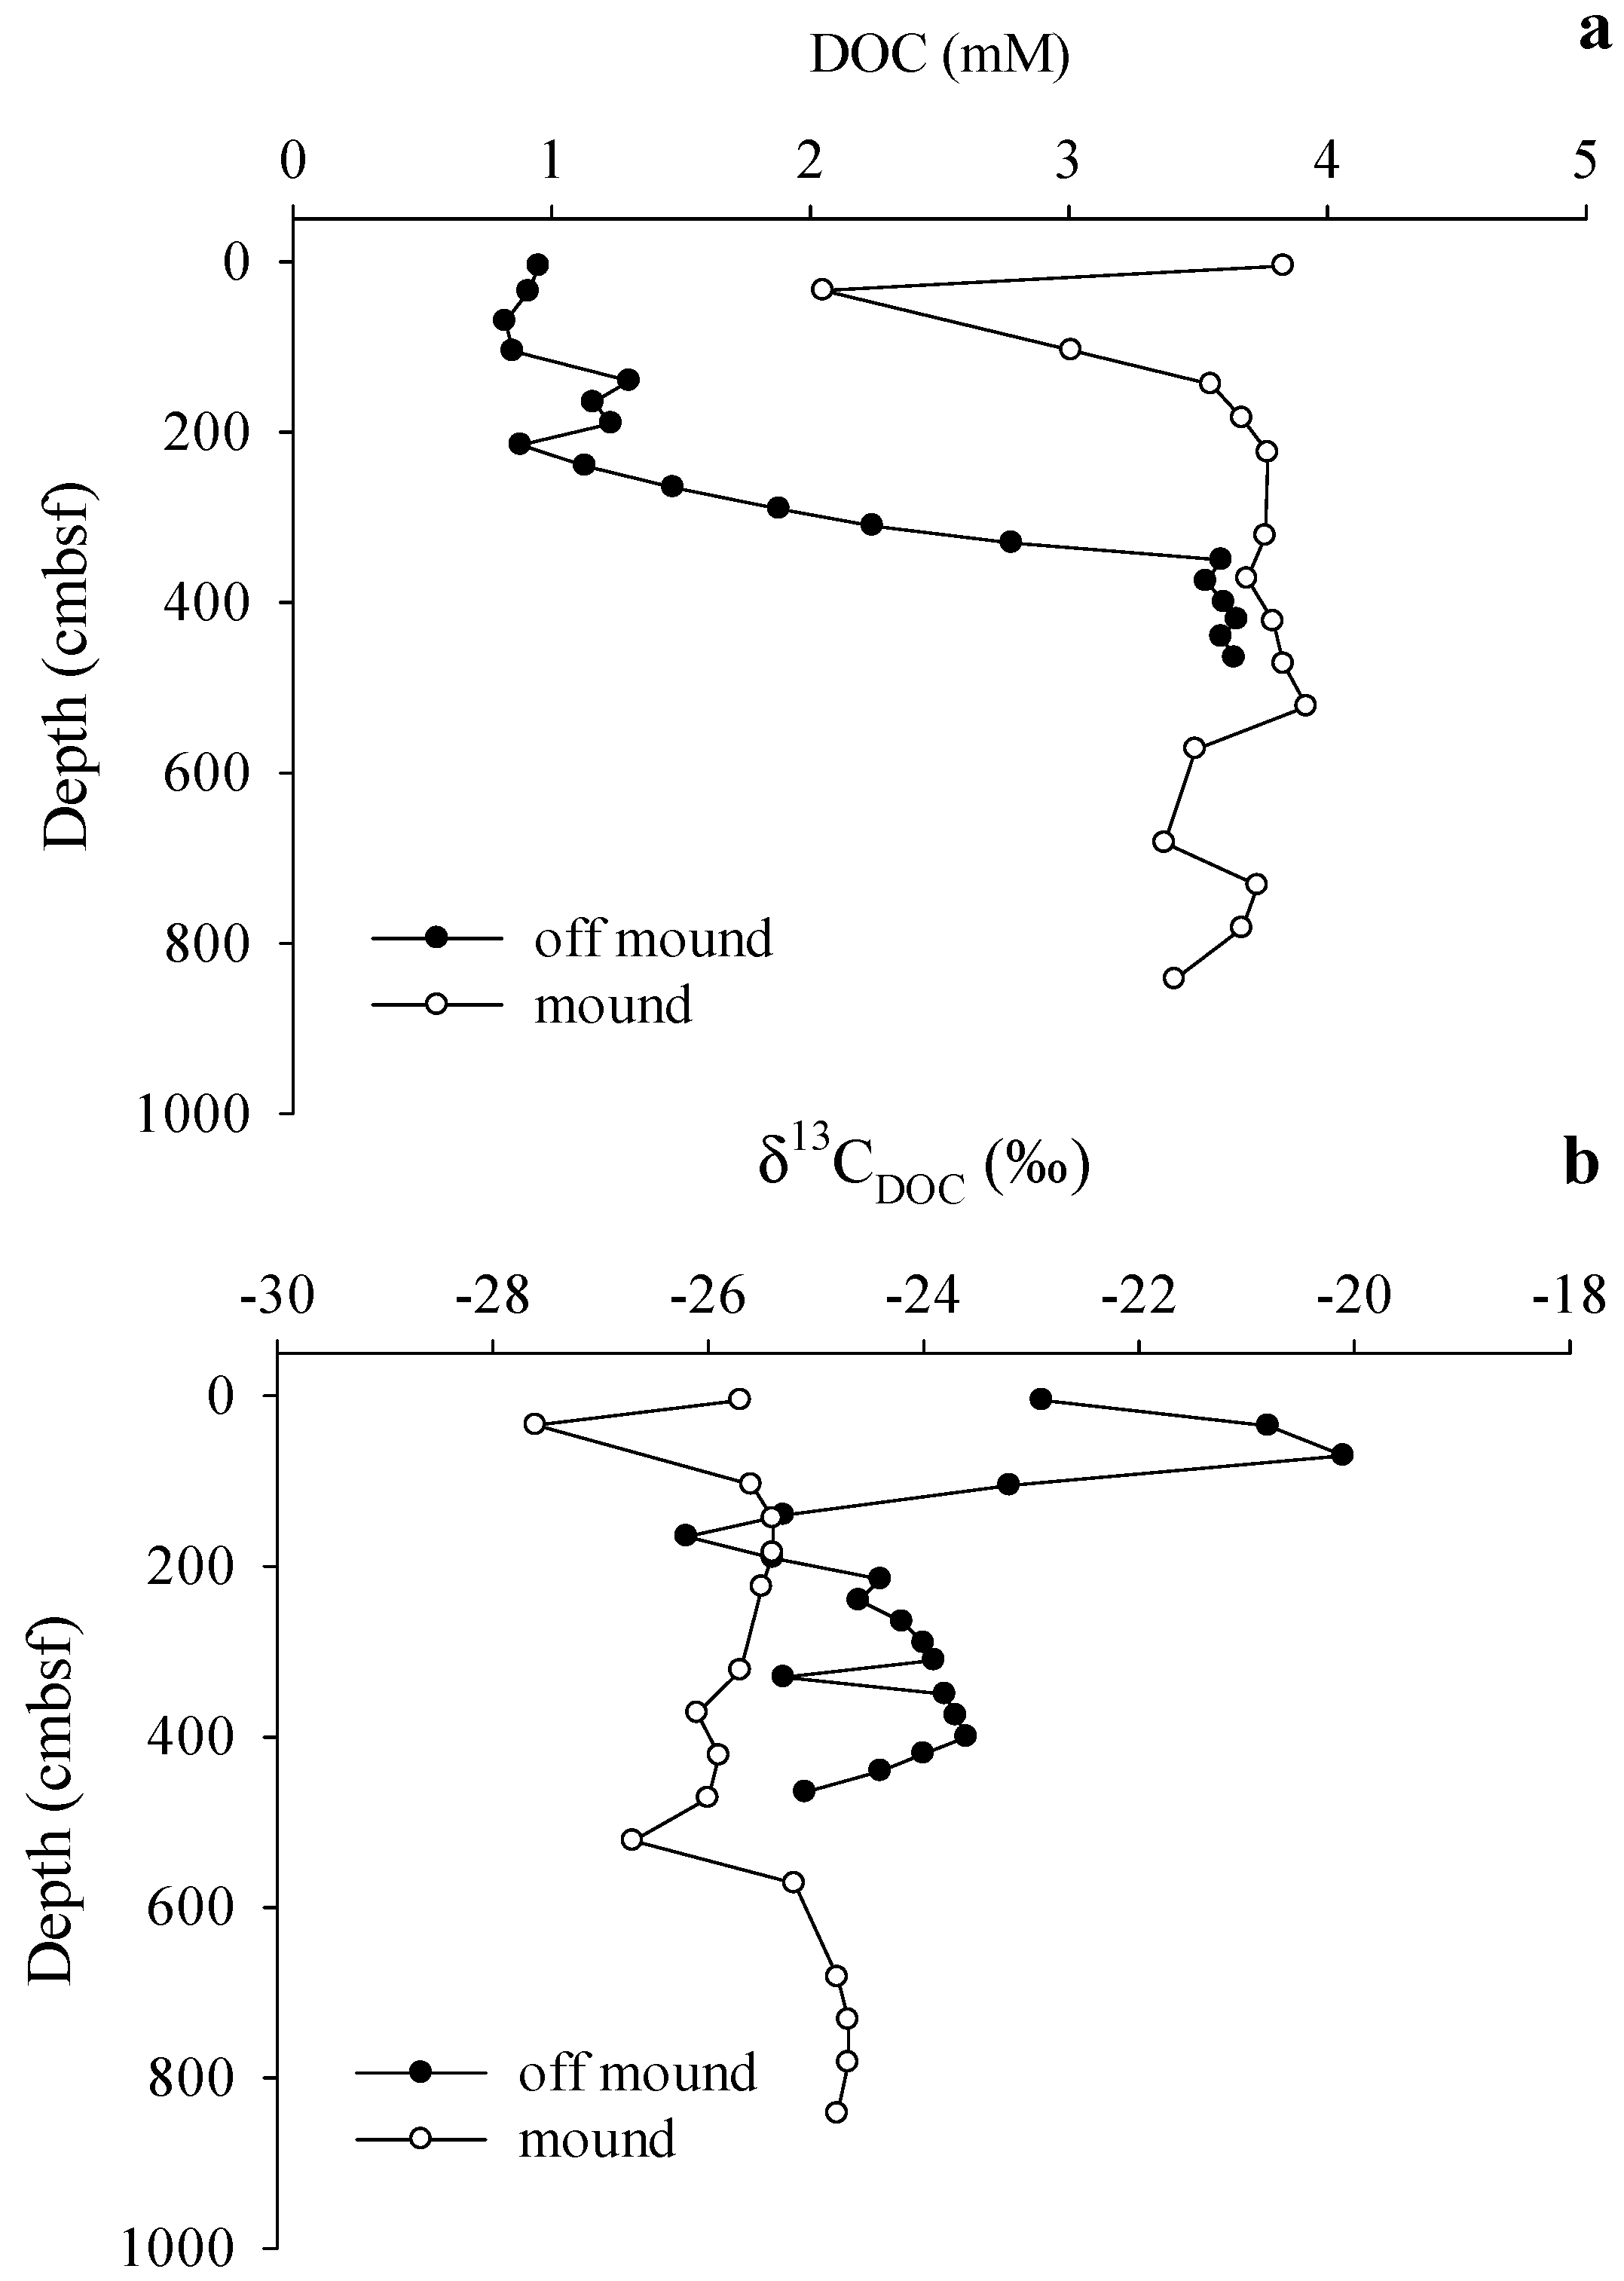
| Min | ND | ND | LOD | −86.9 | 2.8 | −47.1 | 0.82 | −26.2 | 0.91 | −23 | −679 | 2.4 | −6.1 |
| Max | ND | ND | 12.5 | −48.8 | 20 | −9.4 | 3.64 | −20.1 | 0.64 | −20.5 | −283 | 13.04 | 1.8 |
| AVG ± SD | ND | ND | 5.3 ± 5.5 | −74.1 ±11.5 | 10.2 ± 5.3 | −27.6 ± 11.5 | 2.06 ± 1.18 | −23.9 ± 1.5 | 0.72 ± 0.07 | −22.5 ± 0.6 | −629 ± 88 | 4.4 ± 3.2 | −4.6 ± 2.4 |
| C3 | |||||||||||||
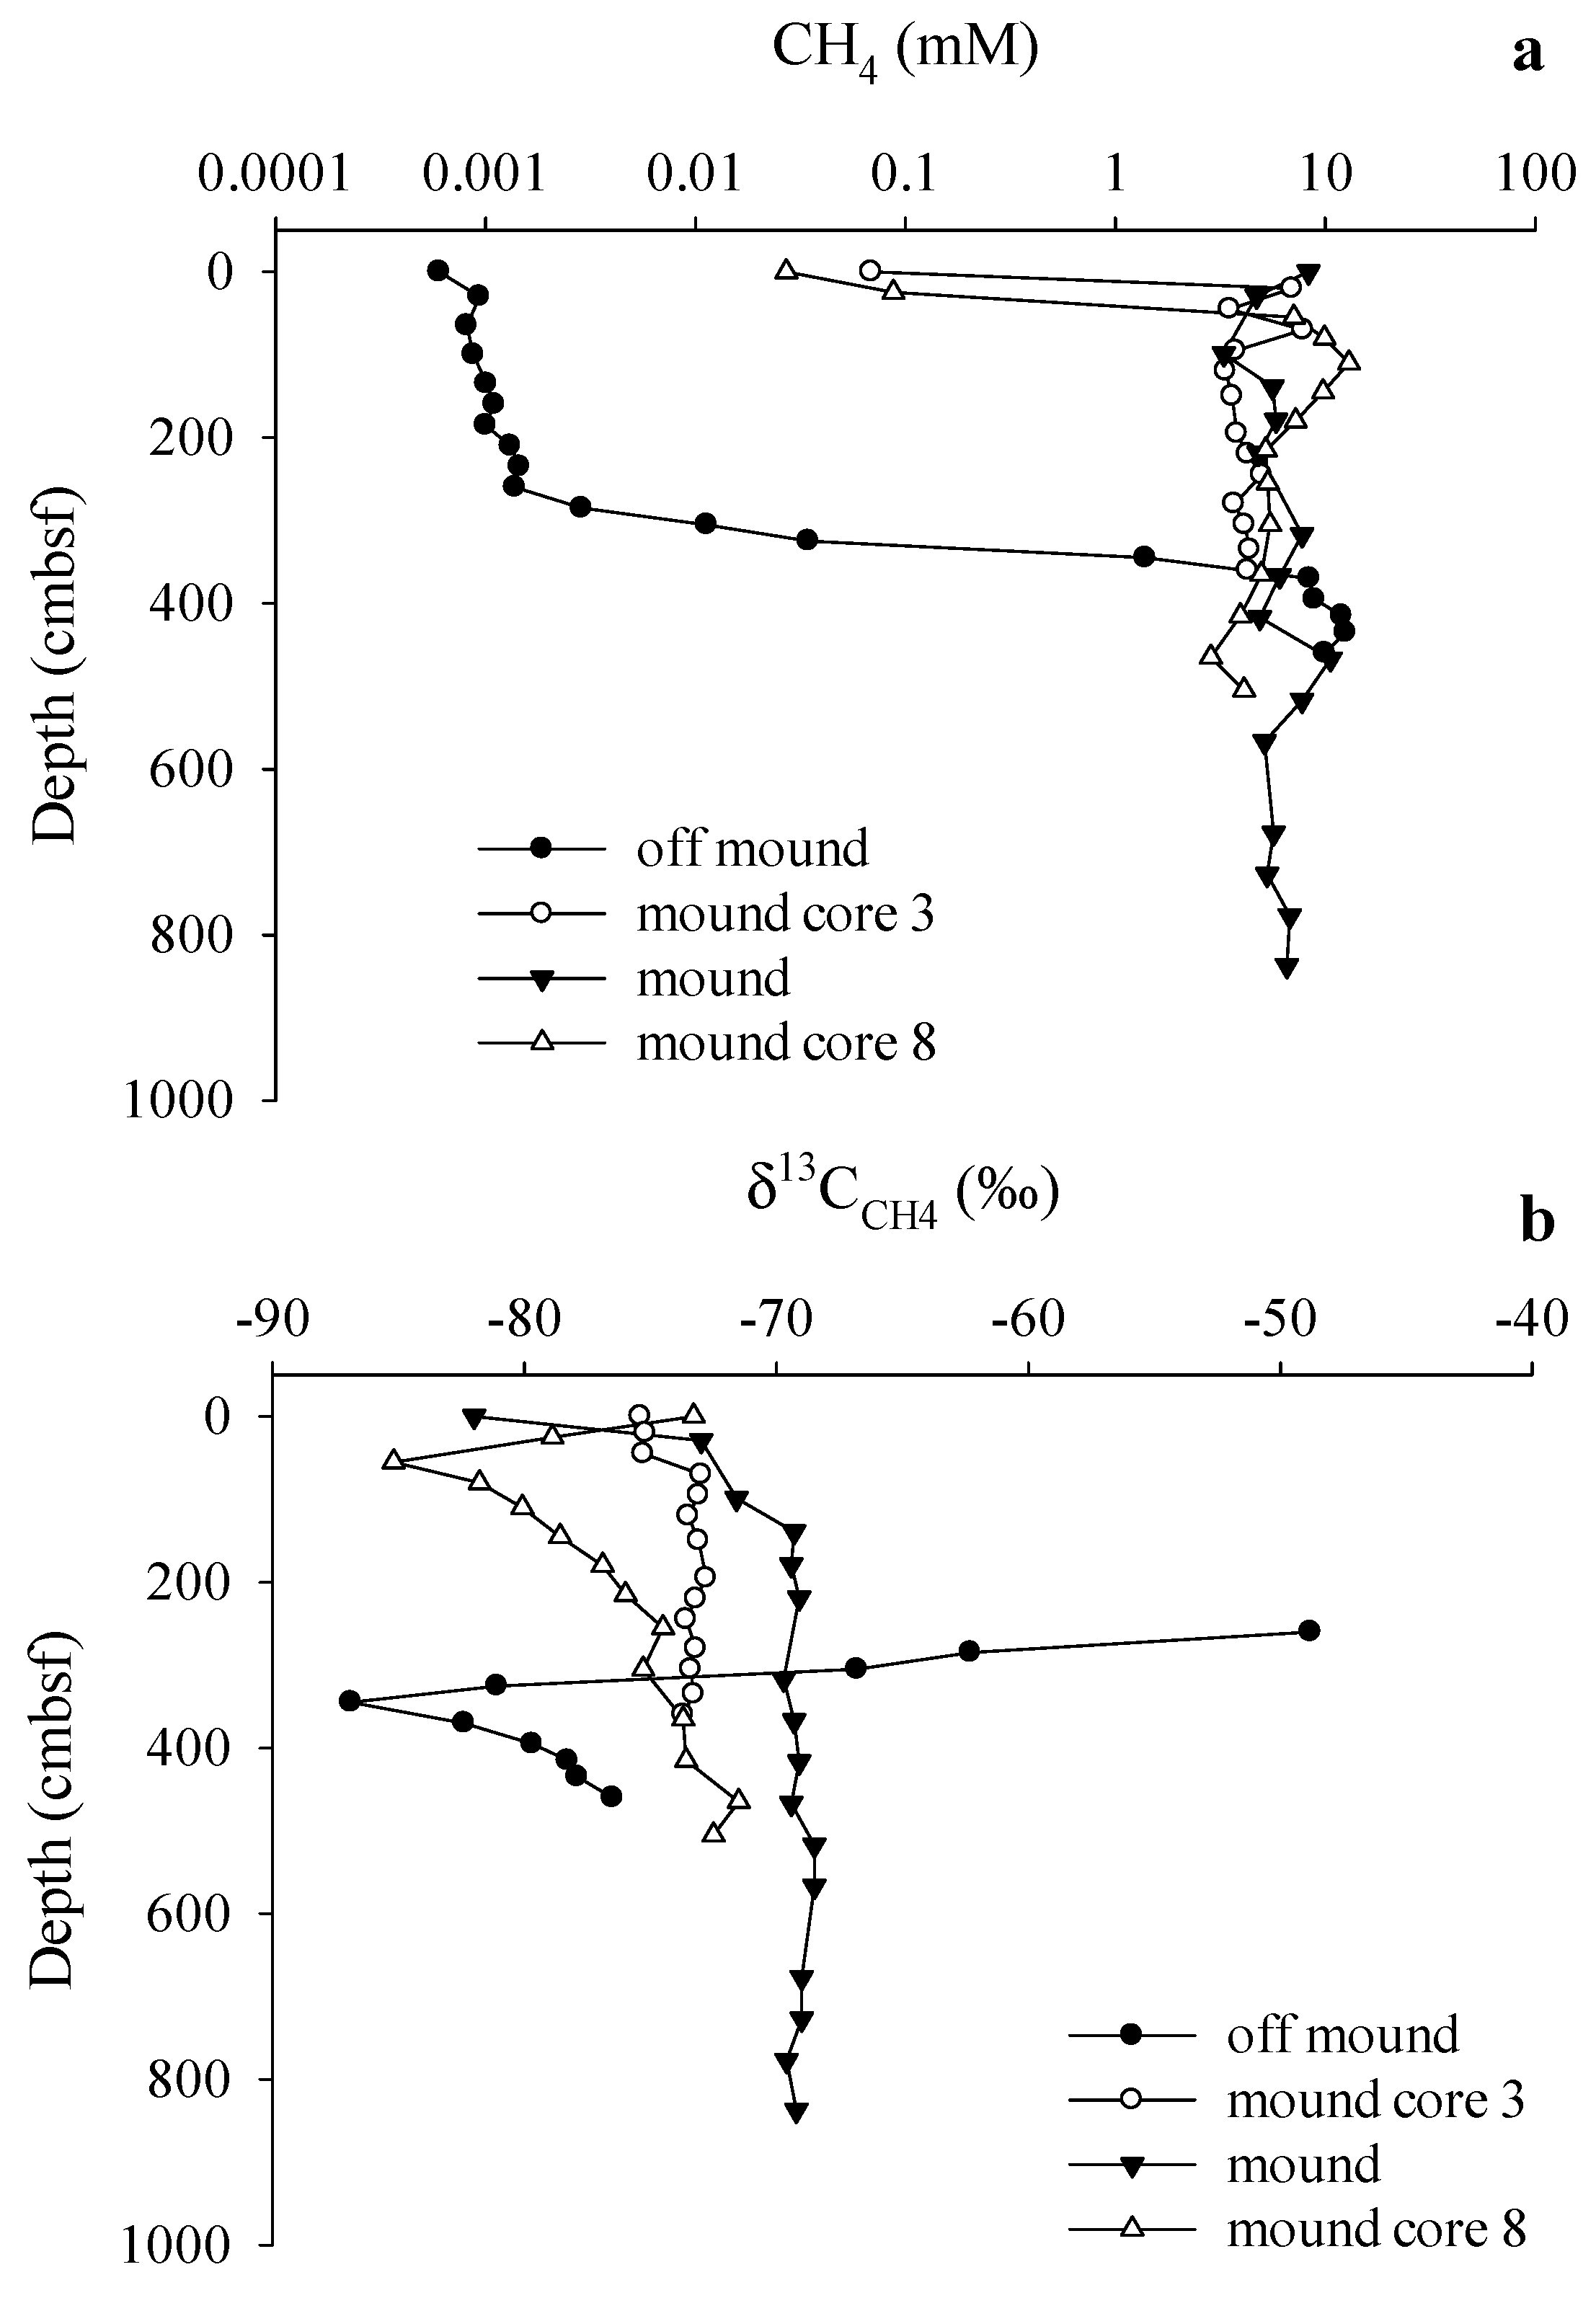
| Min | −72.5 | −963 | 0.1 | −75.4 | 6.7 | −42.9 | ND | ND | ND | ND | ND | ND | ND |
| Max | −72 | −957 | 7.9 | −72.8 | 13.6 | 3.7 | ND | ND | ND | ND | ND | ND | ND |
| AVG ± SD | −72.3 ± 0.2 | −960 ± 3 | 4.2 ± 1.8 | −73.7 ± 0.9 | 9.7 ± 2.3 | −3.0 ± 12.6 | ND | ND | ND | ND | ND | ND | ND |
| C7 | |||||||||||||
| Min | −71.4 | ND | 3.3 | −82 | 5.6 | −48.1 | 2.05 | −27.6 | 0.57 | −28.2 | −951 | 9.89 | −12.6 |
| Max | −71.2 | ND | 10.6 | −69 | 12.1 | 4.6 | 3.92 | −24.8 | 0.66 | −25 | −890 | 13.04 | −1.1 |
| AVG ± SD | −71.3 ± 0.3 | ND | 6.2 ± 1.8 | −70.4 ± 3.3 | 7.3 ± 1.6 | −3.4 ± 14.4 | 3.55 ± 0.42 | −25.6 ± 0.8 | 0.60 ± 0.03 | −25.8 ± 0.8 | −929 ± 22 | 11.4 ± 1.1 | −2.7 ± 2.8 |
| C8 | |||||||||||||
| Min | −72.3 | −905 | 0.0 | −85.2 | 5.5 | −44.3 | ND | ND | ND | ND | ND | ND | ND |
| Max | −65.8 | −901 | 13.0 | −71.5 | 13.8 | 6.7 | ND | ND | ND | ND | ND | ND | ND |
| AVG ± SD | −69.7 ± 3.4 | −903 ± 2 | 5.64 ± 3.62 | −76.6 ± 3.9 | 10.6 ± 2.0 | −15.0 ± 21.7 | ND | ND | ND | ND | ND | ND | ND |
3.3. Gas Sources and Sediment and Porewater Carbon Profiles


4. Discussion
4.1. Shallow Sediment Carbon
4.2. Methane Source and Cycling
4.3. Estimation of CH4 Contribution to the Shallow Organic Carbon

5. Conclusions
Supplementary Materials
Acknowledgments
Author Contributions
Conflicts of Interest
References
- Goñi, M.A.; Ruttenberg, K.C.; Eglington, T.I. A reassesment of the sources and importance of land-derived organic matter in surface sediment from the Gulf of Mexico. Geochem. Cosmochim. Acta 1998, 62, 3055–3075. [Google Scholar] [CrossRef]
- Bianchi, T.S.; Mitra, S.; McKee, B.A. Sources of terrestrially-derived organic carbon in lower Mississippi River and Louisiana shelf sediments: Implications for differential sedimentation and transport at the coastal margin. Mar. Chem. 2002, 77, 211–223. [Google Scholar] [CrossRef]
- Gordon, E.S.; Goñi, M.A. Controls on the distribution and accumulation of terrigenous organic matter in sediments from the Mississippi and Atchafalaya river margin. Mar. Chem. 2004, 92, 331–352. [Google Scholar] [CrossRef]
- Mayer, L.M.; Schick, L.L.; Allison, M.A.; Rutthenberg, K.C.; Bentley, S.J. Marine vs. terrigenous organic matter in Louisiana coastal sediments: The uses of bromine organic carbonratios. Mar. Chem. 2007, 107, 244–254. [Google Scholar] [CrossRef]
- Rabalais, N.N.; Atilla, N.; Normandeau, C.; Turner, R.E. Ecosystem history of Mississippi River influenced continental shelf revealed through preserved phytoplankton pigments. Mar. Pollut. Bull. 2004, 49, 537–547. [Google Scholar] [CrossRef] [PubMed]
- Ruttenberg, K.C.; Goñi, M.A. Phosphourus distribution, C:N:P ratios, and δ13Coc in arctic, temperate, and tropical coastal sediments: Tools for characterizing bulk sedimentary organic matter. Mar. Geol. 1997, 139, 123–145. [Google Scholar] [CrossRef]
- Anderson, R.K.; Scalan, R.S.; Parker, P.L.; Behrens, E.W. Seep oil and gas in Gulf of Mexico slope sediment. Science 1998, 222, 619–621. [Google Scholar] [CrossRef]
- Milkov, A.V. Molecular and stable isotope compositions of natural gas hydraes: A revised global data set and basic interpretations in the context of geological settings. Org. Geochem. 2005, 36, 681–702. [Google Scholar] [CrossRef]
- Borowski, W.S.; Paull, C.K.; Ussler, W., III. Marine porewater sulfate profiles indicate in situ methane flux from underlying gas hydrate. Geology 1996, 24, 655–658. [Google Scholar] [CrossRef]
- Pancost, R.D.; Damste, J.S.S.; de Lint, S.; van der Maarel, M.J.E.C.; Gottschal, J.C.; the Medinaut Shipboard Scientific Party. Biomarker evidence for widespread anaerobic methane oxidation in Mediterranean sediments by a consortium of methanogenic archaea and bacteria. Appl. Environ. Microbiol. 2000, 66, 1126–1132. [Google Scholar] [CrossRef]
- Knittel, K.; Boetius, A. Anaerobic oxidation of methane: Progress with an unknown process. Annu. Rev. Microbiol. 2009, 63, 311–334. [Google Scholar] [CrossRef] [PubMed]
- Alperin, M.J.; Hoehler, T.M. Anaerobic methane oxidation by archaea/sulfate-reducing bacteria aggregates: 2. Isotopic constraints. Am. J. Sci. 2009, 309, 958–984. [Google Scholar] [CrossRef]
- Wegener, G.; Niemann, H.; Elvert, M.; Hinrichs, K.-U.; Boetius, A. Assimilation of methane and inorganic carbon by microbial communities mediating the anaerobic oxidation of methane. Environ. Microbiol. 2008, 10, 2287–2298. [Google Scholar] [CrossRef] [PubMed]
- Kellermann, M.; Wegener, G.; Elvert, M.; Yoshinga, M.Y.; Lin, Y.-S.; Holler, T.; Mollar, X.P.; Knittel, K.; Hinrichs, K.-U. Autotrophy as a predominant mode of carbon fixation in anaerobic methane-oxidizing mincrobial communities. PNAS 2012, 109, 19321–19326. [Google Scholar] [CrossRef] [PubMed]
- Leak, D.J.; Dalton, H. Growth yields of methanotrophs. Appl. Microbiol. Biotechnol. 1986, 23, 470–476. [Google Scholar] [CrossRef]
- Kelley, C.A.; Coffin, R.B.; Cifuentes, L.A. Stable isotope evidence for alternate carbon sources in the Gulf of Mexico. Limnol. Oceanogr. 1998, 43, 1962–1969. [Google Scholar]
- Wang, X.-C.; Chen, R.F.; Whelan, J.; Eglinton, T. Contribution of “old” carbon from natural marine hydrocarbon seeps to sedimentary and dissolved organic carbon pools in the Gulf of Mexico. Geophys. Res. Lett. 2001, 28, 3313–3316. [Google Scholar] [CrossRef]
- Joye, S.B.; Boetius, A.; Orcutt, B.N.; Montoya, R.P.; Schulz, H.N.; Ericson, M.J.; Lugo, S.K. The anaerobic oxidation of methane and sulfate reduction in sediments from Gulf of Mexico cold seeps. Chem. Geo. 2004, 205, 219–238. [Google Scholar] [CrossRef]
- Paull, C.K.; Ussler, W., III; Lorenson, T.; Winters, W.; Dougherty, J. Geochemical constraints on the distribution of gas hydrates in the Gulf of Mexico. Geo. Mar. Lett. 2005, 25, 273–280. [Google Scholar] [CrossRef]
- Ruppel, C.; Dickens, G.R.; Castellini, D.G.; Gilhooly, W.; Lisarralde, D. Heat and salt inhibition of gas hydrae formation in the northern Gulf of Mexico. Geophys. Res. Lett. 2005, 32, L04605. [Google Scholar] [CrossRef]
- Lapham, L.L.; Chanton, J.P.; Martens, C.S.; Sleeper, S.; Woolsey, J.R. Microbial activity in surficial sediments overlying acoustic wipeout zones at a Gulf of Mexico cold seep. Geochem. Geophys. Geosyst. 2008, 9. [Google Scholar] [CrossRef]
- Coffin, R.B.; Hamdan, L.; Plummer, R.; Smith, J.; Gardner, J.; Wood, W.T. Analysis of methane and sulfate flux in methane charged sediments from the Mississippi Canyon, Gulf of Mexico. Mar. Pet. Geol. 2008, 25, 977–987. [Google Scholar] [CrossRef]
- Wood, W.T.; Hart, P.E.; Hutchinson, D.R.; Dutta, N.; Snyder, F.; Coffin, R.B.; Gettrust, J.F. Gas and gas hydrate distribution around seafloor seeps in Mississippi Canyon, Northern Gulf of Mexico, using multi-resolution seismic imagery. Mar. Pet. Geol. 2008, 9, 952–959. [Google Scholar] [CrossRef]
- Weimer, P.; Buffler, R.T. Structural geology and evolution of the Mississippi fan fold belt, deep Gulf of Mexico. AAPG Bull. 1992, 76, 225–251. [Google Scholar]
- Goodwin, R.H.; Prior, D.B. Geometry and depositional sequences of the Mississippi Canyon, Gulf of Mexico. J. Sediment. Res. 1989, 59, 318–329. [Google Scholar]
- Ellwood, B.B.; Balsam, W.L.; Roberts, H.H. Gulf of Mexico sediment sources and sediment transport trends from magnetic susceptibility measurements of surface samples. Mar. Geol. 2006, 230, 237–248. [Google Scholar] [CrossRef]
- Coffin, R.B.; Gardner, J.; Pohlman, J.; Downer, R.; Wood, W. Methane Hydrate Exploration, Atwater Valley, Texas-Louisiana Shelf: Geophysical And Geochemical Profiles; Naval Research Laboratory: Washington, DC, USA, 2006. [Google Scholar]
- Reeburgh, W.S. An improved interstitial water sampler. Limnol. Oceanogr. 1967, 12, 163–165. [Google Scholar] [CrossRef]
- Plummer, R.E.; Pohlman, J.; Coffin, R.B. Compound-Specific Stable Carbon Isotope Analysis of Low-Concentration Complex Hydrocarbon Mixtures from Natural Gas Hydrate Systems; American Geophysical Union: Washington, DC, USA, 2005. [Google Scholar]
- Osburn, C.L.; St-Jean, G. The use of wet chemical oxidation with high-amplification isotope ratio mass spectrometry (WCO-IRMS) to measure stable isotope values of dissolved organic carbon in seawater. Limnol. Oceanogr. Methods 2007, 5, 296–308. [Google Scholar] [CrossRef]
- Pohlman, J.W.; Knies, D.L.; Grabowski, K.S.; DeTurck, T.M.; Treacy, D.J.; Coffin, R.B. Sample distillation/graphitization system for carbon pool analysis by accelerator mass spectrometry (AMS). Nucl. Instrum. Methods Phys. Res. Sect. B Beam Interact. Mater. Atoms 2000, 172, 428–433. [Google Scholar] [CrossRef]
- Grabowski, K.S.; Knies, D.L.; DeTurck, T.M.; Treacy, D.J.; Pohlman, J.W.; Coffin, R.B.; Hubler, G.K. A report on the Naval Research Laboratory AMS facility. Nucl. Instrum. Methods Phys. Res. Sect. B Beam Interact. Mater. Atoms 2000, 172, 34–39. [Google Scholar] [CrossRef]
- Tumey, S.T.; Grabowski, K.S.; Knies, D.L.; Mignerey, A.C. Data collection, filtering and analysis at the Naval Research Laboratory trace element accelerator mass spectrometry facility. Nucl. Instrum. Methods Phys. Res. Sect. B Beam Interact. Mater. Atoms 2004, 176, 428–433. [Google Scholar]
- Stuiver, M.; Polach, H.A. Discussion: Reporting of 14C data. Radiocarbon 1977, 19, 355–363. [Google Scholar]
- Stuiver, M. International agreements and the use of the new oxalic acid standard. Radiocarbon 1983, 25, 793–795. [Google Scholar]
- Donahue, D.J.; Linick, T.W.; Jull, A.J.T. Isotope-ratio and background corrections for accelerator mass spectrometry radiocarbon measurements. Radiocarbon 1990, 32, 135–142. [Google Scholar]
- Coffin, R.B.; Hamdan, L.J.; Smith, J.P.; Rose, P.S.; Plummer, R.E.; Yoza, B.; Pecher, I.; Montgomery, M.T. Contribution of vertical methane flux to shallow sediment carbon pools across porangahau ridge, New Zealand. Energies 2014, 7, 5332–5356. [Google Scholar] [CrossRef]
- Macko, S.A.; Ostrom, N.E. Pollution studies using stable isotopes. In Stable Isotopes in Ecology and Environmental Science; Lajtha, K., Michener, R., Eds.; Blackwell Scientific Publications: Hoboken, NJ, USA, 1994; pp. 45–62. [Google Scholar]
- Fry, B. Using stable isotopes to monitor watershed influences on aquatic trophodynamics. Can. J. Fish. Aquat. Sci. 1999, 56, 2167–2171. [Google Scholar] [CrossRef]
- Gordon, E.S.; Goñi, M.A. Source and distribution of terrigenous organic matter delivered by the Atchafalaya River to sediments in the northern Gulf of Mexico. Geochem. Cosmochim. Acta 2003, 67, 2359–2375. [Google Scholar] [CrossRef]
- Wang, X.; Chen, R.F.; Gardner, G.B. Sources and transport of dissolved and particulate organic carbon in the Mississippi River estuary and adjacent coastal waters of the northern Gulf of Mexico. Mar. Chem. 2004, 89, 241–256. [Google Scholar] [CrossRef]
- Peterson, B.J.; Howarth, R.W.; Garritt, R.H. Multiple stable isotopes used to trace the flow of organic matter in estuarine food webs. Science 1985, 277, 1361–1363. [Google Scholar] [CrossRef]
- Chen, X.; Lohrenz, S.E.; Wiesenburg, D.A. Distribution and controlling mechanisms of primary production on the Louisianan-Texas continental shelf. J. Mar. Syst. 2000, 25, 179–207. [Google Scholar] [CrossRef]
- Burdige, D.J.; Martens, C.S. Biogeochemical cycling in an organic-rich coastal marine basin: The sedimentary cycling of dissolved, free amino acids. Geochim. Cosmochim. Acta 1990, 54, 3033–3052. [Google Scholar] [CrossRef]
- Lee, C. Controls on organic carbon preservation: The use of stratified water bodies to compare intrinsic rates of decomposition in oxic and anoxic systems. Geochim. Cosmochim. Acta 1992, 56, 3323–3335. [Google Scholar] [CrossRef]
- Canuel, E.A.; Martens, C.S. Seasonal variations in the sources and alteration of organic matter associated with recently-deposited sediments. Org. Geochem. 1993, 20, 563–577. [Google Scholar] [CrossRef]
- Gong, C.; Hollander, D.J. Differential contribution of bacteria to sedimentary organic matter in oxic and anoxic environments, Santa Monica Basin, California. Org. Geochem. 1997, 26, 545–563. [Google Scholar] [CrossRef]
- Orphan, V.J.; Hinrichs, K.U.; Ussler, W., III; Paull, C.K.; Taylor, L.T.; Sylva, S.P.; Hayes, J.M.; Delong, E.F. Comparative analysis of methane-oxidizing archaea and sulfate-reducing bacteria in anoxic marine sediments. Appl. Environ. Microbiol. 2001, 67, 1922–1934. [Google Scholar] [CrossRef] [PubMed]
- Reeburgh, W.S. Oceanic methane biogeochemistry. Chem. Rev. 2007, 107, 486–513. [Google Scholar] [CrossRef] [PubMed]
- Goevert, D.; Conrad, R. Effect of substrate concentration on carbon isotope fractionation during acetoclastic methanogenesis by Methanosarcina barkeri and M. acetivorans and in rice field soil. Appl. Environ. Microbiol. 2009, 75, 2605–2612. [Google Scholar] [CrossRef] [PubMed]
- Szynkiewicz, A.M.; Jedrysek, O.; Kurasiewicz, M. Carbon isotope effects during precipitation of barium carbonate: Implications for environmental studies. Environ. Chem. Lett. 2006, 4, 29–35. [Google Scholar] [CrossRef]
- Martens, C.S.; Chanton, J.P.; Paull, C.K. Fossil biogenic methane at the Florida escarpment. Geology 1991, 19, 851–854. [Google Scholar] [CrossRef]
- Sassen, R.; MacDonald, I.R. Hydrocarbons of experimental and natural gas hydrates, Gulf of Mexico continental slope. Org. Geochem. 1997, 26, 289–293. [Google Scholar] [CrossRef]
- Sassen, R.; Sweet, S.T.; DeFreitas, D.A.; Morelos, J.A.; Milkov, A.V. Gas hydrate and crude oil from the Mississippi Fan Foldbelt, downdip Gulf of Mexico Salt Basin: Significance to petroleum system. Org. Geochem. 2001, 32, 999–1008. [Google Scholar] [CrossRef]
- Pohlman, J.W.; Kaneko, M.; Heuer, V.B.; Coffin, R.B.; Whiticar, M. Methane soucrces and production in the north Cascadia Margin gas hydrate system. Earth Planet. Sci. Lett. 2009, 287, 504–512. [Google Scholar] [CrossRef]
- Whiticar, M.J. Carbon and hydrogen isotope systematics of bacterial formation and oxidation of methane. Chem. Geol. 1999, 16, 291–314. [Google Scholar] [CrossRef]
- Boetius, A.; Ravenschlag, K.; Schubert, C.J.; Rickert, D.; Widdel, F.; Gleske, A.; Amann, R.; Jørgensen, B.B.; Witte, U.; Pfannkuche, O. A marine microbial consortium apparently mediating anaerobic oxidation of methane. Nature 2000, 407, 623–626. [Google Scholar] [CrossRef] [PubMed]
- Orphan, V.J.; House, C.H.; Hinrichs, K.-U.; McKeegan, K.D.; DeLong, E.F. Methane-consuming archea revealed by directly coupled isotopic and phylogenetic analysis. Science 2001, 293, 484–487. [Google Scholar] [CrossRef] [PubMed]
- Alperin, M.J.; Blair, N.E.; Albert, D.B.; Hoehler, T.M.; Martens, C.S. Factors that control the stable carbon isotopic composition of methane produced in an anoxic marine sediment. Glob. Biogeochem. Cycles 1992, 6, 271–291. [Google Scholar] [CrossRef]
- Hoehler, T.M.; Alperin, M.J.; Albert, D.B.; Martens, C.S. Field and laboratory studies of methane oxidation in an anoxic marine sediment: Evidence for a methanogen-sulfate reducer consortium. Glob. Biogeochem. Cycles 1994, 8, 451–463. [Google Scholar] [CrossRef]
- Yoshinaga, M.Y.; Holler, T.; Goldhammer, T.; Wegener, G.; Pohlman, J.W.; Brunner, B.; Kuypers, M.M.M.; Hinrichs, K-U.; Elvert, M. Carbon isotope equilibration during sulphate-limited anaerobic oxidation of methane. Nat. Geosci. 2014, 7. [Google Scholar] [CrossRef]
- Borowski, W.S.; Paull, C.K.; Ussler, W., III. Global and local variations of interstitial sulfate gradients in the deep-water, continental margin sediments: Sensitivity to underlying methane and gas hydrates. Mar. Geol. 1999, 159, 131–154. [Google Scholar] [CrossRef]
- House, C.H.; Schopf, J.W.; Stetter, K.O. Carbon isotopic fractionation by Archaens and other thermophilic prokaryotes. Org. Geochem. 2003, 34, 345–356. [Google Scholar] [CrossRef]
- Zhang, C.L.; Fouke, B.W.; Bonheyo, G.T.; Peackock, A.D.; White, D.C.; Huang, Y.; Romanek, C.S. Lipid biomarkers and carbon-isotopes of modern travertine deposits (Yellowstone Natioinal Park, USA): Implications for biogeochemical dynamics in hot-spring systems. Geochem. Cosmochim. Acta 2004, 68, 3157–3169. [Google Scholar] [CrossRef]
- Quandt, L.; Gottschalk, G.; Ziegler, H.; Stichler, W. Isotope discrimination by photosynthetic bacteria. REMS Microbiol. Lett. 1977, 1, 125–128. [Google Scholar] [CrossRef]
- Morse, J.W.; Beazley, M.J. Organic matter in deepwater sediments of the Northern Gulf of Mexico and its relationship to the distribution of benthic organisms. Deep Sea Res. II 2008, 55, 2563–2571. [Google Scholar] [CrossRef]
- Burdige, D.J. Geochemistry of Marine Sediments; Princeton University Press: Princeton, NJ, USA, 2006. [Google Scholar]
- Martens, C.S.; Klump, J.V. Biogeochemical cycling of an organic-rich coastal marine basin 4. An organic carbon budget for sediments dominated by sulfate reduction and methanogenesis. Geochem. Cosmochim. Acta 1984, 48, 1987–2004. [Google Scholar] [CrossRef]
- Hoehler, T.M.; Albert, D.B.; Alperin, M.J.; Martens, C.S. Acetogenesis from CO2 in an anoxic marine sediment. Limnol. Oceanogr. 1999, 44, 662–667. [Google Scholar] [CrossRef]
© 2015 by the authors; licensee MDPI, Basel, Switzerland. This article is an open access article distributed under the terms and conditions of the Creative Commons Attribution license (http://creativecommons.org/licenses/by/4.0/).
Share and Cite
Coffin, R.B.; Osburn, C.L.; Plummer, R.E.; Smith, J.P.; Rose, P.S.; Grabowski, K.S. Deep Sediment-Sourced Methane Contribution to Shallow Sediment Organic Carbon: Atwater Valley, Texas-Louisiana Shelf, Gulf of Mexico. Energies 2015, 8, 1561-1583. https://doi.org/10.3390/en8031561
Coffin RB, Osburn CL, Plummer RE, Smith JP, Rose PS, Grabowski KS. Deep Sediment-Sourced Methane Contribution to Shallow Sediment Organic Carbon: Atwater Valley, Texas-Louisiana Shelf, Gulf of Mexico. Energies. 2015; 8(3):1561-1583. https://doi.org/10.3390/en8031561
Chicago/Turabian StyleCoffin, Richard B., Christopher L. Osburn, Rebecca E. Plummer, Joseph P. Smith, Paula S. Rose, and Kenneth S. Grabowski. 2015. "Deep Sediment-Sourced Methane Contribution to Shallow Sediment Organic Carbon: Atwater Valley, Texas-Louisiana Shelf, Gulf of Mexico" Energies 8, no. 3: 1561-1583. https://doi.org/10.3390/en8031561