1. Introduction
This paper is motivated by the need to better understand: (a) the wind loads on photovoltaic (PV) modules and arrays installed on flat roofs at high angles of inclination and (b) the lift and drag of small wind turbine blades in the post-stall region important for starting when typical angles of attack, α, can reach 90° (see Wood [
1]). Since most prior work relates to PV wind loads, we start with this topic in the following brief review.
Most wind engineering studies of PV modules, e.g., Tieleman
et al. [
2] and Miller and Zimmerman [
3], have measured the average pressure distribution on model modules and arrays and inferring the forces. Some authors, e.g., Chevalier and Norton [
4], measured the moments as well, but the data is limited: the pitch (overturning) moment has not been reported. Radu
et al. [
5] determined wind force coefficients on solar collector arrays mounted on a typical five-story building. Kopp
et al. [
6] measured the loading on PV arrays in a wind tunnel that simulated the atmospheric boundary layer and the building on which the array was mounted. The influence of wind direction was investigated.
Given the advent of accurate, fast-response force and torque sensors such as the one described in the next section, it should now be easy to measure these quantities directly. Torres and Mueller [
7] directly measured the forces on low aspect ratio (
AR) rectangular flat plates (among other geometries) for 0.5 ≤
AR ≤ 2 and α ≤ 50°. Their Equations (5) and (7) are data correlations for the lift and drag respectively. These equations are:
and:
where
Cd0 is the zero-angle drag due to viscosity, and the constants
Kp and
K are given in
Table 1 along with α
m, the highest angle for which the equations are valid. At low α, the viscosity dominates the drag, with typical values of
Cd0 being 0.015 (Torres and Mueller [
7]). As α increases, however, it is to be expected that pressure becomes dominant, and that eventually:
and Equations (1a) and (1b) will no longer be valid. In other words, α
m, is a lower bound on the angles for which Equation (2) should be valid and all forces on the plate are due to pressure acting in the direction normal to the plate surface.
Table 1 shows that α
m is strongly dependent on
AR, and implies that Equation (2) holds over an increasing range of α as
AR increases. The classic study of Fage and Johansen [
8] gave a stall angle of 9° for infinite
AR, judged as the angle giving the maximum value of the normal force coefficient, so that α
m ~9° for a two-dimensional normal flat plate.
Table 1.
Parameters for flat plate lift and drag from Torres and Mueller [
7]. α
m is taken from their
Figure 6,
Kp from their
Figure 10, and
K from their
Figure 11.
Table 1.
Parameters for flat plate lift and drag from Torres and Mueller [7]. αm is taken from their Figure 6, Kp from their Figure 10, and K from their Figure 11.
| AR | αm (°) | Kp | K |
|---|
| 0.5 | 35 | 0.831 | 0.67 |
| 0.75 | 33 | 1.26 | 0.565 |
| 1.0 | 28 | 1.59 | 0.53 |
| 1.25 | 20 | 1.85 | 0.483 |
| 1.5 | 15 | 2.10 | 0.417 |
| 1.75 | 14 | 2.35 | 0.409 |
| 2.0 | 13 | 2.59 | 0.374 |
The Engineering Sciences Data Unit (ESDU) 70015 [
9] provides a compilation of flat plate lift and drag as a function of
AR and α, much of it apparently taken from Fail
et al. [
10] and Winter [
11] who investigated 0.5 <
AR < 33, but limited most of his measurements to α < 60°. Holmes
et al. [
12] determined data correlations for the normal force and center of pressure of square flat plates (
AR = 1.0) over a wide range of α for determining the trajectories of wind-borne debris, based on four different wind tunnel measurements. Given that a single PV module in portrait has a typical
AR = 0.67 and an array of six modules in landscape has
AR = 9.0, and that data at high α is needed, the main aim of the present work was to extend the range of force data. This AR is equal to that of the small wind turbine whose starting performance was measured and analyzed in Chapter 6 of Wood [
1]. On the stationary blades of typical small wind turbines with no pitch adjustment, α can reach 90°.
We measured the forces in the middle of a wind tunnel, and then again with the plates close to the floor, in order to get basic information on the effects of wall proximity without accounting for an actual or typical installation. The remainder of this paper consists of a description of the experiment and data analysis in the next section, which is followed by the presentation of the time-averaged results.
Section 4 describes instantaneous forces and moments and the conclusions are listed in
Section 5.
2. Wind Tunnel Experiments
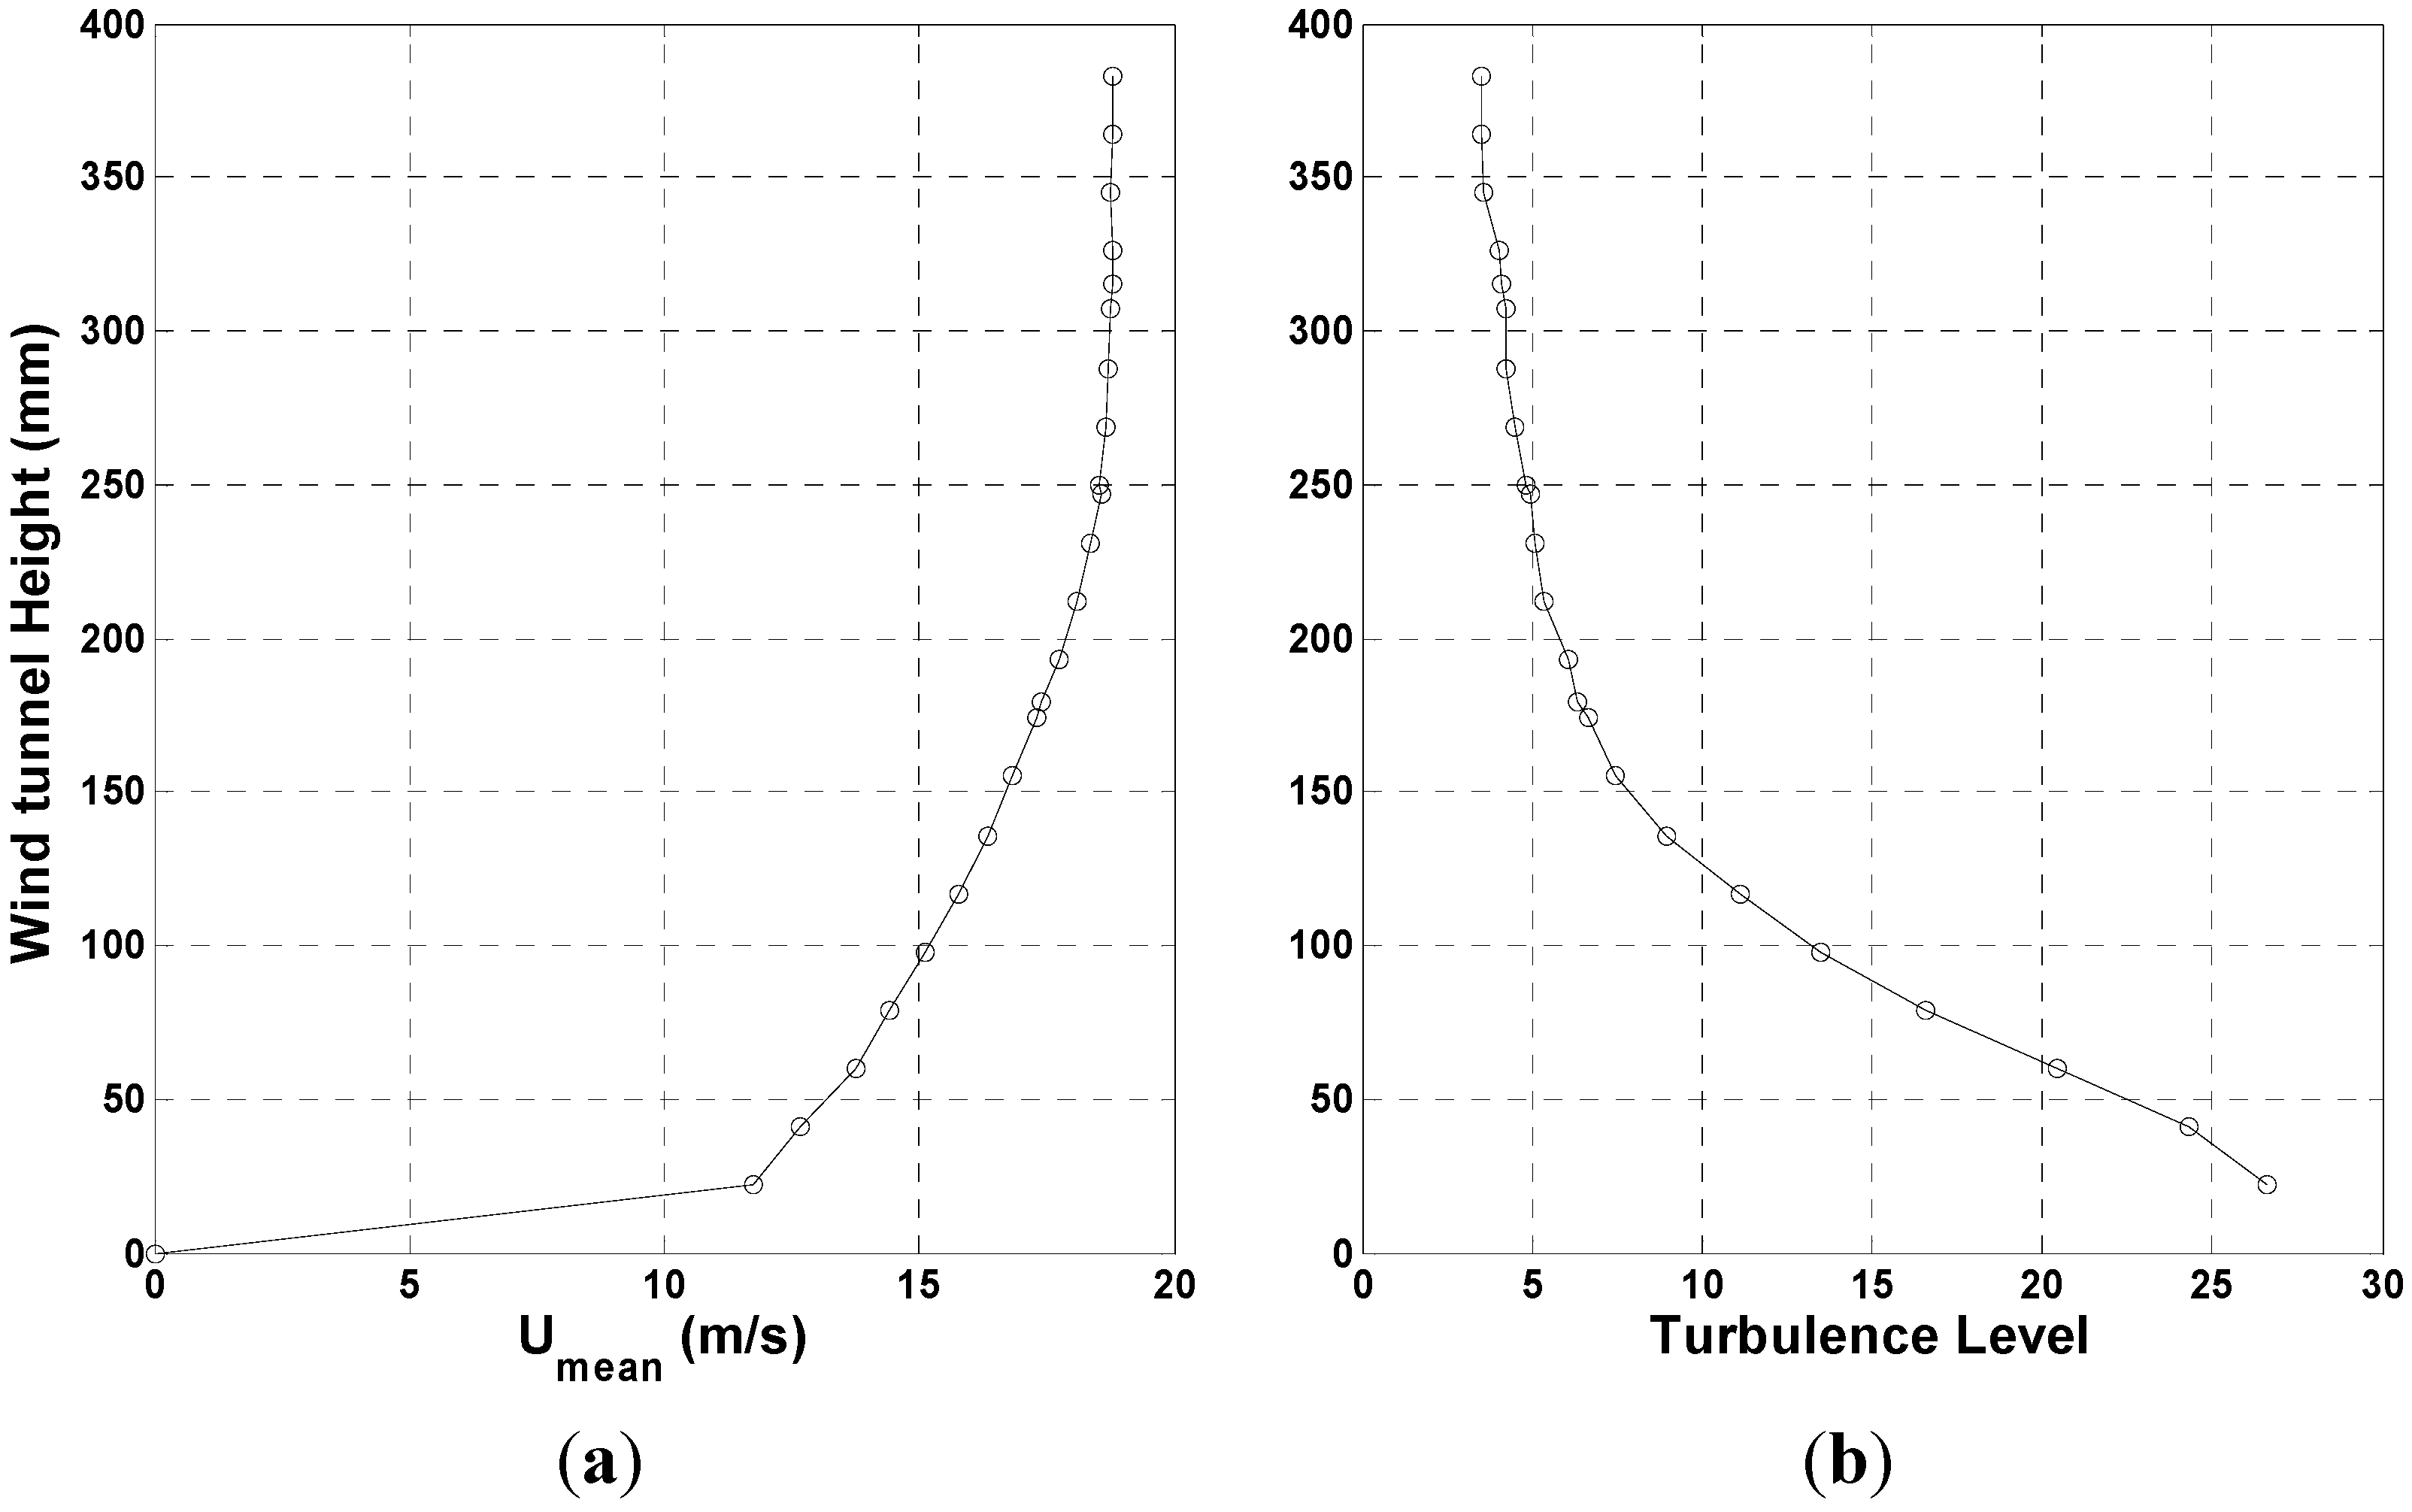
Wind tunnel experiments have been carried out in the Environmental Wind Tunnel at the University of Calgary, which has a cross-section of 0.76 m × 1.37 m. Mean wind speeds and turbulence levels were measured using a single hot-wire probe TSI-1210 connected to a TSI-158 Intelligent Flow Analyzer. No attempt was made to accurately simulate the atmospheric boundary layer because this would have required the use of very small flat plates that had low Reynolds numbers and were difficult to measure accurately. In any case, the flow over a flat roof depends strongly on the building dimensions and orientation, e.g., Kono and Kogaki [
13] and the references therein, and it is not possible to provide a generic boundary layer to simulate the rooftop flow. In the free-stream position, the nominal wind speed was 19 m/s, and the turbulence was 3.5%, as shown in
Figure 1.
Figure 1.
(a) Mean wind speed in m/s; and (b) turbulence level in %.
Figure 1.
(a) Mean wind speed in m/s; and (b) turbulence level in %.
The model sizes were chosen to keep the blockage ratio,
B, defined as the area of the plate (
B =
ab where
a and
b are defined in
Figure 2) divided by the working section area, below 0.035.
Table 2 shows the eight different
ARs that were tested.
AR = 0.6 represents a typical single PV module in “portrait” orientation,
AR = 1.66 is the same module in “landscape”, while
AR = 3.6 (see
Figure 2a) represents an array of six modules in portrait, a common grouping. In the first two columns,
a is the breadth and
b is the height of the flat plate, both defined in
Figure 2. The third column gives the plate thickness ratio, defined as
t/√(
ab), where
t is the plate thickness. For modern PV modules this ratio is about 0.030 and will reduce with new modules becoming available in the near future.
Re is the Reynolds number based on the shortest dimension at each
AR. Measurements were made at eleven different angles of attack, α (0°, 25°, 35°, 40°, 45°, 50°, 55°, 60°, 70°, 80°, 90°) and five different clearances between the model and the wind tunnel floor,
H. Only the results from the free-stream and closest to the wall are presented. In practice, the wind direction can vary significantly from being parallel to the
x-axis as indicated in
Figure 2a, but this is the only direction studied so far.
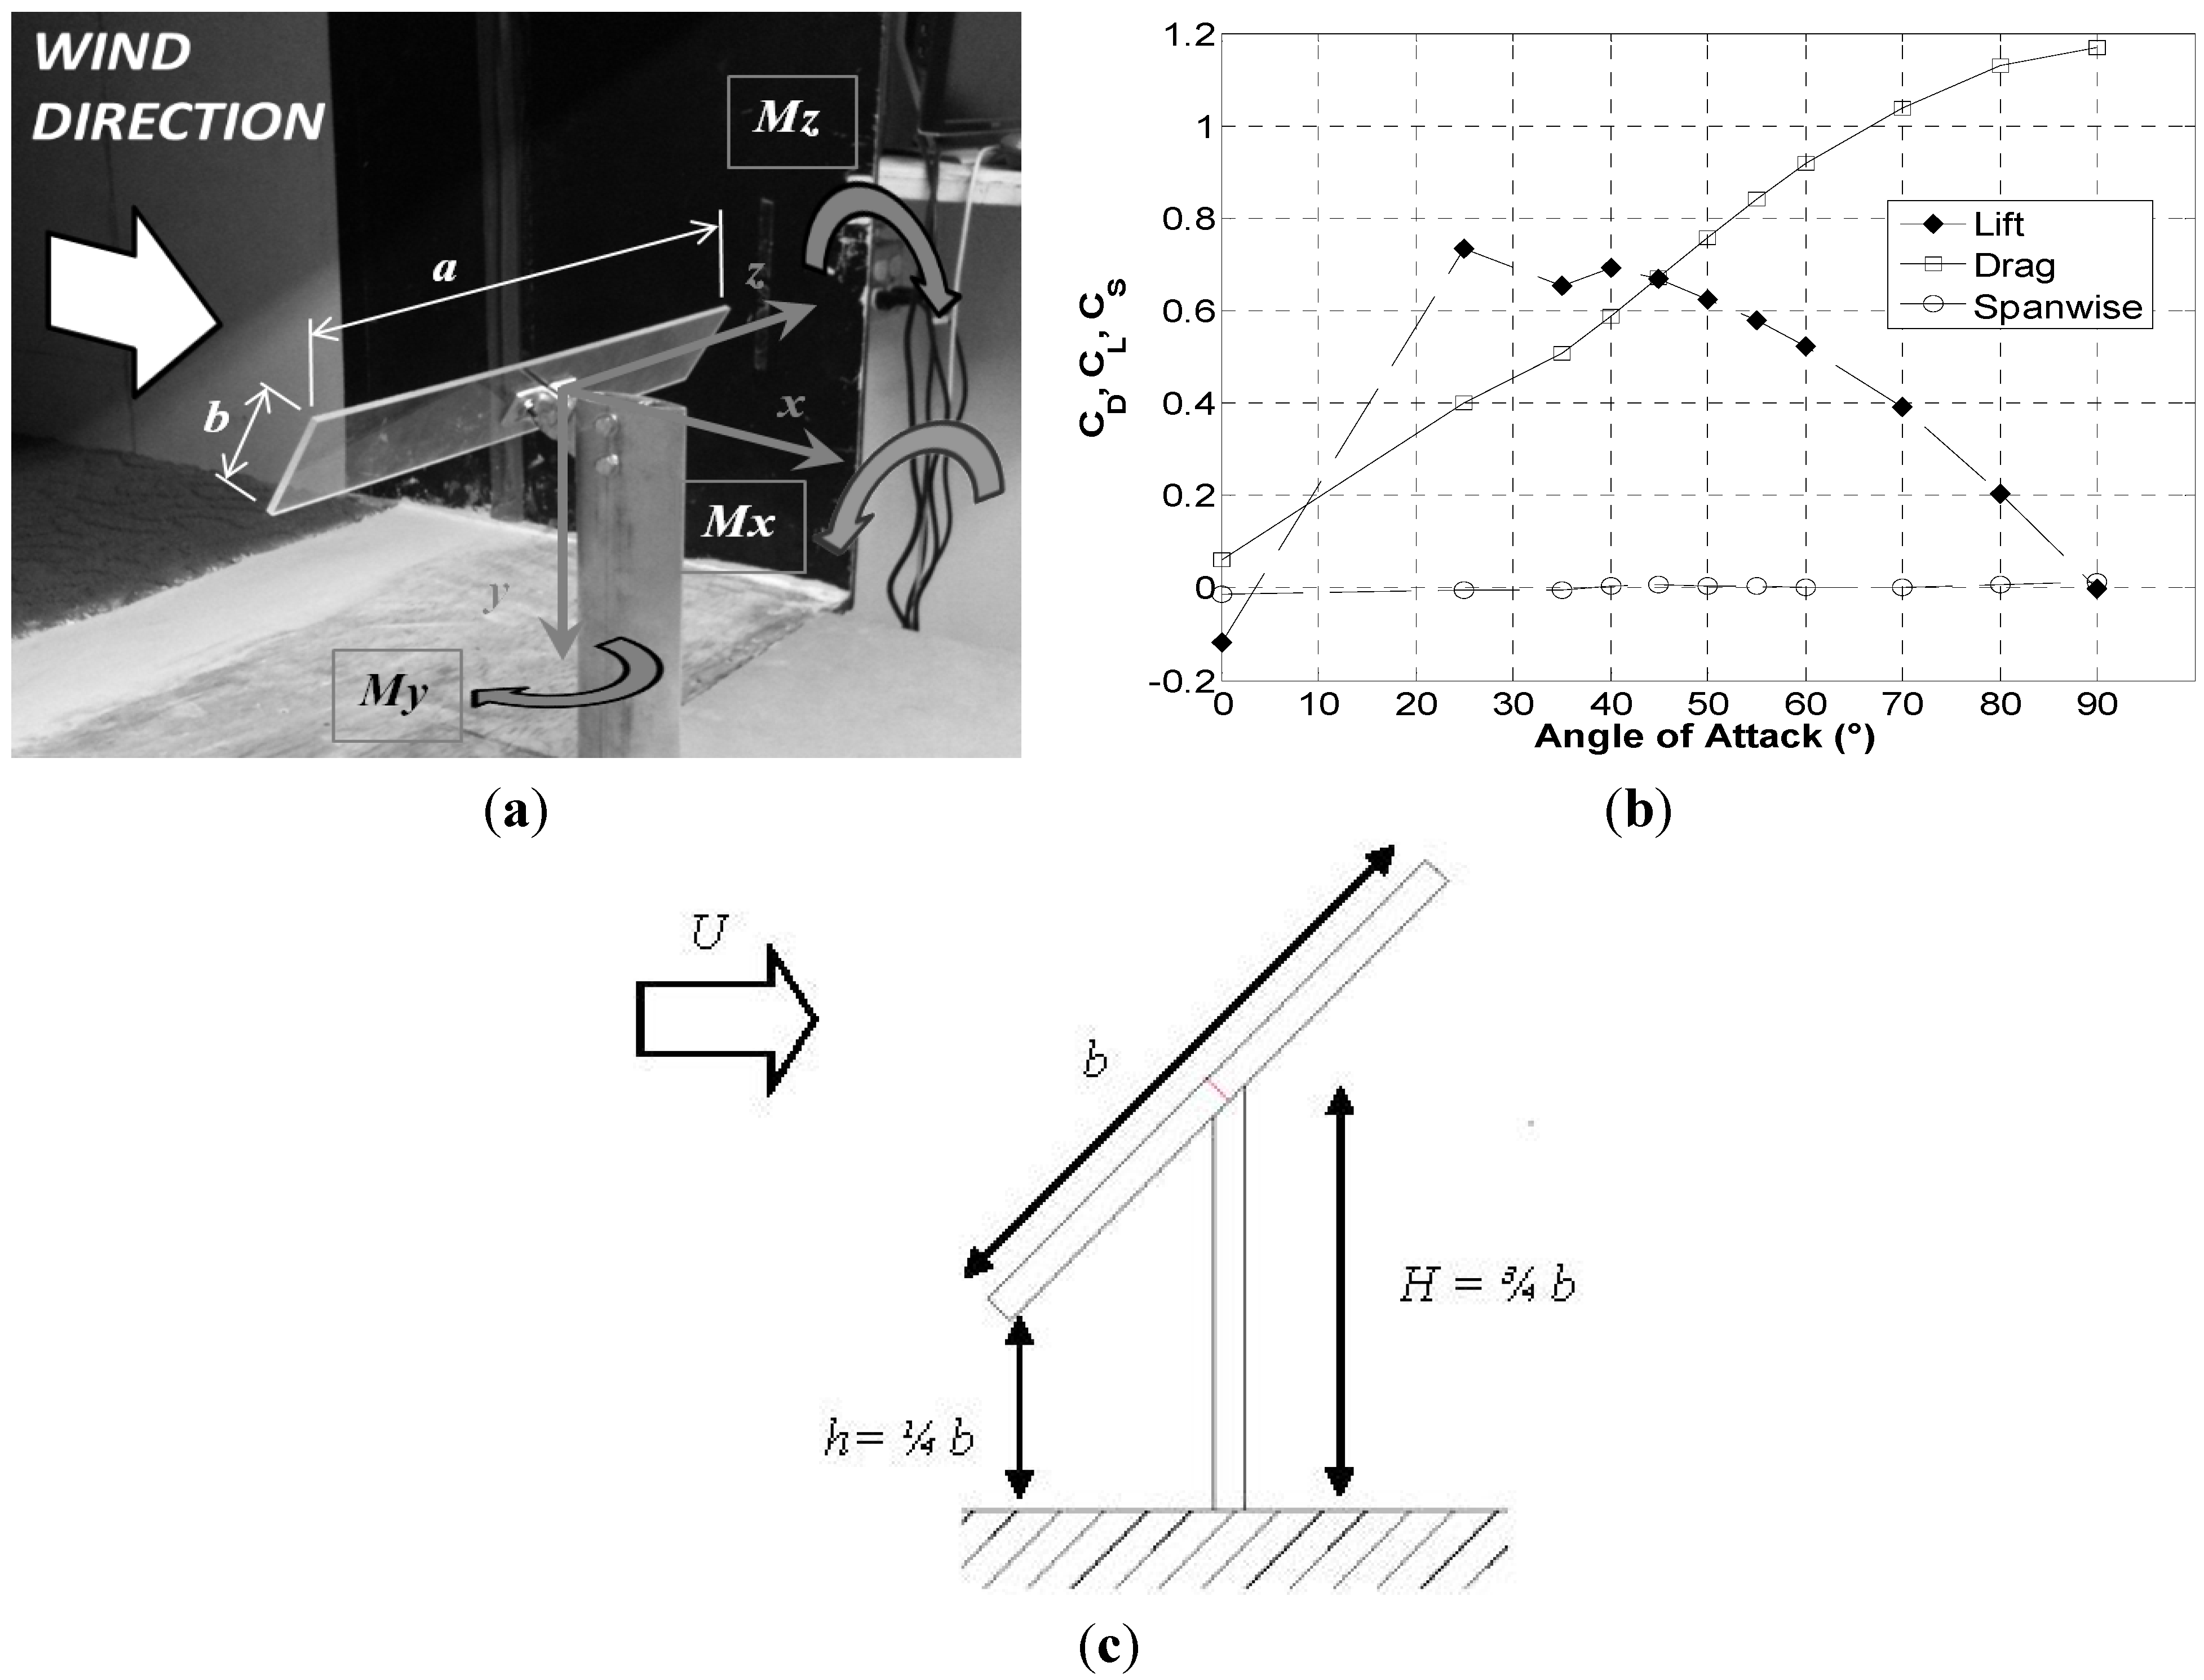
The flat plates were attached to the sting shown in
Figure 2a to simulate an open support structure for PV installations. The dimensions shown in
Figure 2a give the position closest to the wall for all plates. The sting was a streamline strut based on a National Advisory Committee on Aeronautics (NACA) 0009 section with a chord of 200 mm. Instantaneous forces and moments were measured by an ATI Gamma multi-axis force/torque sensor holding the sting to a solid frame. The force sensing range was 65 N in the
x-direction and the
y-direction, and 200 N in the
z-direction, as defined in
Figure 1. The moment sensing range was 5 N·m. Resolution was 1/80 N for force and 10/13333 N·m for torque. The frequency response was up to 40 kHz per channel. The sensor output signal in the range of ±10 V was connected to a National Instruments data acquisition board NI-DAQ USB 6212. The resolution of the board is 16 bit. One bit was used to transmit the sign (+ or −) of the signal, the other 15 were used to digitize the instantaneous value per channel, corresponding to a digital resolution of 0.61 mV. The sampling rate was 1 kHz. Forces and moments were recorded for 60 s using the NI LabView 2013 Signal Express Software. Matlab R2012a was used for data reduction.
Figure 2.
(a) Experimental stand showing a flat plate of AR = 3.58; (b) force coefficients as a function of angle of attack for AR = 3.58 in the free-stream; and (c) location of the plates at minimum distance from the wall.
Figure 2.
(a) Experimental stand showing a flat plate of AR = 3.58; (b) force coefficients as a function of angle of attack for AR = 3.58 in the free-stream; and (c) location of the plates at minimum distance from the wall.
Table 2.
Plate geometry and measured forces on a normal flat plate in the free stream.
Table 2.
Plate geometry and measured forces on a normal flat plate in the free stream.
| AR | a (m) | b (m) | t/√(ab) | Re | CD | CD from Equation (3) | CL | CS |
|---|
| 0.4 | 0.094 | 0.232 | 0.0430 | 1.18 × 10⁵ | 1.077 | 1.157 | 0.0168 | 0.0124 |
| 0.6 | 0.142 | 0.236 | 0.0347 | 1.78 × 10⁵ | 1.074 | 1.145 | 0.0164 | −0.023 |
| 1.0 | 0.168 | 0.168 | 0.0378 | 2.10 × 10⁵ | 1.067 | 1.14 | 0.0096 | −0.03 |
| 1.66 | 0.236 | 0.142 | 0.0347 | 1.78 × 10⁵ | 1.081 | 1.145 | 0.0111 | −0.015 |
| 2.48 | 0.232 | 0.094 | 0.0430 | 1.18 × 10⁵ | 1.101 | 1.157 | 0.1133 | 0.0004 |
| 3.58 | 0.364 | 0.101 | 0.0331 | 1.27 × 10⁵ | 1.169 | 1.178 | 0.0023 | −0.014 |
| 6.0 | 0.4 | 0.066 | 0.0391 | 8.27 × 10⁴ | 1.155 | 1.225 | 0.0201 | 0.0039 |
| 9.0 | 0.457 | 0.051 | 0.0416 | 6.39 × 10⁴ | 1.182 | 1.281 | 0.0227 | 0.0148 |
The
x-coordinate (and drag) is in the free-stream direction,
y, the direction of lift is normal, and
z is the spanwise direction parallel to the shortest side of the models for
AR < 1 and the longest side when
AR > 1, as shown in
Figure 2a. All moments are about the centre of the flat plate. Forces and moments acting on the sting were measured prior to the tests with the flat plate to allow these to be subtracted from the averaged measurements.
Typical measurements of all three average force coefficients as a function of angle of attack α, for
AR = 3.58, are shown in
Figure 2b. The results further demonstrate the adequacy of the experimental arrangement. Similar data were obtained for all plates.
Figure 2c defines the location of all the plates at their closest position to the wall. This is the location for the results designated as “minimum clearance” in the next section.
3. Time-Averaged Results
The present lift and drag measurements of normal plates in the free stream are summarized in
Table 2 where the drag coefficient,
CD, is compared to the equation given by ESDU 70015 [
9]:
Equation (3) expresses the fact that, in the absence of
Re effects, the drag on a normal plate of
AR = a/b, is the same as on a plate of the “complementary”
AR = b/a. The measured
CD is in reasonable agreement with Equation (3); the difference is 6.9% at the lowest
AR and 7.7% at the highest.
CS in
Table 2 is the spanwise force coefficient, which, along with
CL, should be zero. In general, both
CS and
CL were significantly smaller than the drag coefficient.
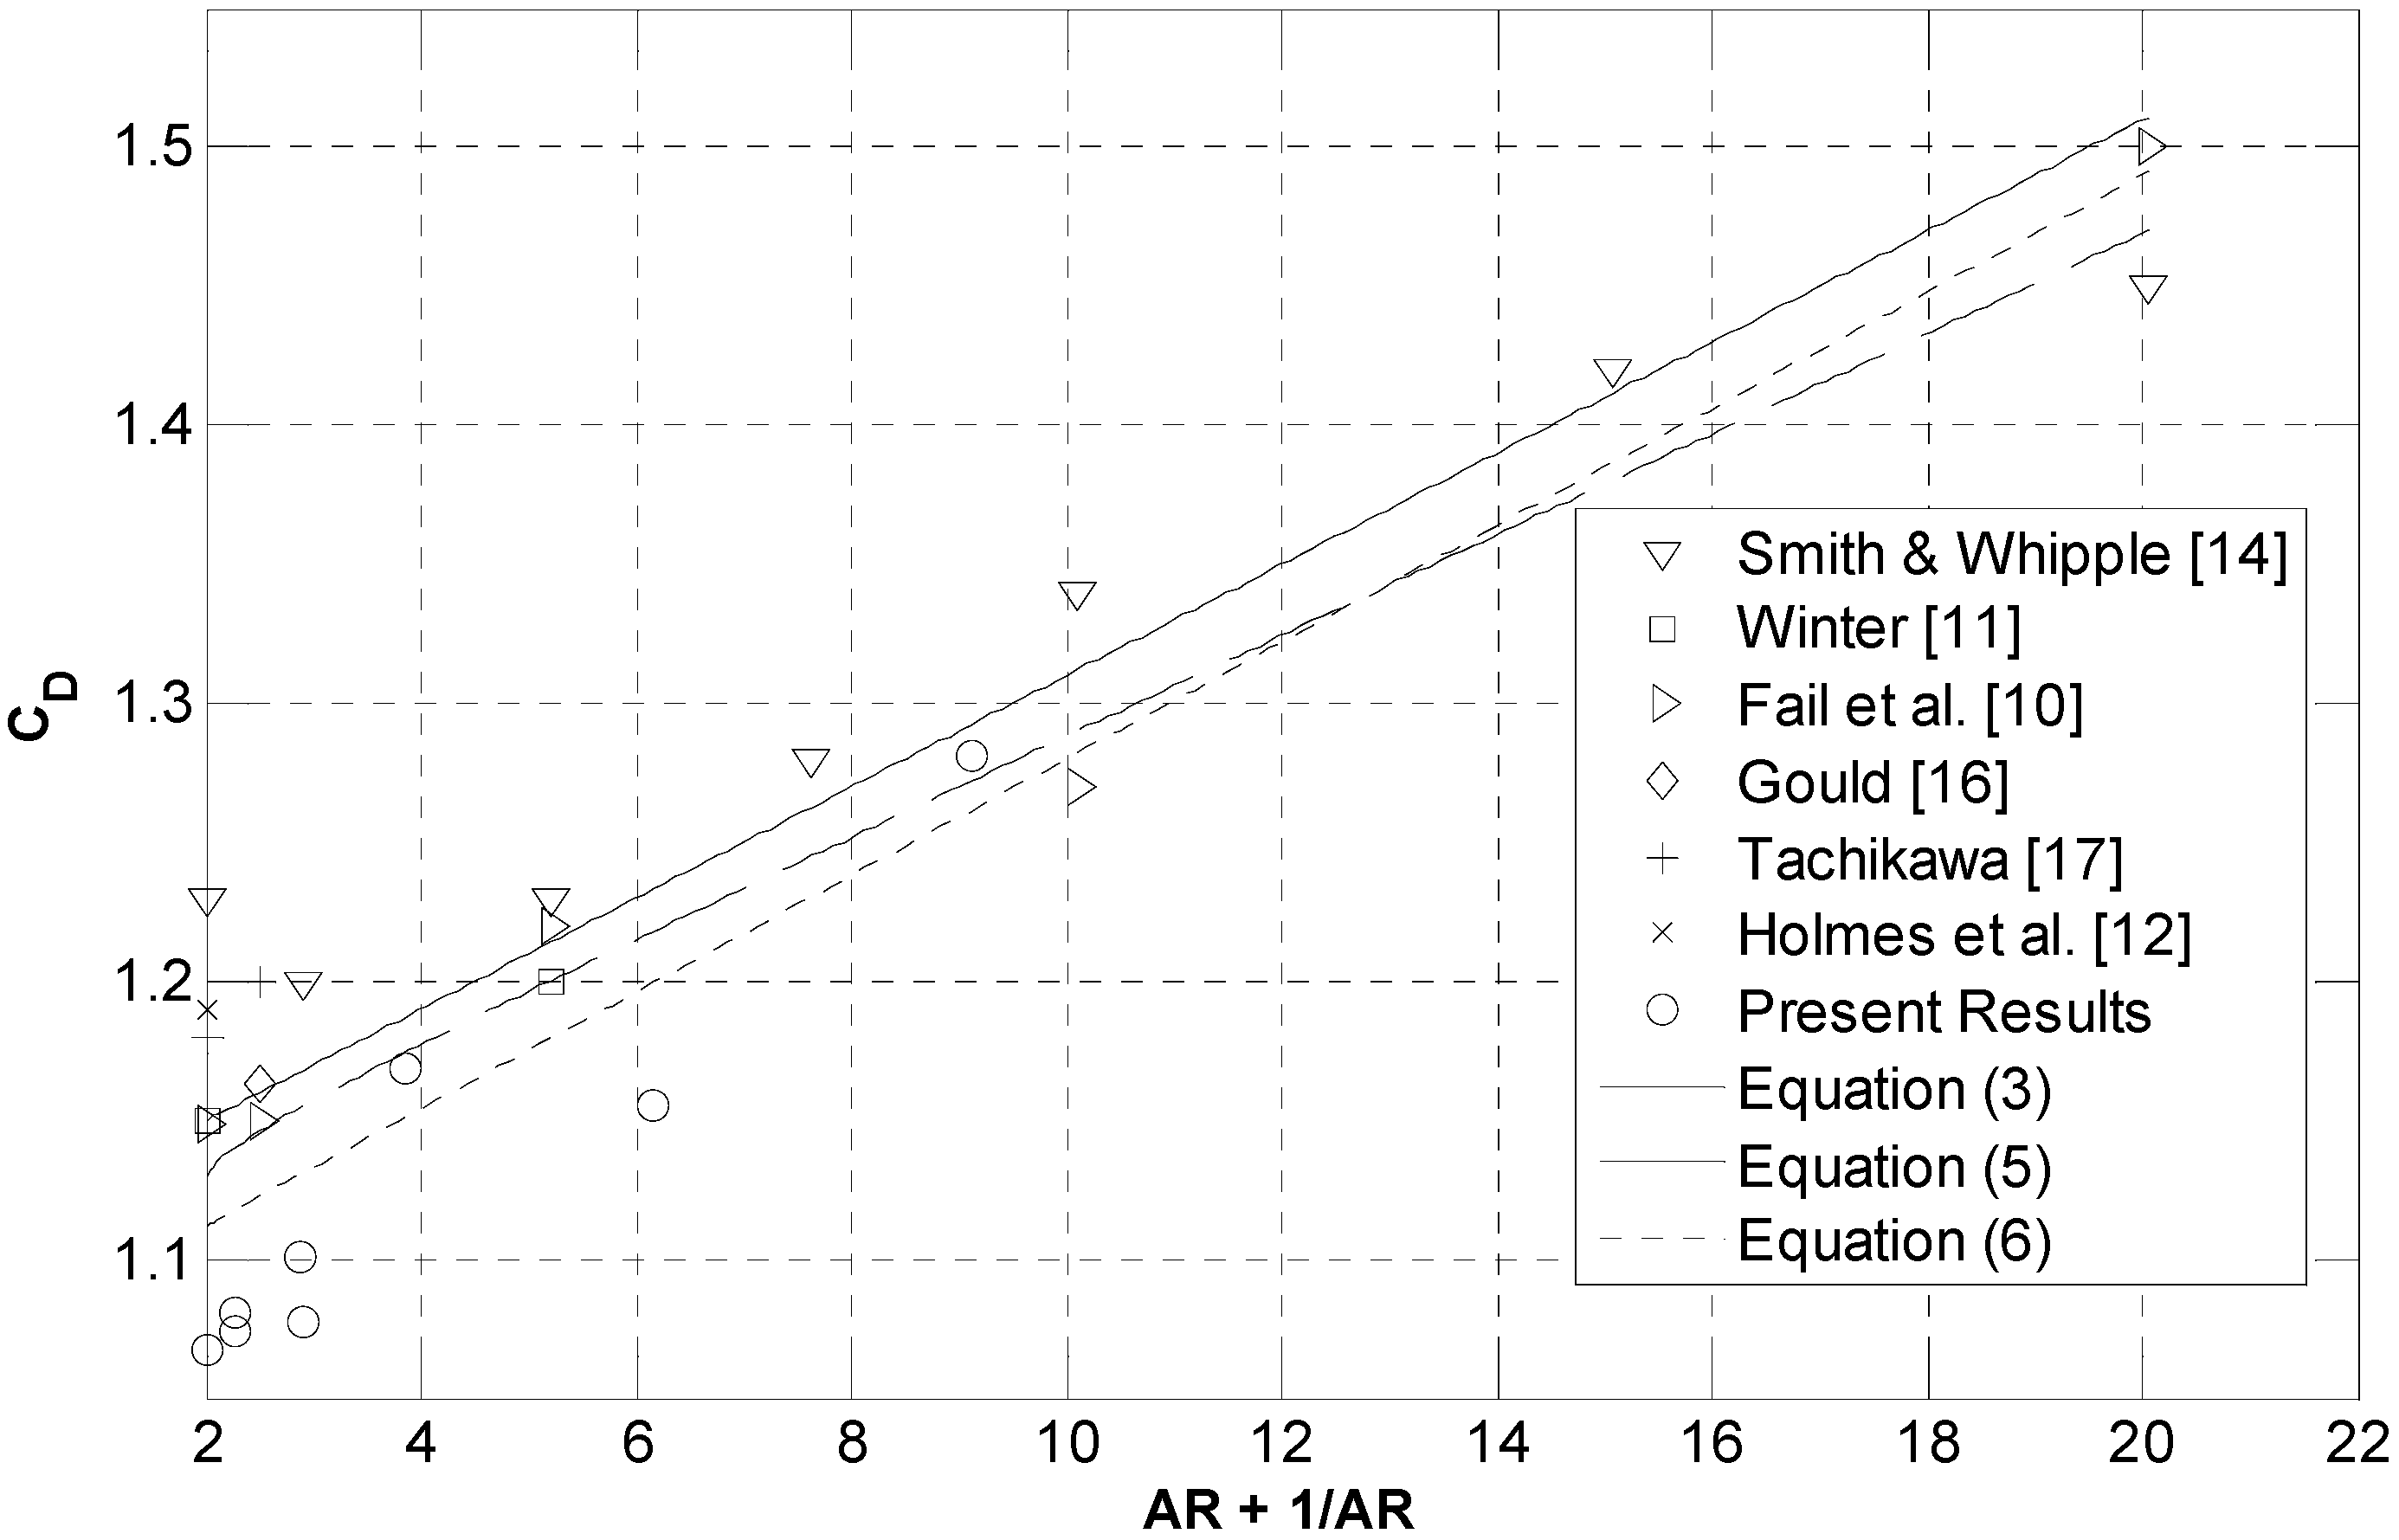
Figure 3 shows the lift and drag results from
Table 2 in comparison to all previous results that the authors could find. The data from Smith & Whipple [
14] are reproduced in Hoerner [
15]. Fail
et al. [
10] provided the measurements that were presumably used to develop Equation (3). Gould [
16] used normal plates with
AR = 1 of varying sizes to investigate blockage corrections. His blockage correction gives the corrected drag coefficient,
CDc, as:
Showing that blockage increases the drag. It is likely, but not entirely certain, that the results of Fail
et al. [
10] and Gould [
16] are the only ones corrected for blockage in
Figure 3. Tachikawa [
17] was interested, like Holmes
et al. [
12], in wind-blown debris. There is considerable scatter in the results near
AR = 1 which may be a result of the difficulties in holding square plates in comparison to those of higher
AR, particularly the errors in removing the sting drag, details of which were not given in the papers referred to. The other equations shown in the figure are:
which was used to develop the well-known Viterna and Corrigan [
18] model for wind turbine blade lift and drag in the post-stall region, see e.g., Wood [
1]. The final curve is:
which is biased towards the present results close to
AR = 1.
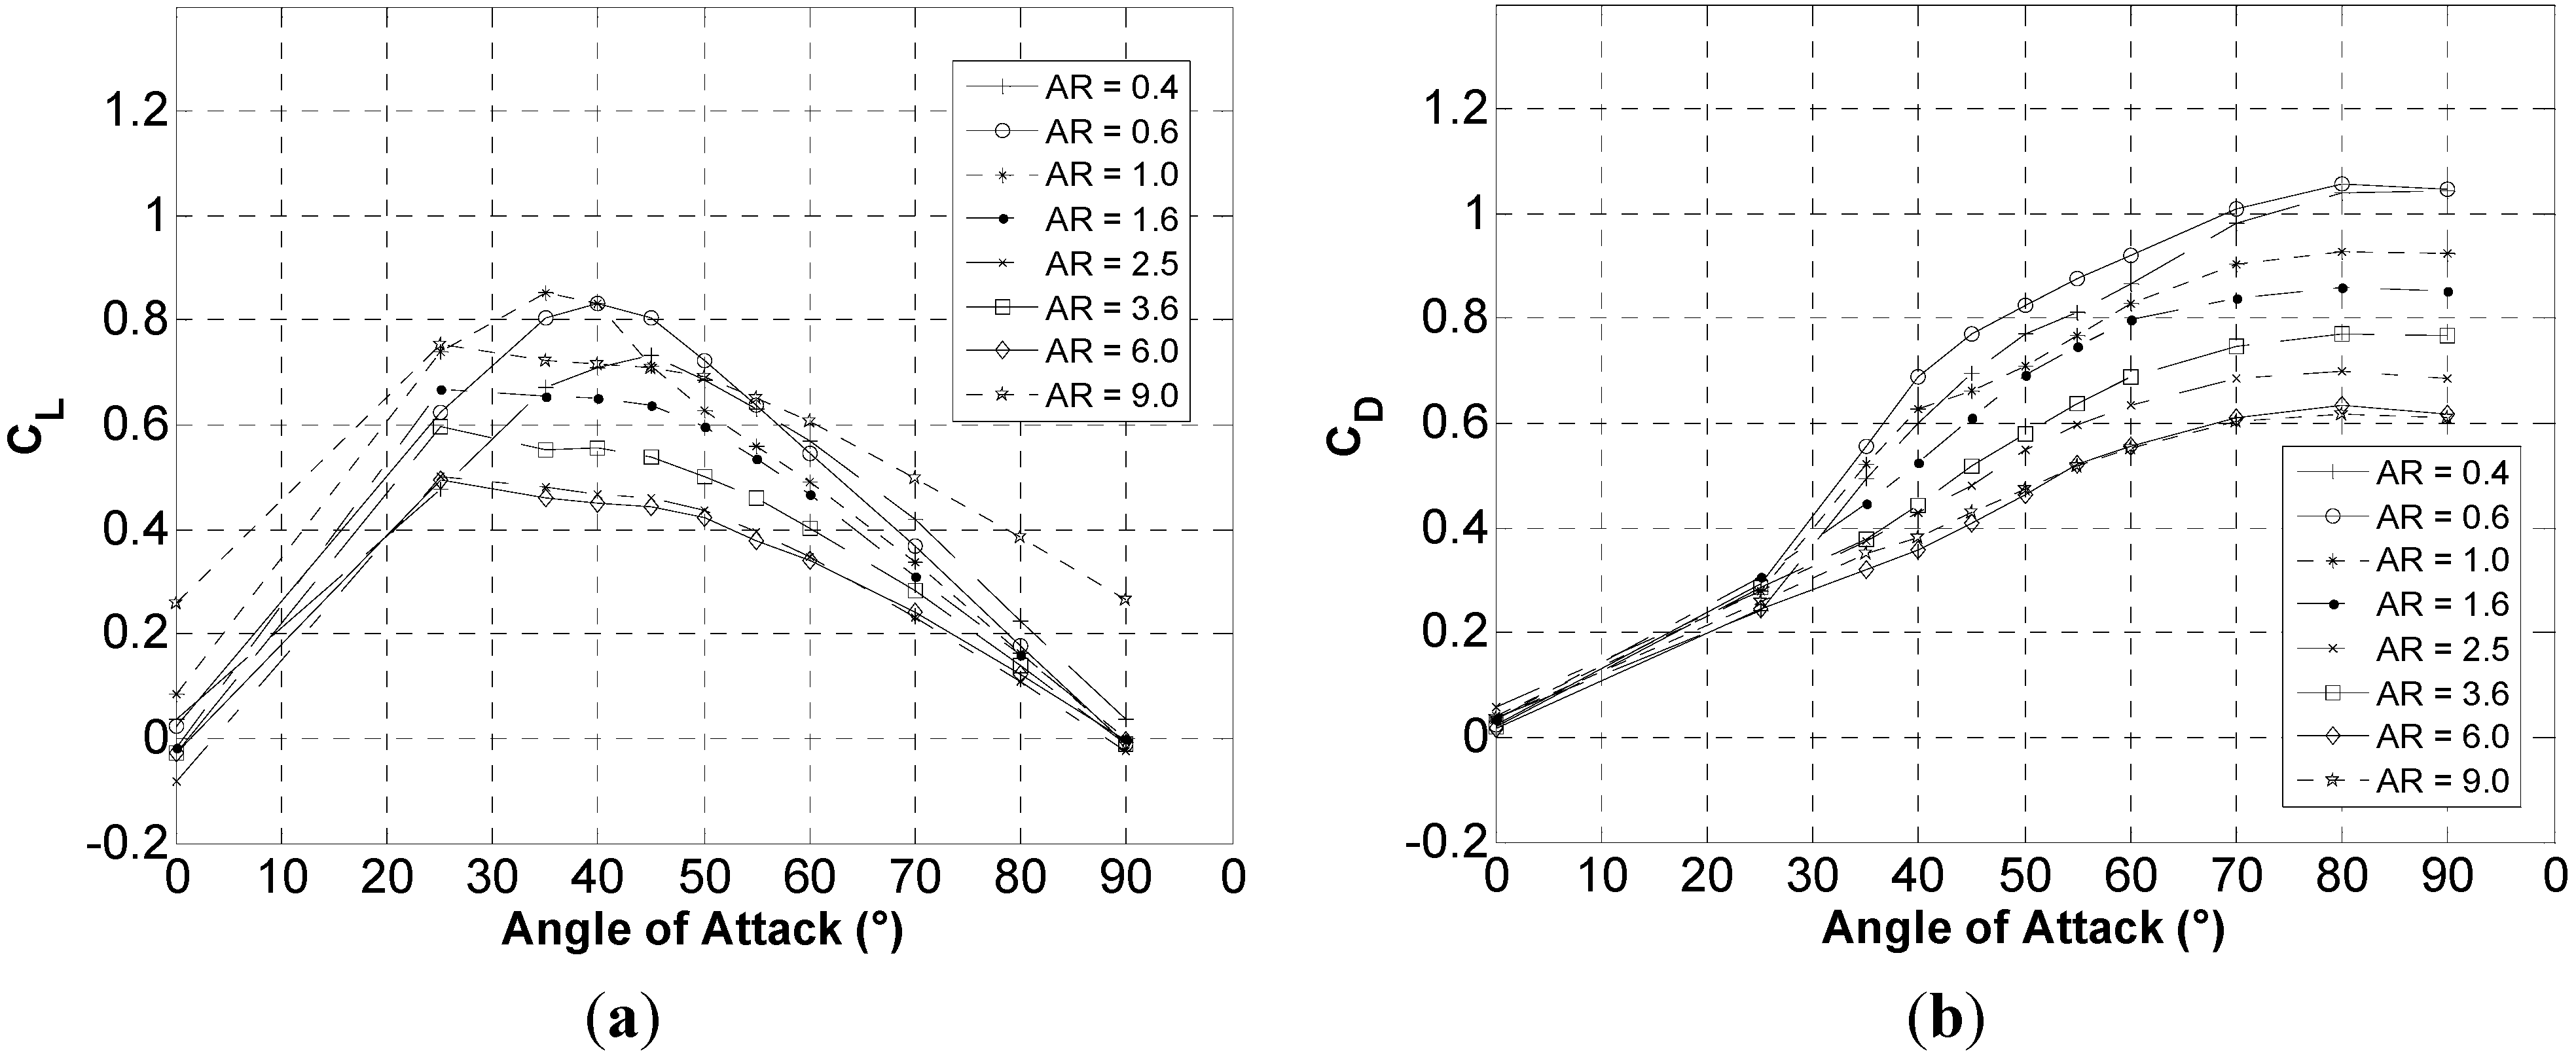
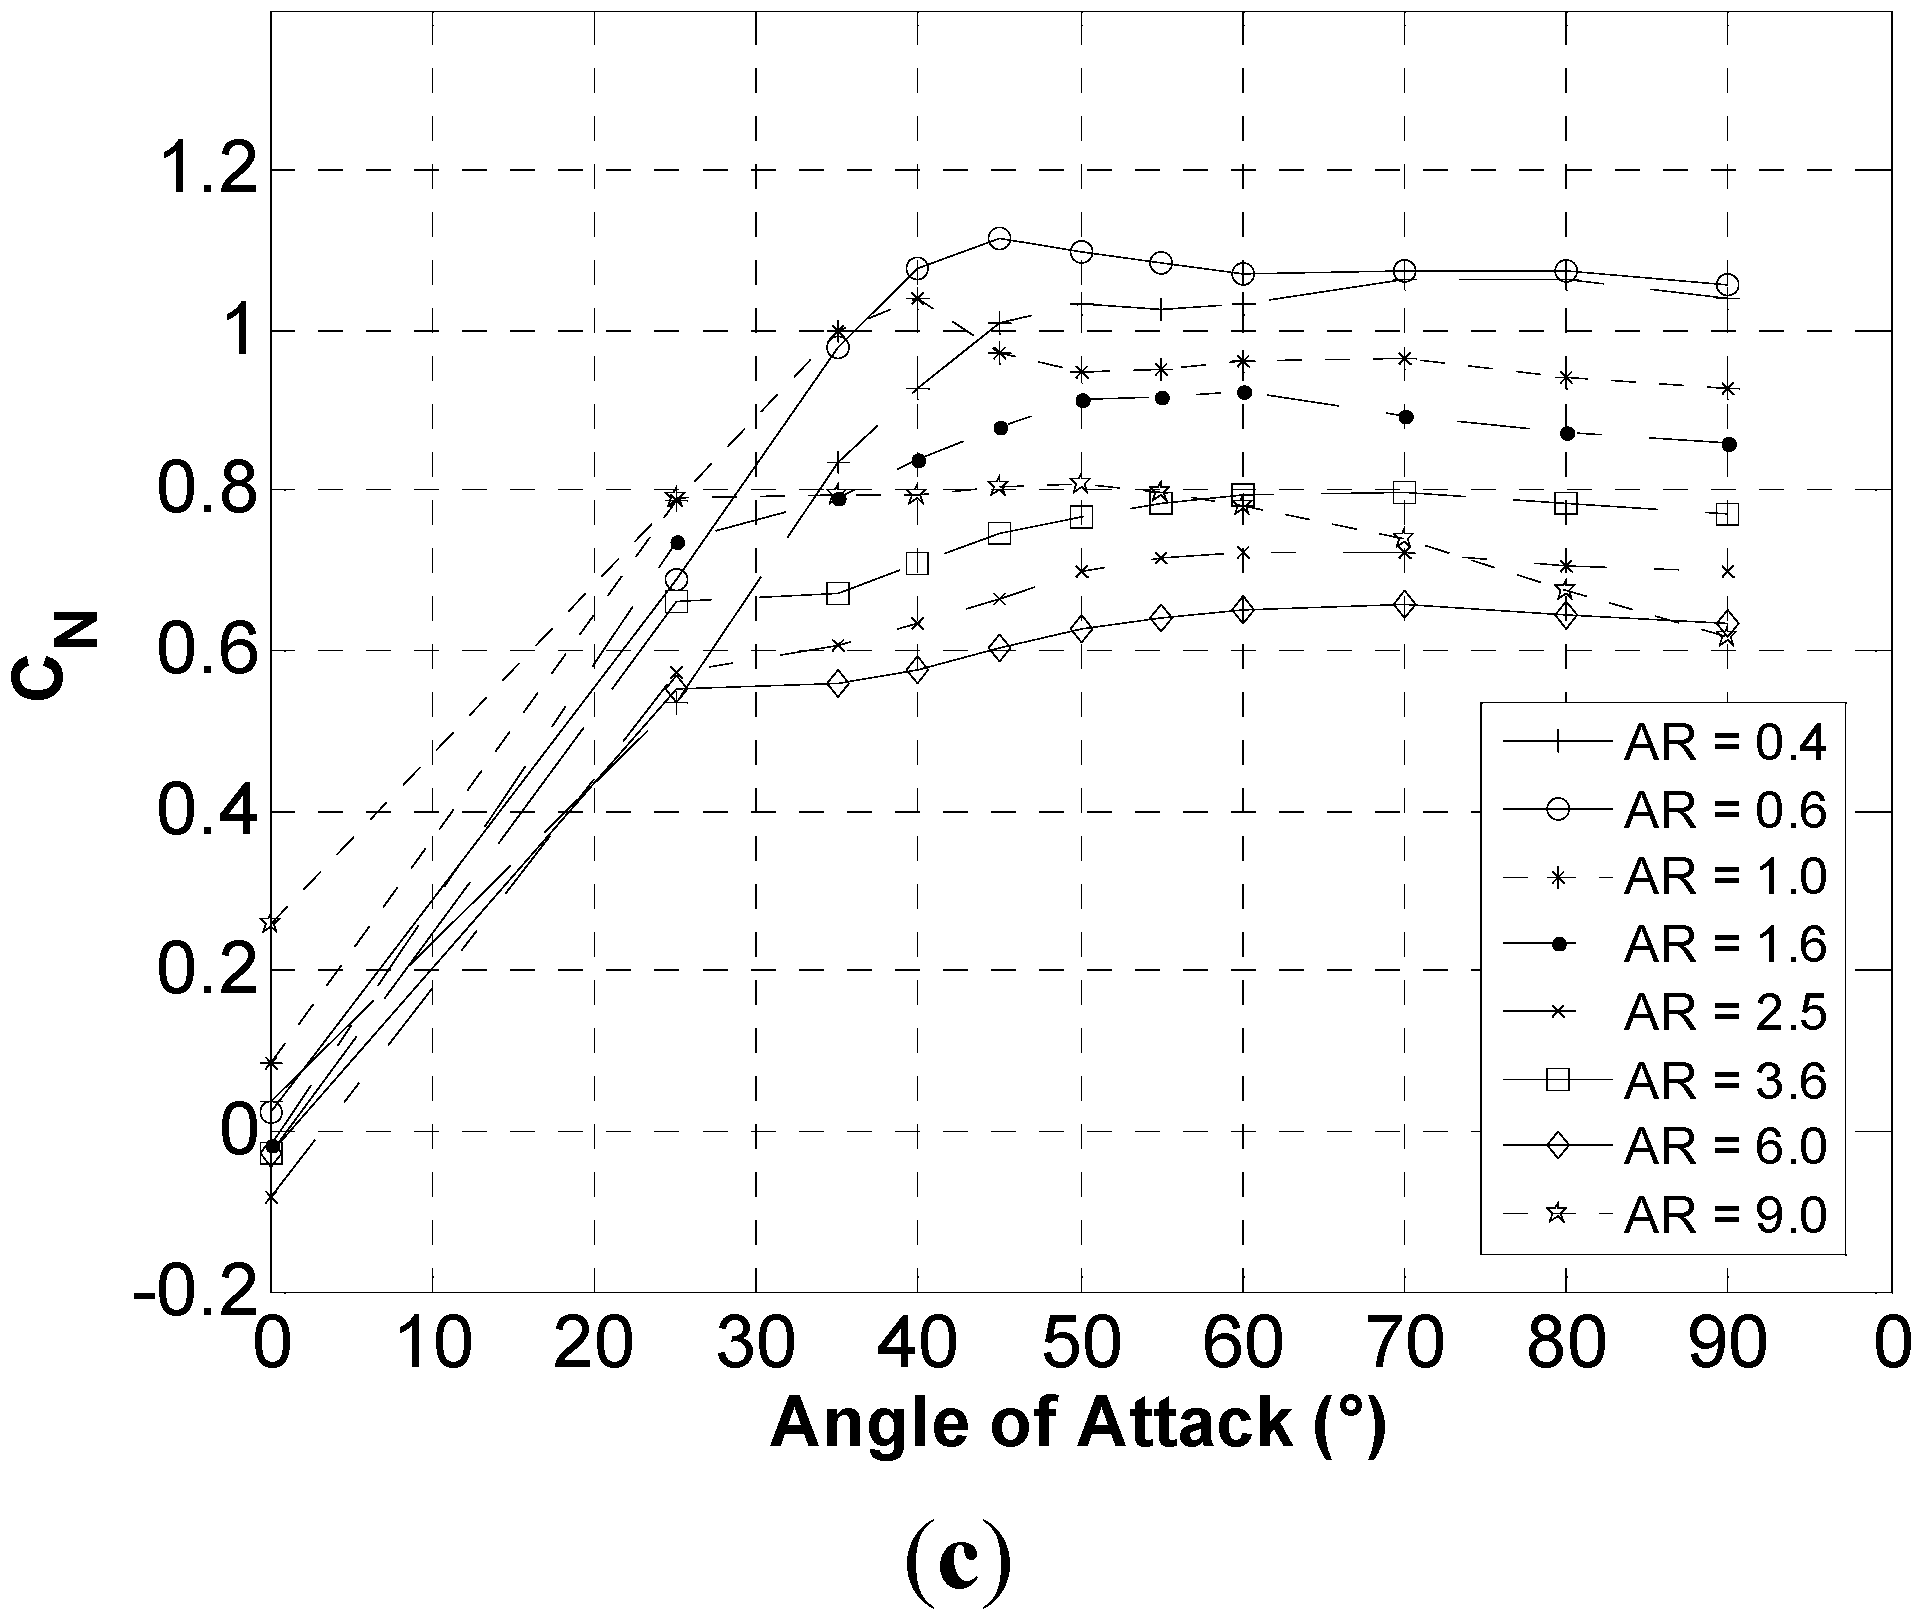
Figure 4 presents the lift, drag, and normal force coefficient,
CN, in the free-stream as a function of α. The coefficients were determined using the model surface area
ab,
not the projected area. In all cases
CL should be zero for α = 0, but this is not the case, especially at the higher
AR, probably because of the increased difficulty in accurately setting up the models as
AR increases.
Figure 3.
Measurements and correlations of the drag of normal flat plates as a function of aspect ratio.
Figure 3.
Measurements and correlations of the drag of normal flat plates as a function of aspect ratio.
Figure 4.
(a) Free-stream lift; (b) drag; and (c) normal force coefficient, as a function of AR and α.
Figure 4.
(a) Free-stream lift; (b) drag; and (c) normal force coefficient, as a function of AR and α.
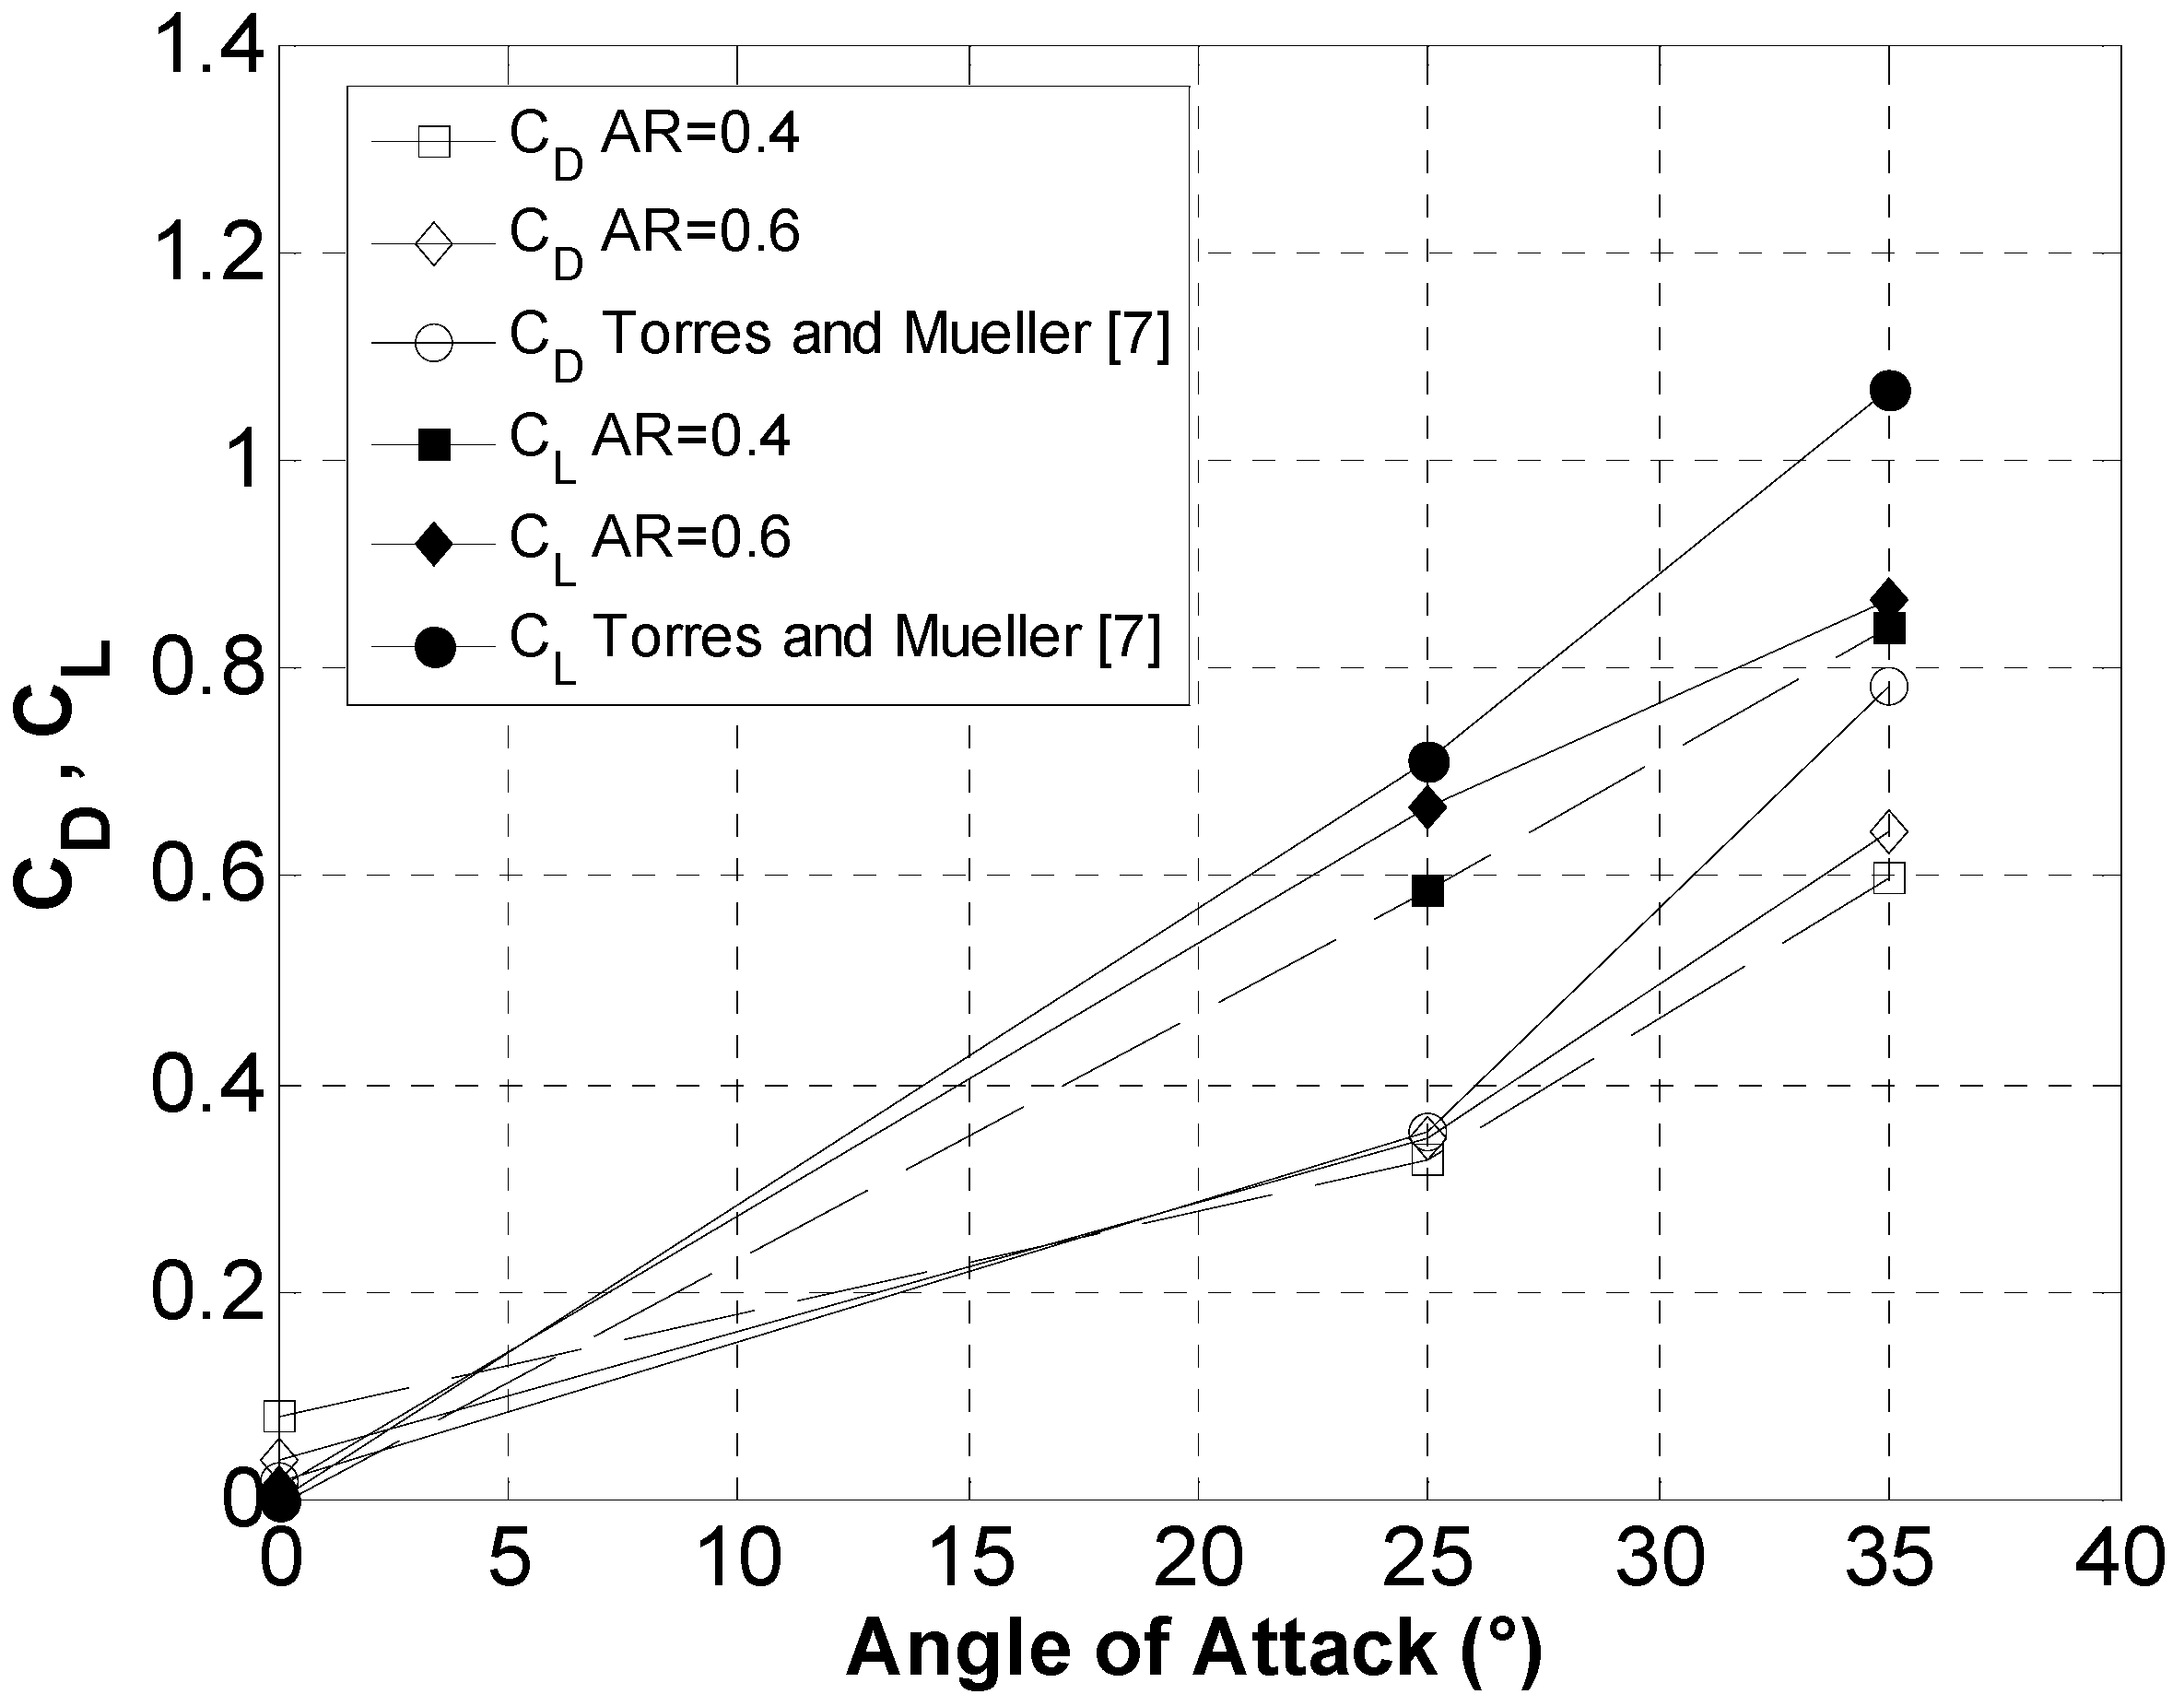
Figure 5 compares the
AR = 0.4 and 0.6 results with those for
AR = 0.5 from Torres and Mueller [
8].
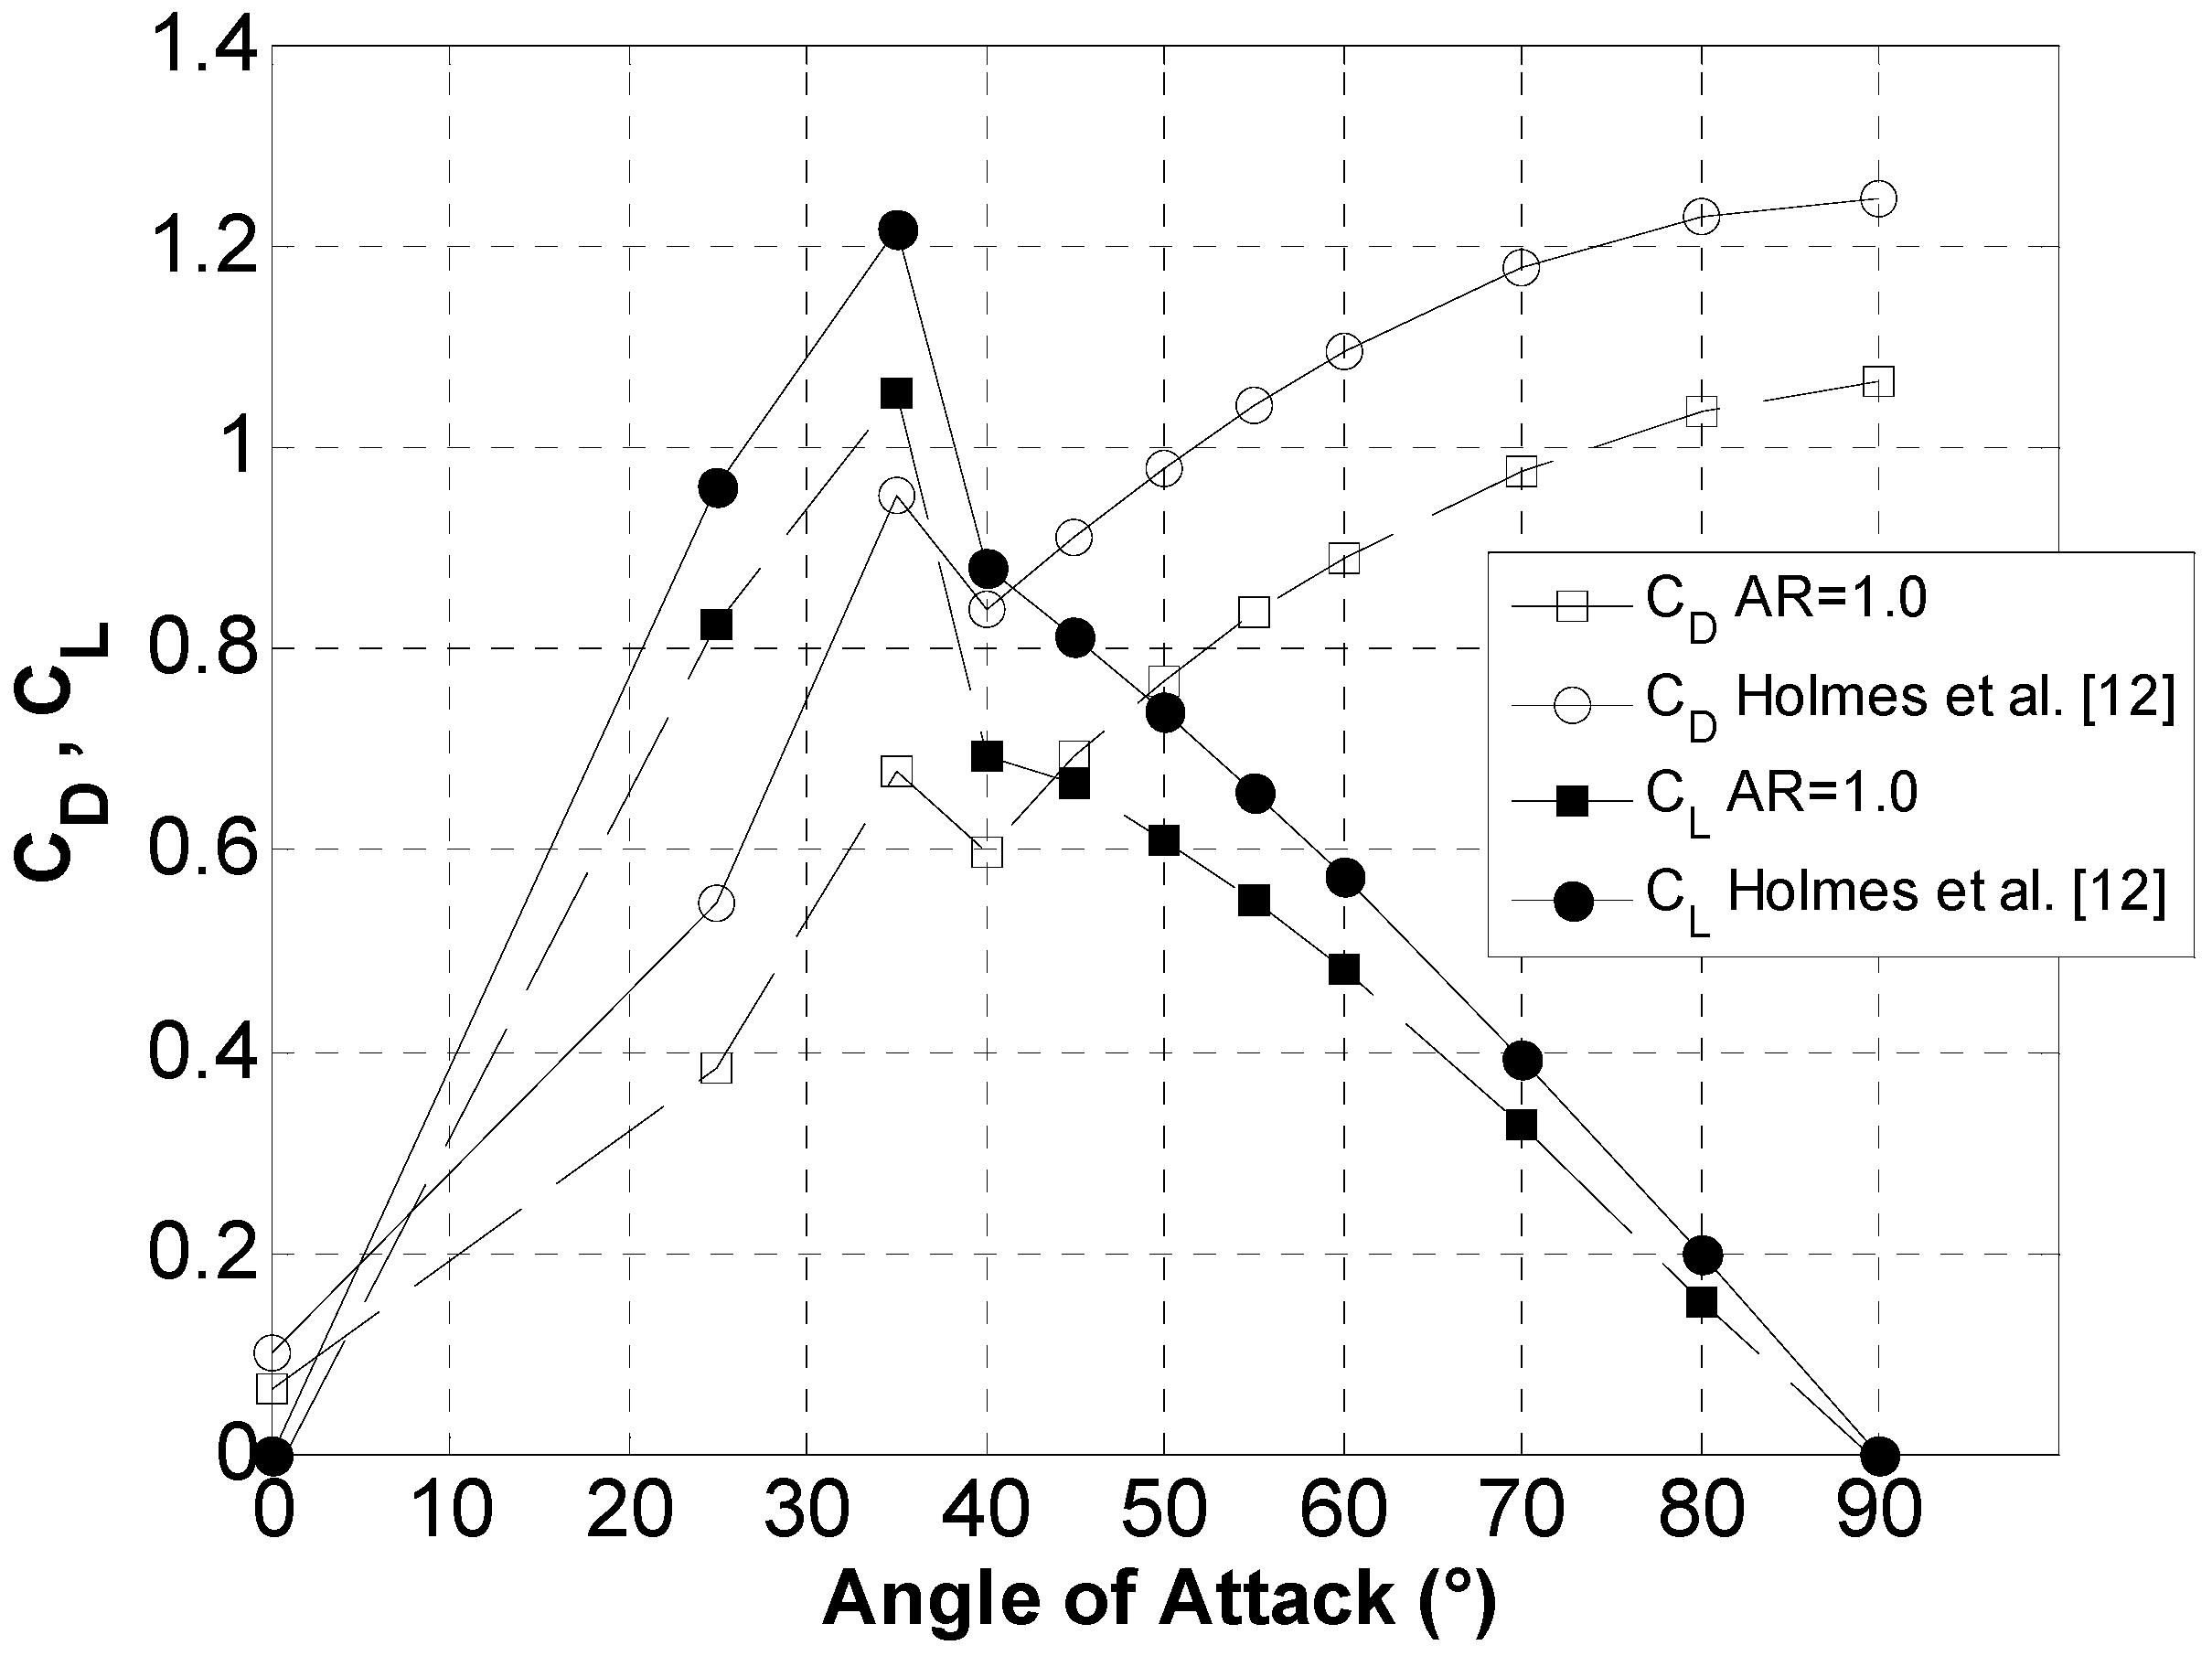
Figure 6 compares the
CL and
CD for
AR = 1 with the equations of fit given by Holmes
et al. [
12]. The differences from the previous results are real, but about equal to the scatter from the four different measurements shown for
AR = 1.0 by Holmes
et al. [
12]. Interestingly their peaks in lift and drag occur at nearly equal angles to the present results. These peaks move to lower angles and eventually disappear as
AR increases and the stall angle, as inferred for example from
Table 1, decreases.
Figure 4c shows the normal force coefficient. For
AR = 1, Holmes
et al. [
12] assume a constant
CN ~1.15 for α > 40°.
Figure 5.
Free stream CL and CD for AR = 0.4 and AR = 0.6 compared with Equations (1a) and (1b).
Figure 5.
Free stream CL and CD for AR = 0.4 and AR = 0.6 compared with Equations (1a) and (1b).
Figure 6.
Free stream
CL and
CD for
AR = 1.0 compared with Equations (1) and (2) from Holmes
et al. [
12].
Figure 6.
Free stream
CL and
CD for
AR = 1.0 compared with Equations (1) and (2) from Holmes
et al. [
12].
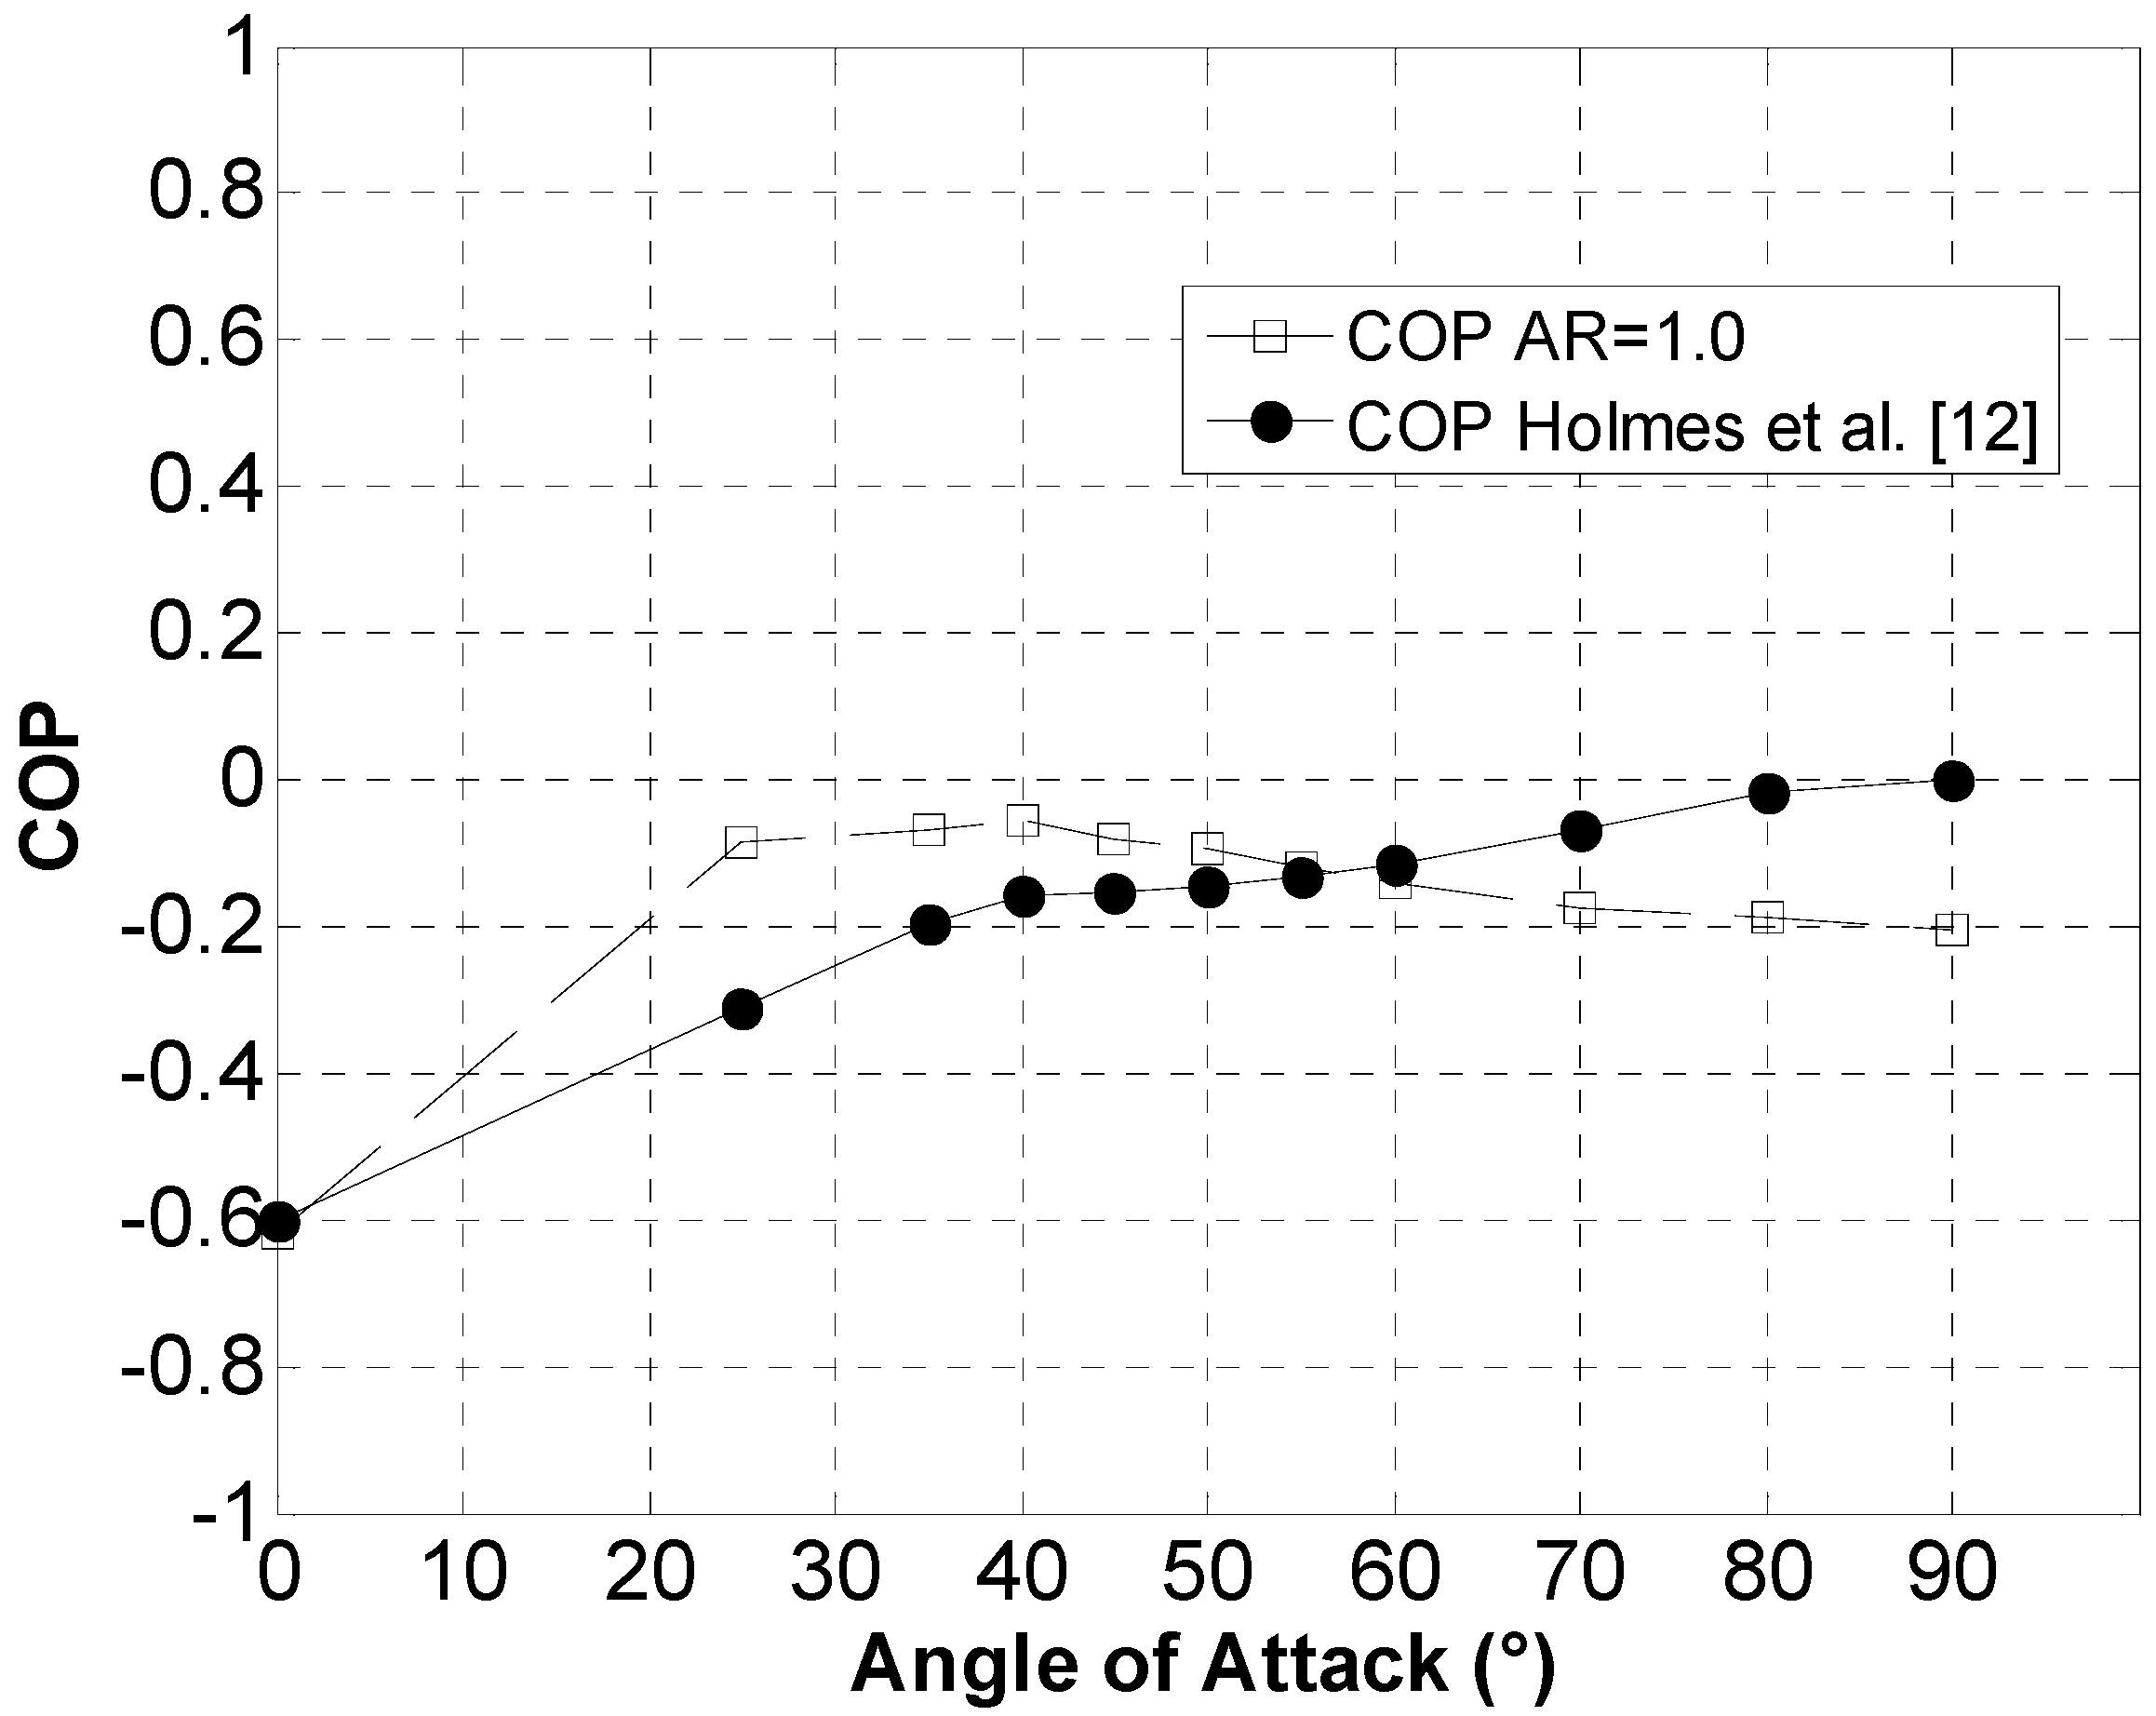
The present centre of pressure (
CoP) results are compared in
Figure 7 with the lines of fit from Holmes
et al. [
12] for
AR = 1. The
CoP is normalized such that −1 indicates the leading edge, 0 the midpoint of the plate, and 1 the trailing edge. The present results are in error at large α, which we attribute to the sensitivity of the flow to slight errors in α at large angles.
Figure 4 shows that lift at 90° is generally close to zero but the small departures are consistent with the
CoP trend in
Figure 7. That the average lift is zero indicates that there was no problem with aligning the
x-axis with the direction of wind flow in the tunnel.
Figure 7.
Free stream
CoP for
AR = 1.0 compared with Equation (5) from Holmes
et al. [
12].
Figure 7.
Free stream
CoP for
AR = 1.0 compared with Equation (5) from Holmes
et al. [
12].
Figure 8 shows the lift and drag coefficients at closest proximity to the tunnel floor, for which there are no previous data for comparison. In all cases the drag is reduced but the lift behavior is more complex and non-monotonic in
AR. It is possible for the lift at zero angle to be negative in the presence of the mean velocity gradient but the extent of the departure from zero is possibly high. The main effect of
AR on
CD occurs after α = 25°.
Figure 8.
(a) Drag; (b) lift; and (c) normal coefficient at minimum clearance as a function of AR and α.
Figure 8.
(a) Drag; (b) lift; and (c) normal coefficient at minimum clearance as a function of AR and α.
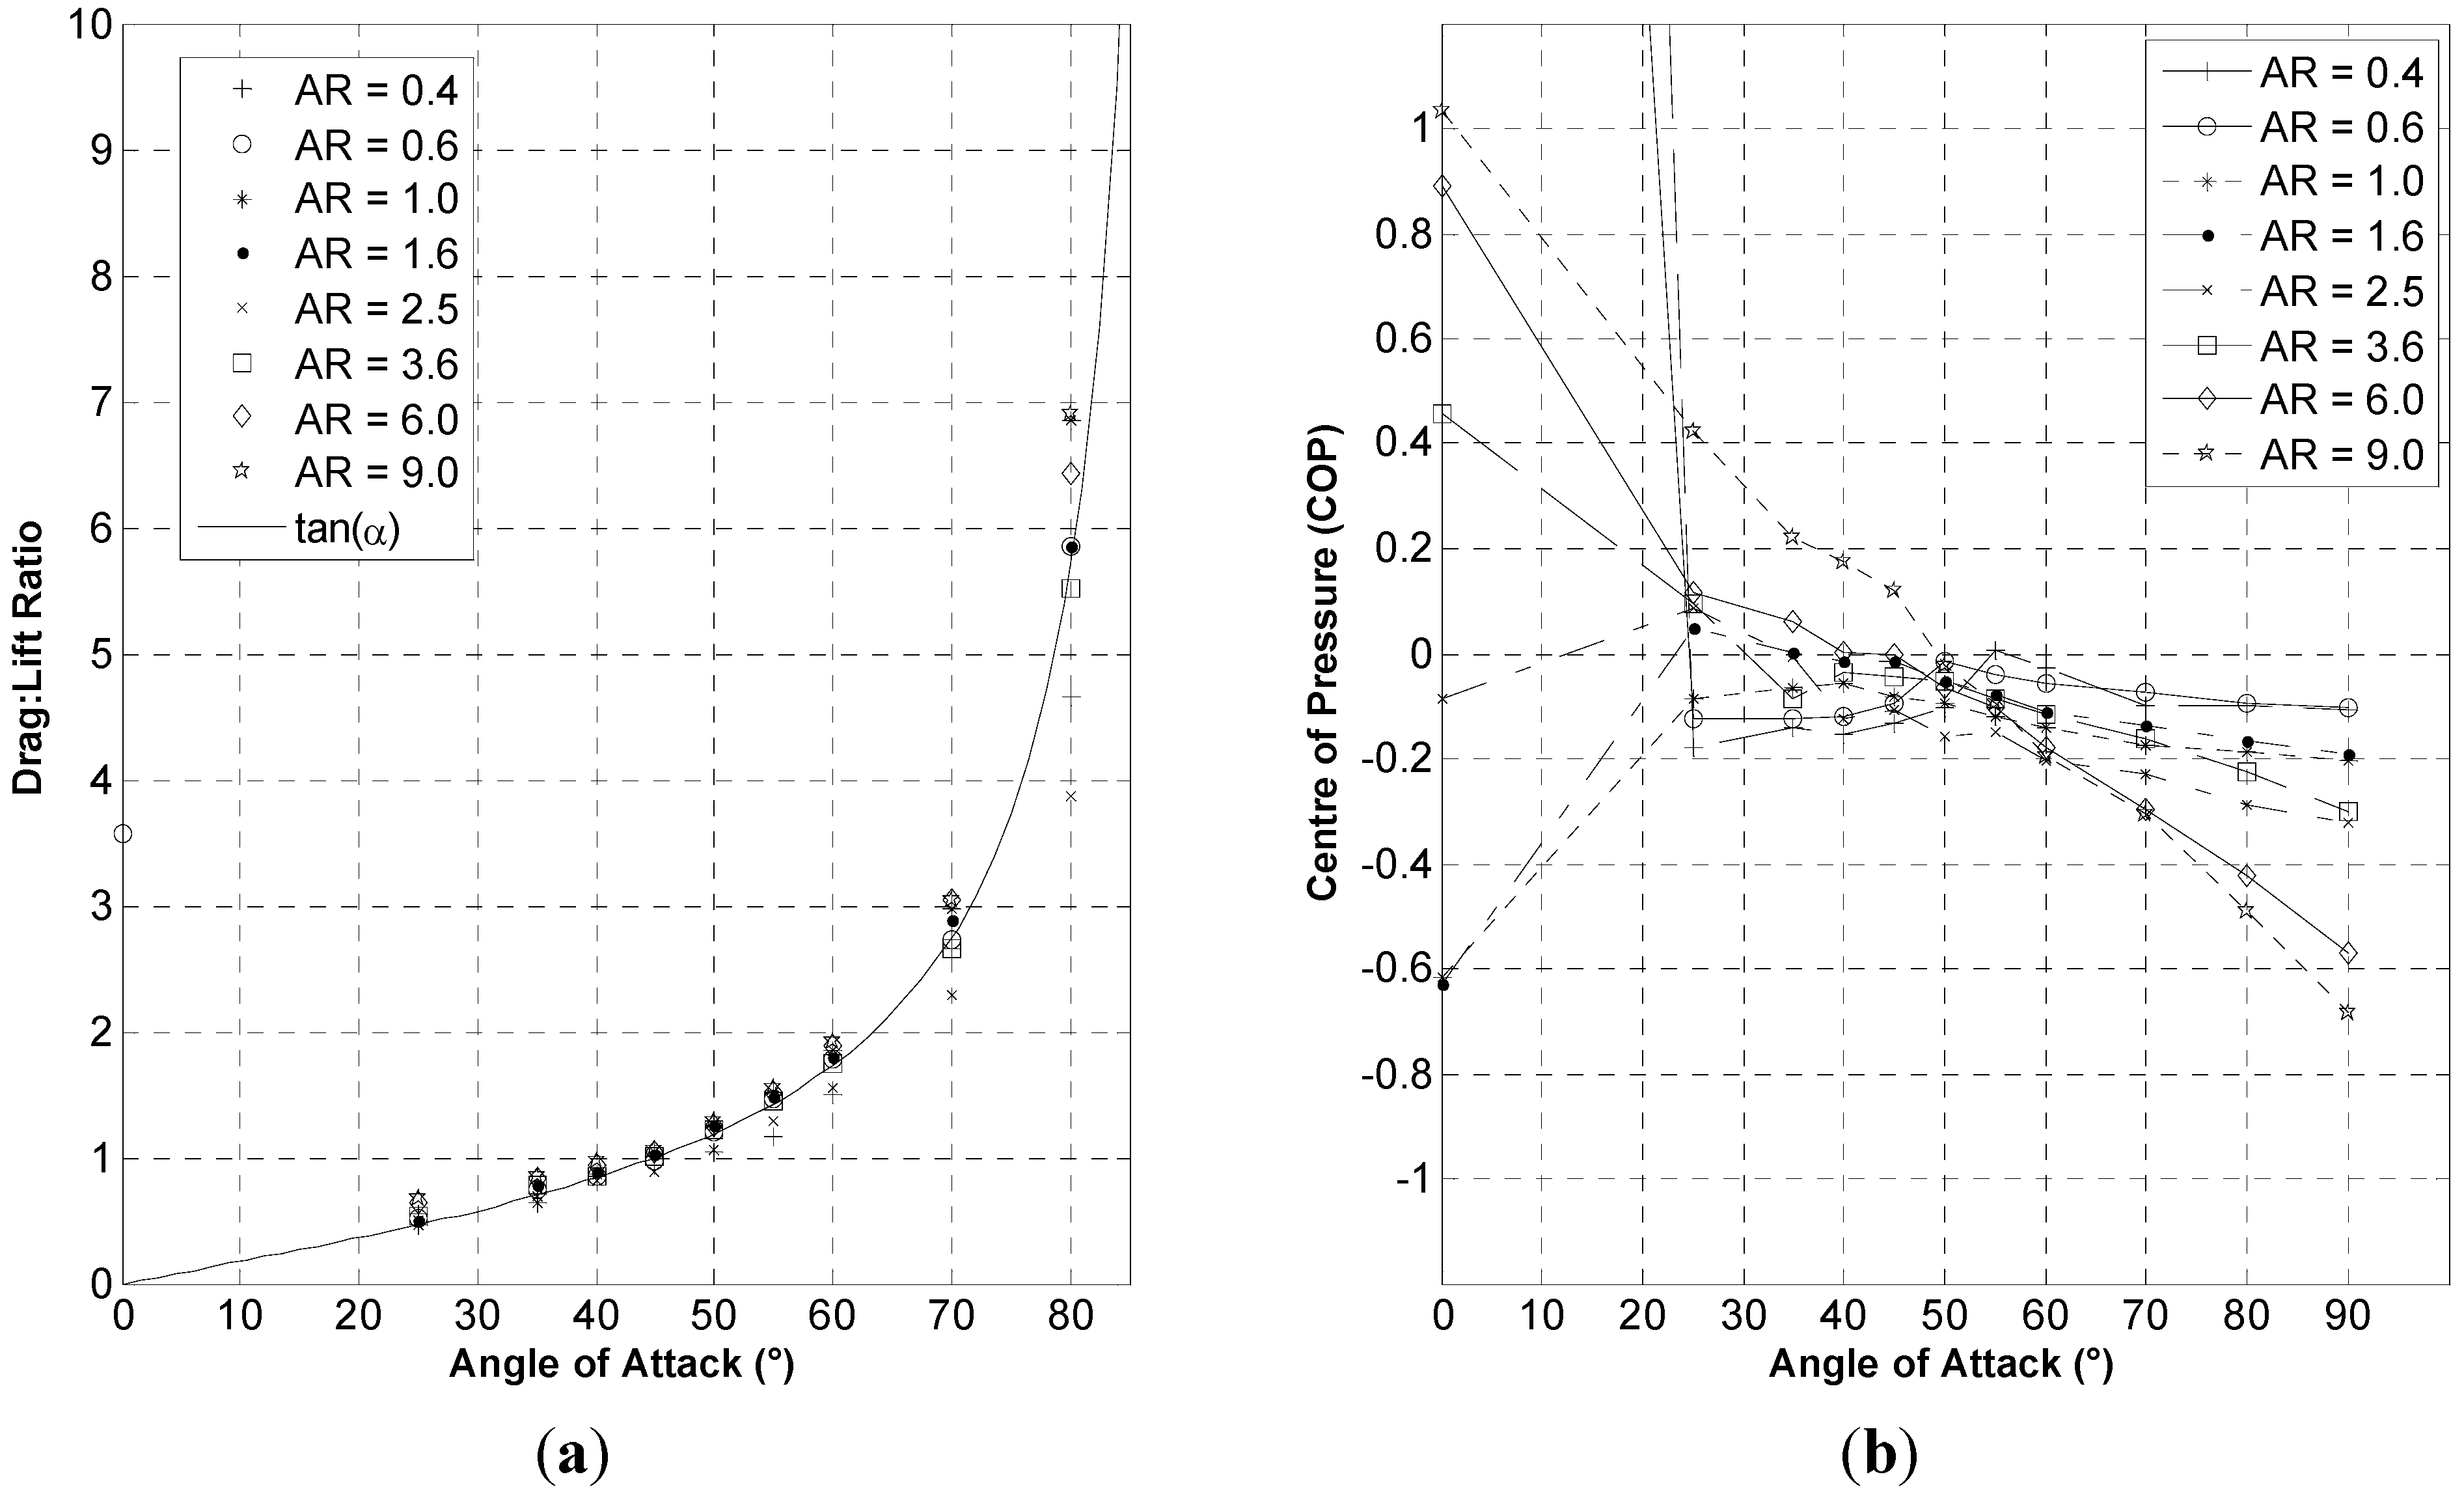
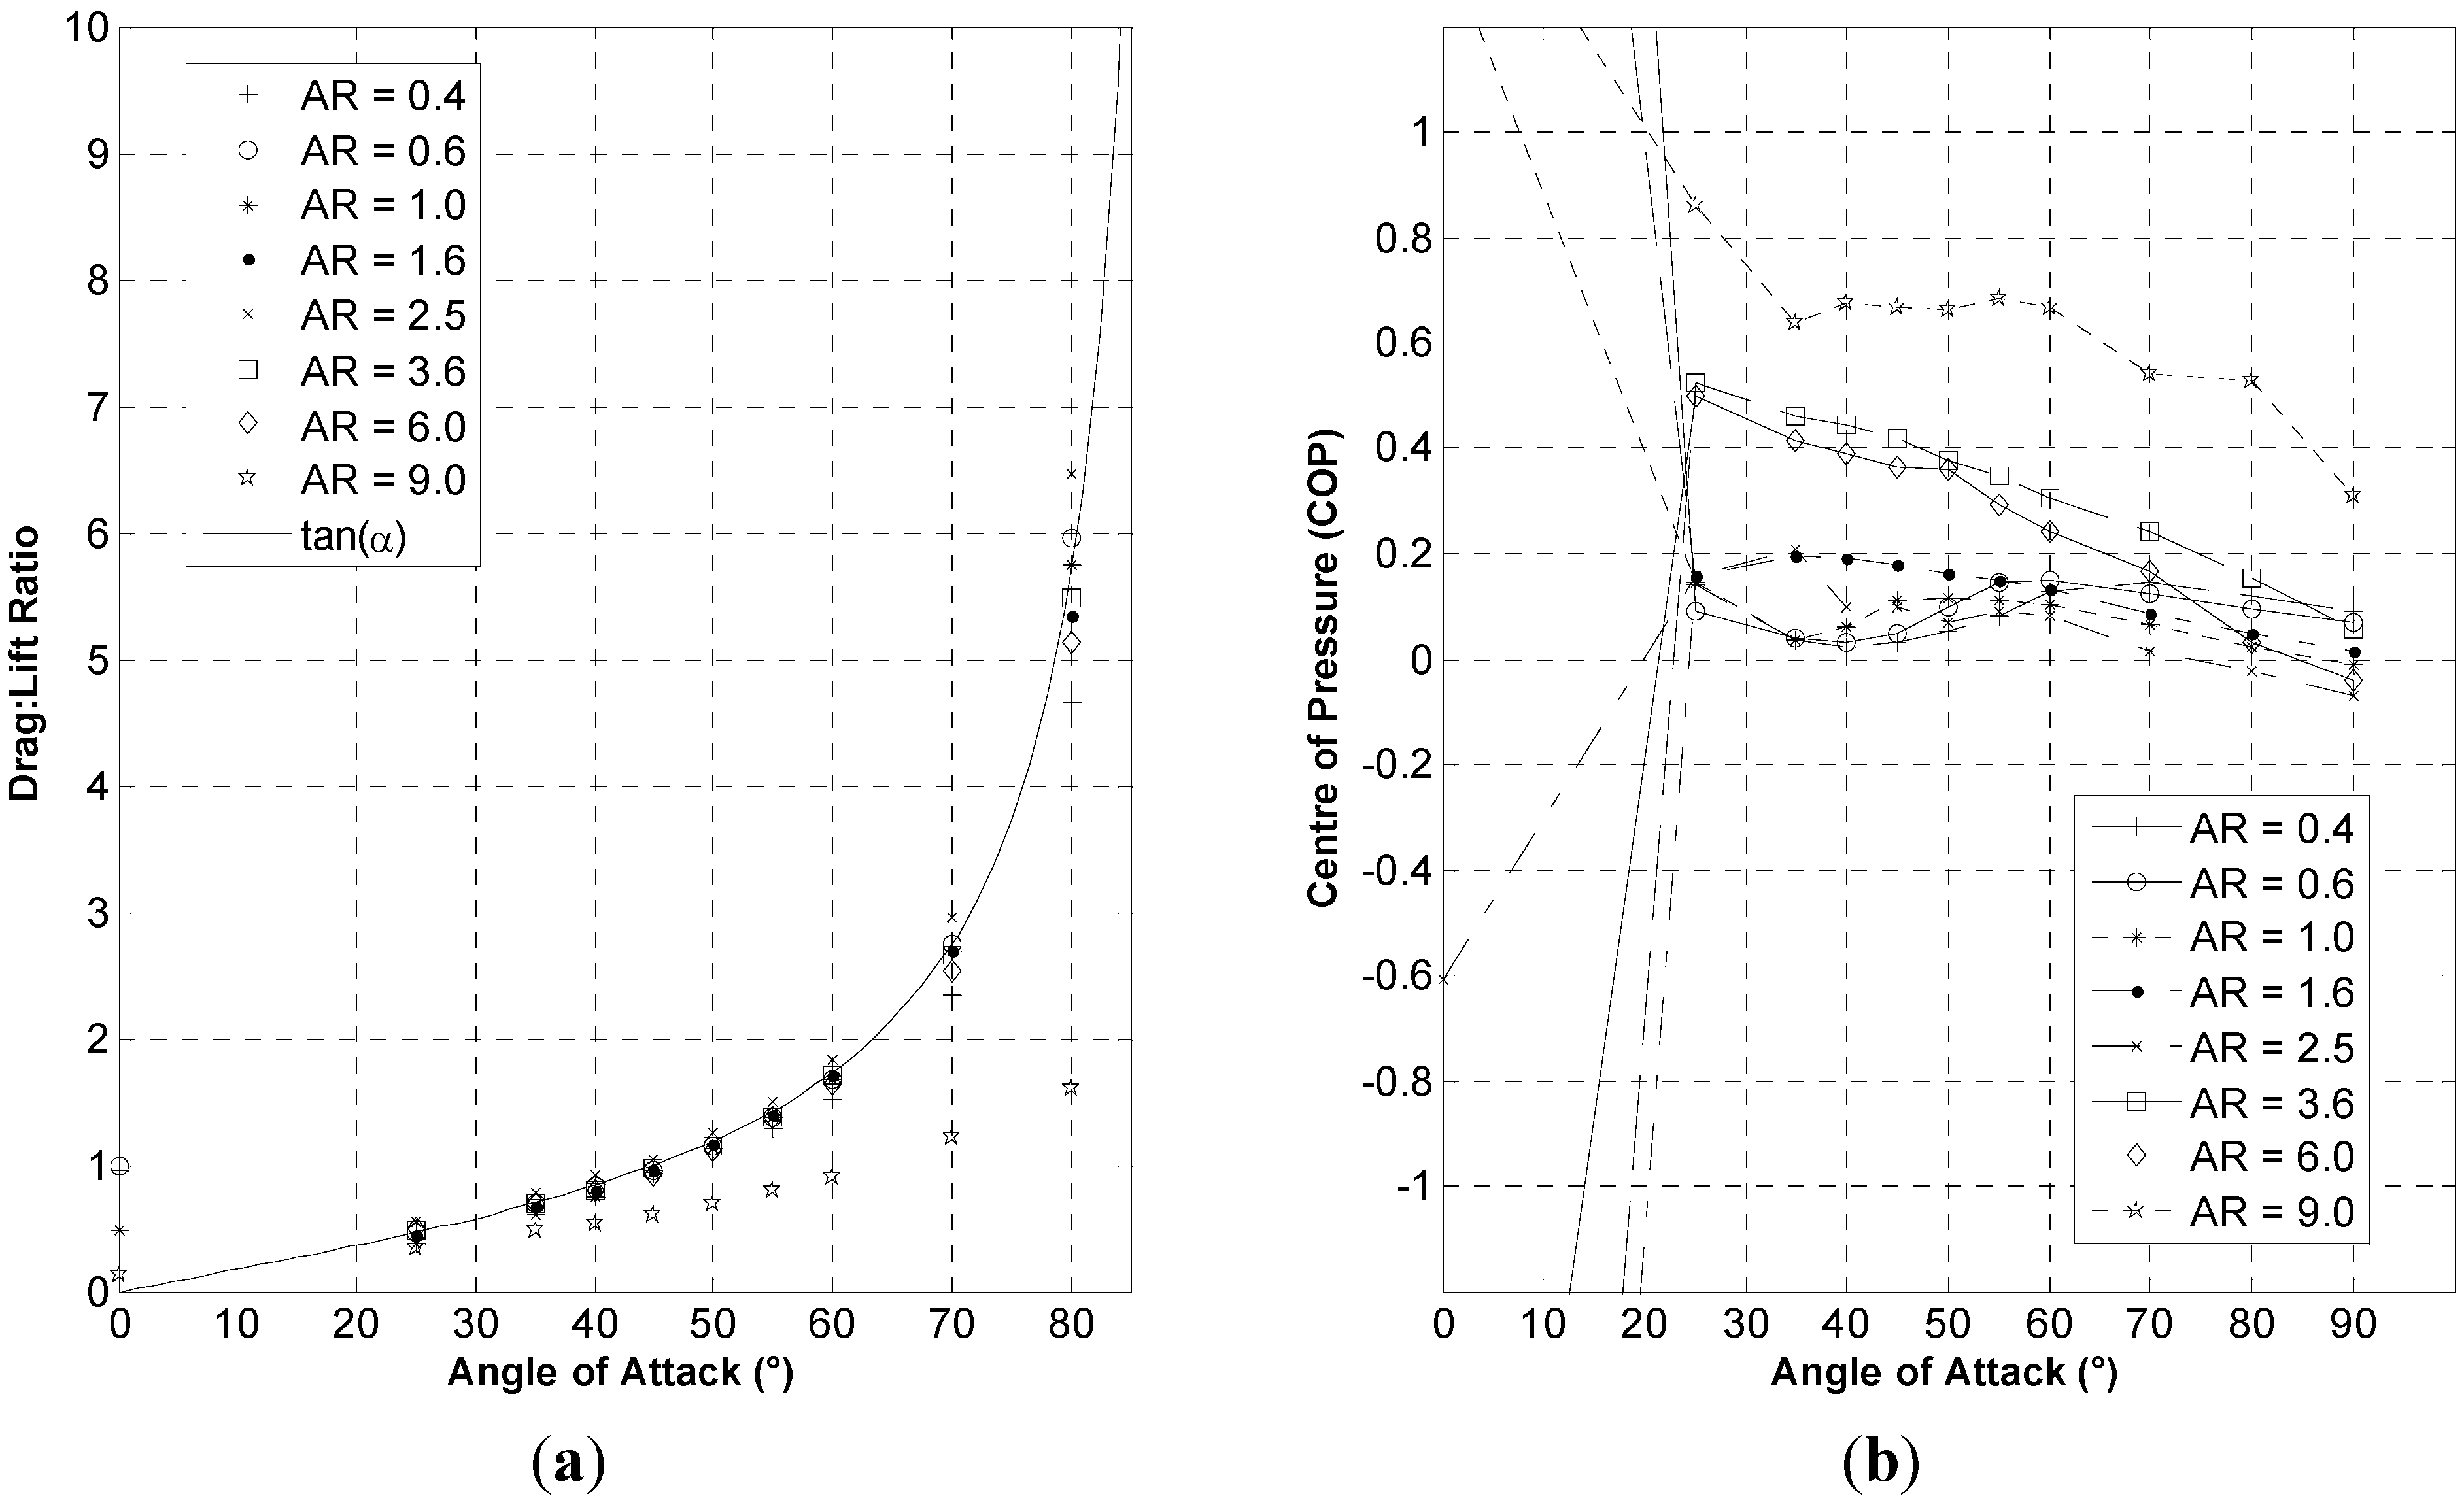
Figure 9 and
Figure 10 show the experimental drag:lift ratio in comparison to Equation (2) and the
CoP for all
AR, for the free-stream and at minimum clearance respectively. In the free-stream, the majority of the results are consistent with pressure being the dominant force on the plate. Somewhat surprisingly the minimum clearance lift and drag also follow Equation (2), except possibly for the highest
AR case, which may have been affected by misalignment close to the surface.
Figure 9.
(a) Free-stream drag: lift ratio and (b) CoP as a function of AR and α.
Figure 9.
(a) Free-stream drag: lift ratio and (b) CoP as a function of AR and α.
While the CoP at the extremes of the range of angles are not to be trusted, for most angles the CoP is much closer to the centre of the plates than to the quarter-chord position as is often assumed and is approximately the case for airfoils and other shapes at low incidence. Generally, the CoP moves towards the trailing edge at minimum clearance.
Figure 10.
(a) Drag:lift ratio and (b) CoP at minimum clearance as a function of AR and α.
Figure 10.
(a) Drag:lift ratio and (b) CoP at minimum clearance as a function of AR and α.
4. Instantaneous Results
One of the aims in measuring the instantaneous forces and moments was to investigate the unsteady overturning moment in comparison with the conventionally measured mean values. Unfortunately this could not be done in general because transforming the results from the force sensor location below the wind tunnel to the center of the plate could only be done by accounting for the average drag on the sting. It became clear that the instantaneous drag could be significantly different from the average. This caused, for example, a substantial proportion of the instantaneous centers of pressure to lie outside the plate. Nevertheless, the instantaneous lift should be much less affected by this problem, which, in any case, reduces as the wall is approached. To our knowledge, only very limited measurements of the fluctuation of the forces are available in the literature.
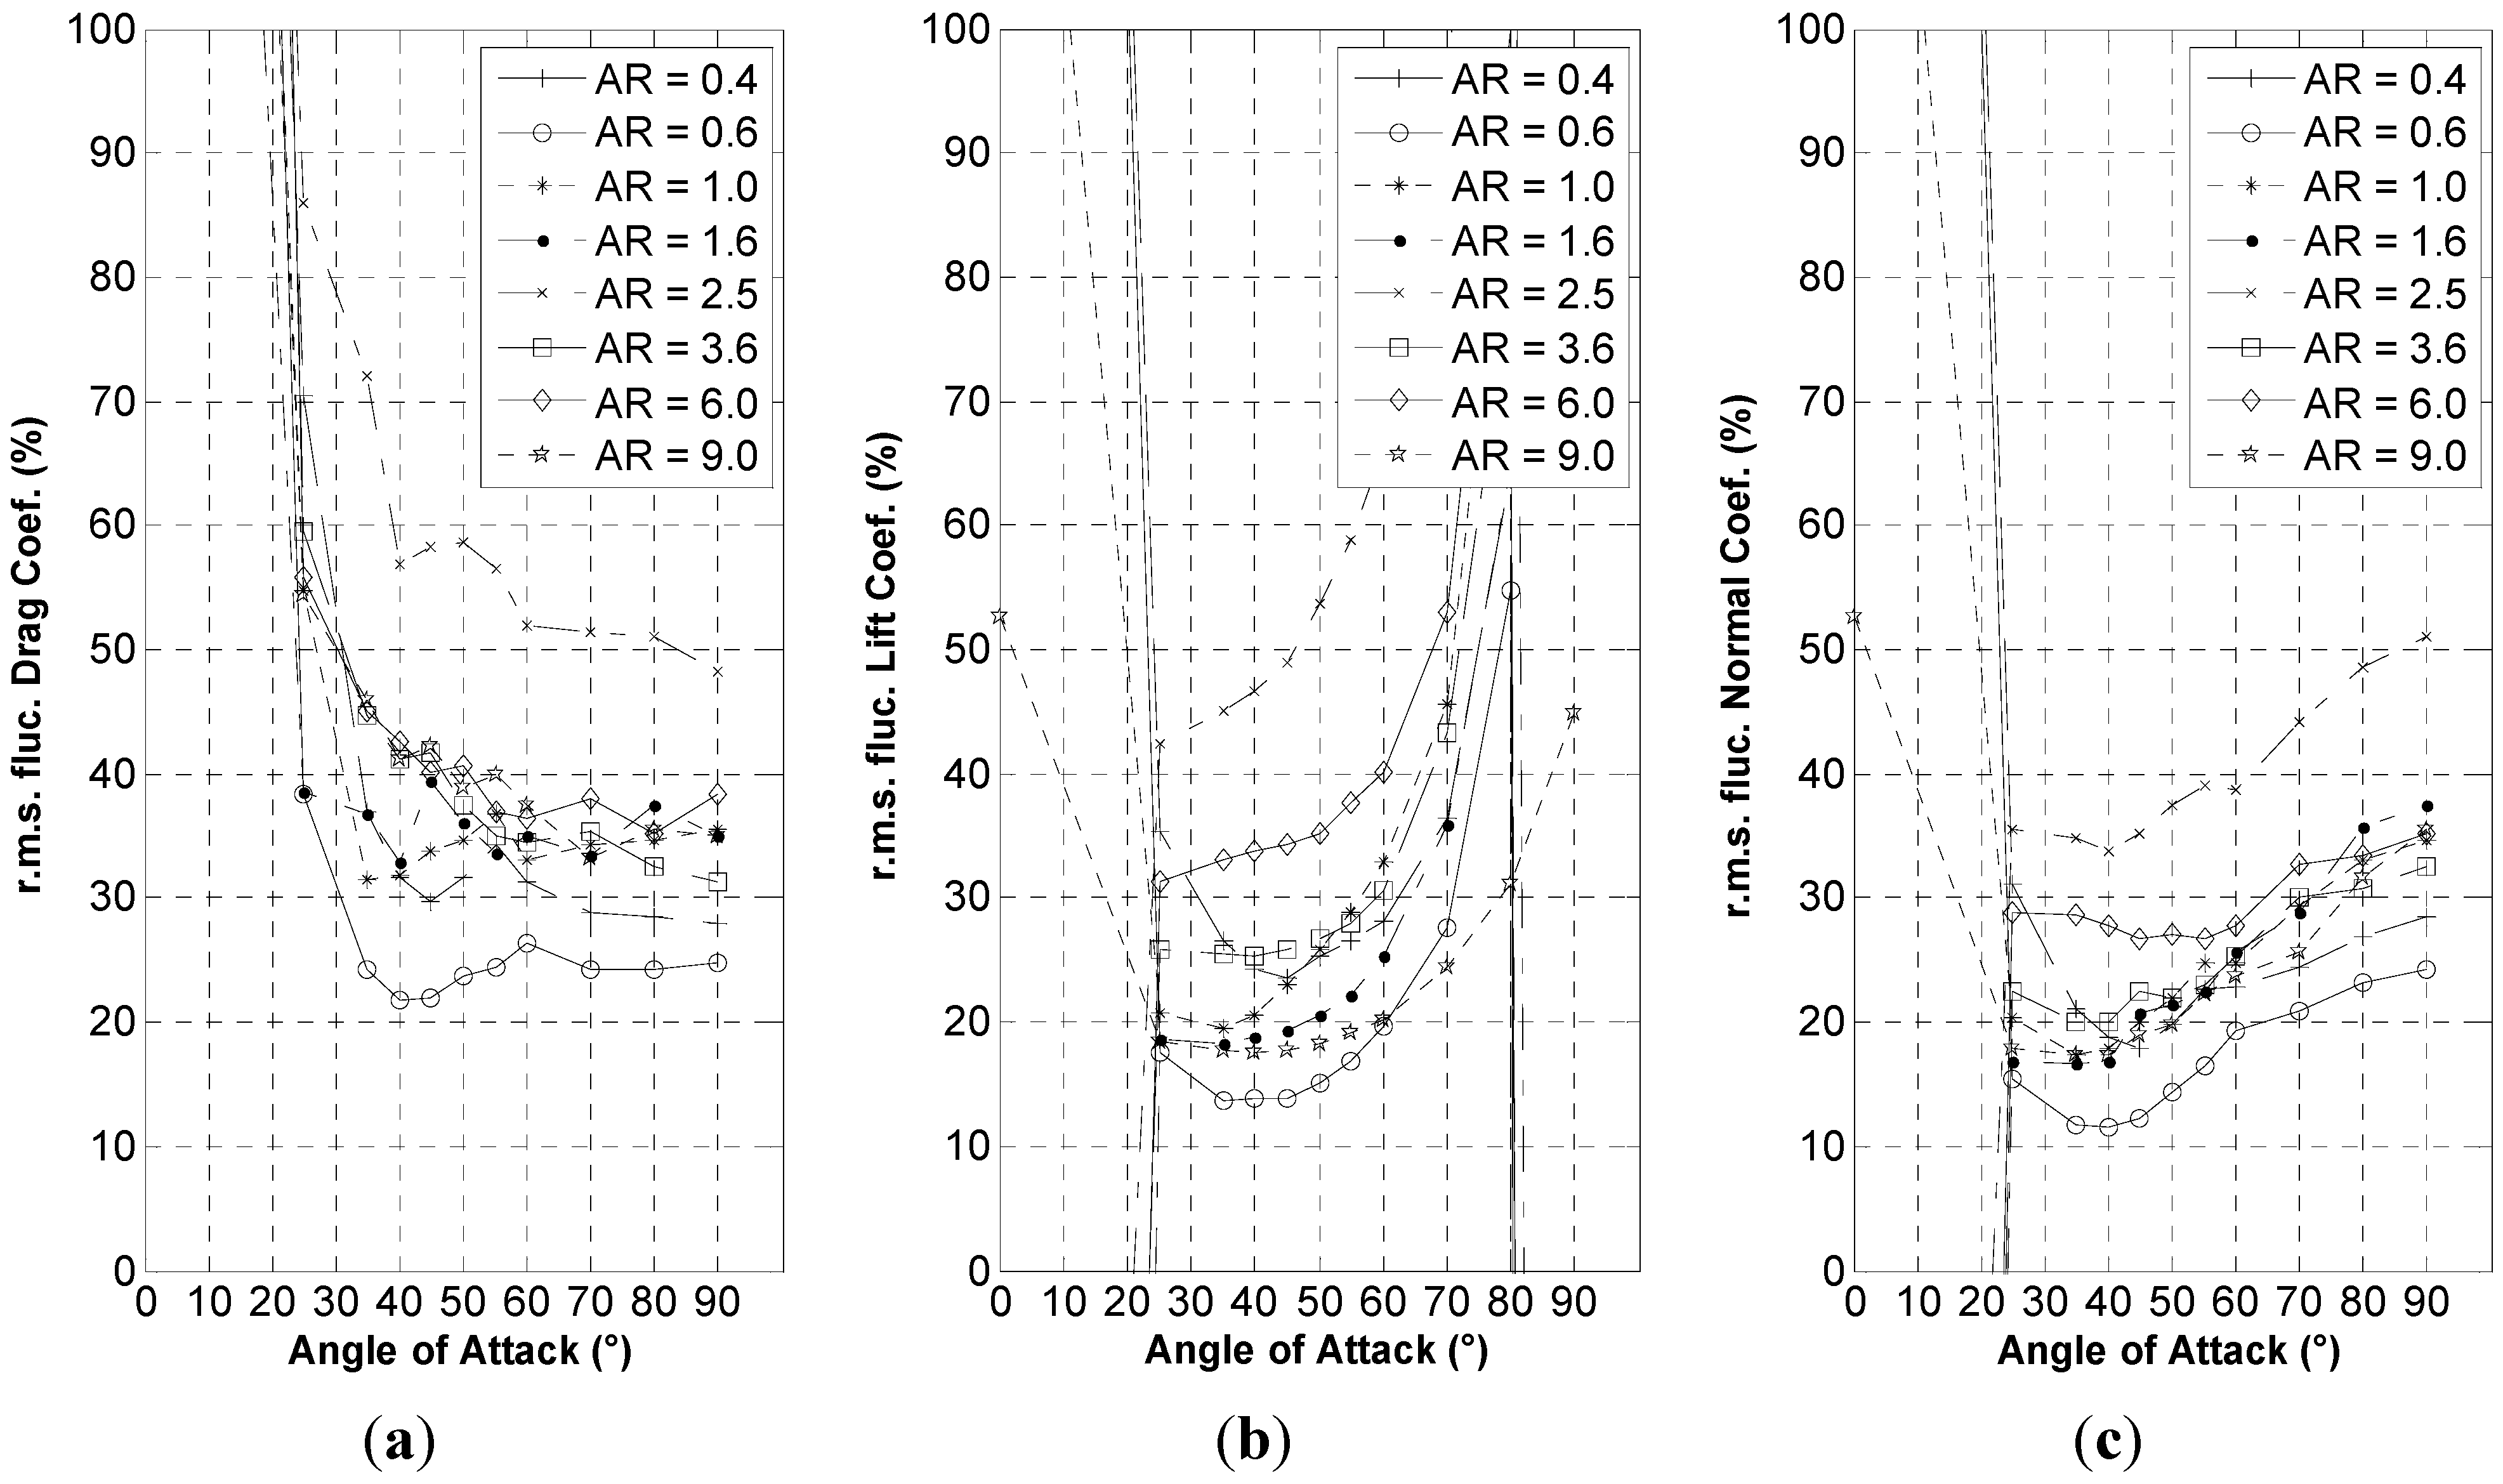
Figure 11 and
Figure 12 show the root mean square fluctuation level of the lift, drag and normal force in the free-stream and at minimum clearance, respectively. The fluctuations in the normal force are surprisingly uniform with the r.m.s. in the free-stream between 10% and 20% of the mean force and non-monotonic in
AR, with the minimum levles at both locations occurring at
AR = 0.6. The fluctuation levels increase subtantially as the wall was approached.
Figure 13 shows typical time histories of the instantaneous forces and their power spectral densities in the free stream for
AR = 1 and α = 90°. Prior to these tests we undertook extensive studies of the natural frequency of the sting on its own in the free stream position. In this location the sting was the main structural element and the changes caused by the different plates should be small.
Figure 11.
Root mean square fluctuation levels for (a) drag; (b) lift and (c) normal force in the free-stream.
Figure 11.
Root mean square fluctuation levels for (a) drag; (b) lift and (c) normal force in the free-stream.
Figure 12.
Root mean square fluctuation levels for (a) drag; (b) lift and (c) normal force close to the wall.
Figure 12.
Root mean square fluctuation levels for (a) drag; (b) lift and (c) normal force close to the wall.
Figure 13.
Time history and spectra of spanwise force, drag and lift for the normal flat plate (α = 90°) with AR = 1 in the free-stream. In the spectra, the first peak for the spanwise force is at 20.8 Hz, and the second at 27.7 Hz. For the drag, the first two peaks are at 12.8 and 33.7 Hz.
Figure 13.
Time history and spectra of spanwise force, drag and lift for the normal flat plate (α = 90°) with AR = 1 in the free-stream. In the spectra, the first peak for the spanwise force is at 20.8 Hz, and the second at 27.7 Hz. For the drag, the first two peaks are at 12.8 and 33.7 Hz.
Tapping the top of the sting with no airflow showed peaks in the force sensor spectrum in the drag direction at 12.8 and a larger peak at 31 Hz, the latter being shared by the vibration in the span and lift directions. During the measurements only the 12.8 Hz peak was observable in the force spectra.
For
AR = 1, the spanwise and lift force spectra should be identical which is clearly not the case, implying that further investigation of the force sensor is required. The lowest peak for the drag, at 12.8 Hz is due to the sting holding the plates shown in
Figure 2a. For most two-dimensional bluff bodies, the vortex shedding frequency produces a peak in the equivalent of the spanwise force or lift, with the main peak in the drag at twice this frequency, e.g., Vickery [
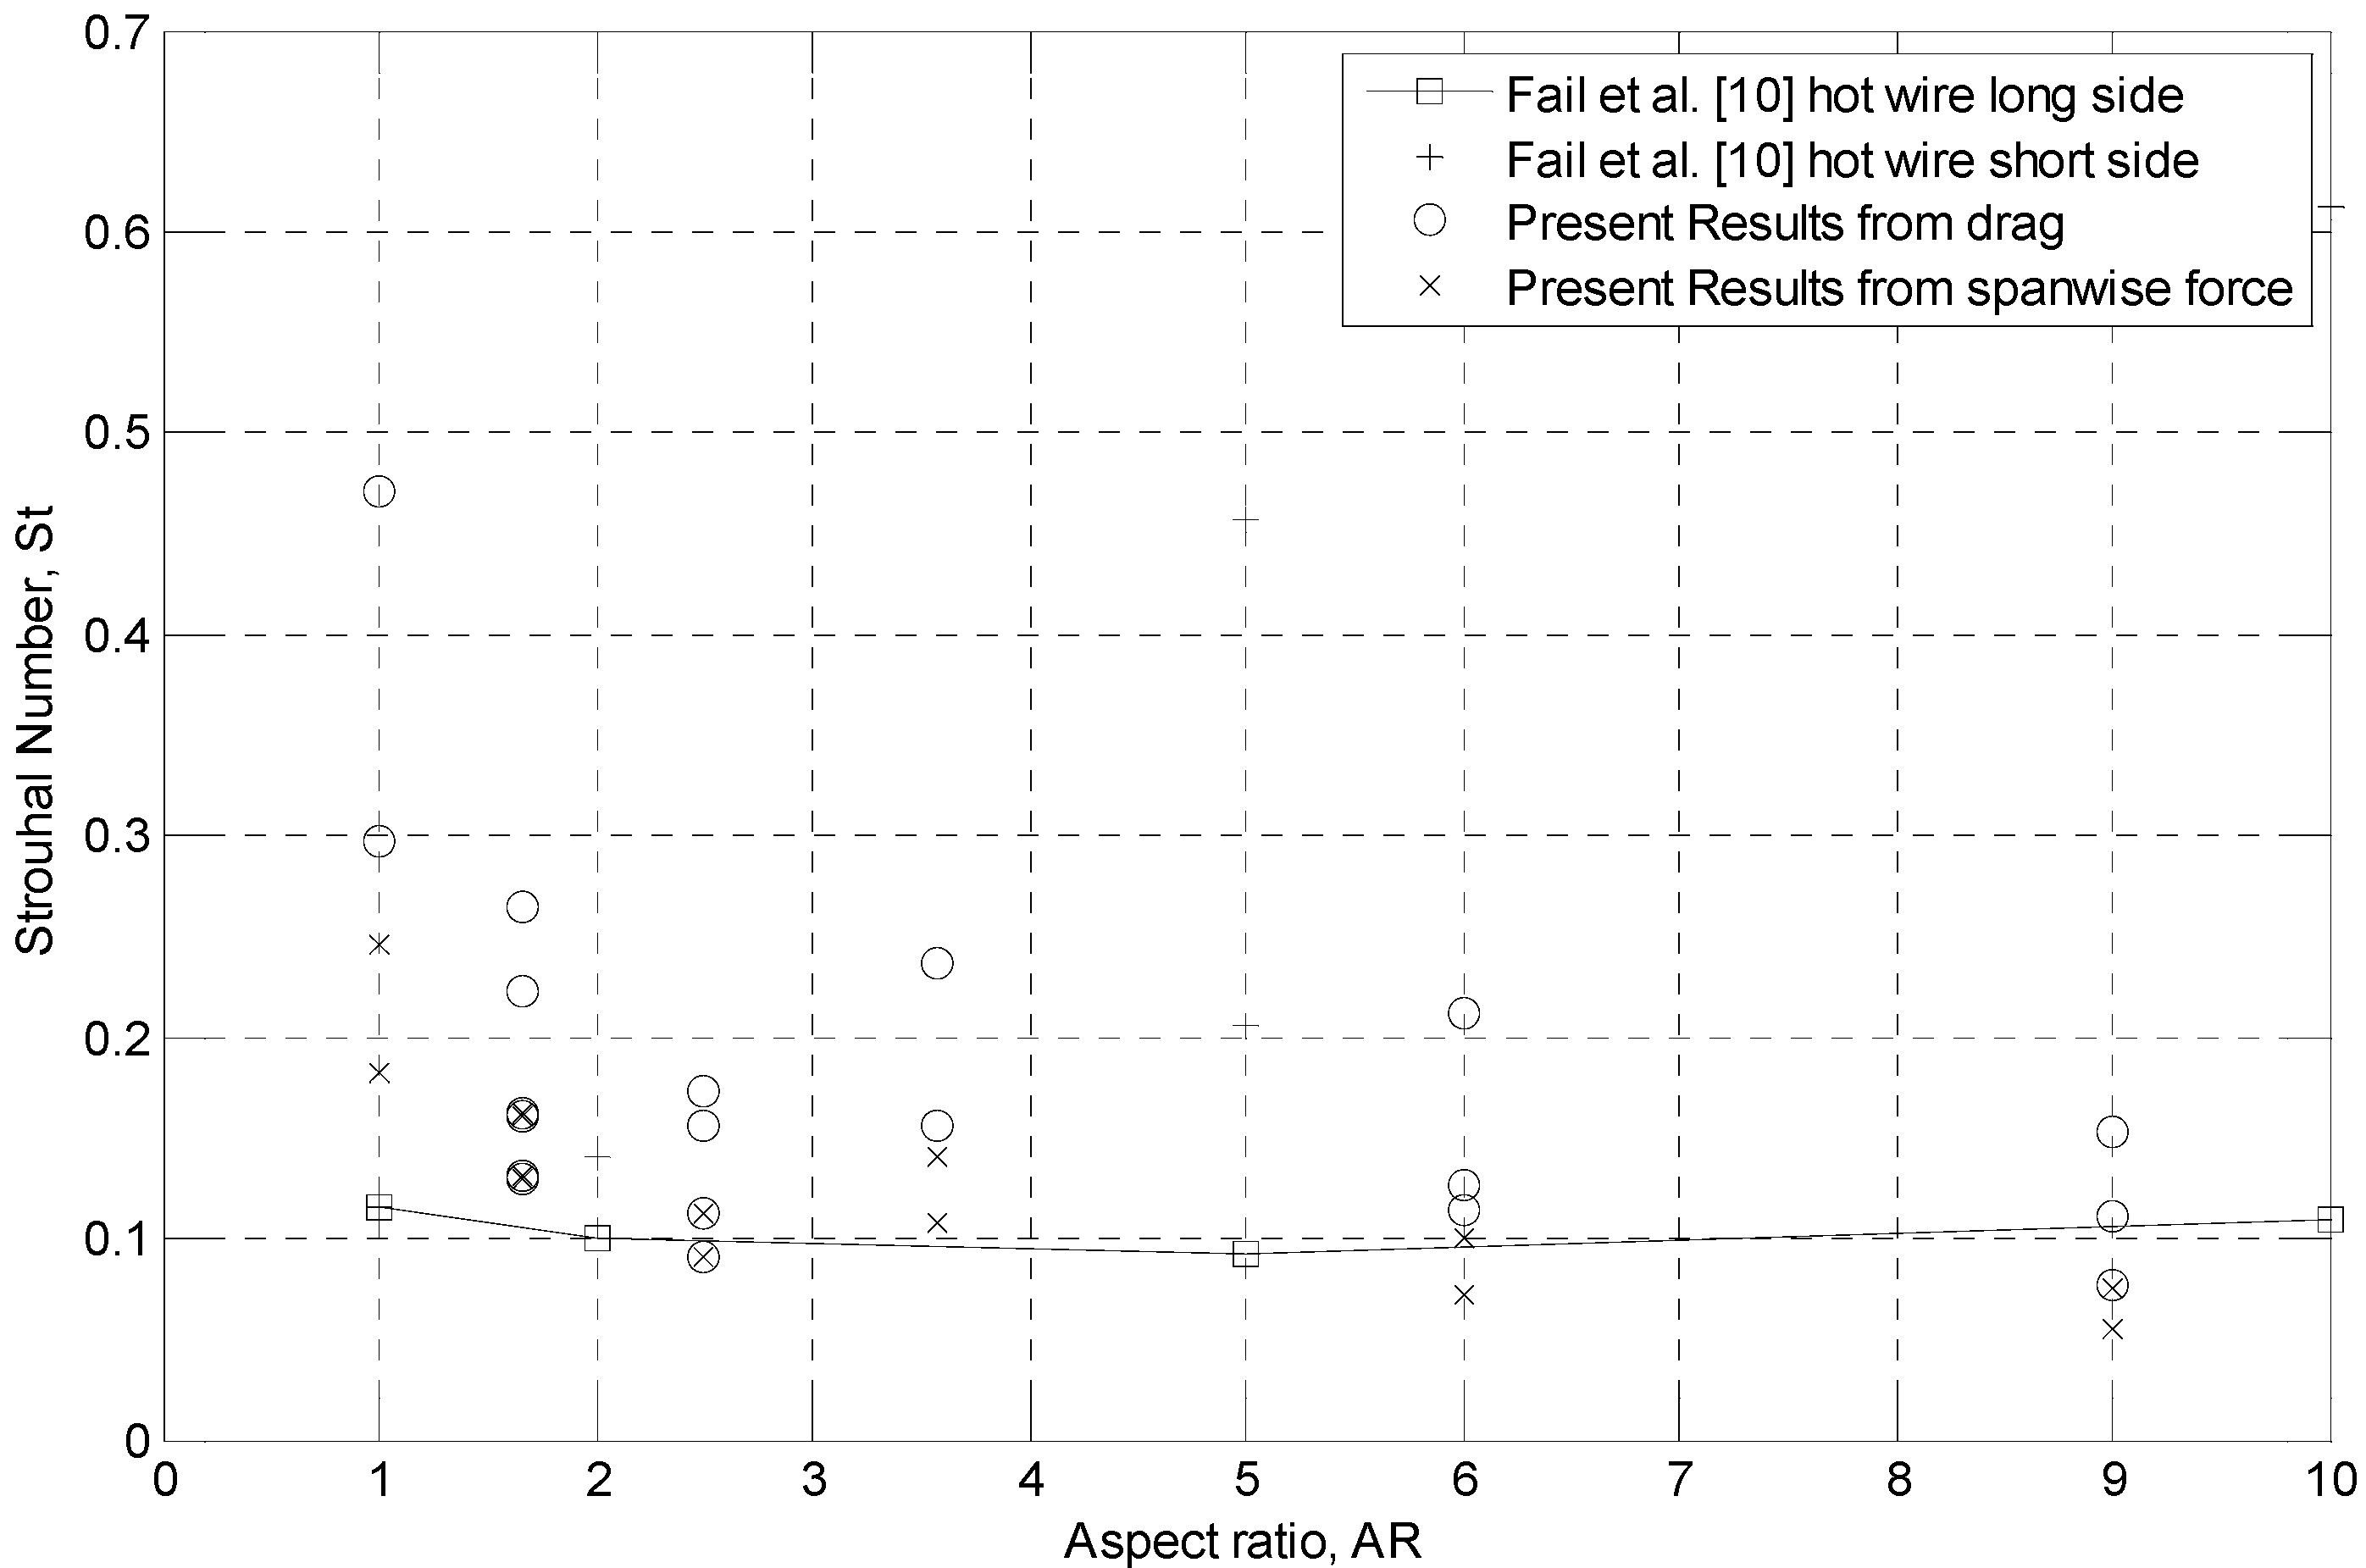
19]. It is difficult to make such a distinction and 31 Hz in the present case, so all the substantial spectral peaks were converted into a Strouhal number,
St, using the smallest of
a and
b and plotted in
Figure 14. The present results are compared to the hot-wire spectral peaks from Fail
et al. [
10] determined at the midpoints of the longest side (square symbols) and the shortest side (+), respectively. The normalization to form
St was the same as for the present results. For AR = 5, Fail
et al. [
10] could not find a single dominant spectra so the two symbols for this case denote the approximate range of the shedding frequency. The present results are generally consistent with those from [
10] suggesting that the force sensor is suitable for further investigation of the complex vortex shedding of flat plates of finite aspect ratio.
As the floor was approached the results (not shown in the interest of brevity) show that the high frequency fluctuations are attenuated.
Figure 14.
Strouhal numbers for the spectral peaks such as those in
Figure 13 for the drag and spanwise force compared to the hot-wire spectral peaks from Fail
et al. [
10].
Figure 14.
Strouhal numbers for the spectral peaks such as those in
Figure 13 for the drag and spanwise force compared to the hot-wire spectral peaks from Fail
et al. [
10].
5. Conclusions
The present experiments investigated the mean and instantaneous forces on thin, rectangular flat plate over a range of aspect ratio up to 9, angles of attack, and distances from the wind tunnel floor. The primary application was to determine extreme wind loads on photovoltaic structures at high angles, but the higher aspect ratio results are also relevant to small, starting wind turbine blades. The new results cover a wider range of aspect ratios and angles of attack than previously measured for the mean forces in the free-stream and at minimum clearance to the wind tunnel wall. In addition, they provide almost entirely new data for the root mean square level of the force fluctuations, as well as their spectral densities. Values of the mean forces are consistent with the expectations of two-dimensionality and with previous measurements on normal flat plates in the free stream. In nearly all cases, the ratio of drag to lift is approximately equal to the tangent of the incidence angle, showing that these forces result from the pressure, rather than the shear stress, acting on the thin plates. This result is consistent with previous results, and should also hold for photovoltaic arrays in which their normalized thickness is slightly lower than that of the plates used to model them in these experiments. Furthermore, the dominance of the pressure implies the Reynolds numbers of the experiments were sufficiently high to be applicable to photovoltaic arrays.
In the free stream, the root mean square of the fluctuating normal force is between 10% and 20% of the mean for all aspect ratios, with some very large instantaneous excursions. Given the large fluctuation levels in the instantaneous pitch moments, it is noteworthy that the assumption that the center of the plate is also the center of pressure is remarkably accurate for the entire angle of attack range studied here. The peaks in the force spectra when converted to Strouhal numbers are in agreement with the previous values from hot-wire measurements, suggesting that in uniform flow the Strouhal number is approximately 0.1 for the range of aspect ratios studied here.


