Article

Molecular and Isotopic Composition of Volatiles in Gas Hydrates and in Sediment from the Joetsu Basin, Eastern Margin of the Japan Sea

1
Environmental and Energy Resources Research Center, Kitami Institute of Technology, 165 Koen-cho, Kitami 090-8507, Japan
2
Faculty of Social and Cultural Studies, Kyushu University, 744 Motooka, Nishi-ku, Fukuoka 819-0395, Japan
3
Department of Earth Sciences, Graduate School of Science, Chiba University, 1-33 Yayoi-cho, Inage-ku, Chiba 263-8522, Japan
4
Department of Energy and Resource Engineering, College of Engineering, Peking University, Beijing 100871, China
5
Gas Hydrate Laboratory, Organization for the Strategic Coordination of Research and Intellectual Properties, Meiji University, 1-1 Kanda-Surugadai, Chiyoda-ku, Tokyo 101-8301, Japan
*
Author to whom correspondence should be addressed.
Energies 2015, 8(6), 4647-4666; https://doi.org/10.3390/en8064647
Submission received: 31 January 2015 / Accepted: 12 May 2015 / Published: 25 May 2015
(This article belongs to the Special Issue Coastal Ocean Natural Gas Hydrate 2014)

Abstract

:
Hydrate-bearing sediment cores were retrieved from the Joetsu Basin (off Joetsu city, Niigata Prefecture) at the eastern margin of the Japan Sea during the MD179 gas hydrates cruise onboard R/V Marion Dufresne in June 2010. We measured molecular and stable isotope compositions of volatiles bound in the gas hydrates and headspace gases obtained from sediments to clarify how the minor components of hydrocarbons affects to gas hydrate crystals. The hydrate-bound hydrocarbons at Umitaka Spur (southwestern Joetsu Basin) primarily consisted of thermogenic methane, whereas those at Joetsu Knoll (northwestern Joetsu Basin, about 15 km from Umitaka Spur) contained both thermogenic methane and a mixture of thermogenic and microbial methane. The depth concentration profiles of methane, ethane, propane, CO2, and H2S in the sediments from the Joetsu Basin area showed shallow sulfate–methane interface (SMI) and high microbial methane production beneath the SMI depth. Relatively high concentrations of propane and neopentane (2,2-dimethylpropane) were detected in the headspace gases of the hydrate-bearing sediment cores obtained at Umitaka Spur and Joetsu Knoll. Propane and neopentane cannot be encaged in the structure I hydrate; therefore, they were probably excluded from the hydrate crystals during the structure I formation process and thus remained in the sediment and/or released from the small amounts of structure II hydrate that can host such large gas molecules. The lower concentrations of ethane and propane in the sediment, high δ13C of propane and isobutane, and below-detection normal butane and normal pentane at Umitaka Spur and Joetsu Knoll suggest biodegradation in the sediment layers.

1. Introduction

Gas hydrates are crystalline clathrate compounds consisting of water and gas molecules that form at low temperatures and high pressures [1]. Natural gas hydrates are found worldwide in continental margin sediments [2,3,4] and in near-surface sediments associated with active gas plume that vent from the seafloor [5,6,7]. Natural gas hydrates are considered potential energy resources and are large reservoirs of methane (C1), and their dissociation may cause submarine geohazards and contribute to global warming [8,9,10].
Crystallographic structures of natural gas hydrate are usually either structure I (sI), which is composed of two 12-hedra and six 14-hedra with space group Pm3n, or structure II (sII), which is composed of sixteen 12-hedra and eight 16-hedra with space group Fd3m [1]. C1 and ethane (C2) are both known to form sI hydrates; however, certain compositions of C1 and C2 will form sII hydrates [11,12], whereas propane (C3) and isobutane (i-C4) is incorporated only in sII. The concentrations of C2 and C3 in hydrate-bound gas from the Gulf of Mexico represent 3%–5% and >15% of the total gas, respectively [13]. Gas hydrate from the Sea of Marmara contained high concentrations of C3 (18.8%) and i-C4 (9.5%) [14]. Mixed-gas (C1 and C2) hydrates in Lake Baikal belonged to the sII hydrate and contained 0.026%–0.064% of neopentane (neo-C5, 2,2-dimethylpropane) [15,16], which can be encaged in the large cages of sII [17].
Shallow gas hydrates were recently found in the Joetsu Basin at the eastern margin of the Japan Sea, where gas venting was observed on echo-sounder images [18,19]. Gas hydrate was recovered from the sea floor [20], and δ13C of hydrate-bound C1 was from −37.3‰ to −37.1‰ [20], suggesting thermogenic origin in the criteria of the Bernard plot [21]. However, C2 and C3 concentrations of hydrate-bound gas at Umitaka Spur and Joetsu Knoll (Figure 1) were very low; the molar ratio C1/(C2 + C3) ranged from 1000 to 10,000 [22]. The Sado Nansei Oki drillings at Umitaka Spur conducted by the Ministry of Economy, Trade and Industry, Japan revealed C1/(C2 + C3) values less than 100 at depths 1143−2016 m below the sea floor [20], indicating either that C2 and C3 concentrations are reduced in the ascending fluid during migration or that the addition of microbial C1 is significant in higher strata. The depth profiles of sediment gases at Umitaka Spur and Joetsu Knoll were reported in our previous work [23]; however, molecular and isotopic compositions of hydrate-bound gas were not reported yet and the effect of low concentration of higher hydrocarbons on gas hydrates has not been discussed. In this study, we investigate the molecular and stable isotope compositions of hydrate-bound gas and gas in sediment cores (headspace gas) retrieved from Umitaka Spur and Joetsu Knoll and focus on C2, C3, and higher hydrocarbons, those may change crystallographic structure of the shallow gas hydrates in these areas.
Figure 1. Locations of the coring sites in the Joetsu Basin area, Japan Sea. The sites of hydrate-bearing cores are highlighted.
Energies 08 04647 g001

2. Study Sites and Sediment Cores

Umitaka Spur and Joetsu Knoll are located in the Joetsu Basin off the city of Joetsu (Niigata Prefecture, Figure 1). High P-wave velocities at the mounds and pockmarks on the Umitaka Spur seafloor were reported, suggesting the existence of gas hydrate [24]. Echo sounding of the sea bottom at Umitaka Spur and Joetsu Knoll showed large-scale gas venting from the sea floor [18]. Depth profiles of sulfate in the pore water of the sediment cores indicated shallow (<5 m) sulfate–methane interface (SMI; where sulfate and methane are both consumed to depletion at the base of the sulfate reduction zone) in the Joetsu Basin [25], indicating high flux of hydrocarbons and other organic matter. High heat flow was observed in a restricted area on the sea floor around the gas seep sites at Umitaka Spur (maximum value of 1590 mW m−2) and Joetsu Knoll (maximum value of 519 mW m−2) compared to the average value obtained on a normal muddy seafloor in these areas (98 ± 13 mW m−2), indicating local fluid migration from the deep subsurface layer [26].
Previous study considered origin of hydrate-bound C1 at Umitaka Spur and Joetsu Knoll as thermogenic one (C1 δ13C ranged from −39.0 to −34.9‰ V-PDB) and mixed gas of microbial and thermogenic ones (C1 δ13C ranged from −57.9 to −51.8‰ V-PDB), respectively [22]. Because the content of total organic carbon (TOC) ranged from 0.58% to 1.55% in the shallow sediment layer (0–9 m depth, [27]) and from 0.90% to 2.98% in the deep layer (1360–2088 m depth, mixed Type II/III kerogen, [20]), the potential of C1 generation via microbial and thermogenic processes is high.
Sediment cores were retrieved from Umitaka Spur, Joetsu Knoll, Joetsu Basin and its peripheral area (Figure 1) during the MD179 cruise onboard R/V Marion Dufresne in June 2010. A Calypso giant piston corer enabled us to obtain sediment cores up to 40 m in length. A Calypso square box corer (CASQ, 25 cm × 25 cm × 12 m) was also used. Out of the 20 sediment cores obtained, four contained hydrates: MD179-3305G and MD179-3306 (located 300 m apart) from Umitaka Spur, and MD179-3317 and MD179-3318C (located 5 km apart) from Joetsu Knoll. Hydrates were virtually absent in the other sediment cores. MD179-3305G was retrieved by a gravity corer, and a few samples of the gas hydrates were taken for gas analysis. All the hydrate-bearing cores except MD179-3318C lost several meters of the top sediment layers because the lead weight section was disconnected from the core barrel due to a technical problem; the gas hydrates dissociated in the corer and the core top was displaced during the onboard recovery process. The top depths of the gas hydrates were estimated to be 4.5 mbsf (MD179-3306), 31.5 mbsf (MD179-3317), and 1.5 mbsf (MD179-3318C). The depth of gas hydrate in MD179-3305G was unknown.

3. Sampling Methods and Analysis

3.1. Onboard Gas Sampling

The gas sampling procedures for the hydrate-bound and headspace gases were the same as those used in our previous studies [28,29]. The hydrate-bound gases were collected using a 50-mL plastic syringe and stored in 5-mL vials sealed with butyl septum stoppers. Several samples were taken from each hydrate-bearing sediment core. First, we placed small pieces of hydrate sample into a 50-mL plastic syringe, pushed the cylinder to reduce the dead volume, and connected the syringe to a 5-mL vial with a needle. Another needle was connected to the vial to flush the air inside. Each vial was thus filled with hydrate-bound gas without sediment particles or water. Consequently, this method contributed to prevention of microbial activity during storage. The gas dissociated from hydrate flushed air in the system, and the concentration of air in the vial was less than 2%.
Headspace gas method was employed to know the depth profiles of each gas component in the sediment cores. 10 mL of sediment, 9.5 mL of saturated aqueous solution of NaCl, and 0.5 mL of preservative (10 wt % aqueous solution of benzalkonium chloride, [30]) were introduced into 25-mL vials to create a 5-mL headspace. The headspace was flushed with helium, the carrier gas used in the gas chromatography, to reduce air contamination. Although the flushing process may reduce gas concentrations from their native values, differences in concentration and stable isotopes (δ13C and δD) of C1 between flushed and non-flushed samples were undetectable [31]. Hence, we can discuss the trend of their depth profiles using headspace gas data. The vials were shaken well and stored upside down until they were analyzed.
In some of the gas-rich cores (MD179-3296, 3299, 3301, 3304, 3308, 3313, and 3317, see Figure 1), voids formed in the plastic core liner during their retrieval from the core barrel. The gas in the voids was collected by modifying the method of [32]. The surface temperature of the plastic core liner was measured with an infrared thermal imaging camera to locate the voids. Small holes several meters apart were then drilled into the liner. Gas samples collected through these holes with a 50-mL plastic syringe were stored in evacuated 5-mL glass vials. Because the concentration of hydrocarbons in the void gas was considerably higher than that obtained by the headspace gas method, the void-gas method is suitable for stable carbon and hydrogen isotope analysis on non-C1 hydrocarbons, which are typically present in low concentration. Isotopic difference between void and headspace gases was within 2‰ for C1 δ13C and 3‰ for C1 δD [23]. In this study, we obtained the stable carbon isotope signature of C2 by the void-gas method.

3.2. Analytical Methods

The molecular composition of the gas samples was determined using a gas chromatograph (GC-14B, Shimadzu, Kyoto, Japan) equipped with a packed column (Shimadzu Sunpak-S; 2 m length, 3 mm ID), a thermal conductivity detector (TCD) for detecting CO2, H2S, and high concentrations (>0.1 mol% of the sample gas) of C1, and a flame ionization detector (FID) for detecting low concentrations (<0.1 mol% of the sample gas) of hydrocarbons (C1–C5). The TCD and FID were connected in series. The detection limit was 0.00005 mol% (C1–C3) and 0.0005 mol% (C4–C5). The analytical error estimated by multiple injections of standard gases was less than 1.2% for each gas component.
Stable carbon and hydrogen isotopic ratios of the hydrocarbons and CO2 were measured using a continuous-flow isotope-ratio mass spectrometer (CF-IRMS, DELTAplus XP, Thermo Fisher Scientific, Waltham, MA, USA) coupled with a gas chromatograph (Trace GC, Thermo Fisher Scientific) via a combustion/pyrolysis reactor (GC-C/TC III, Thermo Fisher Scientific). The gas chromatograph was equipped with a Carboxen-1006 PLOT capillary column (30 m length, 0.32 mm ID, 15 μm film thickness, Sigma-Aldrich, St. Louis, MO, USA). In the case of samples with low C1 concentration, a Sigma-Aldrich Carboxen-1010 PLOT capillary column (30 m length, 0.32 mm ID, 15 μm film thickness) was also used to separate air components from hydrocarbons. A PoraPLOT Q capillary column (27.5 m length, 0.32 mm ID, 10 μm film thickness, Agilent Technologies, Santa Clara, CA, USA) was used for higher hydrocarbons (C4–C8). Stable isotope compositions are reported as δ values (‰):
δ s a m p l e = ( R s a m p l e R standard R standard ) × 1000   ( )
where R denotes the 13C/12C or D/H ratio. δ13C and δD are given with reference to the V-PDB and V-SMOW standards, respectively, determined by using NIST RM8544 (NBS19) for δ13C and NIST RM8561 (NGS3) for δD. The analytical precision was 0.3‰ for δ13C of C1–C3, 1‰ for δ13C of C4–C8, and 2‰ for δD.

4. Results

Figure 2a–c show the depth profiles of the concentration (C1, C2, C3, CO2, and H2S) of headspace gases, C1/(C2 + C3) values calculated from the concentration of C1, C2, and C3, and stable carbon and hydrogen isotopes of C1, C2, and CO2. The concentration of C1 drastically increased with depth toward the SMI, with the peak concentration appearing at around 5–8 mbsf and then decreasing slightly. The C1 concentration profiles indicate that the SMI is around 0.5–5 mbsf in the Joetsu Basin area including Umitaka Spur and Joetsu Knoll. The trend of C2 and C3 concentration profiles was similar to that of C1; however, their concentrations below the SMI differed between the sediment cores. C1/(C2 + C3) values showed a peak near 5–8 m, which agrees with the peak of the C1 concentrations. C1/(C2 + C3) values below the SMI were less than 10,000 in the areas of Umitaka Spur (Figure 2a) and Joetsu Knoll (Figure 2b) except the cores MD179-3320G and 3324C, and more than 10,000 in the other cores of Joetsu Basin (Figure 2c). The CO2 concentrations of the all cores simply increased with depth, and the H2S concentrations showed peaks at their SMI depths.
The trend of C1 δ13C profiles were similar to those of CO2 δ13C, increasing with depth below the SMI. Negative C1 δ13C and CO2 δ13C peaks were observed around the SMI, which agreed with the high H2S concentrations. High C1 δ13C (more than –45‰ V-PDB) was observed in the hydrate-bearing cores MD179-3306 and 3318C. C1 δ13C at the depth of 10 mbsf ranged from −66.7‰ to −57.8‰ at Umitaka Spur except the core MD-179-3306, from −74.5‰ to −58.3‰ at Joetsu Knoll, and from −83.5‰ to −77.4‰ at the other sites in Joetsu Basin. On the other hand, C1 δD simply decreased with depth except the core MD179-3306. C1 δD for MD179-3306 was distinctly large and ranged from −165.9‰ to −157.8‰, while those for other cores ranged from −207.4‰ to −175.8‰. C1 δ13C, C1 δD, and C2 δ13C of hydrate-bound and headspace gases were almost the same with each other. On the contrary, distinct differences were found in CO2δ13C; those of hydrate-bound gas was 10‰ lower (MD179-3306), 8‰ lower (MD179-3317), and 27‰ higher (MD179-3318C) than those of headspace gas around the same depth.
The concentration of C2 in the hydrate-bearing cores (MD179-3306, 3317, and 3318C) below the SMI was nearly one order of magnitude higher than that in the nonhydrate-bearing cores. MD179-3297C, 3300C, 3304, and 3307C were also rich in C2. The concentrations of C3 in the three hydrate-bearing cores (MD179-3306, 3317, and 3318C) and in MD179-3304 were higher than in the nonhydrate-bearing cores. The C2-rich cores (MD179-3304 and 3317) showed 13C enrichment in C2, although C3 δ13C is not available. C2 δ13C of nonhydrate-bearing cores in Joetsu Basin was low, ranging from −62.8‰ to −52.6‰.
Figure 2. Depth profiles of C1, C2, C3, CO2, and H2S concentrations, C1/(C2 + C3) values, C1 δ13C, C1 δD, C2 δ13C, and CO2 δ13C in the headspace gas. (a) Umitaka Spur area; (b) Joetsu Knoll area; (c) Joetsu Basin and its peripheral area. These depth profiles of the headspace gases were already reported [23]. The C1/(C2 + C3) values and stable carbon (C1, C2, and CO2) and hydrogen (C1) isotopic ratios in the hydrate-bound gas of the cores MD179-3306, 3317 and 3318C are plotted. The data of C2 δ13C was obtained by the void-gas method and other data by the headspace gas method. The depth data of C2 δ13C profile for MD179-3296 is unknown. The headspace gas data of MD179-3305G is missing due to sediment loss.
Energies 08 04647 g002aEnergies 08 04647 g002b
Molecular compositions and stable isotope signatures of hydrate-bound gases at Umitaka Spur and Joetsu Knoll are summarized in Table 1. In the entire study sites C1 was the main component of the hydrate-bound gas, comprising more than 98 mol% of the total volume; the concentrations of C2, C3, CO2, and H2S were 0.0148–0.0456 mol% (n = 17), 0.0001–0.0025 mol% (n = 17), 0.03–1.26 mol% (n = 16), and 0.03–0.77 mol% (n = 8), respectively. C1 δ13C has a wide range (−57.1‰ to −43.9‰) at Joetsu Knoll (MD179-3317 and 3318C) and a narrow range (−37.3‰ to −34.6‰) at Umitaka Spur (MD179-3305G and 3306), whereas C1/(C2 + C3) values concentrate from 2200 to 9700 at the both areas. C2 δ13C ranged from −31.9‰ to −21.3‰ at Joetsu Knoll and from −18.4‰ to −17.9‰ at Umitaka Spur, respectively.
Table 1. Molecular compositions (mol% of the total components) and stable carbon (C1–3 and CO2) and hydrogen (C1) isotopic ratios of hydrate-bound gases retrieved from Umitaka Spur (MD179-3305G and 3306) and Joetsu Knoll (MD179-3317 and 3318C), Japan Sea. Because H2S is highly corrosive and reaction with sampling and analytical tools was apparently not prevented, a higher portion of H2S is lost during core retrieval and gas analysis compared to hydrocarbons and CO2.
Core No. Depth [mbsf]Molecular compositionIsotopic composition
C1 [mol%]C2 [mol%]C3 [mol%]CO2 [mol%]H2S [mol%]C1/(C2+C3)C1δ13C [‰V-PDB]C2δ13C [‰V-PDB]C3δ13C [‰V-PDB]CO2δ13C [‰V-PDB]C1δD [‰V-SMOW]
MD179-3305G unknown depth98.10.02920.00191.100.773158−36.6−17.95.814.3−167
98.30.02700.00201.180.533389−36.0−18.25.718.0−164
98.20.03010.00171.260.533086−36.0−18.25.919.5−164
99.80.03310.00180.20n.d.2859−34.6 17.3−167
MD179-3306 4.5 [mbsf]99.10.02920.00200.85n.d.3176−37.3−18.46.320.3−164
100.00.02210.0016 4213−35.7−18.14.823.8−167
MD179-3317 31.5 [mbsf]99.30.01710.00010.640.045783−56.4−31.7−5.69.7−194
99.30.01530.00010.630.046446−54.6−31.8 11.6−195
99.40.01720.00010.57n.d.5758−54.8−31.9 8.5−194
99.90.01710.00010.11n.d.5810−54.8 −194
99.30.02050.00010.660.034819−57.1−31.4−5.39.1−194
99.90.02110.00010.10n.d.4713−55.4 −195
100.00.02160.00010.03n.d.4603−54.8 −194
MD179-3318C 1.5 [mbsf]99.80.01480.00110.18n.d.6257−44.0−21.34.0 −189
99.10.04210.00050.510.362328 −22.84.517.4−188
99.90.04560.00040.07n.d.2172−44.3−24.5 −190
99.70.00780.00250.210.099682−43.9−21.4 n.d.
Notes: mbsf: meters below sea floor; blank: not measured; n.d.: not detected.
The molecular and stable carbon and hydrogen isotopic composition of volatiles in the headspace gas of MD179-3306 (Umitaka Spur) and 3318C (Joetsu Knoll) are summarized in Table 2. A high concentration of a compound (0.1–0.2 mol%) putatively assigned as neo-C5 based on its relative retention time during gas chromatography was also detected. Although normal butane (n-C4), i-C4, isopentane (i-C5), and normal pentane (n-C5) were below the detection limit of the gas chromatograph, CF-IRMS (detection limit: 0.00006 mol%) detected only i-C4 in the samples. δ13C of C5–C8 in MD179-3306 and 3318C was within −23‰ ± 5‰; however, C3 δ13C and i-C4 δ13C were exceptionally high (+1.1‰ to +8.8‰) compared with δ13C of the other hydrocarbons.
Table 2. Molecular and isotopic compositions of headspace gas of the hydrate-bearing cores (MD179-3306 and MD179-3318C).
CoreMD179-3306MD179-3318C
Depth [mbsf]4.505.005.957.001.50
Molecular composition [mol%]
C140.742.341.428.486.9
C20.02110.02640.02550.01530.0289
C30.00370.00390.00370.00220.0063
neo-C50.19460.12980.18620.08300.0760
CO259.157.558.471.56.6
H2Sn.d.n.d.n.d.n.d.6.3
C1/(C2+C3)16401393142216242469
Isotopic composition [δ13C ‰V-PDB]
C1–33.9–34.6–34.4–34.3–45.3
C2–47.3–32.9–21.5–21.1–24.8
C34.54.53.92.98.8
i-C42.64.4 2.31.1
neo-C5–23.0–23.3–22.8–23.2–21.4
2,2DMB–18.3–19.0–19.3–18.6–15.7
2,3DMB–21.9–20.5 –21.6
n-C6–23.0–22.6 –23.0
n-C7–28.1–26.6 –27.4
n-C8–26.4
CO231.431.531.831.9–10.2
Isotopic composition [δD ‰V-SMOW]
C1–162–166–158–161–183
neo-C5–125–124–133–125–119
Notes: mbsf: meters below sea floor; blank: not measured; n.d.: not detected; DMB: dimethylbutane.

5. Discussion

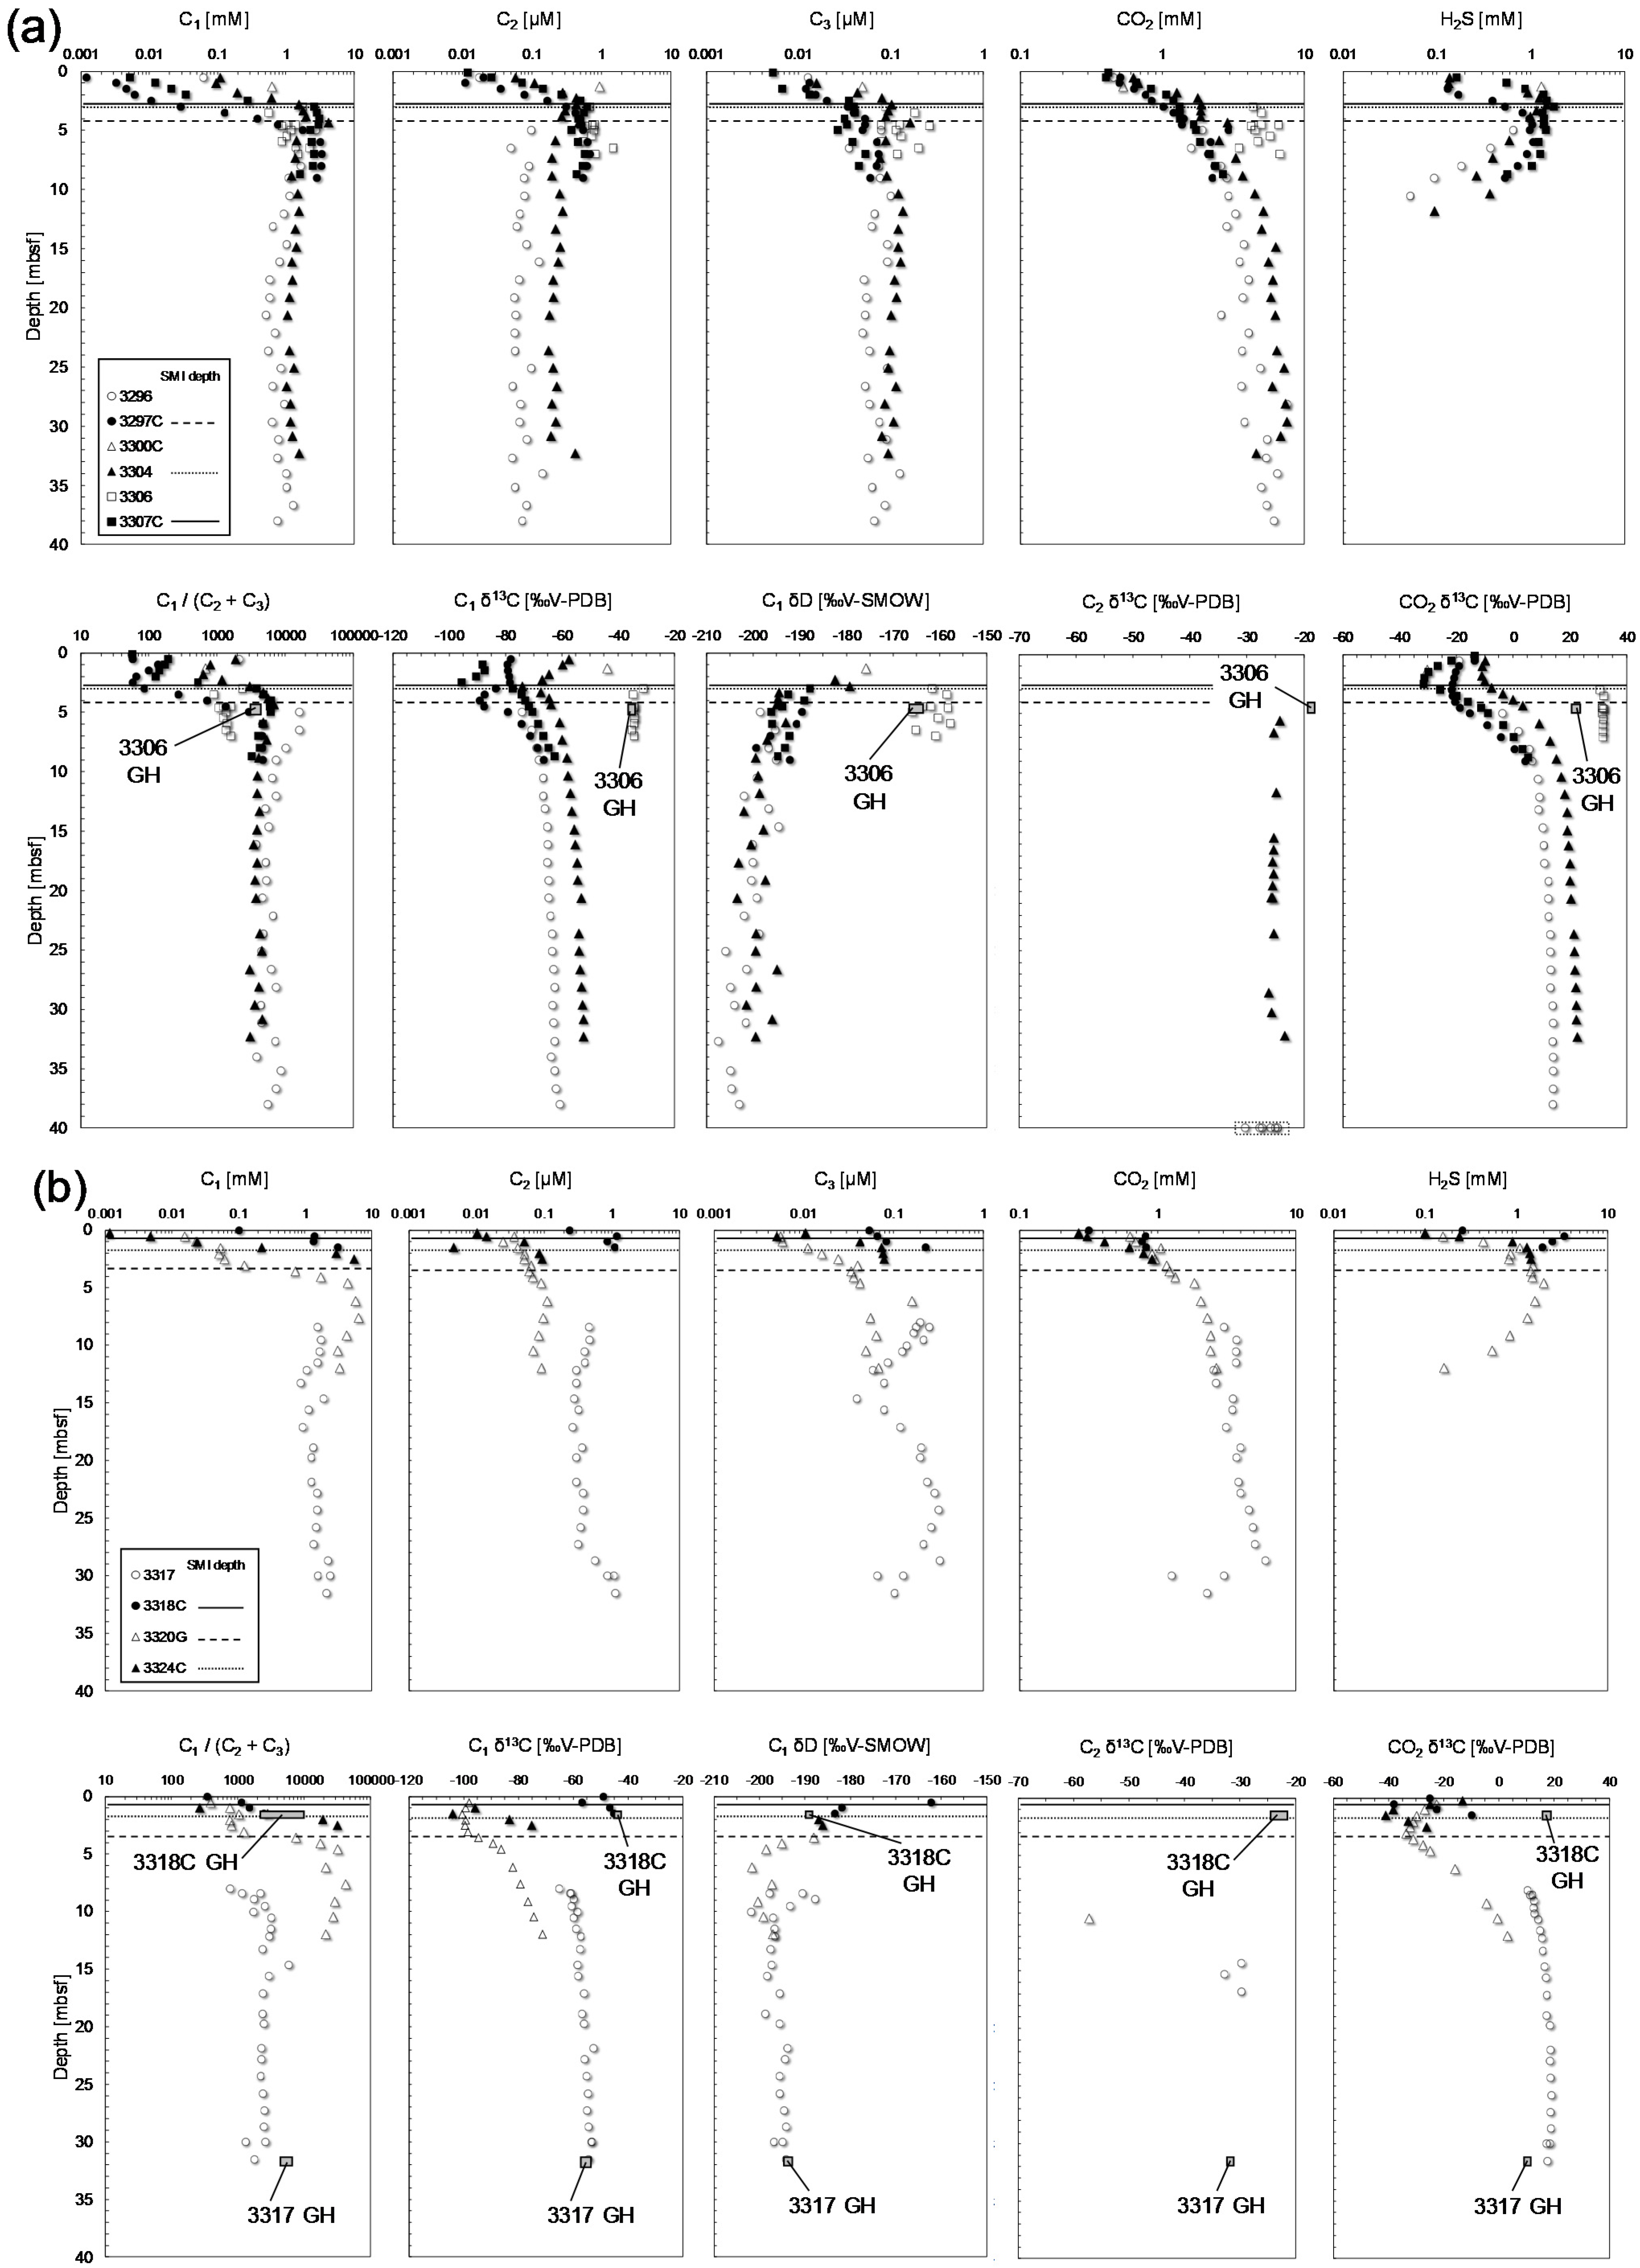
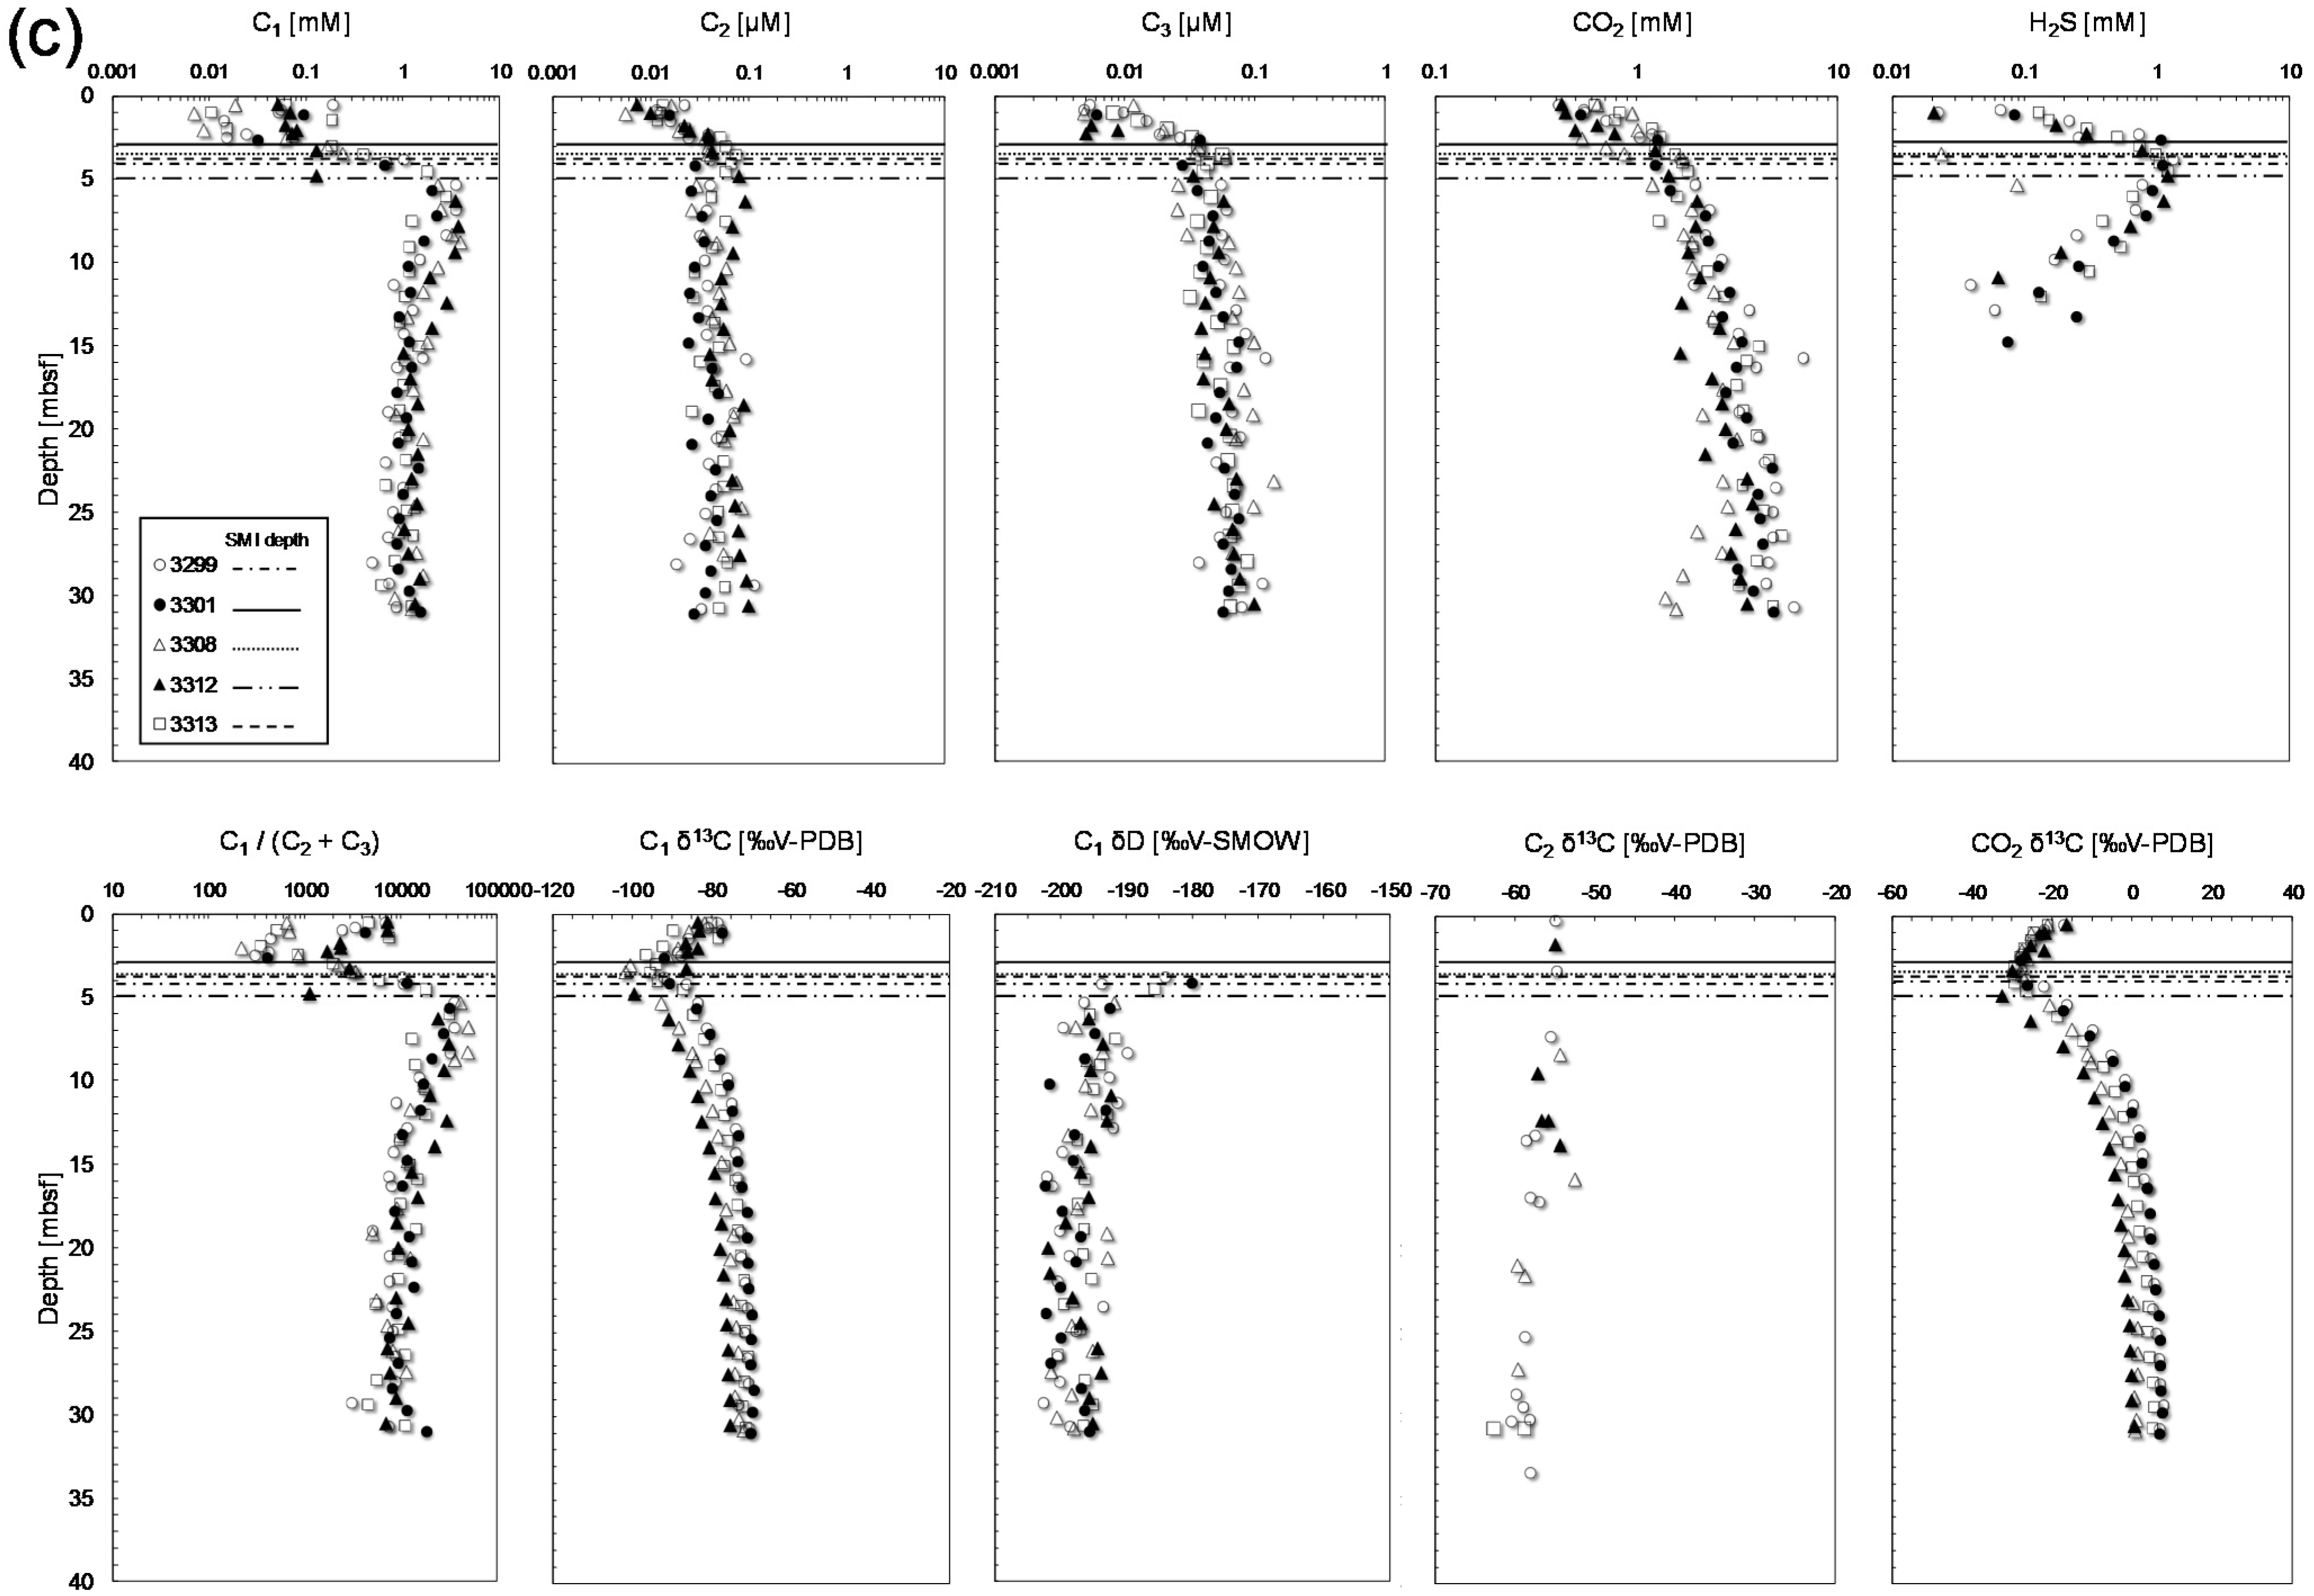
5.1. Depth Profiles of Headspace Gas

Shallow SMI was observed in the Joetsu Basin area including Umitaka Spur and Joetsu Knoll, suggesting that the hydrocarbon flux from great depth was primarily high. The peak of the C1 concentrations and high C1/(C2 + C3) values appeared around 5–8 mbsf, indicating high microbial C1 production (methanogenesis) just beneath the SMI. Negative C1 δ13C and CO2 δ13C peaks and high H2S concentrations were observed around the SMI (Figure 2a–c), which typically results from the anaerobic oxidation of methane (AOM). C1 δ13C decreased around the SMI can be explained as a result of carbon recycling between the AOM and methanogenesis [33]. ANME-1 and ANME-2 groups were distinguished at Umitaka Spur and Joetsu Knoll [34] using the lipid biomarker signatures of the AOM communities [35]. In the same study area, the occurrence of AOM in the SMI zone is also supported by environmental DNA analysis [36]. Similar relations between the depth profiles of C1 δ13C and CO2 δ13C were also reported in the gassy sediment of Eckernförde Bay in the western Baltic Sea [37] and in the C1-rich sediment near a gas chimney in northern Gulf of Mexico [38]. Although high C1 δ13C was observed in the hydrate-bearing core MD179-3318C that indicated thermogenic origin according to empirical classifications [21,39], depleted C1/(C2+C3), C1 δ13C, and CO2 δ13C around SMI were observed even in the MD179-3318C, suggesting that C1 is basically thermogenic and the top layer around SMI depth is affected by microbial alternation.
The upward increase in the profiles of C1 δ13C and CO2 δ13C above the SMI is due to C1 oxidation near the sea floor [39]. On the other hand, the increase in the C1 δ13C below the SMI is explained by the concurrent increase in the CO2 δ13C with depth, resulting from the reduction of CO2 in the methanegenic zone and the Rayleigh process. Except for MD179-3306, the profiles of C1 δD were almost identical and gradually decreased with depth. This trend agrees fairly well with previously published δD profiles of pore water (ambient H2O) in the same cores [40]; this is because C1 δD is primarily determined by δD of H2O and H2 in the ambient water in the case of microbial C1 generation via CO2 reduction [41]. In contrast, the profile of C1 δD for MD179-3306 was distinctly larger than those of other cores, indicating that C1 is of thermogenic origin.
The concentration of C2 in the three hydrate-bearing cores below the SMI was nearly one order of magnitude higher than that in the nonhydrate-bearing cores (Figure 2a–c), and the other cores at Umitaka Spur were also rich in C2. These C2-rich cores showed 13C enrichment in C2. The concentrations of C3 in the hydrate-bearing cores and in MD179-3304 were also higher than in the nonhydrate-bearing cores. The results for C2 and C3 suggest two possibilities: (1) injections of thermogenic hydrocarbons from greater depth and (2) dissociation of tiny amounts of C2- and C3- rich sII hydrates during recovery process of sediment cores.
The concentration of C3 in MD179-3317 was conspicuously higher (0.039–0.331 μM) than in the other cores, whereas the hydrate-bound C3 in MD179-3317 was negligible (0.0001% of the hydrate-bound gas, Table 1). Because sI gas hydrates cannot encage C3, it is reasonable to assume that C3 was excluded from the hydrate formation. Similar molecular fractionations were described in previous studies [42,43,44].

5.2. Effect of Gas Characteristics on Hydrate Crystal

The relation between the molecular ratio of hydrate-bound hydrocarbons and the stable carbon and hydrogen isotopic ratio of individual hydrate-bound volatiles is shown in Figure 3. The Bernard plot (Figure 3a), which compares C1 δ13C with C1/(C2 + C3) [21], is useful for understanding the gas origin and its pathway. The data from stations MD179-3305G, 3306, and 3318C plot in the mixed gas field, whereas those from MD179-3317 plot near and within the field of microbial hydrocarbons (Figure 3a). These relation between C1 δ13C and C1/(C2 + C3) at Umitaka Spur and Joetsu Knoll agree well with those obtained in a previous study [22].
Figure 3. Relationship between molecular and isotopic composition of hydrate-bound hydrocarbons. (a) “Bernard plot” showing relationship between C1 δ13C and C1/(C2 + C3) values [21]. The data agree well with those obtained at the same area from 2005 to 2008 [22]. The headspace gas data obtained from deeper sediment layer of Umitaka Spur at depths 993−2016 m below the sea floor [20] are plotted; (b) Relationship between C1 δ13C and C2 δ13C, based on the classification of Milkov [4].
Energies 08 04647 g003
Figure 3b shows the relation between C1 δ13C and C2 δ13C. The boundaries between thermogenic and microbial origins are based on literature [4,45,46]. C2 δ13C ranged from −31.9‰ to −17.9‰, plotted in the field of thermogenic C2 [4,45,46]. Because microbial C2 is generally a minor component of microbial gas (<0.1%, see Figure 3a) and is depleted in 13C [46], mixing of microbial and thermogenic hydrocarbons slightly decreases the C2 δ13C and strongly decreases the C1 δ13C.
The molecular ratios of hydrate-bound hydrocarbons and stable carbon isotope signatures of C1 shown in Figure 3a indicate a mixed gas origin for the hydrate at Umitaka Spur, implying depletion of C2 and C3 from the thermogenic gas field in Figure 3a (C1/(C2 + C3) < 100). C1/(C2 + C3) values were less than 100 at depths 1143−2016 m below the sea floor at Umitaka Spur [20]. Although thermogenic gas might contain significant amounts of C2 and C3 (sometimes >10 mol%), as found in samples from the Gulf of Mexico [13,47], the northern Cascadia margin offshore Vancouver Island [48], and the Caspian Sea [6], the composition of C2 and C3 of hydrate-bound hydrocarbons at Umitaka Spur was less than 0.04% and 0.002%, respectively (Table 1). These results can be explained by molecular hydrocarbon fractionation during upward gas migration [49]. Several similar theories have been proposed, e.g., formation of C2-rich gas hydrates in the deep layers and C2 depletion in the residual migrating gas [22], and adsorption of C2 and C3 to the mineral matrix during migration [30]. Assuming steady-state upward migration of thermogenic hydrocarbons, we have to consider the consumption and/or degradation of C2 and C3 in the deeper sediment layers. Non-C1 hydrocarbon degradation [43,50,51] likely selectively decreases C2 and C3.
Stable isotope signatures (C1 δ13C, C2 δD, and C2 δ13C) of hydrate-bound and headspace gases were almost the same with each other (Figure 2a,b); however, distinct differences were found in CO2 δ13C. Previous studies showed no or rather small differences in CO2 δ13C between stable isotopes of hydrate-bound and headspace gases [42,52]. It remains unsettled and further studies are needed to find the reason why such large differences in CO2 δ13C existed.
Although C3 composition of hydrate-bound gas was very small (less than 0.0025 mol%, Table 1), we need to discuss the existence of C3 in the hydrate-bound gas. C1, C2, CO2, and H2S can be encaged in the sI gas hydrate [1], but C3 is exclusively found in the sII gas hydrate because of its large molecular size. It is possible that C3 in these samples was a contaminant from the sediments attached to the hydrate during the preparation of the hydrate-bound gas. Based on the gas compositions, the gas hydrates investigated in this study were assumed to be mainly sI. This assumption is supported by the powder X-ray diffraction (PXRD) data for gas hydrates collected from Umitaka Spur and Joetsu Knoll in the past [53,54]. Nevertheless, we cannot exclude the potential coexistence of sI (C1-rich) and sII (C3 encaged in the large cages) gas hydrates, because PXRD cannot detect small amounts of sII. As encaged C3 molecules in C1-rich natural gas hydrate retrieved at the Mackenzie Delta (Onshore, Canada) were detected by Raman spectroscopy [55], heterogeneity of hydrocarbons in the different crystallographic structures is an attractive research target in the future from the viewpoint of crystal growth process of natural gas hydrates.

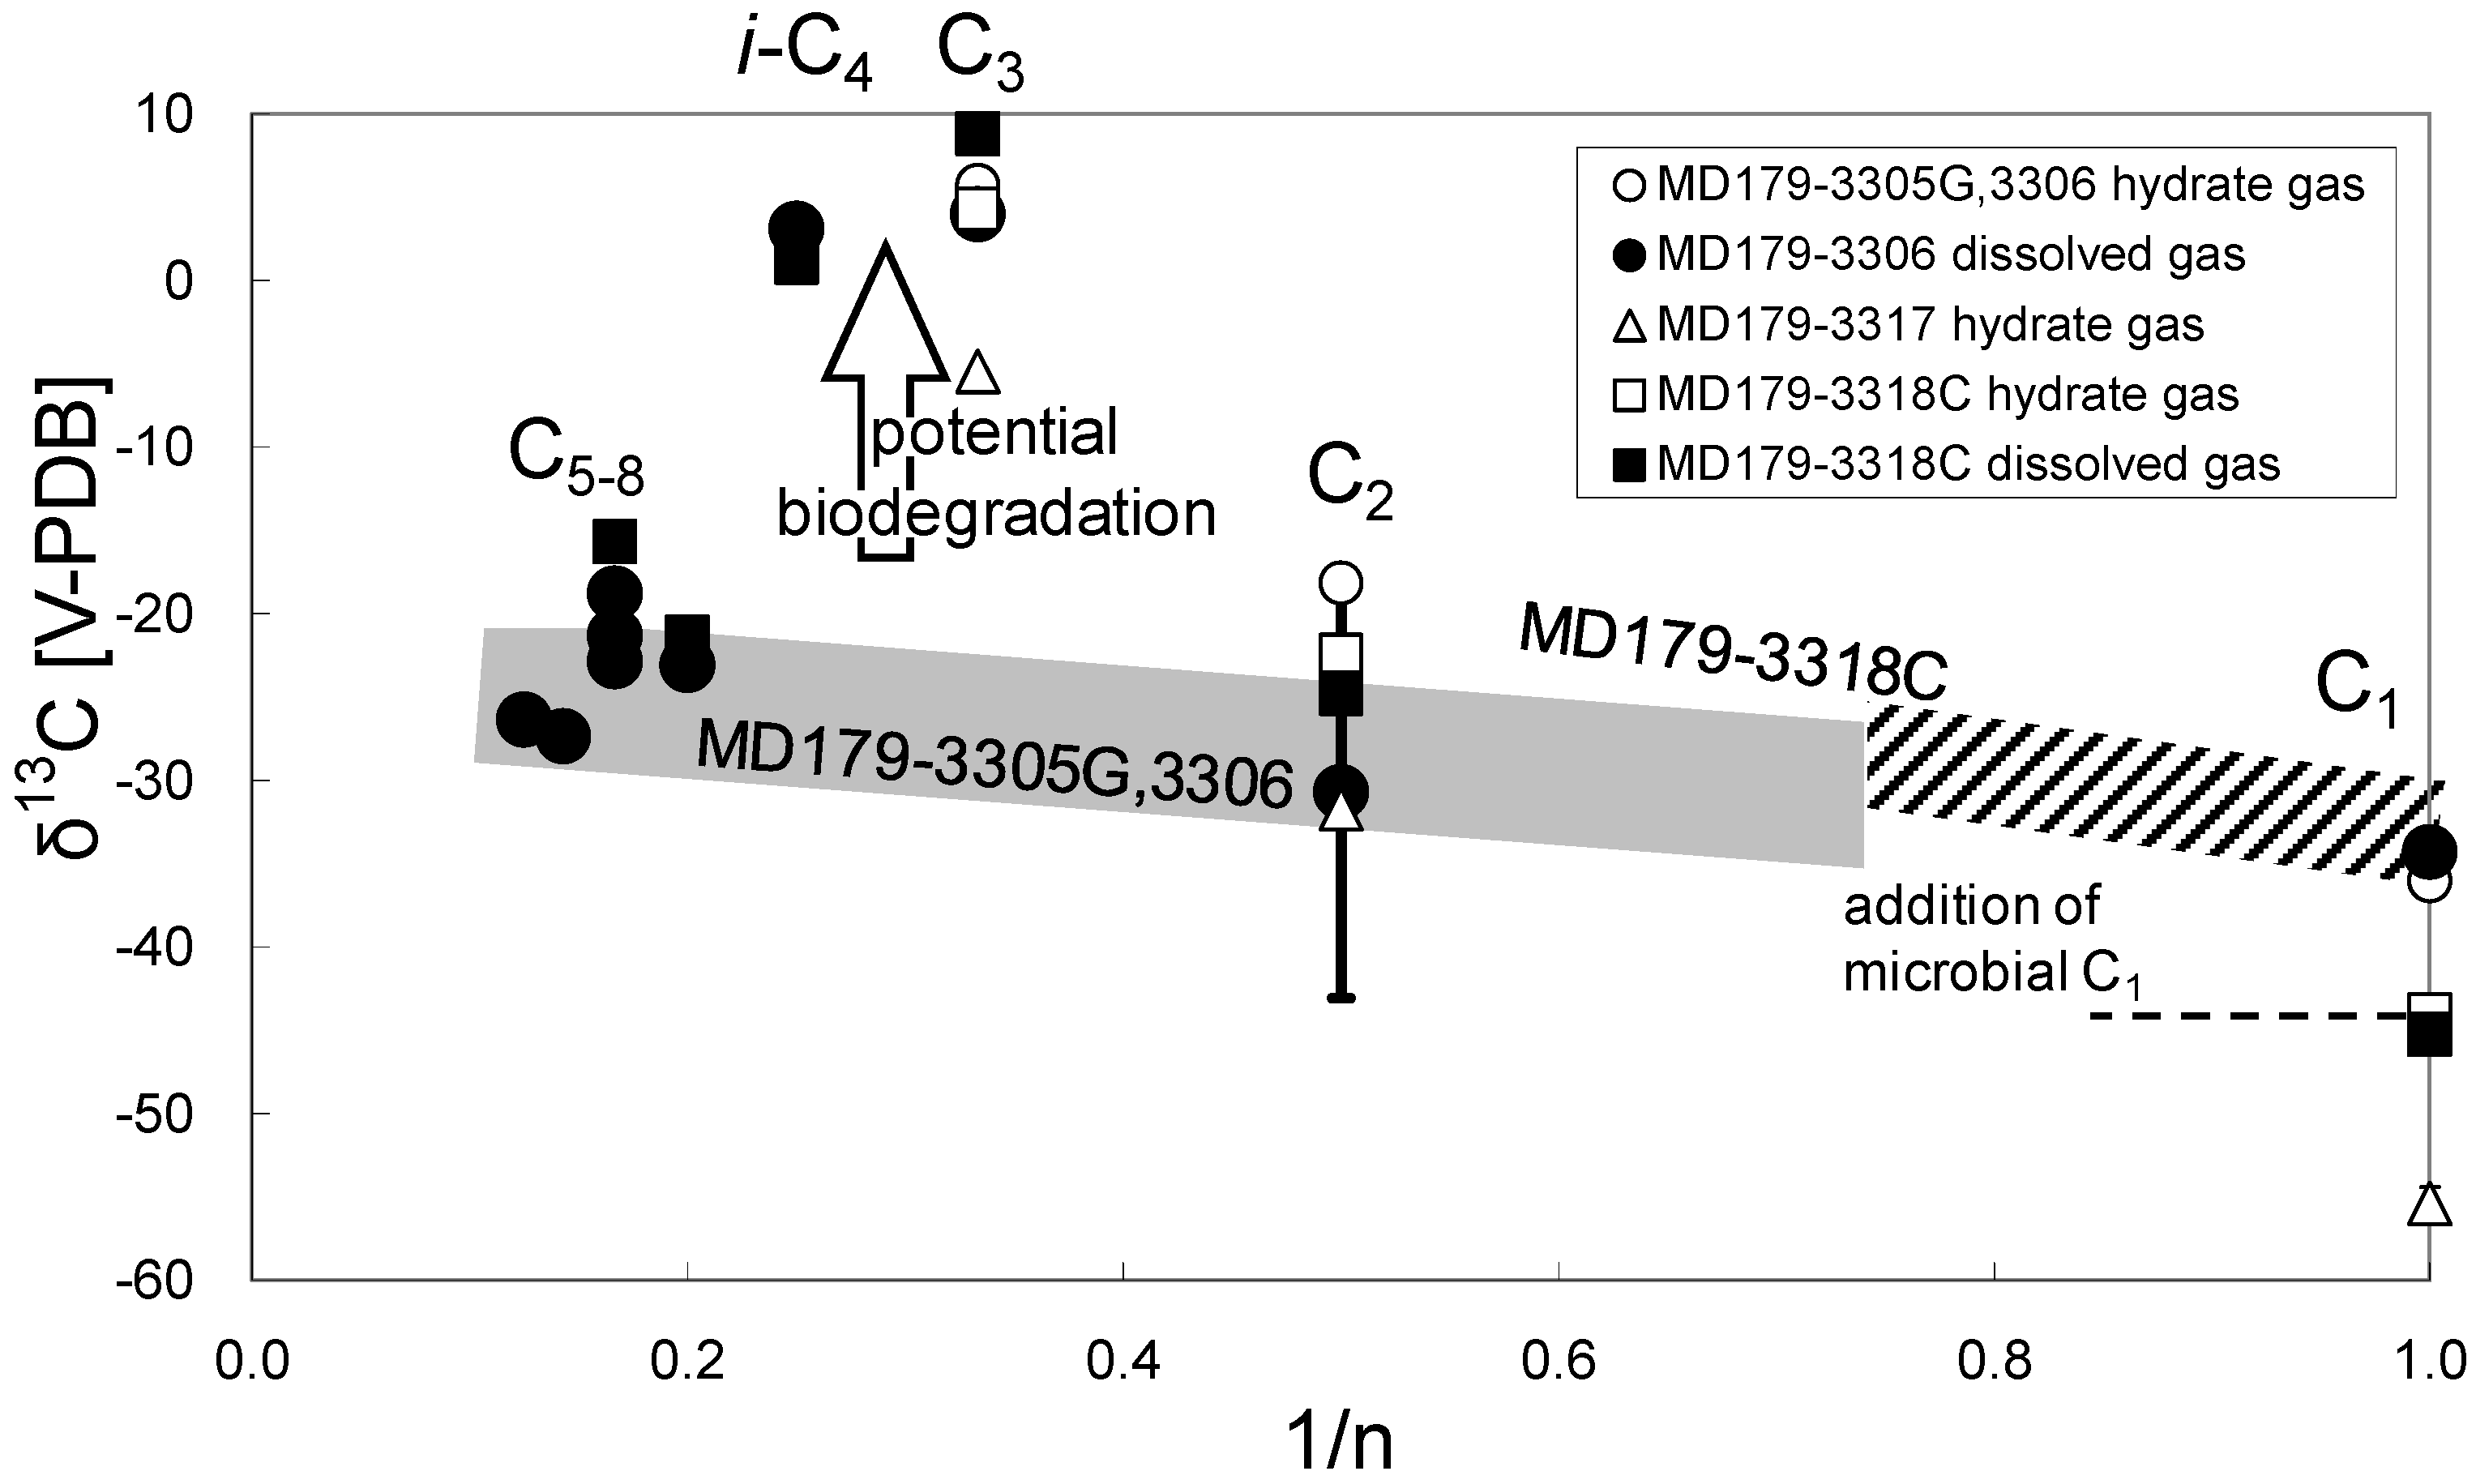
5.3. Neopentane and Non-Methane Hydrocarbons in the Headspace Gases

The presence of gem-dimethyl hydrocarbons was previously reported in the Deep Sea Drilling Project Holes 381 and 397 [56,57]. neo-C5 is considered to form from the decomposition of gem-dimethylcycloalkanes derived from the terpenes of terrestrial organic matter [56]. Unusually high concentration of neo-C5 in gases extracted from the Athabasca oil sands and proposed that neo-C5 forms from the microbial degradation of bitumen [58]. Although the origin of neo-C5 remains unknown, the potential involvement of microbes has been suggested [57]. Schaefer and Leythaeuser [59] explained that enrichment of neo-C5 is caused by preferential diffusion due to the nearly spherical molecules and its diffusion coefficient, which is higher than that of less branched isomers.
Although neo-C5 can be encaged in the large cages of sII gas hydrates [17], only trace levels of neo-C5 were detected in the samples of hydrate-bound gas, perhaps because of contamination with the sediment gas at their retrieval process. Similar to C3, during the formation of sI gas hydrates, neo-C5 is excluded and remains in sediment. However, negligible amounts of sII gas hydrates containing neo-C5 could also be present, which dissociated during core retrieval. While C3 and neo-C5 in C1-rich hydrocarbons decrease the equilibrium pressures and stabilize their hydrate phase, the dissociation behavior of the gas hydrate depends on the guest molecules. C1 hydrate shows self-preservation phenomena [60] in the dissociation process; however, the hydrates with lower decomposition pressures (C2 and C3) do not show it [61]. Further investigations are needed to understand the behavior of the small amount of sII formers, C3 and neo-C5.
C3 δ13C and i-C4 δ13C were exceptionally high compared with δ13C of the other hydrocarbons as shown in Table 2. Possibly, 13C-depleted C3 and i-C4 were preferentially consumed as microbial substrates; hence, the residual C3 and i-C4 were enriched in 13C [30]. The concentration of n-C4 was below the detection limit (0.00006 mol% of the original headspace sample) of the CF-IRMS; n-C4 is easily transformed by hydrocarbon degraders, whereas C2 and i-C4 appear less affected or remain unaltered [42,50,51,62]. Therefore, it is reasonable to assume that n-C4 was consumed primarily by biodegradation because it is more affected by biodegradation than i-C4. δ13C of C1–C8 are plotted in Figure 4: the so-called “Natural gas plot” [63]. In the Umitaka Spur area, δ13C values of C1–C8 except C3 and i-C4 show a linear trend, indicating no microbial contribution in C1. Moreover, the hydrate-bound C1 comprised pure thermogenic gas.
Figure 4. δ13C of hydrocarbons plotted in the “Natural gas plot” adapted from [63], where n is the number of the carbon atoms of individual hydrocarbon molecules. δ13C of C1, C2, C3, n-C4, and n-C5 were plotted in the original natural gas plot. However, we plotted the data of i-C4 (instead of n-C4), neo-C5 (instead of n-C5), and C6–8 shown in Table 2. The concentrations of n-C4, and n-C5 were below the detection limit. Thick shaded lines show linear relation between C2 and C8 for MD179-3305G and 3306 (Umitaka Spur) and for MD179-3318C (Joetsu Knoll), except 13C-rich C3 and i-C4 due to potential biodegradation. C2 δ13C of MD179-3306 has a large error bar because of wide distribution along with depth (Table 2).
Energies 08 04647 g004
In contrast, these gases mixed with microbial C1 during migration to shallow sediment layers in the Joetsu Knoll area, as C1 δ13C decreased from the anticipated thermogenic C1 value for MD179-3318C.

6. Conclusions

Molecular and stable carbon and hydrogen isotopic compositions of hydrate-bound and pore-water gas were reported for samples retrieved from Umitaka Spur and Joetsu Knoll at the eastern margin of the Japan Sea. According to empirical classifications of gas data, the hydrate-bound gas from Umitaka Spur was of thermogenic origin and that from Joetsu Knoll partly contained microbial gas. C1 concentration depth profiles showed shallow SMI in these areas, indicating high C1 flux. The molecular composition of C2 and C3 for the headspace gas of hydrate-bound cores were around a thousandth smaller than those of hydrate-bound thermogenic gases across the world, and C3 δ13C and i-C4 δ13C were exceptionally high (+1.1‰ to +8.8‰) in the pore water, suggesting that biodegradation affects these hydrocarbons in hydrate-bearing sediment systems.
High concentration of neo-C5 was detected in the pore water gases in MD179-3306 (Umitaka Spur) and 3318C (Joetsu Knoll), which suggests that neo-C5 was excluded from the hydrate crystal during the formation process and thus remained in the pore water, because neo-C5 cannot be encaged by sI gas hydrates. This is supported by the observation that the concentration of C3 in the hydrate-bearing core was higher than that in the nonhydrate-bearing cores. However, small amounts of sII gas hydrate can possibly encage these heavier hydrocarbons. Because neo-C5 forms from the microbial degradation of organic matter and is easy to diffuse in sediment layers, the accumulation of neo-C5 in subsurface sediment can affect and change the crystallographic properties of gas hydrates in marine sediments.

Acknowledgments

We appreciate the support of the crew onboard R/V Marion Dufresne during the MD179/Japan Sea Gas Hydrate cruise. We express our gratitude to the scientists onboard the MD179/Japan Sea Gas Hydrate cruise. We also thank Thomas Pape (University of Bremen, Germany) for valuable suggestions and comments. This study was mainly supported by the MH21 Research Consortium for Methane Hydrate Resources in Japan, and the analytical system was supported by the Grant-in-Aid for Scientific Research (C) 22540485 and (B) 26303021 of the Japan Society for the Promotion of Science (JSPS).

Author Contributions

Akihiro Hachikubo designed the study, performed gas analysis, and drafted the manuscript. Katsunori Yanagawa (microbiology), Hitoshi Tomaru (pore water geochemistry), and Hailong Lu (crystallography) helped to draft the manuscript from their professional point of view. Ryo Matsumoto designed the framework of the MD179 cruise. All authors discussed the results and approved the final manuscript.

Conflicts of Interest

The authors declare no conflict of interest.

References

  1. Sloan, E.D.; Koh, C.A. Clathrate Hydrates of Natural Gases, 3rd ed.; CRC Press: Boca Raton, FL, USA, 2008. [Google Scholar]
  2. Kvenvolden, K.A. Potential effects of gas hydrate on human welfare. Proc. Natl. Acad. Sci. USA 1999, 96, 3420–3426. [Google Scholar] [CrossRef] [PubMed]
  3. Judd, A.G.; Hovland, M.; Dimitrov, L.I.; García Gil, S.; Jukes, V. The geological methane budget at continental margins and its influence on climate change. Geofluids 2002, 2, 109–126. [Google Scholar] [CrossRef]
  4. Milkov, A.V. Molecular and stable isotope compositions of natural gas hydrates: A revised global dataset and basic interpretations in the context of geological settings. Org. Geochem. 2005, 36, 681–702. [Google Scholar] [CrossRef]
  5. Paull, C.K.; Ussler, W., III; Borowski, W.S.; Spiess, F.N. Methane-rich plumes on the Carolina continental rise: Associations with gas hydrates. Geology 1995, 23, 89–92. [Google Scholar] [CrossRef]
  6. Ginsburg, G.D.; Soloviev, V.A. Submarine Gas Hydrates; VNIIOkeangeologia: St. Petersburg, Russia, 1998. [Google Scholar]
  7. Heeschen, K.U.; Tréhu, A.M.; Collier, R.W.; Suess, E.; Rehder, G. Distribution and height of methane bubble plumes on the Cascadia Margin characterized by acoustic imaging. Geophys. Res. Lett. 2003, 30. [Google Scholar] [CrossRef]
  8. Kvenvolden, K.A. Gas hydrates―Geological perspective and global change. Rev. Geophys. 1993, 31, 173–187. [Google Scholar] [CrossRef]
  9. Sloan, E.D., Jr. Fundamental principles and applications of natural gas hydrates. Nature 2003, 426, 353–363. [Google Scholar] [CrossRef] [PubMed]
  10. Boswell, R.; Collett, T.S. Current perspectives on gas hydrate resources. Energy Environ. Sci. 2011, 4, 1206–1215. [Google Scholar] [CrossRef]
  11. Subramanian, S.; Kini, R.A.; Dec, S.F.; Sloan, E.D. Evidence of structure II hydrate formation from methane + ethane mixtures. Chem. Eng. Sci. 2000, 55, 1981–1999. [Google Scholar] [CrossRef]
  12. Subramanian, S.; Ballard, A.L.; Kini, R.A.; Dec, S.F.; Sloan, E.D. Structural transitions in methane + ethane gas hydrates—Part I: Upper transition point and applications. Chem. Eng. Sci. 2000, 55, 5763–5771. [Google Scholar] [CrossRef]
  13. Brooks, J.M.; Kennicutt, M.C., II; Fay, R.R.; McDonald, T.J.; Sassen, R. Thermogenic gas hydrates in the Gulf of Mexico. Science 1984, 225, 409–411. [Google Scholar] [CrossRef] [PubMed]
  14. Bourry, C.; Chazallon, B.; Charlou, J.L.; Donval, J.P.; Ruffine, L.; Henry, P.; Geli, L.; Çagatay, M.N.; İnan, S.; Moreau, M. Free gas and gas hydrates from the Sea of Marmara, Turkey. Chemical and structural characterization. Chem. Geol. 2009, 264, 197–206. [Google Scholar] [CrossRef]
  15. Kida, M.; Khlystov, O.; Zemskaya, T.; Takahashi, N.; Minami, H.; Sakagami, H.; Krylov, A.; Hachikubo, A.; Yamashita, S.; Shoji, H.; et al. Coexistence of structure I and II gas hydrates in Lake Baikal suggesting gas sources from microbial and thermogenic origin. Geophys. Res. Lett. 2006, 33. [Google Scholar] [CrossRef]
  16. Kida, M.; Hachikubo, A.; Sakagami, H.; Minami, H.; Krylov, A.; Yamashita, S.; Takahashi, N.; Shoji, H.; Khlystov, O.; Poort, J.; et al. Natural gas hydrates with locally different cage occupancies and hydration numbers in Lake Baikal. Geochem. Geophys. Geosyst. 2009, 10. [Google Scholar] [CrossRef]
  17. Davidson, D.W.; Garg, S.K.; Gough, S.R.; Hawkins, R.E.; Ripmeester, J.A. Characterization of natural gas hydrates by nuclear magnetic resonance and dielectric relaxation. Can. J. Chem. 1977, 55, 3641–3650. [Google Scholar] [CrossRef]
  18. Aoyama, C.; Matsumoto, R. Acoustic surveys of methane plumes by quantitative echo sounder in Japan Sea and the estimate of the seeping amount of the methane hydrate bubbles. J. Geogr. 2009, 118, 156–174. (In Japanese) [Google Scholar] [CrossRef]
  19. Matsumoto, R.; Okuda, Y.; Aoyama, C.; Hiruta, A.; Ishida, Y.; Sunamura, M.; Numanami, H.; Tomaru, H.; Snyder, G.; Komatsubara, J.; et al. Methane plumes over a marine gas hydrate system in the eastern margin of Japan Sea: A possible mechanism for the transportation of subsurface methane to shallow waters. In Proceedings of the 5th International Conference on Gas Hydrates, Trondheim, Norway, 13–16 June 2005; Volume 3006, pp. 749–754.
  20. Monzawa, N.; Kaneko, M.; Osawa, M. A review of petroleum system in the deep water area of the Toyama Trough to the Sado Island in the Japan Sea, based on the results of the METI Sado Nansei Oki drilling. J. Jpn. Assoc. Pet. Technol. 2006, 71, 618–627. (In Japanese) [Google Scholar] [CrossRef]
  21. Bernard, B.B.; Brooks, J.M.; Sackett, W.M. Natural gas seepage in the Gulf of Mexico. Earth Planet. Sci. Lett. 1976, 31, 48–54. [Google Scholar] [CrossRef]
  22. Matsumoto, R.; Okuda, Y.; Hiruta, A.; Tomaru, H.; Takeuchi, E.; Sanno, R.; Suzuki, M.; Tsuchinaga, K.; Ishida, Y.; Ishizaki, O.; et al. Formation and collapse of gas hydrate deposits in high methane flux area of the Joetsu Basin, eastern margin of Japan Sea. J. Geogr. 2009, 118, 43–71. (In Japanese) [Google Scholar] [CrossRef]
  23. Hachikubo, A.; Yanagawa, K.; Tomaru, H.; Matsumoto, R. Dissolved gas analysis of pore water in subsurface sediments retrieved at eastern margin of Japan Sea (MD179 gas hydrates cruise). J. Jpn. Assoc. Pet. Technol. 2012, 77, 268–273. (In Japanese) [Google Scholar] [CrossRef]
  24. Saeki, T.; Inamori, T.; Nagakubo, S.; Ward, P.; Asakawa, E. 3D seismic velocity structure below mounds and pockmarks in the deep water southwest of the Sado Island. J. Geogr. 2009, 118, 93–110. (In Japanese) [Google Scholar] [CrossRef]
  25. Hiruta, A.; Snyder, G.T.; Tomaru, H.; Matsumoto, R. Geochemical constraints for the formation and dissociation of gas hydrate in an area of high methane flux, eastern margin of the Japan Sea. Earth Planet. Sci. Lett. 2009, 279, 326–339. [Google Scholar] [CrossRef]
  26. Machiyama, H.; Kinoshita, M.; Takeuchi, R.; Matsumoto, R.; Yamano, M.; Hamamoto, H.; Hiromatsu, M.; Satoh, M.; Komatsubara, J. Heat flow distribution around the Joetsu gas hydrate field, western Joetsu basin, eastern margin of the Japan Sea. J. Geogr. 2009, 118, 986–1007. (In Japanese) [Google Scholar] [CrossRef]
  27. Freire, A.F.M.; Menezes, T.R.; Matsumoto, R.; Sugai, T.; Miller, D.J. Origin of the organic matter in the Late Quaternary sediments of the eastern margin of Japan Sea. J. Sedimentol. Soc. Jpn. 2009, 68, 117–128. [Google Scholar] [CrossRef]
  28. Hachikubo, A.; Krylov, A.; Sakagami, H.; Minami, H.; Nunokawa, Y.; Shoji, H.; Matveeva, T.; Jin, Y.K.; Obzhirov, A. Isotopic composition of gas hydrates in subsurface sediments from offshore Sakhalin Island, Sea of Okhotsk. Geo-Mar. Lett. 2010, 30, 313–319. [Google Scholar] [CrossRef]
  29. Hachikubo, A.; Khlystov, O.; Krylov, A.; Sakagami, H.; Minami, H.; Nunokawa, Y.; Yamashita, S.; Takahashi, N.; Shoji, H.; Nishio, S.; et al. Molecular and isotopic characteristics of gas hydrate-bound hydrocarbons in southern and central Lake Baikal. Geo-Mar. Lett. 2010, 30, 321–329. [Google Scholar] [CrossRef]
  30. Waseda, A.; Iwano, H. Reservoir evaluation using carbon isotope composition of gas. J. Jpn. Assoc. Pet. Technol. 2007, 72, 585–593. (In Japanese) [Google Scholar] [CrossRef]
  31. Sakagami, H.; Takahashi, N.; Hachikubo, A.; Minami, H.; Yamashita, S.; Shoji, H.; Khlystov, O.; Kalmychkov, G.; Grachev, M.; de Batist, M. Molecular and isotopic composition of hydrate-bound and sediment gases in the southern basin of Lake Baikal, based on an improved headspace gas method. Geo-Mar. Lett. 2012, 32, 465–472. [Google Scholar] [CrossRef]
  32. Gealy, E.L.; Dubois, R. Shipboard geochemical analysis, Leg 7, Glomar Challenger. Initial Rep. Deep Sea Drill. Proj. 1971, 7, 863–869. [Google Scholar]
  33. Knab, N.J.; Cragg, B.A.; Hornibrook, E.R.C.; Holmkvist, L.; Pancost, R.D.; Borowski, C.; Parkes, R.J.; Jørgensen, B.B. Regulation of anaerobic methane oxidation in sediments of the Black Sea. Biogeosciences 2009, 6, 1505–1518. [Google Scholar] [CrossRef]
  34. Ogihara, S.; Ishizaki, O.; Matsumoto, R. Organic geochemical analysis of push core sediment samples collected from NT-06-19 (Umitaka Spur and Joetsu Knoll off Naoetsu). J. Geogr. 2009, 118, 128–135. (In Japanese) [Google Scholar] [CrossRef]
  35. Niemann, H.; Elvert, M. Diagnostic lipid biomarker and stable carbon isotope signatures of microbial communities mediating the anaerobic oxidation of methane with sulphate. Org. Geochem. 2008, 39, 1668–1677. [Google Scholar] [CrossRef]
  36. Yanagawa, K.; Sunamura, M.; Lever, M.A.; Morono, Y.; Hiruta, A.; Ishizaki, O.; Matsumoto, R.; Urabe, T.; Inagaki, F. Niche separation of methanotrophic archaea (ANME-1 and -2) in methane-seep sediments of the Eastern Japan Sea offshore Joetsu. Geomicrobiol. J. 2011, 28, 118–129. [Google Scholar] [CrossRef]
  37. Martens, C.S.; Albert, D.B.; Alperin, M.J. Stable isotope tracing of anaerobic methane oxidation in the gassy sediments of Eckernförde Bay, German Baltic Sea. Am. J. Sci. 1999, 299, 589–610. [Google Scholar] [CrossRef]
  38. Ussler, W., III; Paull, C.K. Rates of anaerobic oxidation of methane and authigenic carbonate mineralization in methane-rich deep-sea sediments inferred from models and geochemical profiles. Earth Planet. Sci. Lett. 2008, 266, 271–287. [Google Scholar] [CrossRef]
  39. Whiticar, M.J. Carbon and hydrogen isotope systematics of bacterial formation and oxidation of methane. Chem. Geol. 1999, 161, 291–314. [Google Scholar] [CrossRef]
  40. Tomaru, H.; Hachikubo, A.; Yanagawa, K.; Muramatsu, Y.; Anzai, H.; Snyder, G.T.; Matsumoto, R. Geochemistry of pore waters from gas hydrate research in the eastern margin of the Japan Sea (MD179). J. Jpn. Assoc. Pet. Technol. 2012, 77, 262–267. (In Japanese) [Google Scholar] [CrossRef]
  41. Kawagucci, S.; Kobayashi, M.; Hattori, S.; Yamada, K.; Ueno, Y.; Takai, K.; Yoshida, N. Hydrogen isotope systematics among H2–H2O–CH4 during the growth of the hydrogenotrophic methanogen Methanothermobacter thermautotrophicus strain ΔH. Geochim. Cosmochim. Acta 2014, 142, 601–614. [Google Scholar] [CrossRef]
  42. Pape, T.; Bahr, A.; Rethemeyer, J.; Kessler, J.D.; Sahling, H.; Hinrichs, K.-U.; Klapp, S.A.; Reeburgh, W.S.; Bohrmann, G. Molecular and isotopic partitioning of low-molecular-weight hydrocarbons during migration and gas hydrate precipitation in deposits of a high-flux seepage site. Chem. Geol. 2010, 269, 350–363. [Google Scholar] [CrossRef]
  43. Milkov, A.V.; Claypool, G.E.; Lee, Y.-J.; Torres, M.E.; Borowski, W.S.; Tomaru, H.; Sassen, R.; Long, P.E. ODP Leg 204 Scientific Party Ethane enrichment and propane depletion in subsurface gases indicate gas hydrate occurrence in marine sediments at southern Hydrate Ridge offshore Oregon. Org. Geochem. 2004, 35, 1067–1080. [Google Scholar] [CrossRef]
  44. Sassen, R.; Sweet, S.T.; DeFreitas, D.A.; Milkov, A.V. Exclusion of 2-methylbutane (isopentane) during crystallization of structure II gas hydrate in sea-floor sediment, Gulf of Mexico. Org. Geochem. 2000, 31, 1257–1262. [Google Scholar] [CrossRef]
  45. Sassen, R.; Curiale, J.A. Microbial methane and ethane from gas hydrate nodules of the Makassar Strait, Indonesia. Org. Geochem. 2006, 37, 977–980. [Google Scholar] [CrossRef]
  46. Taylor, S.W.; Sherwood Lollar, B.; Wassenaar, L.I. Bacteriogenic ethane in near-surface aquifers: Implications for leaking hydrocarbon well bores. Environ. Sci. Technol. 2000, 34, 4727–4732. [Google Scholar] [CrossRef]
  47. Sassen, R.; Joye, S.; Sweet, S.T.; DeFreitas, D.A.; Milkov, A.V.; MacDonald, I.R. Thermogenic gas hydrates and hydrocarbon gases in complex chemosynthetic communities, Gulf of Mexico continental slope. Org. Geochem. 1999, 30, 485–497. [Google Scholar] [CrossRef]
  48. Pohlman, J.W.; Canuel, E.A.; Chapman, N.R.; Spence, G.D.; Whiticar, M.J.; Coffin, R.B. The origin of thermogenic gas hydrates on the northern Cascadia Margin as inferred from isotopic (13C/12C and D/H) and molecular composition of hydrate and vent gas. Org. Geochem. 2005, 36, 703–716. [Google Scholar] [CrossRef]
  49. Lorenson, T.D.; Whiticar, M.J.; Waseda, A.; Dallimore, S.R.; Collett, T.S. Gas composition and isotopic geochemistry of cuttings, core, and gas hydrate from the JAPEX/JNOC/GSC Mallik 2L-38 gas hydrate research well. Geol. Surv. Can. Bull. 1999, 544, 143–163. [Google Scholar]
  50. James, A.T.; Burns, B.J. Microbial alteration of subsurface natural gas accumulations. Am. Assoc. Pet. Geol. Bull. 1984, 68, 957–960. [Google Scholar]
  51. Kniemeyer, O.; Musat, F.; Sievert, S.M.; Knittel, K.; Wilkes, H.; Blumenberg, M.; Michaelis, W.; Classen, A.; Bolm, C.; Joye, S.B.; et al. Anaerobic oxidation of short-chain hydrocarbons by marine sulphate-reducing bacteria. Nature 2007, 449, 898–901. [Google Scholar] [CrossRef] [PubMed]
  52. Kim, J.-H.; Torres, M.E.; Choi, J.; Bahk, J.-J.; Park, M.-H.; Hong, W.-L. Influences on gas transport based on molecular and isotopic signatures of gases at acoustic chimneys and background sites in the Ulleung Basin. Org. Geochem. 2012, 43, 26–38. [Google Scholar] [CrossRef]
  53. Lu, H.; Moudrakovski, I.L.; Matsumoto, R.; Dutrisac, R.; Ripmeester, J.A. The characteristics of gas hydrates recovered from shallow sediments at Umitaka spur, Eastern margin of the Sea of Japan. In Proceedings of the American Geophysical Union Fall Meeting 2008, San Francisco, CA, USA, 15–19 December 2008.
  54. Lu, H.; Moudrakovski, I.L.; Ripmeester, J.A.; Ratcliffe, C.I.; Matsumoto, R.; Tani, A. The characteristics of gas hydrates recovered from Joetsu basin, eastern margin of the Sea of Japan. In Proceedings of the 7th International Conference on Gas Hydrates, Edinburgh, UK, 17−21 July 2011.
  55. Uchida, T.; Uchida, T.; Kato, A.; Sasaki, H.; Kono, F.; Takeya, S. Physical properties of natural gas hydrate and associated gas-hydrate-bearing sediments in the JAPEX/JNOC/GSC et al. Mallik 5L-38 gas hydrate production research well. Geol. Surv. Can. Bull. 2005, 585, 1–10. [Google Scholar]
  56. Hunt, J.M.; Whelan, J.K. Dissolved gases in Black Sea sediments. DSDP Initial Rep. 1978, 42, 661–665. [Google Scholar]
  57. Whelan, J.K. C1 to C7 hydrocarbons from IPOD holes 397 and 397A. DSDP Initial Rep. 1979, 47, 531–539. [Google Scholar]
  58. Strausz, O.P.; Jha, K.N.; Montgomery, D.S. Chemical composition of gases in Athabasca bitumen and in low-temperature thermolysis of oil sand, asphaltene and maltene. Fuel 1977, 56, 114–120. [Google Scholar] [CrossRef]
  59. Schaefer, R.G.; Leythaeuser, D. C2–C8 hydrocarbons in sediments from Deep Sea Drilling Project Leg 75, holes 530A, Angola Basin, and 532, Walvis Ridge. DSDP Initial Rep. 1984, 75, 1055–1067. [Google Scholar]
  60. Yakushev, V.S.; Istomin, V.A. Gas-hydrates self-preservation effect. In Physics and Chemistry of Ice; Hokkaido University Press: Sapporo, Japan, 1992; pp. 136–140. [Google Scholar]
  61. Takeya, S.; Ripmeester, J.A. Dissociation behavior of clathrate hydrates to ice and dependence on guest molecules. Angew. Chem. Int. Ed. 2008, 47, 1276–1279. [Google Scholar] [CrossRef]
  62. Wang, W.-C.; Zhang, L.-Y.; Liu, W.-H.; Kang, Y.; Ren, J.-H. Effects of biodegradation on the carbon isotopic composition of natural gas—A case study in the Bamianhe oil field of the Jiyang Depression, Eastern China. Geochem. J. 2005, 39, 301–309. [Google Scholar] [CrossRef]
  63. Chung, H.M.; Gormly, J.R.; Squires, R.M. Origin of gaseous hydrocarbons in subsurface environments: Theoretical considerations of carbon isotope distribution. Chem. Geol. 1988, 71, 97–103. [Google Scholar] [CrossRef]

