1. Introduction
In the face of climate change and energy crisis, low-carbon development was the best approach to ensure sustainable social development [
1,
2,
3,
4,
5,
6,
7]. In communities, optimal dispatches had been studied to minimize carbon emissions [
8,
9,
10]. However, establishing a carbon emissions trading market [
11,
12,
13,
14] was also important to develop a low-carbon economy. Literature [
15] presented the practical significance of carbon emissions trading on China’s development of a low-carbon economy, and literature [
16] presented the implications of CO
2 price for the power sector decarbonization in China. Literature [
17] proposed a conceptual model of power consumer behavior considering the influence mechanism and factors of power consumption choice under a personal carbon trading market. The Ministry of Finance in China had drawn a roadmap for implementing a carbon tax and a carbon market as part of the 12th Five-Year Plan, with starting dates for the carbon tax and the carbon market in 2012 and 2015, respectively to reduce carbon emissions [
18,
19,
20]. A carbon emissions trading market would no doubt be very meaningful and promising. Chinese government launched the energy-saving generation dispatch (ESGD) in 2007 with which the annual coal could be saved [
21]. Literature [
22] proposed a new ESGD mode with which the power resources allocation could be optimized in a longer time horizon. However, the generation dispatch in literature [
21,
22] was not a market-based arrangement. Literature [
23] presented a multi-objective model for the combined heat and power dispatch problem, where the emissions reduction and the fuel cost could be optimized simultaneously. However, this multi-objective model did not consider carbon trading, which is also a critical part in the power dispatch market.
Currently, some large industrial consumers of electricity, such as aluminum smelters and steel mills, which consumed electric energy in excess of a certain amount, were permitted to directly purchase electricity from generation companies [
24]. Direct power purchase for large consumers was an important measure for the reformation of the electricity industry [
25,
26]. The large electricity consumers were permitted to purchase electric energy directly, either from the generation companies via long-term contracts or from the spot energy market. The large electricity consumers had the right to freely select power providers to reduce production costs. As a result, this approach helped not only to break the monopoly of power network corporations but also to establish a competitive and open electricity market [
27]. Literature [
28] discussed the impact of direct power purchase for large consumers on the Chinese power market, and the financial cost of large consumers was also analyzed. Because of the massive electricity demand of large consumers, these consumers would have a great impact on the low-carbon operation of the power system. Literature [
29] proposed an economic dispatch of generators based on Carbon Dioxide trading scheme, but the direct power consumer was not considered. Literature [
30] proposed an algorithm to efficiently combine heat and power production planning under the emission trading scheme, however it focused on the planning rather than dispatch. Literature [
31] proposed an economic-emission dispatch model highlighting generation cost as well as the pollutant emissions, but the benefit of the power grid was not considered.
Based on a carbon trading market, how to minimize the economic cost and the carbon emission cost of direct power purchased by large consumers must be studied in the power system dispatch.
To address this issue, the carbon emission flow in the power grid must first be analyzed. Carbon emissions were usually calculated by using official energy consumption statistics and using a conversion of primary energy consumption, but this method could not reveal the characteristics of carbon emission from the generation side. Literature [
32] proposed a carbon flow tracing method, which could address carbon accounting at the regional level and carbon intensity assessment at the user level, but it could not clearly trace the source of carbon emissions at each load. Literature [
33,
34,
35,
36] introduced the concept of “carbon emission flow in networks” and proposed a method to calculate the carbon emission flow in networks. By approaching the carbon emissions from a spatial perspective, carbon production and consumption were integrated in the analysis of carbon emission flow, which had some unique advantages, such as integration with energy flows, reasonable allocation of carbon mitigation obligations and easy identification of carbon utilization efficiency for the entire network. However, the power grid loss was neglected to simplify the calculation of the carbon emission flow, thus its applications were limited in a real power system.
Considering the power loss by allocating grid loss to the load side, the theory of carbon emission flow [
33,
34,
35,
36] is improved in this paper. Taking carbon emissions trading into account, an optimal dispatch strategy of a power system is proposed to minimize the economic cost, the carbon emission cost of large power consumers, and the operation cost of the power grid companies. The effects of the carbon emission price, the electricity prices of normal generators, and low-carbon generators on the optimal dispatch model are studied. Analysis based on the optimal dispatch strategy in the benchmark system with different numbers of large consumers is performed.
The rest of the paper is organized as follows.
Section 2 improves the carbon emission flow theory by considering the power loss.
Section 3 proposes a carbon-emissions flow based optimal dispatch strategy, including large consumers under the carbon emissions trading market. In
Section 4, simulations on an IEEE 30-bus system are performed to investigate the performance of the proposed optimal dispatch strategy. Finally, conclusions are drawn in
Section 5.
3. The Carbon Emission Flow Based Optimal Dispatch Strategy Considering Large Consumers
Large consumers and optimal operation of the power grid are of primary concern because they are the important aspects of a power system in the low-carbon environment. Compared to obtaining power from power grid companies, large consumers would rather obtain power directly from generators to reduce cost. As a result, determining how to obtain reasonable power directly from generators is an important issue for large consumers. Meanwhile, from the power grid companies’ perspective, determining how to reduce the operation cost is important too. Based on the optimal power flow (OPF) method [
38], this paper proposes an optimal dispatch model based on the improved carbon emission flow theory. The OPF is a complex non-linear programming problem [
39], in which the power system will operate in a steady state to achieve a predetermined optimal target by adjusting available control means. This is different from the conventional power flow calculation. Mathematically, the OPF can be described as follows.
By choosing different objective functions and control variables combined with corresponding constraints, OPF can be used to solve certain problems with different purposes.
In this paper, the proposed optimal dispatch model is presented as follows.
3.1. Objective Function
To minimize the operation cost of power grid and the power utilization cost of large consumers, the objective function can be expressed as follows.
where
is the power system loss measuring the operation cost of power grid companies.
is the production cost that large power consumers must pay in a carbon emissions trading market. w
1 and w
2 are the respective weights. In this paper, the active power outputs of generators are chosen as the system control variables.
The power system loss can be formulated as follows:
where
PLj is the active power demand at load bus
j,
NL is the total number of load buses,
PGi is the power output of the generator
i, and
NG is the number of generators.
E is the electricity price that the power grid sells the electricity to normal power users.
In the carbon emission trading market, the power utilization cost of large power consumers includes the power supply cost as well as the carbon emission cost. Therefore, the
of a load
i is calculated as follows:
where
is the carbon emission flow rate contribution from generator
j to load
i.
EGj is the carbon emission intensity of generator
j, and
CGj is the unit electricity price, including the wheeling price [
40].
ec is the quantity of carbon emission, which can be obtained from
.
ec0 is the initial carbon quotas, and
CP is the unit price of carbon emission.
In the carbon trading market, carbon dioxide can be traded. If the carbon emission ec caused by power users is greater than their initial carbon quotas ec0, they can purchase additional carbon quotas from other power users with available carbon emission quotas. On the contrary, if the carbon emission ec caused by the power users is less than their initial carbon quotas ec0, the redundant carbon quotas can be sold to other users who need extra carbon quotas.
According to [
17], the initial carbon quota of a consumer is the average of carbon quotas for all of the consumers.
ec0i is the initial carbon quotas of the consumer
i, and
eci is the carbon emission of consumer
i. Assuming that the number of the consumers is
n,
ec0i can be expressed as follows:
3.2. Constraints
The corresponding constraints in the proposed optimal dispatch model must be satisfied.
(1) The power balance constraints.
The active power constraint and the reactive power constraint are given by:
where
Pi,
Qi,
Vi denote the active power demand, reactive power demand, voltage bus at bus
i, respectively.
,
,
denote the phase angle difference, conductance, and susceptance between bus
i and bus
j, respectively.
N is the number of the buses.
(2) The constraints of power system safety
The respective upper and lower limits of the active power output and the reactive power output of the generators are as follows:
where
PGi and
QGi denote the active power and reactive power output at generator
i, respectively;
PGimin and
PGimax denote the maximum and minimum active power at generator
i, respectively;
QGimin and
QGimax denote the maximum and minimum reactive power at generator
i, respectively.
The available transfer capacity limit of the transmission lines is as follows:
where
denotes the available transfer capacity in line
i −
j, and
NB denotes the number of branches.
is the transfer power flow in line
i −
j.
The upper and lower limits of node voltages are denoted as follows:
where
Vimin and
Vimax denote the minimum and maximum voltage of the bus
i, respectively.
(3) The constraint of large consumers
As the large consumer is mostly supplied by direct generation, its power source should be restrained as:
where
i is the load bus,
j is the direct generator bus supplying power to bus
i,
is the rate of active power contribution from generator
j to load bus
i, and γ is the threshold of direct power supply rate.
The
can be expressed as follows:
where
is the carbon emission flow rate contribution from generator
k to load
i and
is the carbon emission intensity of generator
k.
The OPF model is a non-convex problem [
41] that can be solved by the heuristic and probabilistic search methods (genetic algorithms). The heuristic and probabilistic search methods [
42] can overcome the limitations of non-convex and discrete control variables, and they have advantages such as simplicity, easier implementation, fewer parameters, and faster convergence. The Genetic Algorithm has some unique abilities including fast convergence speed, robustness, and capability of searching the global optimal solution [
43]. Other probabilistic search based methods (e.g., Particle Swarm Algorithm, Simulated Annealing) were ever used to solve the optimization problem, but their convergence ability was not good for the OPF model in this paper. Therefore, the genetic algorithm is used in this paper to solve the model. The flowchart of genetic algorithm is shown in
Figure 1. The algorithm is implemented in the Matlab (R2010b) (The MathWorks, Natick, MA, USA) platform.
4. Case Studies
To investigate the performance of the proposed optimal dispatch strategy, simulations, and analysis of an IEEE 30-bus system are performed. As shown in
Figure 2, the IEEE 30-bus system has six generators. Assuming that G1, G2, and G6 are normal generators and that G3, G4, and G5 are low-carbon generators, such as gas-fired generating units, the carbon emission intensities of normal generators and low-carbon generators are 0.875 and 0.525 kg CO
2/kWh [
34], respectively.
Figure 1.
The flowchart of genetic algorithm.
Figure 1.
The flowchart of genetic algorithm.
Figure 2.
The IEEE 30-bus system.
Figure 2.
The IEEE 30-bus system.
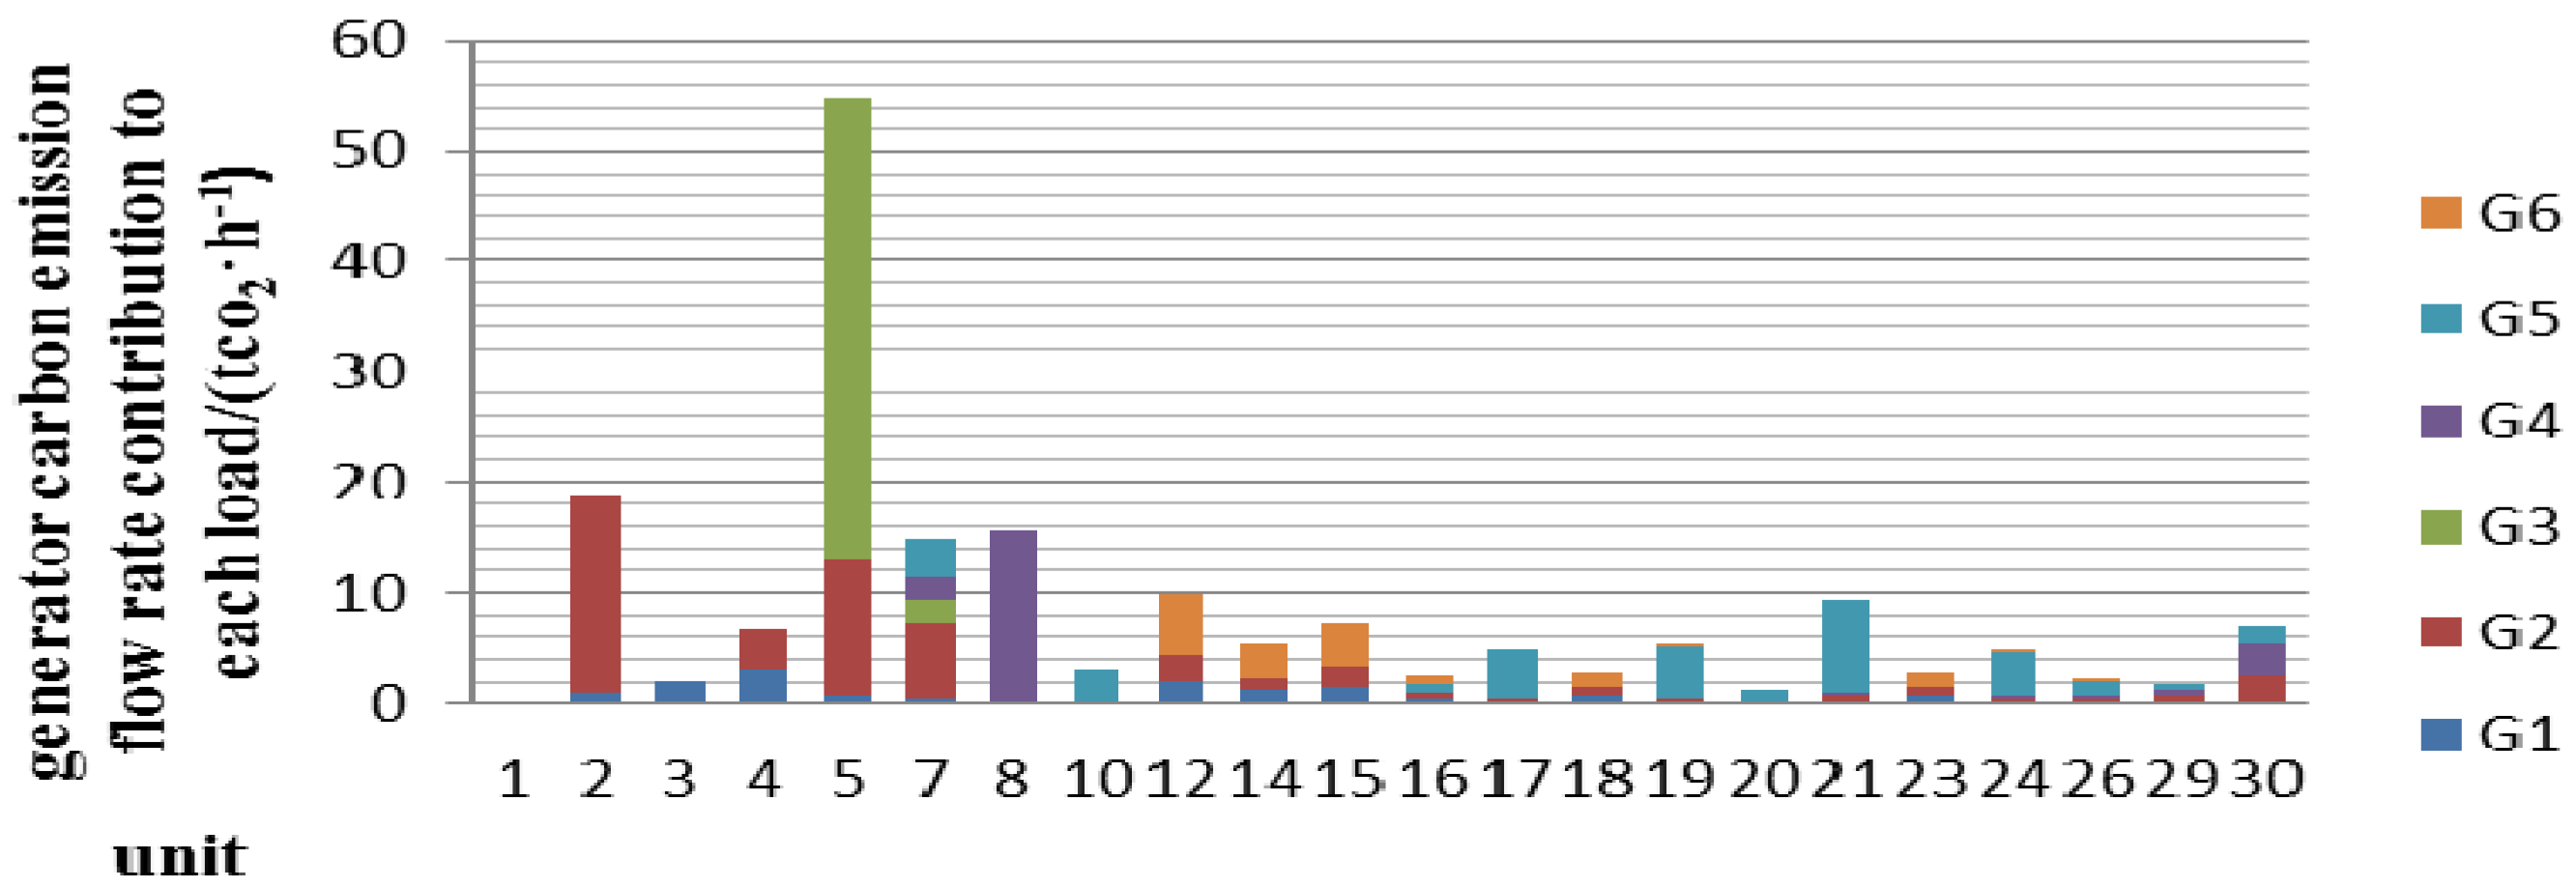
For one operational mode of the power system, the results of the carbon emission flow distribution can be obtained according to the improved carbon emission flow theory. The
of the operation mode is shown in
Figure 3. As shown in
Figure 3, the largest carbon emission flow rate bus is bus 5, which consists of G1, G2 and G3. Most of the carbon emission flow rate of bus 5 is caused by G3 because bus 5 is directly connected to G3. Bus 1 has no load, and the value of its carbon emission flow rate is zero. From these observations, we find that
RU−L can help the load easily trace the carbon emission flow caused by each generator, and the gross carbon emission rate can be obtained from
RU−L As a result,
RU−L provides a reference for the carbon emission quotas for the load under the carbon trading market.
The emission carbon flow rates to each load calculated by the carbon emission flow theory in [
33,
34,
35,
36] and the improved carbon emission flow theory are shown in
Table 2.
Figure 3.
The contribution of each load to the carbon emission flow rate.
Figure 3.
The contribution of each load to the carbon emission flow rate.
Table 2.
The emission carbon flow rates calculated by the carbon emission flow theory and the improved carbon emission flow theory.
Table 2.
The emission carbon flow rates calculated by the carbon emission flow theory and the improved carbon emission flow theory.
| Load | Carbon Emission Flow Theory/(tCO2·h−1) | Improved Carbon Emission Flow Theory/(tCO2·h−1) | Error/% |
|---|
| 1 | 18.99 | 19.08 | 0.47 |
| 2 | 2.10 | 2.13 | 1.41 |
| 3 | 6.65 | 6.75 | 1.48 |
| 4 | 53.12 | 53.24 | 0.23 |
| 5 | 14.30 | 14.63 | 2.26 |
| 6 | 3.13 | 3.15 | 0.63 |
| 7 | 9.80 | 9.85 | 0.51 |
| 8 | 5.43 | 5.50 | 1.27 |
| 9 | 7.18 | 7.30 | 1.64 |
| 10 | 3.06 | 3.10 | 1.29 |
| 11 | 5.35 | 5.44 | 1.65 |
| 12 | 2.80 | 2.86 | 2.10 |
| 13 | 5.61 | 5.73 | 2.09 |
| 14 | 1.19 | 1.21 | 1.65 |
| 15 | 9.46 | 9.56 | 1.05 |
| 16 | 2.80 | 2.87 | 2.44 |
| 17 | 5.16 | 5.34 | 3.37 |
| 18 | 1.91 | 2.05 | 6.83 |
| 19 | 1.15 | 1.20 | 4.17 |
| 20 | 5.08 | 5.36 | 5.22 |
| Total | 164.27 | 166.34 | 1.24 |
It can be observed from
Table 2 that the emission carbon flow rate calculated by the improved carbon emission flow theory is greater than that by the carbon emission flow theory. This is because of the inclusion of power loss in the improved carbon emission flow theory.
To study the impact of the different number of large consumers on the proposed optimal model, two cases have been studied.
4.1. Case A: One Large Consumer
In the carbon trading market, the consumer not only must pay for the power purchased from generators but should also submit the corresponding carbon quotas for the carbon emission caused by power production. Compared with low-carbon generators, normal generators provide inexpensive power at the cost of higher carbon emissions, so the loads supplied by normal generators must submit more carbon emission quotas. In Case A, it is assumed that only one large consumer is located at bus 5 and that G2 and G3 are direct generators. Assuming that power prices of normal generators and low-carbon generators are 0.6 and 0.9 ¥/kWh [
44], respectively, the initial
Cp is set as 150 ¥/t and γ set as is 0.8 [
45]. By using the Delphi method [
46], about 10 experts from power grid companies are asked to determine the weights in this paper. And all of them think that the benefits of large consumers and power grid are of equal importance, so the weight w
1 and w
2 are considered as 0.5.
4.1.1. The Optimal Dispatch Results with One Large Consumer
When the power system operates normally without optimizing the active power output of generators, this situation is defined as “without optimal dispatch”. In normal operation, the power system operates stably, and the power flow distribution is controllable. No strategies are used in power systems during normal operation. And all power generation is under normal operation. If the proposed model is used to optimize the active power output of generators, the corresponding situation is defined as “with optimal dispatch”.
The calculation of the genetic algorithm is repeated one-hundred times, and the average value of results is presented in
Table 3.
As presented in
Table 3, the value of the objective function becomes smaller with the optimal dispatch scheme. In addition, the large consumer at bus 5 obtains more power from low-carbon generator G3 because of the carbon emission cost.
Table 3.
The results with or without optimal dispatch.
Table 3.
The results with or without optimal dispatch.
| With or Without Optimal Dispatch | Carbon Flow Rate of Bus 5/(tCO2·h−1) | Active Power Output of Each Generator/MW | The Objective Function/¥ | Power System Operation Cost/¥ | Large Consumers Cost/¥ |
|---|
| G2 | G3 | G1 | G2 | G3 | G4 | G5 | G6 |
|---|
| With Optimal Dispatch | 61.4 | 7.70 | 25.1 | 123.9 | 14.7 | 48.9 | 38.7 | 37.1 | 40,221 | 6303 | 74,139 |
| Without Optimal Dispatch | 62.8 | 5.54 | 5.94 | 103.2 | 5.54 | 33.41 | 13.4 | 56.3 | 40,700 | 6739 | 74,662 |
4.1.2. The Impact of the Carbon Emission Price Cp on the Optimal Dispatch
The price of carbon emission
Cp can affect the cost of the load sides; therefore, in this section, we will analyze the impact of
Cp on the power system’s optimal dispatch. The effects of
Cp on the system’s optimal dispatch are presented in
Table 4. The range of
Cp is determined from [
47].
When the carbon emission price increases from 80 to 170 ¥/t, it can be observed from
Table 4 that the carbon flow rate supplied to the large consumer from G2 decreases, while that from G3 increases. The carbon flow rate from low-carbon generators in the same price range also increases, while the gross carbon flow rate decreases. The reason for this behavior is that the increase of
Cp leads the large consumer to obtain more power from low-carbon generators, such as G3, to reduce the carbon flow rate, although the price of power from low-carbon generators is higher than that from normal generators.
Table 4.
Results under the condition of different carbon emission prices.
Table 4.
Results under the condition of different carbon emission prices.
| Cp (¥/t) | Carbon Flow Rate of Bus 5/(tCO2·h−1) | Carbon Flow Rate of Bus 5 from Low-Carbon Generators/(tCO2·h−1) | Gross Carbon Flow Rate of Bus 5/(tCO2·h−1) |
|---|
| G2 | G3 |
|---|
| 80 | 69.5 | 2.72 | 3.32 | 82.95 |
| 100 | 63.1 | 3.23 | 5.28 | 81.56 |
| 150 | 61.4 | 7.70 | 10.62 | 77.49 |
| 170 | 48.4 | 14.4 | 17.27 | 72.46 |
| 180 | 62.6 | 8.47 | 11.60 | 76.69 |
| 200 | 70.6 | 1.33 | 2.18 | 83.86 |
| 300 | 63.5 | 6.52 | 9.17 | 78.54 |
| 500 | 36.8 | 22.7 | 24.75 | 66.90 |
| 700 | 10.9 | 43.0 | 43.02 | 53.89 |
| 900 | 4.1 | 46.1 | 46.1 | 51.83 |
When Cp increases from 170 to 200 ¥/t, the tendency of the carbon flow rate supplied to the large consumer from G2 and G3 is opposite to the situation above. The carbon flow rate from low-carbon generators decreases, while the gross carbon flow rate increases. The large consumer obtains more low-carbon electricity from G3 rather than normal electricity from G2, and the large consumer cost will increase because the reduced carbon emission cost is less than the increased cost for purchasing the low-carbon electricity.
When Cp increases from 200 to 900 ¥/t, the carbon flow rate supplied to the large consumer from G2 decreases, while that from G3 increases and the carbon flow rate from low-carbon generators increases. When Cp is larger than 200 ¥/t, the large consumer prefers to purchase power electricity from low-carbon generators. In this situation, the cost for submitting carbon quotas is higher with higher carbon emission price, so purchasing low-carbon electricity rather than normal electricity to reduce carbon emissions is more beneficial.
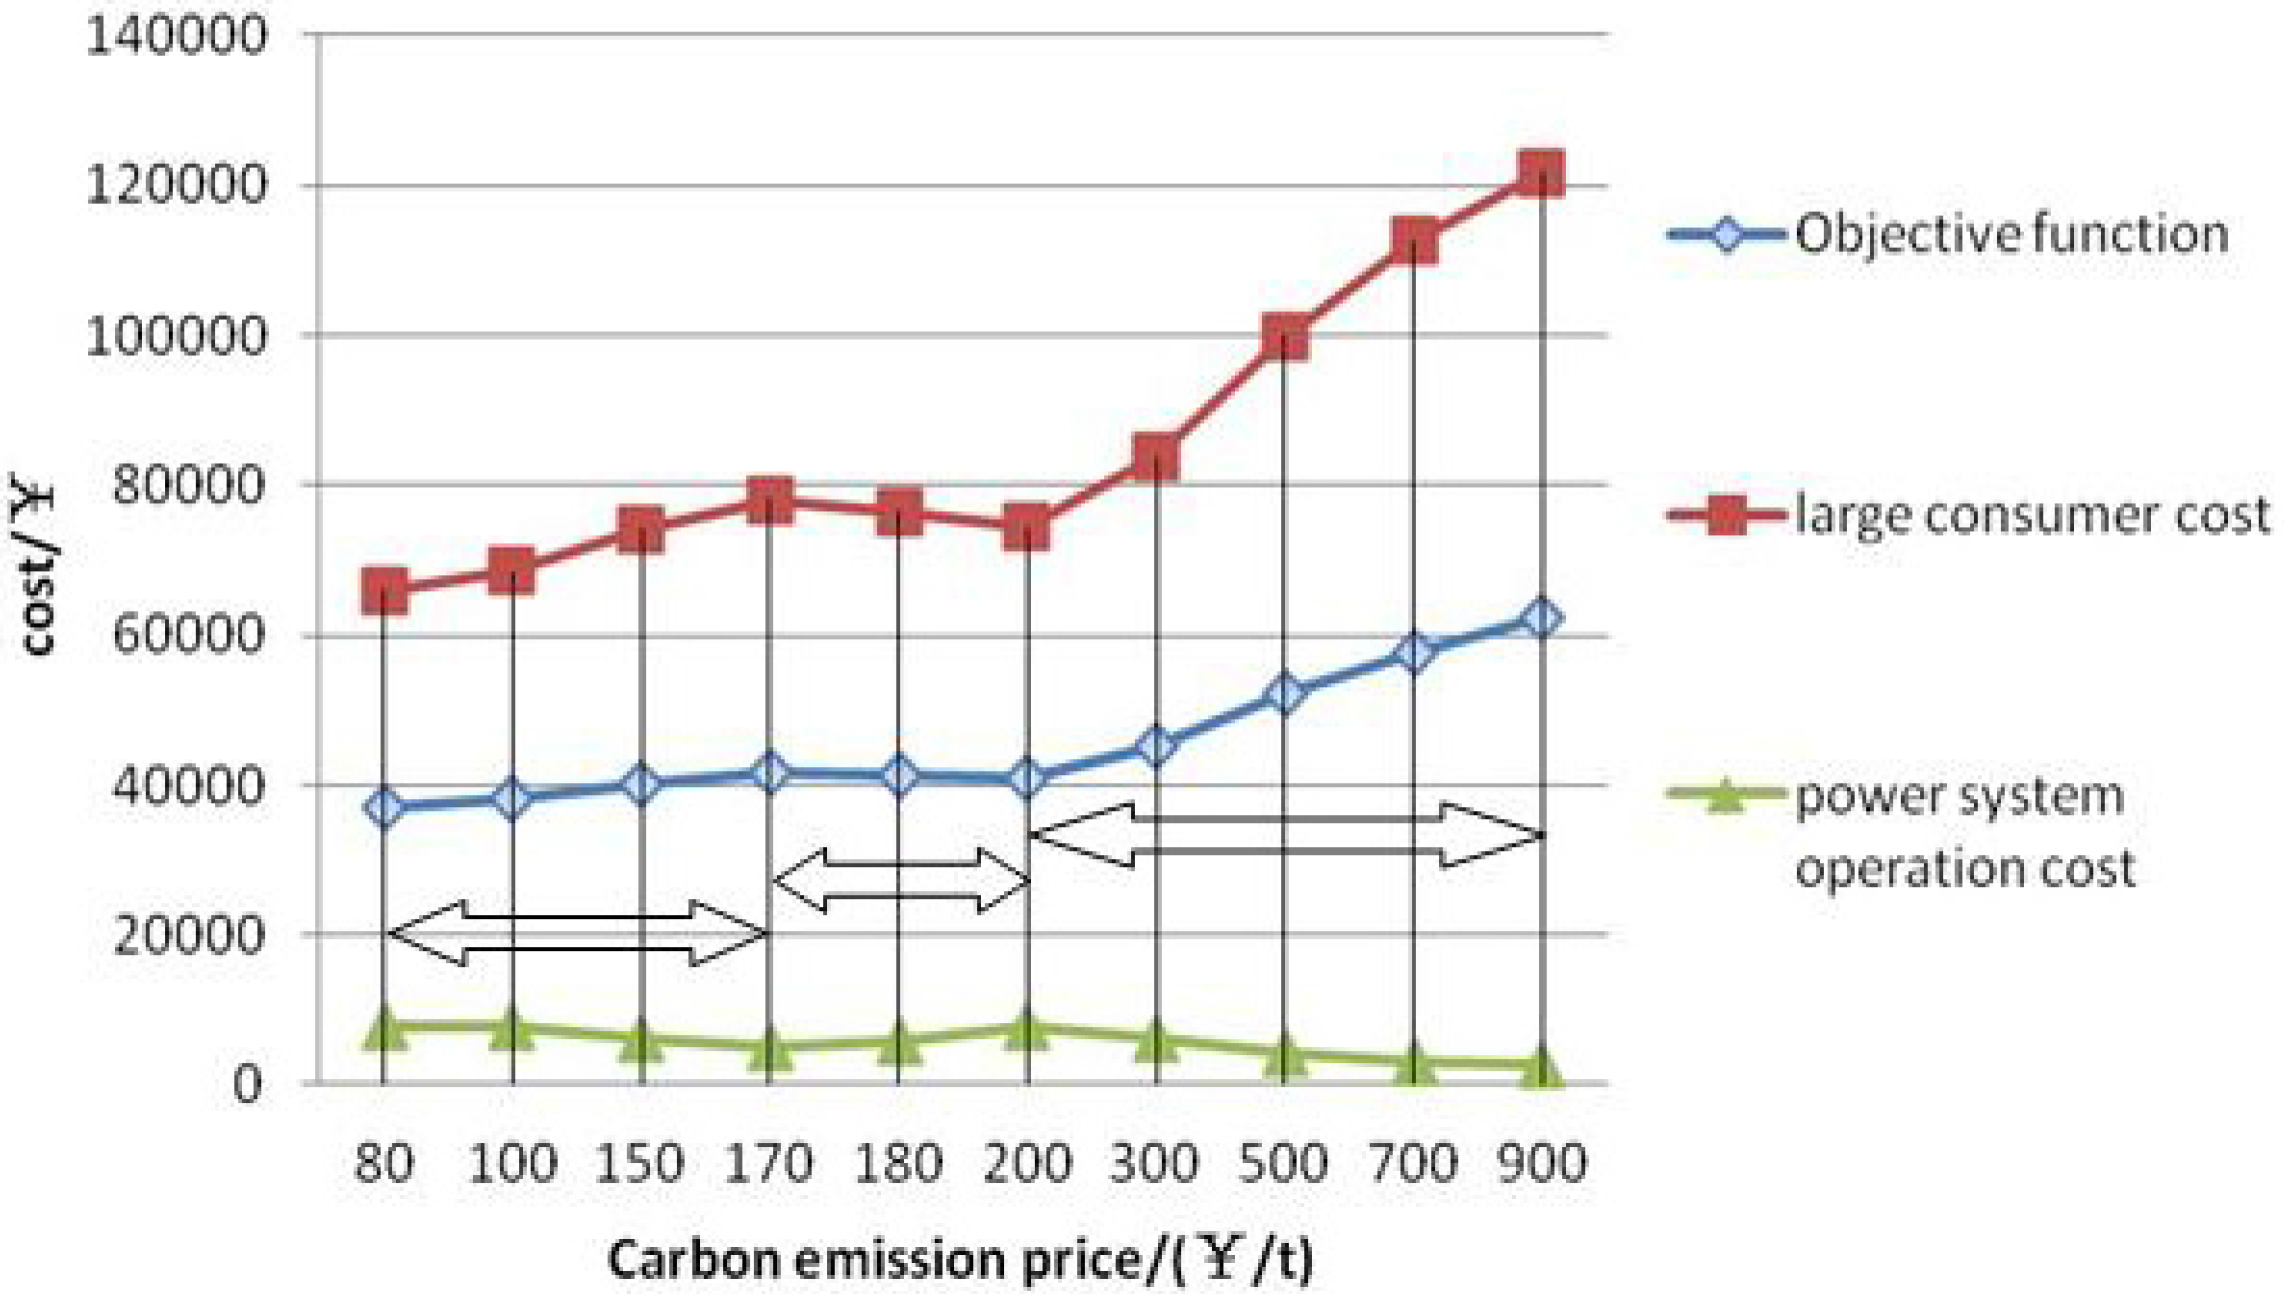
The objective function, the large consumer cost, and the power system operation cost under conditions of different
Cp are shown in
Figure 4. The data in
Figure 4 indicates that the objective function and the large consumer cost have a similar variation tendency, while the power system operation cost yields a different curve.
When
Cp ranges from 80 to 170 ¥/t and from 200 to 900 ¥/t, the large consumer’s cost increases, while the power system operation cost decreases. As shown in
Table 4, G3 supplies more power to the large consumer so that it obtains less power from other generators. The power system operation cost would decrease because of the reduced power flow in the system, excluding the neighborhood of bus 5. As the electricity price of low-carbon generators is higher, the cost to the large consumer would increase. Because the increased cost to the large consumer is greater than the reduced power system operation cost, the objective function will increase.
When Cp ranges from 170 to 200 ¥/t, the large consumer cost decreases, while the power system operation cost increases. This occurs because the large consumer obtains more electricity from normal generators rather than low-carbon generators. As the decreased cost to the large consumer is greater than the increased power system operation cost, the objective function will decrease.
Figure 4.
The variation tendency of the objective function, the large consumer cost and the power system operation cost.
Figure 4.
The variation tendency of the objective function, the large consumer cost and the power system operation cost.
In addition, each load has different carbon emission flow rates. The carbon emission flow rates of some loads may be larger than the initial carbon emission quotas, and others may be less than the initial quotas. The initial carbon emission quotas and carbon flow rates of some buses under the condition of different carbon emission prices are shown in
Figure 5.
Figure 5 shows that the carbon emission flow rates of bus 7 and bus 5 are always larger than initial carbon emission quotas, so they must purchase additional carbon emission quotas. The carbon emission flow rates of bus 4 are always smaller than the initial carbon emission quotas, so it can sell the remaining carbon emission quotas to other loads that need carbon emission quotas, e.g., bus7 and bus 5. Because the power demand at bus 4 is small, the carbon emission fluctuation of bus 4 is small too.
Figure 5.
The carbon flow rate with one large consumer in the system.
Figure 5.
The carbon flow rate with one large consumer in the system.
4.1.3. The Impact of the Electricity Price of Normal Generators on the Optimal Dispatch
Table 5 shows the results under the condition of different electricity prices of normal generators.
Table 5.
Results under the condition of different electricity prices of normal generators.
Table 5.
Results under the condition of different electricity prices of normal generators.
| The Electricity Price of Normal Generators ¥/kWh | Carbon Flow Rate of Bus 5/(tCO2·h−1) | The Objective Function/¥ | Power System Operation Cost/¥ | Large Consumer Cost/¥ |
|---|
| From Direct Generators | From Low-Carbon Generators | Gross |
|---|
| G2 | G3 |
|---|
| 0.5 | 69.0 | 4.82 | 5.29 | 81.41 | 35,328 | 7954 | 63,132 |
| 0.55 | 67.5 | 5.80 | 7.49 | 79.79 | 37,708 | 6949 | 68,682 |
| 0.6 | 61.4 | 7.70 | 10.62 | 77.49 | 40,221 | 6303 | 74,139 |
| 0.65 | 59.4 | 10.2 | 11.12 | 76.97 | 42,098 | 6240 | 77,955 |
| 0.7 | 31.2 | 28.0 | 28.55 | 64.09 | 44,755 | 3981 | 85,528 |
Table 5 indicates that when the electricity price of normal generators increases, the carbon flow rate supplied to the large consumer from G3 tends to increase, while that from G2 decreases. In addition, the carbon flow rate from all of the low-carbon generators increases with the increasing electricity price of normal generators because of the greater amount of power purchased from low-carbon generators. As a result, the carbon emission cost is reduced. Considering the higher electricity price of low-carbon generators, the cost to the large consumer will increase. When G3 supplies more power to the large consumer, which obtains less power from other generators, then the power system operation cost will decrease because of the reduced power flow in the system, excluding the neighborhood of bus 5.
4.1.4. The Impact of the Electricity Price of Low-Carbon Generators on the Optimal Dispatch
Table 6 shows the results with different electricity prices of normal generators.
Table 6.
Results under the condition of different electricity prices of low-carbon generators.
Table 6.
Results under the condition of different electricity prices of low-carbon generators.
| The Electricity Price of Low-Carbon Generators ¥/kWh | Carbon Flow Rate of Bus 5/(tCO2·h−1) | The Objective Function/¥ | Large Consumer Cost/¥ | Power System Operation Cost/¥ |
|---|
| From Direct Generators | From Low-Carbon Generators | Gross |
|---|
| G2 | G3 |
|---|
| 0.75 | 18.75 | 36.75 | 36.75 | 58.25 | 38,915 | 74,598 | 3232 |
| 0.8 | 29.46 | 25.66 | 26.80 | 65.24 | 39,868 | 75,704 | 4033 |
| 0.85 | 65.35 | 6.11 | 7.69 | 79.63 | 39,946 | 72,165 | 6728 |
| 0.9 | 61.4 | 7.70 | 10.62 | 77.49 | 40,221 | 74,139 | 6303 |
| 0.95 | 66.81 | 5.34 | 9.21 | 79.07 | 40,313 | 74,029 | 6597 |
| 1.0 | 75.03 | 0.26 | 4.54 | 83.47 | 39,581 | 71,415 | 7746 |
As shown in
Table 6, when the electricity price of the low-carbon generators varies from 0.75 to 0.85 ¥/kWh, the carbon flow rate supplied to the large consumer from G3 tends to decrease, while that from G2 increases. In this situation, the increasing carbon emission cost of purchasing power from normal generators is smaller than the increasing power cost from low-carbon generators, so the large consumer prefers to purchase power from the normal generators. When the electricity price of low-carbon generators increases from 0.85 to 0.9 ¥/kWh, the carbon flow rate supplied to the large consumer from G2 tends to decrease, while that from G3 increases. In this situation, the increasing power cost from low-carbon generators is smaller than the increasing carbon emission cost of the purchasing power from normal generators. When the electricity price of low-carbon generators is higher than 0.9 ¥/kWh, the increasing carbon emission cost of the purchasing power from normal generators becomes smaller than the increasing power cost from low-carbon generators. Thus, the large consumer obtains more power from the normal generators.
4.2. Case B: Multiple Large Consumers
In Case B, we consider more than one large consumer in the power system, where in the objective function is the sum of all of the consumers. Assuming two large consumers located at bus 5and bus 21, respectively, the direct generators of bus 5 are G2 and G3, while the direct generators of bus 21 are G2 and G5. Cp is set as 150 ¥/t. The electricity prices of normal generators and low-carbon generators are set as 0.6 and 0.9 ¥/kWh, respectively.
4.2.1. The Results of the Optimal Dispatch Scheme
The definitions of “without optimal dispatch” and “with optimal dispatch” are the same with that aforementioned in
Table 3.
The results of the optimal dispatch with two large consumers are shown in
Table 7.
Table 7.
The optimal dispatch results of the system with two large consumers.
Table 7.
The optimal dispatch results of the system with two large consumers.
| With or Without Optimal Dispatch | Carbon Flow Rate of Large Consumer at Bus 5/(tCO2·h−1) | Carbon Flow Rate of Large Consumer at Bus 21/(tCO2·h−1) | The Objective Function/¥ | Power System Operation Cost/¥ | Large Consumer Cost/¥ |
|---|
| G2 | G3 | Gross | G2 | G5 | Gross |
|---|
| With optimal dispatch | 54.16 | 11.09 | 75.19 | 0.81 | 8.49 | 9.73 | 45,966 | 57,66 | 86,165 |
| Without optimal dispatch | 57.29 | 8.83 | 77.20 | 2.36 | 6.64 | 10.77 | 47,664 | 6439 | 88,889 |
As shown in
Table 7, the value of the objective function becomes smaller with the optimal dispatch scheme, and large consumers at bus 5 and bus 21 obtain more power from low-carbon generators G3 and G5 because of the carbon emission cost.
4.2.2. The Impact of the Carbon Emission Price Cp on the Optimal Dispatch of the System with Multiple Large Consumers
The results of the effects of
Cp on the system’s optimal dispatch are presented in
Table 8.
The
Table 8 shows that when the carbon emission price
Cp increases from 80 to 170 ¥/t and from 200 to 900 ¥/t, the large consumer’s cost will increase, while the power system operation cost will decrease. As the increased cost to the large consumer is greater than the reduced power system operation cost, the objective function will increase.
When the carbon emission price Cp increases from 170 to 200 ¥/t, the large consumer cost will increase, and the power system operation cost will increase too. The result is different with the case of one large consumer. The reason is that the large consumer at bus 21 obtains more electricity from low-carbon generators. Meanwhile, the bus 21 and bus 5 have the same direct generator G2. As G2 is close to bus 5 in the system network, it supplies most of its power to bus 5; thus, bus 21 has to purchase power from the other direct generator G5 to satisfy the direct supply contract. So the large consumer’s cost increases.
Table 8.
Results under the conditions of different carbon emission prices.
Table 8.
Results under the conditions of different carbon emission prices.
| Cp ¥/t | Carbon Flow Rate of Large Consumer at Bus 5/(tCO2·h−1) | Carbon Flow Rate of Large Consumer at Bus 21/(tCO2·h−1) | The Objective Function/¥ | Power System Operation Cost/¥ | Large Consumer Cost/¥ |
|---|
| G2 | G3 | Gross | G2 | G5 | Gross |
|---|
| 80 | 70.11 | 3.85 | 80.40 | 3.96 | 5.39 | 11.39 | 44,178 | 7978 | 80,379 |
| 100 | 55.97 | 9.08 | 77.93 | 3.19 | 6.16 | 11.25 | 45,280 | 7306 | 83,255 |
| 150 | 54.16 | 11.09 | 75.19 | 0.81 | 8.49 | 9.73 | 45,966 | 5766 | 86,165 |
| 170 | 54.91 | 8.21 | 78.95 | 2.33 | 6.28 | 11.29 | 47,874 | 6959 | 88,789 |
| 180 | 67.20 | 6.47 | 79.58 | 1.07 | 8.19 | 9.99 | 48,480 | 7017 | 89,942 |
| 200 | 72.90 | 0.62 | 81.67 | 0.32 | 9.02 | 9.41 | 49,149 | 7098 | 91,200 |
| 500 | 31.97 | 25.20 | 65.71 | 0.68 | 8.62 | 9.69 | 59,857 | 4107 | 115,610 |
| 700 | 12.38 | 40.31 | 55.78 | 0.52 | 8.70 | 9.63 | 65,558 | 3224 | 127,890 |
| 900 | 7.71 | 43.02 | 53.92 | 0.20 | 9.04 | 9.41 | 70,389 | 2804 | 139,750 |
4.2.3. The Impact of the Electricity Price of Normal Generators on the Optimal Dispatch
The results of the impact of the electricity price of normal generators on the optimal dispatch are shown in
Table 9.
Table 9 shows that with an increasing electricity price of normal generators, the results are the same with the above case of one large consumer. When the electricity price of normal generators increases, the carbon flow rate supplied to the large consumer at bus 5 from G3 tends to increase, while that from G2 decreases. The carbon flow rate supplied to the large consumer at bus 21 from G5 tends to increase, while that from G2 decreases except when the electricity price of normal generators varies from 0.5 to 0.55 ¥/kWh. As presented in
Table 9, most of the carbon flow rate of G2 is supplied to bus 5 when the electricity price of normal generators is at 0.5 ¥/kWh. So the carbon flow rate supplied to bus 21 from G2 is very small and the large consumer at bus 21 needs to obtain more power from G5 to satisfy the direct supplying contract.
Table 9.
Results under the condition of different electricity prices of the normal generators.
Table 9.
Results under the condition of different electricity prices of the normal generators.
| Power Price of Normal Generators ¥/kWh | Carbon Flow Rate to Large Consumer at Bus 5/(tCO2·h−1) | Carbon Flow Rate Large Consumer at Bus 21/(tCO2·h−1) | The Objective Function/¥ | Power System Operation Cost /¥ | Large Consumer Cost/¥ |
|---|
| G2 | G3 | Gross | G2 | G5 | Gross |
|---|
| 0.5 | 65.58 | 6.72 | 80.28 | 2.64 | 6.66 | 11.07 | 42,672 | 7448 | 77,896 |
| 0.55 | 54.32 | 10.11 | 75.67 | 5.19 | 4.43 | 12.27 | 45,787 | 6875 | 84,698 |
| 0.6 | 54.16 | 11.09 | 75.19 | 0.81 | 8.49 | 9.73 | 45,966 | 5766 | 86,165 |
| 0.65 | 48.47 | 16.47 | 71.42 | 0.68 | 8.71 | 9.63 | 50,431 | 4958 | 96,904 |
| 0.7 | 42.09 | 21.91 | 67.07 | 0.59 | 8.84 | 9.52 | 52,324 | 4260 | 100,390 |
With the increasing electricity price of normal generators, the cost to the large consumer will increase. As the increased cost of large consumer is greater than the reduced power system operation cost, the objective function will increase. When G3 supplies more power to the large consumers, which obtain less power from other generators, then the power system operation cost will decrease because of the reduced large scale power flow in the system, excluding the neighborhood of bus 5.
4.2.4. The Impact of the Electricity Price of Low-Carbon Generators on the Optimal Dispatch
The results of the impact of the electricity price of low-carbon generators on the optimal dispatch are presented in
Table 10.
As shown in
Table 10, when the electricity price of the low-carbon generators varies from 0.8 to 0.85 ¥/kWh, the carbon flow rate supplied to the large consumer at bus 5 from G3 tends to decrease, while that from G2 increases. The carbon flow rate supplied to the large consumer at bus 21 from G2 tends to increase, while that from G5 decreases. The increasing carbon emission cost of purchasing power from normal generators is smaller than the increasing power cost from low-carbon generators, so the large consumers prefer to purchase power from the normal generators. When the electricity price of low-carbon generators increases from 0.85 to 0.9 ¥/kWh, the carbon flow rate supplied to the large consumer at bus 5 from G2 tends to decrease but, the flow rate from G3 increases. The carbon flow rate supplied to the large consumer at bus 21 from G2 tends to decrease, while that from G5 increases. In this situation, the increasing power cost from low-carbon generators is smaller than the increasing carbon emission cost of the purchasing power from normal generators. When the electricity price of low-carbon generators is greater than 0.9 ¥/kWh, the increasing carbon emission cost of the purchasing power from normal generators becomes smaller than the increasing power cost from low-carbon generators. Thus, both large consumers at bus 5 and bus 21 obtain more power from the normal generators.
Table 10.
Results under the condition of different electricity prices of low-carbon generators.
Table 10.
Results under the condition of different electricity prices of low-carbon generators.
| Power Price of Low-Carbon Generators ¥/kWh | Carbon Flow Rate to Large Consumer at Bus 5/(tCO2·h−1) | Carbon Flow Rate Large Consumer at Bus 21/(tCO2·h−1) | The Objective Function/¥ | Power System Operation Cost/¥ | Large Consumer Cost /¥ |
|---|
| G2 | G3 | Gross | G2 | G5 | Gross |
|---|
| 0.8 | 49.53 | 14.37 | 73.23 | 0.85 | 8.48 | 9.76 | 46,174 | 5383 | 86,965 |
| 0.85 | 56.01 | 10.72 | 75.90 | 1.16 | 8.34 | 9.88 | 47,108 | 5734 | 88,482 |
| 0.9 | 54.16 | 11.09 | 75.19 | 0.81 | 8.49 | 9.73 | 45,966 | 5766 | 86,165 |
| 0.95 | 55.76 | 8.78 | 76.42 | 0.84 | 8.31 | 9.83 | 48,714 | 6213 | 91,216 |
| 1.0 | 69.99 | 2.29 | 79.42 | 2.48 | 6.66 | 10.36 | 49,388 | 7229 | 91,547 |
In addition, the variation tendency of the carbon flow rates with two large consumers in the system is shown in
Figure 6. The carbon flow rates of bus 7 and bus 5 are always greater than the initial carbon emission quotas, so they must purchase additional carbon emission quotas. The carbon emission of bus 4 is always smaller than the initial carbon emission quotas, so it can sell the remaining carbon emission quotas to other loads that need carbon emission quotas.
Figure 6.
The variation tendency of the carbon flow rate with two large consumers in the system.
Figure 6.
The variation tendency of the carbon flow rate with two large consumers in the system.
5. Conclusions
With the demand for energy dramatically increasing in the 21st century, carbon emission reductions and low-carbon emission development are indispensable because of the global climate change caused by the release of carbon into the atmosphere. As a result, carbon emissions have become a serious concern for power systems. In this paper, to trace the carbon flow in a real power grid, the theory of carbon emission flow is improved by considering power losses in the power grid. The power losses are allocated to the load side, where the carbon emission caused by power losses is calculated. With the improved carbon emission flow theory, each load can trace its carbon flow rate, thus a reference can be obtained when submitting carbon quotas in the carbon trading market. Considering the cost of large consumers and the operational cost of a power grid under the carbon trading market, a power system dispatch strategy based on the improved theory of carbon emission flow is also proposed in this paper. As an important measure of electric industry reformation, large consumers and their direct power purchase ability are considered in the proposed dispatch model. To investigate the performance of the proposed optimal dispatch strategy, simulations with different numbers of large consumers are carried out based on an IEEE 30-bus system.
The simulation results indicate that the improved carbon emission flow theory can be used in the real power system by considering the power losses. And the proposed strategy can provide a reasonable dispatching mode to reduce the operational cost of the power grid as well as the power utilization cost of large consumers. Moreover, the simulation results demonstrate that the price of the carbon emission, the power price of normal generators, and the low-carbon generators have critical impacts on the dispatch results of the power system.
Based on the Matlab (R2010b) simulation platform, the genetic algorithm is used to solve the problem in a centralized manner. For large-scale power system, the calculation speed and solution accuracy may not satisfy the requirement. In future work, commercial software (e.g., Gurobi) as well as parallel computation methods may be needed to solve the problem.


