
A Review of CO2-Enhanced Oil Recovery with a Simulated Sensitivity Analysis

 , , ,
, , ,
Abstract
:
1. Introduction
2. A Comprehensive Review of the Enhanced Oil Recovery Process
2.1. Major Oil Recovery Techniques in the Field
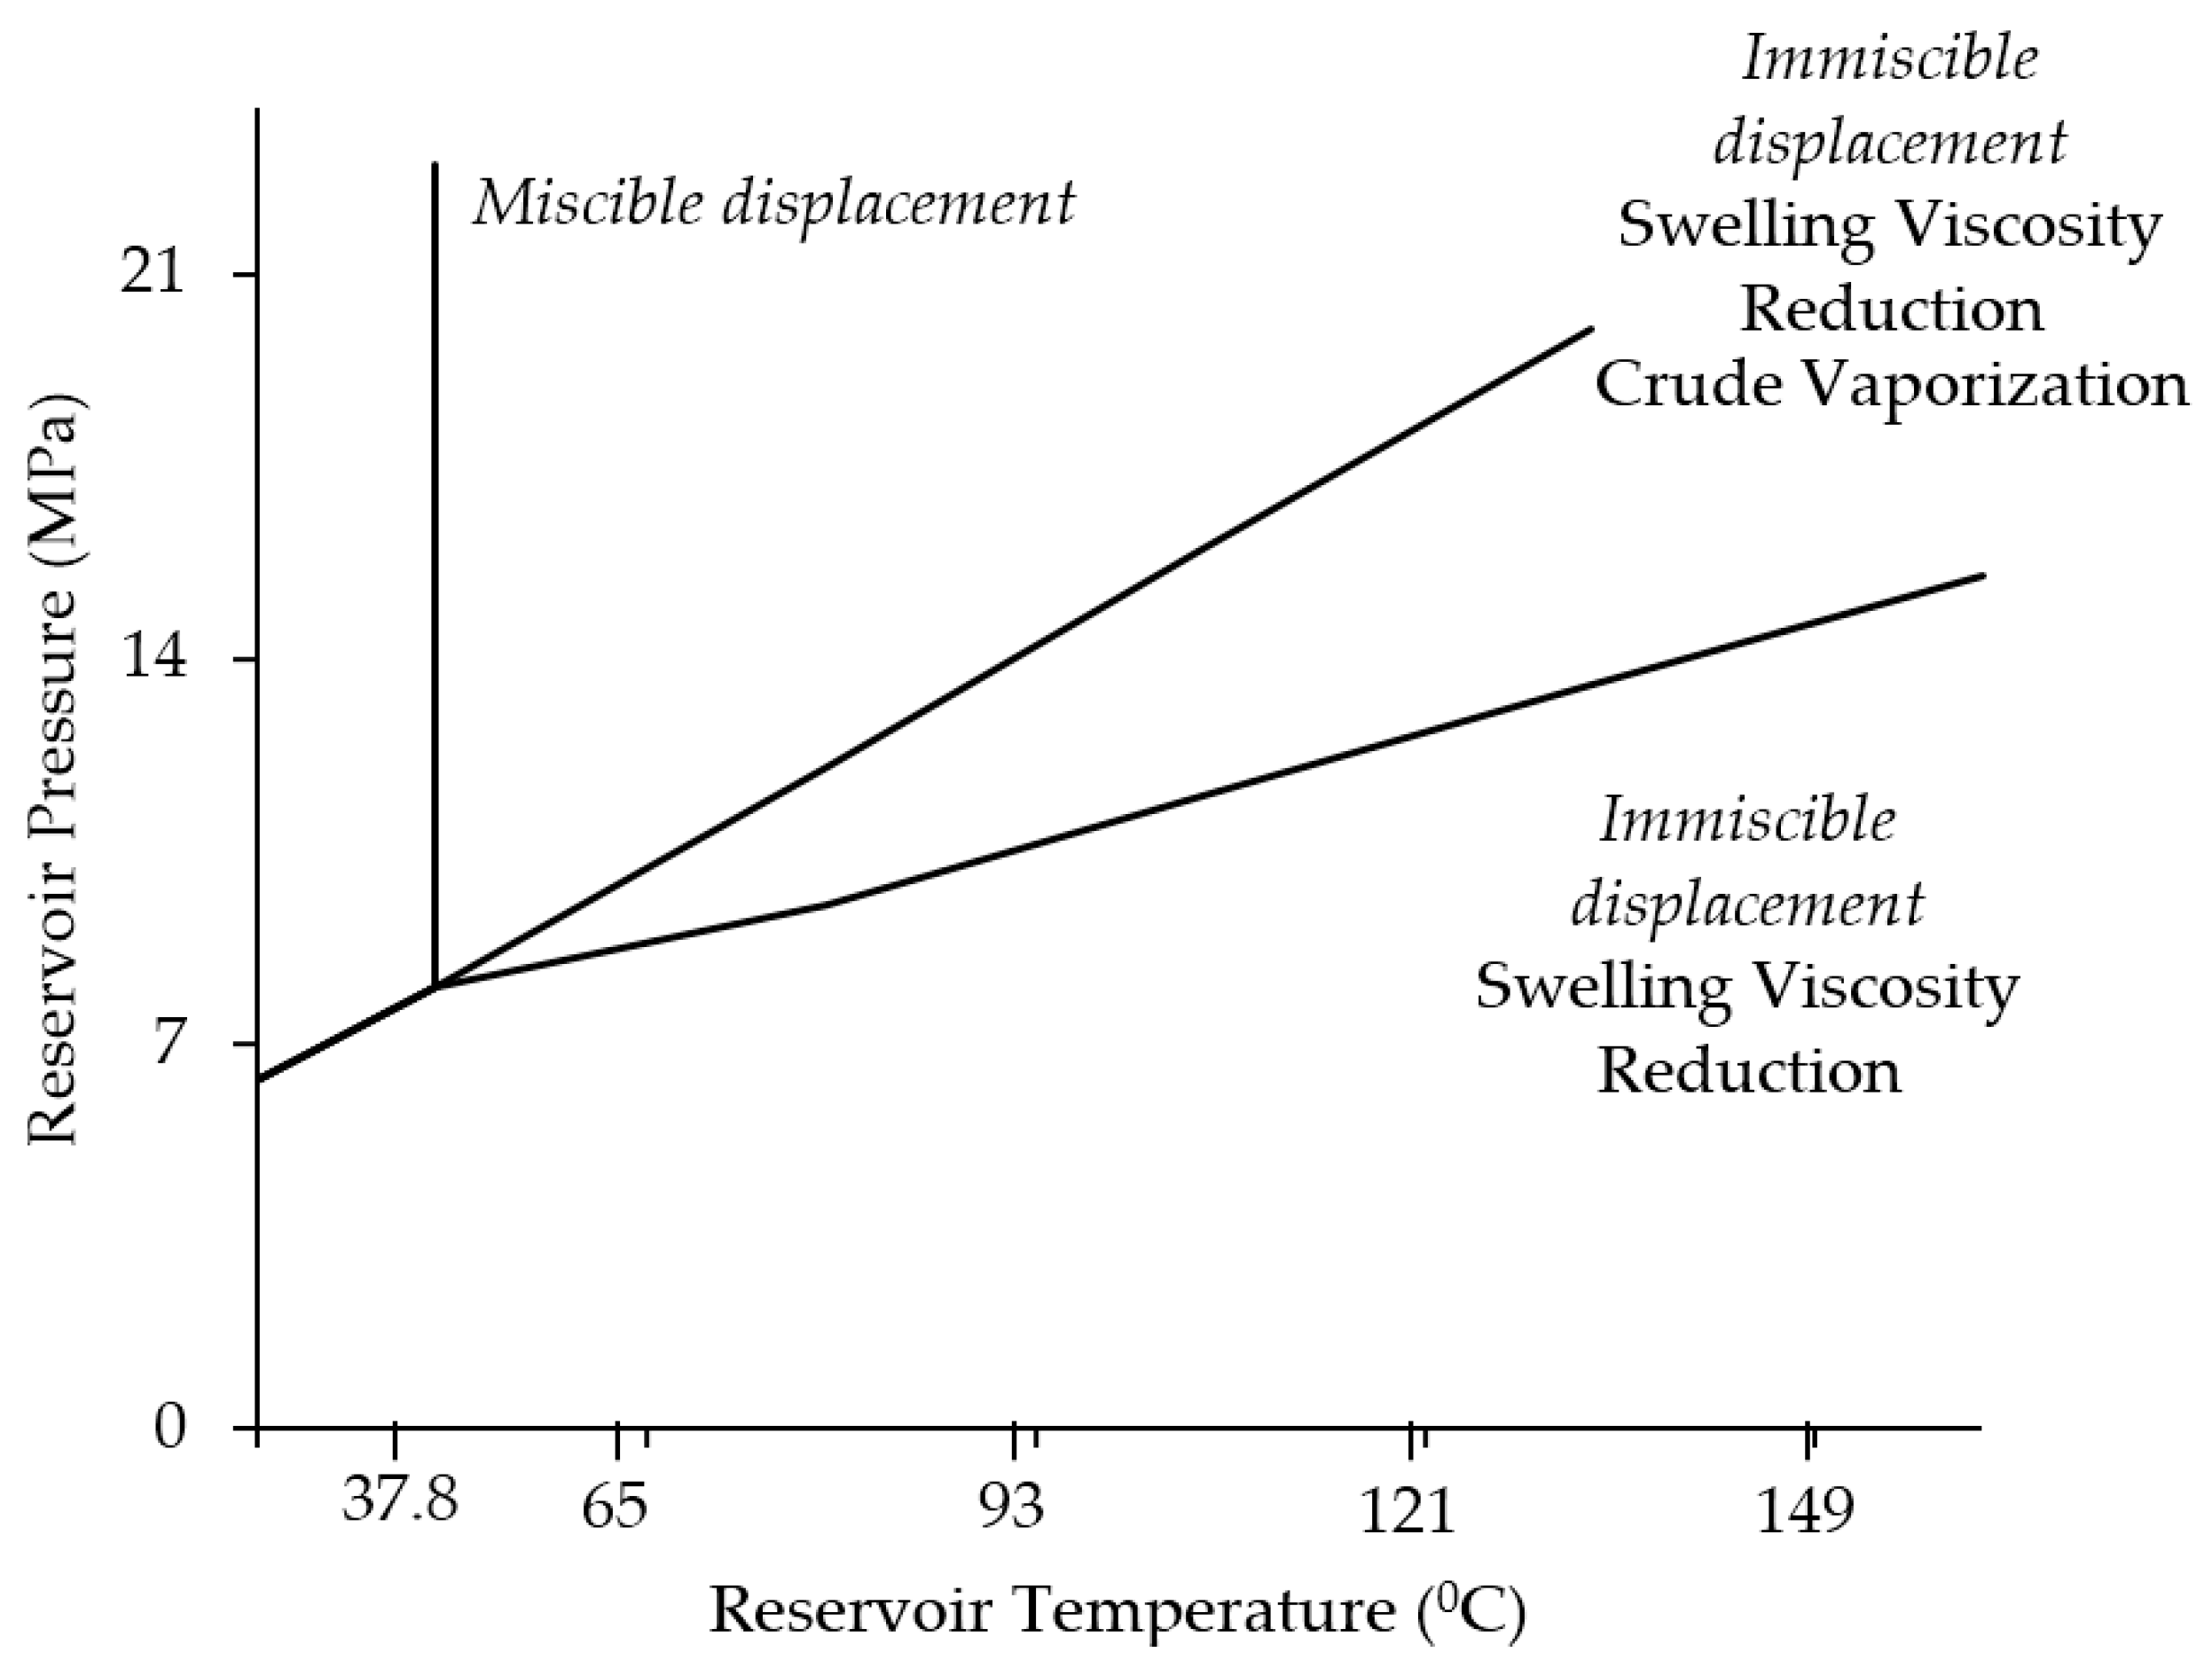
2.1.1. Miscible Oil Recovery
2.1.2. Immiscible CO2-EOR Process
- (1)
- CO2 Solubility in Oil
- (2)
- Oil Swelling
- (3)
- Oil Viscosity
2.2. How Does CO2 Injection Enhance Oil Recovery?
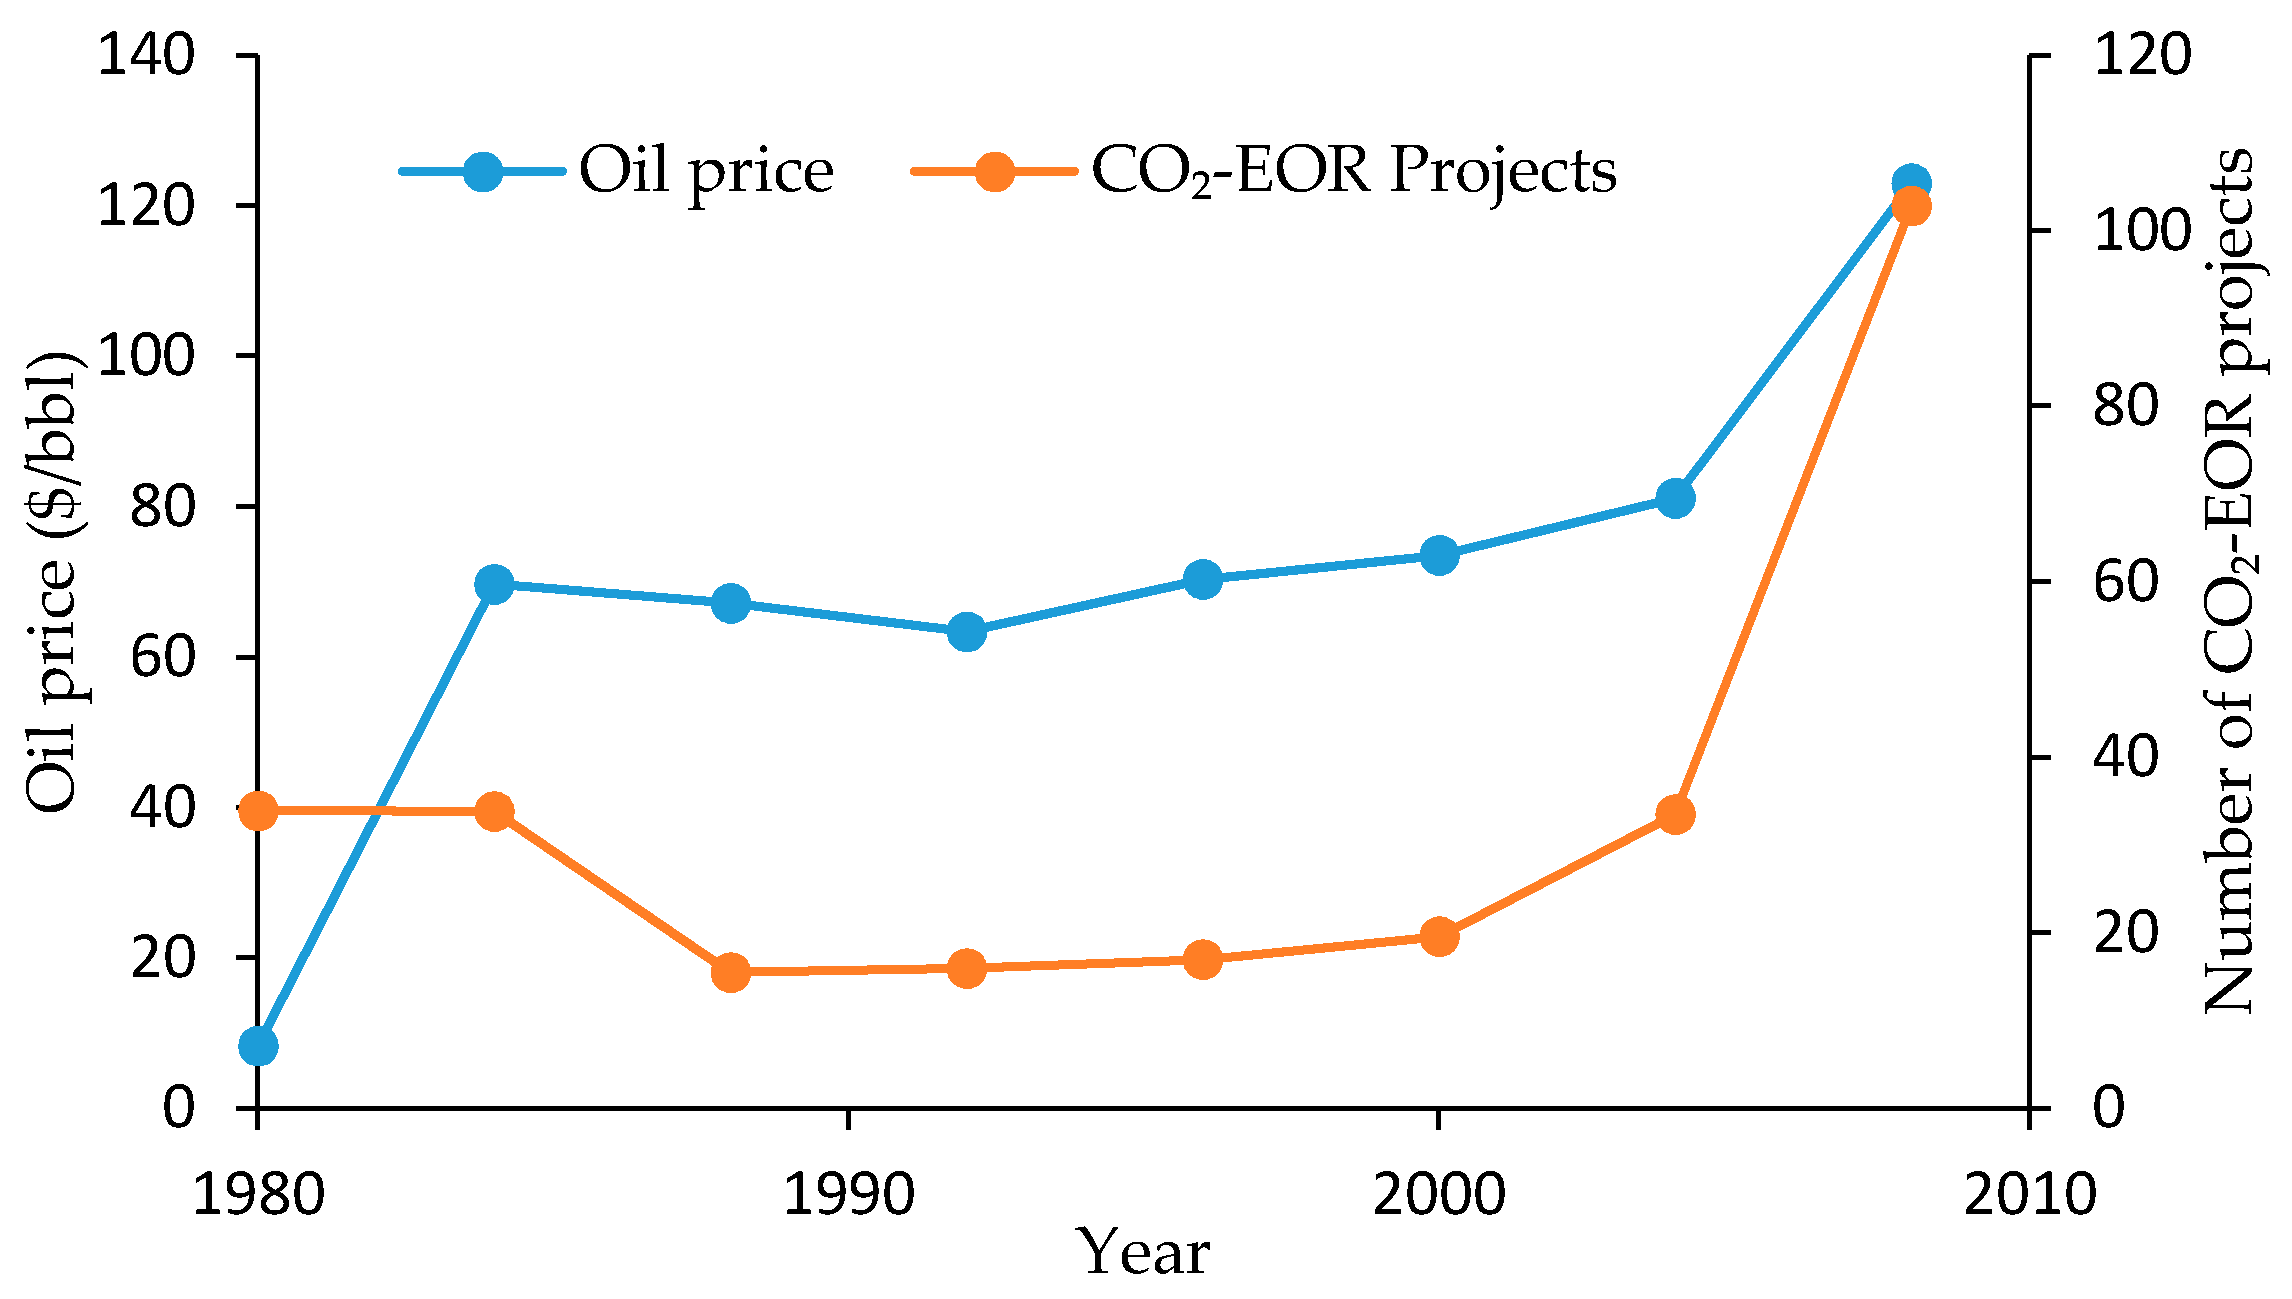
2.3. Economics of CO2-EOR
2.4. Environmental Impacts of CO2-EOR
2.5. Field Enhanced Oil Recovery Projects
2.6. Opportunities for CO2-EOR Process Improvement
2.6.1. Increase in the Amount of CO2 Injected
2.6.2. Innovative Flood Design and Well Placement
2.6.3. Improving the Mobility Ratio
2.6.4. Extending Miscibility
3. A Numerical Study to Investigate the Effective Factors for the CO2-EOR Process
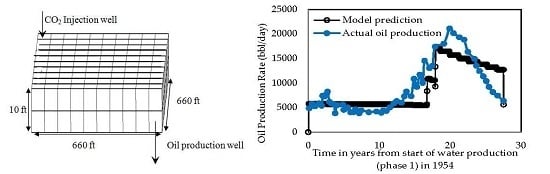
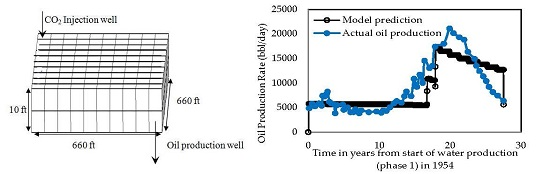
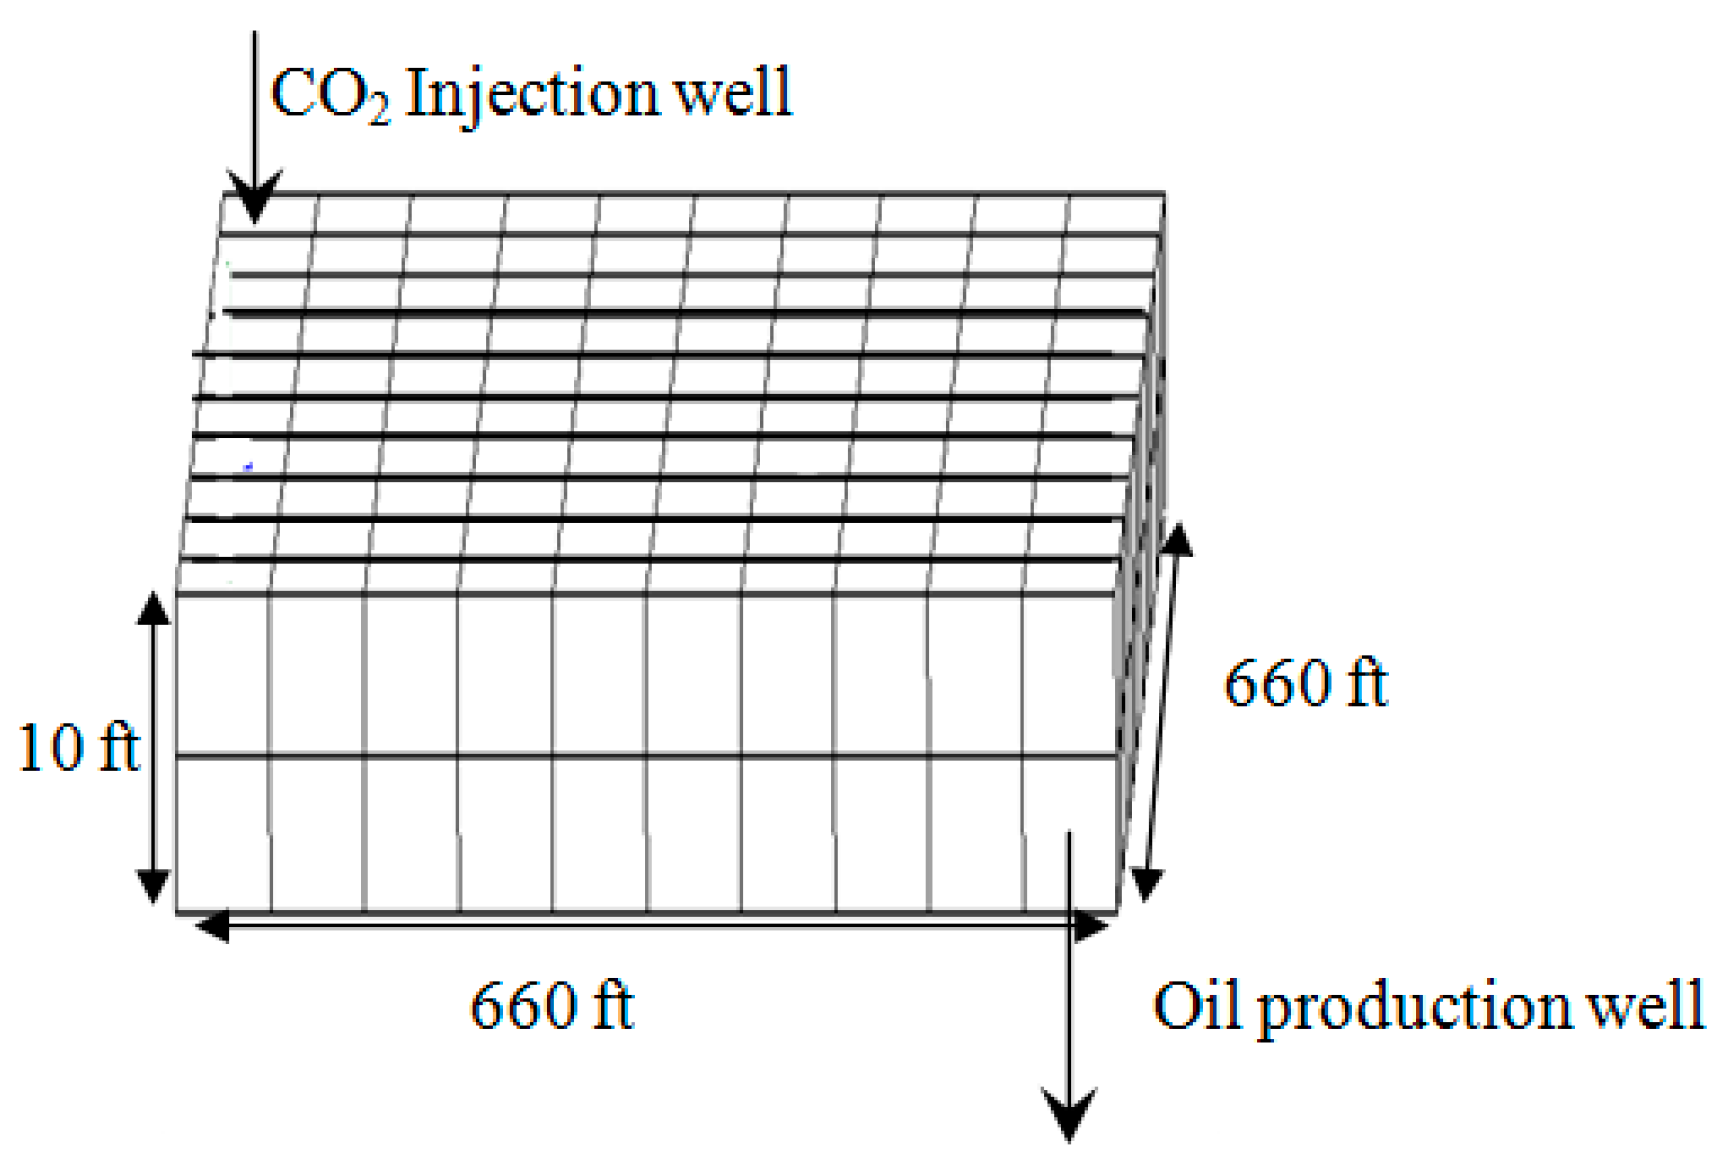
3.1. Model Development
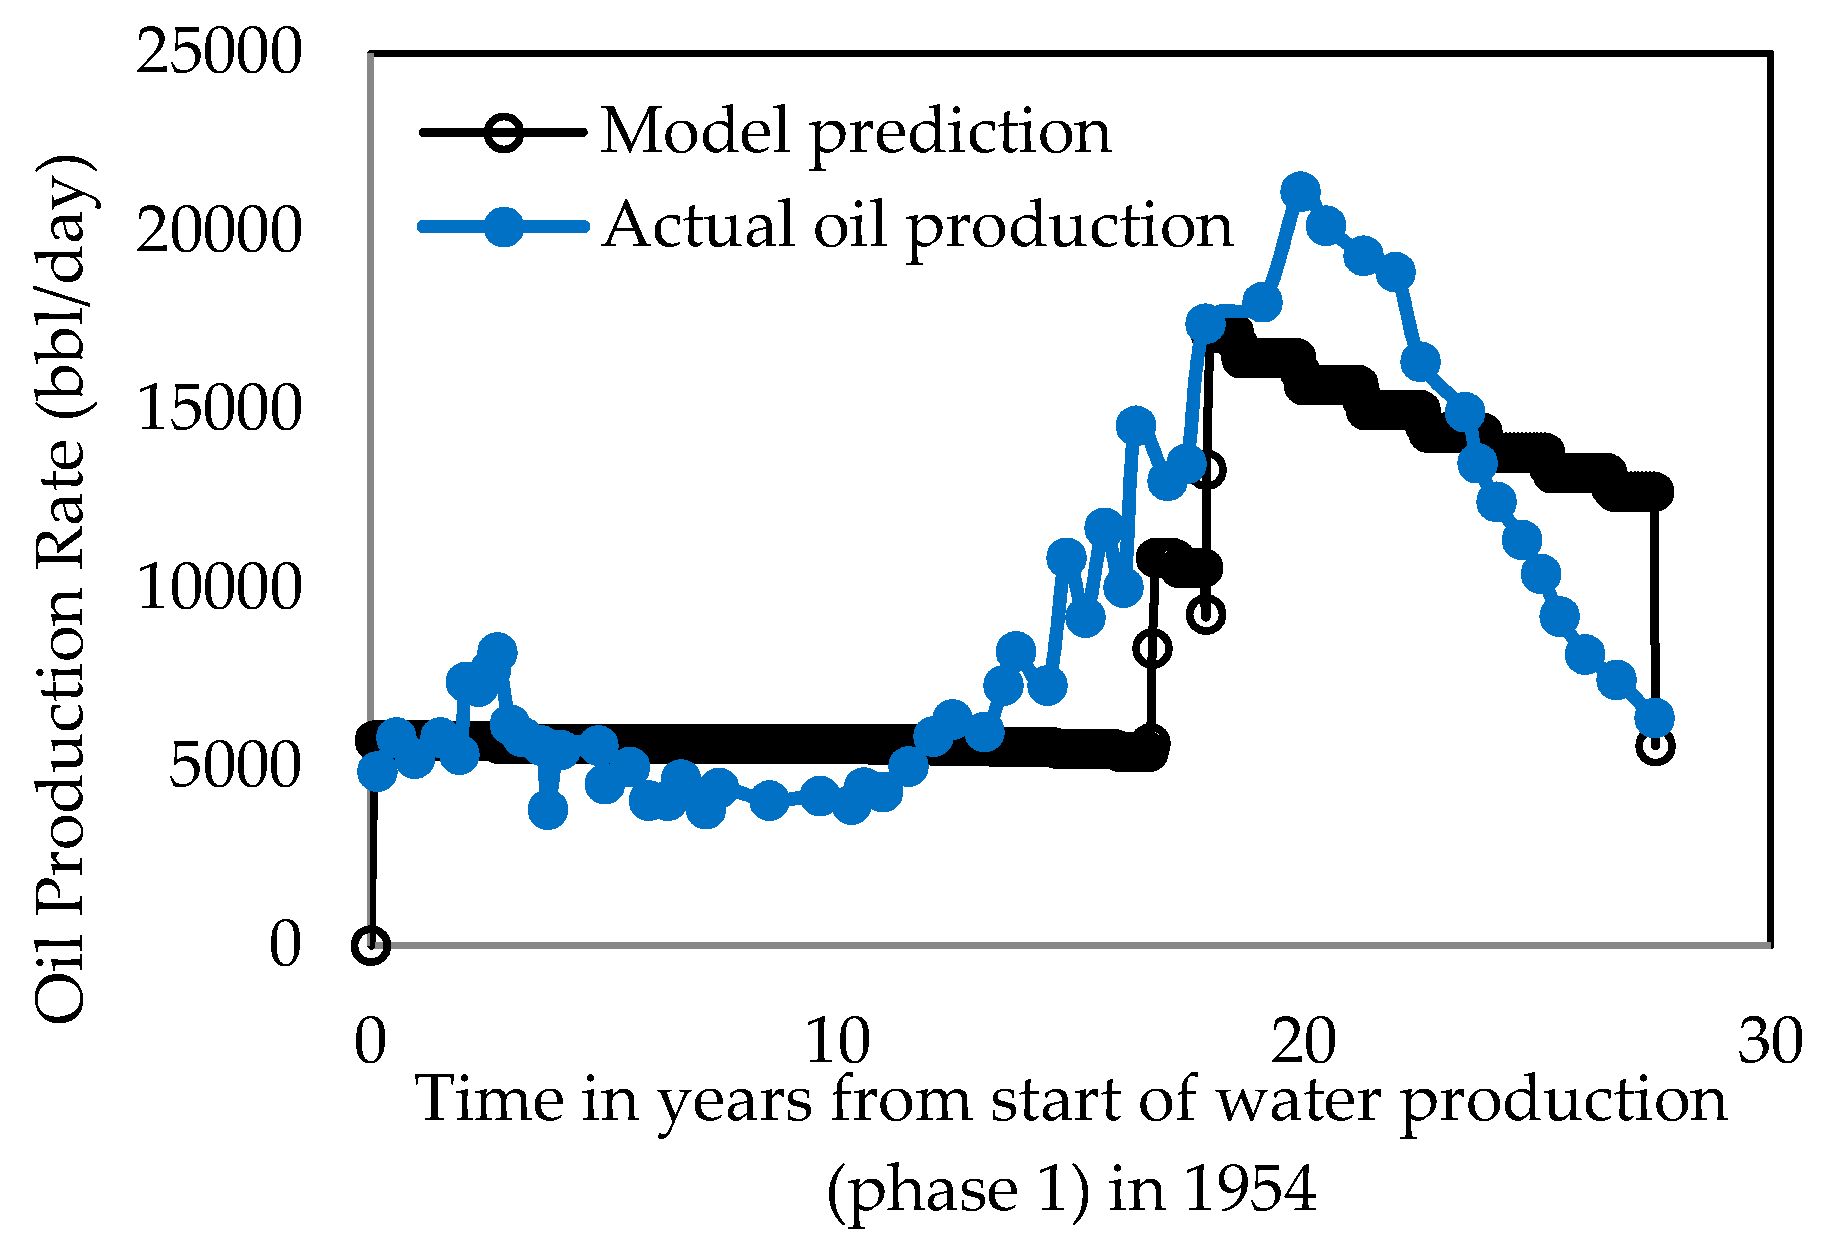
3.2. Model Simulation
- (1)
- Pure CO2 Injection
- (2)
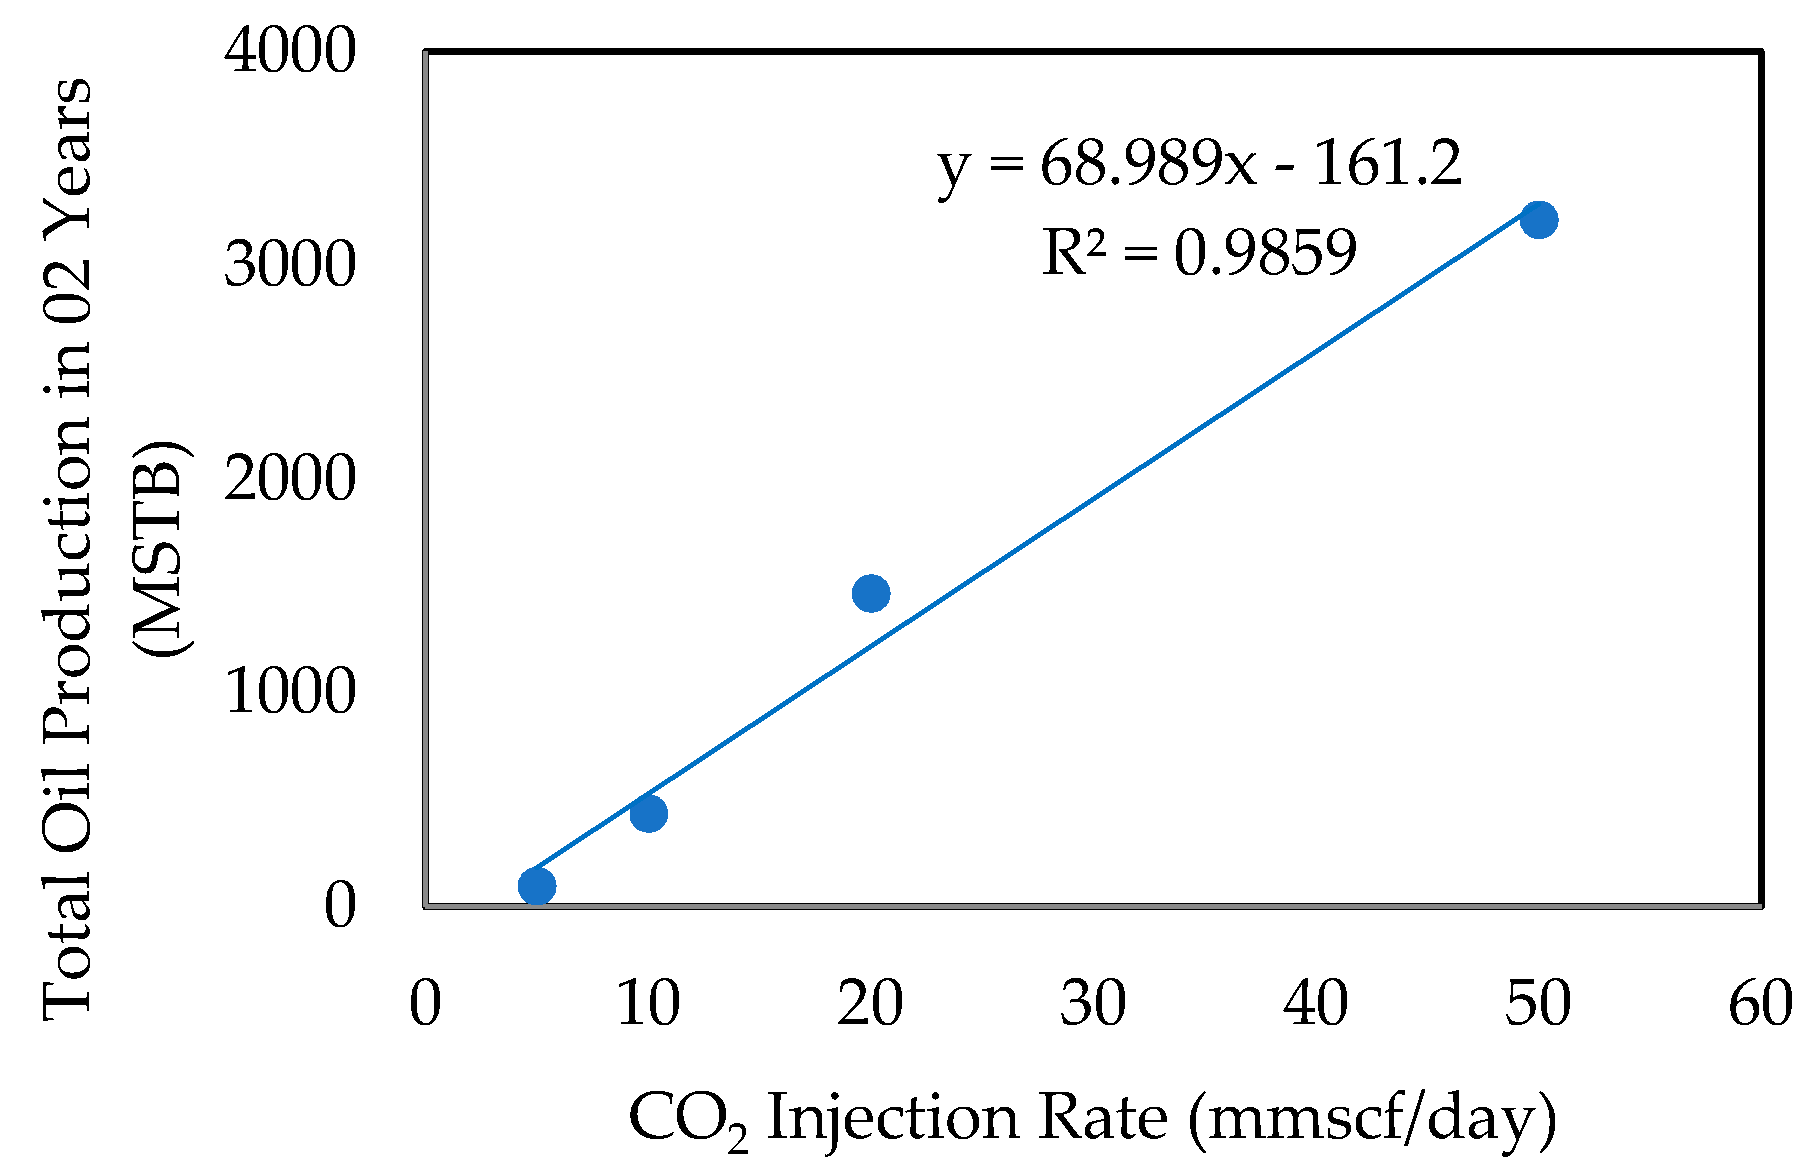
- Effect of CO2 Injection Rate
- (3)
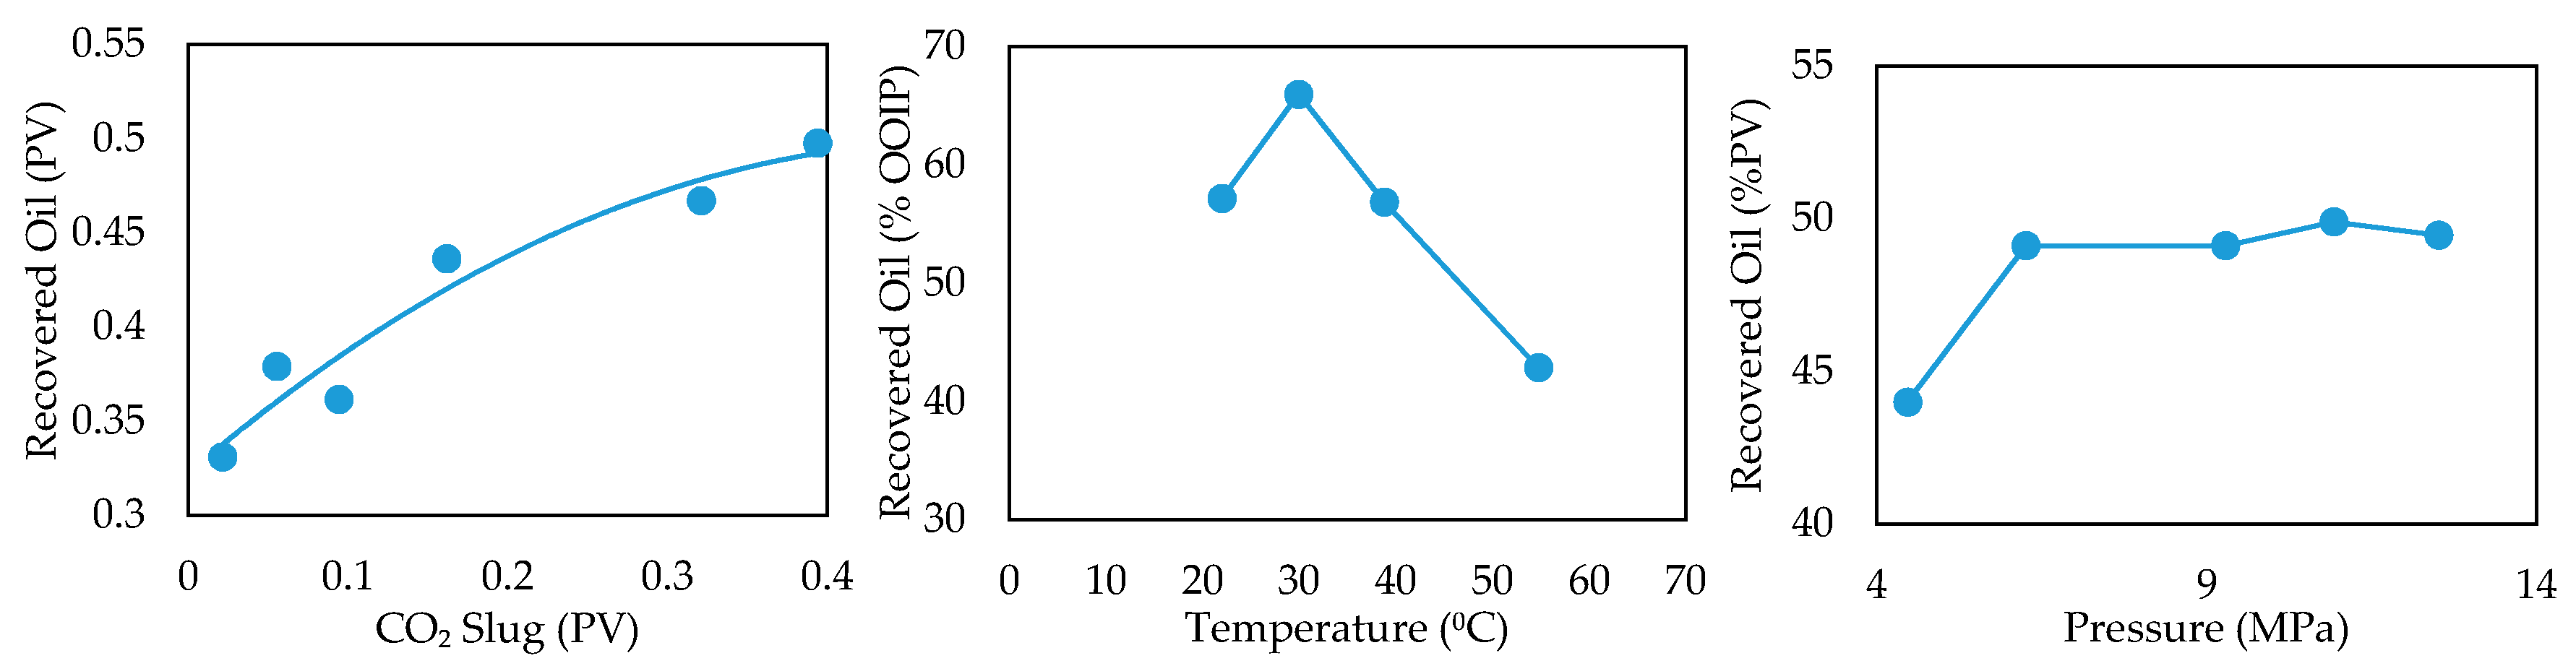
- Effect of Amount of CO2 Injected
- (4)
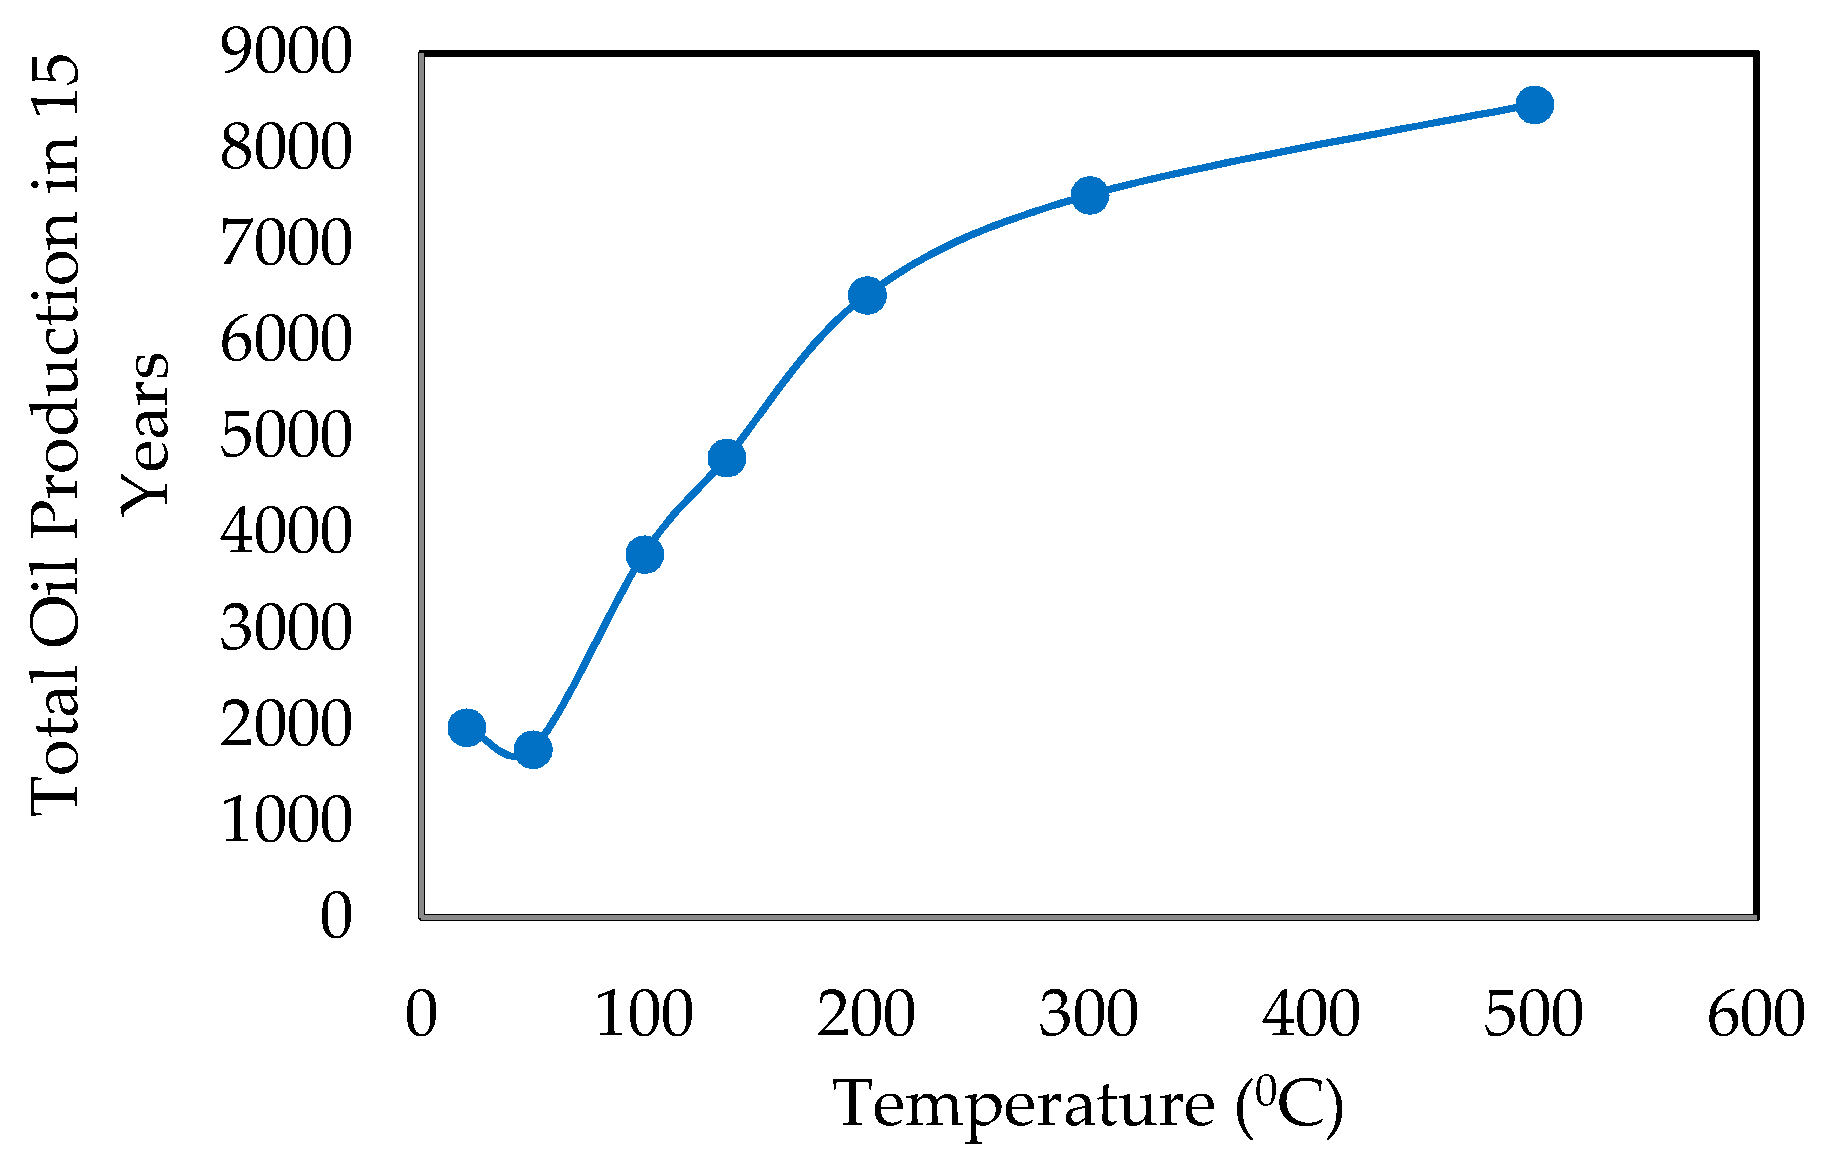
- Effect of Temperature
- (5)
- WAG CO2 Injection
- (6)
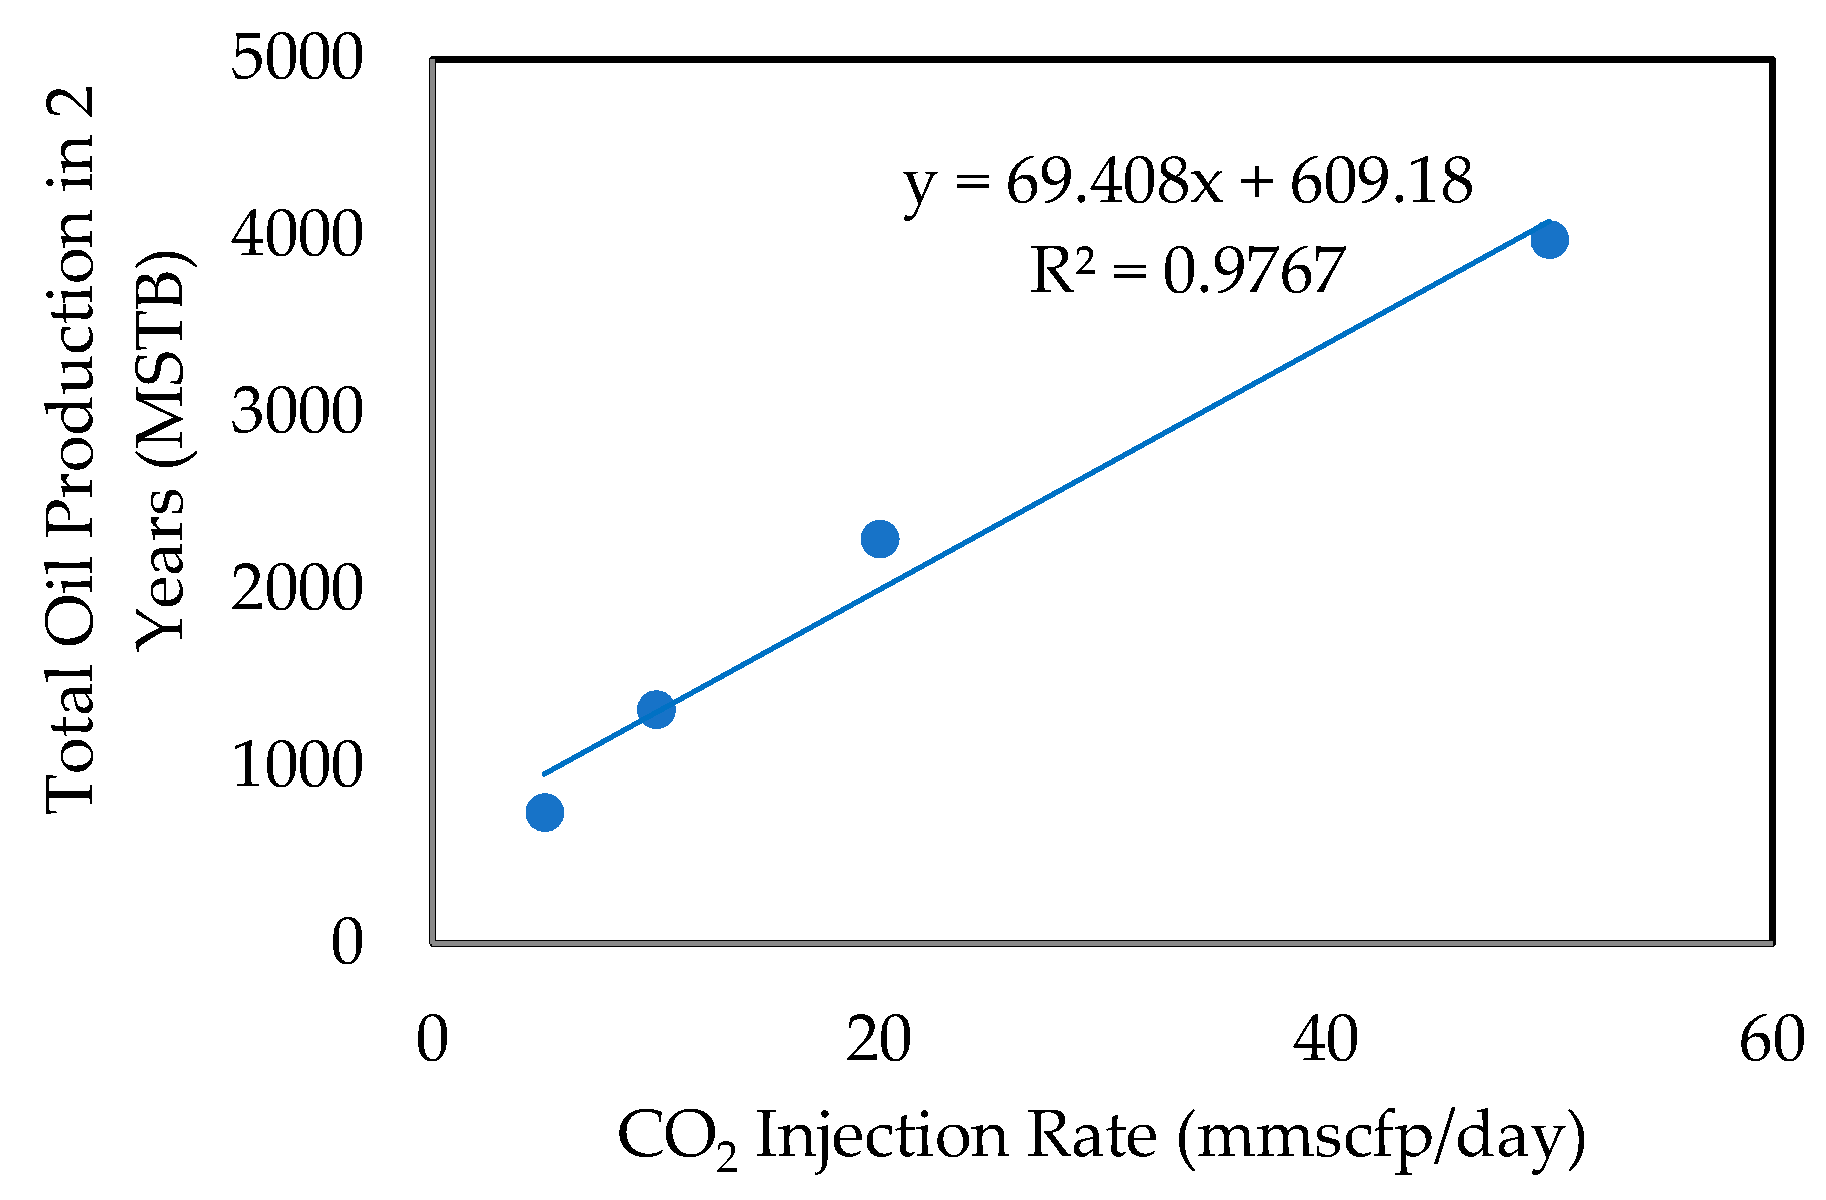
- Effect of CO2 Injection Rate
- (7)
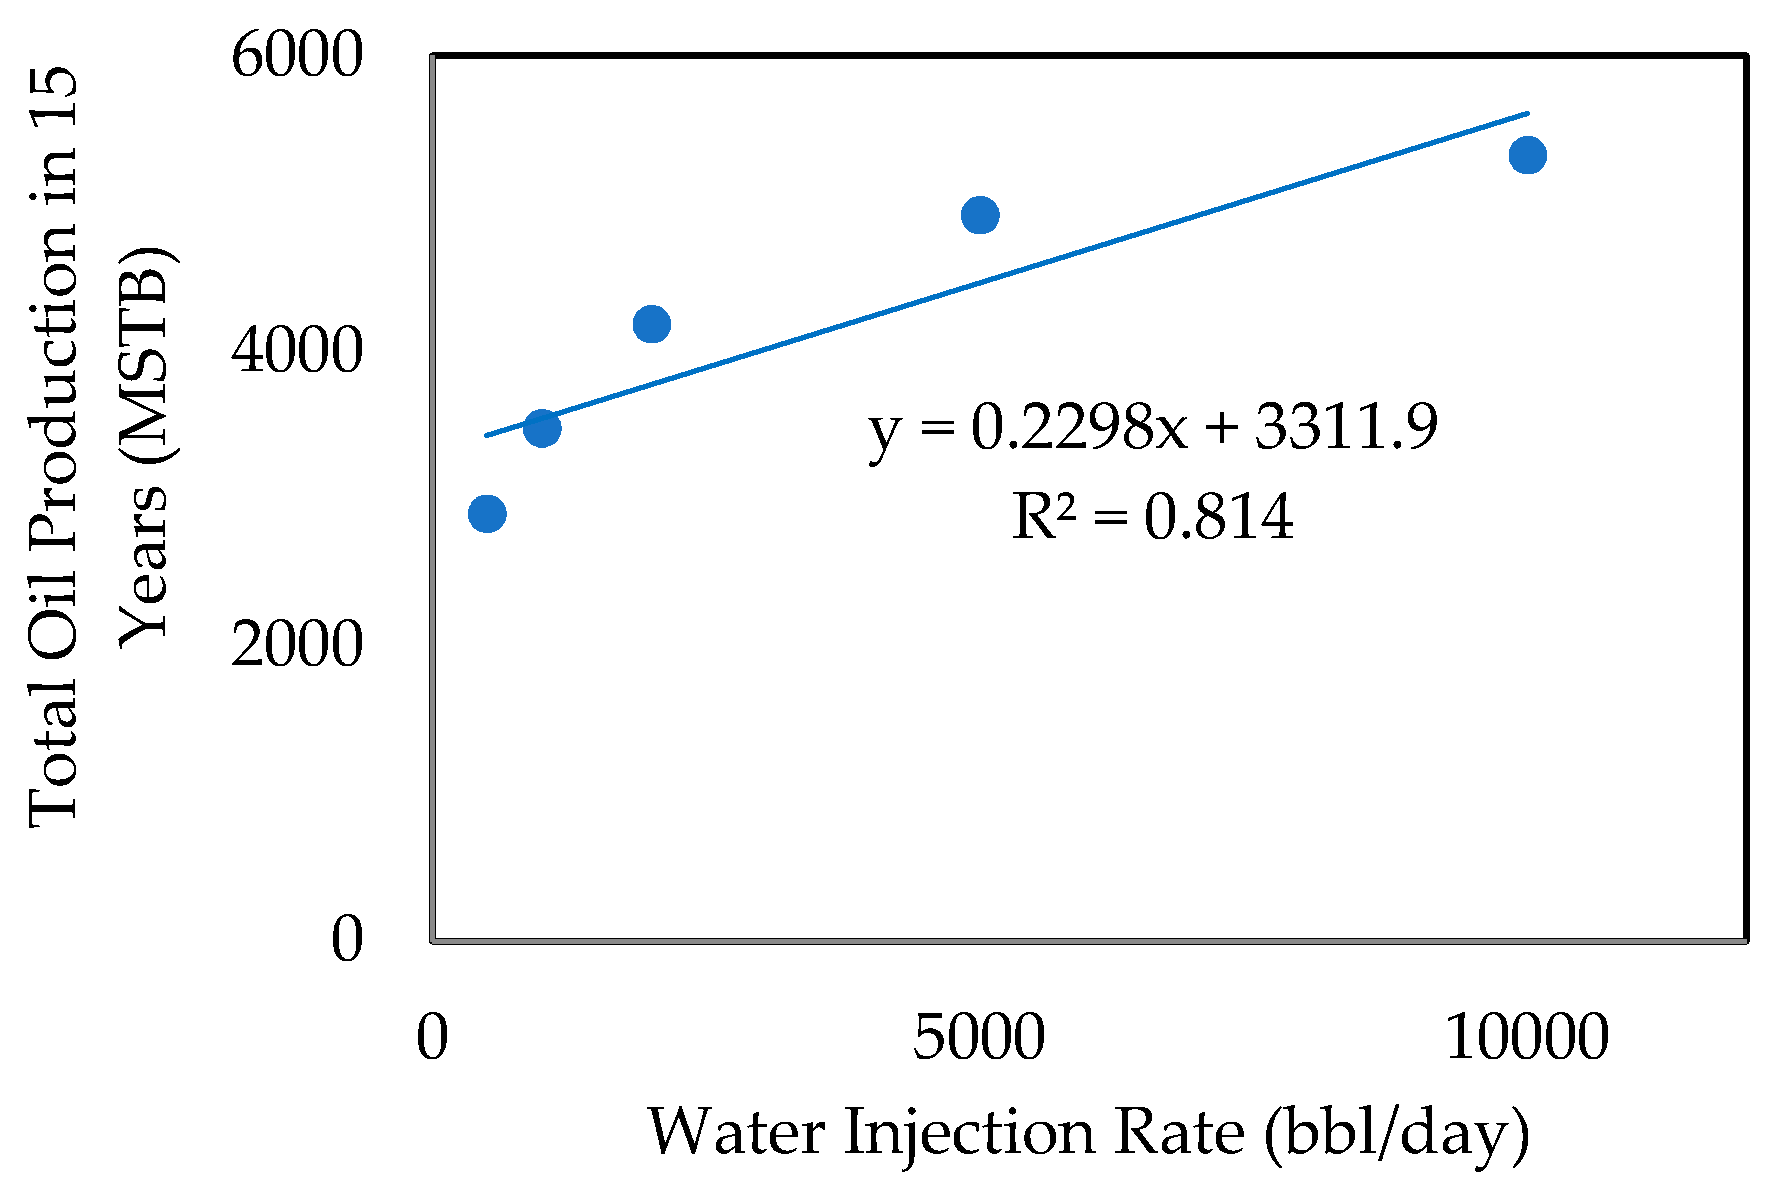
- Effect of Water Injection Rate
- (8)
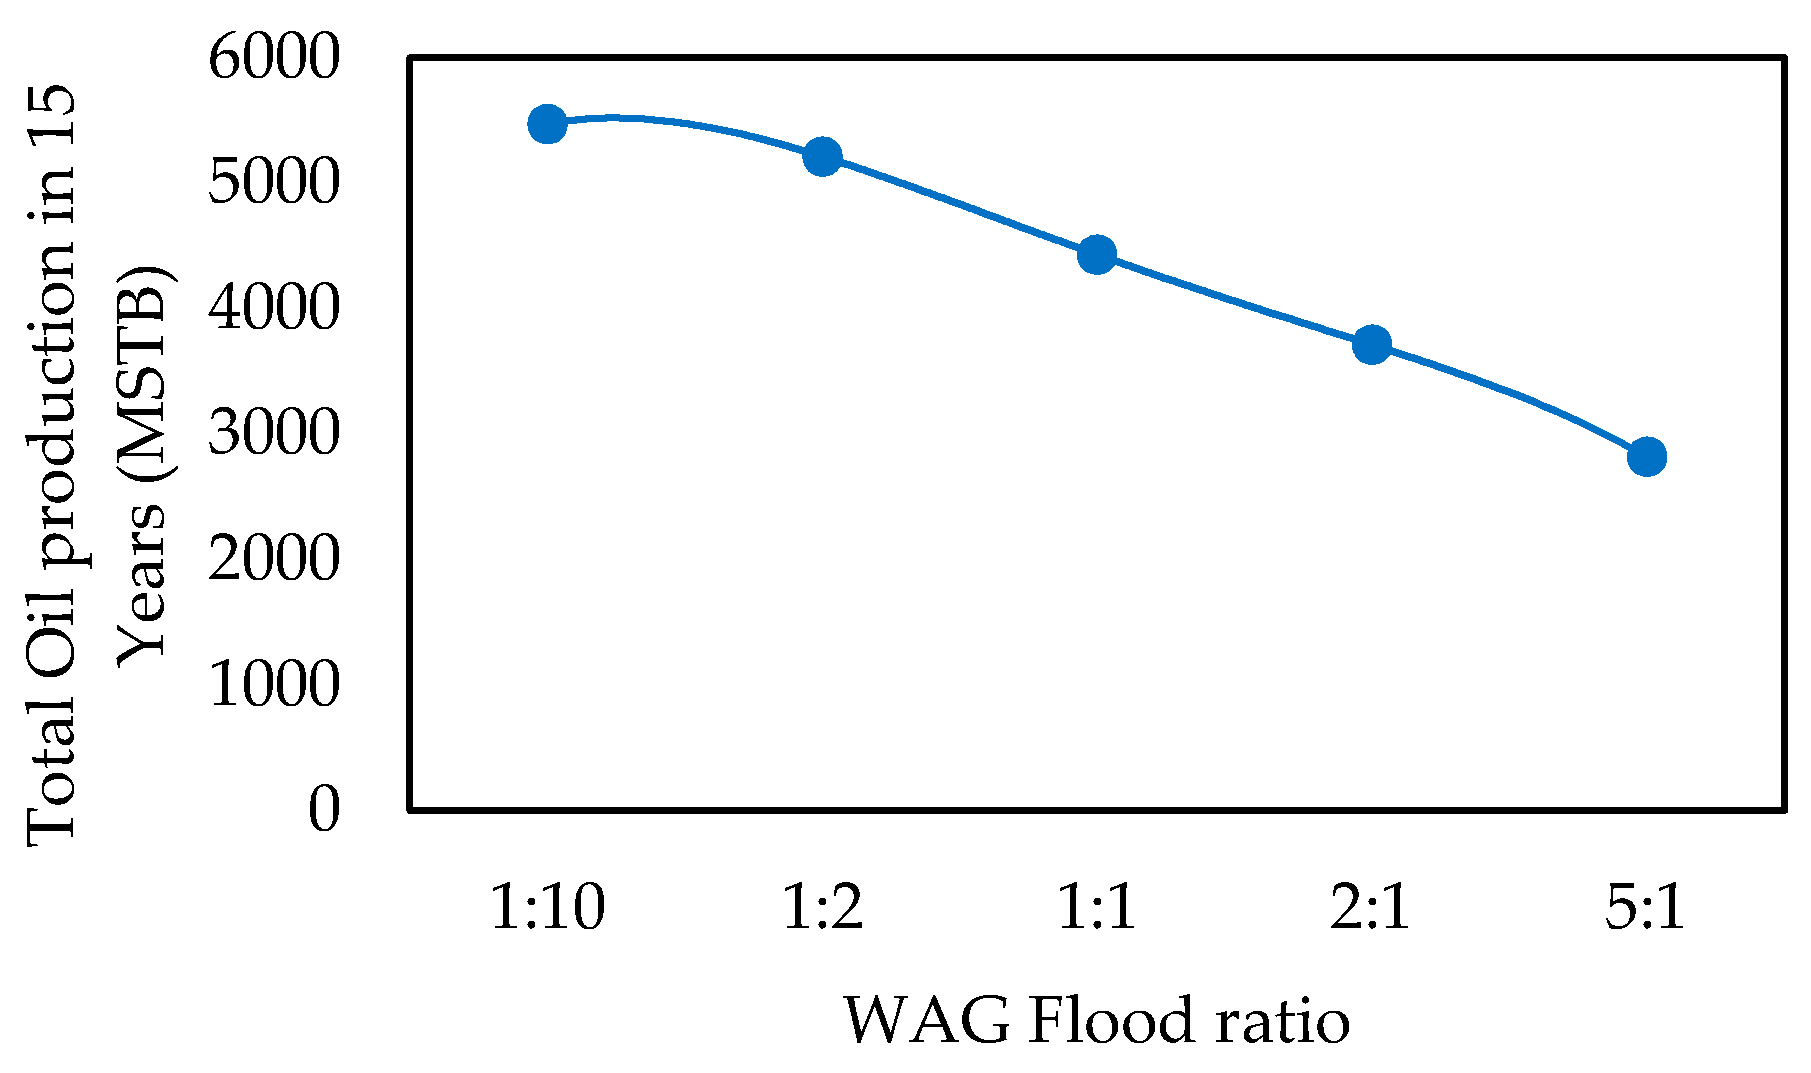
- WAG Flood Ratio
- (9)
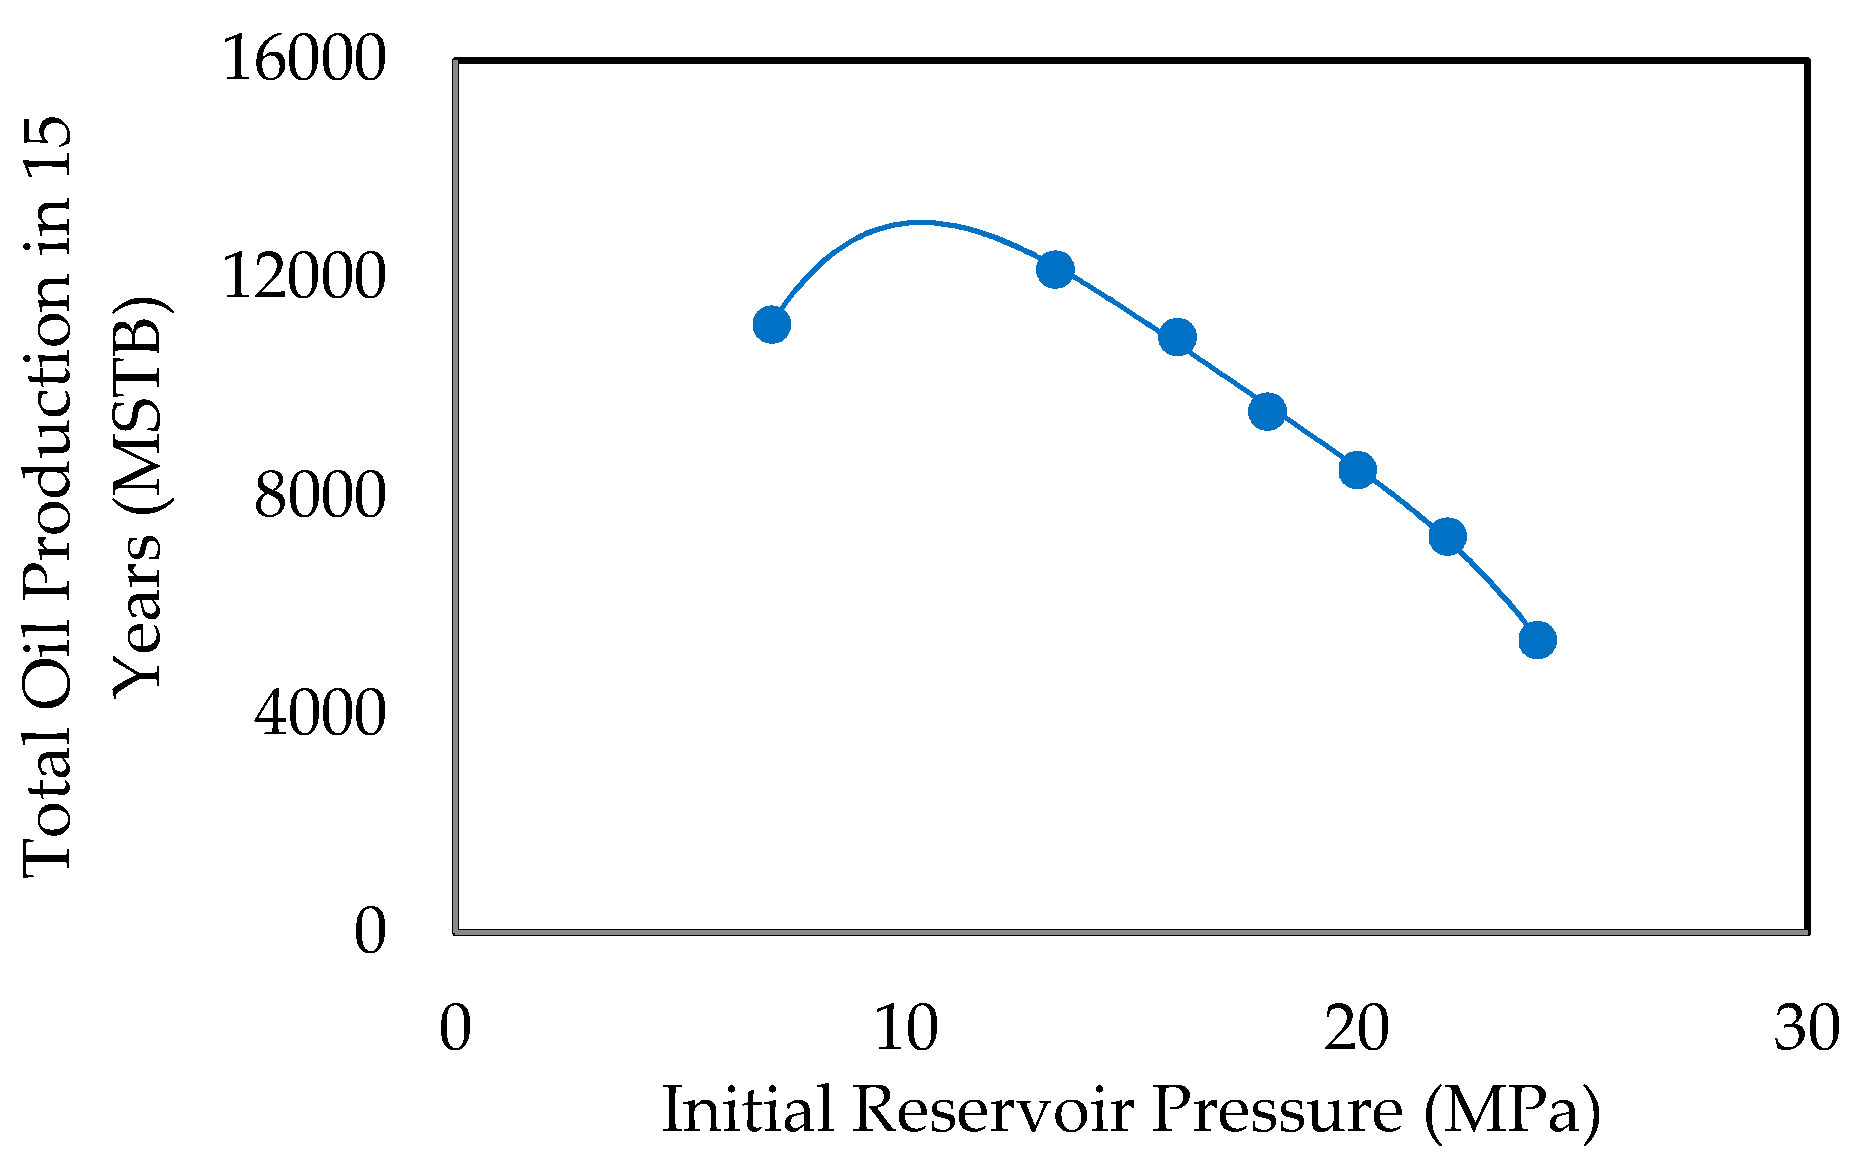
- Initial Reservoir Pressure
- (10)
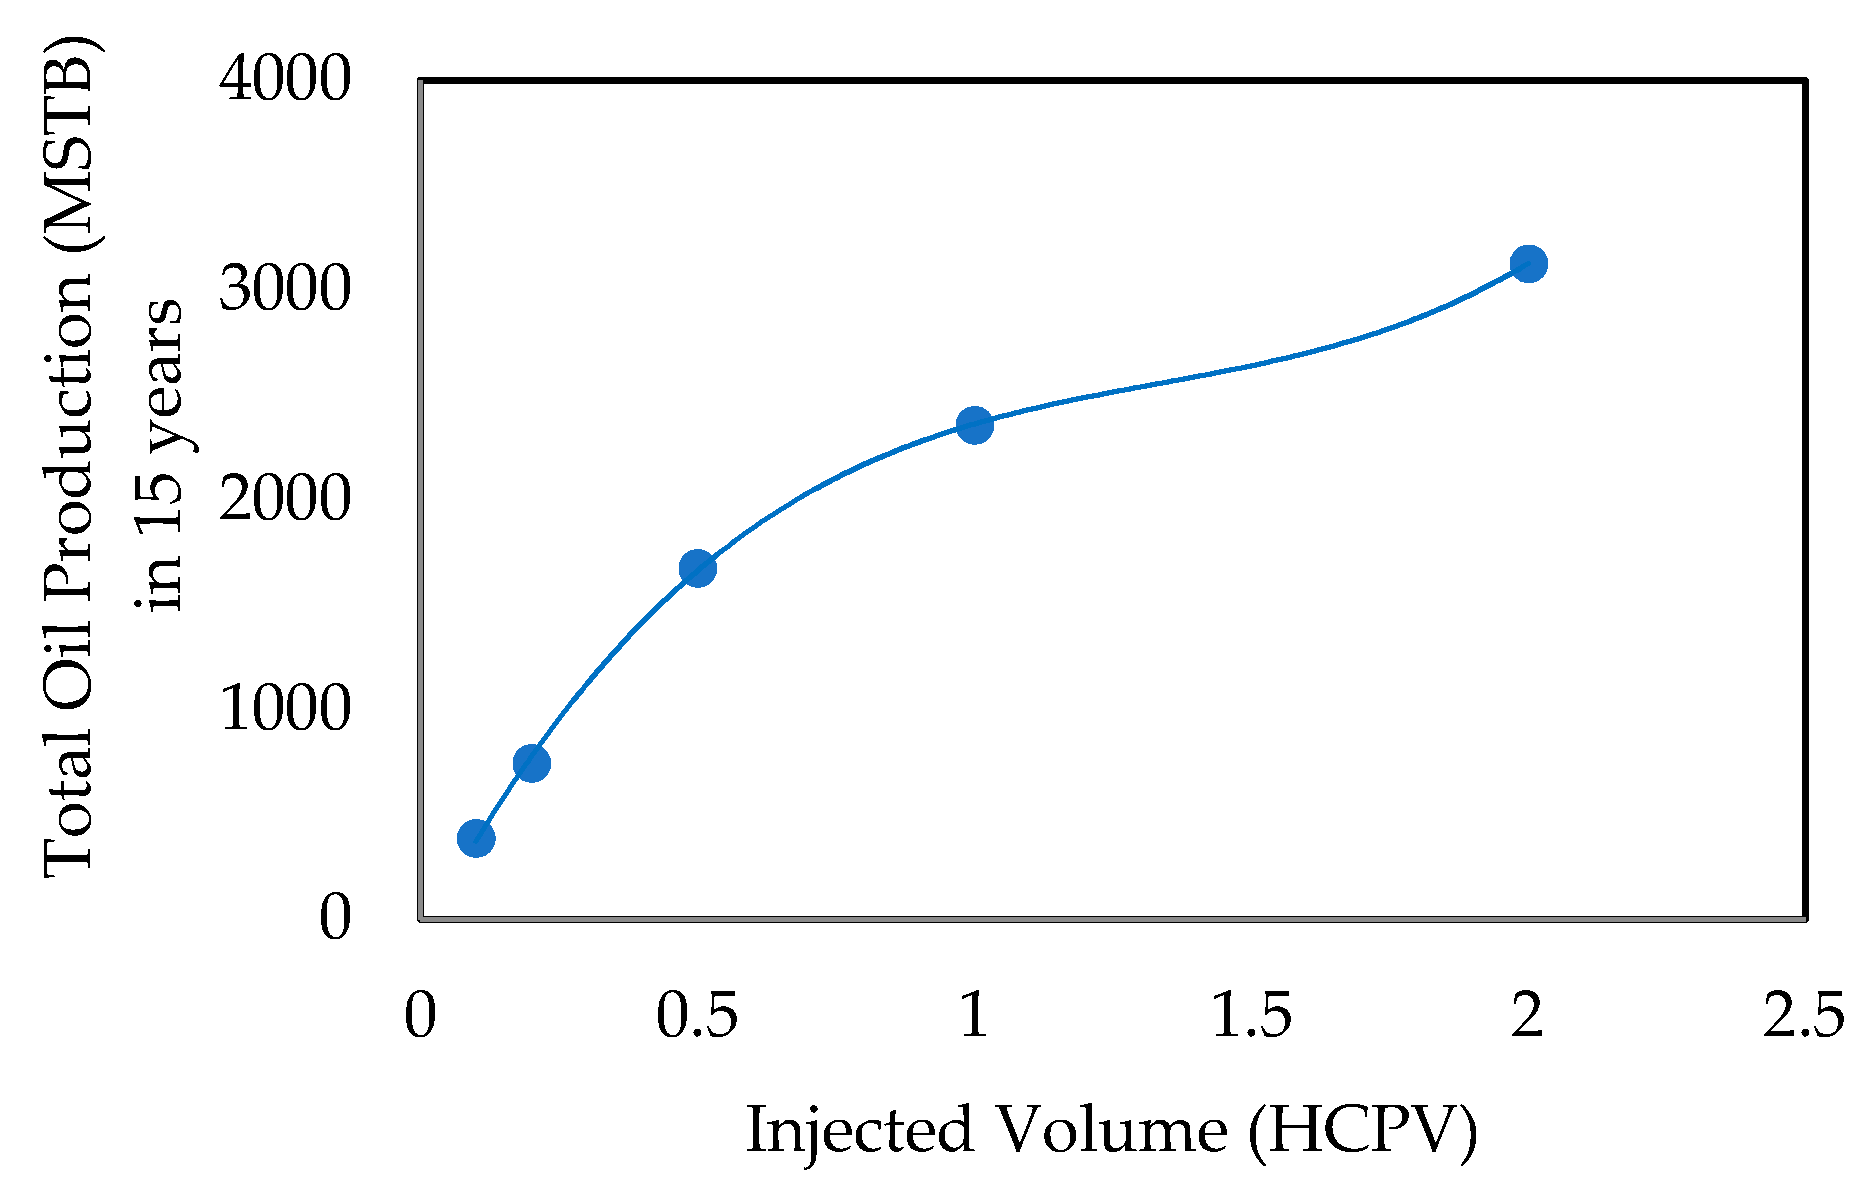
- Effect of Total Injected Volume in HCPV
- (11)
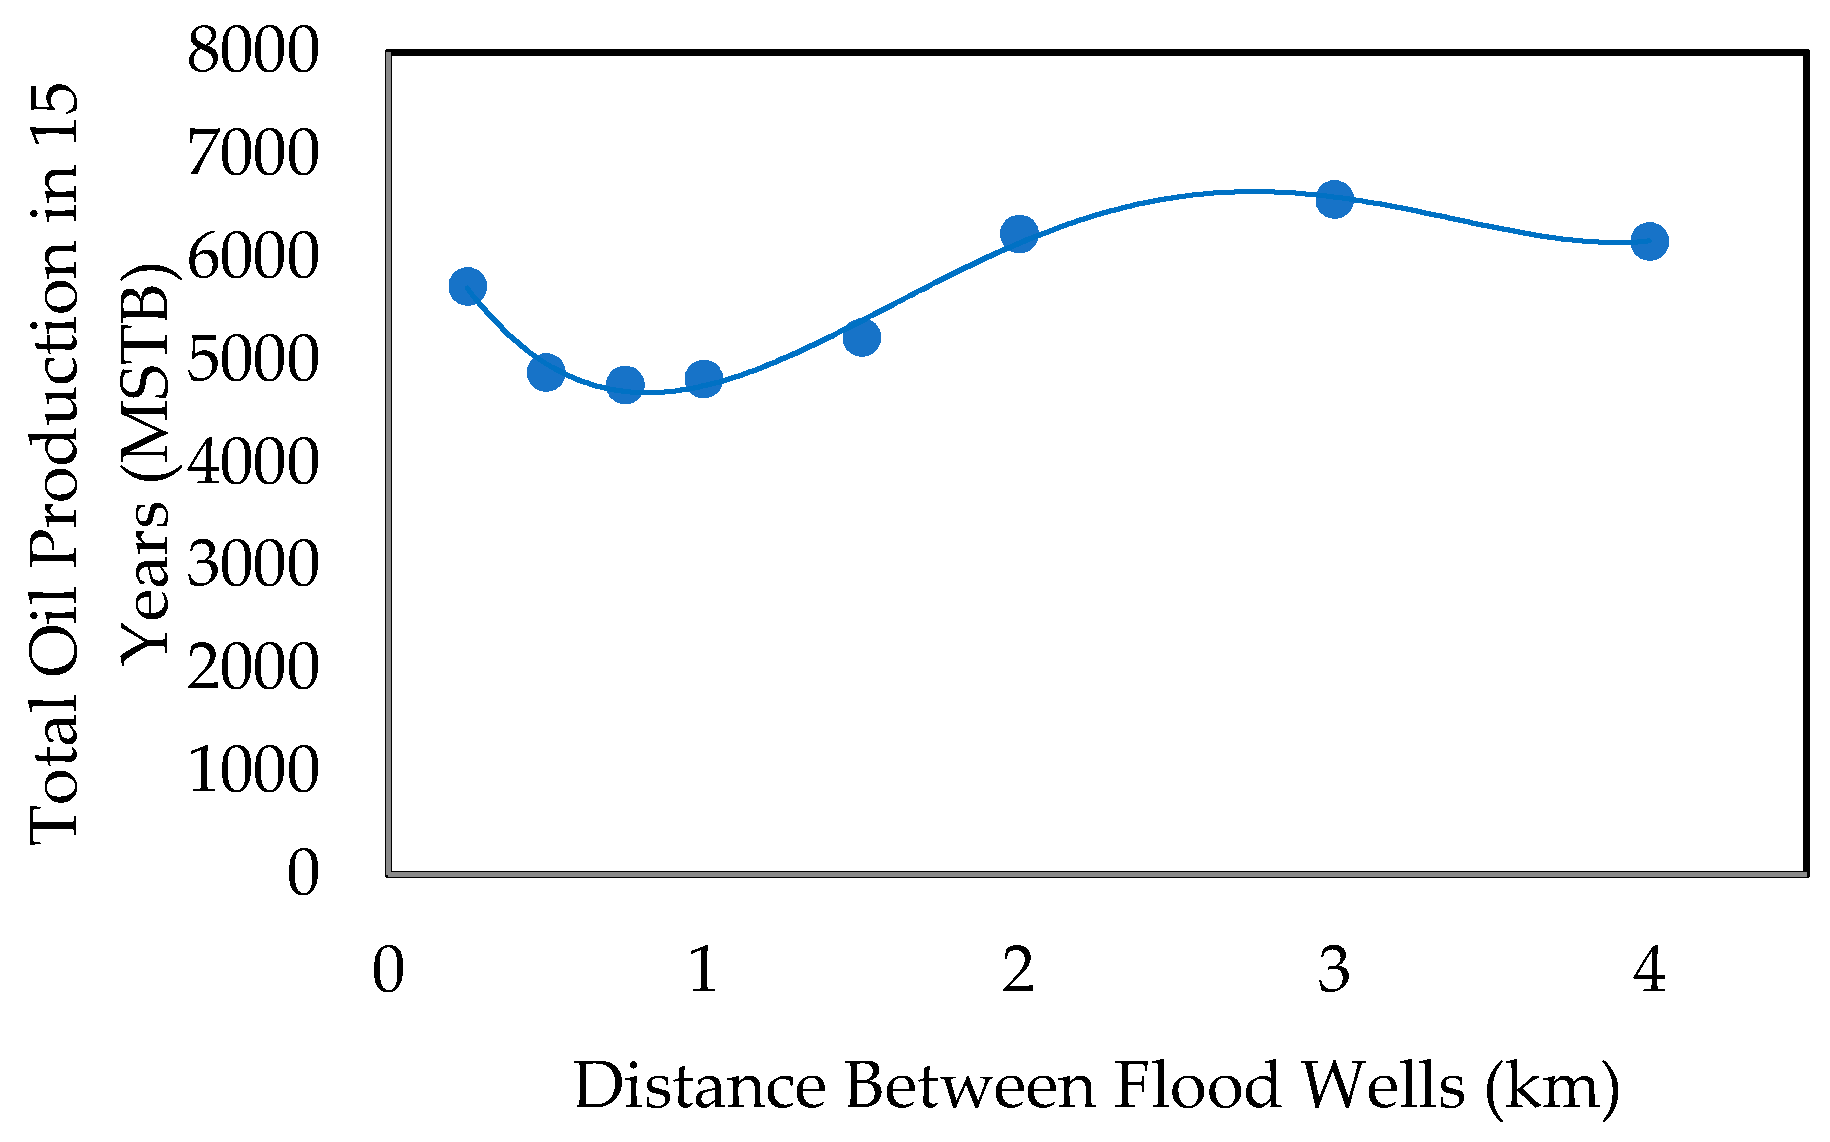
- Effect of Injecting Well Pattern
4. Conclusions
Acknowledgments
Author Contributions
Conflicts of Interest
Abbreviations
| EOR | Enhanced Oil Recovery |
| HCPV | Hydrocarbon pore volume |
| mmcf/day | Million cubic feet per day |
| bbl/day | Barrel per day |
| STB | Stock tank barrel |
| MMP | Minimum miscibility pressure |
| MSTB | Million stock tank barrels |
| OOIP | Original oil in place |
| PV | Pore volume |
| WAG | Water alternating gas |
References
- Hook, M.; Hirsch, R.; Aleklett, K. Giant oil field decline rates and their influence on world oil production. Energy Policy 2009, 37, 2262–2272. [Google Scholar] [CrossRef]
- Godec, M.; Kuuskraa, V.; van Leeuwen, T.; Melzer, L.S.; Wildgust, N. CO2 storage in depleted oil fields: The worldwide potential for carbon dioxide enhanced oil recovery. Energy Procedia 2011, 4, 2162–2169. [Google Scholar] [CrossRef]
- Kuuskraa, V.A.; Koperna, G.J. Evaluating the Potential for “Game Changer” Improvements in Oil Recovery Efficiency Using CO2 EOR; U.S. Department of Energy: Washington, DC, USA, 2006.
- Lake, L.; Johns, R.T.; Rossen, W.R.; Pope, G.A. Fundamentals of Enhanced Oil Recovery; Society of Petroleum Engineers (SPE): Richardson, TX, USA, 2015. [Google Scholar]
- Green, D.W.; Willhite, G.P. Enhanced Oil Recovery; Society of Petroleum Engineers (SPE): Richardson, TX, USA, 1998; Volume 6. [Google Scholar]
- Holm, L. Miscibility and miscible displacement. J. Pet. Technol. 1986, 38, 817–818. [Google Scholar] [CrossRef]
- Tunio, S.Q.; Tunio, A.H.; Ghirano, N.A.; El Adawy, Z.M. Comparison of different enhanced oil recovery techniques for better oil productivity. Int. J. Appl. Sci. Technol. 2011, 1, 143–153. [Google Scholar]
- Kulkarni, M.M. Immiscible and Miscible Gas-Oil Displacements in Porous Media. Master’s Thesis, Louisiana State University, Baton Rouge, LA, USA, 2003. [Google Scholar]
- Schrag, D.P. Preparing to capture carbon. Science 2007, 315, 812–813. [Google Scholar] [CrossRef] [PubMed]
- Perera, M.S.A.; Ranjith, P.G.; Airey, D.W.; Choi, S.K. Sub- and super-critical carbon dioxide flow behavior in naturally fractured black coal: An experimental study. Fuel 2011, 90, 3390–3397. [Google Scholar] [CrossRef]
- Perera, M.S.A.; Ranjith, P.G. Carbon dioxide sequestration effects on coal's hydro-mechanical properties: A review. Int. J. Energ. Res. 2012, 36, 1015–1031. [Google Scholar] [CrossRef]
- Perera, M.S.A.; Ranjith, P.G.; Choi, S.K.; Bouazza, A.; Kodikara, J.; Airey, D. A review of coal properties pertinent to carbon dioxide sequestration in coal seams: With special reference to victorian brown coals. Environ. Earth Sci. 2011, 64, 223–235. [Google Scholar] [CrossRef]
- Ranathunga, A.S.; Perera, M.S.A.; Ranjith, P.G. Deep coal seams as a greener energy source: A review. J. Geophys. Eng. 2014, 11, 063001. [Google Scholar] [CrossRef]
- Gozalpour, F.; Ren, S.R.; Tohidi, B. CO2-EOR and storage in oil reservoir. Oil Gas Sci. Technol. 2005, 60, 537–546. [Google Scholar] [CrossRef]
- Arshad, A.; Al-Majed, A.A.; Menouar, H.; Muhammadain, A.M.; Mtawaa, B. Carbon Dioxide (CO2) Miscible Flooding in Tight Oil Reservoirs: A Case Study. In Proceedings of the Kuwait International Petroleum Conference and Exhibition, Kuwait City, Kuwait, 14–16 December 2009.
- Bui, L.H. Near Miscible CO2 Application to Improve Oil Recovery. Master’s Thesis, University of Kansas, Lawrence, KS, USA, 2010. [Google Scholar]
- Ozan, P. Advanced resources international, basin oriented strategies for CO2 enchanced oil recovery: Oklahoma. Onshore Gulf Coast 2003, 34, 117–118. [Google Scholar]
- Advanced Resources International. Basin Oriented Strategies for CO2 Enchanced Oil Recovery: Permian Basin; U.S. Department of Energy: Washington, DC, USA, 2006.
- Poettmann, F. Improved Oil Recovery; Interstate Oil Compact Commission: Oklahoma City, OK, USA, 1983. [Google Scholar]
- Holm, L.; Josendal, V. Mechanisms of oil displacement by carbon dioxide. J. Pet. Technol. 1974, 26, 1427. [Google Scholar] [CrossRef]
- Ali, S.F.; Thomas, S. A realistic look at enhanced oil recovery. Sci. Iran. 1994, 1, 219–230. [Google Scholar]
- Tabrizy, V.A. Investigated Miscible CO2 Flooding for Enhancing Oil Recovery in Wettability Altered Chalk and Sandstone Rocks. Ph.D. Thesis, University of Stavanger, Stavanger, Norway, 2012. [Google Scholar]
- Holtz, M.H.; Nance, P.K.; Finley, R.J. Reduction of greenhouse gas emissions through CO2 EOR in Texas. Environ. Geosci. 2001, 8, 187–199. [Google Scholar] [CrossRef]
- Jarrell, P.M.; Fox, C.E.; Stein, M.H.; Webb, S.L.; Johns, R.T.; Day, L.A. Practical Aspects of CO2 Flooding; SPE Monograph Series; Society of Petroleum Engineers: Richardson, TX, USA, 2002; Volume 22, pp. 220–231. [Google Scholar]
- Alian, S.S.; Omar, A.A.; Alta, A.F.; Hani, I. Study of Asphaltene Precipitation During CO2 Injection for Malaysian Light Oil Reservoirs. In Proceedings of the National Postgraduate Conference (NPC), Perak, Malaysia, 19–20 September 2011.
- Rabbani, A.; Hassanzadeh, G.; Dehyadegari, E. Asphaltene deposition under CO2 injection: An experimental study of the bangestan reservoir of Ahwaz oilfield, SW Iran. Pet. Sci. Technol. 2012, 30, 9–15. [Google Scholar] [CrossRef]
- Bagci, A. Immiscible CO2 flooding through horizontal wells. Energy Sources Part A 2007, 29, 85–95. [Google Scholar] [CrossRef]
- Issever, K.; Topkaya, I. Use of carbon dioxide to enhanced heavy oil recovery. In Proceedings of the 7th Unitar International Conference on Heavy Crude and Tar Sands, Beijing, China, 27–30 October 1998.
- Emera, M.; Sarma, H. Prediction of CO2 solubility in oil and the effects on the oil physical properties. Energy Sources Part A 2007, 29, 1233–1242. [Google Scholar] [CrossRef]
- Al Jarba, M.; Al Anazi, B.D. A comparison study of the of the CO2-oil physical properties-literature correlations accuracy using visual basic modeling technique. Oil Gas Bus. 2009, 60, 287–291. [Google Scholar]
- Rojas, G.; Ali, S. Scaled model studies of carbon dioxide/brine injection strategies for heavy oil recovery from thin formations. J. Can. Pet. Technol. 1986, 25. [Google Scholar] [CrossRef]
- Klins, M.A. Carbon Dioxide Flooding: Basic Mechanisms and Project Design; International Human Resources Development Corporation: Boston, MA, USA, 1984. [Google Scholar]
- Manrique, E.J.; Muci, V.E.; Gurfinkel, M.E. EOR Field experiences in carbonate reservoirs in the United States. SPE Reserv. Eval. Eng. 2007, 10, 667–686. [Google Scholar] [CrossRef]
- Moritis, G. New companies, infrastructure, projects reshape landscape for CO2 EOR in US. Oil Gas J. 2001, 99, 68. [Google Scholar]
- Kuuskraa, V.; Ferguson, R. Storing CO2 with Enhanced Oil Recovery; U.S. Department of Energy: Washington, DC, USA, 2008.
- Duda, J.R.; Il, A.B.Y.; Long, R.; Dehoratiis, G.; Ogunsola, O. Carbon Dioxide Enhanced Oil Recovery: Untapped Domestic Energy Supply and Long Term Carbon Storage Solution; U.S. Department of Energy: Washington, DC, USA, 2010.
- Alvarado, V.; Manrique, E. Enhanced oil recovery: An update review. Energies 2010, 3, 1529–1575. [Google Scholar] [CrossRef]
- Aycaguer, A.C.; Lev-On, M.; Winer, A.M. Reducing carbon dioxide emissions with enhanced oil recovery projects: A life cycle assessment approach. Energy Fuel 2001, 15, 303–308. [Google Scholar] [CrossRef]
- Khoo, H.H.; Tan, R.B. Environmental impact evaluation of conventional fossil fuel production (oil and natural gas) and enhanced resource recovery with potential CO2 sequestration. Energy Fuel 2006, 20, 1914–1924. [Google Scholar] [CrossRef]
- Olivier, J.; Janssens Maenhout, G.; Peters, J. Trends in Global CO2 Emissions; 2012 Report, the Hague: Pbl Netherlands Environmental Assessment Agency; ISPRA: Joint Research Centre. Available online: http://www.pbl.nl/sites/default/files/cms/publicaties/PBL_2012_Trends_in_global_CO2_emissions_2012 (accessed on 18 July 2012).
- Massachusetts Institute of Technolog. Role of Enhanced Oil Recovery in Accelerating the Deployment of Carbon Capture and Sequestration; MIT: Cambridge, MA, USA, 2010. [Google Scholar]
- Blondes, M.S.; Brennan, S.T.; Merrill, M.D.; Buursink, M.L.; Warwick, P.D.; Cahan, S.M.; Corum, M.D.; Cook, T.A.; Craddock, W.H.; DeVera, C.A.; et al. National Assessment of Geologic Carbon Dioxide Storage Resources–Methodology Implementation; US Geological Survey Open-File Report 2013–1055; U.S. Geological Survey (USGS): Reston, WV, USA, 2013.
- Koornneef, J.; Ramírez, A.; Turkenburg, W.; Faaij, A. The environmental impact and risk assessment of CO2 capture, transport and storage-an evaluation of the knowledge base using the dpsir framework. Energy Procedia 2011, 4, 2293–2300. [Google Scholar] [CrossRef]
- Tenasaka, I. Bridging the Commercial Gap for Carbon Capture and Storage; Global CCS Institute: Maryland, NE, USA, 2011. [Google Scholar]
- Demchuk, M.; Weyburn, T.L. Testimony Prepared for the Oversight Hearing on “Spinning Straw into Black Gold: Enhanced Oil Recovery Using Carbon Dioxide”; U.S. House of Representatives: Washington, DC, USA, 2008.
- Taber, J.J. Dynamic and static forces required to remove a discontinuous oil phase from porous media containing both oil and water. Soc. Pet. Eng. J. 1969, 9, 3–12. [Google Scholar] [CrossRef]
- Peng, B. CO2 Storage and Enhanced Oil Recovery in Jilin Oil Field; University of Petroleum: Beijing, China, 2010. [Google Scholar]
- Mohammed-Singh, L.J.; Ashok, K. Lessons from trinidad’s CO2 immiscible pilot projects 1973–2003. In Proceedings of the IOR 2015—13th European Symposium on Improved Oil Recovery, Tulsa, OK, USA, 25 April 2005.
- Comberiati, J.R.; Zammerilli, A.M. Effects of Petroleum-Reservoir Conditions on Oil Recovery by Carbon Dioxide Injection; DOE/METC/TPR-83-4 (DE83008455); U.S. Department of Energy: Morgantown, WV, USA, 1982.
- Sweatman, R.E.; Crookshank, S.; Edman, S. Outlook and technologies for offshore CO2 EOR/CCS projects. In Proceedings of the Offshore Technology Conference, Houston, TX, USA, 2–5 May 2011.
- Thomas, S. Enhanced oil recovery-an overview. Oil Gas Sci. Technol. Rev. IFP 2008, 63, 9–19. [Google Scholar] [CrossRef]
- Advanced Resources International and Melzer Consul. CO2 Storage in Depleted Oilfields: Global Application Criteria for Carbon Dioxide Enhanced Oil Recovery; Report Number: 2009-12; IEA Greenhouse Gas R&D Programme: Stoke Orch, UK, 2009. [Google Scholar]
- Koperna, G.; Kuuskraa, V. Technical Oil Recovery Potential from Residual Oil Zones: Permian Basin; U.S. Depertment of Energy: Washington, DC, USA, 2006.
- National Energy Technology Laboratory. CO2 Prophet Software and User Manual; Naional Energy Technology Laboratory: South Park Township, PA, USA, 1994.
- Saini, D. CO2-Prophet model based evaluation of CO2-EOR and storage potential in mature oil reservoirs. J. Pet. Sci. Eng. 2015, 134, 79–86. [Google Scholar] [CrossRef]
- Han, W.S. Evaluation of CO2 Trapping Mechanisms at the Sacroc Northern Platform: Site of 35 years of CO2 injection; The New Mexico Institute of Mining and Technology: Socorro, NM, USA, 2008. [Google Scholar]
- Bon, J. Laboratory and Modelling Studies on the Effects of Injection Gas Composition on CO2-Rich Flooding in Cooper Basin, South Australia; The University of Adelaide: Adelaide, Australia, 2009. [Google Scholar]
- Ghedan, S. Global laboratory experience of CO2-EOR flooding. In Proceedings of the SPE/EAGE Reservoir Characterization & Simulation Conference, Abu Dhabi, United Arab Emirates, 19–21 October 2009.
- Yongmao, H.; Zenggui, W.; Binshan, J.; Yueming, C.; Xiangjie, L. Laboratory investigation of CO2 flooding. In Nigeria Annual International Conference and Exhibition; Society of Petroleum Engineers: Houston, TX, USA, 2004. [Google Scholar]
- Srivastava, R.K.; Huang, S.S.; Dong, M. Laboratory Investigation of Weyburn CO2 Miscible Flooding. J. Can. Pet. Technol. 2000, 39, 25–37. [Google Scholar] [CrossRef]
- Azzolina, N.; Gorecki, C.; Pu, H.; Peck, W.; Ayash, S.; Melzer, S.; Nakles, D.; Chatterjee, S. Statistical analysis of CO2-EOR production and injection data to examine ongoing and ultimate CO2-EOR incidental storage. In Proceedings of the 13th Annual Conference on Carbon Capture, Utilization and Storage Conference, Pittsburg, PA, USA, 28 April–1 May 2014.
- Perera, M.; Ranjith, P.; Choi, S.; Airey, D.; Weniger, P. Estimation of gas adsorption capacity in coal: A review and an analytical study. Int. J. Coal Prep. Util. 2012, 32, 25–55. [Google Scholar] [CrossRef]
- Perera, M.S.A.; Ranjith, P.G.; Choi, S.K.; Airey, D. Investigation of temperature effect on permeability of naturally fractured black coal for carbon dioxide movement: An experimental and numerical study. Fuel 2012, 94, 596–605. [Google Scholar] [CrossRef]
- Shaw, J.; Bachu, S. Screening, evaluation, and ranking of oil reservoirs suitable for CO2-flood EOR and carbon dioxide sequestration. J. Can. Pet. Technol. 2002, 41, 9–21. [Google Scholar] [CrossRef]
- Jackson, D.D.; Andrews, G.L.; Claridge, E.L. Optimum WAG ratio vs. Rock wettability in CO2 flooding. In Proceedings of SPE Annual Technical Conference and Exhibition, Las Vegas, NV, USA, 22–26 September 1985.
- Tiffin, D.L.; Yellig, W.F. Effects of mobile water on multiple-contact miscible gas displacements. Soc. Pet. Eng. J. 1983, 23, 447–455. [Google Scholar] [CrossRef]
- Stalkup, F.I. Displacement of oil by solevent at high water saturation. Soc. Pet. Eng. 1970, 10, 337–348. [Google Scholar] [CrossRef]
- Huang, E.T.S.; Holm, L.W. Effect of WAG injection and rock wettibility on oil recovery during CO2 flooding. Soc. Pet. Eng. 1988, 3, 119–129. [Google Scholar]
- Rivas, O.; Embid, S.; Bolivar, F. Ranking reservoirs for carbon dioxide flooding processes. SPE Adv. Technol. Ser. 1994, 2, 95–103. [Google Scholar] [CrossRef]
- Kovscek, A.R. Screening criteria for CO2 storage in oil reservoirs. Pet. Sci. Technol. 2002, 20, 841–866. [Google Scholar] [CrossRef]
- Bachu, S.; Shaw, J.C.; Pearson, R.M. Estimation of oil recovery and CO2 storage capacity in CO2 EOR incorporating the effect of underlying aquifers. In Proceedings of SPE/DOE Symposium on Improved Oil Recovery, Tulsa, OK, USA, 17–21 April 2004.
- Taber, J.J.; Martin, F.D.; Seright, R.S. EOR screening criteria revisited—Part 2: Applications and impact of oil prices. SPE Reserv. Eng. 1997, 12, 199–206. [Google Scholar] [CrossRef]


| Cost Category | Cost US$/barrel |
|---|---|
| CO2 costs | 15 |
| Well/Lease operation and management | 10–15 |
| Capital costs | 5–10 |
| Total (without any tax included) | 30–40 |
| Variable | Value |
|---|---|
| Dykstra-Parsons Coefficient | 0.7 |
| Reservoir Temperature | 137 °C |
| Average Reservoir Pressure | 22 MPa |
| Porosity | 0.15 |
| Initial oil saturation | 54% |
| Minimum Miscibility Pressure | 19 MPa |
| Oil Viscosity | 0.14 cp |
| Oil Formation Volume Factor (swelling factor) | 2.10 rb/STB |
| Solution Gas-Oil Ratio (solubility) | 1444 scf/STB |
| Oil Gravity, API | 30 |
| CO2 Specific Gravity (relative to air) | 1.5189 |
| Water Viscosity | 0.2 cp |
| Water Salinity | 2000 ppm |
© 2016 by the authors; licensee MDPI, Basel, Switzerland. This article is an open access article distributed under the terms and conditions of the Creative Commons Attribution (CC-BY) license (http://creativecommons.org/licenses/by/4.0/).
Share and Cite
Perera, M.S.A.; Gamage, R.P.; Rathnaweera, T.D.; Ranathunga, A.S.; Koay, A.; Choi, X. A Review of CO2-Enhanced Oil Recovery with a Simulated Sensitivity Analysis. Energies 2016, 9, 481. https://doi.org/10.3390/en9070481
Perera MSA, Gamage RP, Rathnaweera TD, Ranathunga AS, Koay A, Choi X. A Review of CO2-Enhanced Oil Recovery with a Simulated Sensitivity Analysis. Energies. 2016; 9(7):481. https://doi.org/10.3390/en9070481
Chicago/Turabian StylePerera, Mandadige Samintha Anne, Ranjith Pathegama Gamage, Tharaka Dilanka Rathnaweera, Ashani Savinda Ranathunga, Andrew Koay, and Xavier Choi. 2016. "A Review of CO2-Enhanced Oil Recovery with a Simulated Sensitivity Analysis" Energies 9, no. 7: 481. https://doi.org/10.3390/en9070481