Article

Labor Union Effects on Innovation and Commercialization Productivity: An Integrated Propensity Score Matching and Two-Stage Data Envelopment Analysis

1
Policy Development Team, Division of Policy and Cooperation, Korea Research Institute of Chemical Technology (KRICT), Yuseong-gu, Daejeon 305-600, Korea
2
Korea Advanced Institute of Science and Technology, 291, Daehak-ro, Yuseong-gu, Daejeon 305-701, Korea
*
Author to whom correspondence should be addressed.
Sustainability 2015, 7(5), 5120-5138; https://doi.org/10.3390/su7055120
Submission received: 30 November 2014 / Revised: 2 April 2015 / Accepted: 21 April 2015 / Published: 27 April 2015
(This article belongs to the Special Issue Sustainable Business and Development II)

Abstract

:
Research and development (R&D) is a critical factor in sustaining a firm’s competitive advantage. Accurate measurement of R&D productivity and investigation of its influencing factors are of value for R&D productivity improvements. This study is divided into two sections. The first section outlines the innovation and commercialization stages of firm-level R&D activities. This section analyzes the productivity of each stage using a propensity score matching (PSM) and two-stage data envelopment analysis (DEA) integrated model to solve the selection bias problem. Second, this study conducts a comparative analysis among subgroups categorized as labor unionized or non-labor unionized on productivity at each stage. We used Korea Innovation Survey (KIS) data for analysis using a sample of 400 Korean manufacturers. The key findings of this study include: (1) firm innovation and commercialization productivity are balanced and show relatively low innovation productivity; and (2) labor unions have a positive effect on commercialization productivity. Moreover, labor unions are an influential factor in determining manufacturing firms’ commercialization productivity.

1. Introduction

Korea has achieved radical economic growth with continual efforts towards technological innovation [1]. Korean manufacturing firms have played a significant role in this rapid growth. The manufacturing industry constituted 31.1% of the Korean gross value added in 2012 [2]. Since the 1998 Asian financial crisis, many Korean firms have opted for a labor market structure with greater labor flexibility, which has helped them to overcome the crisis [3,4]. The labor market structure is closely related to government policy.
Korea’s wage growth rates exceeded firm productivity rates during the period 1990 to 1993 because the Korean government policy failed to moderate wages between labor and business. Currently, Korean policy makers are focusing on increasing labor market flexibility after several policies have failed to coordinate labor and firms in terms of wage growth rates [5]. With enhanced labor market flexibility, Korean firm labor unions have attempted to improve wage and employment stability levels [6]. Korean labor unions have been affecting firm decisions concerning working conditions, wages, and lay-offs. Since the Democratization Declaration of 1987, labor unions have been growing, and the national unionization rate was 10.1% in 2011 [7]. Although Korean law does not prohibit staff reduction, firms face difficulties, in practice, when laying off workers because of the influence of labor unions. This rigid labor market of regular employees encourages the employment of temporary workers who lack job security and are paid low wages. Korean firms have recently preferred to employ temporary workers rather than commit to regular workers. In the Japanese context, labor unions have been positively affecting firm-level innovation under the seniority wage system. As a quid pro quo, employees have received training and education from the companies to increase their value as human resources that are used as complementary assets to foster firm productivity [8]. Korean labor market reform is similar to the labor market reform of Japan [5]; an investigation into labor unions’ effect on firms’ productivity is timely and valuable.
Firms must innovate to stay competitive [9]. The variation in competitive advantages explains the differences in firm performance [10]. From this perspective, R&D is also a significant element for firms’ survival and growth and offers opportunities for firms to secure competitive advantages. Increasing R&D productivity, therefore, is a crucial factor in enhancing firms’ sustainable economic growth [11,12,13,14,15]. Previous studies have focused on the effect of labor unions on R&D investments or union effects on R&D outputs, such as patents and innovation activity [16,17,18]. However, there are other influencing factors that determine firm sustainability and that shape the relationship between labor unions and R&D.
Previous studies have two main limitations. First, many researchers focus on firm conditional factors such as the industry and the firm size. It is difficult for firm decision makers to manage conditional factors to improve their R&D productivity. The consideration of internal factors will support decision makers. Second, almost all previous data envelopment analysis (DEA)-related studies have not addressed the sample selection bias problem. DEA does not consider sample selection bias, which can distort the derived results. Additional methodology is required to select the right sample for DEA. To overcome these two limitations of previous studies, this study examines the significance of labor unions and R&D productivity and investigates the effects of labor unions on R&D productivity. We attempted to solve selection bias in the comparative analysis by applying a propensity score matching (PSM) method to the sample to investigate R&D productivity. In the R&D productivity analysis, R&D is further divided into innovation and the commercialization stages [19]. The productivity in each stage is measured using a two-stage data envelopment analysis (DEA) model.
This manuscript is organized as follows: Section 2 provides a literature review of the two-stage DEA model used to analyze productivity, the PSM methodology that is combined with the two-stage DEA, and the effect of labor unions on firm R&D. Section 3 outlines the model and data sources. Section 4 presents the results of the analysis. Finally, Section 5 offers a summary, implications, and the limitations of the research.

2. Literature Review

This research overcomes the limitations of previous studies. We divide R&D into innovation and commercialization stages to investigate labor union effects on R&D productivity. Additionally, almost all of the related research has applied parametric methods. DEA provides insightful results with respect to reducing or summing input resources to enhance performance, whereas parametric methods are a suitable method for hypothesis testing and economic justification [20]. Unfortunately, each approach is unsuitable across all contexts or data. If DEA is considered with a parametric approach, Banker et al. [21] found that DEA is superior to the parametric approach, and Banker et al. [22] reconfirmed this finding by providing DEA’s more accurate efficiency estimates compared to corrected ordinary least squares (COLS). Thus, this paper selects a two-stage DEA as an appropriate method to measure R&D performance in terms of efficiency. We employ propensity scoring methods (PSM) methodology to mitigate the sample selection bias problem that is the main limitation of empirical research using DEA.

2.1. Two-Stage DEA Model for Analyzing Innovation and Commercialization Productivity

We employ two-stage DEA to measure innovation and commercialization productivity of Korean manufacturing firms (KMFs). The concept of DEA is defined by Farrell [23], who first introduced the concept of productive efficiency. Charnes et al. [24] developed a methodology to measure multiple-input and multiple-output productivity based on mathematical programming. Banker et al. [25] introduced a variable returns to scale (VRS) model to improve the weakness in the constant returns to scale (CRS) problem of Charnes, Cooper and Rhodes [24] methodology. DEA is one of the common approaches to the measuring of productivity [26], and it has attracted scholarly attention as a non-parametric approach [27,28].
One primary managerial objective is to produce a given output with minimal use of resources. The concept of productivity is the measuring of outputs divided by input resources [29]. Productivity, therefore, can be described as output/input [26]. DEA is an appropriate method to measure productivity using the ratio of multiple inputs and multiple outputs. DEA’s productivity ratio indicates relative efficiency. DEA is a widely used linear model for analyzing relative efficiency based on multiple inputs and outputs [30]. However, a substantial part of DEA models overlooks the existence of intermediates [27]. Practically, it is difficult to reflect the presence of intermediates because of the direct connection between inputs and outputs [27,31,32]. From this perspective, a two-stage DEA model can adequately represent the real-world setting and offer practical insights into firm productivity [33].
The two-stage DEA model was developed by Seiford and Zhu [34] and used by Chen and Zhu [35]. Seiford and Zhu [34] applied the Banker, Charnes and Cooper [25] equation for developing the two-stage DEA model that can solve the scale efficiency problem considering intermediate products. The authors investigated the productivity of the leading 55 US commercial banks and considered sales and operating income as they relate to scale efficiencies. We believe that this model is appropriate for applying firm-level research. Chen and Zhu [35] improved the two-stage DEA model in follow-up studies when measuring relative efficiency in numerous organizations.
Since Seiford and Zhu [34], many studies have applied the two-stage DEA model to organizational productivity analysis. These organizations represent various sectors including banking, IT investment, purchasing and supply management (PSM), and sports [32,35,36,37]. Recently, Cao and Yang [38] applied the two-stage DEA model when measuring the productivity of internet-based companies. The authors identified each firm’s position by mapping a 2 × 2 matrix using profitability and marketability efficiency scores.
With respect to R&D, many previous studies have explained that R&D is not an isolated single stage, but at least two stages forming a process [39,40,41,42]. A two-stage process is considered a more appropriate classification for R&D because it includes an innovation stage and a commercialization stage [19]. Thus, a two-stage DEA model is more appropriate than other traditional DEA models in the investigation of R&D productivity. Recently, Chiu et al. [43] investigated R&D productivity of Chinese high-tech industries using a two-stage DEA model.
R&D processes entail various paths of trial and error, which implies that there are no identical activities among individual firms [44]. A firm’s R&D productivity may differ according to the innovation and commercialization activity. Thus, this study investigates KMFs’ R&D productivity taking both the innovation and commercialization stages into account using a two-stage DEA model.

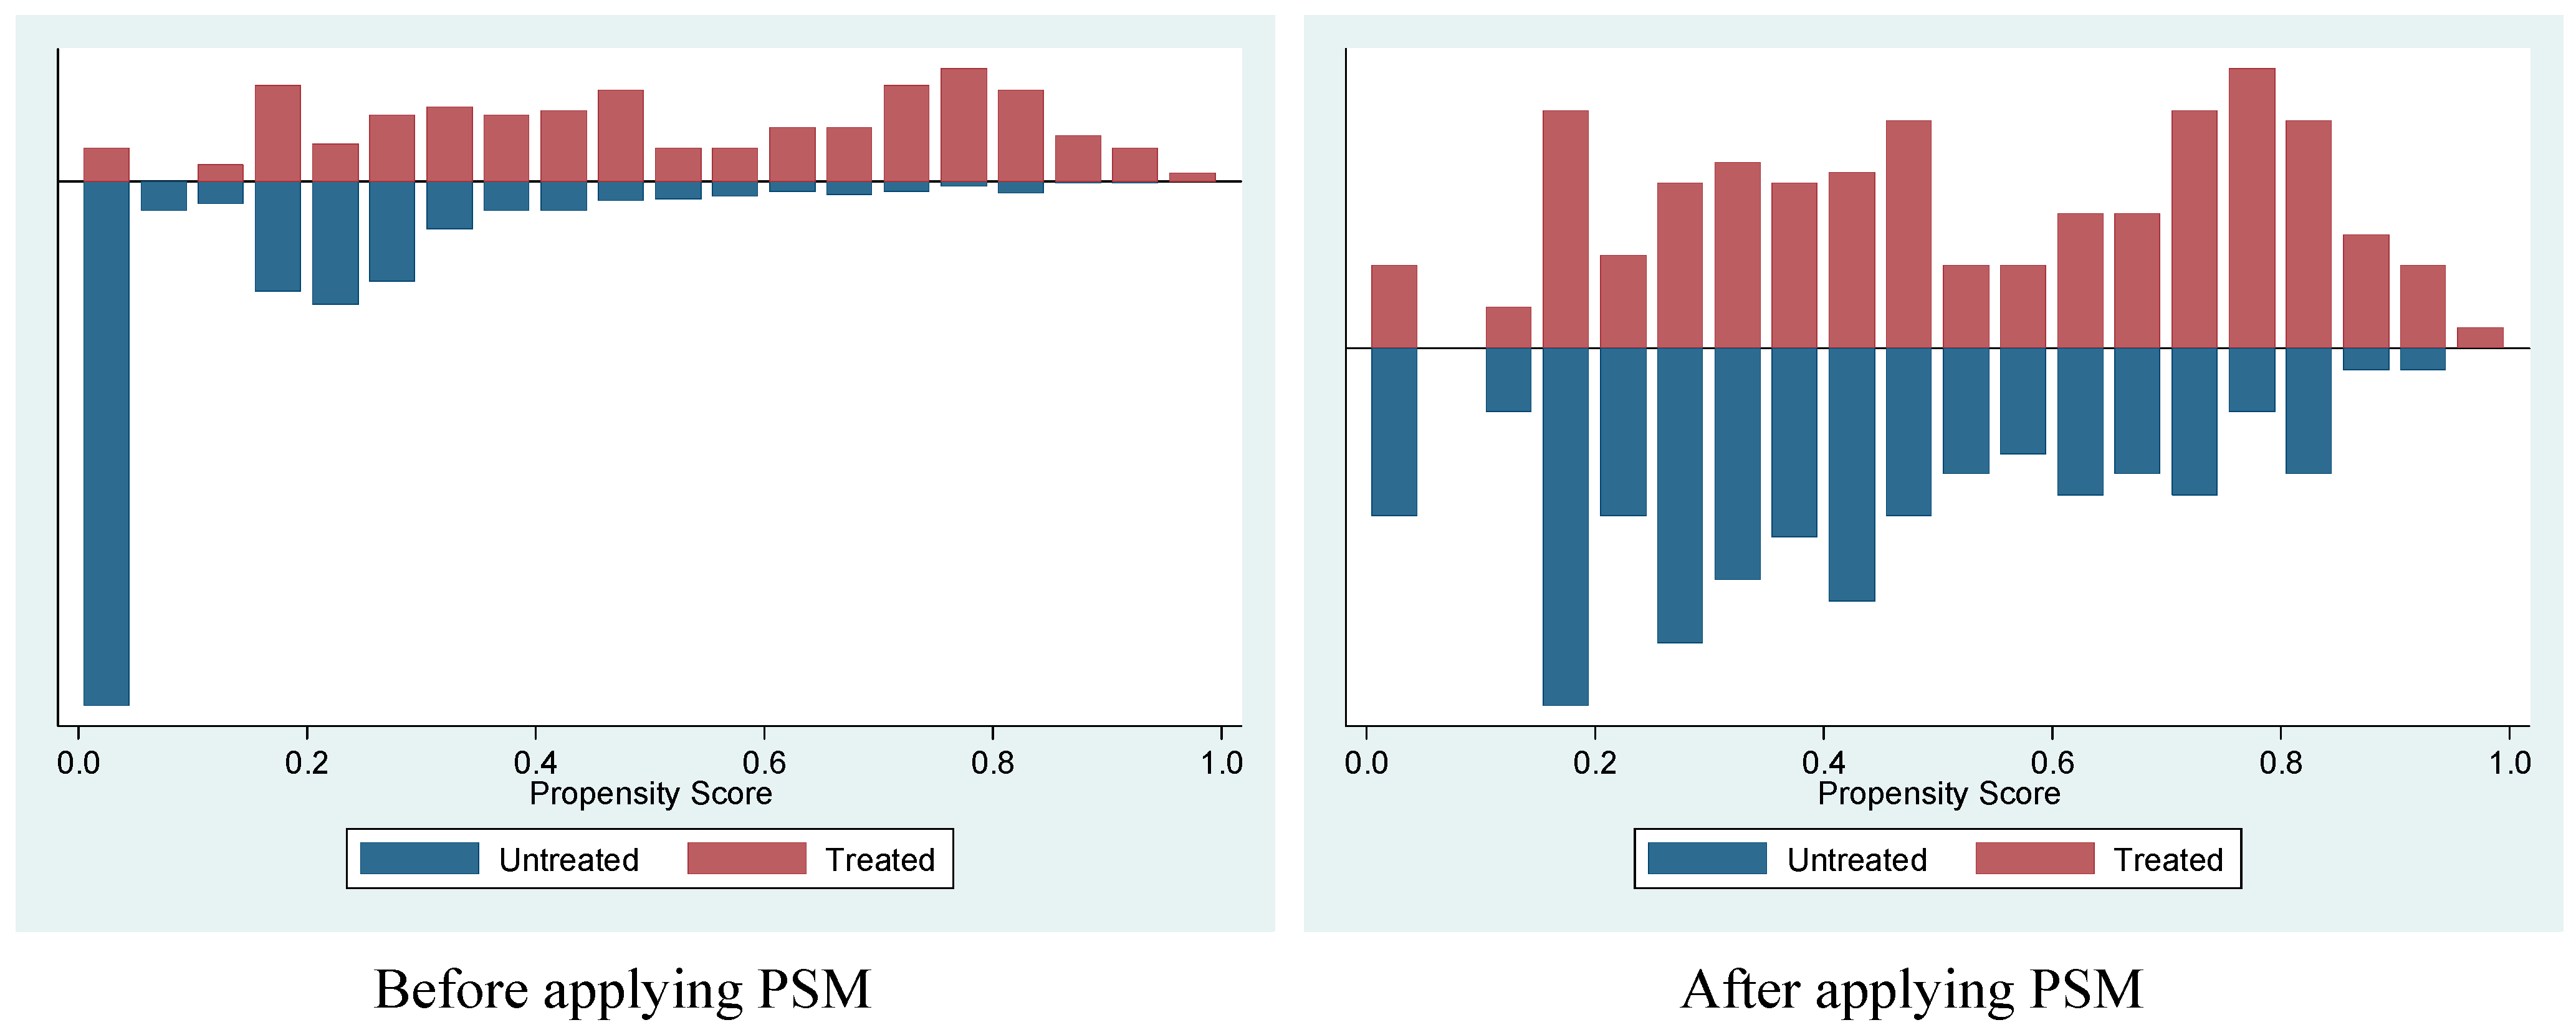
2.2. Propensity Score Matching (PSM) Methodology

In this section, the authors introduce the PSM method that is adopted to measure the effect of labor unions in KMFs. This method can control the selective problem that might under- or over-estimate the effect of the treatment factor [45]. PSM estimators have advanced in the field of labor economics [46,47,48]. Recently, this method has been applied to firm-level literature [49,50,51].
With respect to a non-randomized sample, we consider selection bias. PSM methodology was introduced by Rosenbaum and Rubin [52] to resolve selection bias. PSM’s advantage lies in the identification of matching pairs that have a relatively small difference in propensity score. The score is calculated using a number of characteristics or variables that should be rigorously identical with the treatment subject (such as labor unions in the case of this study) [53]. Thus, we consider only one score instead of considering many characteristics individually to take into account many background variables, simultaneously, using PSM.
The PSM must support the conditional independence assumption (CIA). CIA can be expressed by the following equation:
( Y 0 , Y 1 )   z | x ,    0 < p r ( z = 1 | x ) < 1
where ⊥ denotes independence, Y1 represents the outcome of the unionized firm, and Y0 denotes the outcome of the non-unionized firm. z is an indicator variable that represents the treatment assignment of a union. This study creates groups of similar union and non-union firms based on the propensity score calculated by the probit model [52]. The propensity score represents the conditional probability of unionization given the covariates, which is related to the observable background variables. This is represented by an equation as follows (z: if there is a union; if not, then z is 0/X: background variables).
p ( x ) = Pr (z = 1 |X = x )
A group of non-unionized firms, which corresponds to the group of unionized firms is composed of companies with many similarities. For this, we use different matching measures [48,54,55]. This paper uses 1:1 nearest neighbor matching among the matching measures. Nearest neighbor matching is used to match firms that have a labor union with a firm that has the nearest propensity score. Therefore, some firms have more than one match to reduce bias and increase the average quality of matching. The number of distinct non-participants used to construct the counterfactual outcome is restricted by allowing replacement. Then, the variance of the estimator can be increased [54].

2.3. Labor Unions and Firm R&D

The difference in productivity between union and non-union firms is determined by a labor union’s effect on the firm’s turnover, training, work rules, labor-management communication, worker morale, and management behavior [56]. This is not an exception for firm R&D. While scholars have studied the relationship between labor unions and firm R&D, studies investigating how labor unions may affect R&D productivity are scarce. We suggest trends from previous studies’ findings.
First, a large body of literature has investigated labor union effects on R&D investments [16,18,56,57,58,59,60,61,62,63]. Almost all of the existing research indicates that labor unions have a negative effect on R&D investment. The results are based on a union rent-seeking tendency. The tendency refers to desire by labor unions to retain quasi-rents of the return generated from long-term R&D and capital investment. In compliance with the tendency, firms decrease their investment in intangible and tangible assets [64]. Only a few researchers have found that labor unions have a positive effect in low-tech industry firm’s R&D, or a negative effect in high-tech industry firm’s R&D. Second, Machin and Wadhwani [65] and Daniel [66] researched labor unions and their effect on technology acceptance. These studies suggest that labor unions have a positive effect on worker acceptance of advanced technology. Third, some scholars have analyzed the relationship between labor unions and technology innovation activity [67,68,69]. These papers found that unionism has a positive effect on product innovation-related activities. Finally, other papers have investigated the labor union effect on R&D outputs [17,70,71,72]. While many studies revealed that unionism has a negative effect on firm R&D outputs, a few sources from literature found that when union density and bargaining power for wages are appropriate, labor unions have a positive effect.

3. Model and Data Sources
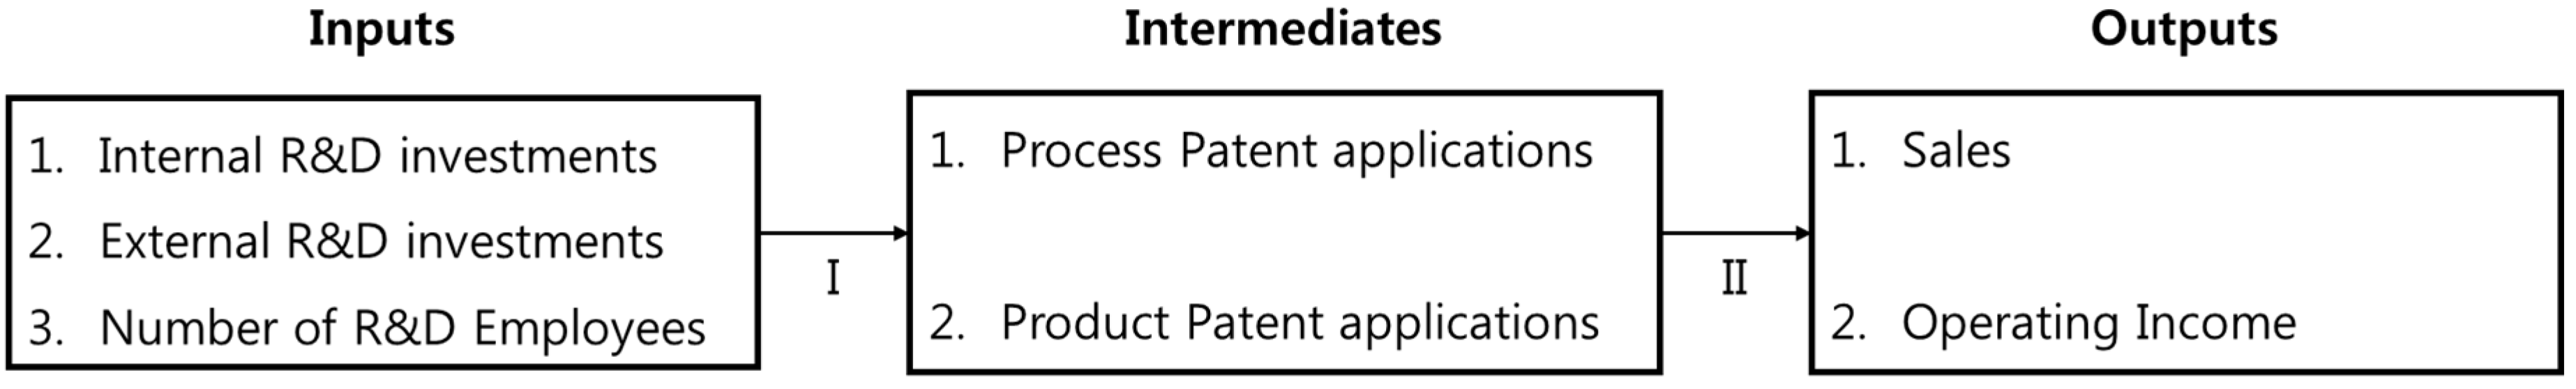
3.1. Model

To measure KMF’s R&D productivity, we label innovation as the first stage and commercialization as the second stage. This study uses a two-stage DEA model that is comprised of inputs, intermediates, and outputs. Innovation efficiency is calculated by considering internal R&D investments, external R&D investments, and the number of R&D employees required to produce process and product patent applications. These intermediates represent outputs of the innovation stage and inputs of the commercialization stage, concurrently. Sales and operating income represent outputs of the commercialization stage. Figure 1 presents the research model. This approach comprehensively considers firms’ financial performance, which is composed of revenue and profit. This study used DEA Frontier software through a Microsoft Excel add-in to measure R&D productivity.
Figure 1. Two-stage data envelopment analysis model for measuring R&D productivity.
Sustainability 07 05120 g001
The following equation shows the two-stage DEA model as the basis for our research investigating R&D productivity. In the first stage, xi (i = 1, …, m) are inputs and zd (d = 1, …, D) are outputs. In the second stage, zd are inputs and yr (r = 1, …, s) are outputs. We recognize that zd are intermediates.
Min α , β , λ j , μ j , z ˜ w 1 α w 2 β
subject to
( stage 1 ) ( stage 2 )
j = 1 n λ j x i j     α x i j 0            i = 1 ,   .   .   .   ,   m j = 1 n μ j z d j     z ˜ d j 0             d = 1 ,   .   .   .   ,   D
j = 1 n λ j z d j   z ˜ d j 0               d = 1 ,   .   .   . ,   D j = 1 n μ j y r j    β y r j 0           r = 1 ,   .   .   . ,   s
j = 1 n λ j = 1 j = 1 n μ j = 1
λ j 0 ,     j = 1 ,   .   .   .   ,   n μ j 0 ,     j = 1 ,   .   .   .   ,   n
α 1 β 1

3.2. Data

This research uses the “2010 Korean Innovation Survey (KIS): Manufacturing industry”. Most of the KIS data questionnaires were followed up by the OECD Oslo Manual and Community Innovation Survey (CIS) data. Particularly, the CIS data is collected quadrennially at the firm level in all EU member nations and several non-EU countries. The KIS data were collected by the Science and Technology Policy Institute (STEPI), which is a Korean government-funded research institute. Additionally, KIS data is approved and certified by Statistics Korea (the Korean central government organization for statistics). KIS data are, therefore, appropriate for empirical research investigations at the firm level. Recently, Woo et al. [1] used the KIS data for firm-level empirical research investigating green innovation and firms’ labor productivity.
We analyzed the relative efficiency score of each KMF using KIS data through a two-stage DEA model. Additionally, we investigated KMFs R&D productivity by classifying labor unions for comparative analysis. Labor unions are categorized as unionized or non-unionized. For this study, we considered the R&D time lag effect from inputs to outputs when calculating R&D productivity. Many previous studies have considered R&D time lag when measuring productivity. With respect to time lag duration, there is no adequate method of selecting an appropriate duration in years from R&D inputs to R&D outputs [28]. This paper assumes two years as an R&D time lag from inputs to outputs including intermediates. As suggested in the literature review, R&D is a process of inputs to outputs. Therefore, the average method is more appropriate than the lagged method for time lag duration. Lee and Park [73] and Chiu, Huang, and Chen [43] used the average method for considering R&D time lag. We use the average from 2007 to 2009 on input variables. For all intermediate variables, we use the sum from 2007 to 2009. Lastly, we use 2009 data for output variables. Table 1 presents a summary description of each variable.
Table 1. Description of each variable for measuring productivity using a two-stage data envelopment analysis (DEA) model.
VariableDescriptionUnit of MeasurementVariable Used in the AnalysisPrevious Studies
InputsInternal R&D expenditureKorean won (million)Average of 2007–2009[25,70,71]
External R&D expenditure
R&D employeesNumber
IntermediatesProcess innovation patent applicationsNumberSum of 2007–2009[25,70,71]
Product innovation patent applications
OutputsSalesKorean won (million)2009[71]
Operating income
Labor unionUnionized, non-unionizedNominal scale2009[57,72]
Educational level, industry, firm size, firm age, and the location of the company are considered observable background variables to calculate the propensity score. These variables are also related to R&D performance. Highly educated researchers can rapidly adapt in response to external change [74], thus contributing to superior R&D performance. Firm size and firm R&D performance have a relationship. A firm’s size and industry affects company composition of R&D activities [75]. Immature firms may experience unsuccessful R&D performance from a lack of experience [76]. Mature firms have greater management experience that includes accumulated technological knowledge. This knowledge provides advantages for technology innovation [77]. A firm’s location may capture internal and external knowledge that impacts R&D performance [78]. Observable variables for PSM partially control firm R&D, simultaneously.
Among variables, industry is classified as high-tech and low-tech. Four types of industry were suggested by OECD [79]: high-tech, medium-high-tech, medium-low-tech, and low-tech based on the International Standard Industry Classification (ISIC) Revision 3. The KIS data followed the Korean Standard Industry Classification (KSIC) code for industry classifications. Therefore, this paper matches industry classification KIS data and OECD [79] standards. We set our data as high-tech and low-tech industry consistent with [80]. PSM implicitly assumes that the matching twin firms do not differ in terms of observable variables. The all-inclusive list of attributes must be included to approximate the propensity score because the matching models do not necessitate exclusion restrictions [81]. We estimate the propensity score for firms that have a union, including variables that will affect an outcome. We then match, with replacement, a union firm with a non-union firm that has the closest predicted value. A pseudo random sample can be selected through this procedure for which the union type is randomly allocated [82]. Table 2 summarizes background variable information for PSM.
Table 2. Description of background variables for the propensity score matching.
VariableDescriptionUnit of MeasurementPrevious Studies
Educational levelRatio of highly educated employees (Master’s degree or higher employees/total employees)Percentage[80,81,82,83,84]
IndustryHigh-tech or low-techNominal scale[82,81,82,83,84]
Firm sizeBig, medium, and smallOrdinal scale[80,81,82,83,84]
Firm agePresent year—established yearNumber[84,85,86]
Company locationUrban or ruralNominal scale[82,83,84]
The number of samples in the KIS data is 3925. Among the samples, there are 1587 missing sample cases for internal and external R&D expenditures, and 32 samples cases are missing for R&D employees, sales, and operating income. A total of 222 samples cases are excluded because of product and process innovation patent variables. Finally, this study uses 997 firms for the two-stage analysis.
We run probit regression to estimate propensity score with background variables. A sufficient set of background variables is required to satisfy CIA because the assumption only eliminates bias depending on observed variables because of the characteristics of PSM. Each variable was identified because it affects labor union and R&D efficiency. Table 3 shows the results of the analysis. Firm size and firm age affect unionization status in Korean manufacturing firms, positively. With respect to firm size, the larger the firm, the more firm size affects unionization. The result of the balancing test (Table 4) shows that overall bias is reduced. Particularly, over 90% of bias was reduced for firm size and firm age. We attain valid matching results, which implies that the two-stage DEA results are not influenced by PSM. Among the samples, 132 non-unionized firms were matched with 268 unionized firms by applying PSM.
Table 3. Propensity score matching (PSM): Probit regression.
Background VariablesCoeff.p-Value
Educational level−0.00042650.954
Industry−0.11103350.282
Firm size 1 (large)2.0337720.000 ***
Firm size 2 (medium)1.2103340.000 ***
Firm age 0.02781710.000 ***
Firm location−0.10730230.306
Constant−2.2627710.000 ***
Number of observations997
Pseudo R20.3239
Note: Levels of statistical significance: *** = 1%, ** = 5%, and * = 10%.
Table 4. Results of balancing test.
VariableUnmatchedMean%Bias%Reduct |bias|t-Test
MatchedTreatedControltp > |t|
IndustryU0.511190.52538−2.8 −0.400.691
M0.511190.462699.7−242.01.120.262
Firm locationU0.462690.47051−1.6 −0.220.827
M0.462690.455221.54.60.170.863
BigU0.492540.07682103.6 16.850.000
M0.492540.488810.999.10.090.931
MediumU0.477610.4279810.0 1.400.162
M0.477610.48134−0.792.5−0.090.931
SmallU0.029850.4952−124.5 −14.910.000
M0.029850.029850.0100.0−0.001.000
Education levelU4.39474.8502−5.8 −0.810.420
M4.39474.12763.441.40.460.643
Firm ageU30.86215.804111.7 17.470.000
M30.86230.8510.199.90.010.994
Change in Mean Bias: 51.4(Raw) → 2.3(Matched); Change in Median Bias: 10.0(Raw) → 0.9(Matched).
Therefore, we use data from 400 firms to investigate R&D productivity using the two-stage DEA model. Table 5 and Figure 2 show results of PSM. Table 6 shows the descriptive statistics for the two-stage DEA-related variables. Some firms show a negative value for operating income. This is contrary to the popular assumption that DEA variables require positive values, unlike other variables. This implies that operating income is not an appropriate measure for DEA. To accommodate this finding, we adjust the operating income value by adding 293,401 to all firms’ operating income to produce at least “1” as a positive value. This method is offered by Iqbal Ali and Seiford [83] and Pastor [84]. This overcomes the negative values, and we include the operating income variable into the two-stage DEA model’s output variable.
Table 5. Weight of matched controls.
FrequencyPercentCumulative Percent
18161.3661.36
22921.9783.33
396.8290.15
410.7690.91
510.7691.67
632.2793.94
721.5295.45
810.7696.21
921.5297.73
1010.7698.48
1110.7699.24
120099.24
130099.24
1410.76100.00
Total132100.00
Figure 2. Histograms of propensity score distribution.
Sustainability 07 05120 g002
Table 6. Descriptive statistics for two-stage DEA related variables.
N = 400Min.Max.MeanStd. Dev.
Internal R&D investment2860,76912,240.4359,256.52
External R&D investment0198,6391560.2410,552.71
R&D employees0123342.1698.03
Product innovation patent applications09209.7071.50
Process innovation patent applications0472344.07286.55
Sales71015,759,742388,407.621,225,270.89
Operating income−293,4002,233,17426,352.59136,248.27

4. Empirical Results

4.1. Productivity Analysis

Table 7 shows the results of KMFs’ relative innovation and commercialization productivity. We find that the mean of KMFs’ innovation productivity is relatively low. Moreover, the standard deviation of the innovation stage is higher than the standard deviation for the commercialization stage. There is a small capability gap among KMFs in terms of commercialization compared to innovation.
Table 7. Innovation and commercialization productivity of Korean manufacturing firms.
N = 400Innovation Efficiency ScoreCommercialization Efficiency Score
Mean0.20870.4484
Std. Dev.0.282730.10058
Min.0.000.07
Max.1.001.00
Table 8 shows the results of the Wilcoxon matched-pairs signed-rank test. The results demonstrate the difference between innovation and commercialization with respect to the productivity rank of KMFs. This analysis is based on the relative efficiency score and each firm’s individual efficiency score ranking. We ranked the scores in descending order. Table 8 implies that KMF innovation and commercialization productivity are consistent across firm R&D. This result shows that KMFs are balanced through the R&D process, which consists of innovation and commercialization. Although the stages are not different based on statistical significance, we conclude that practitioners and scholars should recognize both stages of efficiency to improve R&D productivity.
Table 8. Wilcoxon matched-pairs signed-rank test.
Total N = 400NMean Rank
Rank of commercialization productivity (1) – Rank of innovation productivity (2)(1) − (2) < 0212194.01
(1) − (2) > 0188207.81
(1) − (2) = 03-
Z = −0.446, p = 0.656.

4.2. Comparative Analysis

The DEA scores’ statistical validity does not employ parametric analysis methods [85]. Therefore, the DEA score is not appropriate for applying parametric statistical methods under a comparative analysis. This research applied the Mann-Whitney U test to conduct an in-depth analysis on the R&D productivity of KMFs. We investigate the differences in efficiency by labor unions using the Mann-Whitney U test. Table 9 shows the results. The difference in R&D efficiency between these two groups reflects the treatment effect of union firm (ATT) and not pre-existing firm characteristics. The innovation and commercialization stages have slightly opposite directions. In the innovation stage, non-unionized firms have higher productivity than unionized firms without statistical significance. However, unionized firms have higher productivity than non-unionized firms in the commercialization stage with statistical significance.
Table 9. Results of the Mann-Whitney U test by labor union.
Total N = 400Labor UnionNMean RankSum of Rank
Innovation stageUnionized268207.1255509.00
Non-unionized132187.0524691.00
Commercialization stageUnionized268193.7851932.00
Non-unionized132214.1528268.00
Innovation productivity: Mann-Whitney’s U = 15913.0, Wilcoxon’s W = 24691.0, Z = −1.633, p = 0.103; Commercialization productivity: Mann-Whitney’s U = 15886.0, Wilcoxon’s W = 51932.0, Z = −1.657, p = 0.097 *. Levels of statistical significance: *** = 1%, ** = 5%, and * = 10%.

5. Conclusions

5.1. Summary

In previous studies, the measurement of R&D productivity considering labor unions and industry technology levels had two limitations. The first limitation was that the R&D process was not incorporated into the DEA model. Therefore, the majority of studies use a traditional one-stage DEA model. In contrast, this study recognizes the R&D process by using a two-stage DEA model, thereby strengthening the measurement of firm R&D activities. The second limitation of previous studies is the lack of research showing the relationship between labor unions and firm R&D productivity. Existing studies have focused on the effectiveness of using R&D investment, innovation activity, and patents. Many studies, however, suggest that productivity is also a significant factor concerning firm R&D. This research area provides valuable insights for policy makers and firm decision makers.
In response to the limitations of previous studies, this paper measures R&D productivity of 536 KMFs using a two-stage DEA model, separating the R&D process into the innovation stage and the commercialization stage. R&D productivity was extracted from the DEA calculations to conduct a comparative analysis after categorizing the data according to labor union status. For a more accurate comparative analysis considering selection bias, we adopt PSM for the DEA. This is the first study to do so in DEA-related studies. This procedure revealed the differences in firm R&D productivity across subgroups. We present the key findings.
First, there is no statistically significant difference in productivity among KMFs in both the innovation and commercialization stages. As indicated in Table 8, if the firms with an outstanding innovation capability are strong in terms of commercialization capability, this indicates a balance in productivity between innovation and commercialization processes. Second, there is a statistically significant difference in productivity contingent on labor unions. As indicated in Table 9, whereas unionized firms show outstanding performance in the commercialization stage, there are no statistical differences between non-unionized and unionized firms in the innovation stage. This shows that labor unions have an effect on commercialization directly, and R&D processes as a whole indirectly. Our empirical results do not support previous studies’ findings that labor union can decrease commercialization productivity. With respect to commercialization productivity that is determined by patents and financial performance, the results are consistent with published studies. Among US firms, a negative relationship between labor unions and financial performance is revealed by previous studies [64,86,87]. Additionally, Machin and Stewart [88] and Menezes-Filho and Aquino [89] found that UK firms show similar tendencies. These previous studies were mainly conducted in the US and developed in a western nation context. However, Morikawa [8] claimed the existence of differences in the relationship between labor unions and firm productivity. This paper suggests that although the previous studies in the US context found a negative effect on firm productivity, there is a positive relationship between labor unions and firm productivity in Japan. This recent result implies that the relationship between labor unions and firm productivity can differ by nation. Our empirical results also suggest differences between contexts by reconfirming Morikawa [8].

5.2. Implications and Limitations

The present study determined the effects of labor unions on innovation and commercialization productivity. Our findings suggest practical courses of action for manufacturing firm’s decision makers with respect to R&D. KMFs’ R&D productivity is balanced between the innovation and commercialization stages with relatively low innovation productivity. Moreover, productivity is affected by labor unions in the commercialization stage with statistical significance. A firm’s R&D involves a process of innovation and commercialization. Therefore, a firm’s decision makers should recognize the concept of both innovation and commercialization stages to improve productivity.
The relationship between a firm’s labor union and productivity has long been considered important [8]. From an overall firm productivity perspective, there are two main views that are both orthodox and alternative. The orthodox view shows the negative relationship between labor unions and productivity, whereas the alternative view shows a positive relationship [90]. Interestingly, this paper suggests the alternative view with respect to R&D productivity. Moreover, only commercialization productivity is affected by labor unions. According to Dutta and Lanvin [91], Korea was ranked 39th in a knowledge impact index that includes commercialization and standardization. With respect to Korea’s low commercialization capability, this research suggests valuable insight into the role of labor unions and their ability to increase commercialization productivity in the Korean context. To investigate the effect of labor unions on R&D productivity more accurately than previous studies, we employed PSM methodology to solve a selection bias problem with DEA. Traditional comparative analysis based on DEA score is not free of selection bias. This study suggests an appropriate solution by introducing a combination of PSM-DEA. This study represents a pioneering challenge that is academically valuable. A limited number of papers research firm R&D productivity considering influencing factors. Our empirical results provide superior insights into R&D productivity compared to previous studies.
Additionally, the current findings enhance our understanding of Asian developing nation’s firm characteristics. The results of previous studies’ empirical analyses were not consistent because of the composition of the research samples [92]. Scholars emphasized developed countries such as the US and European countries. There is a lack of empirical research based on developing countries. However, recognition of the significance of labor union and productivity-related research in developing countries has been increasing according to economic growth. Our research serves as a basis for decision making with respect to labor union-related policies of developing nations.
The findings in this paper are subject to four limitations. First, this study set two years as the time lag from R&D inputs to R&D outcomes. Although we explained that there is no appropriate time lag duration in Section 3.2, it may take two years or several years for R&D outcomes to be achieved. The results of future studies can be enriched by extending the time lag. Second, this paper does not consider a strategy of secrecy. We assume that R&D outcomes are achieved through patents. However, some firms do not generate patents to protect their innovation output. Secrecy can be more effective than patent generation in earning profits from innovation [93]. Three, we attempt to focus on the internal features of firm R&D processes. Although innovation (i.e., patents) and financial performance (i.e., sales and operating income) may be affected by numerous external factors, we admit the limitation of DEA in its weakness in accounting for external factors. A future study that reduces the limitations would be insightful. Lastly, this study used cross-sectional data to consider unionization only. Additionally, we set a number of patents as innovation outputs that may have skewness. Moreover, sufficient control was applied to the major attributes following the precedent study, although this is difficult to confirm because all attributes are influential. In reality, measurable variables are limited. If these data problems are overcome in future research, the implications will be more insightful.

Author Contributions

Dongphil Chun mainly contributed to perform this research through research design, data collection, and writing this paper. Yanghon Chung suggested labor union as an influence factor and introduced the PSM method. Chungwon Woo participated in the integration of PSM and DEA. Hangyeol Seo supported data collection, data analysis, and writing this paper. Hyesoo Ko contributed the integration of PSM, DEA, and the follow-up tests such as the balancing test. All authors have read and approved this manuscript.

Conflicts of Interest

The authors declare no conflict of interest.

References

  1. Woo, C.; Chung, Y.; Chun, D.; Han, S.; Lee, D. Impact of green innovation on labor productivity and its determinants: An analysis of the Korean manufacturing industry. Bus. Strateg. Environ. 2013. [Google Scholar] [CrossRef]
  2. BOK. Economic Statistics Systems; Bank of Korea: Seoul, Korea, 2013. [Google Scholar]
  3. Bae, J.; Rowley, C. The impact of globalization on HRM: The case of South Korea. J. World Bus. 2002, 36, 402–428. [Google Scholar] [CrossRef]
  4. Kim, D.O.; Kim, S. Globalization, financial crisis, and industrial relations: The case of South Korea. Ind. Relat. 2003, 42, 341–367. [Google Scholar] [CrossRef]
  5. Song, J. The diverging political pathways of labor market reform in Japan and Korea. J. East Asian Stud. 2012, 12, 161–191. [Google Scholar]
  6. Bryson, A.; Cappellari, L.; Lucifora, C. Does union membership really reduce job satisfaction? Br. J. Ind. Relat. 2004, 42, 439–459. [Google Scholar] [CrossRef]
  7. MOEL. 2012 Employement and Labor Policy in Korea; Ministry of Employment and Labor, Republic of Korea: Sejong City, Korea, 2012.
  8. Morikawa, M. Labor unions and productivity: An empirical analysis using japanese firm-level data. Labour Econ. 2010, 17, 1030–1037. [Google Scholar] [CrossRef]
  9. Porter, M.E. Competitive Advantage: Creating and Sustaining Superior Performance; Free Press: New York, NY, USA, 1985. [Google Scholar]
  10. Lin, F.-J. Innovation and firm performance: An application of determinants in Taiwan. Int. J. Technol. Manag. 2011, 54, 12–28. [Google Scholar] [CrossRef]
  11. Hart, S.L. A natural-resource-based view of the firm. Acad. Manag. Rev. 1995, 20, 986–1014. [Google Scholar]
  12. Zhao, C.; Jie, X.; Gu, X. On the Key Factors for Firms’ Sustainable growth: A Perspective Based on “Industrial Strategic Inflection Point” and Resource-Based View. In Proceedings of the Seventh International Conference on Management Science and Engineering Management; Springer: Berlin, Germany, 2014; pp. 1499–1510. [Google Scholar]
  13. Halt, S.; Milstein, M. Glohal sustainability and the creative destruction of industries. Sloan Manag. Rev. 1999, 41, 23–33. [Google Scholar]
  14. Porter, M.E.; van der Linde, C. Green and competitive: Ending the stalemate. Read. Bus. Rev. 1995, 73, 119–134. [Google Scholar]
  15. Senge, P.M.; Carstedt, G. Innovating our way to the next industrial revolution. MIT Sloan Manag. Rev. 2001, 42, 24–38. [Google Scholar]
  16. Betts, J.R.; Odgers, C.W.; Wilson, M.K. The effects of unions on research and development: An empirical analysis using multi-year data. Can. J. Econ./Revue Can. D'économique 2001, 34, 785–806. [Google Scholar] [CrossRef]
  17. Blundell, R.; Griffith, R.; van Reenen, J. Market share, market value and innovation in a panel of British manufacturing firms. Rev. Econ. Stud. 1999, 66, 529–554. [Google Scholar] [CrossRef]
  18. Connolly, R.A.; Hirsch, B.T.; Hirschey, M. Union rent seeking, intangible capital, and market value of the firm. Rev. Econ. Stat. 1986, 68, 567–577. [Google Scholar] [CrossRef]
  19. Kelm, K.M.; Narayanan, V.; Pinches, G.E. Shareholder value creation during R&D innovation and commercialization stages. Acad. Manag. J. 1995, 38, 770–786. [Google Scholar] [CrossRef]
  20. Lin, L.-C.; Tseng, L.-A. Application of dea and sfa on the Measurement of Operating Efficiencies for 27 International Container Ports. Proc. Eastern Asia Soc. Transp. Stud. 2005, 5, 592–607. [Google Scholar]
  21. Banker, R.D.; Charnes, A.; Cooper, W.W.; Maindiratta, A. A comparison of dea and translog estimates of production frontiers using simulated observations from a known technology. In Applications of Modern Production Theory: Efficiency and Productivity; Springer: Berlin, Germany, 1988; pp. 33–55. [Google Scholar]
  22. Banker, R.D.; Gadh, V.M.; Gorr, W.L. A monte carlo comparison of two production frontier estimation methods: Corrected ordinary least squares and data envelopment analysis. Eur. J. Oper. Res. 1993, 67, 332–343. [Google Scholar] [CrossRef]
  23. Farrell, M.J. The measurement of productive efficiency. J. R. Stat. Soc. 1957, 120, 253–290. [Google Scholar]
  24. Charnes, A.; Cooper, W.W.; Rhodes, E. Measuring the efficiency of decision making units. Eur. J. Oper. Res. 1978, 2, 429–444. [Google Scholar] [CrossRef]
  25. Banker, R.D.; Charnes, A.; Cooper, W.W. Some models for estimating technical and scale inefficiencies in data envelopment analysis. Manag. Sci. 1984, 30, 1078–1092. [Google Scholar] [CrossRef]
  26. Schefczyk, M. Operational performance of airlines: An extension of traditional measurement paradigms. Strateg. Manag. J. 1993, 14, 301–317. [Google Scholar] [CrossRef]
  27. Färe, R.; Grosskopf, S. Productivity and intermediate products: A frontier approach. Econ. Lett. 1996, 50, 65–70. [Google Scholar] [CrossRef]
  28. Wang, E.C.; Huang, W. Relative efficiency of r&d activities: A cross-country study accounting for environmental factors in the DEA approach. Res. Policy 2007, 36, 260–273. [Google Scholar] [CrossRef]
  29. Krajewski, L.J.; Ritzman, L.P. Operation Management: Strategy and Analysis; Addison Wesley Longman Publishing Co.: Upper Saddle River, NJ, USA, 1993. [Google Scholar]
  30. Lin, C.-H.; Yang, H.-L.; Liou, D.-Y. A cross-national comparative analysis of industrial policy and competitive advantage. Int. J. Technol. Manag. 2010, 49, 93–106. [Google Scholar] [CrossRef]
  31. Färe, R.; Grosskopf, S. Network DEA. Socio-Econ. Plan. Sci. 2000, 34, 35–49. [Google Scholar] [CrossRef]
  32. Paradi, J.C.; Rouatt, S.; Zhu, H. Two-stage evaluation of bank branch efficiency using data envelopment analysis. Omega 2011, 39, 99–109. [Google Scholar] [CrossRef]
  33. Yang, Z. A two-stage DEA model to evaluate the overall performance of canadian life and health insurance companies. Math. Comput. Model. 2006, 43, 910–919. [Google Scholar] [CrossRef]
  34. Seiford, L.M.; Zhu, J. Profitability and marketability of the top 55 us commercial banks. Manag. Sci. 1999, 45, 1270–1288. [Google Scholar] [CrossRef]
  35. Chen, Y.; Zhu, J. Measuring information technology's indirect impact on firm performance. Inf. Technol. Manag. 2004, 5, 9–22. [Google Scholar] [CrossRef]
  36. Saranga, H.; Moser, R. Performance evaluation of purchasing and supply management using value chain DEA approach. Eur. J. Oper. Res. 2010, 207, 197–205. [Google Scholar] [CrossRef]
  37. Sexton, T.R.; Lewis, H.F. Two-stage DEA: An application to major league baseball. J. Product. Anal. 2003, 19, 227–249. [Google Scholar] [CrossRef]
  38. Cao, X.; Yang, F. Measuring the performance of internet companies using a two-stage data envelopment analysis model. Enterp. Inf. Syst. 2011, 5, 207–217. [Google Scholar] [CrossRef]
  39. Contractor, F.J.; Narayanan, V. Technology development in the multinational firm: A framework for planning and strategy. R&D Manag. 1990, 20, 305–322. [Google Scholar] [CrossRef]
  40. Freeman, C.; Soete, L. The Economics of Industrial Innovation; The MIT Press: Cambridge, MA, USA, 1997. [Google Scholar]
  41. Guan, J.; Chen, K. Measuring the innovation production process: A cross-region empirical study of China’s high-tech innovations. Technovation 2010, 30, 348–358. [Google Scholar] [CrossRef]
  42. Utterback, J.M.; Abernathy, W.J. A dynamic model of process and product innovation. Omega 1975, 3, 639–656. [Google Scholar] [CrossRef]
  43. Chiu, Y.-H.; Huang, C.-W.; Chen, Y.-C. The R&D value-chain efficiency measurement for high-tech industries in China. Asia Pac. J. Manag. 2012, 29, 989–1006. [Google Scholar] [CrossRef]
  44. Kamien, M.I.; Muller, E.; Zang, I. Research joint ventures and R&D cartels. Am. Econ. Rev. 1992, 82, 1293–1306. [Google Scholar]
  45. Oh, I.; Lee, J.-D.; Heshmati, A.; Choi, G.-G. Evaluation of credit guarantee policy using propensity score matching. Small Bus. Econ. 2009, 33, 335–351. [Google Scholar] [CrossRef]
  46. Dehejia, R.H.; Wahba, S. Propensity score-matching methods for nonexperimental causal studies. Rev. Econ. Stat. 2002, 84, 151–161. [Google Scholar] [CrossRef]
  47. Frölich, M.; Heshmati, A.; Lechner, M. A microeconometric evaluation of rehabilitation of long-term sickness in Sweden. J. Appl. Econ. 2004, 19, 375–396. [Google Scholar] [CrossRef]
  48. Heckman, J.J.; Ichimura, H.; Todd, P.E. Matching as an econometric evaluation estimator: Evidence from evaluating a job training programme. Rev. Econ. Stud. 1997, 64, 605–654. [Google Scholar] [CrossRef]
  49. Arnold, J.M.; Hussinger, K. Export behavior and firm productivity in German manufacturing: A firm-level analysis. Rev. World Econom. 2005, 141, 219–243. [Google Scholar] [CrossRef]
  50. Yasar, M.; Rejesus, R.M. Exporting status and firm performance: Evidence from a matched sample. Econ. Lett. 2005, 88, 397–402. [Google Scholar] [CrossRef]
  51. Lööf, H.; Heshmati, A. The impact of public funds on private R&D investment: New evidence from a firm level innovation study. MTT Discuss. Pap. 2005, 3, 1–26. [Google Scholar]
  52. Rosenbaum, P.R.; Rubin, D.B. The central role of the propensity score in observational studies for causal effects. Biometrika 1983, 70, 41–55. [Google Scholar] [CrossRef]
  53. Engel, D.; Keilbach, M. Firm-level implications of early stage venture capital investment—An empirical investigation. J. Empir. Financ. 2007, 14, 150–167. [Google Scholar] [CrossRef]
  54. Smith, J.A.; Todd, P.E. Does matching overcome lalonde’s critique of nonexperimental estimators? J. Econom. 2005, 125, 305–353. [Google Scholar] [CrossRef]
  55. Abadie, A.; Drukker, D.; Herr, J.L.; Imbens, G.W. Implementing matching estimators for average treatment effects in Stata. Stata J. 2004, 4, 290–311. [Google Scholar]
  56. Allen, S.G. Productivity levels & productivity change under unionism. Ind. Relat.: J. Econ. Soc. 1988, 27, 94–113. [Google Scholar] [CrossRef]
  57. Addison, J.T.; Wagner, J. UK unionism and innovative activity: Some cautionary remarks on the basis of a simple cross-country test. Br. J. Ind. Relat. 1994, 32, 85–98. [Google Scholar] [CrossRef]
  58. Bronars, S.G.; Deere, D.R. Unionization, incomplete contracting, and capital investment. J. Bus. 1993, 66, 117–132. [Google Scholar] [CrossRef]
  59. Bronars, S.G.; Deere, D.R.; Tracy, J.S. The effects of unions on firm behavior: An empirical analysis using firm-level data. Ind. Relat.: J. Econ. Soc. 1994, 33, 426–451. [Google Scholar] [CrossRef]
  60. Hirsch, B.T. Firm investment behavior and collective bargaining strategy. Ind. Relat.: J. Econ. Soc. 1992, 31, 95–121. [Google Scholar] [CrossRef]
  61. Menezes-Filho, N.; Ulph, D.; van Reenen, J. R&D and unionism: Comparative evidence from British companies and establishments. Ind. Labor Relat. Rev. 1998, 52, 45–63. [Google Scholar] [CrossRef]
  62. Schnabel, C.; Wagner, J. Unions and innovative activity in Germany. J. Labor Res. 1992, 13, 393–406. [Google Scholar] [CrossRef]
  63. Ulph, A.; Ulph, D. Labor markets and innovation. J. Jpn. Int. Econ. 1989, 3, 403–423. [Google Scholar] [CrossRef]
  64. Hirsch, B.T. Union coverage and profitability among US firms. Rev. Econ. Stat. 1991, 73, 69–77. [Google Scholar] [CrossRef]
  65. Machin, S.; Wadhwani, S. The effects of unions on investment and innovation: Evidence from WIRS. Econ. J. 1991, 101, 324–330. [Google Scholar] [CrossRef]
  66. Daniel, W.W. Workplace Industrial Relations and Technical Change; Policy Studies Institute: London, UK, 1987. [Google Scholar]
  67. Arvanitis, S. Modes of labor flexibility at firm level: Are there any implications for performance and innovation? Evidence for the Swiss economy. Ind. Corp. Chang. 2005, 14, 993–1016. [Google Scholar] [CrossRef]
  68. Michie, J.; Sheehan, M. Hrm practices, R&D expenditure and innovative investment: Evidence from the UK’S 1990 workplace industrial relations survey (WIRS). Ind. Corp. Chang. 1999, 8, 211–234. [Google Scholar] [CrossRef]
  69. Michie, J.; Sheehan, M. Labour market deregulation,‘flexibility’and innovation. Camb. J. Econ. 2003, 27, 123–143. [Google Scholar] [CrossRef]
  70. Acs, Z.J.; Audretsch, D.B. Innovation in large and small firms: An empirical analysis. Am. Econ. Rev. 1988, 678–690. [Google Scholar]
  71. Geroski, P.A. Innovation, technological opportunity, and market structure. Oxf. Econ. Pap. 1990, 78, 586–602. [Google Scholar]
  72. Hirsch, B.T.; Link, A.N. Labor union effects on innovative activity. J. Labor Res. 1987, 8, 323–332. [Google Scholar] [CrossRef]
  73. Lee, H.Y.; Park, Y.T. An international comparison of R&D efficiency: DEA approach. Asian J. Technol. Innov. 2005, 13, 207–222. [Google Scholar] [CrossRef]
  74. Zhou, H.; Dekker, R.; Kleinknecht, A. Flexible labor and innovation performance: Evidence from longitudinal firm-level data. Ind. Corp. Chang. 2011, 20, 941–968. [Google Scholar] [CrossRef]
  75. Mansfield, E. Composition of R&D expenditures: Relationship to size of firm, concentration, and innovative output. Rev. Econ. Stat. 1981, 63, 610–615. [Google Scholar] [CrossRef]
  76. Van der Panne, G.; van Beers, C.; Kleinknecht, A. Success and failure of innovation: A literature review. Int. J. Innov. Manag. 2003, 7, 309–338. [Google Scholar] [CrossRef]
  77. Tidd, J.; Pavitt, K.; Bessant, J. Managing Innovation; Wiley: Chichester, UK, 2001; Volume 3. [Google Scholar]
  78. Deeds, D.L.; Decarolis, D.M. The impact of stocks and flows of organizational knowledge on firm performance: An empirical investigation of the biotechnology industry. Strateg. Manag. J. 1999, 20, 953–968. [Google Scholar] [CrossRef]
  79. OECD. Oecd Science, Technology and Industry Scoreboard 2009; OECD Publishing: Paris, France, 2009. [Google Scholar]
  80. Czarnitzki, D.; Thorwarth, S. Productivity effects of basic research in low-tech and high-tech industries. Res. Policy 2012, 41, 1555–1564. [Google Scholar] [CrossRef]
  81. Li, K.; Prabhala, N.R. Self-selection models in corporate finance. Robert H. Smith Sch. Bus. Res. Pap. Ser. 2005, 1, 6–20. [Google Scholar]
  82. Heckman, J.; Navarro-Lozano, S. Using matching, instrumental variables, and control functions to estimate economic choice models. Rev. Econ. Stat. 2004, 86, 30–57. [Google Scholar] [CrossRef]
  83. Iqbal Ali, A.; Seiford, L.M. Translation invariance in data envelopment analysis. Oper. Res. Lett. 1990, 9, 403–405. [Google Scholar] [CrossRef]
  84. Pastor, J.T. Translation invariance in data envelopment analysis: A generalization. Ann. Oper. Res. 1996, 66, 91–102. [Google Scholar] [CrossRef]
  85. Lee, H.; Park, Y.; Choi, H. Comparative evaluation of performance of national R&D programs with heterogeneous objectives: A DEA approach. Eur. J. Oper. Res. 2009, 196, 847–855. [Google Scholar] [CrossRef]
  86. Clark, K.B. Unionization and Firm Performance: The Impact on Profits, Growth and Productivity; National Bureau of Economic Research Cambridge: Cambridge, MA, USA, 1982. [Google Scholar]
  87. Voos, P.B.; Mishel, L.R. The union impact on profits: Evidence from industry price-cost margin data. J. Labor Econ. 1986, 4, 105–133. [Google Scholar] [CrossRef]
  88. Machin, S.; Stewart, M. Trade unions and financial performance. Oxf. Econ. Pap. 1996, 48, 213–241. [Google Scholar] [CrossRef]
  89. Menezes-Filho, N.A. Unions and profitability over the 1980s: Some evidence on union-firm bargaining in the United Kingdon. Econ. J. 1997, 107, 651–670. [Google Scholar] [CrossRef]
  90. Singh, G.; Cowell, N. What do Unions do? Unionization, Work Innovations, and Firm Performance in Jamaica. In Industrial Relations Research Association Series, Proceedings of the 55th Annual Meeting, San Diego, CA, USA, 3–5 January 2004; p. 170.
  91. Cornell University; INSEAD; WIPO. The Global Innovation Index 2013: The Local Dynamics of Innovation. Avaliable online: http://www.wipo.int/edocs/pubdocs/en/economics/gii/gii_2013.pdf (accessed on 23 April 2015).
  92. Menezes-Filho, N.; van Reenen, J. Unions and innovation: A survey of the theory and empirical evidence. In International Handbook of Trade Unions; Edward Elgar Publishing: Cheltenham, UK, 2003. [Google Scholar]
  93. Harabi, N. Appropriability of technical innovations an empirical analysis. Res. Policy 1995, 24, 981–992. [Google Scholar] [CrossRef] [Green Version]

