Article

Decomposition Analysis of the Factors that Influence Energy Related Air Pollutant Emission Changes in China Using the SDA Method

1
Management School, China University of Mining and Technology, Xuzhou 221116, China
2
Joint Institute for Regional Earth System Science and Engineering, Department of Atmospheric and Oceanic Sciences, University of California, Los Angeles, CA 90095, USA
3
State Key Joint Laboratory of Environmental Simulation and Pollution Control, School of Environment, Tsinghua University, Beijing 100084, China
4
Energy Center, University of Auckland, OGGB 6th Floor, 12 Grafton Road, Auckland 1010, New Zealand
*
Author to whom correspondence should be addressed.
Sustainability 2017, 9(10), 1742; https://doi.org/10.3390/su9101742
Submission received: 15 July 2017 / Revised: 25 August 2017 / Accepted: 24 September 2017 / Published: 27 September 2017

Abstract

:
We decompose factors affecting China’s energy-related air pollutant (NOx, PM2.5, and SO2) emission changes into different effects using structural decomposition analysis (SDA). We find that, from 2005 to 2012, investment increased NOx, PM2.5, and SO2 emissions by 14.04, 7.82 and 15.59 Mt respectively, and consumption increased these emissions by 11.09, 7.98, and 12.09 Mt respectively. Export and import slightly increased the emissions on the whole, but the rate of the increase has slowed down, possibly reflecting the shift in China’s foreign trade structure. Energy intensity largely reduced NOx, PM2.5, and SO2 emissions by 12.49, 14.33 and 23.06 Mt respectively, followed by emission efficiency that reduces these emissions by 4.57, 9.08, and 17.25 Mt respectively. Input-output efficiency slightly reduces the emissions. At sectoral and sub-sectoral levels, consumption is a great driving factor in agriculture and commerce, whereas investment is a great driving factor in transport, construction, and some industrial subsectors such as iron and steel, nonferrous metals, building materials, coking, and power and heating supply. Energy intensity increases emissions in transport, chemical products and manufacturing, but decreases emissions in all other sectors and subsectors. Some policies arising from our study results are discussed.

1. Introduction

Air pollution not only has a negative impact on economic development, but also harms human health [1], so air pollution has attracted more and more attention worldwide. Recently, China’s air pollution has become increasingly serious, and heavy haze events occur frequently in more than 25% of the land area of China, which seriously affects the health, work and normal life of more than 600 million people [2]. Public voices for controlling haze and reducing air pollutants have been running high. According to a recent survey, there are more than one hundred days of heavy haze in China’s Yangtze River Delta, Pearl River Delta, and Beijing-Tianjin-Hebei region every year. Nowadays, most primary schools in the Beijing-Tianjin-Hebei region are often closed in order to avoid the harm of haze for children. Flight delay or cancellation, highway closure, and motor vehicle congestion often happen in these severe haze regions. In 2005, the economic costs of suspended particulates and ozone in China were estimated to be US$112 billion, which was about 5% of the country’s gross domestic product (GDP) [3]. A recent study stated that air pollution could impose annual economic costs in China equivalent to as much as 1.2% of GDP, based on cost-of-illness valuation and 3.8% of GDP based on willingness to pay [4]. Since the air pollutants can affect many aspects of a society, it is very urgent that China take countermeasures to reduce air pollutant emissions. Although some measures were taken to reduce air pollutants during the periods of the 2014 Asia-Pacific Economic Cooperation (APEC) meeting and 2016 military parade, such as private car restrictions and the closure of high emission factories in Beijing and surrounding cities, and the implementation of these measures achieved “APEC blue” and “parade blue” effects in a short term, the costs of these measures were huge, and the relative policy lacked continuity. Thus, a long-term treatment plan is needed. In this regard, China has released a series of legal documents, such as “Action Plan for Air Pollution Prevention and Control”, in which the government commits to reduce the PM10 (particulate matter with diameter not greater than than 10 um) and PM2.5 (particulate matter with diameter not greater than than 2.5 μm) concentrations for the Beijing–Tianjin–Hebei region, Yangtze River Delta, and Pearl River Delta [2,5]. Due to the close relationship between air pollutants and economic development, if improper handling happens, countermeasures to deal with air pollutants may have a negative impact on economic development especially in the short term. Thus, how to coordinate the conflicts between economic development and air pollutant reduction is an important issue. As we know, the haze mainly consists of primary PM (particulate matter) and secondary PM produced by complicated chemical reactions of gaseous precursors, such as SO2 (sulfur dioxide), NOx (nitrogen oxides) and so on. The main contributing factor of haze is fossil energy consumption, so it is necessary to investigate the factors that influence energy-related air pollutant emission changes. In addition, the contribution of this paper compared with structural decomposition analysis (SDA) studies such as Su and Ang [6] and Wang et al. [5], is that a non-competitive economy-energy-air pollutant emissions input-output table was constructed, and the SDA method was extended to investigate the impacts of the effects on air pollutant emission changes. Therefore, this paper mainly aims to resolve the key driving and inhibitory factors for primary air pollutant (NOx, PM2.5, and SO2) emissions in China during 2005–2012, and put forward policy for the control of these emissions, which is very significant in the aspects of theoretical basis and policy reference for air pollutant emission abatement.
The remainder of this paper is organized as follows. Section 2 reviews the current literature. Section 3 presents the methodology and describes the data. In Section 4, we present our empirical analysis. Section 5 discusses the main results, while Section 6 gives our conclusions and policy implications.

2. Literature Review

Recent studies have included the analyses of air pollutant emission trends and characteristics [7,8,9,10,11,12,13,14], embodied air pollutants [15,16,17,18,19,20,21], impacts of air pollutants on personal health [22,23,24,25,26,27,28,29,30,31,32,33,34,35], and so on. As for the factors influencing air pollutant emissions, some studies investigated the impacts of these factors through the econometric analysis [36,37,38,39,40,41,42,43,44]. These studies mainly explored the relationship between air pollutant emissions and economic development, economic structure, fossil fuel intensity, energy efficiency, residents’ willingness to pay, and so on. Other studies examined these factors through simulation analysis [45,46]. These studies mainly investigated the future air pollutant variations under different scenarios, such as the development of electric vehicles, the use of cleaning agent, an electric air freshener, an ethanol fireplace, and so on. In recent times, decomposition methods are widely used to conduct an empirical analysis of the factors that influence emissions, which can be currently divided into the index decomposition analysis (IDA) and SDA [47]. Many previous studies used the IDA methods to decompose carbon emissions [48,49,50,51,52,53,54]. Besides, the recent methodology in multiplicative SDA has been examined, including attribution analysis [55], different forms of studying carbon intensity changes [56], spatial-SDA framework [57], and aggregate embodied intensity framework [58]. For the analysis of air pollutant emissions using the IDA method, Lyu et al. used the same method to decompose the air pollutant emissions (SO2, NOx, and PM2.5) into emission efficiency, energy intensity, industrial structure and population effects, and examined the driving forces of these emissions [59].
Su and Ang made a comparative analysis and pointed out the differences between the SDA and IDA methods [58]. The IDA method generally uses time series data to decompose emissions into different effects, whereas the SDA method mainly uses input-output data to decompose the factors affecting emissions. Compared with the IDA method, the SDA method can capture the direct and indirect effects along the supply chain and distinguish the effects of the production process and final consumption, so this method can decompose emissions into rather more effects. In this regard, it is a better option for using the SDA method to determine and investigate the impact of different factors on emissions. Mukhopadhya was the first to use the SDA method to analyze the factors influencing air pollutant emissions, and categorize the sources of changes in SO2 and NOx emissions into four factors (the emission coefficients, structure of production, structure of demand, and volume of demand), finding that the dominant role is played by the structure of demand and the volume of demand [60]. In recent studies, Zhang et al. analyzed drivers of fossil fuel use and air pollutant emissions in Beijing during 1997–2010 from both bottom-up and top-down perspectives, based on the SDA method, and the results showed that the key energy-intensive industrial sectors directly caused the variations in Beijing’s air pollution, and population growth was the largest driver of energy consumption and air pollutant emissions [61]. Zhang et al. applied the SDA method to decompose the changes of industrial pollutant emissions into the effects of end-of-pipe abatement efficiency, pollutant generation intensity, production structure, final demand structure, final demand composition, and total final demand, and evaluated the feasibility of the reduction target in China’s 12th Five-Year Plan period [62]. Liu and Wang applied the SDA method to decompose the factors on the changes of industrial SO2 emissions and chemical oxygen demand into the pollution abatement, pollutant generation coefficient, production structure, final import coefficient, exports, and domestic final demands effects, and discussed how China achieved its 11th Five-Year Plan emissions reduction target [63].
The studies mentioned above mainly examined the factors influencing air pollutant emissions through econometric, simulation and decomposition analyses, but there are still some gaps in this research area. First, although some previous literature explored air pollutant emissions through decomposition analysis, these studies only conducted a holistic analysis of the impacts of various decomposition factors on air pollutant emissions, especially in a specific sector or region. Few studies examined these factors on the changes in air pollutant emissions from the perspective of different sectors and subsectors in a region. Because different sectors or subsectors play distinct roles in the changes of various air pollutant emissions, it is necessary to conduct a comparative analysis of the impacts of decomposition effects in different sectors and subsectors on the changes of different air pollutant emissions. Second, in the current analyses of factors related to air pollutant emissions using the SDA method, relatively few factors were identified; some important effects, such as consumption, investment, and input-output efficiency effects, were not examined for influences on air pollutants. In addition, the input-output data used in previous studies is from before 2010, which is relatively old and cannot reflect the recent input and output situation. Thus, this study constructed a non-competitive economy-energy-air pollutant emissions input-output table, and extended the SDA method to decompose the factors influencing air pollutant emissions into emission efficiency, energy intensity, consumption, investment, export, import, and input-output efficiency effects, and investigated the impacts of these effects on the air pollutant emission changes. Compared with the previous studies, we conducted a more in-depth and comprehensive analysis to examine the key factors affecting the air pollutant changes in China in order to provide a better reference for pollutant emission abatement policies.

3. Methodology and Data Description

3.1. Methodology

Based on the input-output tables, we constructed a non-competitive economy-energy-air pollutant emissions input-output table, which is expressed as Table 1, where the variables are defined in Table 2.
The change in air pollutant emissions between the base period and target period can be written as Equation (1).
Δ Q = Q 1 Q 0 = e ^ 1 E ^ 1 X 1 e ^ 0 E ^ 0 X 0
The subscripts 0 and 1 denote the base period 0 and target period 1, respectively. We use the pole decomposition method proposed by Nehorai and Morf [64], which looks like trapezoidal integration and can be used to effectively decompose the changes of pollutant emissions. The change in air pollutant emissions can be decomposed between the base period and target period and expressed as Equation (2).
Δ Q = Δ e ^ ( E ^ 0 X 0 + E ^ 1 X 1 ) / 2 + ( e ^ 1 Δ E ^ X 0 + e ^ 0 Δ E ^ X 1 ) / 2 + ( e ^ 0 E ^ 0 + e ^ 1 E ^ 1 ) Δ X / 2
As can be seen from Table 1, final demand (Y) contains C, K, and EXP. Thus, the change in final demand (Y) can be decomposed between consumption, investment, and export effects. The changes in direct consumption coefficients and final demand have effects on the change in total output. The ratio of domestic supply to total supply is denoted by ui in various sectors and expressed as Equation (3).
u i = ( x i exp i ) / ( x i exp i + i m p i ) = 1 [ i m p i / ( x i exp i + i m p i ) ] = 1 u m i
where u m i = i m p i / ( x i exp i + i m p i ) . xi, expi, and impi represent the corresponding elements in the vectors of X, EXP, and IMP, respectively. The value of total domestic production is equal to the value of domestic intermediate products, domestic production for final domestic demand, and export, thus,
X = U ^ A X + U ^ ( C + K ) + E X P
where U ^ represents the diagonal matrix of the ratio of domestic supply. The change in total output (ΔX) can be decomposed as follows:
Δ X = 1 2 ( R 0 U ^ 0 + R 1 U ^ 1 ) Δ C consumption   change + 1 2 ( R 0 U ^ 0 + R 1 U ^ 1 ) Δ K capital   accumulation   change + 1 2 ( R 0 + R 1 ) Δ E X P export   change + 1 2 [ R 0 Δ U ^ ( A 1 X 1 + C 1 + K 1 ) + R 1 Δ U ^ ( A 0 X 0 + C 0 + K 0 ) ] ratio   of   domestc   supply   change + 1 2 ( R 0 U ^ 0 Δ A X 1 + R 1 U ^ 1 Δ A X 0 ) nput output   efficiency   change
where R 0 = ( I U ^ 0 A 0 ) 1 , R 1 = ( I U ^ 1 A 1 ) 1 . Based on Equation (3), the changes in the ratio of domestic supply can be expressed as follows:
Δ u i = ( Δ u m i )
Using Equations (5) and (6), Equation (2) can be rewritten as follows:
Δ Q = Δ e ^ ( E ^ 0 X 0 + E ^ 1 X 1 ) / 2 emission   efficiency   effect + ( e ^ 1 Δ E ^ X 0 + e ^ 0 Δ E ^ X 1 ) / 2 energy   intensity   effect + k ( R 0 U ^ 0 + R 1 U ^ 1 ) Δ C / 2 consumption   effect + k ( R 0 U ^ 0 + R 1 U ^ 1 ) Δ K / 2 investment   effect + k ( R 0 + R 1 ) Δ E X P / 2 export   effect k [ R 0 Δ U ^ m ( A 1 X 1 + C 1 + K 1 ) + R 1 Δ U ^ m ( A 0 X 0 + C 0 + K 0 ) ] / 2 import   effect + k ( R 0 U ^ 0 Δ A X 1 + R 1 U ^ 1 Δ A X 0 ) / 2 input output   efficiency   effect
where k = ( e ^ 1 E ^ 1 + e ^ 0 E ^ 0 ) / 2 . U ^ m represents the diagonal matrices of import. The terms on the right-hand side of Equation (7) represent the impact on air pollutant emission changes of the following factors: (1) air pollutant emissions per unit of fossil energy consumption; (2) energy consumption per unit of output; (3) consumption; (4) investment; (5) export; (6) ratio of import to total domestic supply; and (7) direct input-output coefficients. Thus, Equation (7) can be used to determinate the factors that influence changes in primary air pollutant emissions during different time periods.

3.2. Data Description

The input-output data came from the 2005, 2007, 2010, and 2012 input-output tables, which were obtained from the corresponding periods in China Statistical Yearbook. The data for fossil energy consumption came from the corresponding periods in China Energy Statistical Yearbook. Su et al. (2010) highlighted the importance of sector aggregation on the environmental input-output analysis [65]. Because these air pollutant emissions were estimated based on 6 major sectors (agriculture, industry, commerce, transport, construction, and other sectors) and 8 industrial subsectors (iron and steel, nonferrous metals, building materials, coking, refining and petrochemical industry, chemical products and manufacturing, power and heating supply, and other industrial subsectors), the whole Chinese economy was divided into 6 major sectors and 8 industrial subsectors to match the data for air pollutant emissions and input-output classifications. The data for currency variables were converted into standard prices using a price index (2005 = 100) because the study period is from 2005 to 2012. The relevant price indices of different sectors and subsectors were from the corresponding periods in China Statistical Yearbook. The emissions of major air pollutants (NOx, PM2.5, SO2) in China from 2005 to 2012 were estimated by Tsinghua University using an “emission factor method” [66,67,68,69,70]. The emissions from each sector/subsector were calculated from the activity data (energy consumption, industrial product yields, solvent use, etc.), technology-based uncontrolled emission factors, and penetrations of control technologies.

4. Empirical Results

4.1. Holistic Analysis

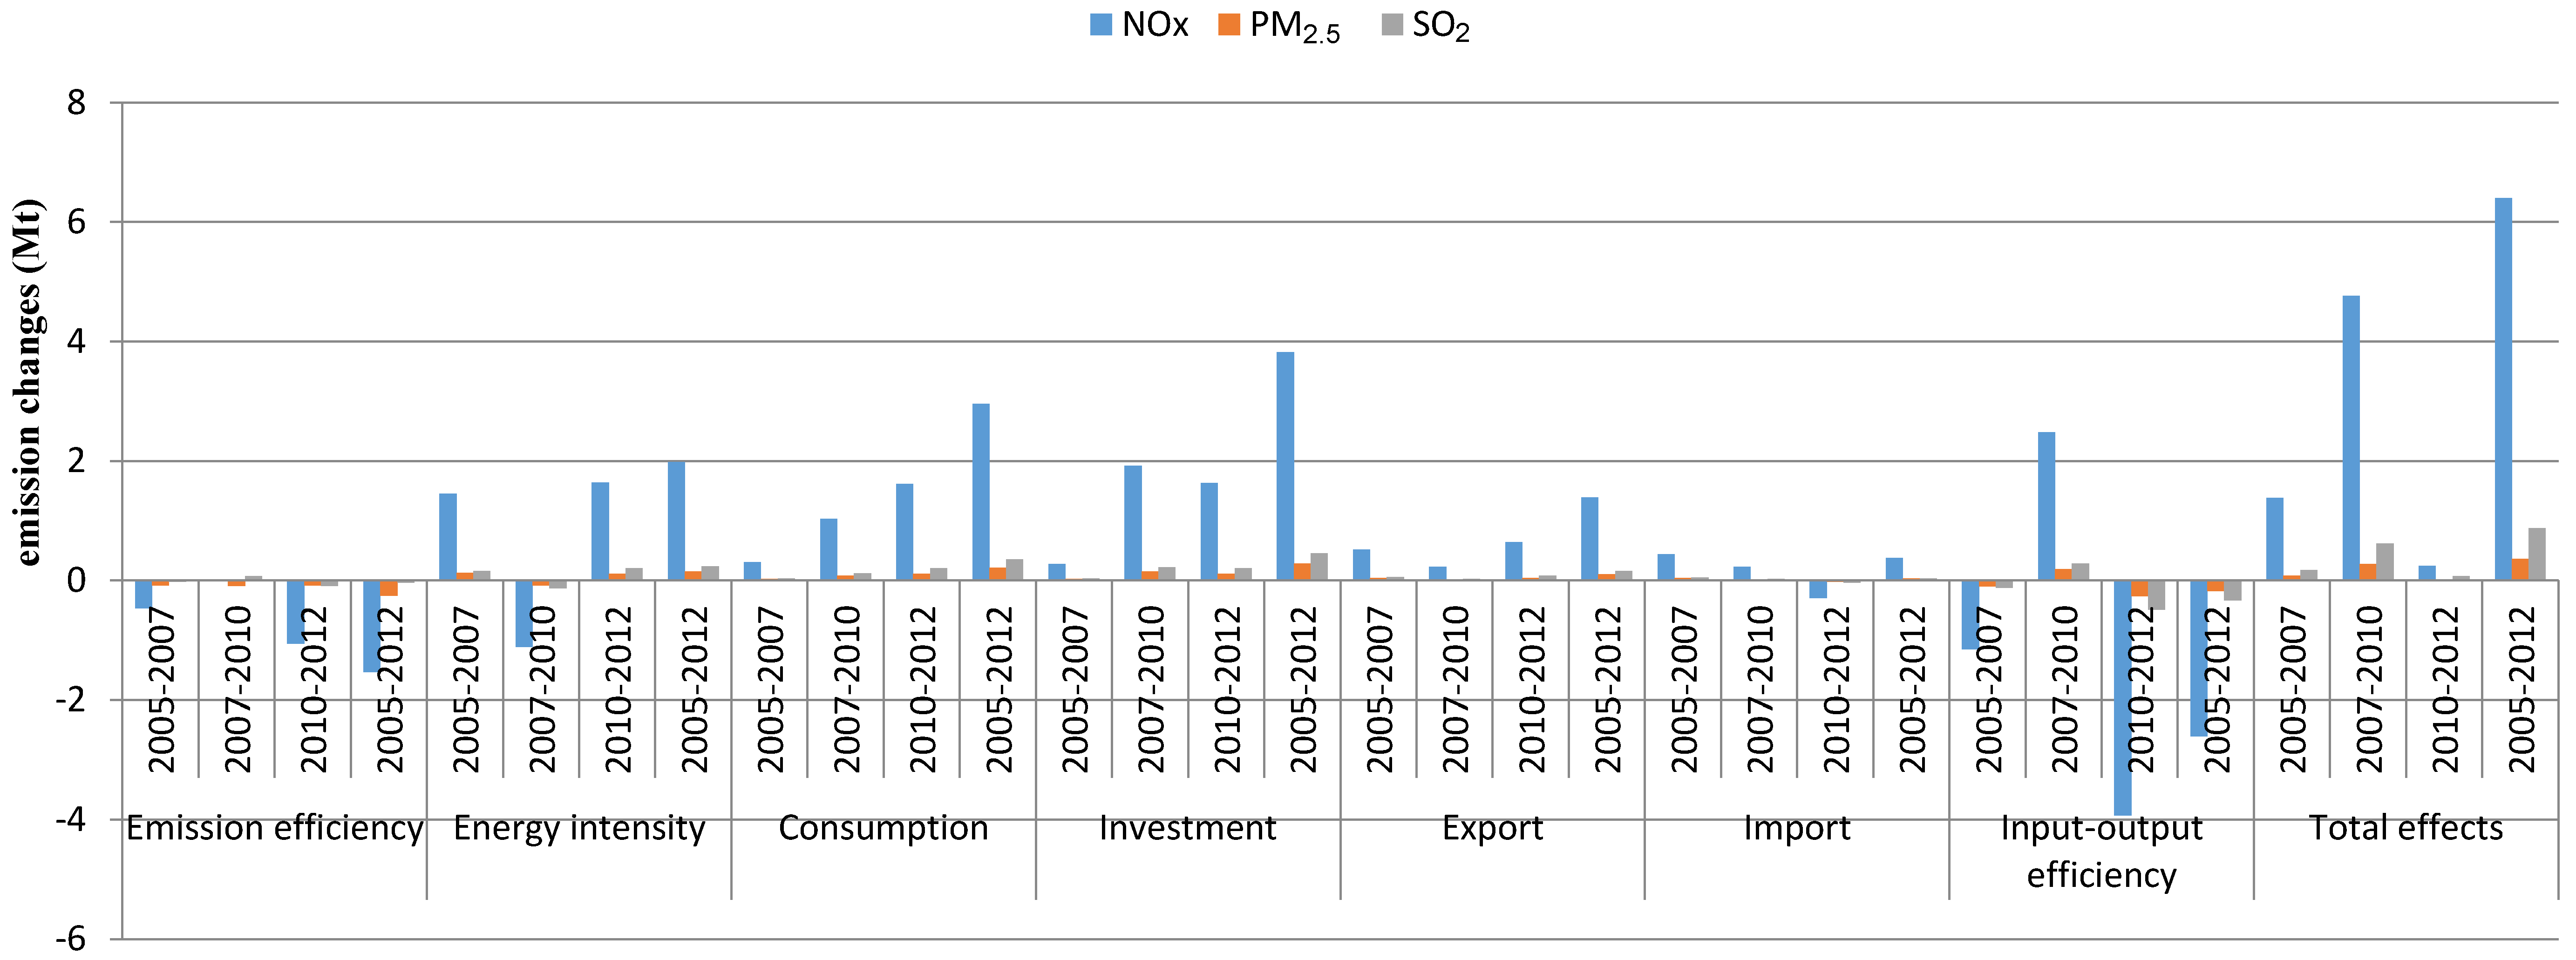
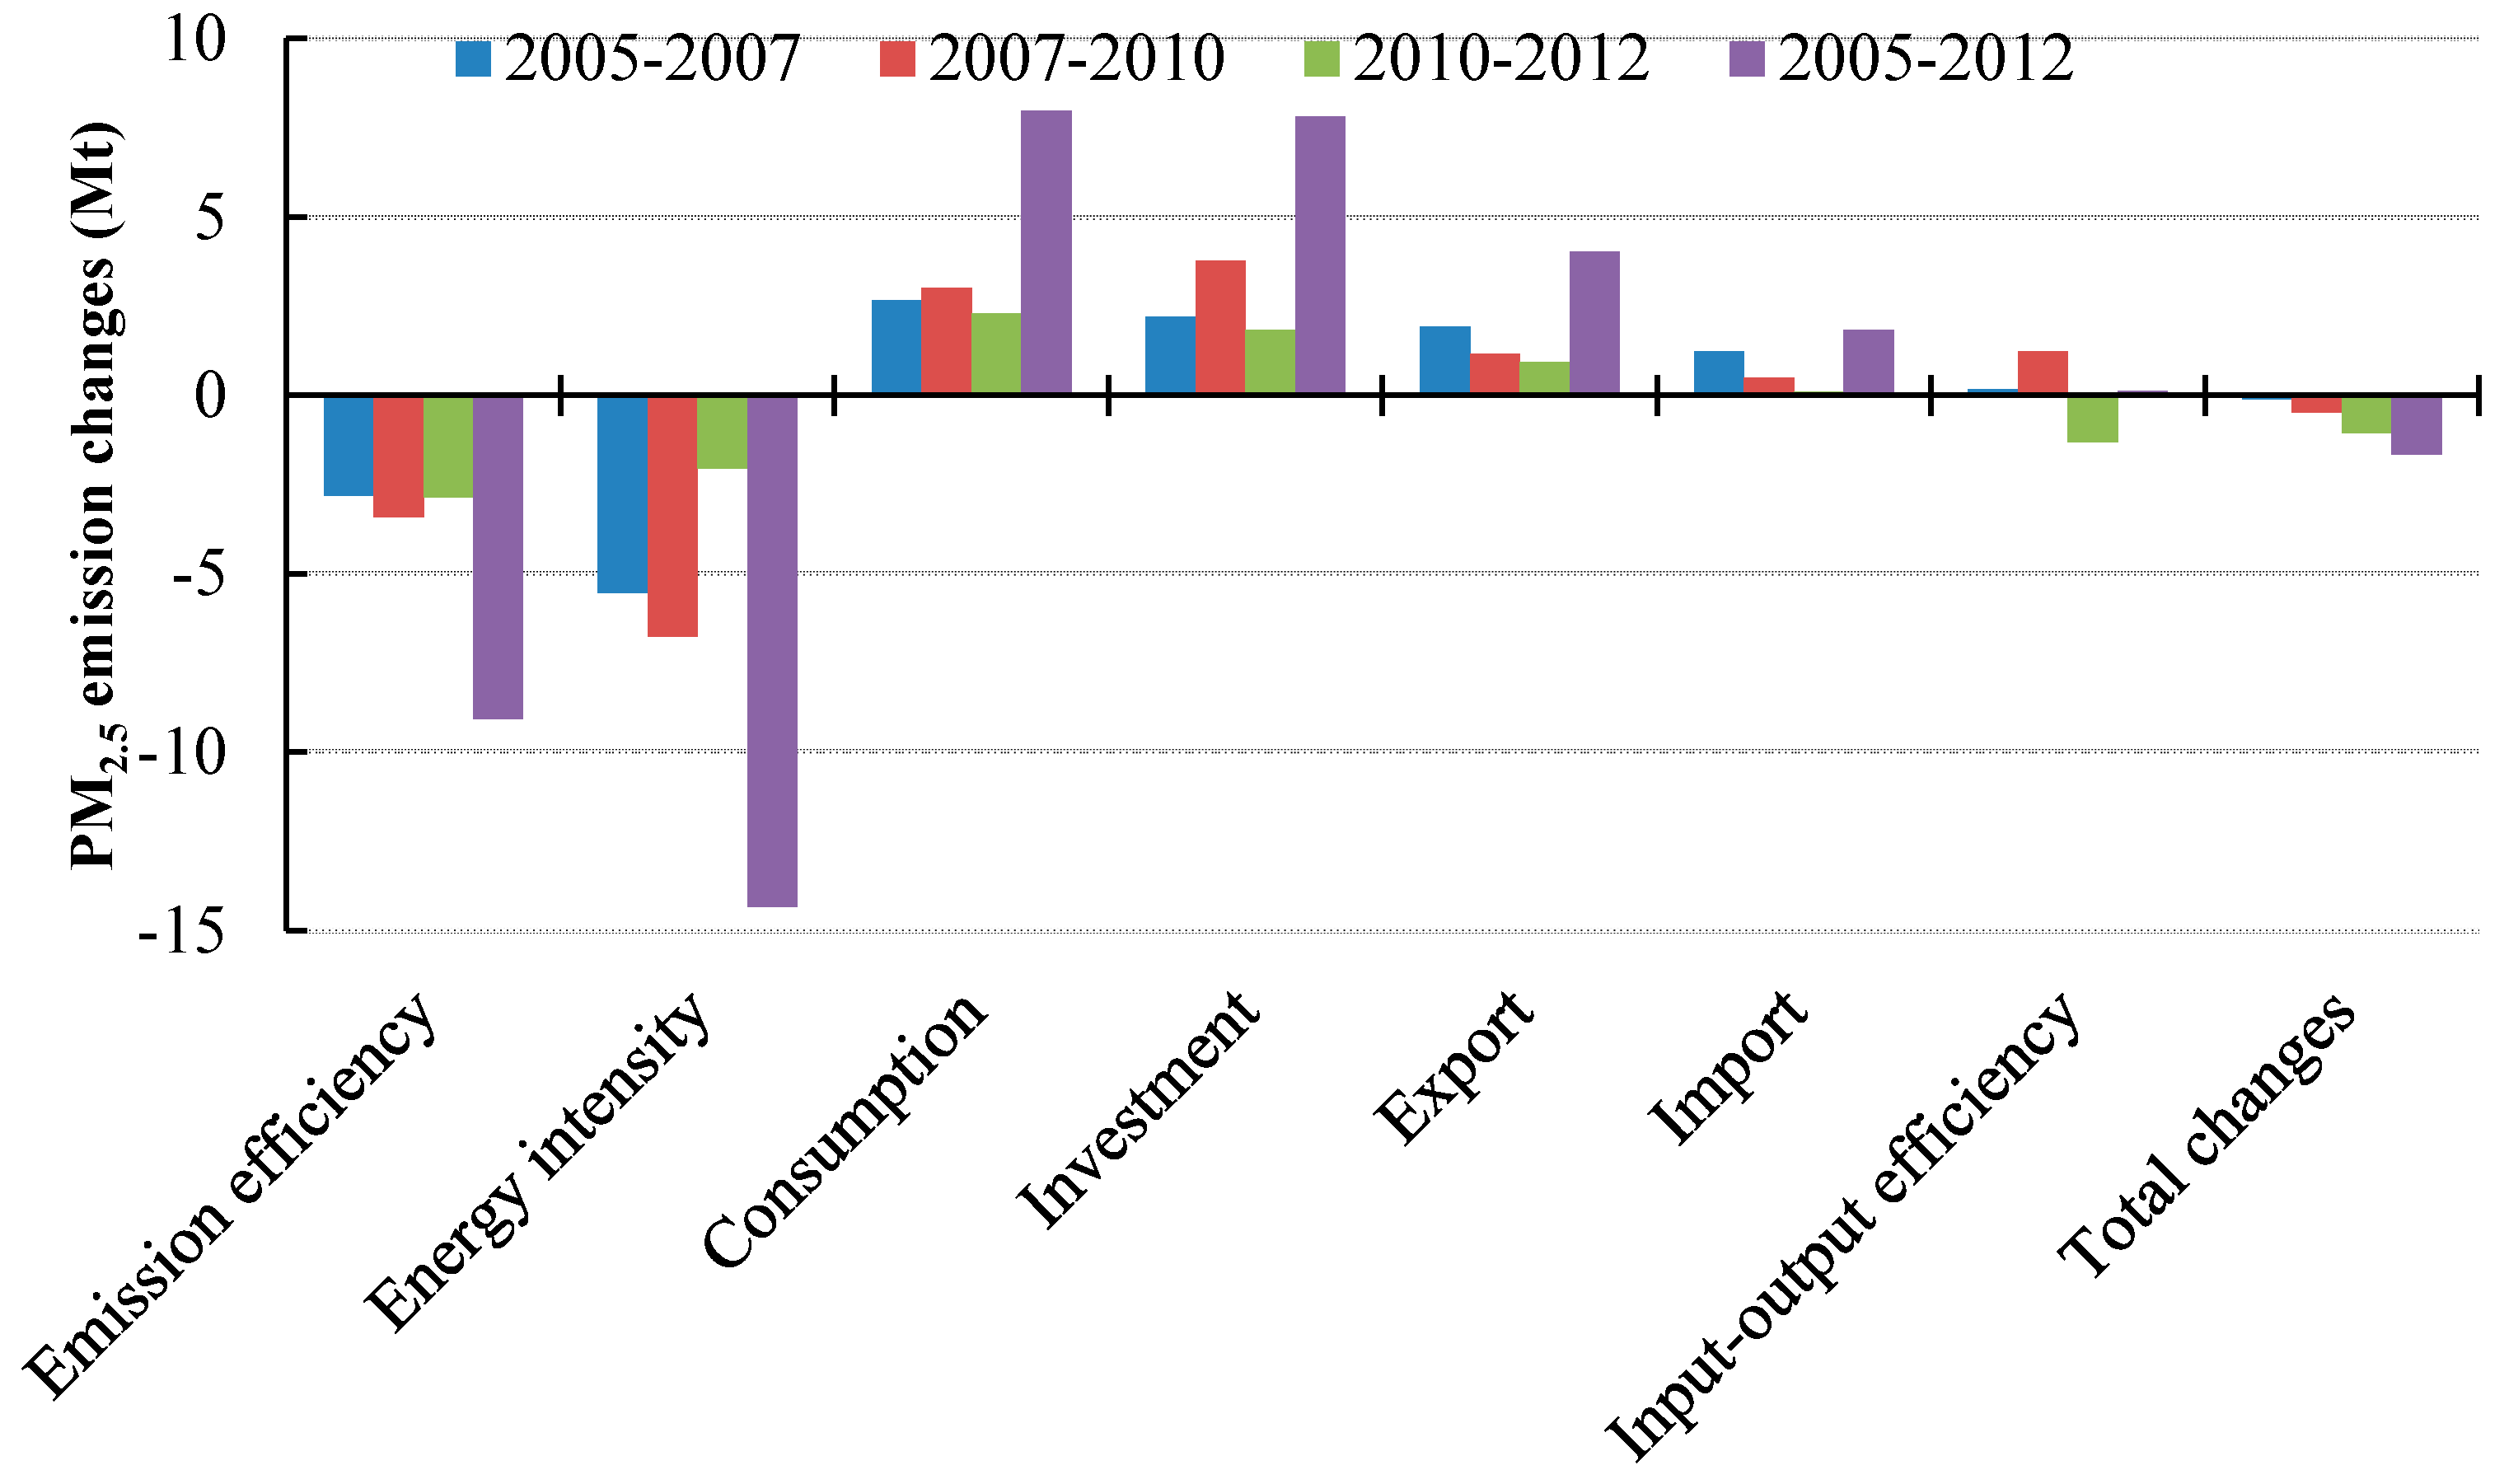
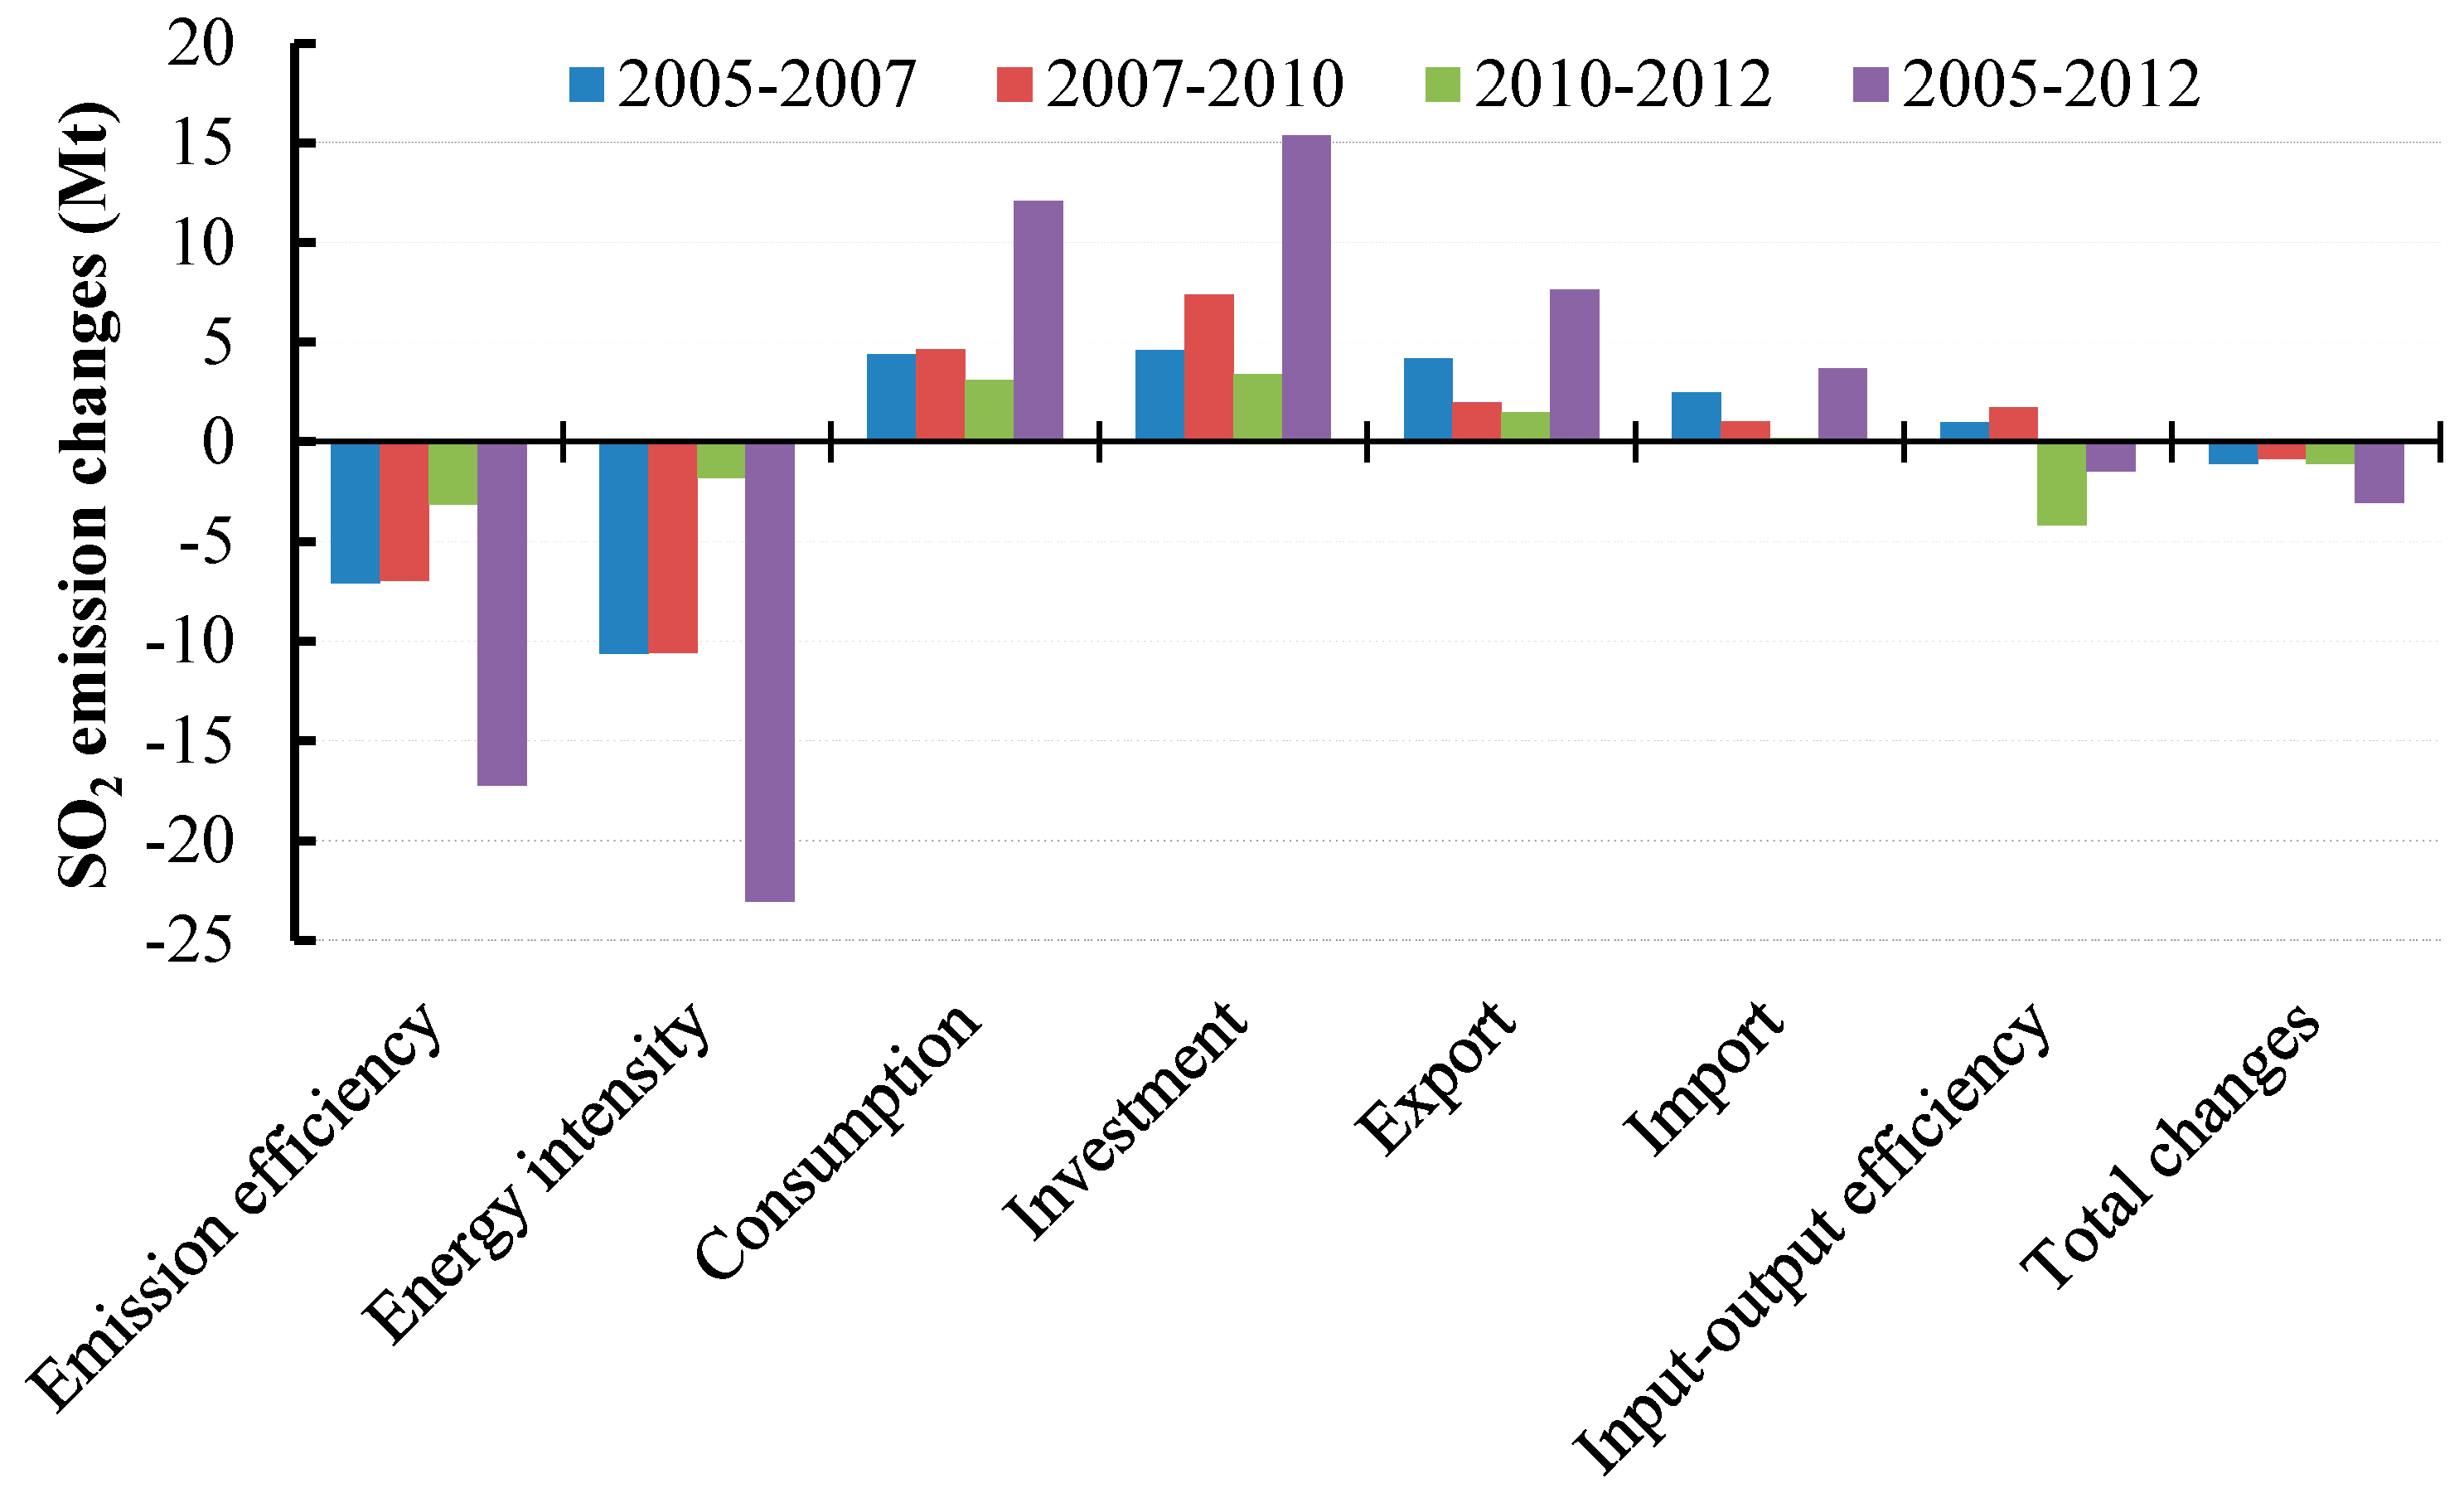
The air pollutant emissions are different from carbon emissions. Because these air pollutant emissions from each sector/subsector were calculated from the activity data, technology-based uncontrolled emission factors, and penetrations of control technologies, the emission factors were different during different periods. The proportion of different fossil energy types in China changed very slightly during our study periods, and the emission factors played the most important role in this effect, so it was called “emission efficiency”, which means the air pollutant emissions per unit of fossil energy consumption. Even though the energy types were not distinguished, it can still reflect the emission efficiency in the process of energy consumption. Figure 1, Figure 2 and Figure 3 show that there were similar impacts of various effects on the changes in NOx, PM2.5, and SO2 emissions during the periods 2005–2007, 2007–2010, 2010–2012, and 2005–2012. On the whole, the emission efficiency and energy intensity effects were negative, and had great inhibitory impacts on emissions increments. The energy intensity effect greatly decreased NOx (−12.49 million tons, Mt), PM2.5 (−14.33 Mt), and SO2 (−23.06 Mt) emissions during 2005–2012. The factors related to economic growth, such as investment, consumption, and export promoted NOx, PM2.5, and SO2 emissions, especially the investment and consumption were the key promoting effects on these emissions.
From the perspective of the trends of different effects during the periods 2005–2007, 2007–2010, and 2010–2012, on the whole, the emission efficiency effect on inhibiting NOx emissions increased (Figure 1), but its effect on inhibiting SO2 emissions decreased (Figure 3). The emission efficiency effect on inhibiting PM2.5 emissions increased and then decreased (Figure 2). The energy intensity effect had an increasing inhibitory impact on these air pollutant emission increments from 2005–2007 to 2007–2010, whereas it had a decreasing inhibitory impact from 2007–2010 to 2010–2012. The consumption and investment effects were driving factors on the air pollution emission increments. During the periods 2005–2007 and 2010–2012, the consumption and investment effects had a certain upward trend for promoting NOx emissions (Figure 1), whereas they had a downward trend for promoting PM2.5 and SO2 emissions (Figure 2 and Figure 3). Export and import effects showed downward trends for promoting these air pollutant emissions, which indicates that China’s trade structure was in an unreasonable state from the perspective of energy conservation and emission reduction, but it had been slightly improved from the trends of export and import effects. In general, the input-output efficiency effect remained fluctuating from positive to negative, and it had an inhibitory effect on these air pollutant emissions, especially after 2010. As shown in Figure 1 and Figure 3, the input-output efficiency effect decreased NOx and SO2 emissions during the period 2005–2012, whereas it increased PM2.5 emissions during this period (Figure 2). The input-output efficiency effect promoted these air pollutant emissions during the period 2007–2010, whereas this effect reduced these air pollutant emissions during the period 2010–2012, reflecting the improvement of input-output efficiency in most recent period. On the whole, during the long period 2005–2012, China’s input-output efficiency had been improved, but the degree was not significant.

4.2. Sectoral Analysis

Figure A1 (see Appendix) shows the impact of various factors on the changes in the air pollutant emissions in agriculture, industry, commerce, transport, construction, and other sectors. During 2005–2012, the impact of all factors in transport, industry, construction, and commerce increased NOx emissions by 6.398, 5.734, 0.107, and 0.038 Mt, respectively, and decreased NOx emissions in agriculture and the other sectors by 0.131, and 0.014 Mt, respectively. This indicates that transport and industry played an important promoting role in NOx emissions. The total effects in industry greatly decreased PM2.5 emissions by 0.911 Mt. However, the total effects increased PM2.5 emissions in transport by 0.358 Mt, so transport was still the main sector promoting PM2.5 emissions compared with other sectors. The total effects on SO2 emissions in industry had an inhibitory impact, which reduced the emissions by 4.245 Mt. These effects in transport and commerce greatly promoted SO2 emissions by 0.873 and 0.516 Mt, respectively. The total effects in transport significantly increased NOx, PM2.5, and SO2 emissions. The main reason for this is that the energy intensity of transport did not decline, and even went up in recent periods. Except in transport, the energy intensity effect in all sectors was negative, which means that energy efficiency in transport declined, whereas it rose in other sectors. The emission efficiency and energy efficiency effects were the key inhibitory factors on air pollutant emissions, especially for the industry. The consumption, investment, export and import effects were positive on the whole, which suggests that these factors related to economic growth such as consumption, investment, and export promoted air pollutants. The degree of the impacts of these effects in different sectors differed greatly during the period 2005–2012. Our empirical results suggest that the energy intensity effect in transport decreased air pollutant emissions only during the period 2007–2010, but greatly increased these emissions during the periods 2005–2007, and 2010–2012 (Figure A2). The main reasons are as follows. During period 2005–2007, the economic growth reached its maximum, resulting in the rapid development of the transport [71]. Energy efficiency decreased in the transport sector during this period, because of the lack of cohesion and coordination among the different modes of transport, such as the railways, aviation, highways, and waterways, and a modal shift from less energy consuming modes, such as the railways, to more energy consumption intensive modes, such as the highways and civil aviation [72]. During the period 2007–2010, China formulated a series of policies to promote emissions reduction, and stimulated the improvement of energy efficiency, and China’s express railways developed rapidly, which improved the conveying efficiency and the energy efficiency in the transport during this period [73]. During the period 2010–2012, the low price of the fossil energy led to an increase in the rebound effect on energy consumption, resulting in an increase in the energy intensity of transport [74].

4.3. Sub-Sectoral Analysis in Industry

As shown in Figure A3, power and heating supply had the largest promoting impact on NOx emissions, whereas the coking had the greatest inhibitory impact on these emissions. Except the subsectors of iron and steel, and building materials, all industrial subsectors, especially the coking, refining and petrochemical industry, nonferrous metals, power and heating supply, reduced PM2.5 emissions. Power and heating supply played the greatest role in SO2 emissions reduction, whereas iron and steel was the main subsector increasing SO2 emissions. On the whole, power and heating supply had the greatest impact on the changes of these air pollutants emissions. From the perspective of the impacts of various effects on air pollutant emissions increments in different industrial subsectors, on the whole, the consumption, and investment effects were the main factors that increased air pollutant emissions during the period 2005–2012. For these industrial subsectors, the investment effect was a key driving factor on the air pollutants emissions in the iron and steel, nonferrous metals, building materials, coking, chemical products and manufacturing, power and heating supply, and other industrial subsectors; the consumption effect was a key driving factor in chemical products and manufacturing, and the refining and petrochemical industry. Except in chemical products and manufacturing, the energy intensity effect in all industrial subsectors was negative. During the period 2005–2012, the emission efficiency effect in all industrial subsectors obviously reduced PM2.5 and SO2 emissions. Although the emission efficiency effect increased NOx emissions in most industrial subsectors, this effect greatly reduced NOx emissions in the power and heating supply (2.304 Mt). Thus, for the industry sector, the emission efficiency effect reduced NOx emissions on the whole. The input-output efficiency effect on the emissions in these industrial subsectors differed greatly.

5. Discussion

The empirical analysis results reveal the following interesting phenomena:
(1) On the whole, the energy intensity effect was a key curbing factor on the air pollutant emissions increments, followed by the emission efficiency effect.
China’s energy intensity showed a declining trend in long term, in particular, the energy intensity in the industry declined greatly. Due to the highest proportional output and energy consumption for the industry, a decrease in the energy consumption per unit of output in the industry would lead to substantial air pollutants emissions reduction, which is supported by [62]. It is worth mentioning that, during 2007–2012, the energy intensity effect on the inhibition of air pollutants showed a downward trend. This indicates that China’s industrial energy efficiency improvement had slowed down. The emission efficiency effect obviously reduced air pollutant emissions, which indicates that the air pollutant emissions per unit of energy consumption generally decreased. This result is consistent with [69]. This reflects that China had made a significant improvement in the air pollutants’ end-of-pipe treatment in these periods. Our empirical results reveal that the emission efficiency effect on the inhibition of different air pollutants differed greatly. For example, the emission efficiency effect showed an uptrend for decreasing NOx emissions, whereas it presented a downward trend for decreasing SO2 emissions. This emission efficiency effect on decreasing PM2.5 emissions changed from a rise to a decline. This may be related to China’s emission reduction policies and reduction potentials. For example, during the 11th Five-Year Plan period (2006–2010), no clear NOx emissions reduction target was put forward, so the denitration rate was relatively low, and there was much room for NOx emissions reduction. During the 12th Five-Year Plan (2011–2015) period, China proposed the target of reducing NOx emissions by 10%, so the denitration rate was greatly improved due to this reduction target, and NOx emissions decreased in this period. Thus, the emission efficiency effect on reducing NOx emissions went up during 2005–2012. As for SO2 emissions, during the 11th Five-Year Plan period, China put forward the target of reducing SO2 emissions by 10%, and SO2 emissions decreased by 14.3% during this period according to China’s statistics [75]; during the 12th Five-Year period, China put forward another target of reducing SO2 emissions by 8%. Due to the magnitude reduction in the 11th Five-Year period, China’s enterprises had a narrow space in the end-of-pipe treatment of reducing SO2 emissions. Thus, the emission efficiency effect on reducing SO2 emissions declined. China has made great efforts in PM2.5 emissions reduction without quantitative targets during the period 2005–2012. China’s statistics showed that total suspended particles (TSP) emissions reduction reached more than 30% during the 11th Five-Year Plan period [13], so China made a great achievement in PM2.5 emissions reduction during this period. Through the end-of-pipe reduction, dust can be reduced by 96% using electrostatic precipitation, and nowadays the use of more advanced equipment can reduce dust up to 99%, so the PM2.5 emissions reduction potential decreased [66].
(2) The investment and consumption effects were the main driving forces for China’s air pollutant emissions increments. The export and import increased these emissions on the whole, but China’s trade structure had been slightly improved from the perspective of the trends of export and import effects.
Investment, consumption and export, regarded as the “three carriages” for economic growth, would promote air pollutants emissions, if other factors remained unchanged [76]. Our empirical results reveal that the investment and consumption effects were dominant promoting factors for air pollutants emissions. Furthermore, the investment and consumption structures have great impacts on pollutants emissions as well. For example, the investment in infrastructure and urbanization development, and consumption of automobiles, and energy-intensive products would greatly promote air pollutant emissions. According to the China Statistical Yearbook (2013), the number of motor vehicles in China increased from 18.48 million in 2005 to 88.39 million in 2012; Xie et al. found that, with the continuous infrastructure construction, such as highway, railway and aviation, the energy consumption and pollutant emissions have increased by leaps and bounds [77]. The export and import effects promoted air pollutant emissions on the whole, so from the perspective of energy conservation and emission reduction, China’s foreign trade development was not in a good state. The main reason is that China’s foreign trade scale increased year by year, which increased air pollutants emissions. However, the export and import effects on increasing pollutants emissions declined, and even curbed air pollutant emissions. The main reason for this result is that, China’s foreign trade structure had been improved to some extent [71]. Our empirical results show that, from different sectors, the export effect on driving air pollutant emissions declined in the agriculture, industry, and other sectors, while this effect went up in the commerce. The import effect on promoting these emissions went up to a small degree in the construction, whereas this effect obviously declined in the other five sectors. Export and import effects on promoting air pollutant emissions showed a downward trend in most industrial subsectors, and even inhibited the emissions, which indicates that the foreign trade in most industrial sectors had an improving trend.
(3) The impact of various factors on air pollutant emission changes differed greatly across sectors and industrial subsectors.
Due to the great differences between sectors and industrial subsectors in economic status, production technology, emissions reduction technology and so on, the various effects in these sectors and subsectors had different impacts on the air pollutants emission changes. The empirical results indicates that the consumption effect greatly increased air pollutant emissions in agriculture, commerce, and other sectors, whereas the investment effect greatly increased these emissions in industry, transport, and construction. This is because the large investment in industry, transport, and construction in the long term, such as the Western Development strategy and China’s 4 trillion RMB yuan investment in 2008, which was most relevant to industry, transport, and construction [47]. Agriculture, commerce and other sectors are directly related to people’s daily life, which leads to high consumption in these sectors, so the consumption effect in these sectors obviously increased air pollutant emissions. Overall, the investment effect was the greatest driving factor on the air pollutant emissions in the industrial subsectors of iron and steel, nonferrous metals, building materials, coking, and power and heating supply, because of the relatively large investment and even overcapacity in these subsectors. The consumption effect greatly increased pollutant emissions in chemical products and manufacturing, and refining and petrochemical industry. The main reason is that, with the improvement of people’s living standards, an increase in private cars, energy-intensive goods consumption, and so on, would lead to the expansion of production in these sectors, thereby promoting pollutants emissions. This result is also supported by [16].

6. Conclusions and Policy Implications

On the whole, energy intensity had a great inhibitory effect on the air pollutant emissions, followed by emission efficiency. The input-output efficiency effect had only a slight inhibitory impact on these emissions, which indicates that its reduction potential has not been realized. The factors related to economic growth greatly increased air pollutant emissions, among which, the investment and consumption effects were the key driving factors on the emissions. Overall, the export and import effects increased the emissions, but the effects on increasing the emissions showed a downward trend, and even reduced the emissions in the period 2010–2012. The various effects on the changes of air pollutant emissions differed greatly in different sectors and industrial subsectors.
Our empirical analysis points to the following policy implications for control of air pollutant emissions: (1) NOx control should be strengthened, and the energy efficiency and input-output efficiency should be further improved, especially for energy intensive industry. Our analysis results reveal that the emission efficiency reduced air pollutant emissions, which indicates the end-of-pipe reduction had been improved to some degree. In this regard, China should further promote the end-of-pipe reduction capacity to reduce the air pollutants by improving emissions reduction equipment and technology. Our analysis results reveal that all the effects did not effectively reduce NOx emissions, so NOx control should be strengthened in future. The energy intensity effect had a great inhibitory impact on these emissions. Thus, China should make full use of this advantage to reduce energy consumption per unit of output, by improving the production process and energy saving technology. The input-output efficiency can be improved through the following two aspects. First, the production technology should be enhanced to reduce the input per unit of output. Second, the input structure should be optimized by decreasing the energy-intensive and pollution-intensive intermediate inputs, and increasing clean intermediate inputs. (2) The factors related to economic growth greatly increased air pollutants emissions, so more attention should be focused on sustainable development. The policies such as “structure adjustment and growth promotion”, put forward by China’s central government, should be implemented effectively to transform the mode of economic development. Our analysis results reveal that the investment and consumption effects were the key driving factors on emissions, therefore the concept of green consumption should be cultivated to guide consumers to focus on energy saving and emissions reduction, and forming sustainable consumption habits. Meanwhile, it is necessary to optimize the investment scale and structure to improve the investment quality and efficiency, and avoid excessive, blind and repetitive investment. Overall, the export and import effects promoted air pollutant emissions, so high added-value exports and high energy-intensive imports should be encouraged to optimize the foreign trade structure. (3) More attention should be paid to the sustainable development of China’s industry and transport. Therefore, it is necessary to eliminate the sources of excessive pollutants for industry. For transport, enhancing its energy efficiency should be considered first. The end-of-pipe treatment is also an effective way to promote emissions reduction, such as the introduction and implementation of relevant environmental standards, elimination of vehicles without meeting environmental standards, and improvement of fuel quality and auto emissions standards. (4) The consumption effect greatly increased air pollutants emissions in agriculture and commerce, so it is necessary to adjust the consumption scale and structure in these sectors through encouraging green consumption, and developing consumers’ energy saving awareness and behavior. The investment effect greatly promoted air pollutants emissions in industry and transport. Therefore, China should adjust the investment structure of these sectors, to avoid blind and excessive investment, especially in industrial subsectors. Energy efficiency has not been effectively improved in transport and chemical products and manufacturing, so it is urgent to improve the energy efficiency in these sectors.

Acknowledgments

This study was financially supported by the Fundamental Research Funds for the Central Universities (grant no. 2015XKMS090).

Author Contributions

Shichun Xu and Qinbin Li conceived and designed the experiments; Wenwen Zhang performed the experiments; Bin Zhao and Shuxiao Wang analyzed the data; Ruyin Long contributed reagents/materials/analysis tools; Shichun Xu and Wenwen Zhang wrote the paper.

Conflicts of Interest

The authors declare no conflict of interest.

Appendix A

Figure A1. Structural decomposition of air pollutant emission changes in China’s different sectors during 2005–2012.
Sustainability 09 01742 g004
Figure A2. Structural decomposition of air pollutant emission changes in China’s transport sector during different periods.
Sustainability 09 01742 g005
Figure A3. Structural decomposition of air pollutant emission changes in China’s different industrial subsectors during 2005–2012.
Sustainability 09 01742 g006

References

  1. Lelieveld, J.; Evans, J.S.; Fnais, M.; Giannadaki, D.; Pozzer, A. The contribution of outdoor air pollution sources to premature mortality on a global scale. Nature 2015, 525, 367–371. [Google Scholar] [CrossRef] [PubMed]
  2. Sun, C.W.; Yuan, X.; Yao, X. Social acceptance towards the air pollution in China: Evidence from public’s willingness to pay for smog mitigation. Energy Policy 2016, 92, 313–324. [Google Scholar] [CrossRef]
  3. Matus, K.; Nam, K.M.; Selin, N.E.; Lamsal, L.N.; Reilly, J.M.; Paltsev, S. Health damages from air pollution in China. Glob. Environ. Chang. 2012, 22, 55–66. [Google Scholar] [CrossRef]
  4. Zhang, Q.; Crooks, R. Toward an Environmentally Sustainable Future: Country Environmental Analysis of the People’s Republic of China; ADB: Manila, The Philippines, 2012. [Google Scholar]
  5. Wang, J.D.; Zhao, B.; Yang, F.M.; Xing, J.; Morawska, L.; Ding, A.J.; Kulmala, M.; Kerminen, V.-M.; Kujansuu, J.; Wang, Z.F.; et al. Particulate matter pollution over China and the effects of control policies. Sci. Total Environ. 2017, 584–585, 426–447. [Google Scholar] [CrossRef] [PubMed]
  6. Su, B.; Ang, B.W. Structural decomposition analysis applied to energy and emissions: Some methodological developments. Energy Econ. 2012, 34, 177–188. [Google Scholar] [CrossRef]
  7. Zheng, M.; Salmon, L.G.; Schauer, J.J.; Zeng, L.; Kiang, C.S.; Zhang, Y.; Cass, G.R. Seasonal trends in PM2.5 source contributions in Beijing, China. Atmos. Environ. 2005, 39, 3967–3976. [Google Scholar] [CrossRef]
  8. Huang, X.F.; He, L.Y.; Hu, M.; Zhang, Y.H. Annual variation of particulate organic compounds in PM2.5 in the urban atmosphere of Beijing. Atmos. Environ. 2006, 40, 2449–2458. [Google Scholar] [CrossRef]
  9. Huang, W.; Cao, J.J.; Tao, Y.B.; Dai, L.Z.; Lu, S.E.; Hou, B.; Wang, Z.; Zhu, T. Seasonal variation of chemical species associated with short term mortality effects of PM2.5 in Xi’an, a central city in China. Am. J. Epidemiol. 2012, 175, 556–566. [Google Scholar] [CrossRef] [PubMed]
  10. Zhao, P.S.; Dong, F.; He, D.; Zhao, X.J. Characteristics of concentrations and chemical compositions for PM2.5 in the region of Beijing, Tianjin, and Hebei, China. Atmos. Chem. Phys. 2013, 13, 4631–4644. [Google Scholar] [CrossRef]
  11. Hao, Y.; Liu, Y.M. The influential factors of urban PM2.5 concentrations in China: A spatial econometric analysis. J. Clean. Prod. 2016, 112, 1443–1453. [Google Scholar] [CrossRef]
  12. Zhang, J.; Zhang, L.Y.; Du, M.; Zhang, W.; Huang, X.; Zhang, Y.Q.; Yang, Y.Y.; Zhang, J.M.; Deng, S.H.; Shen, F.; et al. Indentifying the major air pollutants base on factor and cluster analysis, a case study in 74 Chinese cities. Atmos. Environ. 2016, 144, 37–46. [Google Scholar] [CrossRef]
  13. Wang, K.; Tian, H.; Hua, S.; Zhu, C.; Gao, J.; Xue, J.; Hao, J.; Wang, Y.; Zhou, J. A comprehensive emission inventory of multiple air pollutants from iron and steel industry in China: Temporal trends and spatial variation characteristics. Sci. Total Environ. 2016, 559, 7–14. [Google Scholar] [CrossRef] [PubMed]
  14. Xue, Y.F.; Tian, H.Z.; Yan, J.; Zhou, Z.; Wang, J.L.; Nie, L.; Pan, T.; Zhou, J.R.; Hua, S.B.; Wang, Y.; et al. Temporal trends and spatial variation characteristics of primary air pollutants emissions from coal-fired industrial boilers in Beijing, China. Environ. Pollut. 2016, 213, 717–726. [Google Scholar] [CrossRef] [PubMed]
  15. Peters, G.P.; Minx, J.C.; Weber, C.L.; Edenhofer, O. Growth in emission transfers via international trade from 1990 to 2008. Proc. Natl. Acad. Sci. USA 2011, 108, 8903–8908. [Google Scholar] [CrossRef] [PubMed]
  16. Liu, Q.; Wang, Q. Reexamine SO2, emissions embodied in China’s exports using multiregional input–output analysis. Ecol. Econ. 2015, 113, 39–50. [Google Scholar] [CrossRef]
  17. Chang, Y.; Huang, Z.; Ries, R.J.; Masanet, E. The embodied air pollutant emissions and water footprints of buildings in China: A quantification using disaggregated input–output life cycle inventory model. J. Clean. Prod. 2016, 113, 274–284. [Google Scholar] [CrossRef]
  18. Román, R.; Cansino, J.M.; Rueda-Cantuche, J.M. A multi-regional input-output analysis of ozone precursor emissions embodied in Spanish international trade. J. Clean. Prod. 2016, 137, 1382–1392. [Google Scholar] [CrossRef]
  19. Deng, G.Y.; Ding, Y.F.; Ren, S.L. The study on the air pollutants embodied in goods for consumption and trade in China: Accounting and structural decomposition analysis. J. Clean. Prod. 2016, 135, 332–341. [Google Scholar] [CrossRef]
  20. Yang, S.; Fath, B.; Chen, B. Ecological network analysis of embodied particulate matter 2.5—A case study of Beijing. Appl. Energy 2016, 184, 882–888. [Google Scholar] [CrossRef]
  21. Wakeel, M.; Yang, S.; Chen, B.; Hayat, T.; Alasedi, A.; Ahmad, B. Network perspective of embodied PM2.5, emissions: A case study of India. J. Clean. Prod. 2016, 16, 3322–3331. [Google Scholar]
  22. Tecer, L.H.; Alagha, O.; Karaca, F.; Tuncel, G.; Eldes, N. Particulate matter (PM2.5, PM10-2.5, and PM10) and children’s hospital admissions for asthma and respiratory diseases: A bidirectional case-crossover study. J. Toxicol. Environ. Health Part A 2008, 71, 512–520. [Google Scholar] [CrossRef] [PubMed]
  23. Guaita, R.; Pichiule, M.; Mate, T.; Linares, C.; Diaz, J. Short-term impact of particulate matter (PM2.5) on respiratory mortality in Madrid. Int. J. Environ. Health Res. 2011, 21, 260–274. [Google Scholar] [CrossRef] [PubMed]
  24. Hu, W.; Downward, G.S.; Reiss, B.; Xu, J.; Bassig, B.A.; Hosgood, H.D.; Zhang, L.; Seow, W.J.; Wu, G.; Chapman, R.S.; et al. Personal and indoor PM2.5 exposure from burning solid fuels in vented and unvented stoves in a rural region of China with a high incidence of lung cancer. Environ. Sci. Technol. 2014, 48, 8456–8464. [Google Scholar] [CrossRef] [PubMed]
  25. Lipsett, M.J.; Ostro, B.D.; Reynolds, P.; Goldberg, D.; Hertz, A.; Jerrett, M.; Smith, D.F.; Garcia, C.; Chang, E.T.; Bernstein, L. Long-term exposure to air pollution and cardiorespiratory disease in the California teachers study cohort. Am. J. Respir. Crit. Care Med. 2011, 184, 828–835. [Google Scholar] [CrossRef] [PubMed]
  26. Lepeule, J.; Laden, F.; Dockery, D.; Schwartz, J. Chronic exposure to fine particles and mortality: An extended follow-up of the harvard six cities study from 1974 to 2009. Environ. Health Perspect. 2012, 120, 965–970. [Google Scholar] [CrossRef] [PubMed] [Green Version]
  27. Ostro, B.; Malig, B.; Broadwin, R.; Basu, R.; Gold, E.B.; Bromberger, J.T.; Derby, C.; Feinstein, S.; Greendale, G.A.; Jackson, E.A.; et al. Chronic PM2.5 exposure and inflammation: Determining sensitive subgroups in mid-life women. Environ. Res. 2014, 132, 168–175. [Google Scholar] [CrossRef] [PubMed]
  28. Nawahda, A.; Yamashita, K.; Ohara, T.; Kurokawa, J.; Yamaji, K. Evaluation of premature mortality caused by exposure to PM2.5 and ozone in east Asia: 2000, 2005, 2020. Water Air Soil Pollut. 2012, 223, 3445–3459. [Google Scholar] [CrossRef]
  29. Baxter, L.K.; Duvall, R.M.; Sacks, J. Examining the effects of air pollution composition on within region differences in PM2.5 mortality risk estimates. J. Expo. Sci. Environ. Epidemiol. 2013, 23, 457–465. [Google Scholar] [CrossRef] [PubMed]
  30. Chalbot, M.C.; Jones, T.A.; Kavouras, I.G. Trends of non-accidental, cardiovascular, stroke and lung cancer mortality in Arkansas are associated with ambient PM2.5 reductions. Int. J. Environ. Res. Public Health 2014, 11, 7442–7455. [Google Scholar] [CrossRef] [PubMed]
  31. Atkinson, R.W.; Kang, S.; Anderson, H.R.; Mills, I.C.; Walton, H.A. Epidemiological time series studies of PM2.5 and daily mortality and hospital admissions: A systematic review and meta-analysis. Thorax 2014, 69, 660–665. [Google Scholar] [CrossRef] [PubMed]
  32. Kim, H.; Park, Y.; Park, K.; Yoo, B. Association between Pollen Risk Indexes, Air Pollutants, and Allergic Diseases in Korea. Osong Public Health Res. Perspect. 2016, 7, 172–179. [Google Scholar] [CrossRef] [PubMed]
  33. Zhao, R.; Chen, S.; Wang, W.; Huang, J.; Wang, K.; Liu, L.; Wei, S. The impact of short-term exposure to air pollutants on the onset of out-of-hospital cardiac arrest: A systematic review and meta-analysis. Int. J. Cardiol. 2016, 226, 110–117. [Google Scholar] [CrossRef] [PubMed]
  34. Yu, T.; Wang, W.; Ciren, P.; Zhu, Y. Assessment of human health impact from exposure to multiple air pollutants in China based on satellite observations. Int. J. Appl. Earth Obs. Geoinf. 2016, 52, 542–553. [Google Scholar] [CrossRef]
  35. Maji, S.; Ahmed, S.; Siddiqui, W.A.; Ghosh, S. Short term effects of criteria air pollutants on daily mortality in Delhi, India. Atmos. Environ. 2017, 150, 210–219. [Google Scholar] [CrossRef]
  36. Kuo, Y.M.; Wang, S.W.; Jang, C.S.; Yeh, N.; Yu, H.L. Identifying the factors influencing PM2.5 in southern Taiwan using dynamic factor analysis. Atmos. Environ. 2011, 45, 7276–7285. [Google Scholar] [CrossRef]
  37. Han, Y.; Xiong, X.; Liu, Y.; Pan, Y.R.; Zhang, Y.B. The analysis of factors affecting SO2 emission of Chinese industry. In Proceedings of the International Conference on Computer and Management (CAMAN), Wuhan, China, 19–21 May 2011; IEEE: Piscataway, NJ, USA, 2011; pp. 1–11. [Google Scholar]
  38. Fujii, H.; Managi, S.; Kaneko, S. Decomposition analysis of air pollution abatement in China: Empirical study for ten industrial sectors from 1998 to 2009. J. Clean. Prod. 2013, 59, 22–31. [Google Scholar] [CrossRef]
  39. Guan, D.B.; Su, X.; Zhang, Q.; Peters, G.P.; Liu, Z.; Lei, Y.; He, K. The socioeconomic drivers of China’s primary PM2.5 emissions. Environ. Res. Lett. 2014, 9, 1–9. [Google Scholar] [CrossRef]
  40. Han, L.; Zhou, W.; Li, W.; Li, L. Impact of urbanization level on urban air quality: A case of fine particles (PM2.5) in Chinese cities. Environ. Pollut. 2014, 194, 163–170. [Google Scholar] [CrossRef] [PubMed]
  41. Xu, B.; Lin, B. Regional differences of pollution emissions in China: Contributing factors and mitigation strategies. J. Clean. Prod. 2016, 112, 1454–1463. [Google Scholar] [CrossRef]
  42. Xu, B.; Luo, L.Q.; Lin, B.Q. A dynamic analysis of air pollution emissions in China: Evidence from nonparametric additive regression models. Ecol. Indic. 2016, 63, 346–358. [Google Scholar] [CrossRef]
  43. Meng, J.; Liu, J.; Guo, S.; Huang, Y.; Tao, S. The impact of domestic and foreign trade on energy-related PM emissions in Beijing. Appl. Energy 2016, 184, 853–862. [Google Scholar] [CrossRef]
  44. Gonzalez, C.M.; Gomez, C.D.; Rojas, N.Y.; Acevedo, H.; Aristizabal, B.H. Relative impact of on-road vehicular and point-source industrial emissions of air pollutants in a medium-sized Andean city. Atmos. Environ. 2016, 152, 152–279. [Google Scholar] [CrossRef]
  45. Höllbacher, E.; Ters, T.; Rieder-Gradinger, C.; Srebotnik, E. Emissions of indoor air pollutants from six user scenarios in a model room. Atmos. Environ. 2017, 150, 389–394. [Google Scholar] [CrossRef]
  46. Wu, Y.; Zhang, L. Can the development of electric vehicles reduce the emission of air pollutants and greenhouse gases in developing countries? Transp. Res. Part D 2017, 51, 129–145. [Google Scholar] [CrossRef]
  47. Xu, S.C.; Zhang, L.; Liu, Y.T.; Zhang, W.W.; He, Z.X.; Long, R.Y.; Chen, H. Determination of the factors that influence increments in CO2, emissions in Jiangsu, China using the SDA method. J. Clean. Prod. 2017, 142, 3061–3074. [Google Scholar] [CrossRef]
  48. Liu, L.C.; Fan, Y.; Wu, G.; Wei, Y.M. Using LMDI method to analyze the change of China’s industrial CO2 emissions from final fuel use: An empirical analysis. Energy Policy 2007, 35, 5892–5900. [Google Scholar] [CrossRef]
  49. Xu, S.C.; He, Z.X.; Long, R.Y. Factors that influence carbon emissions due to energy consumption in China: Decomposition analysis using LMDI. Appl. Energy 2014, 127, 182–193. [Google Scholar] [CrossRef]
  50. Li, W.; Sun, S.; Li, H. Decomposing the decoupling relationship between energy-related CO2 emissions and economic growth in China. Nat. Hazards 2015, 79, 977–997. [Google Scholar] [CrossRef]
  51. Xu, S.C.; He, Z.X.; Long, R.Y.; Chen, H.; Han, H.M.; Zhang, W.W. Comparative analysis of the regional contributions to carbon emissions in China. J. Clean. Prod. 2016, 127, 406–417. [Google Scholar] [CrossRef]
  52. Xu, S.C.; Han, H.M.; Zhang, W.W.; Zhang, Q.Q.; Long, R.Y.; Chen, H.; He, Z.X. Analysis of regional contributions to the national carbon intensity in China in different Five-Year Plan periods. J. Clean. Prod. 2017, 145, 209–220. [Google Scholar] [CrossRef]
  53. Huang, Y.H.; Wu, J.H. Analyzing the driving forces behind CO2 emissions and reduction strategies for energy-intensive sectors in Taiwan, 1996–2006. Energy 2013, 57, 402–411. [Google Scholar] [CrossRef]
  54. Zhang, H.Y.; Lahr, M.L. China’s energy consumption change from 1987 to 2007: A multi-regional structural decomposition analysis. Energy Policy 2014, 67, 682–693. [Google Scholar] [CrossRef]
  55. Su, B.; Ang, B.W. Multi-region comparisons of emission performance: The structural decomposition analysis approach. Ecol. Indic. 2016, 67, 78–87. [Google Scholar] [CrossRef]
  56. Su, B.; Ang, B.W. Attribution of changes in the generalized Fisher index with application to embodied emission studies. Energy 2014, 69, 778–786. [Google Scholar] [CrossRef]
  57. Su, B.; Ang, B.W. Multiplicative decomposition of aggregate carbon intensity change using input-output analysis. Appl. Energy 2015, 154, 13–20. [Google Scholar] [CrossRef]
  58. Su, B.; Ang, B.W. Multiplicative structural decomposition analysis of aggregate embodied energy and emission intensities. Energy Econ. 2017, 65, 137–147. [Google Scholar] [CrossRef]
  59. Lyu, W.; Li, Y.; Guan, D.; Zhao, H.Y.; Zhang, Q.; Liu, Z. Driving forces of Chinese primary air pollution emissions: An index decomposition analysis. J. Clean. Prod. 2016, 133, 136–144. [Google Scholar] [CrossRef]
  60. Mukhopadhya, K. A structural decomposition analysis of air pollution from fossil fuel consumption in India. Environ. Pollut. 2002, 18, 486–491. [Google Scholar]
  61. Zhang, Y.X.; Wang, H.K.; Liang, S.; Xu, M.; Zhang, Q.; Zhao, H.Y.; Bi, J. A dual strategy for controlling energy consumption and air pollution in China’s metropolis of Beijing. Energy 2015, 81, 294–303. [Google Scholar] [CrossRef]
  62. Zhang, W.; Wang, J.; Zhang, B.; Bi, J.; Jiang, H. Can China comply with its 12th five-year plan on industrial emissions control: A structural decomposition analysis. Environ. Sci. Technol. 2015, 49, 4816–4824. [Google Scholar] [CrossRef] [PubMed]
  63. Liu, Q.L.; Wang, Q. How China achieved its 11th Five-Year Plan emissions reduction target: A structural decomposition analysis of industrial SO2 and chemical oxygen demand. Sci. Total Environ. 2017, 574, 1104–1116. [Google Scholar] [CrossRef] [PubMed]
  64. Nehorai, A.; Morf, M. Estimation of time difference of arrivals for multiple ARMA sources by a pole decomposition method. In Proceedings of the IEEE Conference on Decision and Control, Orlando, FL, USA, 8–10 December 1982; IEEE: Piscataway, NJ, USA, 1982; pp. 1000–1002. [Google Scholar]
  65. Su, B.; Huang, H.C.; Ang, B.W.; Zhou, P. Input–output analysis of CO2 emissions embodied in trade: The effects of sector aggregation. Energy Econ. 2010, 32, 166–175. [Google Scholar] [CrossRef]
  66. Zhao, B.; Wang, S.X.; Dong, X.Y.; Wang, J.D.; Duan, L.; Fu, X.; Hao, J.M.; Fu, J. Environmental effects of the recent emission changes in China: Implications for particulate matter pollution and soil acidification. Environ. Res. Lett. 2013, 8, 024031. [Google Scholar] [CrossRef]
  67. Zhao, B.; Wang, S.X.; Wang, J.D.; Fu, J.S.; Liu, T.H.; Xu, J.Y.; Fu, X.; Hao, J.M. Impact of national NOx and SO2 control policies on particulate matter pollution in China. Atmos. Environ. 2013, 77, 453–463. [Google Scholar] [CrossRef]
  68. Zhao, B.; Wang, S.X.; Liu, H.; Xu, J.Y.; Fu, K.; Klimont, Z.; Hao, J.M.; He, K.B.; Cofala, J.; Amann, M. NOx emissions in China: Historical trends and future perspectives. Atmos. Chem. Phys. 2013, 13, 9869–9897. [Google Scholar] [CrossRef] [Green Version]
  69. Wang, Z.H.; Lu, M.L.; Wang, J.C. Direct rebound effect on urban residential electricity use: An empirical study in China. Renew. Sustain. Energy Rev. 2014, 30, 124–132. [Google Scholar] [CrossRef]
  70. Cai, S.Y.; Wang, Y.J.; Zhao, B.; Wang, S.X.; Chang, X.; Hao, J.M. The impact of the “Air Pollution Prevention and Control Action Plan” on PM2.5 concentrations in Jing-Jin-Ji region during 2012–2020. Sci. Total Environ. 2017, 580, 197–209. [Google Scholar] [CrossRef] [PubMed]
  71. Xu, S.C.; He, Z.X.; Long, R.Y.; Chen, H. Factors that influence carbon emissions due to energy consumption based on different stages and sectors in China. J. Clean. Prod. 2016, 115, 139–148. [Google Scholar] [CrossRef]
  72. Wang, W.W.; Zhang, M.; Zhou, M. Using LMDI method to analyze transport sector CO2 emissions in China. Energy 2011, 36, 5909–5915. [Google Scholar] [CrossRef]
  73. Wang, H.; Ang, B.W.; Su, B. Assessing drivers of economy-wide energy use and emissions: IDA versus SDA. Energy Policy 2017, 107, 585–599. [Google Scholar] [CrossRef]
  74. Mao, X.; Zhou, J.; Corsetti, G. How well have China’s recent Five-Year Plans been implemented for energy conservation and air pollution control? Environ. Sci. Technol. 2014, 48, 10036–10044. [Google Scholar] [CrossRef] [PubMed]
  75. Xue, B.; Mitchell, B.; Geng, Y.; Ren, W.; Müller, K.; Ma, Z.; Puppim de Oliveira, J.A.; Fujita, T.; Tobias, M. A review on China’s pollutant emissions reduction assessment. Ecol. Indic. 2014, 38, 272–278. [Google Scholar] [CrossRef]
  76. Yang, H.; Flower, R.J.; Thompson, J.R. Sustaining China’s water resources. Science 2013, 339, 141. [Google Scholar] [CrossRef] [PubMed]
  77. Xie, S.H.; Cai, H.Y.; Xia, G.X. Calculation of the carbon emissions of Chinese transportation industry and the driving factors. J. Arid Land Resour. Environ. 2016, 30, 13–18. (In Chinese) [Google Scholar]
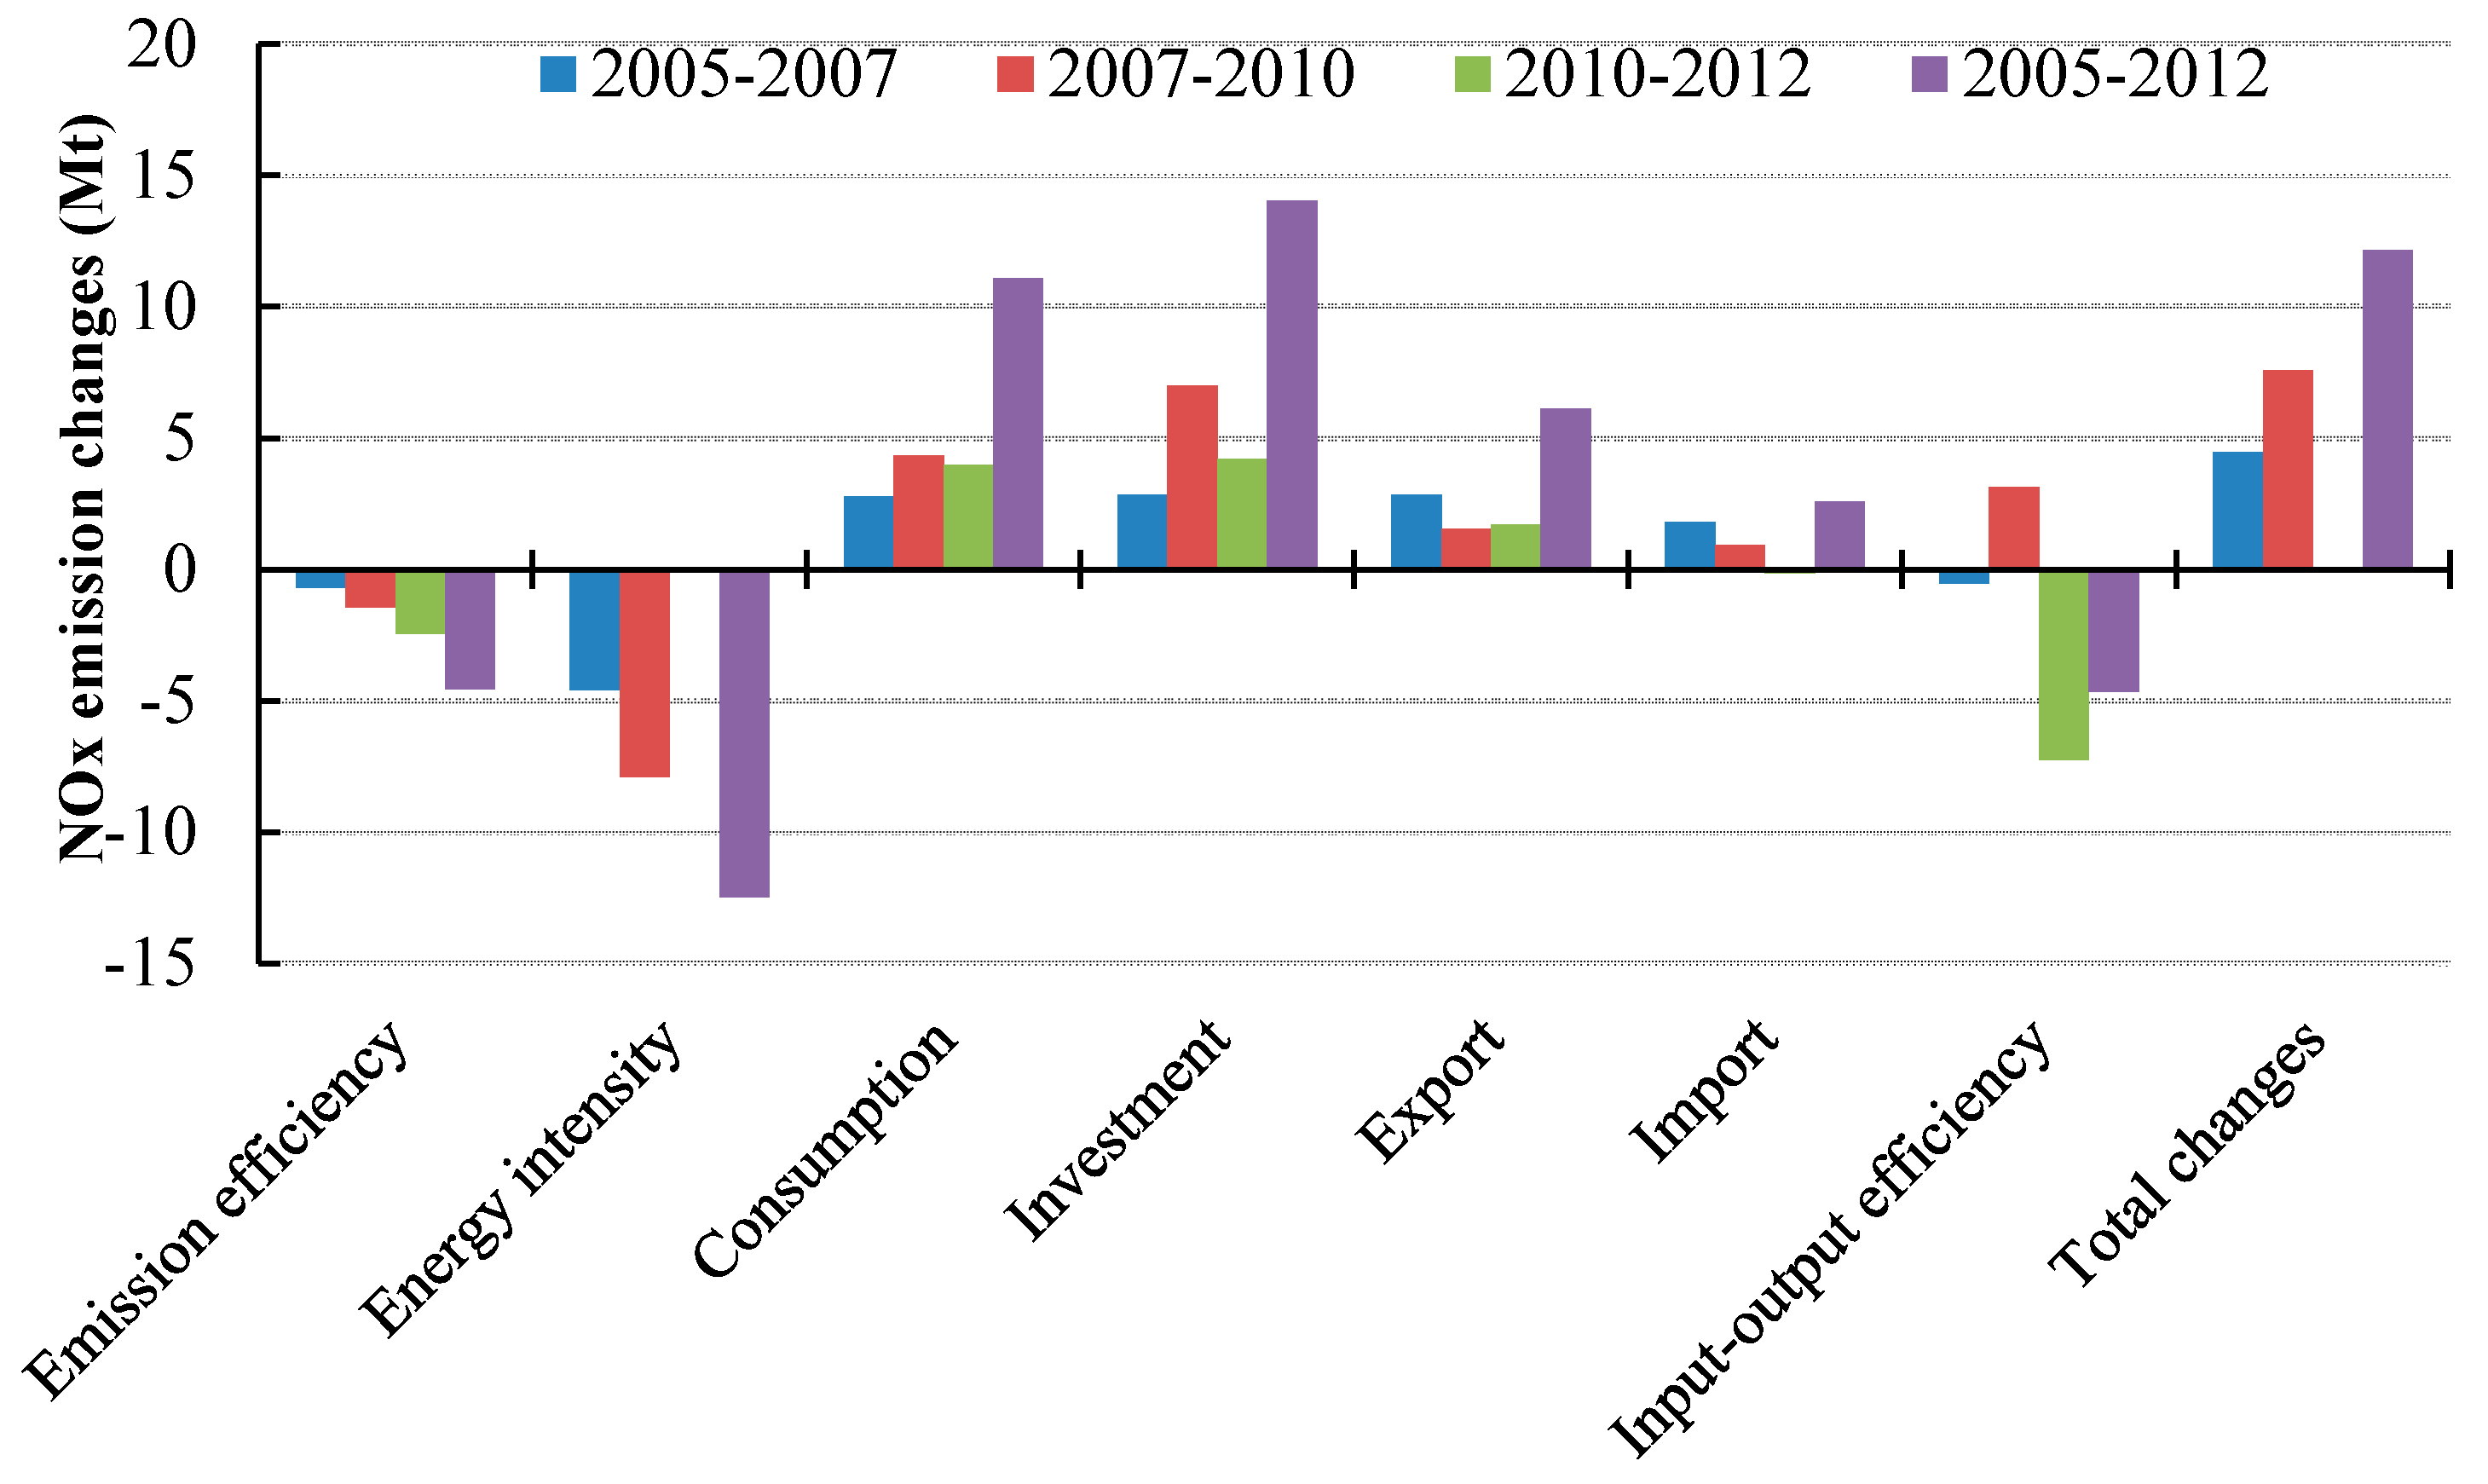
Figure 1. The structural decomposition results of NOx emission changes in China from 2005 to 2012.
Sustainability 09 01742 g001
Figure 2. The structural decomposition results of PM2.5 emission changes in China from 2005 to 2012.
Sustainability 09 01742 g002
Figure 3. The structural decomposition results of SO2 emission changes in China from 2005 to 2012.
Sustainability 09 01742 g003
Table 1. Non-competitive economy-energy-air pollutant emissions input-output table.
Intermediate UseFinal Demand (Y)Total Output
ConsumptionCapital AccumulationExport
Domestic intermediate inputÛ A XÛ CÛ KEXPX
ImportsIMP
Added valueV
Total inputXT
Energy intensityE
Air pollutant emissionsQT = ê·Ê·X
Table 2. Definition of the variables in Table 1.
VariableDefinition
ADirect input-output coefficient matrix
ÛDiagonal matrix of the ratio of domestic supply
impImport intermediate input
XTotal output vector
CConsumption vector
KCapital accumulation vector
EXPExport vector
IMPImport vector
VAdded value vector
XTTotal input vector (Transport matrix of X)
ERow vector of energy intensity
ÊDiagonal matrix of energy intensity (Diagonal matrix of E)
êDiagonal matrix of emissions efficiency
QTAir pollutant emissions matrix (Transpose matrix of Q)
A · XColumn vector of intermediate use
Yfinal demand, which includes the vectors of C, K, and EX