Article

Non-parametric Methods for Soil Moisture Retrieval from Satellite Remote Sensing Data

1
NOAA-Cooperative Remote Sensing Science & Technology Center (NOAA-CREST), City University of New York, NY 10031 USA
2
American University in Dubai P.O. Box: 28282 Dubai, United Arab Emirates
3
Co-operative Institute for Research in the Atmosphere (CIRA), Colorado State University, Fort Collins, CO 80521 USA
*
Author to whom correspondence should be addressed.
Remote Sens. 2009, 1(1), 3-21; https://doi.org/10.3390/rs1010003
Submission received: 20 February 2009 / Revised: 24 March 2009 / Accepted: 25 March 2009 / Published: 27 March 2009
(This article belongs to the Special Issue Microwave Remote Sensing)

Abstract

:
Satellite remote sensing observations have the potential for efficient and reliable mapping of spatial soil moisture distributions. However, soil moisture retrievals from active microwave remote sensing data are typically complex due to inherent difficulty in characterizing interactions among land surface parameters that contribute to the retrieval process. Therefore, adequate physical mathematical descriptions of microwave backscatter interaction with parameters such as land cover, vegetation density, and soil characteristics are not readily available. In such condition, non-parametric models could be used as possible alternative for better understanding the impact of variables in the retrieval process and relating it in the absence of exact formulation. In this study, non-parametric methods such as neural networks, fuzzy logic are used to retrieve soil moisture from active microwave remote sensing data. The inclusion of soil characteristics and Normalized Difference Vegetation Index (NDVI) derived from infrared and visible measurement, have significantly improved soil moisture retrievals and reduced root mean square error (RMSE) by around 30% in the retrievals. Soil moisture derived from these methods was compared with ESTAR soil moisture (RMSE ~4.0%) and field soil moisture measurements (RMSE ~6.5%). Additionally, the study showed that soil moisture retrievals from highly vegetated areas are less accurate than bare soil areas.

Graphical Abstract

1. Introduction

In a remote sensing context, soil moisture represents the amount of water in the top layer (5 to 10 cm) of the soil surface. The temporal and spatial variations of soil moisture are needed in many hydrological modeling processes [1,2]. Conventional field measurement techniques have serious limitations in their ability to appropriately estimate the spatial distribution of soil moisture, particularly over large areas that are characterized by soil surface heterogeneity [3]. Most hydrological models require soil moisture information and use point measurements or spatial distributed soil moisture values derived from physically-based land surface models [1,2,4,5,6]. Presently, however, spatial distributions of high resolution soil moisture estimates are being used as input to hydrological models to predict the runoff [2,7,8]. Having an accurate estimation of soil moisture with acceptable spatial and temporal resolutions is indispensable for efficient hydrological modeling and improved soil wetness forecasts [9]. The scope and potential impacts climate change on flooding and drought cannot be adequately captured by ground soil moisture measurements alone [10]. It has, therefore, become necessary to use remote sensing capabilities in conjunction with ground-based observations in natural resource management and especially in water resources monitoring and forecasting [5,9,11].
A number of spaceborne active microwave missions such as ERS-1, ERS-2, JERS-1, SIR-C/X-SAR and RADARSAT-1 demonstrated that soil moisture in the upper ~5 cm of the surface can be measured from space. The launching of active microwave sensors such as the Advanced Scatterometer (ASCAT) on EUMETSAT’s Polar System METOP, Canadian RADARSAT-2, European SMOS, Indian Radar Imaging Satellite (RISAT), and the newly programmed NASA’s SMAP mission are expected to enhance the capability to remotely sense soil moisture over the next decades. The ASCAT scatterometer will be a continuation of the ERS scatterometer mission, and the METOP and SMOS will be the first operational satellite system dedicated to the retrieval of soil moisture [9].
Soil moisture retrieval using active microwave remote sensing involves the backscatter from the soil surface, which may be affected by vegetation canopy and soil moisture [12,13,14]. The surface vegetation modifies and attenuates the outgoing microwave radiation of the soil and adds to the complexity of acquiring accurate and realistic retrieval of soil moisture from satellite-based sensors [15,16]. The vegetation canopy affects the backscatter by contributing to the volume backscatter of the observed scene and by attenuating the soil component of the total backscatter [13,17]. The total amount of attenuation and backscatter depends on several vegetation parameters, such as, vegetation height, leaf area index (LAI), and vegetation water content (VWC). Indeed, the presence of tall and dense vegetation decreases the correlation between the backscatter and soil moisture [13,18].
Many researchers have used a linear regression model to simplify complex relationship between radar backscatter and soil moisture from a limited number of sample points [17,19,20,21,22,23,24,25,26,27,28,29]. These studies have shown that surface backscatter cannot be considered as a only source to retrieve soil moisture for vegetated soil surface. Therefore, vegetation characteristic such as NDVI are essential in soil moisture retrieval from backscatter data [1,30].
Due to the complex relationship between backscatter and soil moisture, non-parametric methods like neural networks and fuzzy logic were used to empirically ascertain the statistical relationship between soil moisture and backscatter in the presence of surface vegetation. These non-parametric methods are considered alternatives to the classical modeling techniques for hydrological and meteorological applications [31,32]. In remote sensing community, these tools are highly used for image classification and pattern recognition [31,33,34]. Since, these non-parametric methods exploit the statistical relationships between hydrologic inputs and outputs without explicitly considering the physical relationships that exist between them [35]. Relating to the philosophy of data modeling, important progress has been made in data fusion, i.e. the operation of combining information from multiple sensors and data sources, by eventually exploiting the potential of several alternative methods such as neural networks, fuzzy logic, and maximum likelihood methods. These techniques are data driven, and a functional relationship is determined based on some training datasets. In addition, non-parametric methods do not require any assumptions to be made about the fitness of the data [31,35].
In this paper, multiple regression, neural network, and fuzzy logic were used for spatial soil moisture retrieval using active microwave data. An attempt has been made to: (1) select the best input parameters to have significant improvement in soil moisture retrieval; (2) generate the multivariate model using regression analysis for soil moisture retrieval; (3) discuss the impact of internal parameters of neural network and fuzzy logic; and (4) compare the retrieved soil moisture by above methods; and (5) evaluate the effect of NDVI on the soil moisture retrieval.

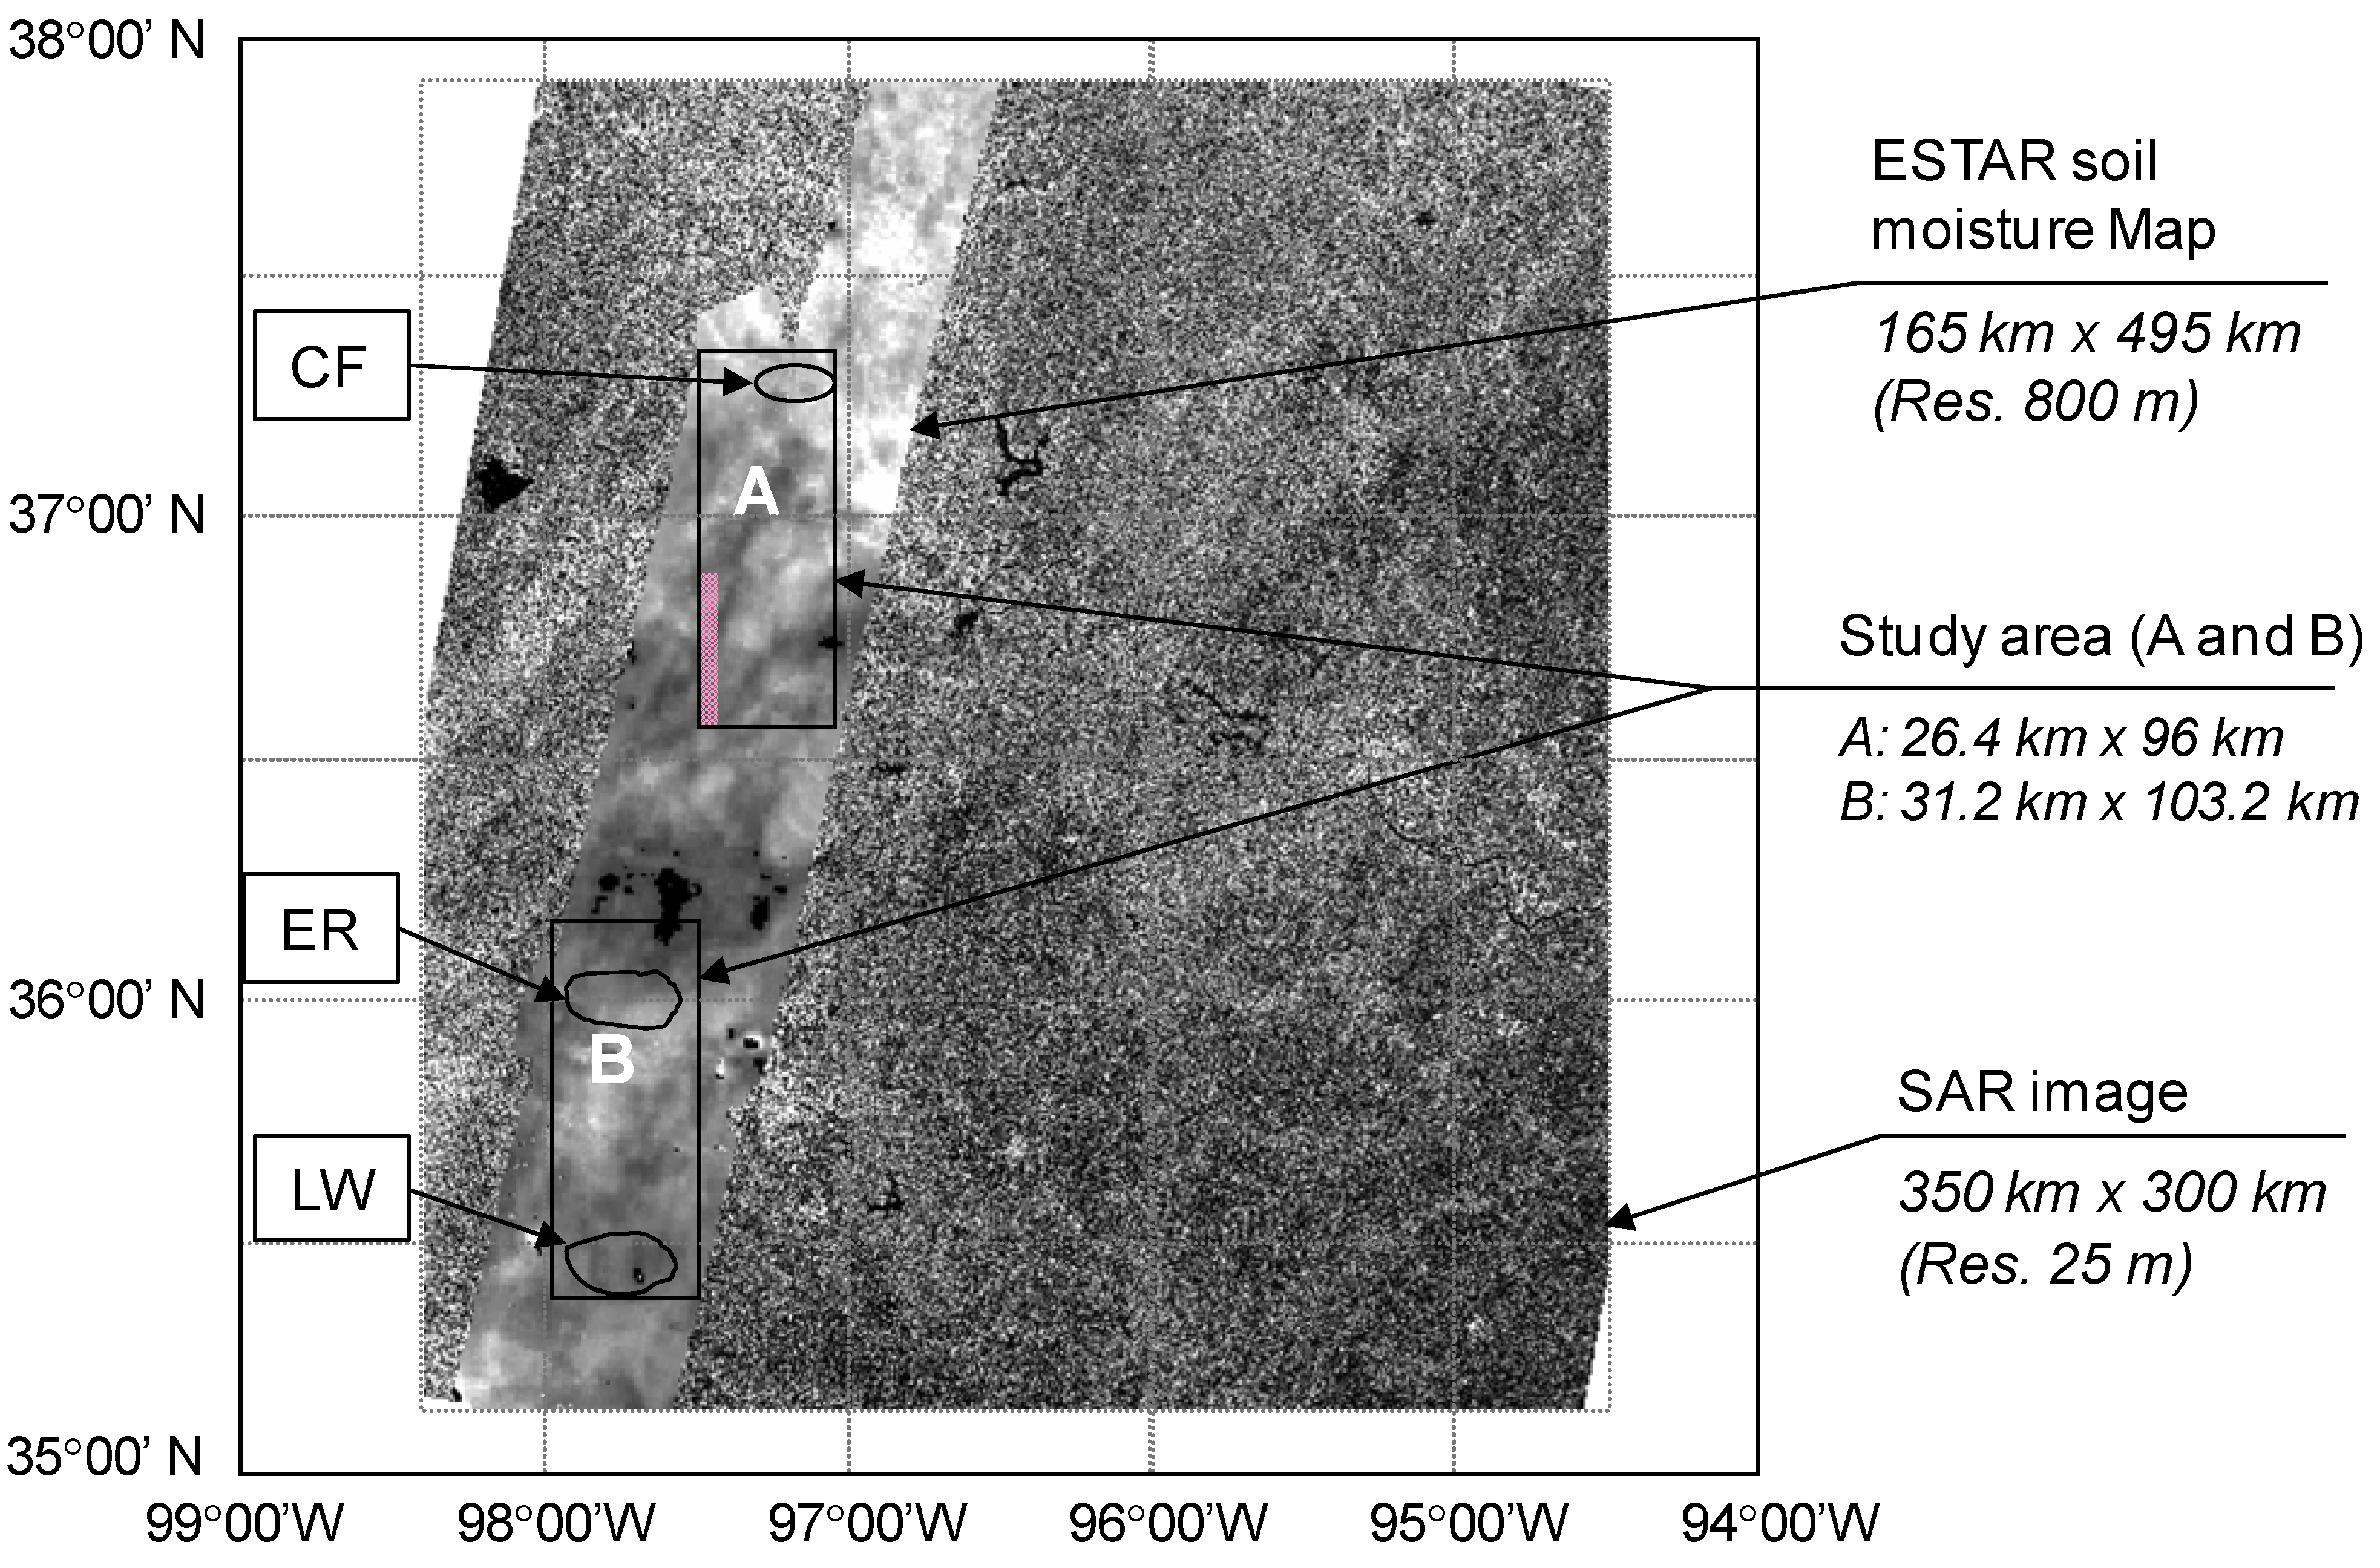
2. Study Area and Data Sets
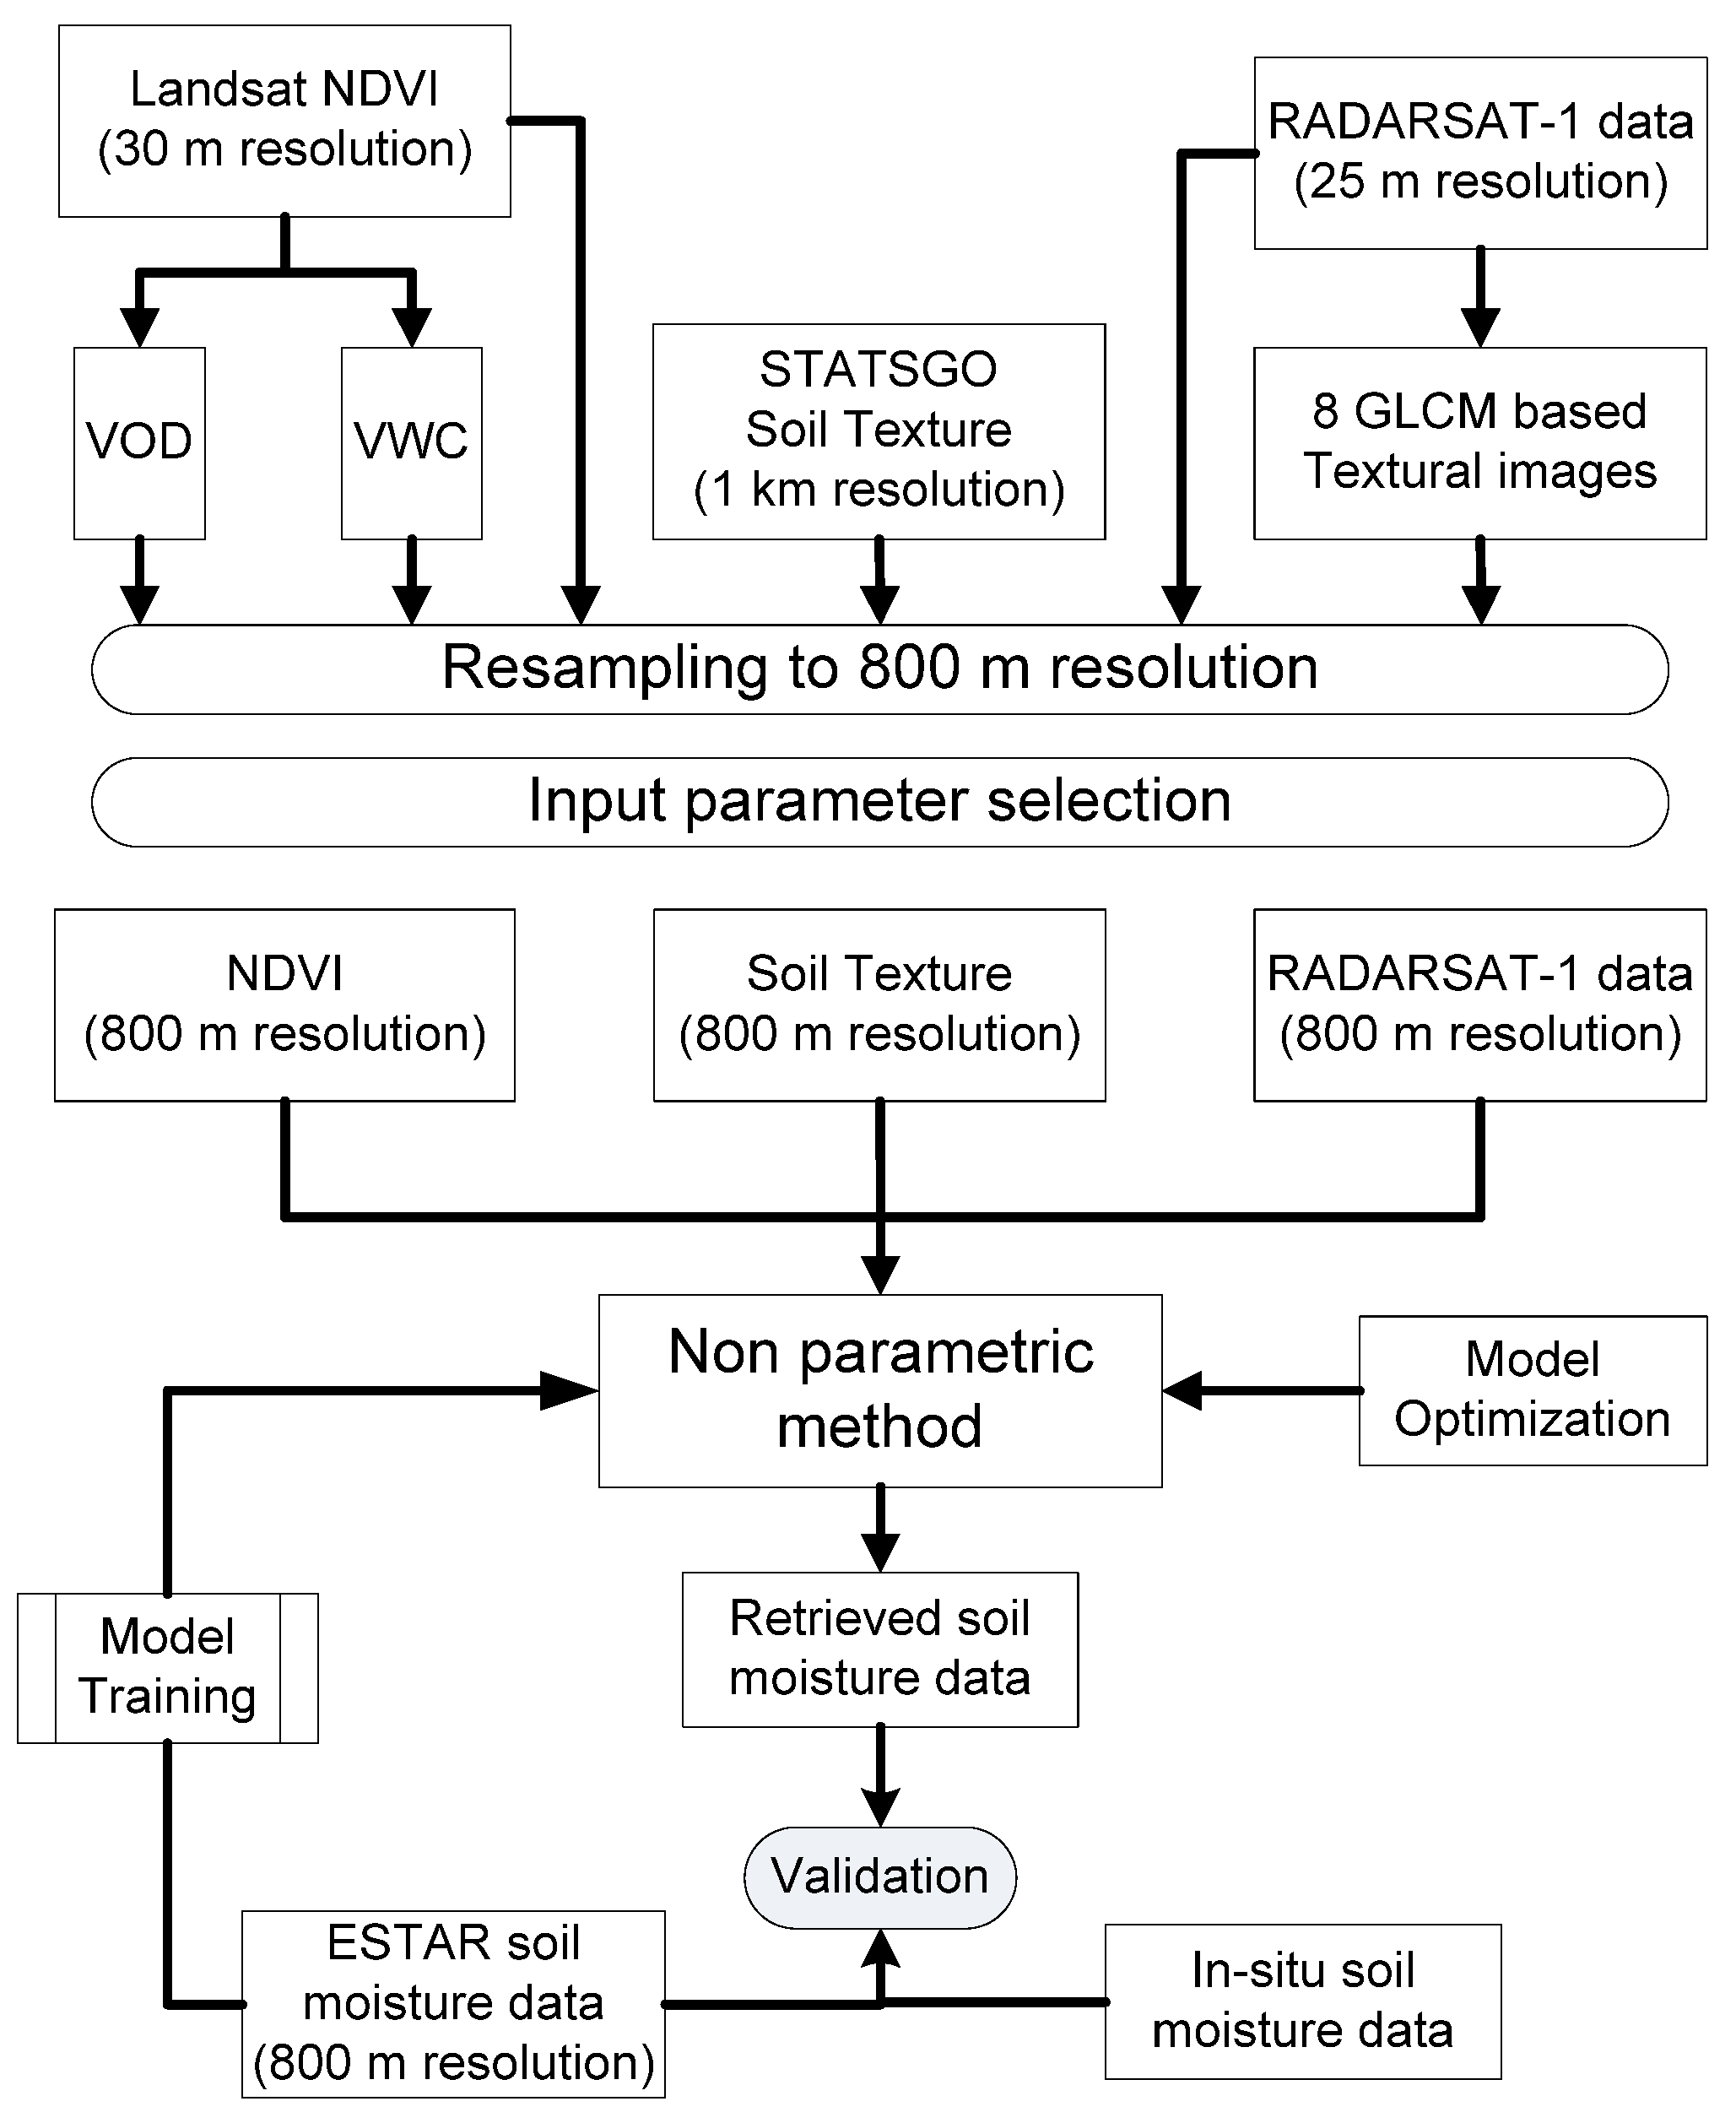
The study area is located in Oklahoma, USA (97°35’W, 36°15’N). This area was selected based on the availability of soil moisture measurements collected in 1997 during the Southern Great Plain Mission (SGP97). This mission was a large, interdisciplinary field campaign performed over a one month period (18 June–17 July) with the objective of testing previously established passive microwave - Electronically Scanned Thinned Array Radiometer (ESTAR) - based soil-moisture retrieval algorithms [1]. Soil moisture data, retrieved from L-band ESTAR instrument during the SGP97 experiment, were used in this study. The ESTAR derived soil moisture available in 800m x 800m resolution was validated with field measurements with RMSE of 4.8%. The technical details about the instruments and the methodology used in soil moisture field measurement can be found in [1].
Gravimetric soil moisture measurements of the surface layer have been taken from 50 sites distributed in Central facility (CF), El Reno (ER), and the Little Washita (WS) areas marked in Figure 1. For each sampling site an average of 14 samples of soil moisture were measured. The number of samples taken from each site varied based on heterogeneity of land surface. The sample location from each site was kept 100 m apart and spatially distributed within a grid size of approximately 800 square meters. Detailed information about SGP97 mission, geographical coordinates and methodology used to measure in situ soil moisture as well as other soil and land cover parameters can be found in Jackson et al. (1999) [1]. The relationship between ground measured soil moisture and backscatter is shown in Figure 2 for different vegetation covers for 2nd and 12th July 1997. The data shows better correlation between backscatter and soil moisture in the harvested field. However, there is no correlation observed in the vegetated field. The vegetation canopy may affect the backscatter by contributing to the volume backscatter of the observed scene and by attenuating the soil component of the total backscatter [17].
Figure 1. Field soil moisture measuring area: Central Facility (CF), El Reno (ER), and Little Washita (LW) placed on ESTAR derived soil moisture and RADARSAT backscatter image. Two study areas (A and B) are extracted from overlapping area.
Remotesensing 01 00003 g001
Soil classification data were acquired from the State Soil Geographic Database (STATSGO) of the USDA Natural Resources Conservation Service (NRCS), on a 1 km grid; the data were re-sampled using bi-linear interpolations (Geomatica Software) to 800 meters to match ESTAR resolution. The NDVI data were obtained from one Landsat TM image acquired on July 25, 1997. The NDVI values were originally calculated at 30 meter resolution, and then aggregated (average) to 800 meter resolution to match the soil moisture resolution. The vegetation optical depth (VOD is a function of vegetation water content and vegetation-b parameter) for each crop type was obtained from studies made by Jackson and Schmugge [14]. Vegetation water content was estimated from NDVI based on algorithm given in [1].
The active microwave, Synthetic Aperture Radar (SAR) backscatter data from RADARSAT-1 satellite was used in this study. With its C-band channel, the effective penetration depth of RADARSAT beam is shallower than 5 cm for highly wet soil and deeper than 5 cm for dry soil [4]. Two RADARSAT-1 images taken in SCANSAR Narrow Mode were acquired for July 2nd and July 12th, 1997. Two regions (A and B) were selected within the study area (Figure 1) for both the images. Region A covers 26.4 km x 96 km (2534.4 km2) and region B covers 31.2 km x 103.2 km (3220.0 km2).
Textural features extracted using Grey Level Co-occurrence Matrix computation is used commonly in land cover classification [36,37,38] and sea ice detection [39,40]. In this study, we explored the use of textural features by using then as inputs to multiple regression, neural network and fuzzy logic for soil moisture retrieval. Eight textural images (Homogeneity, Contrast, Dissimilarity, Mean, Variance, Entropy, Angular Second Moment, and Correlation) were extracted from the RADARSAT backscatter data using Grey Level Co-occurrence Matrix [36,38].
Figure 2. SAR backscatter v/s field measured soil moisture for different vegetation covers for (a) 2nd July 1997 and (b) 12th July 1997 data, show better correlation in harvested field than vegetated field.
Remotesensing 01 00003 g002
Figure 3. Flow chart of steps performed for soil moisture retrieval using non parametric method.
Remotesensing 01 00003 g003

3. Methodology

3.1 Input Variable Selection approach

The potential inputs (discussed in Section 2 and given in Table 1) that affect soil moisture retrievals can be better understood by techniques like neural network, fuzzy logic, and multiple regression models where more than one input can be automatically weighted and tested. The identification of important and redundant inputs is a critical issue that leads to reduced size of problem, faster training, and possibly more accurate results [41]. The flow chart displaying all necessary steps performed for soil moisture retrieval using these non parametric method is shown in Figure 3. The model sensitivity is estimated by measuring the change of RMSE when an input variable is added (or deleted) from the models. These models run 25 times and estimated RMSE is then compared using a statistical significant test (two sample t-test) at the 95% confidence limit. The t statistic for testing whether the means are significantly different can be calculated as follows:
t = X ¯ 1 X ¯ 2 S X 1 X 2 . 2 n ,  where ,   S X 1 X 2 = S X 1 2 + S X 2 2 2
where, S X 1 X 2 , the standard deviation of RMSE results from 25 runs for test each input configurations. The estimated t value was compared with 95% confidence interval using t-distribution.
Table 1. Table shows type of data used in this study.
Sr. No.DataData SourceSpatial Resolution
1Active microwave SAR dataRADARSAT-1 images25 m * 25 m (aggregated to 800 m * 800 m)
2Soil moistureESTAR based brightness temperature800 m * 800 m
3Soil moistureField MeasurementPoint measurements
4Normalized Difference Vegetation Index (NDVI)Landsat images (Visible and Near Infrared band)30 m * 30 m (aggregated to 800 m * 800 m)
5Vegetation Water Content (VWC)Algorithm given by Jackson et al (1999) using NDVI800 m * 800 m
6Vegetation Optical Depth (VOD)Algorithm given in Jackson et al (1999) using NDVI800 m * 800 m
7SAR textural images (Homogeneity, Contrast, Dissimilarity, Mean, Variance, Entropy, Angular Second Moment, and Correlation)RADARSAT-1 images25 m * 25 m (aggregated to 800 m * 800 m)
8Soil texture (percent of sand)STATSGO of USDA1 km * 1 km (re-sampled to 800 m * 800 m)
Initially, each input is individually used to train the models and then the RMSE of soil moisture retrieval is analyzed. The model trained with backscatter data was able to predict soil moisture with lower RMSE (4.857) using neural network than trained with other individual inputs. Similar trend also observed when multiple regression and fuzzy logic is used. The models were then trained in combination with two or more inputs such as textural images, VOD, VWC, NDVI, and soil characteristics.
To reduce the redundant inputs from the eight textural images generated using GLCM, a correlation matrix was estimated between all the textural images (Table 2). The idea of selection least correlated images is to have a relatively independent images. If the two images with high correlation means the data showing similar trend and which is redundant information The use of redundant data in neural network or fuzzy logic model, does not improve prediction accuracy, although increase the training duration. Therefore we decided to reduce the number of textural data as an input to these models. Based on correlation matrix, the three least correlated (independent) textural images: mean, variance, and homogeneity, were retained as inputs to the multiple regression analysis, neural network and fuzzy logic models. Further analysis showed that overall effect of the additional input of textural images (mean, variance, and homogeneity) to the models for soil moisture accuracy was not significant using t-test at the 95% confidence limit.
Significant (using t-test) reduction in RMSE was observed only NDVI and soil characteristics were used along with backscatter data, shows that the soil moisture retrieval process is sensitive to the vegetation and soil characteristics. When NDVI was added to the backscatter in the input layer, the accuracy in the soil moisture estimate improved. However, no significant improvement was observed by adding VOD and VWC to an already existing NDVI in the neural network input layer. This can be explained by the indirect relationship between VOD and VWC with NDVI [1]. Based on thorough analysis of several runs of the neural network, fuzzy logic and multiple regression models, we identified backscatter, NDVI and soil characteristics, as critical inputs that are more sensitive to the soil moisture retrieval.
Table 2. Correlation matrix of SAR textural images generated using Grey Level Co-occurrence Matrix. Three least correlated (independent) textural images: mean, variance, and homogeneity, were retained as inputs to the models.
Textural imagesHomogeneityContrastDissimilarityMeanVarianceEntropyAS-MomentCorrelation
Homogeneity10.6470.8480.3030.0530.9490.8700.544
Contrast0.64710.9480.3080.4130.7000.4810.565
Dissimilarity0.8480.94910.0890.3020.8680.6670.612
Mean0.3030.3080.08910.1940.2520.3240.152
Variance0.0530.4130.3020.19410.2980.0960.509
Entropy0.9490.7000.8680.2520.29810.8590.372
AS Moment0.8700.4810.6670.3240.0960.85910.337
Correlation0.5440.5650.6120.1520.5090.3720.3371
The total available in-situ soil moisture measurements corresponding to the active microwave data taken on 2nd and 12th July (76 data points) were used to train the models. However, we observed high RMSE error (9.50) between retrieved soil moisture at 10 jackknifed soil moisture data points. This high RMSE can be attributed to less data points, which were not enough to train the neural network and fuzzy logic models. Also, as shown in Figure 2, there is low correlation between in-situ soil moisture and backscatter under vegetated area. Therefore, soil moisture data [1] derived using ESTAR were used instead of the in-situ soil moisture measurements. The models were then tested for areas A and B of backscatter images taken on July 02 and July 12 using independent pixels which were not used in training the process.
The proper selection of training data is a crucial step in achieving best results for training samples that adequately represent all soil moisture classes and all land cover types. In order to increase the training efficiency these non-parametric methods, a Jack-Knifing technique was applied to ensure an independent validation of the trained models [42]. The Jack-Knifing technique uses an iterative cross validation approach that repeatedly keeps a single independent observation for validation and uses the remaining ones for training. This ensures that the validation is unbiased since the process will not be exposed to the validation point during the training process.

3.2 Multiple Regression Analysis
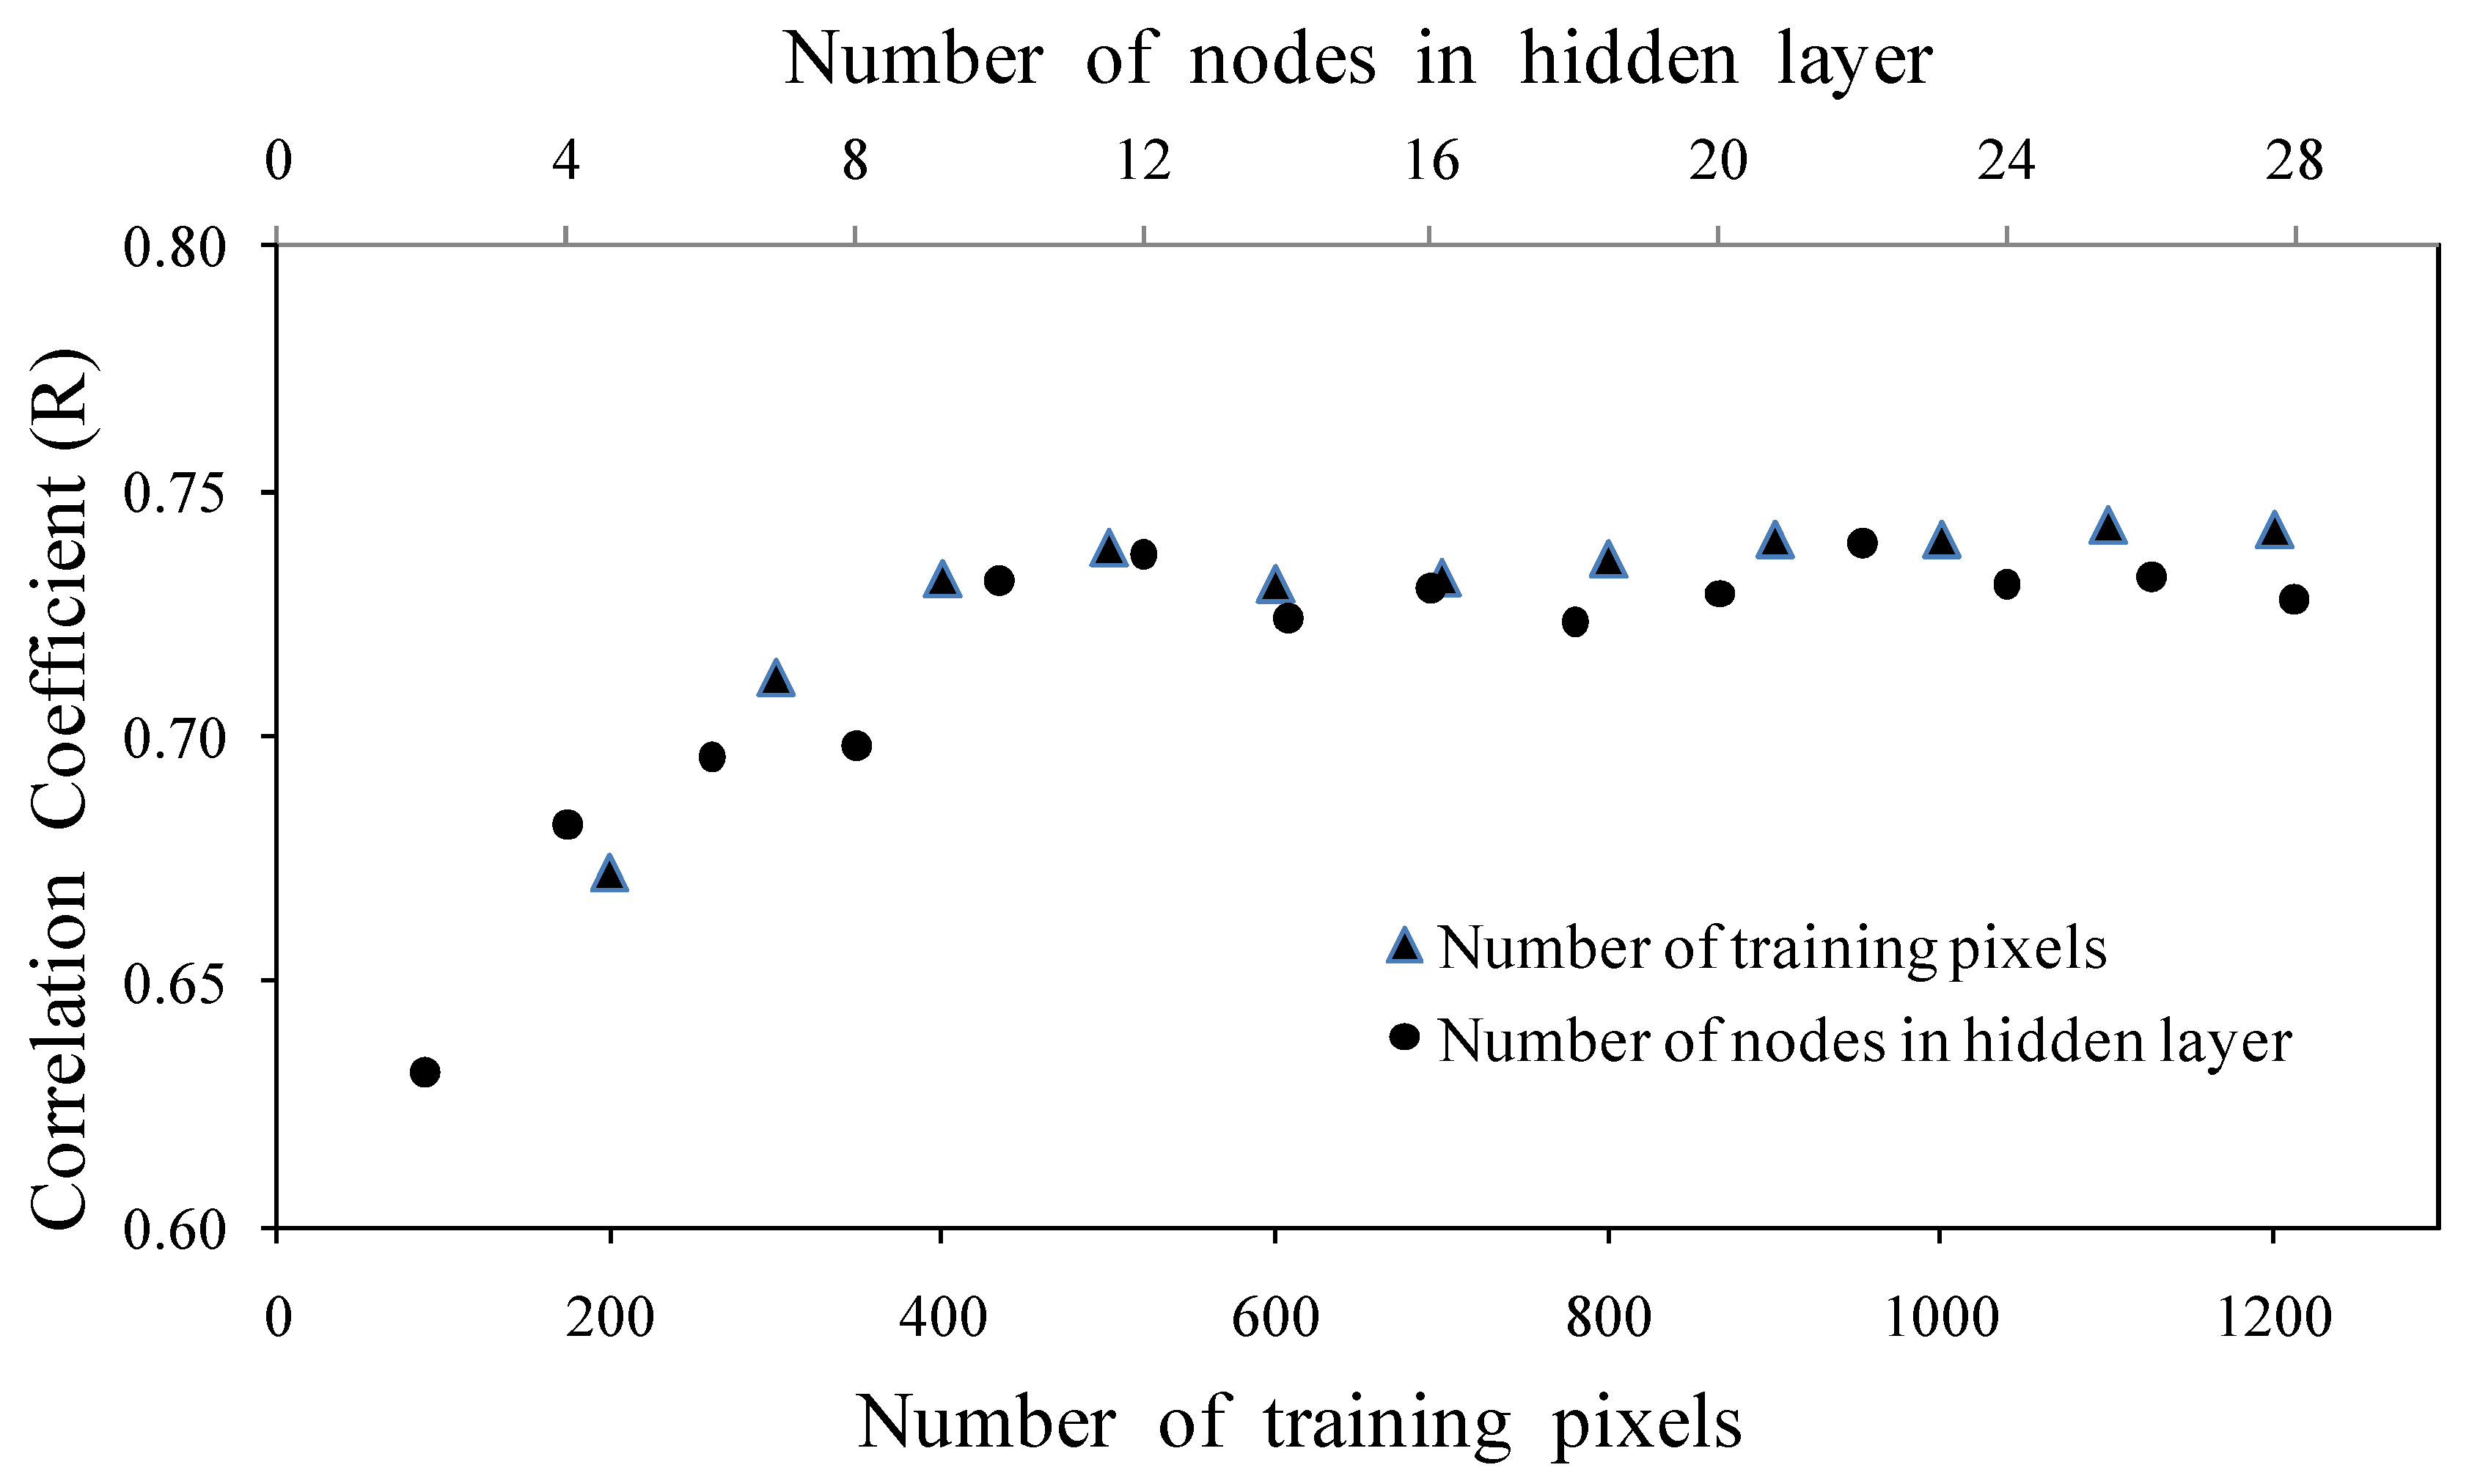
The multiple regression analysis is used to generate the multivariable model. Multiple regression analysis is extensions of simple linear regression that treats more than one independent variable to form a relative predictive model of the independent variables by creating beta weights. Multiple regressions can establish a set of independent variables having a fraction of the variance in a dependent variable at a significant level. Curvilinear effects can be explored by adding independent variables as a power term in the model. Interaction effects can be tested by adding the cross-product terms of independent variables [43,44]. There are a number of software tools such as random forest [45], See5/C5.0 [46], SPSS, SAS, SYSTAT, R, [47] and Matlab Toolbox that can be used for multiple regression analysis to generate multivariable model. In this study, we used Matlab Toolbox to generate multivariable model for soil moisture retrieval.
The basic procedures in multiple regression analysis involve (A) identifying an initial model, (B) iteratively altering the initial model by adding or dropping an independent variable in agreement with the "significant test criteria", and (C) terminating the search when stepping is no longer possible given the significant test criteria, or when a specified maximum number of steps have been reached [44]. The data fitting in multiple regression is tested by correlations (R2 values) for the observed versus predicted values and an overall test of significance. The test of significance is done by: (1) a standardized regression coefficient (b if all variables are standardized), (2) a t value, and (3) a p value associated with the t value. The multiple correlations R2, associated with the regression model, is the percent of the variance in the dependent variable explained collectively by all of the independent variables [44].
In this study, we used multiple regression analysis was used with soil moisture as the dependent variable and backscatter, NDVI, VOD, soil texture, and textural images as independent variables. The model coefficients were estimated based on numerous runs (100) of the multiple regression analysis using random selection of data to find meaningful patterns. Thus equation below was derived, where volumetric soil moisture (Mv) is:
Mv (%) = 0.313 (σ0) + (4.471 * NDVI) – 8.50 * PS
where, σ 0 is backscattering in digital numbers and PS is the percent of sand.

3.3 Neural Network

Neural networks have been applied to a wide range of problems in remote sensing and have produced improved accuracy when compared to traditional statistical methods. The rapid increase of neural network applications in remote sensing is due mainly to its ability to perform more accurately than other classification techniques [35,48,49,50]. A neural network is a highly interconnected system of simple processing elements (called nodes) designed to mimic the highly parallel human biological neurons. These nodes are usually organized into a sequence of fully connected layers. The strength of these connections is given through the connecting weights of the network [51]. Each node calculates a summation of weighted inputs and then outputs its transfer function value to other nodes. There are two main phases in the operation of a network: training, and validation. Training is the process of adapting the connection weights in response to the training data presented at the input layer and the desired response at the output layer. This learning phase is an iterative process which continues until the neurons have reached a convergence stage to the second set of training data. Thus the second test of training phase is used to avoid the overtraining of the neural network by monitoring the error. Validation is then used to assess the performance of the trained neural network via the input vector and the created response at the output layer.
One of the major concerns in the neural network training process is the overtraining [52]. When overtraining occurs, the neural network’s generalization ability will be compromised and the classification space becomes narrowly defined around the training pixels [53]. A large training dataset provides the network with a large number of scenarios for better generalization. Often, the increase in the number of training pixels increases the training time, so it is necessary to find out the optimum size of the training set. Furthermore, the training data must represent the entire range of values associated with a particular class [31].
The selection of number of training pixels was decided based model trained 25 times with pixels varies from 100 to 1,200 with increments of 100 pixels. The correlation coefficient of estimated soil moisture using trained model were compared (Figure 4) to decide the appropriate number of training pixels. After 25 successive runs of the same network, the analysis showed that by increasing the number of training pixels, it is possible to achieve a slightly higher accuracy on validation pixels, as shown in Figure 4. However, once the size of training data reaches maturity, no significant increase in accuracy was observed. The difference between training and validation accuracy was reduced by increasing the number of training pixels since a larger training dataset improves the generalization of network with wide range of experience. Moreover, a large training dataset has less variation in the retrieval accuracy during multiple runs of same network. Based on Figure 4, we used 500 data points of soil moisture data [1] derived using ESTAR for training these models.
When a single hidden layer is used, the number of nodes should be greater than the number of input data layers to get reliable results (Figure 4). For the training dataset no improvement was found by increasing the number of nodes to more than six times of the number of input nodes. Based on this optimization process, it was determined that there was no apparent advantage for using multi-hidden-layer networks instead of single-hidden-layer networks for our data. Therefore, a single hidden layer network structure was used to predict the soil moisture. The network architecture 3:10:1 (Input layer: Hidden nodes: Output layer) was used to train the network with normalized values of soil moisture.

3.4 Fuzzy Logic

Fuzzy set theory linguistic approach is an approximate and effective means of describing the behavior of systems that are imprecise and vague, and too complex to be analyzed with precise mathematical approaches. Fuzzy systems provide a computational framework in which linguistic knowledge is expressed in the form of fuzzy IF-THEN rules [54,55]. A typical Fuzzy system includes the processes of fuzzification, inference system, and defuzzification. Fuzzification involves the process of transforming crisp values of image data into grades of membership in linguistic terms. The fuzzy inference system is based on the concepts of fuzzy set theory, fuzzy if-then rules, and fuzzy reasoning. Defuzzification involves the process of transposing the fuzzy crisp outputs in the form of image data. The fuzzy logic technique has been used in many image classification applications [32,56,57]. The advantage of fuzzy logic over traditional and non-traditional classification techniques is its suitability and ability to deal with uncertainty and imprecision in a decision-making process, and thus offers a new approach for classifying remotely sensed images [32,56,57].
In this study, a subtractive clustering technique (Fuzzy Logic Method) was used to predict the soil moisture from backscatter and then compare the results to the neural network system’s output. The genfis2 algorithm provided by the MATLAB® software uses a subtractive clustering method to generate a Fuzzy Inference System (FIS). The genfis2 function uses the subclust function to estimate the antecedent membership functions and a set of rules. The subclust function assumes that each data point is a potential cluster center and then calculates a measure of the likelihood that each data point would define the cluster center based on the density of surrounding data points (MATLAB Toolbox, 2004). The first cluster center having the highest potential was selected from the data points. The data points under the radii of the cluster center were marked. To find the next cluster, all the points from the radii of the first cluster were removed and a new search for points having the highest potential to become the next cluster center starts. This iterative process continues until all the data are within a radius of the cluster center. The radius used for marking is a value varied between zero and one. The small radii values generally results in finding a few large clusters as shown in Figure 5. In this study, the fuzzy model was run several times for various radius values with randomly selected datasets to find the optimum cluster radius value. Based on several runs the optimum cluster radius was found to be about 0.45. The fuzzy logic has been applied to various potential input parameters such as backscatter, NDVI, soil characteristics, and (GLCM) based textural images. Based on several runs of the fuzzy logic model, the retrieval process was found to be very sensitive to backscatter, NDVI and soil characteristics.
Figure 4. Effect of number hidden nodes in single hidden layer and training pixel on soil moisture retrieval accuracy.
Remotesensing 01 00003 g004
Figure 5. Effect of cluster radii on soil moisture retrieval accuracy for random datasets (SAR backscatter, NDVI and soil characteristics). The corresponding change in the number of clusters with radii is also shown.
Remotesensing 01 00003 g005

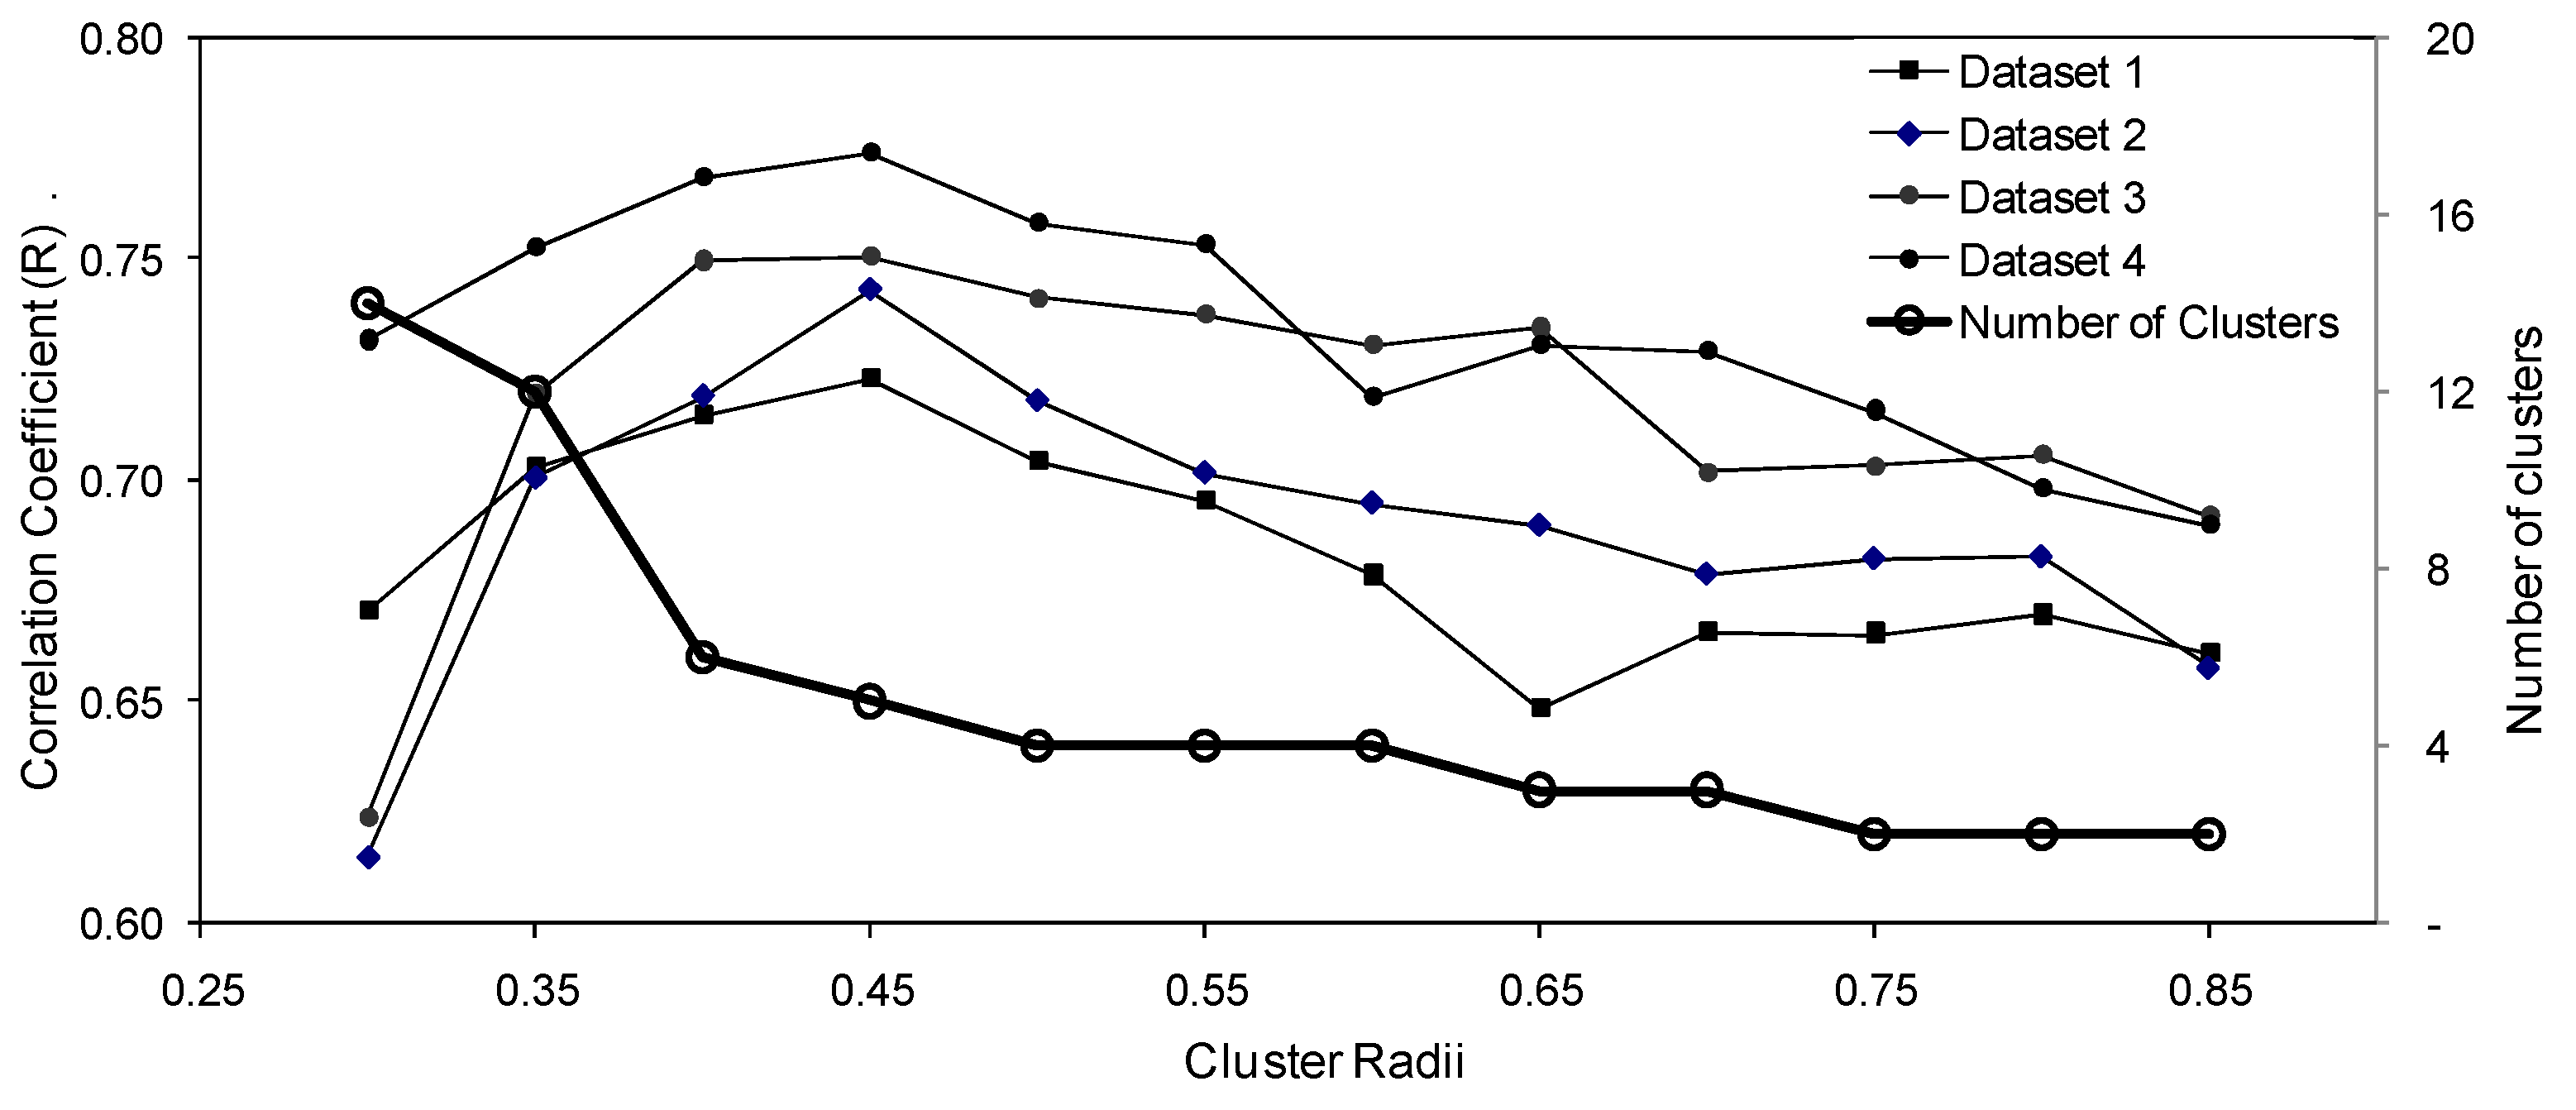
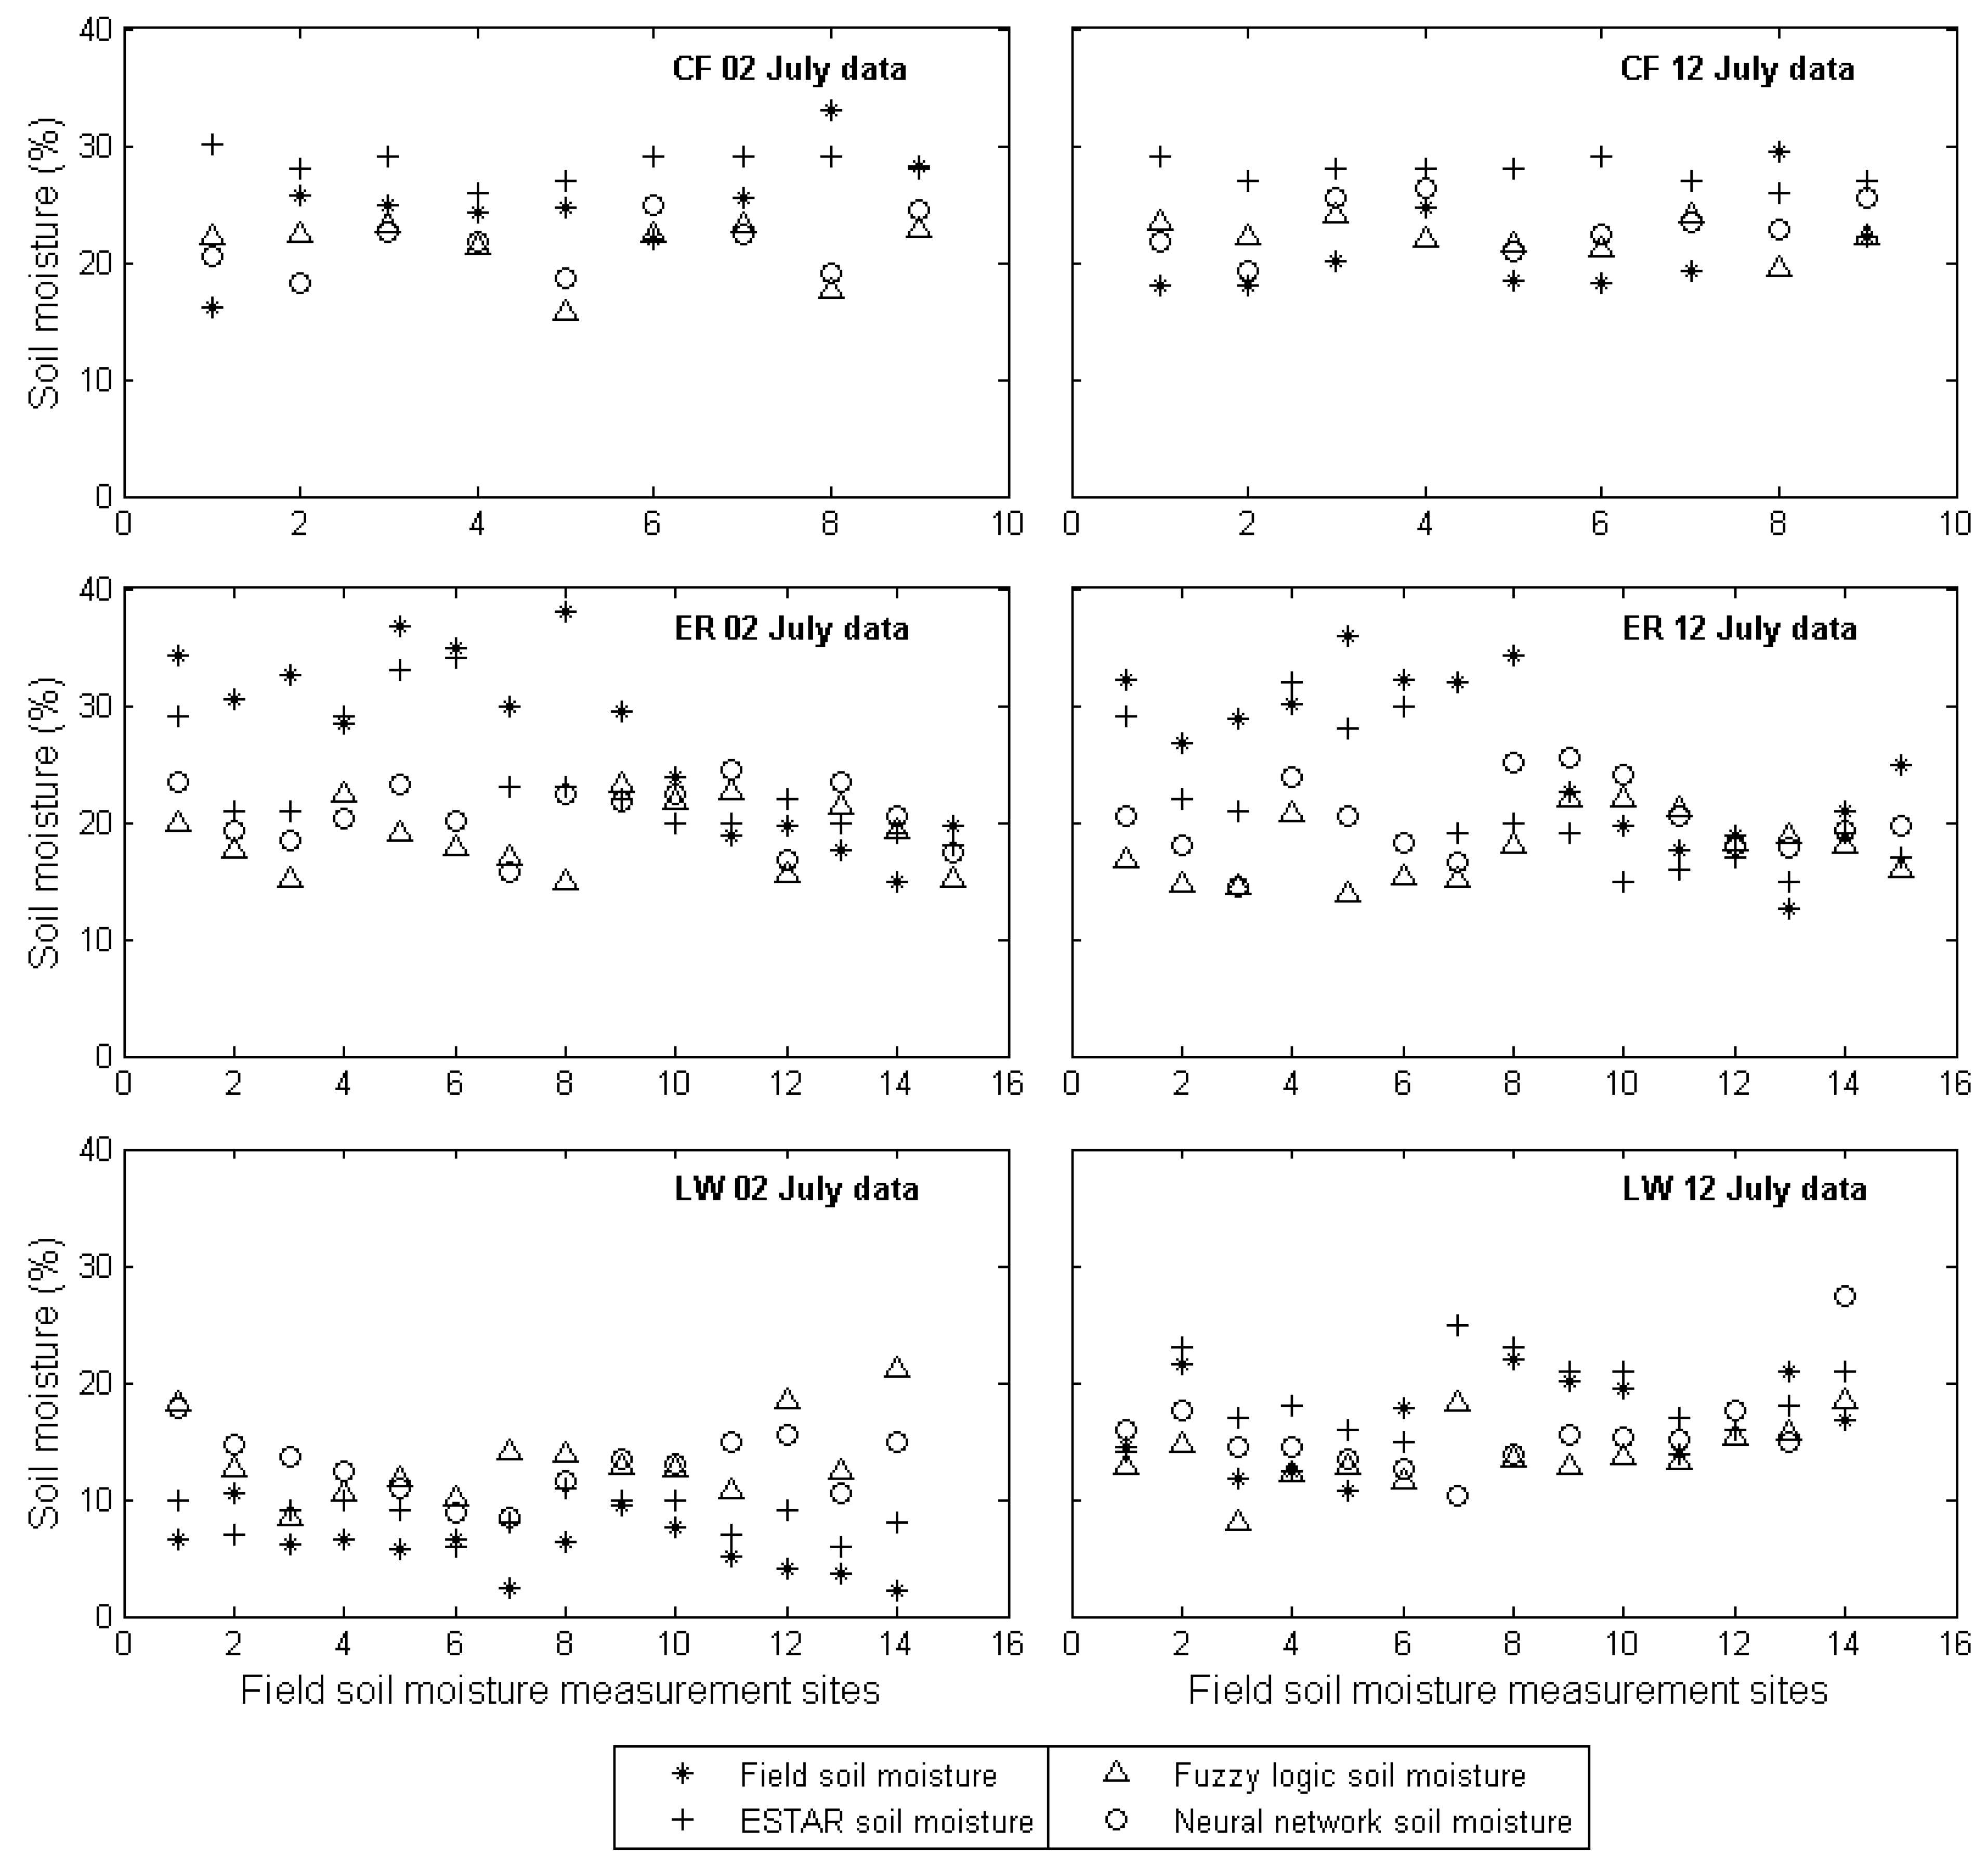
4. Results and Discussion

4.1 Comparison of Results

Multiple regression, neural network, and fuzzy logic methods were used with combinations of inputs; backscatter, soil characteristics, and NDVI. As discussed in Section 3-A, ESTER derived soil moisture data (500 pixels) from study area A of the July 12 image were used to train these models. These models were tested for areas A and B for backscatter images taken on July 02 and July 12. Independent pixels that were not used in training these models were used for validation for Area A of 12th July. Soil moisture data predicted by the neural network, fuzzy logic and multiple regression models were compared with two independent data sets: ESTAR derived soil moisture and field soil moisture measurements (Figure 6). The RMSE of values predicted and in-situ soil moisture measured at 38 field sites locations, in terms of soil moisture percentage, using neural network and fuzzy logic are 6.44 and 6.97 respectively. Lower RMSE was observed for Washita area (LW) compared to El Reno and Central Facility of study area. The comparison (Figure 6) shows that, soil moisture predicted using neural network and fuzzy logic overestimate the soil moisture at lower values and underestimate at higher soil moisture values.
The RMSE between ESTAR derived soil moisture and neural network, fuzzy logic and multiple regression model outputs for independent soil moisture pixels are given in Table 3. The RMSE varies from 3.39 to 8.29 percent of soil moisture. Lower RMSE of soil moisture has been observed for fuzzy logic prediction compared to the neural network model. The RMSE for area A of 12th July is found to be smaller than that for Area B and 2nd July data. The correlation coefficient between neural network and fuzzy logic predicted soil moisture and the ESTAR derived soil moisture varies between 0.62% and 0.77%.

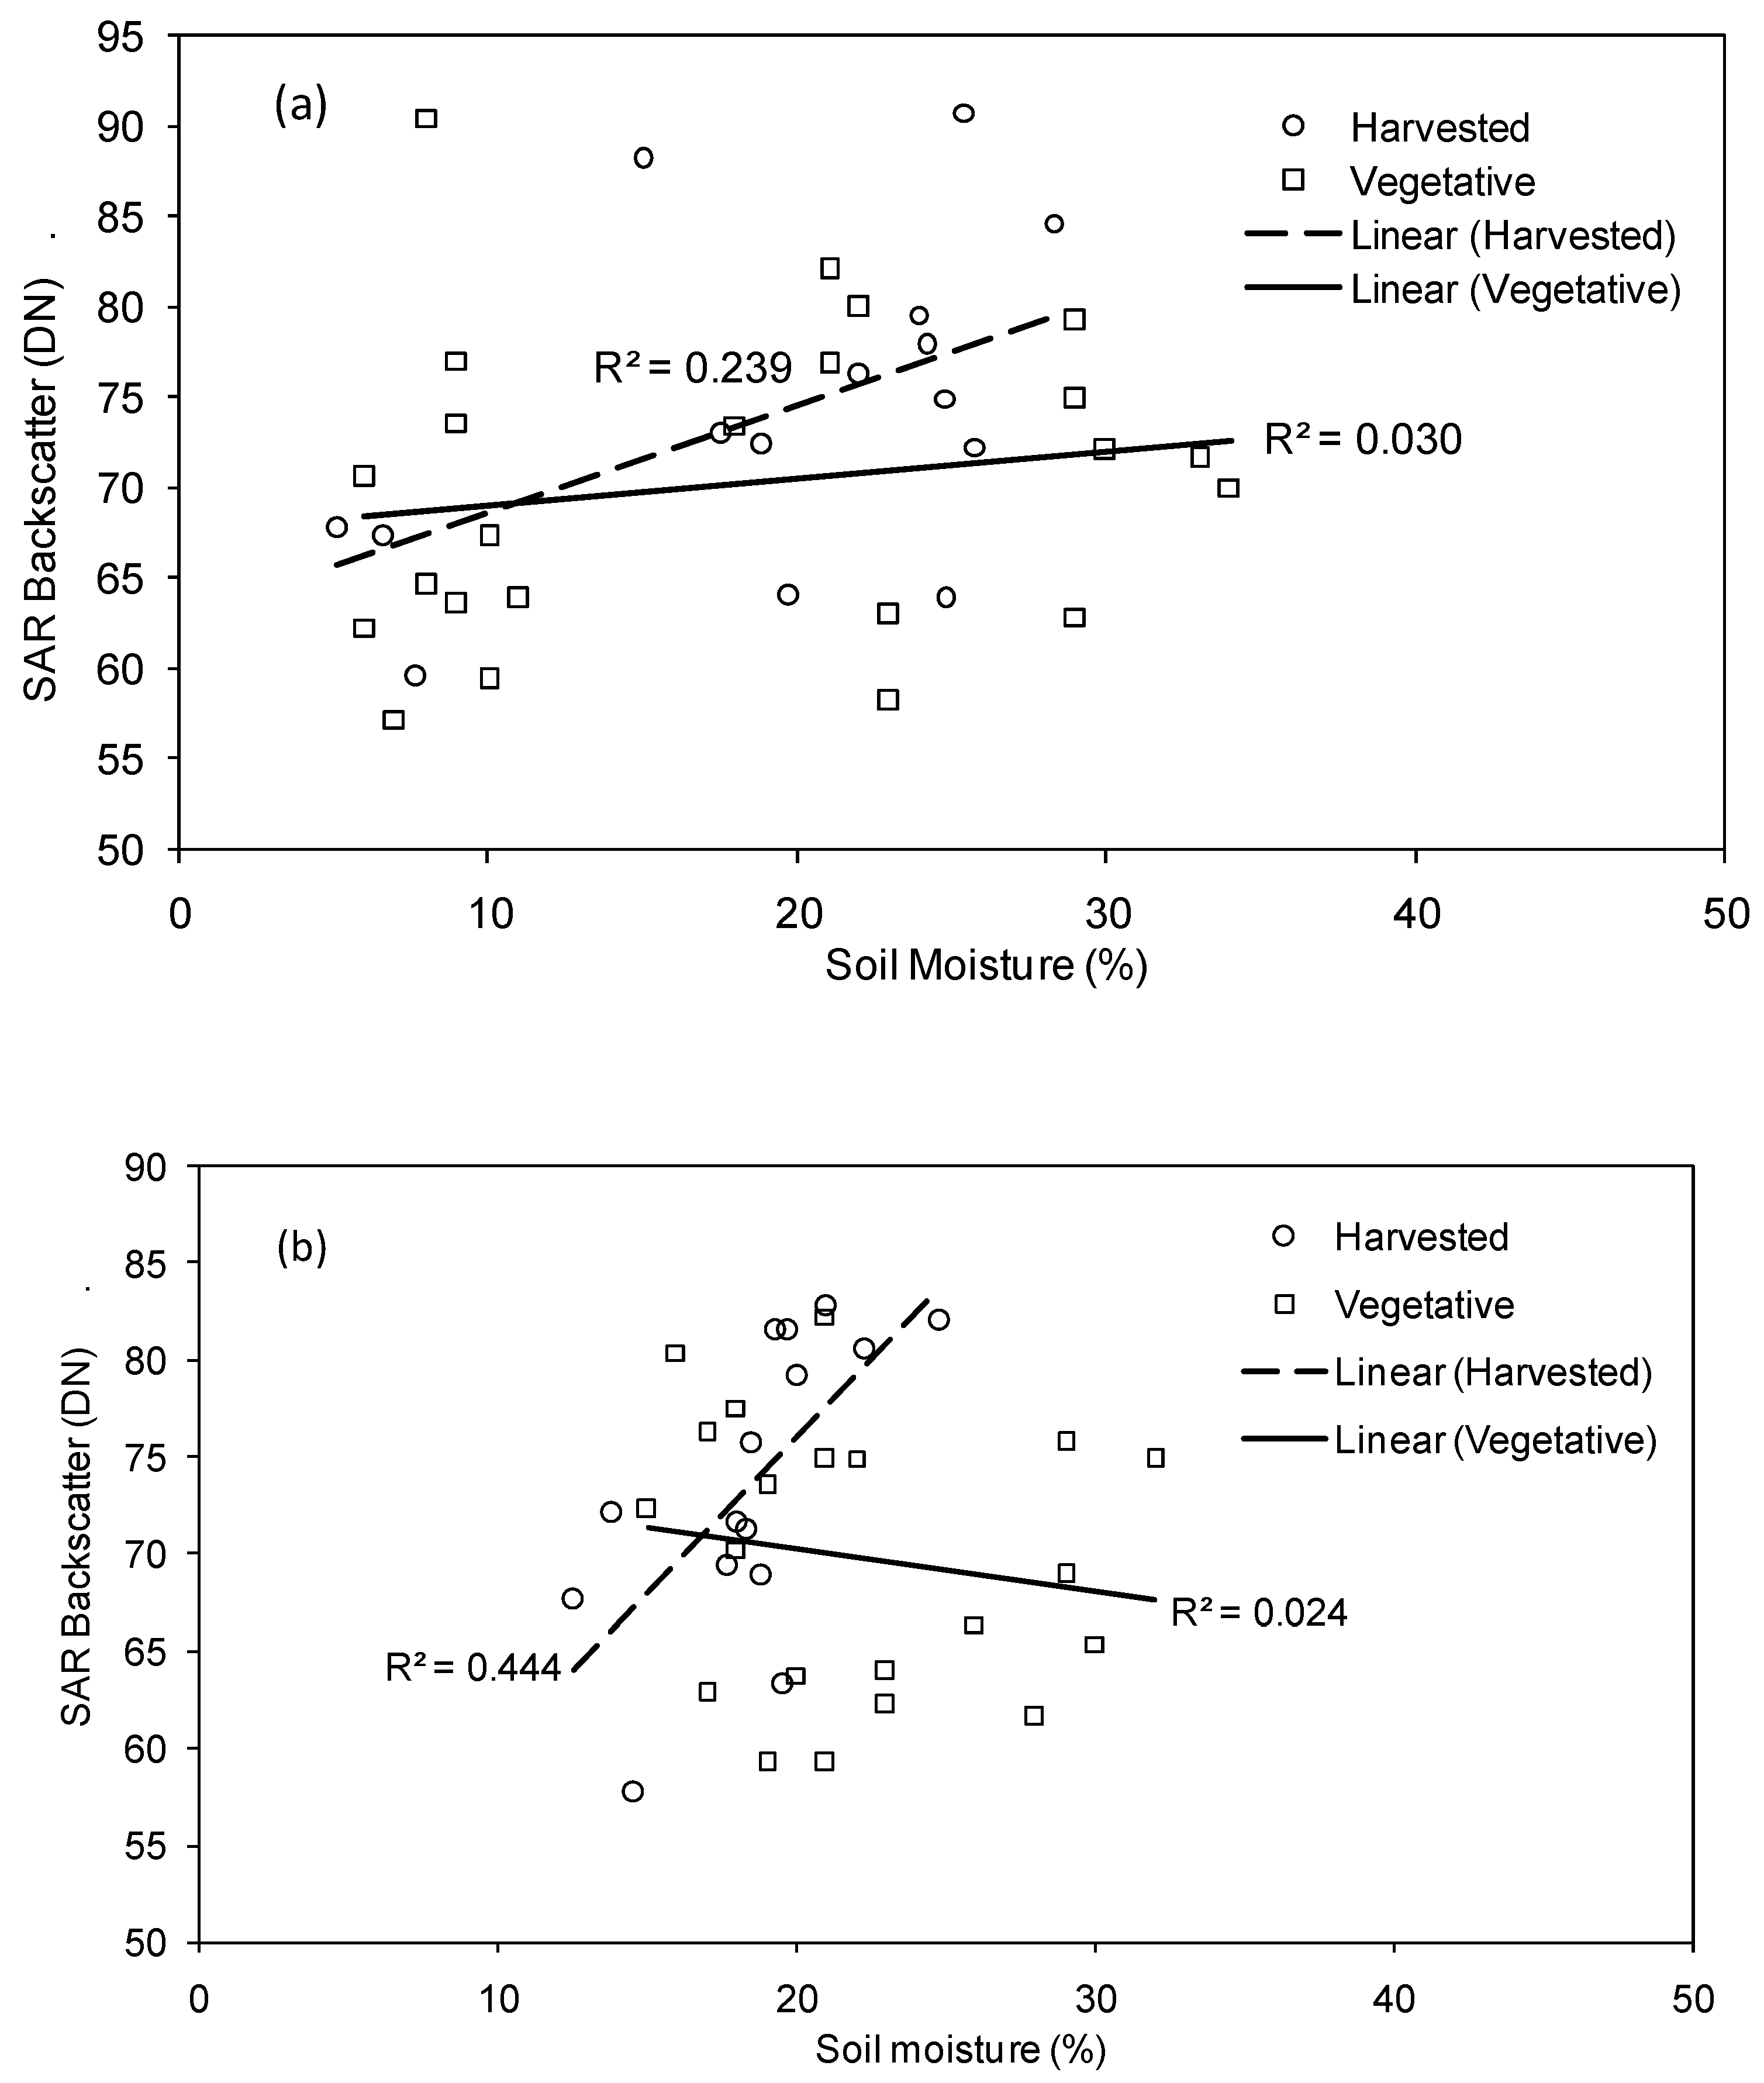
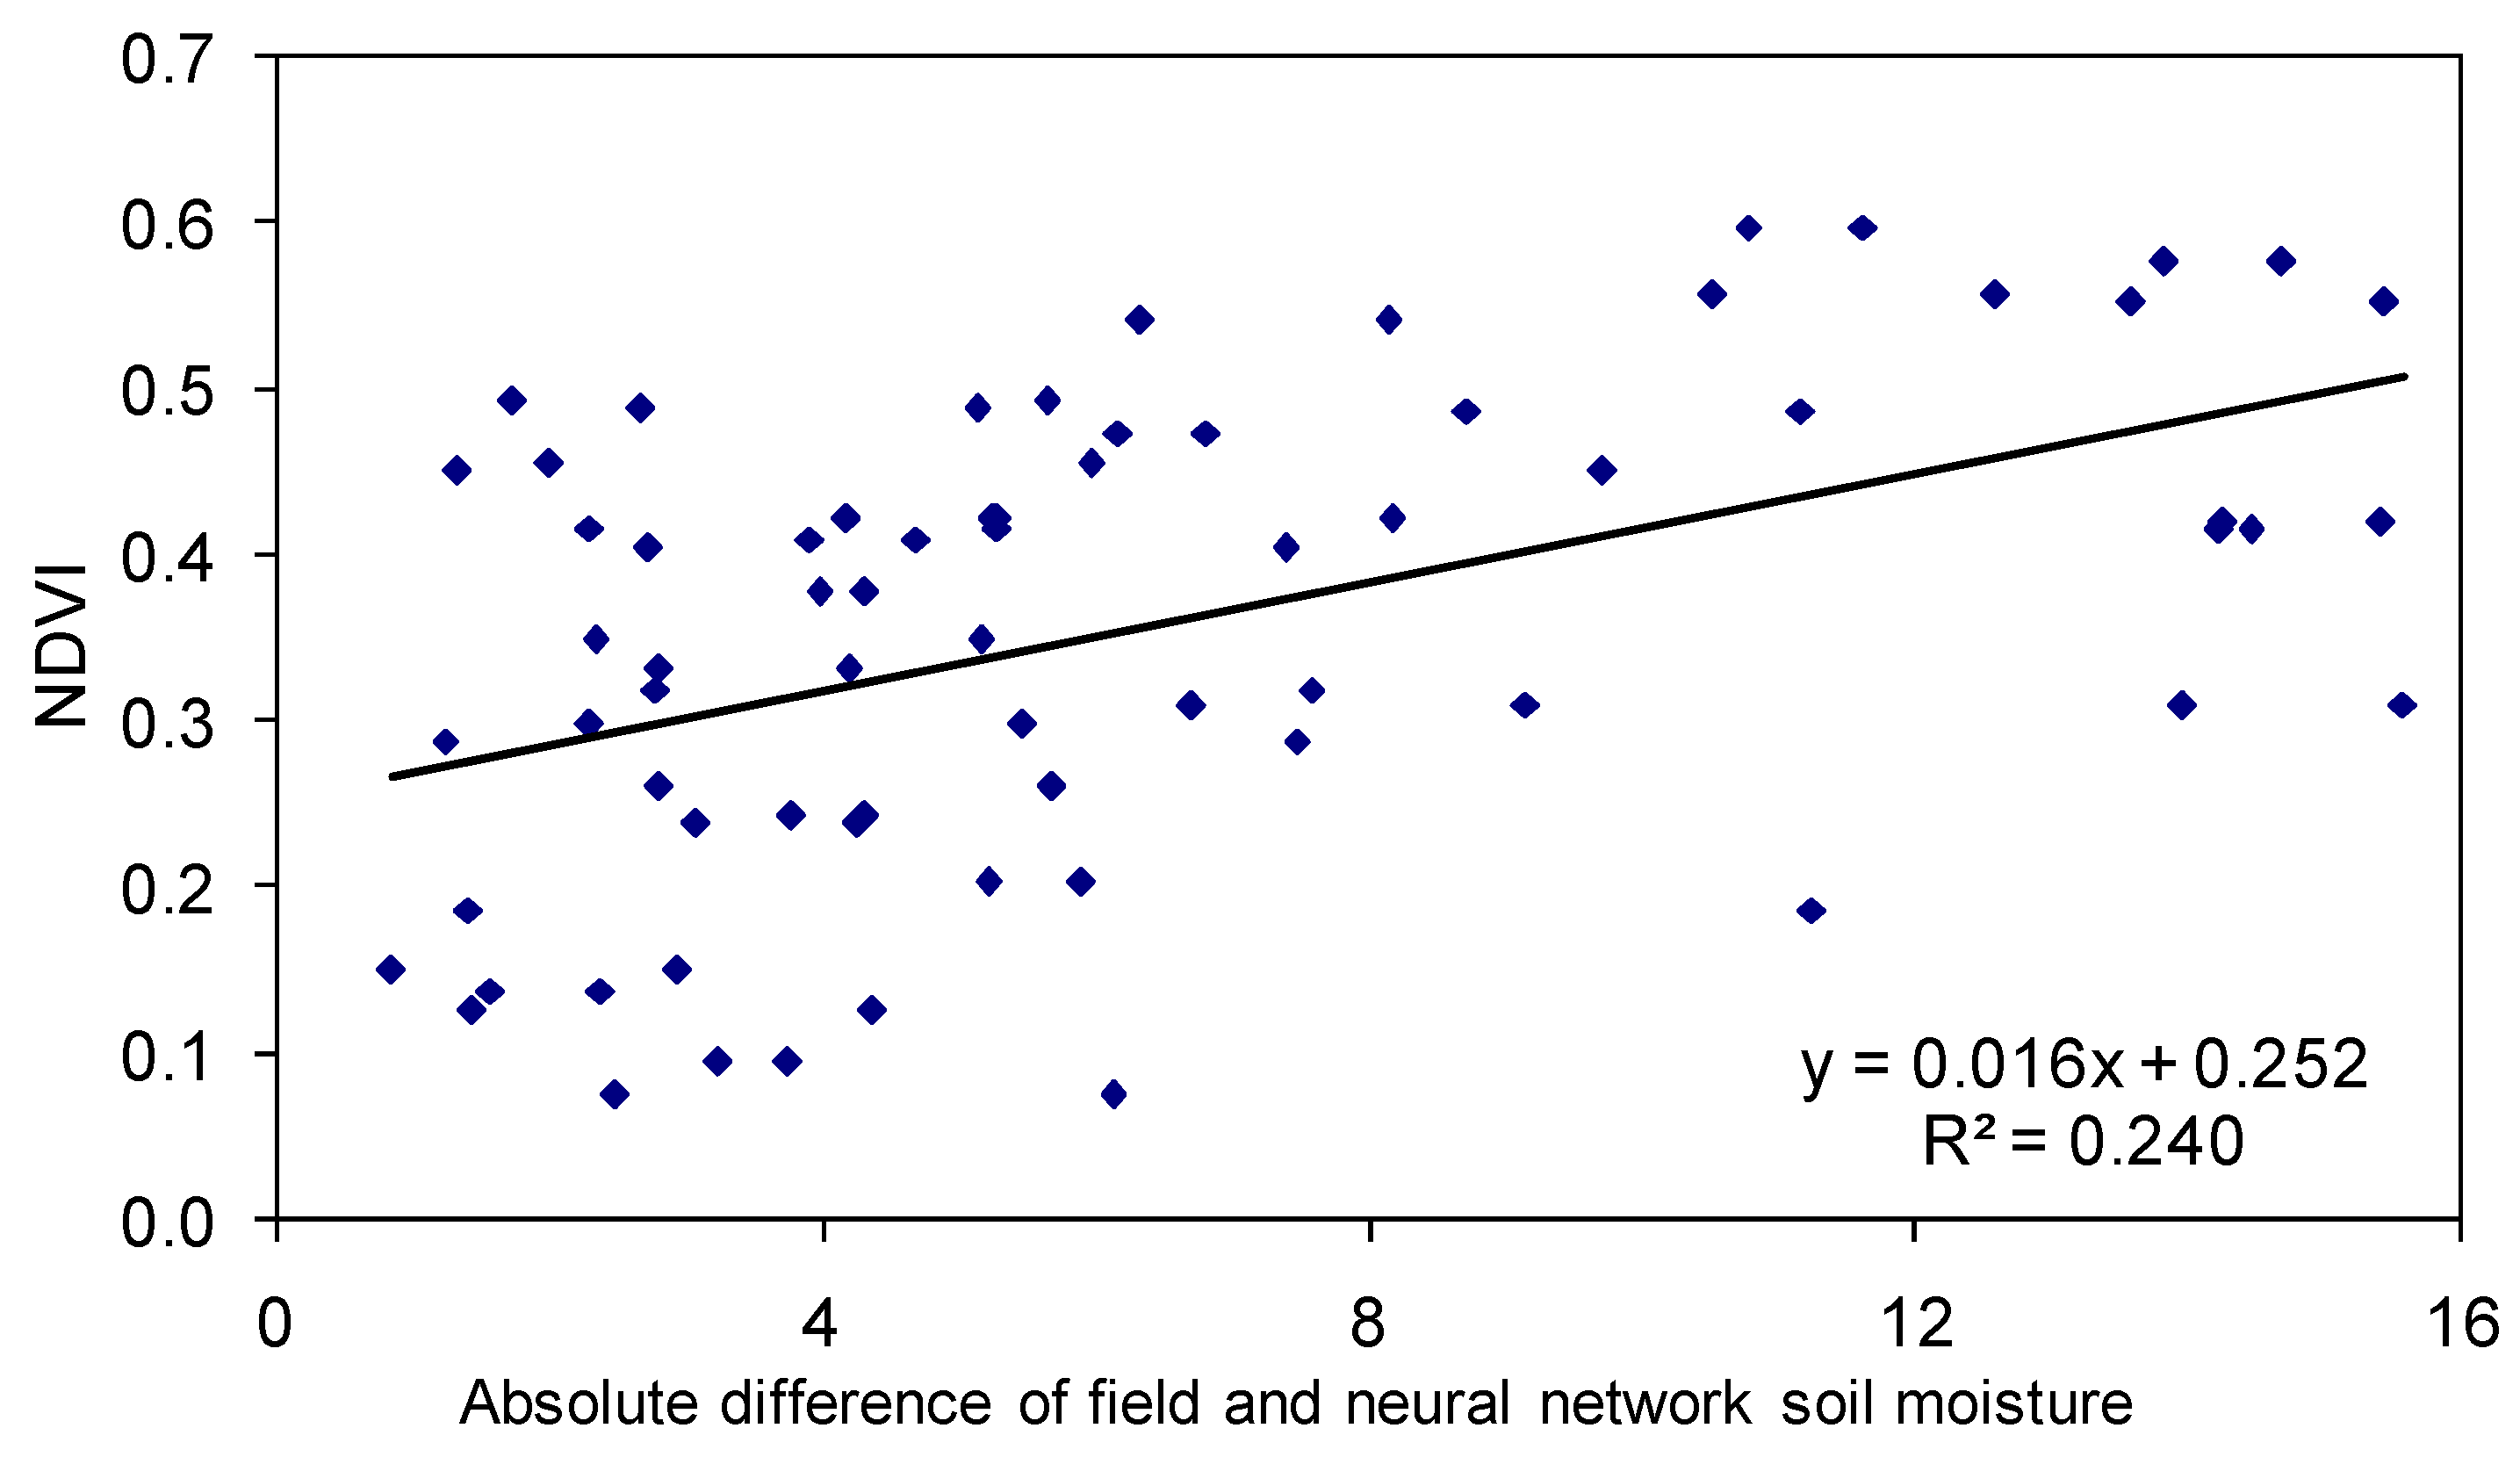
4.2 Effect of Vegetation and Soil Characteristics

The addition of NDVI along with backscatter to the neural network models reduced the RMSE error by 18% and 9.5% using fuzzy logic model. The largest impact was observed using multiple regression models reduced RMSE by 27%. However, RMSE of predicted soil moisture were lower using neural network and fuzzy logic models. The backscatter from vegetated areas depends mainly on soil moisture content and the vegetation overlying the soil surface. The volume scattering which is related to the structure and the density of vegetation dominates backscatter from vegetated areas. The structure of vegetation refers to geometry, density, canopy height, vegetation water contents, and vegetation volume fraction of canopies. Due to lack of measurements of such parameters over large areas, NDVI which is used to directly or indirectly calculate most of these parameters can be considered as a good representation of vegetation [58]. The impact of addition of vegetation information (in terms of NDVI) to neural network, fuzzy logic and multiple regression models in retrieval of soil moisture were given in Table 4.
In this study, we observed that the addition of soil characteristic (in terms of percent of sand) as an input helped to improve the soil moisture retrieval. The addition of soil characteristic along with backscatter to the neural network models reduced the RMSE error by 10% and 12% using fuzzy logic model. The addition of vegetation and soil characteristic along with backscatter to these models reduced the RMSE by 30%, 23% and 39% using neural network, fuzzy logic and multiple regression models respectively. Soil texture is the relative composition of the three major soil classes: sand, silt and clay. The reliance of the dielectric constant on soil texture is a function of variation of water molecule pressure at which it held between soil particles. Previous studies showed a strong linear correlation between the backscatter and soil moisture at a particular soil texture. The backscatter increases when the clay content of the soil decreases at any given value of soil moisture [4].
Figure 6. Comparison of predicted soil moisture from fuzzy logic model with field and ESTAR soil moisture with field soil moisture measuring area: Central Facility (CF), El Reno (ER), and Little Washita (LW) for July 02nd (a), July 12th (b) data.
Remotesensing 01 00003 g006
The absolute difference between field soil moisture and neural network and fuzzy logic derived soil moisture are plotted against NDVI values (Figure 7). Analysis based on the comparison of soil moisture output, showed that areas with low NDVI values have lower RMSE than areas with higher NDVI. This can be explained by the decrease of vegetation contribution to the backscatter [13]. The RMSE error observed with field point measured soil moisture was higher than that observed with ESTAR based soil moisture data. This is due to variability of class covers within a pixel, which generate additional errors when soil moisture point measurements are converted to spatial maps. With the magnitude of heterogeneity typically observed in surface soil moisture fields, and with the uncertainty associated with gridded point-scale observations mapped to space-borne sensor footprint scales, it is difficult to correlate the soil moisture values [59,60,61]. Additionally, soil moisture retrieval is highly influenced by heterogeneity of surface land cover [62]. The addition of vegetation data to the neural network and to the fuzzy logic models is important to improving the accuracy of dry soil moisture pixels estimates, where the dominance of VWC can be greater than soil water content.
Figure 7. Plot showing difference of neural network based with field measured soil moisture is increase with Normalized Difference Vegetation Index.
Remotesensing 01 00003 g007
Table 3. Root means square error (RMSE) and correlation coefficient (R) of estimated soil moisture using neural network and fuzzy logic with ESTER soil moisture.
DateAreaNeural Network ModelFuzzy Logic ModelMultiple Regression Model
RMSERRMSERRMSER
2nd JulyA7.9670.4145.7630.4936.6960.523
B8.2940.3976.1950.4485.8340.405
12nd JulyA3.6210.7153.7220.7024.5700.665
B4.4930.4583.8530.5044.8220.483
Table 4. Effect of data input configuration used in neural network, fuzzy logic and multiple regression model in terms of Root means square error (RMSE) and correlation coefficient (R) values of predicted soil moisture and ESTAR soil moisture for independent 300 pixels from Area A on 12th July data.
Data InputNeural Network ModelFuzzy Logic ModelMultiple Regression Model
RMSERRMSERRMSER
SAR4.8470.6204.5060.6457.4360.591
SAR+NDVI3.9400.7164.0750.6935.4210.653
SAR+PS4.3440.6603.9550.6845.6310.634
SAR+NDVI+PS3.3960.7673.4540.7594.4820.719

5. Conclusions

The use of non-parametric statistical models discussed above facilitates the representation of the true processes by simpler parametric relations. The main objective to use these models is to better understand the impact of variables in the retrieval process and relating it in the absence of exact formulation. Several numerical applications in weather prediction, climate change and hydrological processes have inadequate exact relationship between the variables. The major limitations of neural network and fuzzy logic models, as it does not provide relationships between variables and considered as a black box. However, these models help to identify significant variables in the system for which physical relationship can be developed. Also, these non-parametric models have tendency to underestimate the responses in predicted higher (wet) soil moisture and underestimate at lower (dry) soil moisture area. In spite of these limitations, we believe that, non-parametric methods such as fuzzy logic and neural network could be adequately used for soil moisture retrieval using microwave observations under vegetative cover in the absence of adequate physical based models.
The obtained results in this study clearly show that active microwave remote sensing has significant capabilities in estimating soil moisture in faster and more reliable ways and with sufficient accuracy. Soil moisture retrieval is highly influenced by soil texture and vegetation parameters. The sensitivity of such related parameters on the retrieval process can be better understood by techniques such as multiple regression, neural network and fuzzy logic, where these parameters can be automatically weighted. The significance and use of these parameters can be decided based statistical tests such as correlation coefficient, RMSE and test of significance difference. In this study, analysis showed there is no significant the impact of GLCM based textural images on soil moisture retrieval. The addition of the NDVI and soil characteristics in addition to microwave observations to these models reduced the RMSE for soil moisture retrieval by 30% approximately. This also opens the discussion for use of more sophisticated vegetation indices such as Fractional Green Vegetation Cover, Green Leaf Area Index, and Soil Adjusted Total Vegetation Index [63,64] to differentiate vegetation and soil response in soil moisture retrieval using microwave remote sensing data. Validation results showed that fuzzy logic and neural network models performed better compared to multiple regression.

Acknowledgments

This study was supported and monitored by National Oceanic and Atmospheric Administration (NOAA) under Grant NA06OAR4810162. The views, opinions, and findings contained in this report are those of the authors and should not be construed as an official National Oceanic and Atmospheric Administration or U.S. Government position, policy, or decision.

References and Notes

  1. Jackson, T.J.; Vine, D.L.; Hsu, A.Y.; Oldak, A.; Starks, P.; Swift, C.; Isham, J.; Haken, M. Soil moisture mapping at regional scales using microwave radiometry: the Southern Great Plains Hydrology Experiment. IEEE Transactions on Geoscience and Remote Sensing 1999, 37, 2136–2151. [Google Scholar] [CrossRef]
  2. Jacobs, J.M.; Myers, D.A.; Whitfield, B.M. Improved Rainfall/Runoff Estimates Using Remotely Sensed Soil Moisture. Journal of the American Water Resources Association 2003, 39, 313–324. [Google Scholar] [CrossRef]
  3. Paige, G.B.; Keefer, T.O. Comparison of Field Performance of Multiple Soil Moisture Sensors in a Semi-Arid Rangeland. Journal of the American Water Resources Association 2008, 44, 121–135. [Google Scholar] [CrossRef]
  4. Ulaby, F.T.; Moore, R.; Fung, A. Microwave Remote Sensing Active and Passive From Theory to Applications; 1986; Artech House Norwood MA. [Google Scholar]
  5. Engman, E.T.; Chauhan, N. Status of microwave soil moisture measurements with remote sensing. Remote Sensing of Environment 1995, 51, 189–198. [Google Scholar] [CrossRef]
  6. Li, J.; Islam, S. On the estimation of soil moisture profile and surface fluxes partitioning from sequential assimilation of surface layer soil moisture. Journal of Hydrology 1999, 220, 86–103. [Google Scholar] [CrossRef]
  7. Houser, P.R.; Shuttleworth, W.J.; Gupta, H.V.; Famiglietti, J.S.; Syed, K.H.; Goodrich, D.C. Integration of Soil Moisture Remote Sensing and Hydrologic Modeling using Data Assimilation. Water Resources Research 1998, 34, 3405–3420. [Google Scholar] [CrossRef]
  8. Govind, A.; Chen, J.M.; Margolis, H.; Ju, W.; Sonnentag, O.; Giasson, M.-A. A spatially explicit hydro-ecological modeling framework (BEPS-TerrainLab V2.0): Model description and test in a boreal ecosystem in Eastern North America. Journal of Hydrology 2009, 367, 200–216. [Google Scholar] [CrossRef]
  9. Moran, M.S.; Watts, J.M.; Peters-Lidard, C.D.; McElroy, S.A. Estimating soil moisture at the watershed scale with satellite-based radar and land surface models. Canadian Journal of Remote Sensing 2004, 30, 805–826. [Google Scholar] [CrossRef]
  10. Cao, M.; Woodward, F.I. Dynamic responses of terrestrial ecosystem carbon cycling to global climate change. Nature 1998, 393, 249–252. [Google Scholar] [CrossRef]
  11. Harmsen, E.W.; Mesa, S.E.G.; Cabassa, E.; Ramirez-Beltran, N.D.; Pol, S.C.; Kuligowski, R. J.; Vasquez, R. Satellite Sub-Pixel Rainfall Variability. International Journal of Systems Applications, Engineering & Development 2008, 2, 91–100. [Google Scholar]
  12. Wagner, W.; Pathe, C.; Doubkova, M.; Sabel, D.; Bartsch, A.; Hasenauer, S.; Blöschl, G.; Scipal, K.; Martínez-Fernández, J.; Löw, A. Temporal Stability of Soil Moisture and Radar Backscatter Observed by the Advanced Synthetic Aperture Radar (ASAR). Sensors 2008, 8, 1174–1197. [Google Scholar] [CrossRef]
  13. Jeu, R.D.; Wagner, W.; Holmes, T.; Dolman, A.; Giesen, N.v.d.; Friesen, J. Global Soil Moisture Patterns Observed by Space Borne Microwave Radiometers and Scatterometers. Surveys in Geophysics 2008, 29, 399–420. [Google Scholar] [CrossRef]
  14. Jackson, T.J.; Schmugge, T. Vegetation effects on the microwave emission of soils. Remote Sensing of Environment 1991, 36, 203–212. [Google Scholar] [CrossRef]
  15. Ulaby, F.T.; Allen, C.T.; Eger, G.; Kanemasu, H. Relating the microwave backscattering coefficient to leaf area index. Remote Sensing of Environment 1984, 14, 113–133. [Google Scholar] [CrossRef]
  16. Wang, C.; Qi, J.; Moran, S.; Marsett, R. Soil moisture estimation in a semiarid rangeland using ERS-2 and TM imagery. Remote Sensing of Environment 2004, 90, 178–189. [Google Scholar] [CrossRef]
  17. Ulaby, F.T.; Dobson, M.; Bradley, G. Radar reflectivity of bare and vegetation covered soil. Advanced Space Research 1981, 1, 91–104. [Google Scholar] [CrossRef]
  18. Wang, J.R.; Hsu, A.; Shi, J.C.; O’Neill, P.E.; Engman, E.T. A Comparison of soil moisture retrieval models using SIR-C measurements over the Little Washita River Watershed. Remote Sensing of Environment 1997, 59, 308–320. [Google Scholar] [CrossRef]
  19. Ulaby, F.T. Radar measurement of soil moisture content. IEEE Transaction on Antennas and Propagation 1974, 22, 257–265. [Google Scholar] [CrossRef]
  20. Bernard, R.; Martin, P.H.; Thony, J.L.; Vauclin, M.; Vidal-Madjar, D. C-band radar for determining surface soil moisture. Remote Sensing of Environment 1982, 12, 189–200. [Google Scholar] [CrossRef]
  21. Wood, E.F.; Lin, D.S.; Mamcini, M.; Thongs, D.; Troch, P.A.; Jackson, T.J.; Famiglietti, J.S.; Engman, E.T. Inter-comparisons between passive and active microwave remote sensing and hydrological modeling for soil moisture. Advanced Space Research 1993, 13, 167–175. [Google Scholar] [CrossRef]
  22. Meade, N.; Hinzman, L.; Kane, D. Spatial estimation of soil moisture using synthetic aperture radar in Alaska. Advanced Space Research 1999, 24, 935–940. [Google Scholar] [CrossRef]
  23. Quesney, A.; Hégarat-Mascle, S.L.; Taconet, O.; Vidal-Madjar, D.; Wigneron, J.P.; Loumagne, C.; Normand, M. Estimation of watershed soil moisture index from ERS/SAR data. Remote Sensing of Environment 2000, 72, 290–303. [Google Scholar] [CrossRef]
  24. Moeremans, B.; Dautrebande, S. Soil moisture evaluation by means of multi-temporal ERS SAR PRI images and interferometric coherence. Journal of Hydrology 2000, 234, 162–169. [Google Scholar] [CrossRef]
  25. Glenn, N.F.; Carr, J.R. The use of geo-statistics in relating soil moisture to RADARSAT-1 SAR data obtained over the Great Basin, Nevada, USA. Computers and Geosciences 2003, 29, 577–586. [Google Scholar] [CrossRef]
  26. Srivastava, H.S.; Patel, P.; Manchanda, M.L.; Adiga, S. Use of multi-incidence angle RADARSAT-1 SAR data to incorporate the effect of surface roughness in soil moisture estimation. IEEE Transactions on Geoscience and Remote Sensing 2003, 41, 1638–1640. [Google Scholar] [CrossRef]
  27. Kasischke, E.; Smith, K.; Bourgeau-Chavez, L.; Romanowicz, E.; Brunzell, S.; Richardson, C. Effects of seasonal hydrologic patterns in south Florida wetlands on radar backscatter measured from ERS-2 SAR imagery. Remote Sensing of Environment 2003, 88, 423–441. [Google Scholar] [CrossRef]
  28. Geng, H.; Hugh, Q.; Gwyn, J.; Brisco, B.; Boisvert, J.; Brown, R. Mapping of Soil Moisture from C-Band Radar Images. Canadian Journal of Remote Sensing 1996, 22, 117–126. [Google Scholar] [CrossRef]
  29. Pultz, T.; Leconte, R.; Brown, R.; Brisco, B. Quantitative soil moisture extraction from airborne SAR data. Canadian Journal of Remote Sensing 1990, 16, 56–62. [Google Scholar] [CrossRef]
  30. Wang, Q.; Adiku, S.; Tenhunen, J.; Granier, A. On the relationship of NDVI with leaf area index in a deciduous forest site. Remote Sensing of Environment 2005, 94, 244–255. [Google Scholar] [CrossRef]
  31. Atkinson, P.M.; Tatnall, A.R.L. Neural networks in remote sensing. International Journal of Remote Sensing 1997, 18, 699–709. [Google Scholar] [CrossRef]
  32. Benz, U.C.; Hofmann, P.; Willhauck, G.; Lingenfelder, I.; Heynen, M. Multi-resolution, object-oriented fuzzy analysis of remote sensing data for GIS-ready information. ISPRS Journal of Photogrammetry and Remote Sensing 2004, 58, 239–258. [Google Scholar] [CrossRef]
  33. Satalino, G.; Mattia, F.; Davidson, M.W.J.; Toan, T.L.; Pasquariello, G.; Borgeaud, M. On current limits of soil moisture retrieval from ERS-SAR data. IEEE Transactions on Geoscience and Remote Sensing 2002, 40, 2438–2447. [Google Scholar] [CrossRef]
  34. Ghedira, H.; Bernier, M.; Ouarda, T.B.M.J. Application of neural networks for wetland classification in Radarsat SAR imagery. IEEE International Geosciences and Remote Sensing Symposium, IGARSS’2000 2000, 2, 675–677. [Google Scholar]
  35. Benediktsson, J.; Swain, P.; Ersoy, O.K. Neural network approaches versus statistical methods in classification of multi-source remote sensing data. IEEE Transactions on Geoscience and Remote Sensing 1990, 28, 540–552. [Google Scholar] [CrossRef]
  36. Ulaby, F.T.; Kouyate, F.; Brisco, B.; Williams, T.H.L. Textural information in SAR images. IEEE Transactions on Geoscience and Remote Sensing 1986, 24, 235–245. [Google Scholar] [CrossRef]
  37. Haralick, R.M. Statistical and structural approaches to texture. Proceedings of the IEEE 1979, 67, 786–804. [Google Scholar] [CrossRef]
  38. Soares, J.V.; Renno, C.D.; Formaggio, A.R.; Costa, C.F.Y.; Frery, A.C. An investigation of the selection of texture features for crop discrimination using SAR imagery. Remote Sensing of Environment 1997, 59, 234–247. [Google Scholar] [CrossRef]
  39. Soh, K.L.; Tsatsoulis, C. Texture analysis of SAR sea ice imagery using gray level co-occurrence matrices. Geoscience and Remote Sensing, IEEE Transactions on 1999, 37, 780–795. [Google Scholar] [CrossRef]
  40. Nystuen, J.A.; Garcia, F.W. Sea ice classification using SAR backscatter statistics. Geoscience and Remote Sensing, IEEE Transactions on 1992, 30, 502–509. [Google Scholar] [CrossRef]
  41. Sung, H.A. Ranking importance of input parameters of neural networks. Expert Systems with Applications 1998, 15, 405–411. [Google Scholar] [CrossRef]
  42. Almeida, J.S. Predictive non-linear modeling of complex data by artificial neural networks. Current Opinion in Biotechnology 2002, 13, 72–76. [Google Scholar] [CrossRef]
  43. Gilfilian, E.; Page, D. Use of Multivariate Statistical Techniques to Associate Biologically Active Stressors with Observed Effects in Multiple Stressor Situations. OCEANS 1986, 18, 953–959. [Google Scholar]
  44. Khoshgoftaar, T.M.; Szabo, R.M.; Guasti, P.J. Exploring the behaviour of neural network software quality models. Software Engineering Journal 1995, 10, 89–96. [Google Scholar] [CrossRef]
  45. Breiman, L. Random Forests. Machine Learning 2001, 45, 5–32. [Google Scholar] [CrossRef]
  46. Quinlan, J.R. Data mining tools See5 and C5.0. [cited 17 March 2009]. Available from: http://www.rulequest.com/see5-info.html.
  47. Cohen, J.; West, S.G. Applied Multiple Regression/correlation Analysis for the Behavioral Sciences, 3 ed.; 2003; Lawrence Erlbaum Associates. [Google Scholar]
  48. Paola, J.; Schowengerdt, R.A. A review and analysis of back-propagation neural networks for classification of remotely-sensed multi-spectral imagery. International Journal of Remote Sensing 1995, 16, 3033–3058. [Google Scholar] [CrossRef]
  49. Low, H.K.; Chuah, H.T.; Ewe, H.T. A neural network land use classifier for SAR images using textural and fractal information. Geocarto International 1999, 14, 66–73. [Google Scholar] [CrossRef]
  50. Carpenter, G.A.; Gopal, S.; Macomber, S.; Martens, S.; Woodcock, C.E.; Franklin, J. A neural network method for efficient vegetation mapping. Remote Sensing of Environment 1999, 70, 326–338. [Google Scholar] [CrossRef]
  51. Zainuddin, Z.; Pauline, O. Function Approximation Using Artificial Neural Networks. International Journal of Systems Applications, Engineering & Development 2007, 1, 173–178. [Google Scholar]
  52. Dias, F.M.; Antunes, A. Test error versus training error in artificial neural networks for systems affected by noise. International Journal of Systems Applications, Engineering & Development 2008, 2, 83–90. [Google Scholar]
  53. Augustejin, M.; Clemens, L.; Shaw, K. Performance evaluation of texture measures for ground cover identification in satellite images by means of a neural network classifier. IEEE Transactions on Geoscience and Remote Sensing 1995, 33, 616–626. [Google Scholar] [CrossRef]
  54. Chiu, S.L. An Efficient Method for Extracting Fuzzy Classification Rules from High Dimensional Data. Journal of Advanced Computational Intelligence 1997, 1, 1–7. [Google Scholar]
  55. Hayajneh, M.T.; Radaideh, S.M. Modeling Surface Finish in End Milling Using Fuzzy Subtractive Clustering-Based System Identification Method. Materials and Manufacturing Processes 2003, 18, 653–665. [Google Scholar] [CrossRef]
  56. Nedeljkovic, I. Image classification based on fuzzy logic. In The International Archives of the Photogrammetry, Remote Sensing and Spatial Information Sciences; 2004. [Google Scholar]
  57. Legleiter, C.J.; Goodchild, M.F. Alternative representations of in-stream habitat: classification using remote sensing, hydraulic modeling, and fuzzy logic. International Journal of Geographical Information Science 2005, 19, 29–50. [Google Scholar] [CrossRef]
  58. Jackson, T.J.; Chen, D.; Cosh, M.; Li, F.; Anderson, M.; Walthall, C.; Doraiswamy, P.; Hunt, E.R. Vegetation water content mapping using Landsat data normalized difference water index (NDWI) for corn and soybean. Remote Sensing of Environment 2004, 92, 475–482. [Google Scholar] [CrossRef]
  59. Famiglietti, J.S.; Devereaux, J.A.; Laymon, C.A.; Tsegaye, T.; Houser, P.R.; Jackson, T.J.; Graham, S.T.; Rodell, M.; Oevelen, P.J. Ground-based investigation of soil moisture variability within remote sensing footprints during the Southern Great Plains 1997 (SGP97) Hydrology Experiment. Water Resources Research 1999, 35, 1839–1851. [Google Scholar] [CrossRef]
  60. Crow, W.T.; Ryu, D.; Famiglietti, J.S. Upscaling of field-scale soil moisture measurements using distributed land surface modeling. Advances in Water Resources 2005, 28, 1–14. [Google Scholar] [CrossRef]
  61. Jacobs, J.M.; Mohanty, B.P.; Hsu, E.-C.; Miller, D. SMEX02: Field scale variability, time stability and similarity of soil moisture. Remote Sensing of Environment 2004, 92, 436–446. [Google Scholar] [CrossRef]
  62. Bindlish, R.; Barros, A.P. Sub-pixel variability of remotely sensed soil moisture: an inter-comparison study of SAR and ESTAR. Remote Sensing of Environment 2002, 40, 326–337. [Google Scholar]
  63. Marsett, R.C.; Qi, J.; Heilman, P.; Biedenbender, S.H.; Watson, M.C.; Amer, S.; Weltz, M.; Goodrich, D.; Marsett, R. Remote Sensing for Grassland Management in the Arid Southwest. Rangeland Ecology & Management 2006, 59, 530–540. [Google Scholar]
  64. Qi, J.; Marsett, R.C.; Moran, M.S.; Goodrich, D.C.; Swain, P.; Kerr, Y.H.; Dedieu, G.; Chehbouni, A.; Zhang, X.X. Spatial and temporal dynamics of vegetation in the San Pedro River basin area. Agricultural and Forest Meteorology 2000, 105, 55–68. [Google Scholar] [CrossRef]

